Embed Size (px)
Citation preview

THE IMPACTS OF THE INFLUX OF NEW FOREIGNUNDERGRADUATE STUDENTS ON U.S. HIGHER
EDUCATION
Ying Shen∗
University of Notre Dame
September, 2016
Abstract
Using data from the Integrated Postsecondary Education Data System (IPEDS), this paperexamines the impacts of the dramatic increase in new foreign undergraduate students overthe past decade on the U.S. higher education sector. Since which a school’s foreign attend isa choice variable, I use exogenous factors driving the large inflow of Chinese students since2006, in combination with variation in historical levels of foreign students as the instrumentto predict enrollment patterns. Using a two-stage least square model that is identified witha difference-in-differences specification, I find a significant crowd-out effect of the enrollmentof foreign undergraduate students on the enrollment of domestic undergraduate students atAmerican higher-ranked research universities, approximately one-for-one. Constraints in thedemand for students in large selective universities appear to explain the crowd-out effect. Ialso find that while admitting more undergraduate foreign students increases non-discountedtuition, the economic gains of enrolling foreign undergraduate students allow American uni-versities to increase institutional grant aid.
JEL Classification Codes: A22, F22, I23, J15, K37
∗Contact: 434 Flanner Hall, University of Notre Dame, [email protected]. I am grateful to Kirk Doran, AbigailWozniak, Joseph Kaboski, William Evans, Daniel Hungerman, Ethan Lieber, Terence Johnson and seminar partic-ipants at Notre Dame, the Midwest Economics Association Conference and the SOLE Conference for their valuableconversations and comments. This research was supported by the National Bureau of Economic Research (NBER)Pre-doctoral Fellowship on Economics of High-Skill Immigration. Any errors are my own responsibility.

1 Introduction
The globalization of higher education over the last 70 years has transformed the faculty and
graduate student bodies of American universities, changing how we train, fund, and inform our
knowledge workforce (Borjas (2004), Borjas et al. (2015), Bound et al. (2009), Shih (2015), etc).
Until recently, the undergraduate side of American education has remained relatively immune
from the direct impact of globalization. In the last ten years there has been a large influx of
international students at the undergraduate level, many from China. Data from the Institute of
International Education (IIE) reveals that from 2005 to 2013, the number of foreign undergraduate
students studying at U.S. institutions increased by more than 55 percent, rising from 240,000 to
370,000. Chinese students comprised about 77 percent of the increase in foreign undergraduate
students. American undergraduate education has become a service sought after by millions of
students around the world who now have the income to pursue it, and American universities are
beginning to respond aggressively to this international demand. Because of the size and importance
of undergraduate education for the U.S. economy in general, this third phase of the globalization
of U.S. higher education has the potential to be even more transformative than those at the faculty
and graduate student levels before it. A university with constraints in the demand for students may
force out a number of qualified American students as more foreign undergraduate students enter
the American educational system, which would have transformative impacts on U.S. labor force
and long-term economy. In comparison, the enormous economic benefits from admitting foreign
students might lead to a cash revolution at American institutions which may result in fundamental
changes in a university’s financial and enrollment system.
While existing research (Hoxby (1998), Jackson (2014)) has studied the impact of foreign
born students who immigrated to the United States at a younger age and then attend college here,
there has been little work on what happens when American colleges admit a larger number of their
student body from overseas. The former influx is more limited in its ultimate potential to transform
undergraduate education because of limitations on immigration in general that are unlikely to
drastically change. The latter influx drastically increases the potential number of applicants for
1

American universities, exposing students already in the U.S. to new potential competitors and
peers, and providing the universities themselves with potentially vast new sources of revenue. These
changes could have important implications for domestic students, tuition and fees, institutional
financial aid, and salaries.
In order to estimate the causal impacts of the influx of foreign students on American under-
graduate students and institutions, I make use of a quasi-experiment induced by changes to visa
policies and currency exchange rates in 2006 in China that led to a large increase in the number of
Chinese undergraduate students enrolling in American universities. The changes in national poli-
cies are plausibly exogenous factors driving the foreign student influx because the policy changes
are orthogonal to each individual university’s characteristics. However, cross-time variation by
itself cannot separate the causal effects from other secular trends,therefore, I further exploit a
cross-university difference in the historical presence of foreign students before the supply shock.
Thus, model identification in this paper relies on both cross-time and cross-sectional variations.
Specifically, I first calculate the number of foreign undergraduate students at each institution be-
fore the foreign student supply shock, predicting future student inflows. I then instrument the
actual number of new foreign students at each institution by allocating the foreign supply shock
in proportion to their school-level presence before the shock.
My first-stage results indicate that institutions with a higher number of foreign undergradu-
ate students before the supply shock disproportionately enrolled more new foreign undergraduate
students after 2006. The instrumental variables (IV) results suggest that although the average
crowd-out effect of foreign undergraduate students on domestic undergraduate students is statisti-
cally insignificant, at higher ranked universities there is a statistically significant crowd-out effect
of approximately one-for-one. In other words, for every one additional foreign student enrolled in
higher ranked universities, one domestic student was denied acceptance. Exploring the mechanism
behind the crowd-out effect, I find that constraints in the demand for students in large selective
universities appear to explain the crowd-out effect, with more demand constrained universities ex-
periencing a more significant effect. At the same time, the influx of foreign undergraduate students
has increased U.S. admission standards, measured by SAT scores. Additionally, I also investigate
2

the impacts of the influx of new foreign students on other outcomes of interest to examine whether
the influx affects tuition and fees charged by institutions, institutional financial support for stu-
dents and salaries for instructional staff. I find that although the foreign influx has little impact
on institutional fees, it increases non-discounted tuition.1 Admitting more foreign undergraduate
students enables a university to increase the average amount of institutional grant aid for their
accepted students.
Concerns over the consequence of the recent explosion in the number of foreign undergraduate
enrollment on U.S. higher education and economy have attracted great interest. A large number
of news media extensively reported potential impacts of foreign students streams on U.S. colleges,
and the government has adjusted several immigration policies in response to the recent foreign
student inflows, such as the changes in the STEM OPT-extension.2,3 This study, therefore, provides
informative results for recent immigration policy discussions and offers guidance for future policy-
decision making. The results in this analysis suggest that the influx of new foreign undergraduate
students had both positive and negative impacts on American universities and student population,
generating a long-term effect on the U.S. economy. On the one hand, the increase in the number
of students in the application pool heightened a university’s admission standards, allowing them
to select higher quality students. The increase in school revenue earned from foreign students
improved schools’ financial conditions, enabling them to provide more institutional grant aid for
their students, which could have positive impacts on student’s academic and post-graduation
outcomes (Dynarski (1999), van der Klaauw et al. (2002), Field (2006), Rothstein and Rouse
1Non-discounted tuition includes out-of-state tuition at public universities and tuition at private universities.Both of these two types of tuition are sticker price,not net price.
2Please refer to two prominent articles in New Y ork T imes and Wall StreetJournal that are about foreign student streams. Links:http://www.wsj.com/articles/international-students-stream-into-u-s-colleges-1427248801, http://www.nytimes.com/2014/12/
01/education/chinese-students-lead-foreign-surge-at-us-colleges.html?_r=03Historically, the U.S. immigration policies tightly restricted the number of foreign students who could work in
the U.S. (i.e. the H1-B cap) but placed no caps on the number of student visas. However, in March 2016, theDepartment of Homeland Security published a final rule extending the STEM OPT extension from 17 months to24 months. The OPT is a period during which foreign students with F-1 status who obtain a Bachelor’s or higherdegree are permitted to work in the U.S. before they get H1-B visas. The regular OPT period is 12 months, in2008, the U.S. government announce a 17-month OPT extension for students in STEM majors. The new extension,therefore, allows foreign STEM workers who graduate from U.S. colleges to have an even longer period to legallywork in the U.S. before they get H1-B visas. In these days when the probability in winning H1-B lottery is low,OPT and OPT-extension play important roles for foreign students who work and stay in the U.S.
3
(2011),etc). On the other hand, constraints in student demand cause foreign students to crowd
out domestic students at higher ranked research universities, which would have negative impacts on
crowded-out students’ labor market outcomes(Card (1999), Carneiro et al. (2011)). Additionally,
if a large number of foreign students cannot remain in the U.S. labor market after graduating
because of policy restrictions (i.e. the H1-B visa cap), the displacement of foreign students on
domestic students would leave the U.S. labor market with a chronic shortage, which would harm
U.S. long-term economic growth. These are tradeoffs that will be useful to take into account during
the debate on immigration policy reform.
The remainder of this paper is organized as follows: Section 2 provides a brief description of the
background of the foreign student supply shock induced by Chinese students after 2006. Section
3 illustrates the conceptual hypothesis. Section 4 explains the construction of the data. Section 5
outlines the empirical identification strategy. Sections 6 and 7 report the results and robustness
checks. Section 8 gives a conclusion and discussion.
2 Background
2.1 A Brief History of Chinese Undergraduate Students in the U.S.
The number and characteristics of Chinese students in the United States has varied dramatically
since the establishment of the People’s Republic of China in 1949. Between 1949 and the late
1970s, China’s pro-Soviet “leaning to one side” policy and the Cultural Revolution limited the
flow of Chinese students to the United States to negligible levels.4,5 Beginning in 1979, a large
number of Chinese students entered American institutions, as China implemented the “Open
Up” policy and the Chinese government encouraged students to study abroad and learn from the
developed Western countries. By the late 1980s, although China had become the leading supplier of
4Between 1949 and the 1960s, the Chinese government was firmly committed to the Sino-Soviet alliance. Interms of higher education, the government implemented the “leaning to one side” policy, and the Soviet Union wasthe dominant country receiving Chinese international students.
5The Cultural Revolution began the spring of 1966 and lasted until October 1976. During those 10 years, theChinese government implemented a closed-door policy, isolating itself internationally, both from the communistalliance and from Western developed countries. Therefore, the Culture Revolution shut down the opportunity forany Chinese student to study abroad. (Wang (2001))
4

international students to the U.S., the majority of Chinese students were concentrated in doctoral
programs in the United States.6
However, beginning in 2006, a new pool of Chinese students began enrolling in undergraduate
programs in the U.S. This was mainly due to changes in two national policies enacted in 2005: a
U.S.-China agreement relaxing student visa policies, and a change in China’s official exchange rate
regime that has led to a long run appreciation in its currency.7
In 2005, the U.S. government relaxed student visa policies, causing Chinese scholars and stu-
dents to enter into the U.S. more efficiently. Before this relaxation, visa policies towards Chinese
students were restrictive in that they not only affected the accepted students, leaving them unable
to complete their study at U.S. institutions, but also negatively affected the enthusiasm of po-
tential foreign applicants.8 Given that such restrictive visa policies might have adverse effects on
America’s position at the forefront of technological and academic innovation, in 2005, the United
States and China reached an agreement on mutually relaxing visa requirements for students and
scholars. Under the new visa policies, Chinese citizens applying for student visas (F-1/F-2), ex-
change visas (J-1/J-2) and vocational training visas (M-1/M-2) are allowed to obtain visas that
are valid for twelve months and multiple entries, compared to the previous six-month and two-
entry policy. More important, the new agreement significantly reduced the refusal rate of Chinese
student visas. A survey conducted by American Physics Society tracking Chinese students’ visa
problems suggests that during 2001-2002 academic year, a Chinese citizen on average was about
three times as likely to have experienced student visa problems.9 However, the visa approval rate
for Chinese students increased dramatically after 2006. Between 2002 and 2004, the approval rate
for student visa (F-1) was around 55 percent; but in 2006, the issuance rate climbed up to 76
percent, and in 2009 and 2013, the issuance rate for F-1 further rose to 85 percent and 90 percent,
6Data are from Institute of International Education (2013) and Institute of International Education (2009).7The Chinese currency began depreciating against the U.S.dollar since early 2014, but between 2005 and 2013,
the Chinese currency was consistently appreciating.8The high visa refusal rate negatively affects the enthusiasm of foreign applicants is because a restrictive visa
application process might dissuade potential applicants from applying to American universities in general andencourage them to pursue education in other countries such as the UK or Austrailia.
9Specifically, a Chinese citizen was almost four times as likely to have experienced a student visa problem he orshe ultimately could overcome in time, and was two and a half times as likely to have experienced a student visaproblem he or she could not overcome in time for the start of the 2001-2002 academic year.
5

respectively. The increase in the visa approval rate, therefore, has greatly and effectively promoted
the enthusiasm of Chinese applicants.
In addition to the changes in visa policies, the Chinese currency (Renminbi) has appreciated
against the U.S. dollar by more than 30 percent since July 21st, 2005, when the Chinese government
announced the changes in its official exchange rate regime.10 Figure 1 plots the exchange rate of
the U.S. dollar against Chinese Renminbi between 2000 and 2014. The figure shows that before
2005, the value of the Renminbi was pegged to the U.S. dollar, and the exchange rate of the
U.S. dollar to the Renminbi hovered around 8.27. However, right after July 2005, the Renminbi
continued appreciating, and the central parity rate of the Renminbi stood at approximately 6.2
yuan per dollar at the end of 2013. As a result of the appreciation of the Renminbi, studying
in U.S. colleges became cheaper. Therefore, compared to other places such as Japan, Australia
and European countries, which also traditionally receive a considerable number of international
students, the United States has become more attractive to Chinese families, inducing more Chinese
students to choose the U.S. as their destination.11
Taken together, a combination of the streamlined student visas application procedures and
the appreciation of the Chinese currency against the U.S. dollar have led to a significant increase
in the number of Chinese undergraduate students in American universities, post 2006. Figure
2 illustrates the number of Chinese undergraduate students in all fields studying at American
institutions between 2000 and 2013. It is evident that there was a sudden and dramatic increase
in the number of Chinese undergraduate students sometime around 2006. In fact, the number
of admitted Chinese undergraduate students increased almost thirteen-fold in this period, rising
from 8,252 to 110,550. Although the plausibly exogenous foreign supply shock induced by Chinese
students provides an opportunity to investigate the effects of foreign students on institutional
outcomes, my identification does not only rely on the difference in time dimension, because later
10The Chinese government removed the Renminbi’s peg to the U.S. dollar on July 21, 2005, and switched intoa managed floating exchange rate mechanism based on market supply and demand, with reference to a basket ofcurrencies.
11The exchange rates of the Japanese yen (JPY), Australian dollar (AUD) and Euro (EUR) against the Ren-minbi do not show sharp and persistent depreciations after 2006. Exchange rate data could be retrieved fromhttp://www.oanda.com/lang/cns/currency/historical-rates/.
6

years might be different from earlier years in various aspects. Therefore, in addition to comparing
institutional outcomes in pre-shock periods with those in post-shock periods, I also exploit cross-
university variation to take out other factors aside from the foreign supply shock that might affect
institutional outcomes in the first and second periods.
2.2 Economic Benefits from Foreign Undergraduate Students
Admitting foreign undergraduate students could produce large economic benefits (Bound et al.
(2016)). In the U.S., while most private colleges do not charge different tuition and fees based
on student residency status, public colleges charge two types of tuition and fees: in-state (dis-
counted) tuition and fees for the residents of the state where a college is located and out-of-state
(non-discounted) tuition and fees for American students living in other states, as well as all foreign
students. Data from the Trends in College Pricing 2015 show that tuition and fees at an American
nonprofit private university were $32,405, while in-state tuition and fees and out-of-state tuition
and fees at an American public four year university were $9,410 and $23,893, respectively. There-
fore, at least at public universities, tuition and fees charged to a foreign student are considerably
higher than tuition and fees charged to a local domestic student.
Additionally, compared to domestic students, foreign students receive less financial aid from
American institutions. The Institution of International Education Open Doors 2015 Reports states
that 72 percent of all foreign students receive the majority of their education funds through their
families and/or home country government, and among the 28 percent of foreign students who
receive financial aid from U.S. institutions, most of them are graduate students with assistantships
or fellowships. That is to say, foreign students enrolled at the undergraduate level are typically
self-funded, with little institutional financial aid. In contrast, IPEDS Fast Facts suggests that more
than 80 percent and 40 percent of first-time full-time American undergraduate students received
institutional grant aid in 2012-2013 at private non-profit and public institutions, respectively.
In sum, because foreign undergraduate students tend to pay a higher amount of tuition and
fees, especially at public schools, and have little opportunity to receive institutional grant aid, the
economic revenue per capita from a foreign student is much larger than their American peers.
7

3 Conceptual Hypotheses
Many factors affect a college’s admission decision, including the relative quality of the applicants,
the possibility that foreign students pay for a higher fraction of tuition and fees, and the desire to
diversify the student population. Therefore, the influx of foreign students may alter the educational
opportunities available to domestic students in different ways.
The crowd-out effect may work through both direct and indirect channels. Directly, at least in
the short run, the number of slots available for prospective students at a particular school is fixed
due to constraints in student demand. An increase in the enrollment of foreign students would
then imply a decrease in the number of accepted domestic students. Indirectly, the influx of a
large number of foreign students can alter the incentives for domestic students to pursue other
educational programs. Suppose, for example, that many foreign students enrolled in particular
majors (such as STEM fields) choose to stay and work in the United States after their graduation,
which may lower the entry level wages in the STEM-related occupations, then those occupations
would become less attractive to domestic students.12 Since American students are more flexible in
the U.S. labor market, they would shift away from applying to programs in educational disciplines
where many foreign students cluster. Therefore, both of these two channels lead to a crowd-out
effect of foreign students on domestic students. It is noteworthy that the direct channel of the
crowd-out effect is specific to a particular university, while the indirect channel of the crowd-
out effect is the result of an economy-wide supply response which affects all universities. In the
remaining part of this section, I focus on the changes that occur in domestic enrollment within a
particular university resulting from the increase in the number of foreign students. Any economy-
wide fluctuations, therefore, will be netted out.
Although the influx of foreign students could potentially crowd out domestic students through
constraints in the demand for students, other channels may actually expand the number of domestic
students as the size of the foreign student population increases. Section 2.2 illustrates that foreign
12Borjas (2003) and Borjas (2009) provide evidence on the earning impact of immigration and foreign studentsin the U.S. labor market. Freeman et al. (2001) describe the shifts in the bioscience job market as the consequenceof the influx of foreign students.
8
students tend to pay a higher fraction of their undergraduate education, so an institution’s financial
condition could therefore be improved following an influx of foreign students. Institutions could,
theoretically, utilize the revenue collected from foreign students to provide more opportunities
for domestic students. Since demand constraints and the income effect would work in different
directions, the net enrollment effect of foreign students on domestic students is ambiguous in
theory.
While the financial condition of American institutions could be improved due to the additional
source of revenue from foreign students, the consequences following such economic benefits on
institutional financial indicators, however, are less clear-cut. On the one hand, if the foreign
student supply exceeds a school’s demand, and the school believes that it is easier and faster to
collect tuition and fees from international students, the school will simply increase tuition and fees.
Alternatively, if economic gains from foreign undergraduate students are sufficiently large, then
a school might be able to increase the amount of institutional financial aid for accepted students
and/or salaries for faculty and staff. The intuition behind this argument is that most research
colleges in the U.S. are viewed as optimizing school quality or productivity (Hoxby (2002)). As
a result, any excess of revenue above costs would be used to increase financial aid for qualified
students and/or salaries for faculty and staff, because college quality is usually jointly determined
by student quality and faculty quality which are subject to school resources.
Given the theoretical ambiguity of the impacts of foreign students on domestic enrollment and
institutional financial outcomes, in the following analysis I will discuss an empirical identification
strategy to investigate how the influx of foreign undergraduate students affects the U.S. higher
education sectors in various aspects.
4 Data
The core data in this analysis comes from the Integrated Postsecondary Education Data System
(IPEDS) from 2001 to 2013. For each year, institutions report the number of students enrolled
by race and residency status, both at the undergraduate and the graduate level, tuition/fees
9

charged, institutional grant aid offered, average salaries for faculty and staff, and other institutional
characteristics.13
The empirical study focuses on the impact of changing immigration among undergraduate
programs. Ideally, I would like to collect information on the number of Chinese undergraduate
students enrolled at a particular program in a particular year and examine how the influx of Chinese
undergraduate students affects institutional outcomes. However, in the IPEDS database, schools
do not report the number of students by country; they only report the enrollment information by
residency status. Therefore, I use the supply shock of Chinese undergraduate students to generate
variation in the number of nonresident aliens (which, for simplicity, I will refer to as “foreign
students”), and examine the effects of foreign undergraduate students on U.S. institutions.14 Given
that China is the biggest source of foreign students in America, it is reasonable to anticipate that
a sudden and dramatic increase in the number of Chinese students would also be reflected in an
increase in the number of nonresident aliens. Figure 3 illustrates the total number of Chinese
undergraduate students and the total number of all international undergraduate students in all
fields studying in American institutions between 2000 and 2013. Although not perfectly correlated,
the patterns of these two figures are very similar, suggesting that the supply shock induced by
Chinese students led to a sharp increase in the number of all foreign students. Specifically, from
2005 to 2013, the number of Chinese undergraduate students increased by 101,246, while the
number of all foreign undergraduate students increased by 131,506.15 That is to say, about 77
percent of the increase in foreign undergraduate students was driven by Chinese students.
Interestingly, the increase in the number of foreign undergraduate students was not felt equally
across all types of colleges. Figure A.1 depicts foreign enrollment by college type from 2001 to
2013 based on Carnegie Classification 2000 (Research, Masters, Baccalaureate and others). While
research universities experienced the majority of the influx of foreign students after 2006, other
13The completion of all IPEDS surveys is mandatory for institutions that participate in or are applicants for anyfederal student financial aid program.
14Nonresident alien refers to a person who is not a citizen or national of the United States and who is in thiscountry on a visa or temporary basis.
15In 2005, the number of Chinese undergraduate students and the number of total foreign undergraduate studentsin the U.S. were 9,304 and 239,218, respectively; however, in 2013, these figures became 110,550 and 370,724,respectively.
10

types of colleges saw little fluctuation in foreign enrollment. Therefore, in this paper, I restrict my
attention to U.S. research universities that provide 4 years or more of higher education.16 I calculate
the total enrollment at each institution by counting full-time first-time undergraduate students.
To get a balanced panel, I exclude institutions that only appear in pre-shock or post-shock periods.
By construction, I get 246 institutions and observe the data at the institution-year level, so in total,
the panel tracks the institutional outcomes of 246 institutions over 13 years. Figure 4 presents the
average number and the average fraction of full-time first-time foreign undergraduate students at
each research university over the 2001 and 2013 period.17 The figure clearly shows an increase in
both the number and the fraction of foreign undergraduate students at U.S. research institutions
after 2006. Detailed main variable descriptions and source information are shown in Table A.1
and summary statistics are shown in Table A.2.
The trends in Figure 4, however, only show the time-series variation but ignore the possibility
that there exists heterogeneity in the sample of American institutions. There is little reason to
suspect all institutions are impacted the same. Inspired by Card and DiNardo (2000) and Card
(2001), in this analysis, I assume that institutions that had a higher number of foreign students
prior to 2006 are likely to have a larger influx of international students after the shock. In Figure
A.2, I present a plot of the average number of foreign undergraduate students between 1998 and
2000 (prior to the sample period) against the average number of foreign undergraduate students
between 2006 and 2013 (after the shock). As predicted above, there is a strong positive association
between the number of previously enrolled foreign students and the number of newly enrolled
foreign students. Therefore, in this analysis, I utilize both cross-time and cross-sectional variations
to generate plausibly exogenous variations in the number of foreign students. First, I use the
changes in visa policies and exchange rate regimes in 2006 to generate pre-shock and post-shock
periods. Second, I use historical levels of foreign students across universities as a shift-share
instrument to predict enrollment patterns after 2006.
16Based on Carnegie Classification 2000, research universities refer to research universities (extensive) and researchuniversities (intensive).
17The fraction of foreign student is calculated by dividing the total number of nonresident aliens by the totalnumber of students.
11

5 Empirical Methods
The empirical equation of interest is a two-stage least square model that is identified with a
difference-in-differences specification. Let Eut denote institutional outcomes of interest at school
u in time t, and I am interested in the domestic enrollment and institutional financial outcomes.
Let Fut denotes the respective number of full-time first-time foreign undergraduate students. The
OLS regression model used to capture the impacts of the influx of foreign undergraduate students
on institutional outcomes is given by:18
Eut = δu + ϕt + βFut + εut (1)
Where δu represents a vector of university fixed effects, which is used to net out any time-
invariant university-specific factors that may affect institutional outcomes; ϕt represents a vector
of year fixed effects, which is used to net out any time-specific factors that are common to all
universities and determine outcomes of interest. The coefficient of interest is β, which measures
the effects on institutional outcomes within a particular university when that university enrolls
one additional foreign student. The final term ε is the idiosyncratic error term. The standard
errors are clustered at the university level. It is important to note that time-invariant difference
between larger universities and smaller universities in many dimensions does not invalidate the
identification strategy since level effects are differenced out by including university fixed effects.
Estimation of Equation 1 by the standard OLS regression may lead to biased estimates of β for
several reasons. If universities recruited more foreign students because they faced a decline in the
demand of qualified domestic students or because they became less generous in offering financial
support, then the reverse causality would contaminate the estimates of β. Therefore, in order to
overcome the endogeneity bias, an instrumental variables strategy is necessary.
Card and DiNardo (2000) and Card (2001) first argued that new immigrants are more likely to
gravitate towards enclaves established by earlier immigrants from the same country, and since then
18In this analysis, all variables are measured at levels. The baseline specification (Equation 1) is consistent withexisting literature in this field (Borjas (2004)).
12

their instrument has been used to explore the impacts of immigration on a variety of outcomes in
more recent papers (Wozniak et al. (2012),Peri et al. (2015)). Similarly, in this paper, I instrument
the number of full-time first-time foreign undergraduate students by the interactions of two terms:
one, a continuous number of full-time first-time foreign undergraduate students between 1998 and
2000 at each university, and the other indicating the relative year to 2005. Therefore, the first-
stage equation that relates the endogenous regressor to the instrumental variables and other control
variables is:
Fut = δu + ϕt +8∑
k=−4,k 6=0
αk(BeforeForeignu ∗ PostY eark,t) + εut (2)
In this equation, BeforeForeign equals the historical number of full-time first-time foreign
undergraduate students at each institution between 1998 and 2000; and PostY ear are indicator
variables equaling one if the year is k years relative to 2005. The omitted category is the last
year prior to the supply shock (2005).19 Since the specification has a set of year dummies and
institution dummies, α denote difference-in-differences coefficients. However, unlike the standard
difference-in-differences model, instead of using simple “treatment” and “post” indicators, I use
a continuous measure of the number of initial foreign undergraduate students at each school and
a series of year-since-supply shock dummies. The identification, therefore, could generate more
variation and estimate more time dynamic effects.20
The validity of the instrumental variables relies on several assumptions that are fundamentally
unprovable. First, the influx of foreign students cannot be endogeneously affected by the demand
of top foreign student receiving institutions. Second, the instrumental variables do not affect
institutional outcomes of interest through channels other than the increase in the number of foreign
undergraduate students. The validity of the difference-in-differences instrumental variables and the
robustness of the baseline results will be extensively discussed and tested in the Section 7.
19For example, if the year is 2004, then k=-1; if the year is 2006, then k=1; if the year is 2007, then k=2.20In section 7.2, I show that the regression results are robust to the standard difference-in-difference model and
the model ignoring time series information.
13

6 Results
6.1 First-Stage Results
An interesting starting point for empirical analysis is to investigate the extent that the foreign
supply shock affects the enrollment of foreign undergraduate students at different institutions.
Before jumping into regression results, it is instructive to present a difference-in-differences graph
by two distinct groups: universities with many foreign students before the shock and universities
with few foreign students before the shock. To split the sample into two equal groups, institutions
with many earlier foreign students are defined as 123 universities that had more than the median
number of full-time first-time foreign undergraduate students between 1998 and 2000, and corre-
spondingly, the other 123 universities with few earlier foreign undergraduate students are in the
residual group.21 From Figure 5, we can see increasing trends in the average number of foreign
undergraduate students enrolled in U.S. universities after 2006. The increase in foreign students
is significantly larger at universities with many initial foreign student populations, suggesting that
these universities are more greatly affected by the supply shock, while institutions with few initial
foreign students are less affected. However, the differences between these two groups illustrated in
the figure might be sensitive to the cutoff that I choose to split the sample. It is also important to
note that the graphic representation might understate the variation. Therefore, rather than just
simply dividing the sample into two groups, I report the regression results of Equation 2.
Table 1 displays the first-stage regression coefficients of the interaction terms BeforeForeign
and PostY ear (αk in Equation 2). Column (1) contains the regression results on the entire
sample. However, the average effect may mask heterogeneous effects across institutions with
different characteristics, so from columns (2) through (5), I present the first-stage results separately
by the type and ranking levels of institutions (ranked by the U.S. News, 2015). “Higher ranked” are
schools whose rankings are among the top 100, while “lower ranked” are schools whose rankings
are above 100 or have no rankings. Results in Table 1 show that while the coefficients in the
21Table A.3 lists the top 30 research universities that enrolled the most and fewest full-time first-time foreignundergraduate students between 1998 and 2000.
14

pre-shock periods are negative, small in magnitude, and do not present a particular trend, all
of the coefficients in the post-shock periods are positive, of larger magnitude, and present an
increasing trend. This implies that the difference in the foreign enrollment between highly affected
institutions and less affected institutions is increasing over time. The coefficients in column (1)
could be interpreted as schools having one more foreign student between 1998 and 2000 would
enroll an extra 0.029 more foreign students in 2006, an extra 0.060 more in 2007 and an extra
0.124 more in 2008. Separate regressions across the type and ranking levels of institutions reveal
a similar pattern. The thirteenth row of Table 1 displays the Cragg-Donald Wald F -statistics
associated with the coefficients on the instrumental variables in the first-stage equation.22 Except
for “lower ranked” schools, all other Cragg-Donald Wald F statistics are at least above the Stock
and Yogo (2001)’s critical value at the 10 percent level, suggesting that other than lower ranked
schools, weak instruments are not a particular concern in this analysis.23
Figure 6 graphically presents the first-stage coefficients (solid lines) along with their 95 percent
confidence intervals on the year-since-supply shock indicators, with the last year before the supply
shock (2005) as the reference category (t=0).24 As the figure shows, the coefficients are small
in magnitude in the pre-shock periods with no obvious trend. The coefficients in the post-shock
periods, however, are positive, larger in magnitude, and increasing over time. The first-stage
results, therefore, confirm that institutions with many earlier foreign students saw a greater influx
of new foreign students after 2006.
22If the number of instruments exceeds the number of endogenous regressors, a simple F -test on the instrumentsis not reliable. Alternatively, I use the Cragg-Donald F -statistics and compare the Cragg-Donald F -statistics tothe Stock and Yogo (2001)’s critical values to test for weak instruments.
23Stock and Yogo (2001)’s critical values for one endogenous regressor with twelve instruments at the 5 percentand the 10 percent level are 21.01 and 11.52, respectively
24Because the first-stage results are not significant for “lower ranked” schools, I do not plot the first-stagecoefficients for “lower ranked” universities.
15

6.2 Enrollment Effects
6.2.1 Main Results
The results above indicate that the foreign supply shock had a disproportionate impact on Amer-
ican research universities: foreign students are more likely to be enrolled at institutions with more
initial foreign students. The next thing to consider is the effect of this foreign influx on domestic
enrollment at American universities using the instrumental variables (IV) estimation. Table 2
reports the second-stage coefficient β after using the number of full-time first-time domestic un-
dergraduate students enrolled at school u in year t as the dependent variable and instrumenting
the number of full-time first-time foreign undergraduate students by BeforeForeign and multiple
year dummies (see Equation 2). Column (1) reports the regression results on the full sample, and
columns (2) through column (4) report the regression results based on the type and ranking levels
of schools.25
The estimated coefficient in column (1) is -0.53 (with a standard error of 0.47) and is sta-
tistically insignificant, indicating that the crowd-out effect of the enrollment of foreign students
on the enrollment of domestic students is imprecise in the sample of all schools. However, this
aggregate correlation masks a great deal of dispersion across different types of institutions. Results
in columns (2) through (4) suggest that although there is little evidence of a crowd-out effect on
domestic students at public schools, the crowd-out effect is particularly strong at schools with
higher rankings. In fact, the coefficient on the domestic enrollment at higher ranked universities is
-1.29 (with a standard error of 0.54), indicating that I cannot reject the null hypothesis that the
crowd-out is one-for-one at these higher ranked universities.
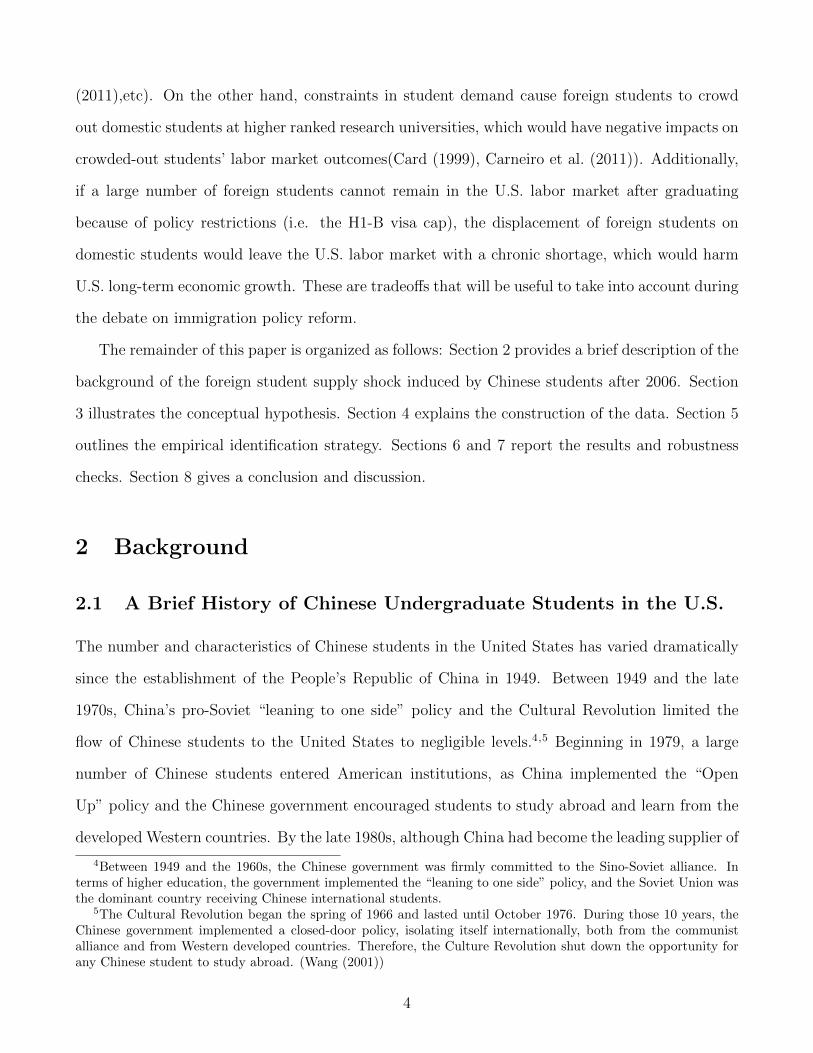
Figure 7 illustrates the variation that underlies the regression results focusing on higher ranked
universities. The enrollment of domestic undergraduate students show differential trends between
universities with many earlier foreign students and universities with few earlier foreign students
after the supply shock. While institutions with few earlier foreign students show a consistently
increasing trend in domestic enrollment over time, institutions with many earlier foreign students
25Because the first-stage results are not significant for “lower ranked” schools and the weak instrument cannotgive us reliable second stage estimate, I do not report the second-stage results for this group.
16

see a stagnant pattern in domestic enrollment after 2006. Therefore, consistent with the regression
results, the figure documents the relative decline in the number of domestic undergraduate students
at institutions with many earlier foreign students.
To summarize, the results in Table 2 suggest that in the top-100 research universities, there
exists a significant crowd-out effect of foreign undergraduate students on domestic undergraduate
students, with the point estimate close to negative one. In other types of universities, the crowd-
out effect is estimated to be smaller, but given the estimates for these other groups are imprecise,
I cannot reject the null that crowd-out is zero or one.
6.2.2 Constraints In the Demand for Students
In this section, I examine whether constraints in the demand for students are a possible explanation
behind the crowd-out effect in higher quality schools. Recent studies (Lovenheim (2011), Barr
and Turner (2013), Kim (2014))acknowledge that changes in enrollment are jointly determined by
changes on both the supply for students and the demand for students. Some universities experience
limited adjustments in student quantity when faced with a supply shock due to various constraints
in campus size, faculty resources, government subsidies, and prestige. Therefore, if in the face of
a student supply shock, a university is less able or willing to respond by increasing class size, a
crowd-out is more likely.
In order to investigate this mechanism, I use a university’s historical enrollment pattern between
1991 and 2000 to measure whether it is subject to more constraints in the demand for students.
In practice, I compare schools between two groups–schools with historically stable enrollment
patterns and schools with historically fluctuating enrollment patterns. I use two measurement to
distinguish whether a school has a historically stable (or fluctuating) enrollment pattern. The first
measurement is based on the percentage change in total undergraduate enrollment.26 I consider
a school with a historically stable enrollment pattern as one with a ten-year percentage change
between 1991 and 2000 smaller than a change at the lower tertile level. Correspondingly, I consider
26Total undergraduate enrollment means the total number of full-time first-time undergraduate students. Thepercentage change is in absolute value.
17

a school with a historically fluctuating enrollment pattern as one with a ten-year percentage change
between 1991 and 2000 larger than a change at the upper tertile level. However, enrollment might
fluctuate year-to-year, which therefore requires a second measurement of enrollment patterns. This
second measurement is based on the coefficient of variation of undergraduate enrollment. Similarly,
if a school’s coefficient of variation of undergraduate enrollment is smaller than the lower tertile
level, then I consider it as a school with historically stable pattern. If a school’s coefficient of
variation of undergraduate enrollment is larger than the upper tertile level, then I consider it as a
school with a historically fluctuating pattern. Schools with historically stable enrollment patterns
are assumed to have more constraints in the demand for students than schools with historically
fluctuating enrollment patterns.
The results of exploring the mechanism behind the crowd-out effect through constraints in the
demand for students are presented in Table 3 and Table A.4. To simplify the exposition, I will
mainly discuss the coefficients summarized in Table 3, which uses the ten-year percentage change
in undergraduate enrollment to measure a school’s enrollment pattern. Results in columns (1) and
(2) show that the coefficient on domestic students is only negative and statistically significant at
universities that are subject to more constraints, and I cannot reject the null that the crowd-out
effect at universities with higher constraints in the demand for students is one-for-one. In columns
(3) and (4), I focus on higher quality (top-100) universities. Among the top-100 universities, 41
belong to schools with more constraints based on the above classification criteria, while 25 belong to
schools with less constraints. Results in columns (3) and (4) yield a similar conclusion, suggesting
that among higher quality schools, the crowd-out effect is much stronger at universities that are
subject to more constraints in the demand for students, and the coefficient on domestic students
at these universities is close to negative one. Regression results using an alternative definition of
historically stable (or fluctuating) enrollment patterns are presented in Table A.4. Not surprisingly,
the estimated coefficients also show that the crowd-out effect only exists at universities with more
constraints. In sum, the regression results in Table 3 and Table A.4 support the hypothesis that
constraints in the demand for students are an important channel to drive the crowd-out effect at
higher quality schools.
18

6.2.3 Admission Standards
After the foreign student supply shock, U.S. institutions faced much larger application pools, which
may have affected their admission standards. To test this, I run the two-stage least square equation
using the SAT 25th verbal/math percentile score and SAT 75th verbal/math percentile score as
dependent variables, with corresponding results shown in Table 4. Although the coefficients on the
SAT 25th and 75th percentile verbal scores are positive, they are either statistically insignificant
(SAT 25th verbal scores) or only marginally statistically significant (SAT 75th verbal scores). The
coefficients on the SAT 25th and 75th percentile math scores are positive, larger in magnitude and
at least statistically significant at the 5 percent level. The regression results suggest that the SAT
verbal scores of newly accepted foreign students are comparable to their American counterparts,
but the SAT math scores of newly accepted foreign students are higher than their American peers.
The empirical results, therefore, imply that admitting more foreign undergraduate students has
resulted in an increase in admission standards at American universities, at least measured by SAT
math scores.
6.3 Effects on Institutional Financial Outcomes
In this section, I investigate the impacts of the influx of foreign undergraduate students on insti-
tutional financial outcomes. There is limited financial data in the IPEDS data, but I will focus
on four variables: tuition for full-time first-time undergraduate students, fees for full-time first-
time undergraduate students, the average amount of institutional grant aid received by full-time
first-time undergraduate students, and the average salaries for equated 9-month instructional staff.
The pricing of higher education in the United States is completely different between private and
public institutions. Private universities do not differentiate tuition/fees by state residency status
of students. In contrast, public universities charge discounted tuition/fees for in-state residents,
and non-discounted tuition/fees for out-of-state residents and foreign students. Therefore, I distin-
guish institutional tuition and fees by two types: discounted tuition/fees at public universities and
19

non-discounted tuition/fees at both public universities and private universities.27,28 It is important
to note that both discounted and non-discounted tuition/fees in this paper are list (sticker) prices,
but discounted tuition/fees are discounted prices charged by public universities only for in-state
residents.
Columns (1) and (2) of Table 5 report the estimated second-stage coefficients using different
types of tuition as dependent variables. While the point estimate on non-discounted tuition is
large and statistically significant at the 1 percent level, the point estimate on discounted tuition at
public schools is of a smaller magnitude and is only marginally statistically significant. Columns
(3) and (4) of Table 5 represent the results on school fees, and both coefficients are very small
in magnitude and statistically insignificant. The results indicate that the influx of foreign under-
graduate students has little impact on fees charged by American universities, but an additional
foreign undergraduate student would lead to a 10-dollar increase in non-discounted tuition. The
fact that this increase is much smaller on discounted tuition at public schools but particularly
larger on non-discounted tuition is acceptable because any change in discounted tuition at public
universities faces complicated political hurdles and is subject to state and local legislators’ regula-
tion. Therefore, public universities cannot easily increase discounted tuition for in-state residents
as much as non-discounted tuition for out-of-state residents in response to market forces.29
Because foreign undergraduate students are more likely to pay full tuition, their entrance might
enable universities to increase the amount of institutional financial aid for students and/or salaries
for faculty and staff. The economic gains would be, in turn, beneficial for accepted domestic
students and university faculty and staff.30 In order to examine such a potential effect, I run
the regressions using the average amount of institutional grant aid and the average salaries for
27Fees are fixed sum charged to students for items not covered by tuition and are required of such a largeproportion of all students that a student who does not pay the charge is an exception.
28In other words, discounted tuition/fees mean in-state tuition/fees, while non-discounted tuition/fees includeout-of-state tuition/fees at public universities and tuition/fees at private universities.
29In-state tuition/fees at public universities are regulated by state and local governors because the state andlocal appropriations are the largest revenue source for public universities. Data from the State Higher EducationExecutive Officers association suggest that in 2009, 58 percent of public universities’ operating revenue are fromstate appropriations.
30An alternative variable of interest is the net price for students, however, the net price data are not available inthe pre-shock periods.
20

instructional staff as dependent variables, with estimates presented in columns (5) and (6) of
Table 5. The point estimate in column (5) is 12.34 (with a standard error of 5.64), in other
words, one extra foreign student leads American research institutions to increase the average
amount of institutional grant aid for accepted undergraduate students by roughly 12 dollars. The
point estimate in column (6) is also positive but is only marginally statistically significant. The
results are therefore supportive of the argument that colleges are able to increase the average
amount of institutional grant aid for accepted students. Given the fact that the magnitude of
the coefficients on non-discounted tuition and on institutional grant aid are both positive and of
similar magnitudes, for accepted domestic students who receive institutional grant aid, the increase
in non-discounted tuition can be at least offset by the increase in institutional grant aid.
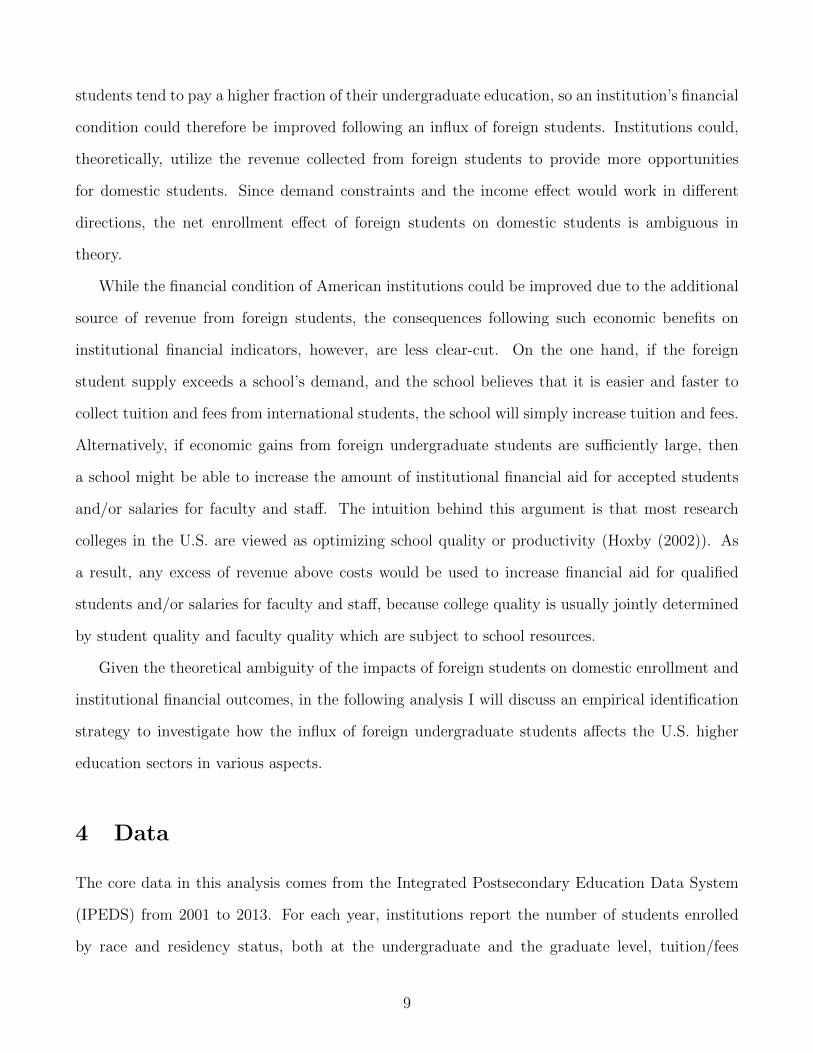
It is instructive to illustrate the raw data that underlies results on institutional financial vari-
ables. Figure 8(a) and Figure 8(b) plot non-discounted tuition and institutional grant aid for
accepted students by two types of institutions over time. The regression results in Table 5 are
consistent with the raw data that are illustrated in Figure 8.
7 Robustness Checks
7.1 Validity of the Instrumental Variables
In order to provide consistent estimates, the instrumental variables must satisfy the exclusion
restriction in that it only affects institutional outcomes through foreign undergraduate students.
Although the exclusion restriction is fundamentally untestable, in this section I provide evidence
that rules out several first-order concerns and demonstrates that the baseline results are robust
across different specifications.
The instruments used in this paper are derived from the interaction of two components–a
university’s historical presence of foreign undergraduate students between 1998 and 2000, and the
foreign student supply shock induced by Chinese students after 2006. Therefore, each component
should be uncorrelated with other factors that have impacted domestic enrollment and institutional
financial variables.
21

Drop the Great Recession Observations : If institutions with and without many earlier foreign
students behaved quite different in the Great Recession (2007-2010). For example, during the Great
Recession, “tuition freezes” were commonly implemented in several states. Under the “tuition
freezes” agreement, in order to increase the funding from the state, institutions agreed not to
increase tuition for a certain period. If institutions with many earlier foreign students switched
from attracting foreign students to domestic students and stopped increasing their tuition in order
to obtain the government funding during the Great Recession period, it would lead to biased
estimates of β. One possible solution is to re-run all 2SLS regressions excluding observations in
years 2007-2010, with results presented in Table 6.31 After excluding observations in years 2007-
2010, the instrumental variables still maintain their statistical power at the first-stage, and the
second-stage results are very comparable to the baseline results in Table 2 and Table 5.32
Drop Ten Universities : A second concern for this model is that the foreign supply shock
induced by Chinese students after 2006 might not be completely supply driven, but partially
demand induced since some large universities with a high number of earlier foreign students might
have incentives to lobby the government to relax the visa policies for international students. If
that was the case, the foreign supply shock for education is not completely exogenous to each
individual institution, resulting in a bias of the IV estimates. Figure A.3 presents the distribution
of the number of full-time first-time foreign undergraduate students between 1998 and 2000 across
American research universities. The data show that there do exist some universities that enrolled a
significant number of foreign undergraduate students between 1998 and 2000. In order to alleviate
this concern, I run the regressions by omitting ten universities that enrolled more than 400 full-time
first-time foreign undergraduate students between 1998 and 2000.33 Table 7 reports the second-
stage results using the interaction term BeforeForeign and a series of year dummies as IV when
excluding ten universities. Here I do not show first-stage coefficients, but I display the Cragg-
31Due to the space limit, I only report the robustness checks of the point estimates that are significant in Table 2and Table 5. However, I also conduct sensitivity analysis on other institutional outcomes of interest, and the resultsare comparable to my baseline results.
32All Cragg Donald F statistics pass the weak instruments test at least the 10 percent level.33These ten universities are Purdue University, Boston University, University of Michigan, University of Texas at
El Paso, University of Pennsylvania, Cornell University, New York University, Northeastern University, Universityof Wisconsin-Madison and University of South California.
22

Donald Wald F test in the second row. Most coefficients on institutional outcomes are similar to
the main results in Table 2 and Table 5. However, if I use the enrollment of domestic students as
the dependent variable at higher ranked universities, the coefficients change from being significant
to being imprecise.
Account for School Size Differences : If universities with few earlier foreign students are much
smaller than universities with many earlier foreign students, this raises the concern that universities
with few earlier foreign students might not provide a credible comparison group. By simply
comparing the total enrollment between 1998 and 2000 at universities with many earlier foreign
students to that at universities with few earlier foreign students, I find that on average, universities
with many earlier foreign students enrolled approximately 30 percent more full-time first-time
foreign students than universities with few earlier foreign students. In the baseline specification,
I include university fixed effects to net out time-invariant differences between larger schools and
smaller schools, but the concern still exists if there are time-varying factors which affect larger
schools and smaller school differently. I propose two ways to overcome this problem. First, I
allow universities with different pre-shock sizes to follow different trends, with the results reported
in Table 8. Specifically, in columns (1) to (3), I divide the sample into 22 groups based on
their initial total number of full-time first-time undergraduate students between 1998 and 2000,
with each group having 1000-student bands, I then incorporate group-specific linear time trends
into the baseline specifications. In columns (4) to (6), I conduct an even more demanding test by
adding institution-specific linear time trends into the baseline specification. The regression results,
however, show that allowing universities with different initial school sizes to follow different trends
would not significantly change the baseline results.34
A second potential way to address this worry is to run separate regressions by the size of a
university. Therefore, I divide institutions into equal three categories: large-sized schools, mid-
sized schools and small-sized schools. Universities in each category are those whose total number
of full-time first-time undergraduate students between 1998 and 2000 are within their tertile.35
34I also conduct a similar analysis by adding group or institution specific quadratic time trends. The regressionresults presented in Table A.5, which are comparable to the results in Table 8.
35Because I have 246 universities in the sample, each category contains 82 universities.
23

Universities are more comparable within their size group after dividing them into subcategories.
I run separate IV regressions using institutional variables as outcomes for large-sized schools and
small-sized schools, with the second-stage results along with Cragg Donald F statistics reported
in Table 9.36 The coefficient on the number of domestic students is only statistically significant at
large-sized schools, with the point estimate close to negative one, suggesting that there exists an
approximately one-for-one crowd-out effect at large-sized schools. Coefficients on non-discounted
tuition and institutional grant aid are all positive and statistically significant at both large-sized
and small-sized universities, but the magnitude of coefficients on non-discounted tuition and insti-
tutional grant aid are much greater at small-sized schools, suggesting that for small-size schools,
the marginal economic benefit of admitting one extra foreign student is of particular significance.
Spillovers from Graduate Programs : A fourth potential concern is due to the fact that visa
relaxation policies and exchange rate regimes affect both undergraduate and graduate students. If
a university experienced an influx of foreign graduate students in addition to foreign undergraduate
students after 2006, and there existed financial spillovers from graduate programs (i.e. tuition used
collected from masters programs to pay institutional grant aid or salaries), then the effects I find in
the previous context may be biased. To address this problem, I run Equation 2 using the number
of full-time first-time foreign graduate students as the dependent variable, with corresponding
coefficients displayed in Figure 9(b). In comparing coefficients in Figures 9(b) and 9(a), we find
that although universities with many initial foreign undergraduate students also experienced a
larger increase in the foreign graduate enrollment after 2006, the coefficients in Figure 9(b) are
only 1/3 to 1/10 the magnitude of those in Figure 9(a). This suggests that the foreign supply shock
is much greater for undergraduate programs than for graduate programs. Therefore, even though
the influx of foreign graduate students may affect baseline point estimates, its lack of significance
suggests that it would not be an important driver of my results.
Domestic Student Supply : Another possible scenario that would violate the exclusion restriction
is an institution attracting more foreign students while also becoming more/less popular among
36Because the first-stage results do not pass Stock and Yogo (2001)’s weak instruments test at the 10 percentlevel at mid-sized schools, I do not report the second-stage results of mid-sized schools.
24

domestic students due to institutional characteristics that are unrelated to the foreign supply
shock. Ideally, I could check the number of domestic applications across universities over time
to see whether this concern exists. Unfortunately, the IPEDS do not have information about
the number of applications separated by domestic and foreign students, but I can use an indi-
rect approach to examine this concern. Figure 10(a) shows the coefficients of running Equation
2 using the total number of applications as the dependent variable. Similar to the pattern in
the baseline first-stage coefficients, while the coefficients are relatively small in magnitude and do
not present an obvious trend in the pre-shock periods, the post-shock coefficients are positive, of
larger magnitude, and have an increasing trend. Regression results suggest that institutions with
many earlier foreign students also received a larger increase in the number of applications after
the supply shock. To disentangle whether the relative increase in the number of applications is
driven by foreign applicants or domestic students or both, I would need to know the enrollment
rate by all students, foreign students, and domestic students, respectively.37 Dividing the total
number of full-time first-time students by the total number of applicants, I can get the overall en-
rollment rate; however, institutions do not typically report the enrollment rate by domestic/foreign
students. By randomly selecting fifty universities in my sample and checking these institutions’
enrollment statistics, I find the enrollment rate presented by domestic/foreign students from only
a few universities.38 Although enrollment rates differ across universities and years, the enrollment
rate of foreign students is much lower than the overall enrollment rate: in particular, the foreign
enrollment rate is typically only 1/2 to 1/10 of the overall enrollment rate. If I assume the foreign
enrollment rate is 1/4 of the overall enrollment rate in my sample, then I could approximate the
relative increase in the number of applications that are attributed to foreign applicants by dividing
coefficients in Table 1 by the approximated foreign enrollment rate, with the approximated number
of foreign applications presented in Figure 10(b). Comparing Figure 10(b) with Figure 10(a), we
can see that they are very similar in patterns and magnitudes, implying that the increase in the
number of applications is mainly driven by foreign applicants. Therefore, it seems that the do-
37Enrollment rate=Acceptance rate* Yield rate. Acceptance rate= number of students accepted/total applicants.Yield rate= number of students enrolled/number of students accepted.
38Enrollment information in these universities are reported in Table A.6
25

mestic applicant pool does not particularly change between universities with many earlier foreign
students and universities with few earlier foreign students over time.
Pre-trends : Additionally, any difference-in-differences identification relies on the assumption
that the treatment group and the control group behave similarly prior to the shock. I have two
ways to test this assumption. First, some graphical presentations already allow for a partial test.
In Figure 6, if the foreign supply shock is unrelated to underlying trends and institutions do not
respond before the supply shock, there should be no trend in the PostY eark’s for k ≤ 0. Figure
6 shows that there is no apparent trend in the pre-shock coefficients in any type of university. In
Figure 7 and Figure 8, if institutions with many earlier foreign students and institutions with few
earlier students did not behave differently prior to the shock, the raw data of domestic enrollment
and financial outcomes in these two types of universities should be parallel to each other in the
pre-shock periods. From Figure 7 and Figure 8, I cannot visualize a particular difference in trends
between these two types of institutions before the supply shock.
Second, I present a placebo test only using the pre-shock periods of the data to ensure that it
is unlikely that the difference in prior trends explain my findings. Specifically, I run Equation 2
by moving the foreign supply shock from 2006 to 2003, and using different outcomes of interest
as dependent variables. If there were no differential pre-trends among universities, it is expected
that the estimated coefficients of the new interaction term would have a small magnitude and be
statistically insignificant. Table 10 reports the results for the placebo test, and as expected, all of
the coefficients are close to zero and most of them are statistically insignificant.
7.2 Other Identification Strategies
In addition to the baseline specification, I conduct the analysis using different identification strate-
gies. First, in addition to the cross-year and cross-university variations in foreign inflows, I exploit
a third important characteristic of foreign students: foreign students are more likely to concentrate
on some majors than others, so I construct a two-stage least square model that is identified with a
triple-difference specification. Second, instead of using an event-study style equation, I implement
a more standard difference-in-difference model as the first-stage, so the model is exactly identified.
26

Third, I use a model that ignores time series information to correct for serial correlation problem in
a long panel. Finally, I create two alternative instrumental variables to further assess the robust-
ness of the baseline results. In the following part of this section, I will discuss each identification
strategy in detail.
7.2.1 A Triple-Difference Design
I create a triple-difference design by looking at the difference across majors at a given university.
The advantage of using a triple-difference model over a difference-in-differences model is that the
exclusion restriction is only violated if there exists time-varying differences between the more
affected majors versus the less affected majors within a university that had differential effects on
institutional outcomes. The IPEDS only report the enrollment information by residency status
and major biennially, so in my sample I can gather the information about the undergraduate
enrollment by residency status and major in 2002, 2004, 2006, 2008, 2010, and 2012. Figure
A.4 depicts the number of full-time first-time foreign undergraduate students by major between
2002 and 2012. It shows that while the number of foreign undergraduate students experienced a
sharp increase in business, engineering, mathematics and physical science after 2006, the number of
foreign undergraduate students in biology/life science and education is stagnant. This phenomenon
indicates that business, engineering, mathematics and physical science fields are more affected by
the foreign supply shock after 2006. Therefore, I run the following regression using a triple-
difference IV to capture the exogenous variation in the number of foreign students:
Fuft =3∑
k=−2,k 6=0
λk(BeforeForeignu ∗ PostY eark,t ∗Majorf ) + δu + ϕt + υf
+majorf ∗ δu + shockt ∗ δu +majorf ∗ shockt + εuft (3)
Where the instrumental variables here are the triple interactions of an indicator variable of
whether the major is in a more affected field, a set of dummies of the year relative to 2006,
and the continuous measure of the historical number of full-time first-time foreign undergraduate
27

students at each university between 1998 and 2000. Because I do not have enrollment information
by major in 2005, the omitted group is the first year of the supply shock (2006). Major is a
dummy variable which equals one if the major is business, engineering, mathematics or physical
science and 0 otherwise. Shock is a dummy variable if the year is in or after 2006. The first-
stage and second-stage results are reported in Table 11, separately for all universities and higher
ranked universities. While pre-shock coefficients are negative and of small magnitude, post-shock
coefficients are positive in the first-stage, suggesting that within a university, foreign students
are more likely to be enrolled in the more affected majors after the shock.39 The second-stage
coefficients are comparable to the main results in Table 2: the coefficient is negative and is of
larger magnitude among higher ranked universities, with the point estimate close to negative
one.40
7.2.2 An Exactly Identified Difference-in-Differences Model
In my baseline analysis, I use an even-study style regression as the first-stage, so one endogenous
variable (the number of foreign students) was instrumented by multiple instrumental variables
(BeforeForeign times different year-since-supply shock dummies). In this section, I use a more
standard difference-in-differences model as the first-stage:
Fut = δu + ϕt + Φ(BeforeForeignu ∗ PostY eart) + εut (4)
Where instead of decomposing PostY ear into different year dummies relative to 2005, PostY ear
is an indicator variable which equals one if the year is after 2005. The second-stage results using
Equation 4 as the first-stage are presented in Table 12. Compared to the results in Table 2 and Ta-
ble 5, the second-stage results with one instrumental variable and multiple instrumental variables
are comparable.41
39Stock and Yogo (2001)’s critical value for a model with one endogenous regressor and four instruments is 10.83at the 10 percent level.
40Because institutional financial outcome variables do not vary by major in the data, I cannot use a triple-differences design to examine the effects on institutional financial variables.
41The F statistics in the first-stage is close to or greater than 10.
28

7.2.3 Aggregating the Data
One limitation of the difference-in-differences strategy pointed out by Bertrand et al. (2004) is that
due to the serial correlation problem, the standard error for the point estimate of interest could be
severely understated.42 One of the corrections in their paper to solve the serial correlation problem
is to ignore time series information when calculating standard errors. I follow this recommenda-
tion by collapsing the data to pre-shock and post-shock periods and running regressions on the
aggregated outcome variables in a panel of two periods. The results of this exercise are presented
in Table 13. After the collapsing, the number of observations declines, but the second-stage results
are similar to the baseline results in Table 2 and Table 5.
7.2.4 Alternative Instrumental Variables
I use two alternative instrumental variables (IV) specifications that depend on different assump-
tions. First, I follow Wozniak et al. (2012) and use the following IV for current foreign students:
IV = (Fu,1998and2000
F1998and2000)∗(Ft−Fu,t), where the first term is an institution’s historical (between 1998 and
2000) share of total foreign undergraduate students among all universities, and the second term
is the subtraction of an institution’s own inflow from total inflow. Similar to Card and DiNardo
(2000) and Card (2001), this IV assumes that if there exists a supply shock, institutions with
larger shares of foreign undergraduate students in the prior period are more likely to experience
larger changes in the number of foreign undergraduate students. However, this IV also relies on
the assumption that fluctuations in the number of foreign undergraduate students in the rest of the
school, which are driven by factors exogenous to school u, drive the shocks to the changes in the
number of foreign undergraduate students. Therefore, the corresponding first-stage that relates
the endogenous regressor to the new IV is:
Fut = δu + ϕt + ρ(Fu,1998and2000
F1998and2000
) ∗ (Ft − Fu,t) + εut (5)
The second-stage results of using the new IV are displayed in Table 14. The associated F
42For detailed information, please refer to Bertrand et al. (2004).
29

statistics in the first-stage equation is close to or above ten, indicating that the new IV has
statistical power in the first-stage. Table 14 yields quite similar results to the main coefficients in
Table 2 and Table 5.
Second, the baseline instruments assume that the initial number of foreign students at a school
could predict the future flow, but one might be also interested in investigating if the initial fraction
of foreign student at a school could also predict the future flow. In order to explore this possibility,
I use the initial fraction of foreign students at a given university as a shift-share instrument, and
the OLS equation of interest and the first-stage equation could be written as:
Eut = δu + ϕt + βFu,t
EnrollTotalu,t−1+ εut (6)
Fu,t
EnrollTotalu,t−1= δu + ϕt + α(
BeforeForeignu
BeforeTotalu∗ PostY ear) + εut (7)
where BeforeTotalu represents the initial total number of enrollment at school u between
1998 and 2000, and EnrollTotalu,t−1 represents the total number of enrollment at school u in the
previous year t−1. In Equation 6, if the dependent variable is the domestic enrollment, I divide the
number of domestic student at school u in year t by EnrollTotalu,t−1.43 In this section, to simply
the analysis, I implement a standard difference-in-differences model as the first-stage. Specifically,
if a university’s initial fraction of foreign students (BeforeForeignu
BeforeTotalu) is larger than the median level,
it is considered as a university that is more affected by the supply shock. Correspondingly, if a
university’s initial fraction of foreign students is smaller than the median level, it is considered
as a university that is less affected by the supply shock. Therefore, in Equqation 7, BeforeForeignu
BeforeTotalu
is a dummy variable which equals one if the school is more affected, and PostY ear is a dummy
variable which equals one if the year is in and after 2006.
The regression results of doing this exercise are reported in Table 15. The first-stage coeffi-
cients(columns 1 & 3) are positive and statistically significant at the 1 percent level, suggesting
that universities with a higher initial fraction of foreign students experience a large increase in the
43Because the instruments are standardized by the initial total enrollment, all other enrollment variables shouldbe transformed in the same manner.
30

fraction of foreign enrollment after 2006. The second-stage point estimate on domestic enrollment
at higher-ranked universities is -1.03 (with a standard error of 0.036), which indicates that a one
percentage point increase in the fraction of foreign enrollment would lead to a one percentage
point decrease in the fraction of domestic enrollment. Because both of foreign enrollment and
domestic enrollment are simple standardization of enrollment levels, the point estimate also sug-
gests that at higher-ranked universities, each additional foreign undergraduate student crowds out
one domestic undergraduate student. The second-stage coefficients on non-discounted tuition and
institutional grant aid are 792.07 (with a standard error of 329.16) and 1639.15 (with a standard
error of 493.54), respectively, which mean that one percentage point increase in the fraction of
foreign enrollment would lead to an approximately 800-dollar increase in non-discounted tuition,
and an approximately 1600-dollar increase in institutional grant aid.
8 Conclusion and Discussion
This paper examines the impacts of the influx of foreign undergraduate students on the U.S. higher
education system. My analysis exploited a quasi-experiment provided by the sudden supply shock
of Chinese undergraduate students around 2006. I use data collected from the Integrated Postsec-
ondary Education Data System (IPEDS), which provides detailed information at the institution
year level. The data reveal that universities with a higher number of foreign undergraduate stu-
dents prior to the shock experienced a larger influx of new foreign undergraduate undergraduate
students after the shock.
I use the instrumental variables strategy to empirically identify the causal relationship between
the enrollment of domestic students and the enrollment of foreign students. The regression results
in this paper suggest that although there is an imprecise crowd-out effect of foreign undergraduate
students on domestic undergraduate students at all schools, this crowd-out effect is particularly
strong at higher ranked universities, approximately one-for-one. Exploration of the mechanism
suggests that constraints in the demand for students at large selective universities is an important
channel in explaining the crowd-out effect. I also find that the greater supply of foreign students
31

leads U.S. institutions to increase their admission standards, measured by SAT math scores. Ad-
ditionally, I examine the impacts of the influx of foreign students on other institutional financial
outcomes of interest. The empirical results indicate that the influx of foreign undergraduate stu-
dents increases non-discounted tuition, but has little impact on school fees. Admitting more foreign
undergraduate students allows a university to increase the average amount of institutional grant
aid for accepted students.
Education is a cornerstone for a nation’s development, and higher education plays a significant
role in maintaining a country’s long-run economic advantages. Since the U.S. is the largest host of
foreign students in the world, examining the effects of the influx of foreign undergraduate students
on American students and colleges has several implications.
The findings in this paper suggest that, from a domestic student’s point of view, the influx
of foreign students increases competition for coveted seats at top universities, which could neg-
atively affect their long-term labor market outcomes such as career prospects and salary. From
an institution’s perspective, admitting more foreign students might have positive effects. First,
more foreign students increase competition among applicants, allowing institutions to select more
talented students. Second, as foreign students usually pay for a larger fraction of their education,
an institution’s financial condition would be better off following the influx of foreign students. It
could potentially improve school quality by providing more institutional grant aid for accepted
students. However, from a policy maker’s perspective, the implication is more complicated, de-
pending crucially on what happens to foreign students after they complete their undergraduate
education. If these foreign students stay in the U.S. and make sizable contributions to the U.S.
economy after their graduation, it is not a bad idea to reallocate resources to take advantage of the
benefits created by those students. In contrast, if these foreign students leave the U.S. upon grad-
uation, the benefits they bring will be short-lived. Additionally, the crowd-out effect could leave
the U.S. labor market with a chronic shortage of highly-skilled workers, dwarfing any short-term
gains from the foreign student influx.44
44The exodus of foreign students could be due to several reasons. On the one hand, the H1-B cap would forcesome highly-skilled immigrant workers to leave the U.S. because they cannot get legal working visa. Alternatively,the economic growth of foreign students’ home countries would attract these highly educated students go back to
32

In sum, the rapid growth of foreign undergraduate students in the past decade has significant
impacts on the U.S. higher education sector in many aspects. This paper focuses on the impacts at
the institutional level, but due to data limitation, little is known about more general equilibrium
effects, such as peer effects or student sorting, so future study could try to uncover the effects of
foreign students on other aspects of U.S. society and economy.
work in their home countries. (Grogger and Hanson (2015))
33

References
Andrew Barr and Sarah E Turner. Expanding enrollments and contracting state budgets the effectof the great recession on higher education. The Annals of the American Academy of Politicaland Social Science, 650(1):168–193, 2013.
Marianne Bertrand, Esther Duflo, and Sendhil Mullainathan. How much should we trustdifferences-in-differences estimates? Quarterly Journal of Economics, 119(1), 2004.
Kelli Bird and Sarah Turner. College in the states: Foreign student demand and higher educationsupply in the us. paper, Curry School of Education, University of Virginia, 3, 2014.
George J Borjas. The labor demand curve is downward sloping: Reexamining the impact ofimmigration on the labor market. The Quarterly Journal of Economics, pages 1335–1374, 2003.
George J Borjas. Do foreign students crowd out native students from graduate programs? NBERWorking Paper Series, page 10349, 2004.
George J Borjas. Immigration in high-skill labor markets: The impact of foreign students on theearnings of doctorates. In Science and Engineering Careers in the United States: An Analysisof Markets and Employment, pages 131–161. University of Chicago Press, 2009.
George J Borjas and Kirk B Doran. The collapse of the soviet union and the productivity ofamerican mathematicians. The Quarterly Journal of Economics, 1143:1203, 2012.
George J Borjas, Kirk B Doran, and Ying Shen. Ethnic complementarities after the opening ofchina: How chinese graduate students affected the productivity of their advisors. NBER WorkingPaper Series, page 21096, 2015.
John Bound and Sarah Turner. Cohort crowding: How resources affect collegiate attainment.Journal of public Economics, 91(5):877–899, 2007.
John Bound, Sarah Turner, and Patrick Walsh. Internationalization of us doctorate education.Technical report, National Bureau of Economic Research, 2009.
John Bound, Breno Braga, Gaurav Khanna, and Sarah Turner. A passage to america: Universityfunding and international students. 2016.
David Card. The causal effect of education on earnings. Handbook of labor economics, 3:1801–1863,1999.
David Card. Immigrant inflows, native outflows, and the local labor market impacts of higherimmigration. Journal of Labor Economics, 19(1):22–64, 2001.
David Card and John DiNardo. Do immigrant inflows lead to native outflows? American EconomicReview, 90(2):360–367, 2000.
Pedro Carneiro, James J Heckman, and Edward J Vytlacil. Estimating marginal returns to edu-cation. American Economic Review, 101:2754–2781, 2011.
34

Kirk Doran, Alexander Gelber, and Adam Isen. The effects of high-skilled immigration on firms:Evidence from h-1b visa lotteries. NBER Working Paper Series, page 20668, 2014.
Susan M Dynarski. Does aid matter? measuring the effect of student aid on college attendanceand completion. NBER Working Paper, (w7422), 1999.
Erica Field. Educational debt burden and career choice: Evidence from a financial aid experimentat nyu law school. NBER Working Paper, (w12282), 2006.
National Center for Education Statistics. Ipeds : Integrated postsecondary education data system.
Richard Freeman, Eric Weinstein, Elizabeth Marincola, Janet Rosenbaum, and Frank Solomon.Competition and careers in biosciences. Science, 294(5550):2293–2294, 2001.
Jeffrey Grogger and Gordon H Hanson. Attracting talent: Location choices of foreign-born phdsin the united states. Journal of Labor Economics, 33(S1):S5–S38, 2015.
Caroline M Hoxby. Do immigrants crowd disadvantaged american natives out of higher education?Help or Hindrance?: The Economic Implications of Immigration for African Americans: TheEconomic Implications of Immigration for African Americans, page 282, 1998.
Caroline M Hoxby. School choice and school productivity (or could school choice be a tide thatlifts all boats?). NBER Working Paper, (w8873), 2002.
Jennifer Hunt. The impact of immigration on the educational attainment of natives. Technicalreport, National Bureau of Economic Research, 2012.
Osborne Jackson. Does immigration crowd natives into or out of higher education? Available atSSRN 2329298, 2014.
William R Kerr, William F Lincoln, et al. The supply side of innovation: H-1b visa reforms andus ethnic invention. Journal of Labor Economics, 28(3):473–508, 2010.
Soobin Kim. College enrollment over the business cycle: The role of supply constraints. Availableat SSRN 2535811, 2014.
Michael F Lovenheim. The effect of liquid housing wealth on college enrollment. Journal of LaborEconomics, 29(4):741–771, 2011.
Stephen Machin and Richard Murphy. Paying out and crowding out? the globalisation of highereducation. 2014.
Petra Moser, Alessandra Voena, and Fabian Waldinger. German-jewish emigres and us invention.NBER Working Paper Series, page 19962, 2014.
Institute of International Education. International students at all institutions, 2001/02-2014/15.Open Doors Report on International Educational Exchange, 2001-2015.
Giovanni Peri, Kevin Shih, and Chad Sparber. Stem workers, h-1b visas, and productivity in uscities. Journal of Labor Economics, 33(3 pt 2), 2015.
35

Jesse Rothstein and Cecilia Elena Rouse. Constrained after college: Student loans and early-careeroccupational choices. Journal of Public Economics, 1(95):149–163, 2011.
Kevin Y Shih. The impact of international students on us graduate education. Working paper,2015.
Douglas Staiger and James H Stock. Instrumental variables regression with weak instruments.Econometrica: Journal of the Econometric Society, pages 557–586, 1997.
James H Stock and Motohiro Yogo. Testing for weak instruments in linear iv regression. 2001.
Wilbert van der Klaauw et al. Estimating the effect of financial aid offers on college enrollment:A regression-discontinuity approach. International Economic Review, 43(4):1249–1287, 2002.
You-Qin Wang. Student attacks against teachers: The revolution of 1966. Issues & Studies, 37(2):29–79, 2001.
Gordon C Winston et al. Subsidies, hierarchy and peers: The awkward economics of highereducation. Journal of Economic Perspectives, 13(1):13–36, 1999.
Abigail Wozniak, Thomas J Murray, et al. Timing is everything: Short-run population impacts ofimmigration in us cities. Journal of Urban Economics, 72(1):60–78, 2012.
36

Figure 1: Exchange Rate of U.S. Dollar against Renmimbi, 2000-2013
Notes: source: http://www.oanda.com/lang/cns/currency/historical-rates/
Figure 2: Number of Chinese Undergraduate Students in American Institutions, 2000-2013
Notes: Data is collected from Open Doors Data, Institute of International Education
37

Figure 3: Number of Chinese and All Foreign Undergraduate Students
Notes: Data is collected from Open Doors Data, Institute of International Education
Figure 4: Number and Fraction of Foreign Undergraduate Students at American Research Institutions
Notes: Data is collected from the Integrated Postsecondary Education Data System (IPEDS). Based onCarnegie Classification 2000, Research universities refer to Doctoral/Research universities (Extensive)and Doctoral/Research universities (Intensive). The fraction of foreign students is calculated by dividingthe total number of nonresident aliens by the total number of students.
38

Figure 5: Average Number of Foreign Undergraduate Students at American Research Institutions
Notes: I split the sample into two groups. Institutions with many foreign students are schools thathad more than the median number of full-time first-time foreign students between 1998 and 2000, andinstitutions with few foreign students are in the residual group.
Figure 6: First Stage Coefficients on Number of Foreign Undergraduate Students
(a) All sample (b) Public universities
(c) Private universities (d) Higher ranked universities
Notes:The solid lines in each figure plot the baseline first-stage coefficients (αk) by running Equation2 using the number of full-time first-time foreign undergraduate students as the dependent variable forall universities, public universities, private universities and higher ranked universities, respectively. Thedashed and dotted lines represent the 95% confidence intervals of the point estimates.
39
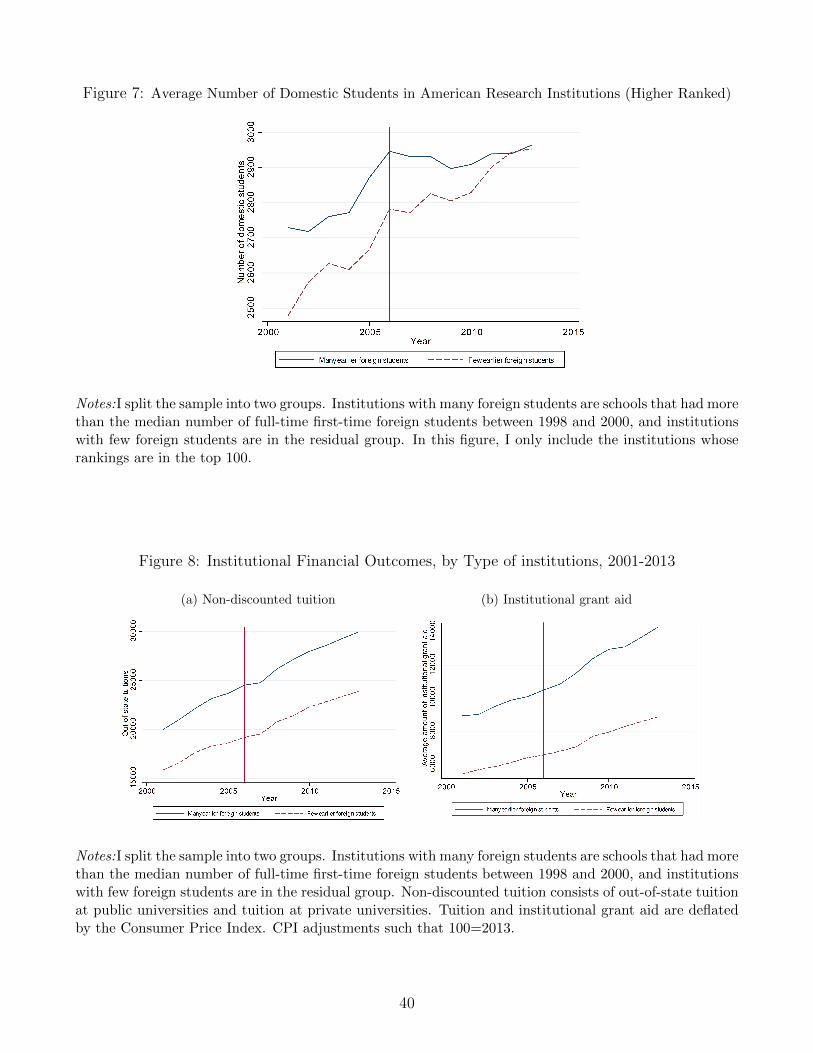
Figure 7: Average Number of Domestic Students in American Research Institutions (Higher Ranked)
Notes:I split the sample into two groups. Institutions with many foreign students are schools that had morethan the median number of full-time first-time foreign students between 1998 and 2000, and institutionswith few foreign students are in the residual group. In this figure, I only include the institutions whoserankings are in the top 100.
Figure 8: Institutional Financial Outcomes, by Type of institutions, 2001-2013
(a) Non-discounted tuition (b) Institutional grant aid
Notes:I split the sample into two groups. Institutions with many foreign students are schools that had morethan the median number of full-time first-time foreign students between 1998 and 2000, and institutionswith few foreign students are in the residual group. Non-discounted tuition consists of out-of-state tuitionat public universities and tuition at private universities. Tuition and institutional grant aid are deflatedby the Consumer Price Index. CPI adjustments such that 100=2013.
40

Figure 9: Robustness Check: Number of Graduate Students, 2001-2013
(a) Baseline first stage coefficients (b) Coefficients on number of graduate students
Notes:Figure (a) plots the coefficients (αk) in Equation 2 using the number of full-time first-time foreignundergraduate students as the dependent variable. In other words, I combine all solid lines in Figure 8in one graph. Figure (b) plots the coefficients (αk) in Equation 2 using the number of full-time first-timeforeign graduate students as the dependent variable.
Figure 10: Robustness Check: Number of Applications, 2001-2013
(a) Coefficients on Number of Applications (b) Approximated Foreign Applications
Notes:Figure (a) plots the coefficients (αk) in Equation 2 using the number of applications as the depen-dent variable. Figure (b) plots the baseline first-stage coefficients (Table 1) divided by the approximatedforeign students’ enrollment rate. The foreign students’ enrollment rate is assumed to be 1/4 of the overallenrollment rate. The overall enrollment rate in a particular year equals the number of full-time first-timeundergraduate students enrolled divided by the total number of applications.
41

Table 1: First Stage Results, 2001-2013
Dependent variable: the number All Schools Public Private Higher Ranked Lower Ranked
of foreign undergraduates (1) (2) (3) (4) (5)BeforeForeign ∗ 2001 (t-4) -.031 -.022 -.042* -.053** .053
(.023) (.039) (.025) (.026) (.035)BeforeForeign ∗ 2002 (t-3) -.068*** -.066** -.071** -.083*** -.013
(.021) (.027) (.034) (.025) (.037)BeforeForeign ∗ 2003 (t-2) -.044* -.044 -.044** -.061*** .008
(.023) (.039) (.018) (.024) (.050)BeforeForeign ∗ 2004 (t-1) -.042* -.053 -.028* -.046 -.040
(.025) (.043) (.017) (.036) (.027)BeforeForeign ∗ 2005 (t) – – – – –
BeforeForeign ∗ 2006(t+1) .029*** .034*** .023 .027** .007(.010) (.014) (.015) (.012) (.028)
BeforeForeign ∗ 2007 (t+2) .060*** .048* .078*** .062*** .000(.020) (.029) (.024) (.024) (.036)
BeforeForeign ∗ 2008 (t+3) .124*** .144** .109*** .115*** .032(.034) (.062) (.034) (.038) (.055)
BeforeForeign ∗ 2009 (t+4) .216*** .249*** .188*** .212*** .049(.054) (.092) (.057) (.060) (.090)
BeforeForeign ∗ 2010 (t+5) .281*** .387*** .170** .292*** .027(.071) (.116) (.082) (.085) (.089)
BeforeForeign ∗ 2011 (t+6) .441*** .592*** .286*** .475*** .041(.130) (.216) (.097) (.169) (.115)
BeforeForeign ∗ 2012 (t+7) .484*** .635*** .342*** .431*** .230(.107) (.189) (.112) (.127) (.183)
BeforeForeign ∗ 2013 (t+8) .520*** .628*** .433*** .429*** .302(.116) (.199) (.140) (.137) (.224)
Cragg-Donald F statistics 49.75 35.07 32.62 14.42 10.25
Year fixed effects Y Y Y Y YInstitution fixed effects Y Y Y Y YNumber of universities 246 162 84 100 146Number of observations 3,198 2,106 1,092 1,300 1,898Note: Standard errors are reported in parentheses and are clustered at the institutional level.BeforeForeign represents the historical number of full-time first-time foreign students at a particularuniversity between 1998 and 2000. *** P<0.01 ** P<0.05 * P<0.1
42

Table 2: Effects on Domestic Student Enrollment
Dependent variable: the number All Schools Public Private Higher Ranked
of domestic undergraduates (1) (2) (3) (4)Number of foreign students -.538 -.068 -.690 -1.290**
(.475) (.715) (.598) (.543)
Year fixed effects Y Y Y YInstitution fixed effects Y Y Y YNumber of universities 246 162 84 100Number of observations 3,198 2,106 1,092 1,300Note: Standard errors are reported in parentheses and are clustered at the institutionallevel. In column (4), based on 2015 U.S. News ranking, top-100 universities are classifiedas higher ranked universities. *** P<0.01 ** P<0.05 * P<0.1
43

Table 3: Heterogeneous Effects on Domestic Student Enrollment by Demand Constraints Levels
All Schools Higher ranked
Dependent variable: the number Stable Fluctuating Stable Fluctuating
of domestic undergraduates enrollment enrollment enrollment enrollment
(1) (2) (3) (4)Number of foreign students -1.348*** .803 -1.381*** .054
(.443) (.537) (.436) (.410)
Cragg-Donald Wald F statistics 29.73 46.14 12.28 25.85
Year fixed effects Y Y Y YInstitution fixed effects Y Y Y YNumber of universities 82 82 41 25Number of observations 1,066 1,066 533 325Note: Standard errors are reported in parentheses and are clustered at the institutionallevel.“Stable enrollment” means the school’s ten-year percentage change (between 1991 and2000) in the total enrollment is smaller than the change at the lower tertile level, and “fluctuat-ing enrollment” means the school’s ten-year percentage change (between 1991 and 2000) in thetotal enrollment is greater than the change at the upper tertile level. In columns (3) and (4), Ifocus on top-100 universities only. *** P<0.01 ** P<0.05 * P<0.1
Table 4: Effects on SAT Scores
Dependent variable: SAT scores SAT 25th SAT 75th SAT 25th SAT 75th
verbal verbal math math
(1) (2) (3) (4)Number of foreign students .036 .033* .048** .070***
(.023) (.020) (.021) ( .019)
Cragg-Donald Wald F statistics 48.51 48.51 49.20 49.20
Year fixed effects Y Y Y YInstitution fixed effects Y Y Y YNumber of universities 234 234 234 234Number of observations 2,762 2,762 2,780 2,780Note: Standard errors are reported in parentheses and are clustered at the insti-tutional level. From columns 1-4, I use the SAT 25th verbal percentile score, SAT75th verbal percentile score, SAT 25th math percentile score and SAT 75th mathpercentile score as dependent variables, respectively *** P<0.01 ** P<0.05 * P<0.1
44

Tab
le5:
Eff
ects
onIn
stit
uti
onal
Fin
anci
alO
utc
omes
Dis
cou
nte
dtu
itio
nN
on
-dis
cou
nte
dD
isco
un
ted
fees
Non
-dis
cou
nte
dIn
stit
uti
on
al
Ave
rage
sala
ries
for
at
pu
blic
schoo
lstu
itio
nat
pu
blic
schoo
lsfe
esgr
an
taid
inst
ruct
ion
al
staff
(1)
(2)
(3)
(4)
(5)
(6)
Nu
mbe
rof
fore
ign
stu
den
ts3.
927*
9.56
4***
.233
1.20
612
.346
**10
.274
*(
2.22
2)(3
.667
)(.
953)
(1.
255)
(5.6
44)
(5.6
51)
Cra
gg-D
on
ald
Wa
ldF
stati
stic
s35
.07
49.7
535
.07
49.7
549
.67
49.7
5
Yea
rfi
xed
effec
tsY
YY
YY
YIn
stit
uti
on
fixe
deff
ects
YY
YY
YY
Nu
mbe
rof
un
iver
siti
es16
224
616
224
624
624
6N
um
ber
of
obs
erva
tion
s2,
106
3,19
82,
106
3,19
83,
195
3,19
8N
ote
:S
tan
dard
erro
rsar
ere
port
edin
pare
nth
eses
and
are
clu
ster
edat
the
inst
itu
tion
alle
vel.
Dis
counte
dtu
itio
nan
dfe
esare
in-s
tate
tuit
ion
and
fees
atp
ub
lic
un
iver
siti
es.
Non
-dis
cou
nte
dtu
itio
nan
dfe
esar
eou
t-of
-sta
tetu
itio
nan
dfe
esat
pu
bli
cu
niv
ersi
ties
and
tuit
ion
and
fees
atp
riva
teu
niv
ersi
ties
.T
uit
ion
,fe
es,
inst
itu
tion
algr
ant
aid
and
aver
age
sala
ries
are
dol
lars
and
are
defl
ate
dby
the
Con
sum
erP
rice
Ind
ex(C
PI)
.C
PI
adju
stm
ents
such
that
100
=2013
.**
*P<
0.01
**P<
0.05
*P<
0.1
45

Table 6: Robustness Checks: Excluding Great Recession Observations
Number of
domestic students Non-discounted Institutional
(higher ranked) tuition grant aid
(1) (2) (3)Number of foreign students -1.317*** 9.443*** 11.999**
(.536) (3.599) (5.443)
Cragg-Donald F statistics 15.19 54.07 53.96
Year fixed effects Y Y YInstitution fixed effects Y Y YNumber of universities 100 246 246Number of observations 900 2,214 2,211Notes: Standard errors are reported in parentheses and are clustered at the institutionallevel. I exclude observations in 2007-2010. Tuition and institutional grant aid are dol-lars and are deflated by the Consumer Price Index (CPI). CPI adjustments such that100=2013. *** P<0.01 ** P<0.05 * P<0.1
Table 7: Robustness Checks: Excluding Ten Large Universities
Number of
domestic students Non-discounted Institutional
(higher ranked) tuition grant aid
(1) (2) (3)Number of foreign students -.515 13.533*** 12.743***
(.667) (4.500) (5.097)
Cragg-Donald F statistics 9.36 43.19 43.12
Year fixed effects Y Y YInstitution fixed effects Y Y YNumber of universities 91 236 236Number of observations 1,183 3,068 3,065Notes: Standard errors are reported in parentheses and are clustered at the institutionallevel. I exclude 10 universities that have the largest number of full-time first-time foreignstudents between 1998 and 2000. Tuition and institutional grant aid are dollars and aredeflated by the Consumer Price Index (CPI). CPI adjustments such that 100=2013. ***P<0.01 ** P<0.05 * P<0.1
46
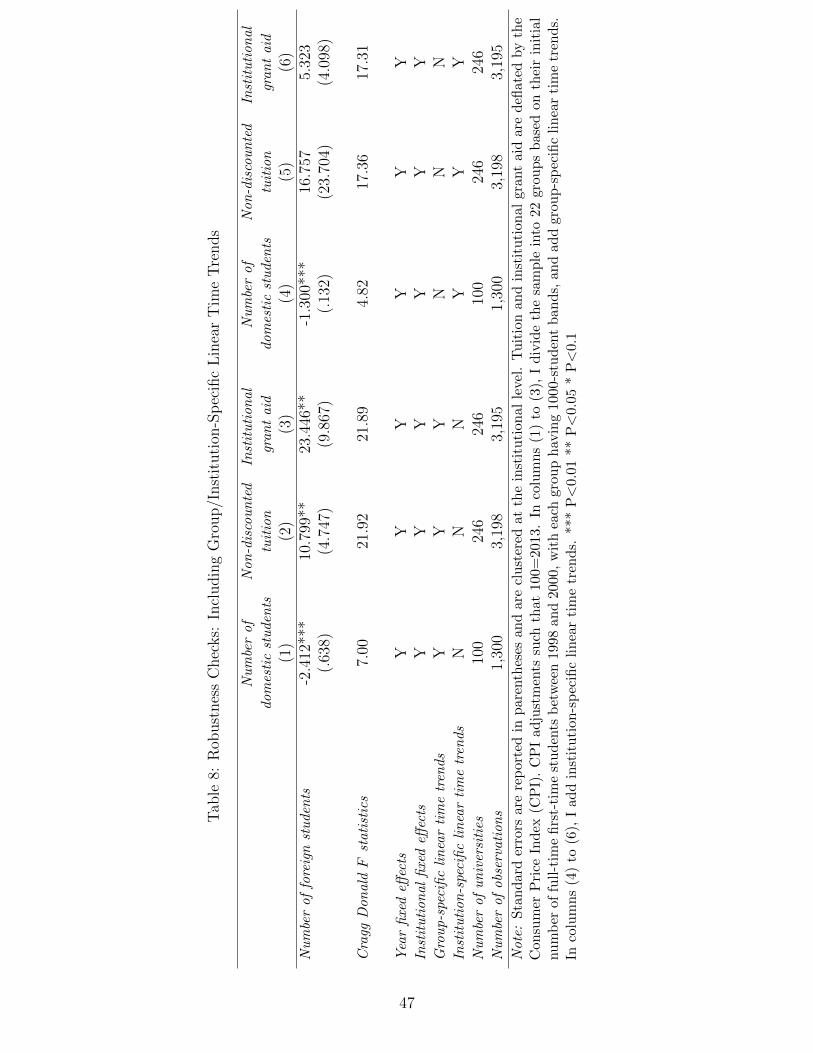
Tab
le8:
Rob
ust
nes
sC
hec
ks:
Incl
udin
gG
roup/I
nst
ituti
on-S
pec
ific
Lin
ear
Tim
eT
rends
Nu
mbe
rof
Non
-dis
cou
nte
dIn
stit
uti
on
al
Nu
mbe
rof
Non
-dis
cou
nte
dIn
stit
uti
on
al
dom
esti
cst
uden
tstu
itio
ngr
an
taid
dom
esti
cst
uden
tstu
itio
ngr
an
taid
(1)
(2)
(3)
(4)
(5)
(6)
Nu
mbe
rof
fore
ign
stu
den
ts-2
.412
***
10.7
99**
23.4
46**
-1.3
00**
*16
.757
5.32
3(.
638)
(4.7
47)
(9.8
67)
(.13
2)(2
3.70
4)(4
.098
)
Cra
ggD
on
aldF
stati
stic
s7.
0021
.92
21.8
94.
8217
.36
17.3
1
Yea
rfi
xed
effec
tsY
YY
YY
YIn
stit
uti
on
al
fixe
deff
ects
YY
YY
YY
Gro
up-s
peci
fic
lin
ear
tim
etr
ends
YY
YN
NN
Inst
itu
tion
-spe
cifi
cli
nea
rti
me
tren
ds
NN
NY
YY
Nu
mbe
rof
un
iver
siti
es10
024
624
610
024
624
6N
um
ber
of
obs
erva
tion
s1,
300
3,19
83,
195
1,30
03,
198
3,19
5N
ote
:S
tan
dard
erro
rsar
ere
port
edin
par
enth
eses
and
are
clu
ster
edat
the
inst
itu
tion
alle
vel.
Tu
itio
nan
din
stit
uti
onal
grant
aid
are
defl
ate
dby
the
Con
sum
erP
rice
Ind
ex(C
PI)
.C
PI
adju
stm
ents
such
that
100=
2013
.In
colu
mn
s(1
)to
(3),
Id
ivid
eth
esa
mp
lein
to22
grou
ps
base
don
thei
rin
itia
lnu
mb
erof
full
-tim
efi
rst-
tim
est
ud
ents
bet
wee
n19
98an
d20
00,
wit
hea
chgr
oup
hav
ing
1000
-stu
den
tb
and
s,an
dad
dgro
up
-sp
ecifi
cli
nea
rti
me
tren
ds.
Inco
lum
ns
(4)
to(6
),I
ad
din
stit
uti
on
-sp
ecifi
cli
nea
rti
me
tren
ds.
***
P<
0.01
**P<
0.05
*P<
0.1
47

Tab
le9:
Het
erog
eneo
us
Eff
ects
onIn
stit
uti
onal
Outc
omes
by
Siz
eof
Sch
ool
s
Sm
all
-siz
edS
chool
sL
arge
-siz
edS
chools
Nu
mbe
rof
Non
-dis
cou
nte
dIn
stit
uti
on
al
Nu
mbe
rof
Non
-dis
cou
nte
dIn
stit
uti
on
al
dom
esti
cst
uden
tstu
itio
ngr
an
taid
dom
esti
cst
uden
tstu
itio
ngr
an
taid
(1)
(2)
(3)
(4)
(5)
(6)
Nu
mbe
rof
fore
ign
stu
den
ts-.
502
31.8
47**
46.1
17*
-1.0
61**
8.37
5**
6.93
3**
(.59
4)(1
5.09
0)(2
5.52
3)(.
555)
(4.0
86)
(3.2
86)
Cra
ggD
on
aldF
stati
stic
s11
.71
11.7
111
.66
20.9
820
.98
20.9
8
Yea
rfi
xed
effec
tsY
YY
YY
YIn
stit
uti
on
al
fixe
deff
ects
YY
YY
YY
Nu
mbe
rof
un
iver
siti
es82
8282
8282
82N
um
ber
of
obs
erva
tion
s1,
066
1,06
61,
066
1,06
61,
066
1,06
6N
ote
:S
tan
dar
der
rors
are
rep
orte
din
par
enth
eses
and
are
clu
ster
edat
the
inst
itu
tion
alle
vel
.T
uit
ion
and
inst
itu
tion
algr
ant
aid
are
defl
ate
dby
the
Con
sum
erP
rice
Ind
ex(C
PI)
.C
PI
adju
stm
ents
such
that
100=
2013
.S
mal
l-si
zed
sch
ool
sar
eth
ose
wh
ose
tota
lnu
mb
erof
full
-tim
efi
rst-
tim
eu
nd
ergra
du
ate
stu
den
tsb
etw
een
1998
an
d20
00ar
eat
the
bot
tom
tert
ile,
wh
ile
larg
e-si
zed
sch
ools
are
those
wh
ose
tota
lnu
mb
erof
full
-tim
efi
rst-
tim
eu
nd
ergr
adu
ate
stud
ents
bet
wee
n19
98an
d20
00ar
eat
the
up
per
tert
ile.
***
P<
0.01
**P<
0.05
*P<
0.1
48

Tab
le10
:R
obust
nes
sC
hec
ks:
Pla
ceb
oT
ests
,20
01-2
005
Nu
mbe
rof
Nu
mbe
rof
dom
esti
cst
ude
nts
Non
-dis
cou
nte
dIn
stit
uti
onal
SA
T25
thS
AT
75th
fore
ign
stu
den
ts(h
ighe
r-ra
nke
d)tu
itio
ngr
ant
aid
mat
hm
ath
(1)
(2)
(3)
(4)
(5)
(6)
Bef
ore
Fore
ign
*2001
.013
.014
-1.7
36**
-.74
2-.
016
.006
(.01
4)(.
244)
(.79
9)(.
894)
(.01
0)(.
009)
Bef
ore
Fore
ign
*2002
-.02
4.0
26-.
482
-.85
1-.
001
.004
(.01
9)(.
276)
(.41
4)(.
911)
(.01
1)(.
007)
Bef
ore
Fore
ign
*2004
.002
.241
.923
-.15
2-.
004
.009
(.02
0)(.
153)
(.55
3)(.
622)
(.01
1)(.
008)
Bef
ore
Fore
ign
*2005
.044
*.3
551.
841*
*-.
216
-.00
6.0
03(.
025)
(.17
8)(.
858)
(.61
3)(.
011)
(.00
7)
Yea
rfi
xed
effec
tsY
YY
YY
YIn
stit
uti
onfi
xed
effec
tsY
YY
YY
YN
um
ber
ofu
niv
ersi
ties
246
100
246
246
221
221
Nu
mbe
rof
obse
rvat
ion
s1,
230
500
1,23
01,
227
996
996
Note
s:S
tan
dar
der
rors
are
rep
orte
din
par
enth
eses
and
are
clu
ster
edat
the
inst
itu
tion
alle
vel.
Ion
lyin
clu
de
pri
orsh
ock
per
iod
ob
serv
atio
ns.
Iru
nE
qu
ati
on
2m
ovin
gth
esh
ock
year
from
2006
to20
03.
***
P<
0.01
**P<
0.05
*P<
0.1
49

Tab
le11
:O
ther
Sp
ecifi
cati
ons:
AT
rip
le-D
iffer
ence
Des
ign
Nu
mbe
rof
Nu
mbe
rof
Nu
mbe
rof
Nu
mbe
rof
fore
ign
stu
den
tsdom
esti
cst
uden
ts
fore
ign
stu
den
tsdom
esti
cst
uden
ts(h
igher
ran
ked)
(hig
her
ran
ked)
(1)
(2)
(3)
(4)
BeforeForeign∗Post2
002∗Major(
t-2)
-.00
2-.
001
(.00
9)(.
011)
BeforeForeign∗Post2
004∗Major(
t-1)
-.00
1-.
000
(.01
0)(.
013)
BeforeForeign∗Post2
006∗Major(
t)–
–
BeforeForeign∗Post2
008∗Major(
t+1)
.016
**.0
15(.
008)
(.01
0)
BeforeForeign∗Post2
010∗Major(
t+2)
.043
***
.047
***
(.00
9)(.
011)
BeforeForeign∗Post2
012
∗Major(
t+3)
.066
***
.062
***
(.01
2)(.
015)
Cra
gg-D
on
aldF
stati
stic
32.3
07.
79
Nu
mbe
rof
fore
ign
stu
den
ts-.
441
-.78
6*(.
381)
(.46
6)
Nu
mbe
rof
un
iver
siti
es23
723
710
010
0N
um
ber
of
obs
erva
tion
s6,
892
6,89
22,
330
2,33
0N
ote
s:S
tan
dard
erro
rsare
rep
orte
din
par
enth
eses
and
are
clu
ster
edat
the
inst
itu
tion
al-y
ear
leve
l.Major
equ
als
on
eif
stu
den
tsar
een
rolled
inb
usi
nes
s,en
gin
eeri
ng,
math
emat
ics
orp
hysi
cal
scie
nce
.Shock
equ
als
one
ifth
eye
ar
iseq
ual
toor
aft
er20
06.
***
P<
0.0
1**
P<
0.0
5*
P<
0.1
50

Table 12: Other Specifications: Using PostY ear as a Single Indicator Variable
Number of
domestic students Non-discounted Institutional
(higher ranked) tuition grant aid
(1) (2) (3)Number of foreign students -1.348** 13.259*** 14.785**
(.626) (4.803) (6.648)
F statistics 13.46 18.83 18.83
Year fixed effects Y Y YInstitution fixed effects Y Y YNumber of universities 100 246 246Number of observations 1,300 3,198 3,195Notes: Standard errors are reported in parentheses and are clustered at the institutionallevel. Tuition and institutional grant aid are dollars and are deflated by the ConsumerPrice Index (CPI). CPI adjustments such that 100=2013. *** P<0.01 ** P<0.05 * P<0.1
Table 13: Other Specifications: Ignoring Time Series Information
Number of
domestic students Non-discounted Institutional
(higher ranked) tuition grant aid
(1) (2) (3)Number of foreign students -1.348** 13.259*** 14.822**
(.626) (4.803) (6.651)
F statistics 7.29 10.17 10.17
Year fixed effects Y Y YInstitution fixed effects Y Y YNumber of universities 100 246 246Number of observations 200 492 492Notes: Standard errors are reported in parentheses and are clustered at the institutionallevel. Tuition and institutional grant aid are dollars and are deflated by the ConsumerPrice Index (CPI). CPI adjustments such that 100=2013. *** P<0.01 ** P<0.05 * P<0.1
51

Table 14: Other Specifications: An Alternative IV Strategy (I)
Number of
domestic students Non-discounted Institutional
(higher ranked) tuition grant aid
(1) (2) (3)Number of foreign students -1.456*** 9.703*** 13.035**
(.592) (3.730) (5.789)
F statistics 10.56 17.97 17.97
Year fixed effects Y Y YInstitution fixed effects Y Y YNumber of universities 100 246 246Number of observations 1,300 3,198 3,195Notes: Standard errors are reported in parentheses and are clustered at the institutionallevel. Tuition and institutional grant aid are dollars and are deflated by the ConsumerPrice Index (CPI). CPI adjustments such that 100=2013. *** P<0.01 ** P<0.05 * P<0.1
Table 15: Other Specifications: An Alternative IV Strategy (II)
Fraction of
domestic students Non-discounted Institutional
(higher ranked) tuition grant aid
(1) (2) (3)Fraction of foreign students -1.028*** 792.07** 1639.15***
(.366) (329.16) (493.53)
First-stage coefficient 0.013*** 0.009*** 0.009***(.005) (.003) (.003)
Year fixed effects Y Y YInstitution fixed effects Y Y YNumber of universities 100 246 246Number of observations 1,300 3,198 3,195Notes: Standard errors are reported in parentheses and are clustered at the institutionallevel. Tuition and institutional grant aid are dollars and are deflated by the ConsumerPrice Index (CPI). CPI adjustments such that 100=2013. *** P<0.01 ** P<0.05 * P<0.1
52

9 Appendix Figures and Tables
Figure A.1: Number of Full-time First-time Foreign Undergraduate Students, by Type of Schools
Notes: Data is collected from the Integrated Postsecondary Education Data System (IPEDS).
Figure A.2: Number of Full-time First-time Foreign Undergraduate Students Before and After the Shock
Notes: Data is collected from the Integrated Postsecondary Education Data System (IPEDS). Based onCarnegie Classification 2000, research universities refer to Doctoral/Research universities (Extensive) andDoctoral/Research universities (Intensive).
53

Figure A.3: The Distribution of the Number of Foreign Undergraduate Students Between 1998 and 2000
Notes: Data is collected from the Integrated Postsecondary Education Data System (IPEDS). Based onCarnegie Classification 2000, research universities refer to Doctoral/Research universities (Extensive) andDoctoral/Research universities (Intensive).
Figure A.4: Number of Foreign Undergraduate Students by Major, 2002-2012
Notes: Data is collected from the Integrated Postsecondary Education Data System (IPEDS). I only focuson American research universities.
54

Table A.1: Main Variable Descriptions
Variable Name Variable Description Dataset Sourceefalevel Level of students (=24 Full-time students, IPEDS
Undergraduate, Degree/certificate-seeking, First-time)
eftotlt Grand total men and women enrolled for credit during the fall IPEDS
efnralt Nonresident aliens enrolled for credit during the fall IPEDS
tuition2 In-state average tuition for full-time undergraduates students IPEDS
tuition3 Out-of-state average tuition for full-time undergraduate students IPEDS
fee2 In-state required fees for full-time undergraduate students IPEDS
fee3 Out-of-state required fees for full-time undergraduates students IPEDS
saltotl Average salary equated to 9 months of full-time IPEDSinstructional staff-all ranks
igrnt a Average amount of institutional grant aid received IPEDSby full-time first-time undergraduate students
f2d03 State appropriations at non-profit private institutions IPEDS
f1b11 State appropriations at public institutions IPEDS
55

Table A.2: Summary Statistics
Overall 2001-2005 2006-2013(1) (2) (3)
Grand total (full-time first-time) 2546.76 2381.18 2650.25(1681.77) (1583.01) (1733.03)
Nonresident alien total (full-time first-time) 79.65 48.69 99.01(121.18) (52.83) (145.42)
Discounted tuition/fees:In-state tuition in public schools 5908.05 4649.40 6694.70
(2998.84) (2564.96) (2982.93)
In-state fees in public schools 1676.98 1600.73 1724.64(1786.13) (1767.92) (1796.44)
Non-Discounted tuition/fees:Out-of state tuition in public schools 22708.12 19754.99 24553.82& tuition in private schools (9919.18) (8648.20) (10213.87)
Out-of state fees in public schools 1571.46 1459.07 1641.70& fees in private schools (2182.56) (2046.26) (2261.25)
Average amount of institutional grant aid 9210.50 7735.17 10130.34(8012.70) (6475.62) (8712.75)
Average salaries for full-time instructional staff 89982.37 89072.48 90551.05(18792.12) (17999.67) (19253.54)
Note: The sample only consists of research institutions. Based on Carnegie Classification 2000,research universities refer to Doctoral/Research universities (Extensive) and Doctoral/Researchuniversities (Intensive). Both discounted tuition and non-discounted tuition are sticker prices.Discounted tuition/fees are in-state tuition/fees charged by public schools for state residents,while non-discounted tuition/fees are out-of-state tuition/fees charged by public schools for out-of-state students and tuition/fees charged by private schools. Tuition, fees, institutional grantaid and average salaries are dollars and are deflated by the Consumer Price Index (CPI). CPIadjustments such that 100=2013. Tuition and fees are for full-time undergraduate students,average institutional grant aid are for full-time first-time undergraduate students, and averagesalaries for full-time instructional staff is equated to 9 months.
56

Table A.3: List of Schools by the Initial Number of Foreign Undergraduate Students
Top 30 Bottom 30
School Name # School Name #Purdue University-Main Campus 880 Texas A&M University-Commerce 0
Boston University 763 Clark Atlanta University 0
University of Michigan-Ann Arbor 681 Widener University-Main Campus 0
The University of Texas at El Paso 657 SUNY College of Enviromental Science and Foresty 0
University of Pennsylvania 636 Union Institute & University 0
Cornell University 606 Ball State University 1
New York University 519 Yeshiva University 3
Northeastern University 443 University of La Verne 6
University of Wisconsin-Madison 404 University of Northern Colorado 8
University of South California 401 Wilmington University 8
University of Virginia-Main Campus 394 New Mexico Institute of Mining and Technology 10
Carnegie Mellon University 390 University of Southern Mississippi 11
Rutgers University-New Brunswick 380 South Carolina State University 12
Indiana University-Bloomington 379 Texas Woman’s University 17
The University of Texas at Austin 378 Catholic University of America 17
Ohio State University-Main Campus 376 University of St. Thomas 18
Arizona State University-Tempe 374 University of Dayton 18
The New School 369 Colorado State University-Fort Collins 20
University of Arizona 345 University of South Dakota 20
University of Miami 330 National Louis University 22
Georgetown University 326 Clemson University 23
Derexl University 319 University of Colorado Denver 25
Harvard University 311 South Dakota State University 26
Columbia University 311 University of Mississippi 27
Florida International University 305 Oakland University 27
Brown University 304 University of Rhode Island 27
Johns Hopkins University 300 Missouri University of Science and Technology 28
Michigan State University 295 Jackson State University 29
University of Oregon 284 Texas A&M University-Kingsville 30
University of Illinois at Urbana-Champaign 282 University of Missouri-St. Louis 30
Note: # means the number of full-time first-time foreign undergraduate students between 1998 and2000
57

Table A.4: Heterogeneous Effects on Domestic Student Enrollment by Demand Constraints Levels
All Schools Higher ranked
Dependent variable: the number Stable Fluctuating Stable Fluctuating
of domestic undergraduates enrollment enrollment enrollment enrollment
(1) (2) (3) (4)Number of foreign students -1.728*** .615 -1.265*** .016
(.447) (.560) (.478) (.555)
Cragg-Donald Wald F statistics 18.84 38.74 9.88 14.84
Year fixed effects Y Y Y YInstitution fixed effects Y Y Y YNumber of universities 82 82 51 20Number of observations 1,066 1,066 663 260Note: Standard errors are reported in parentheses and are clustered at the institutionallevel.“Stable enrollment” means the coefficient of variation of undergraduate enrollment(between1991 and 2000) is at the lower tertile level, and “fluctuating enrollment” means the coefficientof variation of undergraduate enrollment(between 1991 and 2000) is greater than the change atthe upper tertile level. In columns (3) and (4), I focus on top-100 universities only. *** P<0.01** P<0.05 * P<0.1
58

Tab
leA
.5:
Rob
ust
nes
sC
hec
ks:
Incl
udin
gG
roup/I
nst
ituti
on-S
pec
ific
Quad
rati
cT
ime
Tre
nds
Nu
mbe
rof
Non
-dis
cou
nte
dIn
stit
uti
on
al
Nu
mbe
rof
Non
-dis
cou
nte
dIn
stit
uti
on
al
dom
esti
cst
uden
tstu
itio
ngr
an
taid
dom
esti
cst
uden
tstu
itio
ngr
an
taid
(1)
(2)
(3)
(4)
(5)
(6)
Nu
mbe
rof
fore
ign
stu
den
ts-2
.605
***
11.3
33**
28.2
42**
*-1
.465
**7.
987*
**4.
900
(.82
9)(4
.762
)(9
.174
)(.
726)
(2.0
40)
(4.2
83)
Cra
ggD
on
aldF
stati
stic
s7.
0021
.90
21.8
74.
8217
.31
17.2
6
Yea
rfi
xed
effec
tsY
YY
YY
YIn
stit
uti
on
al
fixe
deff
ects
YY
YY
YY
Gro
up-s
peci
fic
quadra
tic
tren
ds
YY
YN
NN
Inst
itu
tion
-spe
cifi
cqu
adra
tic
tren
ds
NN
NY
YY
Nu
mbe
rof
un
iver
siti
es10
024
624
610
024
624
6N
um
ber
of
obs
erva
tion
s1,
300
3,19
83,
195
1,30
03,
198
3,19
5N
ote
:S
tan
dar
der
rors
are
rep
orte
din
pare
nth
eses
and
are
clu
ster
edat
the
inst
itu
tion
alle
vel.
Tu
itio
nan
din
stit
uti
onal
grant
aid
are
defl
ated
by
the
Con
sum
erP
rice
Ind
ex(C
PI)
.C
PI
adju
stm
ents
such
that
100=
2013
.In
colu
mn
s(1
)to
(3),
Id
ivid
eth
esa
mp
lein
to22
gro
up
sbas
edon
thei
rin
itia
lnu
mb
erof
full
-tim
efi
rst-
tim
est
ud
ents
bet
wee
n19
98an
d20
00,
wit
hea
chgr
oup
hav
ing
1000
-stu
den
tb
an
ds,
an
dad
dgro
up
-sp
ecifi
cqu
ad
rati
cti
me
tren
ds.
Inco
lum
ns
(4)
to(6
),I
add
inst
itu
tion
-sp
ecifi
cqu
adra
tic
tim
etr
end
s.***
P<
0.01
**P<
0.05
*P<
0.1
59

Table A.6: Undergraduate Enrollment Rate by Overall Students and International Students
(a) University of California-Santa Cruz
2005 2006 2007 2008 2009 2010 2011 2012 2013 2014
Overall 13.04% 13.6% 15.17% 14.27% 11.8% 11.86% 12.8% 11.57% 8.56% 9.93%
International 5.5% 4.89% 6.8% 3.14% 0.55% 0.96% 0.70% 0.94% 3.82% 3.04%
Notes: Enrollment Rate = Admit Rate* Yield Rate.(http://planning.ucsc.edu/irps/ugAdmissions/froshAdmits(2005-2015).pdf)
(b) University of California-Los Angeles
2002 2003 2004 2005 2006 2007 2008 2009
Overall 9.79% 9.48% 8.61% 10.47% 10.16% 8.99% 8.54% 8.02%
International 4.3% 4.96% 7.81% 6.36% 9.4% 5.9% 5.09% 3.78%
Notes: Enrollment Rate = Admit Rate* Yield Rate.(http://www.admissions.ucla.edu/Prospect/Adm fr/Frosh Prof.htmf)
(c) Other Available Information
UC-Berkeley (2014) Pennsylvania Stete (2014) Gergetown University (2011)
Overall 7.82% 24.14 8.28%
International 4.99% 11.84 5.22%
Notes: http://internationaloffice.berkeley.edu/students/current/enrollment data;http://admissions.psu.edu/apply/statistics/;https://uadmissions.georgetown.edu/firstyear/studentprofile
60