Embed Size (px)
Citation preview

Ecological Modelling, 65 (1993) 71-93 Elsevier Science Publishers B.V., Amsterdam
71
The impacts of climate change on rice yield" a comparison of four model performances *
D o m i n i q u e B a c h e l e t a n d C h e r y l A. G a y 1
Man Tech Enuironmental Technology Inc., US EPA Environmental Research Laboratory, 200 SW 35th Street, Cor~'allis, OR 97333, USA
(Received 13 June 1991; accepted 7 May 1992)
ABSTRACT
Bachelet, D. and Gay, C.A., 1993. The impacts of climate change on rice yield: a comparison of four model performances. Ecol. Modelling, 65: 71-93.
Increasing concentrations of carbon dioxide (CO2) and other greenhouse gases are expected to modify the climate of the earth in the next 50-100 years. Mechanisms of plant response to these changes need to be incorporated in models that predict crop yield estimates to obtain an understanding of the potential consequences of such changes. This is particularly important in Asia where demographic forecasts indicate that rice supplies worldwide will need to increase by 1.6% annually to the year 2000 to match population growth estimates. The objectives of this paper are (1) to review the major hypotheses and /o r experimental results regarding rice sensitivity to climate change and (2) to evaluate the suitability of existing rice models for assessing the impact of global climate change on rice production. A review of four physiologically-based rice models (RICEMOD, CERES- Rice, MACROS, RICESYS) illustrates their potential to predict rice responses to elevated CO 2 and increased temperature. RICEMOD does not respond to increases in CO 2 nor to large increases in temperature. Both MACROS and CERES (wetland rice) responses to temperature and CO 2 agree with recent experimental data. RICESYS is an ecosystem model which predicts herbivory and inter-species competition between rice and weeds but does not respond to CO 2. Its response to increasing temperature also agrees with experi- mental data.
Correspondence to: D. Bachelet, ManTech Environmental Technology Inc., US EPA Envi- ronmental Research Laboratory, 200 SW 35th Street, Corvallis, OR 97333, USA. * The research described in this article has been funded by the U.S. Environmental Protection Agency. This document has been prepared at the EPA Environmental Research Laboratory in Corvallis, Oregon, through contract No. 68-C8-0006 to ManTech Environ- mental Technology Services Corporation. It has been subjected to the Agency's peer and administrative review and approved for publication. Mention of trade names or commercial product does not constitute endorsement or recommendation for use. i Present address: Sveriges Lantbruksuniversitet, Institutionen for Ekologi och Miljovard, Box 7072, S-750 07 Uppsala, Sweden.
0304-3800/93/$06.00 © 1993 - Elsevier Science Publishers B.V. All rights reserved

72 o B A C H E L E T A N D C.A. G A Y
INTRODUCTION
Rice is a staple food for over half of the world's population. Demo- graphic forecasts indicate that rice supplies worldwide will need a 1.6% annual increase until year 2000 ( IRRI, 1989) to match populat ion growth estimates. The major rice-consuming countries of south and southeast Asia will need a 2.5% annual increase in rice yield. Much of that increase is expected to come from irrigated areas, which are responsible for 73% of the world's rice product ion ( IRRI, 1989). Cont inued increases in rice product ion depend on favorable climatic and environmental conditions.
CO 2 concentra t ion in the a tmosphere has increased considerably since pre-industr ial times with current mean annual increments of about 1.5 ppm (Keeling et al., 1984). An increase in CO 2 is associated with an increase in photosynthesis for most crops (Cure, 1985). However, these potential gains may be limited for poor rice farmers because they could be unable to afford the increased fertilizer demand under current agro-economic struc- tures (Seshu et al., 1989). On the other hand, 40 to 50 selection cycles can be comple ted by rice breeders before CO 2 doubles, thus giving them the oppor tuni ty to develop varieties taking advantage of rice sensitivity to the changing climate (Seshu et al., 1989). Moreover , direct physiological effects of CO 2 enr ichment are likely to benefi t C~ crops such as rice more than their C 4 competi tors such as most rice weeds, but increased tempera tures resulting from the greenhouse effect will favor C 4 weeds over C 3 crops (Pat terson and Flint, 1990).
According to current model predictions, the increase in CO 2 and o ther g reenhouse gases is likely to induce surface air t empera tu re rises over the next 50 years and concurrent changes in precipitat ion pat terns (Table 1).
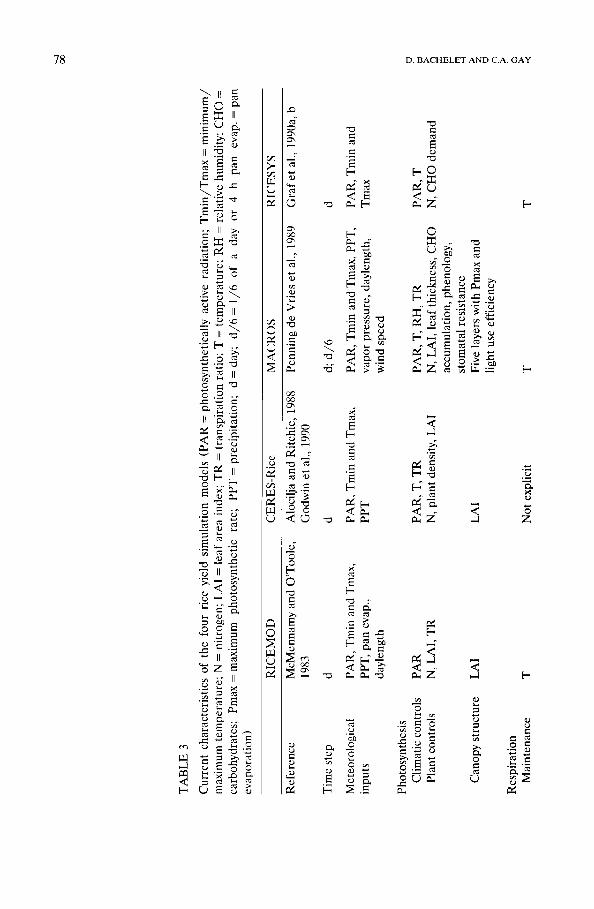
TABLE 1
Estimates of changes in means of surface air temperature and precipitation over South East Asia (5-30°N, 70-105°E), from preindustrial times to 2030, assuming the Intergovernmental Panel on Climate Change "business as usual scenario" (Houghton et al., 1990) following a doubling of C O 2. (DJF = December-January-February; JJA = June-July-August; T = temperature; PPT = precipitation). General circulation models cited below come from the United Kingdom Meteorological Office (UKMO) the Geophysical Fluid Dynamics Labora- tory (GFDL) and the Canadian Climate Center (CCC)
Model Reference Change in T Change in PPT (°c) (%)
DJF JJA DJF JJA
CCC Boer et al., 1989 + 1 + 1 -5 +5 GFDL Wetherald and Manabe, 1989 + 2 + 1 0 + 10 UKMO Mitchell et al., 1989 + 1 + 2 + 15 + 15

I M P A C T O F C L I M A T E C H A N G E O N R I C E Y I E L D 73
The increase in mean daily temperatures due to global warming may lower rice yield potential in many areas, but may also enable the northern limits of rice growing regions to expand, especially in Japan and northern China. Finally, the combined effects of changes in CO 2 and temperature have never been studied and are currently under investigation. Simulation mod- els are at this stage the most promising tools to synthesize current knowl- edge or hypotheses and estimate directional trends for potential changes in rice yield following climate change.
Several publications have described how rice yield may be affected by climate change. Yoshino et al. (1988), using Horie's (1987) rice model, predicted that lowland rice yields would increase in Japan by about 9% following a doubling of CO 2 and associated climatic changes as predicted by the Goddard Institute of Space Studies (GISS) general circulation model. An increase of 0.75°C in mean temperature, with a 2% increase in precipitation is expected to bring a 0.3% decrease in rice yield in India and a 0.6% decrease in China (National Defense University 1980). Yield estimates for a range of sites varying in latitude from 6 to 31°N showed reductions of 10 to 20% by a rise in temperature during harvest (Novem- ber-December) of 1 to 2°C (Seshu and Cady, 1984). From these estimates, it is clear that a wide range of crop yield predictions have been made using climate change scenarios.
Our objective here is (1) to briefly review the major experimental studies of rice sensitivity to climate and (2) to evaluate the suitability of existing rice models to assess the impact of global climate change on rice produc- tion in the rice-growing areas of Asia. Several rice models have been published (see reviews in Kickert, 1984, and McMennamy and O'Toole, 1983), varying from regression models to physiological and mechanistic models with different degrees of validation. We chose four physiologically based models: two models currently used to estimate future rice yield in Asia (Alocilja and Ritchie, 1988, and Godwin et al., 1990; Penning de Vries et al., 1989), a more empirical model (McMennamy and O'Toole, 1983), and an ecosystem model (Graf et al., 1990a, b). Rather than examining model results, which could be misleading because they mostly predict potential yield, we looked at the mechanisms and hypotheses incorporated in the models.
REVIEW OF EFFECTS OF CLIMATE CHANGE ON RICE AND PADDY ECOSYS- TEMS
C O 2 effects
The possibility that a rise in atmospheric C O 2 may significantly increase agricultural yield sparked a wave of activity from the agricultural research

74 D. B A C H E L E T A N D C.A. GAY
TABLE 2
Rice response to a doubling of atmospheric CO2, adapted from Cure (1985). Data in the second column represent the percent change from 300-350 ppm to 680 ppm in each of the variables listed in the first column. The 95% confidence limits on these changes are also included. The third column contains thc number of data points (N) used, the fourth column the number of studies from which the data points were extracted
Parameter Change N Studies References (%)
Short-term carbon exchange rate +43 _+ 19 8 3
Acclimated carbon exchange rate +46 _+ 0 2 1
Net assimilation rate + 26 _+ 11 8 3
Biomass accumulation +27 _+ 7
Root-shoot ratio - 4.0 +_ 0
Harvest index + 1.9_+ 0.6
Stomatal conductance -33 _+ 7
Transpiration -16 _+ 9
Yield + 15 _+ 3
Akita and Tanaka, 1973 Morison and Gifford, 1983 Imai and Murata, 1978b
Imai and Murata, 1978b
Imai and Murata, 1976 Imai and Murata, 1979a, b
22 11 Akita and Tanaka, 1973 Imai and Murata, 1976 Imai and Murata, 1978a, b Cock and Yoshida, 1973 Yoshida, 1973 Morison and Gifford, 1984
2 1 Imai and Murata, 1976 Morison and Gifford, 1984
6 3 Yoshida, 1973 Cock and Yoshida, 1973
5 3 Imai and Murata, 1978b Morison and Gifford, 1983
7 3 Akita and Tanaka, 1973 Imai and Murata, 1976 Imai and Murata, 1978b
6 3 Yoshida, 1973 Cock and Yoshida, 1973
c o m m u n i t y ( A d a m s et al., 1988, Bolin et al., 1986, Cooter , 1990; Crosson, 1989; G o u d r i a a n and Unswor th , 1990; H a m m e r et al., 1987, Par ry et al., 1988). A genera l survey of c rop response to a doubl ing o f C O 2 (Cure, 1985) reviewed studies on rice (Table 2) and showed increases in rice yield and b iomass due to an increase in net assimilat ion rate. The same studies ind ica ted a dec rease in leaf c o n d u c t a n c e and t ransp i ra t ion due to C O 2
e n h a n c e m e n t . M o r e recen t research by Baker et al. (1990a, c) showed an increase in grain yield and b iomass as ambien t C O 2 increases, t oge the r

IMPACT OF C L I M A T E C H A N G E ON RICE YIELD 75
with an increase in canopy net photosynthesis and water use efficiency. Baker et al. (1990b) found that elevated CO 2 accelerated rice development and shortened total growth duration. Strain (1985) also stated that the net effect of CO 2 on plant reproduction is to accelerate all phenological events from anthesis to seed maturation.
At the rice ecosystem level, the indirect impacts of CO z are important. In general, when photosynthesis is enhanced by increased CO2, C / N ratio also increases (Strain, 1987) which reduces the nutritional quality of leaves (Overdiek et al., 1988) and therefore increases feeding by herbivorous insects (Lincoln et al., 1984, 1986) before reducing their fitness. A high C / N ratio also slows down plant tissue decomposition and could reduce methane emission. Bazzaz and colleagues have published a number of studies examining the effects of CO 2 concentration on competing assem- blages of different species (as reported by Patterson and Flint, 1990). The competitive ability of the C 3 species improved in assemblages grown in enriched CO 2 as compared with ambient level atmospheres. In the case of rice cultivation, this means that rice, which is a C 3 plant, would compete advantageously with common weeds such as Echinochloa spp. which have the C a pathway. Finally, both symbiotic and nonsymbiotic nitrogen fixation have been shown repeatedly to increase with increased CO 2 (Strain, 1985). This means a potential increase in the nitrogen content of the rice rhizosphere, rich in nitrogen fixing organisms. Microbiological activity in the rhizosphere should be enhanced at higher CO 2 concentrations due to increased exudation from plants (Lamborg et al., 1983).
Temperature effects
Critically low a n d / o r high temperatures define the environment where the life cycle of the rice plant can be completed. Critical temperature thresholds are (1) low temperatures around 15°C from the seedling stage to panicle initiation and (2) low temperatures around 20°C or high tempera- tures around 35°C at flowering which could induce sterility during pollina- tion (about 80 days after planting). Within the critical low and high temperature range, temperature influences both the rate of development of leaves and panicles and the rate of grain filling, thereby affecting the growing season length of a rice variety, and eventually determining the suitability of that variety to the environment (Yoshida, 1976). Increased temperature speeds up plant development but decreases the length of the grain filling period. According to Stansel and Fries (1980), for a 120-day rice variety, the average daily temperature during the 55 day-long vegeta- tive period should be around 22°C and the temperature during the repro- ductive period (about 21 days) should be around 24°C. Harvest occurs

76 D. B A C H E L E T AND C.A. GAY
following an approximate 35-day period of grain filling and maturation corresponding to an average daily temperature of 24°C.
In principle, global warming should allow for a northward expansion of rice growing areas and a lengthening of rice growing seasons which are now constrained by low temperatures such as in Japan (Seshu et al., 1989). In some areas, it may even be possible to grow two annual rice crops instead of only one. However, the acceleration of the development process can also result in incomplete grain filling and reductions in yield. Baker et al. (1990d) found that increased temperature reduced maturation time and induced a linear decrease in yield while biomass remained mostly unaf- fected.
Temperature effects on rice yield are not simply restricted to direct effects of air temperature on aboveground metabolic processes, and direct effects of water and soil temperatures on root metabolic processes. Indirect effects on the population dynamics of plant pathogens and insects and belowground physical and chemical processes are potentially large, but have been little studied. Insect development cycles are closely linked with temperature, and a shortening of their development phases could increase the potential for outbreaks. However, plants grown for a long time under increased temperature also have a reduced nutrient content and a lower specific leaf weight. The resulting reduction in nutritional quality increases feeding by herbivorous insects (Lincoln et al., 1984, 1986), but also length- ens their development, thus counteracting the direct effect of temperature on insect growth. Rice disease incidence may also be severely affected by modifying the frequency of occurrence of the optimal infection tempera- ture. Finally, the rhizosphere flora are sensitive to high temperatures. Because free-living nitrogen fixers are abundant in the rice root zone, a change in temperature could affect the paddy nitrogen cycle.
G E N E R A L REVIEW OF THE F O U R MODELS
We selected four physiologically based models simulating paddy rice: RICEMOD (McMennamy and O'Toole, 1983), CERES-Rice (Alocilja and Ritchie, 1988; Godwin et al., 1990), MACROS (Penning de Vries et al., 1989) and RICESYS (Graf et al., 1990a, b). The criteria used to select the models were that (1) model documentation and code were available, (2) the model had to be a lowland rice model because we limited our study to paddy rice, thus assuming optimal water supply through irrigation, (3) the model had to be mechanistic in order to represent the effects of climate change on individual physiological processes. The four models run on a daily time step and require at least daily temperature and radiation inputs (Table 3). Major physiological processes that the four models simulate are

IMPACT OF CLIMATE CHANGE ON RICE YIELD 77
photosynthesis, translocation, transpiration, and phenology (Table 3). Ty- phoons are not taken into account in any of the models. Competit ion with weeds is only simulated in RICESYS. Leafhopper damage is also simulated in RICESYS while subroutines to describe the impact of rice diseases are being developed for both CERES-Rice and MACROS. The various plant characteristics that are included in each model are described in detail in Table 4 together with the various climatic factors that may affect simulated yield.
RICEMOD
RICEMOD (McMennamy and O'Toole, 1983: McMennamy, 1980) was developed to assess the state-of-the-art in rice science and guide research by stressing key processes that were not well understood. It includes a number of physical parameters but is also designed to accommodate addition of subroutines dealing with soil and plant chemistry as well as biophysical processes of the aerial environment. Daily weather inputs include precipitation, pan evaporation, maximum and minimum tempera- tures, daylength and solar radiation. It does not include the influence of CO 2. It assumes opt imum levels of nutrients and does not take into account typhoons or pests.
In this model, photosynthesis is a function of solar radiation, canopy structure and the ratio of leaf nitrogen weight to area. Canopy shape is derived from leaf area index (LAI) (Curry et al., 1975). Leaf area is assumed to be proportional to leaf weight. Leaf nitrogen content is as- sumed to be proportional to plant age. Photosynthesis is not affected by temperature, but is affected by water stress. Photosynthetic rate is modified linearly by the ratio of actual transpiration over potential transpiration. Maintenance respiration is a direct function of temperature. Allocation of fixed carbohydrate between plant parts in R I C E M O D is derived from tables relating allocation to plant age in days.
R I CEMOD also includes a soil-water balance routine. The soil is as- sumed to consist of four layers, three of which contain roots, and the fourth is assumed to have a constant water content. A two-stage evaporation is calculated based on the method of Ritchie (1972) and uses soil water diffusivity. It relies almost entirely on soil, plant and atmospheric data derived from experiments at IRRI where fields were fertilized.
CERES-Rice
CERES (Crop Environment Resource Synthesis)-Rice (Alocilja and Ritchie 1988, Godwin et al., 1990) emphasizes the effects of management
"-....I
TA
BL
E 3
Cu
rren
t ch
arac
teri
stic
s of
the
fou
r ri
ce y
ield
sim
ulat
ion
mod
els
(PA
R =
pho
tosy
nthe
tica
lly
acti
ve r
adia
tion
; T
min
/Tm
ax =
min
imu
m/
max
imum
tem
pera
ture
; N
= n
itro
gen;
LA
I =
lea
f ar
ea i
ndex
; T
R =
tra
nspi
rati
on r
atio
; T
= t
emp
erat
ure
; R
H =
rel
ativ
e hu
mid
ity:
CH
O =
ca
rboh
ydra
tes;
P
max
= m
axim
um
phot
osyn
thet
ic
rate
; P
PT
= p
reci
pita
tion
; d
= d
ay;
d/6
= 1
/6
of
a da
y or
4
h p
an
evap
. =
pan
ev
apor
atio
n)
RIC
EM
OD
C
ER
ES
-Ric
e M
AC
RO
S
RIC
ES
YS
Ref
eren
ce
McM
enn
amy
an
d O
'Too
le,
Alo
cilj
a an
d R
itch
ie,
19
88
P
enn
ing
de
Vri
es e
t al
., 1
98
9
Gra
f et
al.,
199
0a,
b 19
83
God
win
et
al.,
1990
Tim
e st
ep
d d
d; d
/6
d
Met
eoro
logi
cal
PA
R,
Tm
in a
nd T
max
, P
AR
, T
min
an
d T
max
, P
AR
, T
min
an
d T
max
, P
PT
, P
AR
, T
min
and
in
puts
P
PT
, p
an e
vap.
, P
PT
va
por
pres
sure
, da
ylen
gth,
T
max
da
ylen
gth
win
d sp
eed
Pho
tosy
nthe
sis
Cli
mat
ic c
ontr
ols
PA
R
PA
R,
T,
TR
P
lant
con
trol
s N
, L
AI,
TR
N
, p
lan
t de
nsit
y, L
AI
Can
opy
stru
ctur
e L
AI
LA
I
Res
pira
tion
M
ain
ten
ance
T
N
ot e
xpli
cit
PA
R,
T,
RH
, T
R
N,
LA
I, l
eaf
thic
knes
s, C
HO
ac
cum
ulat
ion,
phe
nolo
gy,
stom
atal
res
ista
nce
Fiv
e la
yers
wit
h P
max
an
d
ligh
t us
e ef
fici
ency
T
PA
R,
T
N,
CH
O d
eman
d
T

Tra
nslo
cati
on
Eco
syst
em l
evel
So
il
Man
agem
ent
prac
tice
s
Her
bivo
res
Fee
ds
Pla
nt d
evel
opm
ent
Gro
wth
Ass
umpt
ions
Phe
nolo
gy,
sour
ce s
ize
Fou
r la
yers
Irri
gati
on
No
No
T
Hei
ght
= f(
LA
I)
No
typh
ons,
no
pest
s,
leaf
T >
20°
C,
< 35
°C
yiel
d =
pani
cle
wei
ght
Phe
nolo
gy,
sour
ce s
ize,
si
nk d
eman
d, N
, so
il
wat
er,
prio
rity
rule
Inpu
t fi
le w
ith
5-10
lay
ers,
in
itia
l nu
trie
nt c
onte
nt,
text
ure,
wat
er h
oldi
ng
capa
city
N f
erti
liza
tion
, lan
d pr
epar
atio
n, i
rrig
atio
n N
o N
o
Gen
etic
fil
e, T
Sin
k de
man
d, T
No
typh
oons
, no
pes
ts
pote
ntia
l yi
eld
= pa
nicl
e w
eigh
t at
ant
hesi
s
Phe
nolo
gy,
prio
rity
rul
e,
sour
ce s
ize
Soil
wat
er b
alan
ce
Irri
gati
on, f
erti
liza
tion
No
No
Veg
. st
age:
T,
phot
oP
Rep
rod.
sta
ge:
T
T;
sink
No.
and
res
erve
he
ight
= f
(phe
nolo
gy)
No
typh
oons
, no
pes
ts
bioc
hem
ical
con
stra
ints
Pri
orit
y ru
le,
sink
siz
e, N
Soil
nit
roge
n ba
lanc
e
Fer
tili
zati
on
Yes
Y
es
PA
R,
T,
book
keep
ing
Sup
ply/
dem
and
driv
en
No
typh
oons
, no
pes
ts e
xcep
t le
afho
pper
s
"-O

80 D. BACHELETANDC.A. GAY
TABLE 4
Comparison between RICEMOD, CERES, MACROS and RICESYS. Plant characteristics that are included in the model, followed by a list of climatic factors that may affect simulated yield, are listed below [Y = yes; N = no: (Y)= currently under development]
Plant characteristics RICEMOD CERES MACROS RICESYS
Photosynthesis Y Y Y Y Leaf conductance N N Y N Water use efficiency N N Y N Leaf area Y Y Y Y C/N ratio N Y Y Y Specific leaf weight Y Y Y N Dry matter production and yield Y Y Y Y Crop maturation rate, flowering Y Y Y Y
Sensitivity to climatic factors CO 2 N (Y) Y N Temperature Y Y Y Y Drought stress Y Y Y N Mineral stress N Y Y Y
and the influence of soil properties on crop performance. The model was designed to assess yield as constrained by varietal characteristics, soil water and nitrogen, for alternative technology and for new growing sites. It was designed to reduce time and cost of agrotechnology transfer of new varieties and management practices. Weather inputs include daily solar radiation, maximum and minimum temperatures and precipitation. It ig- nores the potential effect of typhoons and assumes no pests. However, some work has been done to simulate the impact of diseases on yield (J. Ritchie, Michigan State University, East Lansing, USA, personal communi- cation, 1991) and subroutines simulating the impact of blast on rice yield have been developed (P. Teng, Internat ional Rice Research Institute, Los Banos, Philippines, personal communication, 1992) but the code was un- available at the time this paper was written. The influence of CO 2 on photosynthesis (enhancement) and transpiration (decrease) has been re- cently added (scalar modifier) to assess the impact of increased CO 2 on rice yield in a US EPA sponsored international project (C. Rosenzweig, NASA Goddard, New York, USA, personal communication, 1991).
In CERES-Rice, photosynthesis is expressed as daily biomass production and calculated as a function of LAI, solar radiation and a radiation use efficiency constant. Biomass production can be reduced by high tempera- tures and nitrogen deficiency. LAI is a function of the time of leaf appearance and expansion, which can also be reduced by nitrogen defi- ciency. Allocation depends on the phenological stage of the plant, which is

I M P A C T O F C L I M A T E C H A N G E O N R I C E Y I E L D 81
primarily a function of thermal time. Partitioning between shoots and roots can be modified by water and nutrient deficiencies. Phenological develop- ment and crop duration are genotype specific and related to temperature and photoperiod. Phenological stages include sowing, germination, emer- gence, juvenile period, panicle initiation, heading, beginning of grain fill, end of grain fill and physiological maturity. Photoperiod sensitivity influ- ences thermal time requirement during floral induction. Specific genetic information needed to run the model includes the thermal time (degree- days) between emergence and the end of the juvenile period, the photoin- duction rate, the opt imum photoperiod, the thermal time required for grain fill, the efficiency of sunlight conversion to assimilates, the tillering rate and the grain size.
A modified Priestly and Taylor (1972) potential evapotranspiration method is used to drive the water balance separating soil evaporation and transpiration. The soil is characterized by its initial nitrogen content, water holding properties, texture and field topographic position. The user deter- mines the number of soil layers used to run the model.
No calibration is required when cultivar characteristics are known. When they are unknown, genetic parameters can be approximated from field results through a calibration exercise.
MACROS
MACROS (Modules of an Annual Crop Simulator) emphasizes the biochemical aspect of plant physiology based on the concept of growth- limiting factors (de Wit and Penning de Vries, 1982; Penning de Vries and van Laar, 1982) and is intended for educational purposes, especially in developing countries. Environmental inputs include solar radiation, maxi- mum and minimum temperatures, precipitation, daylength, vapor pressure and wind speed. It includes the effect of CO 2 on photosynthesis. MACROS is set up to run in one of three distinct modes in which (1) water and nutrients are in optimal supply, and weeds, pests and diseases are absent; (2) water stress due to limiting water availability may occur; (3) nitrogen or water may be limiting plant production during part of the year. In all cases, the carbon fraction in dry matter and the biochemical composition are fixed.
The canopy is divided into five layers with the radiation at the bot tom of the upper layer used as input to the lower layer. A maximum leaf photosyn- thesis rate and initial light use efficiency is calculated for each layer. The distribution of leaf angles for each layer is specified. Photosynthesis in- cludes photorespiration. The rate is expressed per unit leaf area, consider- ing only the area of the upper surface of each leaf. Changes in ambient

82 D. B A C H E L E T A N D C.A. G A Y
C O 2 concentration are simulated by adjusting the maximum photosynthetic rate relative to the ratio of the new CO 2 concentration over 340 ppm. Maximum photosynthetic rate is also reduced by glucose accumulation in leaves, leaf thickness, leaf nitrogen content, temperature and water stress. Maintenance respiration is a direct function of temperature.
The phenological stage determines biomass partitioning to leaves, roots, stems, and storage organs using locally calibrated constants. During the vegetative phase, development rate is a non-linear function of temperature and photoperiod. After flowering, development rate is only dependent on temperature. Carbohydrate requirements for the formation of the various plant parts are determined by the typical biochemical composition of each component. Growth stops when carbohydrate reserves represent less than 5% of leaf dry weight, while maintenance respiration continues. Under ample supply of water and nutrients, crop growth rate can be reduced by low temperatures or by an insufficient number of carbohydrate sinks. Excess carbohydrate is stored in a reserve pool.
Photosynthetic rate is largely determined by transpiration rate when water supply is high; when it is low, the inverse is true. Transpiration is a function of radiation and evaporative demand (Penman, 1956). Reduction in photosynthesis due to sink size limitation, aging, or low relative humid- ity, all result in increased stomatal resistance and subsequent decrease in potential transpiration rate. Water vapor movement is reduced by the leaf, the canopy, and the leaf boundary layer resistances which are calculated for the upper canopy layers which contribute most.
The model includes two different water balance modules. The first one is for free-draining soils, and the second for soils with impeded drainage. In the case of unsaturated soils, the approach is similar to that used in SAHEL (Semi-Arid Habitats that Easily Leach) (Van Keulen, 1975; Stroos- nijder. 1982; Jansen and Gosseye, 1986). In the case of soils with impeded drainage, which are common where lowland rice is grown (a hard pan forms after puddling), SAWAH (Simulation Algorithm for Water Flow in Aquatic Habitats) is used (Penning de Vries et al., 1989).
MACROS was calibrated for the rice cultivar IR-36 grown at several locations across the Philippines.
RICESYS
RICESYS (Graf et al., 1990a, b) is a demographic model for rice growth and development as affected by temperature and solar radiation. It was written to study crop-pes t interactions and provides a useful tool for the development of sound integrated pest management strategies. It was de- signed to describe the dynamics of c rop-weed competition and to predict

IMPACT OF CLIMATE C H A N G E ON RICE YIELD 83
dry matter allocation with respect to different weeding strategies (Graf et al., 1990b). The model does not include an effect of ambient CO 2 concen- trations on plant physiology. A distributed delay model is used to describe the dynamics of tiller production and culm, leaf, root and grain mass growth (Graf et al., 1990a). RICESYS also includes several species of leaffolders feeding on leaves and weeds competing with rice for a limiting resource, solar irradiance or nitrogen.
All nutrients, except nitrogen, are assumed to be non-limiting and water is assumed to be abundant in the irrigated paddies. The model includes a simple soil nitrogen balance. RICESYS does not consider typhoons and assumes no other pests than herbivorous leafhoppers.
The Frazer-Gilbert functional response model is used to predict photo- synthesis. This approach allows the simulation of energy acquisition at different trophic levels. Photosynthesis is a function of solar radiation, temperature, leaf area index and of the plant's demand for carbohydrate. Nitrogen stress (ratio between actual and potential nitrogen content) also modifies photosynthesis. Maintenance respiration is a direct function of temperature. Photosynthate accumulates in a metabolic pool and is used to satisfy respiration first, reproduction, growth and reserves with decreasing priorities. Carbohydrate and nitrogen are partly recycled from dying plant material. The demographic component of the model is a bookkeeping device for births, deaths, growth and aging of mass and numbers of plant subunits.
RICESYS was originally calibrated to represent the variety Makalioka 34 from Madagascar in irrigated paddies that were fertilized before trans- planting. It was secondarily validated for high yielding varieties (IR54 and 68) in the Philippines (Graf et al., 1991).
SENSITIVITY ANALYSIS
We ran each model with the same climatic dataset (Los Banos, Philip- pines, year 1984, mean annual temperature 26.7°C) using changes in temperature of the same order of magnitude as those predicted to accom- pany a doubling of atmospheric CO 2 (Houghton et al., 1990). Maximum and minimum temperatures were simultaneously increased by 0.5°C incre- ments up to a total of 5°C and atmospheric CO 2 was varied from 330 ppm (ambient) to 660 ppm (double CO 2) using 30 ppm increments.
Because neither RICESYS nor RICEMOD includes CO 2 effects, only the sensitivity to temperature is presented (Fig. 1A and B). A 5°C increase in temperature causes a 43% decrease in grain yield, assuming no pest damage, in RICESYS. This prediction compares well with Baker et al.'s (1990c) 50%. In CERES-Rice, some interactions exist between CO 2 levels

84 D. BACHELET AND C.A. GAY
40
35
" i 30
25
20 f I
0.5 1 1.5 2 2.5 3 3.5 4 4.5 5
Temperature increase (oC)
+ Grain Yield + Biomass
4613
450
440
430
420
~ 410 "5
400
390
380
370
B.
I i I I I I ~ I [ I I
0 0.5 1 1.5 2 2.5 3 3,5 4 4.5 5
Temperature increase (oC)
Grain Yield
Fig. 1. Sensitivity of RICESYS (A) and RICEMOD (B) to temperature using climatic inputs from Los Banos (1984) with a mean average annual temperature of 26.7°C, arbitrarily increased by 0.5°C increments.
IMPACT OF CLIMATE CHANGE ON RICE YIELD 85
and temperature regimes (Fig. 2A). An increase in temperature generally corresponds to a decrease in grain yield, while an increase in CO 2 corre- sponds to an increase in yield. In MACROS there is a smoother relation- ship between grain yield, CO 2 and temperature with maximum potential yield at ambient temperatures and doubled CO 2 levels (Fig. 2B). Ulti- mately, both in MACROS and CERES-Rice, the direction of the relation- ships between yield, temperature and CO 2 is the same.
We compared observed rice yields (Baker et al., 1990a, d) with yields predicted by both MACROS and CERES under variable temperature regimes, as represented by the regression curves obtained between model output and temperature range. Without prior calibration of the models, we observed a closer fit of MACROS' results (within the 95% confidence interval for the slope of Baker et al.'s data) than CERES' (Fig. 3). At high temperatures, MACROS simulates a sharper decrease in yield than CERES, which correlates more closely with experimental data from Baker et al. (1990a, d).
DISCUSSION
All four models predict a decrease in rice yield due to a temperature increase, which agrees in direction with current findings (Baker et al., 1990d). R I CEMOD simulates the smallest yield decrease (12% from 25 to 30°C) among the four models. It does not include a CO 2 effect on rice physiology, however the inclusion of a CO 2 effect that enhances photosyn- thesis and reduces transpiration such as that used in CERES-Rice should be easily accomplished since the program is short and well documented.
Both CERES-Rice and MACROS include detailed information on rice physiological processes and explicitly describe effects of both CO 2 and temperature. CERES-Rice predicts a lower impact of temperature (18% from 25 to 30°C) than MACROS does (62% from 25 to 30°C), which corresponds well with Baker et al.'s (1990d) experimental data (50% decrease from 25 to 30°C). However, while CERES-Rice predicts a 15% increase in potential yield due to a doubling of CO2, MACROS only predicts a 9% increase (without temperature increase), both well below the 47% increase observed by Baker et al. (1990d).
Both CERES-Rice and MACROS have been used to estimate potential changes in rice yield following a doubling in atmospheric CO 2 concentra- tion. Panturat and Eddy (1990), using CERES-Rice, predicted a 20% decrease in upland rice yield (due to a decrease in irrigation water availability) in Thailand following a doubling of CO 2 and associated cli- matic changes as predicted by the GISS (Goddard Institute of Space Studies) general circulation model. Jansen (1990) used MACROS and a

86 D. B A C H E L E T A N D C.A. GAY
C E R E S - RICE
Yield .-"" / ",, ",,
I ."" ./\ / /".-7"
./--./ y\ ------; x, . / , ~
o ",'?---~-~ .... >--L
Temperature Change (°C) 5
B. MACROS ~ . > \
5ooo ~" / y " "< --~ '-.~ ........ / ~ "../~. '~/
4000 I/ .-" ./ / "'.. ~. "\ / ". b / /
3000 ~ ' ~ / / / , " "~--~', 440 o ~ - - ~ ..... / . \..//
Temperature Change (°C) 4 5
Fig. 2. Sensitivity of CERES-Rice (A) and MACROS (B) to temperature (same scenario as described in EJg. 1) and CO 2 changes. CO 2 is increased from current levels (330 ppm) to a doubled concentration scenario (660 ppm) by increments of 20 ppm.

I M P A C T O F C L I M A T E C H A N G E O N R I C E Y I E L D 87
11- B
10-
8 8 .._. 8 -
=~ 7 - o o
-- 5-
>" 4-
3-
2-
I -
0- 15 20 25 30 35 40
Temperature (°C)
Fig. 3. Comparison between experimental data (B) from Baker et al. (1990a, d) and MACROS (M) and CERES-Rice (C) predictions of the relationship between rice yield and temperature. The regression line was drawn using the observed data points. The lower curve for both CERES and MACROS corresponds to the relationship between minimum temper- atures and yield. The upper curve corresponds to the relationship between maximum temperatures and yield. Experimental data and predictions correspond to ambient CO 2 conditions (330 ppm).
modified historical database and reported a 10% increase in yield following about a 4°C increase in mean annual temperature (0.3°C yearly increase) and a tripling of CO 2 concentration (to about 1000 ppm) in the year 2100.
Both models are based on the concept of a generic crop growth model, and are thus capable of worldwide calibration and testing for different crops. MACROS requires a greater number of climatic inputs, but its code is also structurally easier to modify compared to CERES-Rice, which includes 2-3 times as many subroutines. MACROS ' code is relatively well documented, but there is no available user's guide.
RICESYS offers the opportunity to examine the effect of climatic change at the system level, i.e. the plant, its weeds and herbivores. It is a well structured, well documented program that lends itself easily to expan- sion and modifications. It also constitutes a radically different approach to carbohydrate partitioning from the three other models as demand drives allocation and in the context of climate change, sink strength as a function of development stage may change significantly. RICESYS, which includes competit ion between rice and its natural weeds and herbivory, simulates a more "realist ic" yield while CERES-Rice estimates pest-free yield and MACROS estimates potential yield, which are rarely at tained in field conditions in the tropics except in experiment stations. Using a climate

88 D. BACHELET A N D C.A. GAY
scenar io with R I C E S Y S can actual ly give the rice f a rmer a be t t e r idea o f how yields may change over the next 50 years. It predicts a 43% decrease in yield, fol lowing a 5°C t e m p e r a t u r e increase, assuming no pest damage ,
which c o m p a r e s well with Baker ' s 50%. As a conclusion, C E R E S - R i c e and M A C R O S should be p re fe r r ed over
R I C E M O D in cl imate change s imula t ion studies for their m o r e realistic r e sponse to t e m p e r a t u r e increases and their a l ready inc luded CO2 re-
sponse mechan i sm. R I C E S Y S responds realistically to increased t e m p e r a -
tures, but does not inc lude a C O 2 response and is the re fo re unapp l icab le
TABLE 5
Overview of the effects of CO 2 and temperature on plants from Krupa and Kickert, 1989)
in single stress mode (adapted
Plant Doubling of C O 2 Increased characteristics temperatures
Photosynthesis C 3 plants increase Increases: C 4 up to 100%, but C4 plants have higher plants only show a temperature small increase optimum than C 3
Leaf conductance Decreases in C 3 Increases and C 4 plants
Water use Increases in C 3 Decreases in most efficiency and C4 plants plants
Leaf area C 3 plants increase Decreases more than C 4 plants
Specific leaf weight Increases Increases
Crop maturation Increases Increases rate, flowering Earlier flowering Earlier flowering
Dry matter C 3 plants nearly Increases in many production and double, but C 4 plants yield plants show only
small increases
Drought stress Plants become less Plants become sensitivity sensitive to drought more sensitive
Mineral stress Plants become less Plants become sensitivity responsive to more sensitive
elevated CO 2 (higher growth rate)
C /N ratio Increases in many Increases in many plants plants

I M P A C T O F C L I M A T E C H A N G E O N R I C E Y I E L D 89
until a C O 2 function, like that in CERES, is included. Its structure can however broaden the range of climate change impacts since it addresses ecosystem-level questions by including herbivores and competitors. These questions may, in the long run, be more relevant than the plants' response since genetic engineering may provide cultivars well adapted to the new climatic conditions. If one is only interested in the plant level, the choice between MACROS and CERES-Rice will probably depend on the familiar- ity of the scientist with the model structure and code. Both models are currently adapted to better deal with the range of climatic change that a doubling in atmospheric CO 2 may bring about.
Finally one should not forget that, while the direct effects on plant processes of CO 2 and temperature, as single factors (Table 5, adapted from Krupa and Kickert, 1989), are well documented and have been used by modelers to adjust their model to respond to climate change scenarios (Reynolds and Acock, 1985), little is known about interactions between those factors. Experimental studies are now needed to explicitly describe interactions of environmental factors on plant physiological processes to actually validate the models that include simultaneous effects of CO 2 and climatic changes. Until then, scientists can only use their best judgment to modify or choose a plant model, which is why current estimates of climate change effects on rice yield are so variable.
ACKNOWLEDGMENTS
We greatly appreciate the helpful comments from reviewers Dr. Benno Graf, Dr. Dale Moss, Dr. Dave Olszyk, Dr. Joe Ritchie, Dr. John Van- Sickle, Steve Wondzell and two anonymous reviewers.
REFERENCES
Adams, R.M., McCarl. B.A., Dudek, D.J. and Glyer, J.D., 1988. Implications of global climate change. West. J. Agric. Econ., 13: 348-356.
Akita, S. and Tanaka, I. 1973. Studies on the mechanism of differences in photosynthesis among species. IV. The differential response in dry matter production between C 3 and C 4 species to atmospheric carbon dioxide enrichment. Proc. Crop Sc. Soc. Jpn., 42: 288-295.
Alocilja, E.C. and Ritchie, J.T., 1988. Upland rice simulation and its use in multicriteria optimization. IBSNAT Research Report Series 01, 96 pp.
Baker, J.T., Allen, L.H. and Boote, K.J., 1990a. Growth and yield responses of rice to carbon dioxide concentration. J. Agric. Sci., 115: 313-320.
Baker, J.T., Allen, L.H., Boote, K.J., Jones, P. and Jones, J.W., 1990b. Developmental responses of rice to photoperiod and carbon dioxide concentration. Agric. For. Meteorol., 50: 201-210.
9 0 D. BACHELET AND C.A. GAY
Baker, J.T., Allen, L.H., Boote, K.J., Jones, P. and Jones, J.W., 1990c. Rice photosynthesis and evapotranspiration in subambient, ambient and superambient carbon dioxide con- centrations. Agron, J., 82: 834-840.
Baker, J.T., Allen, L.H., Boote, K.J., Rowland-Bamford, A.J., Waschmann, R.S., Jones, J.W., Jones, P.H. and Bowes, G., 1990d. Response of vegetation to carbon dioxide: temperature effects on rice at elevated CO 2 concentration. DOE Progress Report No. 60, 71 pp.
Boer. G. et al., 1989. Equilibrium response studies with the CCC climate model. Personal Communication, as cited in U. Cubash and R.D. Cess, Processes and modeling. In: J.T. Houghton, G.J. Jenkins and J.J. Ephraum (Editors), Climate Change: The IPCC Scien- tific Assessment. University Press, Cambridge, United Kingdom, pp. 69-91.
Bolin, W., Doos, B.R., Jager, J. and Warrick, R.A., 1986. The greenhouse effect, climatic change and ecosystems. Scope 29. John Wiley and Sons, New York, 541 pp.
Cock, J.H. and Yoshida, S., 1973. Changing sink and source relations in rice (Oryza satiua L.) using carbon dioxide enrichment in the field. Soil Sci. Plant Nutr., 19: 229-234.
Cooter, E.J., 1990. The impact of climate change on continuous corn production in the southern USA. Climatic Change, 16: 53-82.
Crosson, P., 1989. Climate change and mid-latitudes agriculture: perspectives on conse- quences and policy responses. Climatic Change, 15: 51-73.
Cure, J.D., 1985. Carbon dioxide doubling responses: a crop survey. In: B.R. Strain and J.D. Cure (Editors), Direct Effects of Increasing Carbon Dioxide on Vegetation, U.S. Depart- ment of Energy, DOE/ER-0238, pp. 99-116.
Curry, B.R., C.H. Baker and Streeter, J.G., 1975. SOYMOD I: a dynamic simulation of soybean growth and development. In: American Society of Agricultural Engineers Transactions of the ASAE, pp. 963-974.
Godwin, D.C., Singh, U., Buresh, R.J. and De Datta, S.K., 1990. Modeling of nitrogen dynamics in relation to rice growth and yield. 14th International Congress of Soil Science Transactions, Kyoto, Japan, Aug. 1990. Int. Soc. of Soil Science, Vol. IV, pp. 320-325.
Goudriaan, J. and Unsworth, M.H., 1990. Implications of increasing carbon dioxide and climate change for agricultural productivity and water resources. In: Impact of Carbon Dioxide, Trace Gases and Climate Change on Global Agriculture. ASA Special Publica- tion No. 53, pp. 111-129.
Graf, B., Rakotobe, O., Zahner, P., Delucchi, V. and Gutierrez, A.P., 1990a. A simulation model for the dynamics of rice growth and development. I. The carbon balance. Agric, Syst., 32: 341-365.
Graf, B., Gutierrez, A.P., Rakotobe, O., Zahner, P. and Delucchi. V, 1990b. A simulation model for the dynamics of rice growth and development. II. The competition with weeds for nitrogen and light. Agric. Syst., 32: 367-392.
Graf, B., Dingkuhn, M., Schnier, F., Coronel, V. and Akita, S., 1991. A simulation model for the dynamics of rice growth and development. III. Validation of the model with high yielding varieties. Agric. Syst., 36: 329-349.
Hammer, G.L., Woddruff, D.R. and Robinson, J.B., 1987. Effects of climatic change on reliability of wheat cropping - - a modelling approach. Agric. For. Meteorol., 41: 123-142.
Horie, T., 1987. A model for evaluating climatic productivity and water balance of irrigated rice and its application to southeast Asia. Southeast Asian Stud., 25: 62-74.
Houghton, J.T., Jenkins, G.J. and Ephraums, J.J., 1990. Climate change. The IPCC Scientific Assessment, University Press, Cambridge, United Kingdom, 365 pp.
Imai, K. and Murata, Y., 1976. Effect of carbon dioxide on growth and dry matter
I M P A C T O F C L I M A T E C H A N G E O N R I C E Y I E L D 91
production of crop plants. I. Effects on leaf area, dry matter, tillering, dry matter distribution ratio, and transpiration. Proc. Crop Sci. Soc. Jpn., 45: 598-606.
Imai, K. and Murata, Y., 1978a. Effect of carbon dioxide on growth and dry matter production of crop plants. III. Relationship between CO2 concentration and nitrogen nutrition in some C 3 and C 4 species. Jpn. J. Crop Sci., 47: 118-123.
Imai, K. and Murata, Y., 1978b. Effect of carbon dioxide on growth and dry matter production of crop plants. V. Analysis of after-effect of carbon-dioxide-treatment on apparent photosynthesis. Jpn. J. Crop Sci., 47: 587-595.
Imai, K. and Murata, Y., 1979a. Effect of carbon dioxide on growth and dry matter production of crop plants. VI. Effect of oxygen concentration on the carbon-dioxide-dry matter production relationship in some C 3 and C 4 species. Jpn. J. Crop Sci., 48: 58-65.
Imai, K. and Murata, Y., 1979b. Effect of carbon dioxide on growth and dry matter production of crop plants. VII. Influence of light intensity and temperature on the effect of carbon dioxide-enrichment on some C 3 and C a species. Jpn. J. Crop Sci., 48: 409-417.
International Rice Research Institute, 1989, Implementing the Strategy, Work Plan for 1990-1994. International Rice Research Institute, Los Banos, Philippines.
Jansen, D.M., 1990. Potential rice yields in future weather conditions in different parts of Asia. Neth. J. Agric. Sci., 38: 661-680.
Jansen, D.M. and Gosseye, P., 1986. Simulation of growth of millet (Pennisetum ameri- canum) as influenced by water stress. Simulation Reports CABO-TI" No. 10. Centre for Agrobiological Research, Wageningen.
Keeling, C.D., Carter, A.F. and Mook, W.G., 1984. Seasonal, latitudinal, and secular variations in the abundance and isotopic ratios of atmospheric CO 2. J. Geophys. Res., 89: 4615-4628.
Keulen, H. van, 1975. Simulation of water use and herbage growth in arid regions. Simulation Monographs. Pudoc, Wageningen.
Kickert, R.N., 1984. Names of published computer models in the environmental biological sciences: a partial list and new potential risks. Simulation, 22-39.
Krupa, S.V. and Kickert, R.N., 1989. The greenhouse effect: impacts of ultraviolet-B (UV-B) radiation, carbon dioxide (CO2), and ozone ( 0 3) on vegetation. Environ. Pollut., 61: 263-393.
Lamborg, M.R., Hardy, R.W.F. and Paul, E.A., 1983. Microbial effects. In: E.R. Lemon (Editor), CO 2 and Plants: The Response of Plants to Rising Levels of Atmospheric Carbon Dioxide. AAAS Selected Symp. Ser. 84. Westview Press, Boulder, CO, pp. 131-176.
Lincoln, D.E., Couvet, D. and Sionit, N., 1984. Response of an insect herbivore to host plants grown in carbon dioxide enriched atmospheres. Oecologia, 69: 556-560.
Lincoln, D.E., Sionit, N. and Strain, B.R., 1986. Growth and feeding response of Pseudoplu- sia includens (Lepidoptera: Noctuidae) to host plants grown in controlled carbon dioxide atmospheres. Environ. Entomol., 13: 1527-1530.
McMennamy, J.A., 1980. Dynamic simulation of irrigated rice crop growth and yield. In: World Meteorological Organization and the International Rice Research Institute. Agrometeorology of the Rice Crop. International Rice Research Institute, Los Banos, Philippines, pp. 213-221.
McMennamy, J.A. and O'Toole, J.C., 1983. RICEMOD: a physiologically based rice growth and yield model. IRRI Research Paper Series No. 87, 33 pp.
Mitchell, J.F.B., Senior, C.A. and Ingrain, W.J. 1989. CO 2 and climate: a missing feedback? Nature, 341: 132-134.

92 D. B A C H E L E T AND C.A. G A Y
Morison, J.I.L. and Gifford, R.M., 1983. Stomatal sensitivity to carbon dioxide and humid- ity. A comparison of two C 3 and two C a grass species. Plant Physiol., 71: 789-796.
Morison, J.I.L. and Gifford, R.M., 1984. Plant growth and water use with limited water supply in high CO 2 concentrations. II. Plant dry weight, partitioning and water use efficiency. Aust. J. Plant Physiol., 11: 375-384.
National Defense University, 1980. Crop Yields and Climate Change to the year 2000. Volume I. Report on the second phase of a climate impact assessment. USDA, NOAA, Institute for the Future, Defense Advanced Research Projects Agency. Fort Lesley J. McNair, Washington, DC, 128 pp.
Overdiek, D., Reid, C. and Strain, B.R., 1988. The effects of preindustrial and future CO 2 concentrations on growth, dry matter production and the C / N relationship in plants at low nutrient supply: Vigna unguiculata (cowpea), Abelmoschus eschulentus (okra) and Raphanus sativus (radish). Angew. Bot., 62: 119-134.
Panturat, S. and Eddy. A., 1990. Some impacts on rice yield from changes in the variance of precipitation. Climatol. Bull., 24: 16-27.
Parry, M.L., Carter, T.R., Konijn, N.T. (Editors), 1988. The Impact of Climatic Variations on Agriculture. Kluwer Academic Publishers, Dordrecht. Two volumes, 876 pp. and 764
PP. Patterson, D.T. and Flint, E.P., 1990. Implications of increasing carbon dioxide and climate
change for plant communities and competition in natural and managed ecosystems. In: B.A. Kimball, N. Rosenberg, L.H. Allen, G.H. Heichel, C.W. Stuber. D.E. Kissel and S. Ernst (Editors), Impact of Carbon Dioxide, Trace Gases, and Climate Change on Global Agriculture. ASA Special Publication No. 53. ASA, CSSA, SSSA, pp. 83-110.
Penman, H.L., 1956. Evaporation: an introductory survey. Neth. J. Agric. Sci., 4: 9-29. Penning de Vries, F.W.T. and Laar, H.H. van (Editors), 1982. Simulation of plant growth
and crop production. Simulation Monographs. Pudoc, Wageningen. Penning de Vries, F.W.T., Jansen, D.M., ten Berge, H.F.M. and Bakema, A. (Editors),
1989. Simulation of ecophysiological processes of growth in several annual crops. IRRI, Los Banos, Simulation Monographs 29. Pudoc, Wageningen. 272 pp.
Priestly, C.H.B. and Taylor, R.J., 1972. On the assessment of surface flux and evaporation using large scale parameters. Mon. Weather Rev., 100: 81-92.
Reynolds, J.F. and Acock, B., 1985. Predicting the response of plants to increasing carbon dioxide: a critique of plant growth models. Ecol. Modelling, 29: 107-129.
Ritchie, J.T., 1972. Model for predicting evaporation from a row crop with incomplete cover. Water Resour. Res., 8: 1204-1213.
Seshu, D.V. and Cady, F.B., 1984. Response of rice to solar radiation and temperature estimated from international yield trials. Crop Sci., 24: 649-654.
Seshu, D.V., Woodhead, T., Garrity, D.P. and Oldeman, L.R., 1989. Effect of weather and climate on production and vulnerability of rice. In: Climate and Food Security. Interna- tional Rice Research Institute, pp. 93-121.
Stansel. J.W. and Fries, R.E., 1980. A conceptual agromet rice yield model. In: World Meteorological Organization and the International Rice Research Institute, Agrometeo- rology of the Rice Crop. International Rice Research Institute, Los Banos, Philippines. pp. 201-212.
Strain, B.R., 1985. Physiological and ecological controls on carbon sequestering in terrestrial ecosystems. Biogeochemistry, 1: 219-232.
Strain, B.R.,1987. Direct effects of increasing atmospheric CO 2 on plants and ecosystems. Trends Ecol. Evol., 2: 18-21.
Stroosnijder, L., 1982. Simulation of soil water balance. In: F.W.T. Penning de Vries and

I M P A C T O F C L I M A T E C H A N G E O N R I C E Y I E L D 93
H.H. Van Laar (Editors), Simulation of Plant Growth and Crop Production. Simulation Monographs. Pudoc, Wageningen, pp. 175-193.
Wetherald, R.T. and Manabe, S. 1989. Personal Communication, as cited in U. Cubash and R.D. Cess, Processes and modeling. In: J.T. Houghton, G.J. Jenkins and J.J. Ephraum (Editors), Climate Change: The IPCC Scientific Assessment. Cambridge University Press, Cambridge, United Kingdom, pp. 69-91.
Wit, C.T. de and Penning de Vries, F.W.T., 1982. La synth~se et la simulation des syst6mes de production primaire. In: F.W.T. Penning de Vries and M.A. Djiteye (Editors), La Productivit6 des P~turages Sah61iens. Agricultural Research Reports 918. Pudoc, Wa- geningen.
Yoshida, S. 1973. Effects of CO 2 enrichment at different stages of panicle development on yield components and yield of rice (Oryza sativa L.). Soil Sci. Plant Nutr., 19: 311-316.
Yoshida, S., 1976. Rice, In: P. de T. Alvim and T.T. Koslowski (Editors), Ecophysiology of Tropical Crops. Academic Press, New York, pp. 57-87.
Yoshino, M., Uchijima, Z. and Tsuji, H., 1988. The implications for agricultural policies and planning. In: M.L. Parry, T.R. Carter and N.T. Konijn (Editors), The Impact of Climatic Variations on Agriculture. Vol. 1: Assessments in Cool Temperate and Cold Regions. Kluwer Academic Publishers, Dordrecht, The Netherlands, pp. 853-868.


![Developing Rice with High Yield under Phosphorus · Developing Rice with High Yield under Phosphorus Deficiency: Pup1 Sequence to Application1[W][OA] Joong Hyoun Chin, Rico Gamuyao,](https://img.dokumen.tips/doc/110x75/5f03a4167e708231d40a0d09/developing-rice-with-high-yield-under-developing-rice-with-high-yield-under-phosphorus.jpg)


