Embed Size (px)
Citation preview

i
The Impact on Russia of WTO Accession and The Doha Agenda:
The importance of liberalization of barriers against foreign direct
investment in services for growth and poverty reduction
Thomas Rutherford, University of Colorado
David Tarr, The World Bank
Oleksandr Shepotylo, University of Maryland
Chapter 16 in Poverty and the WTO: Impacts of the Doha Development Agenda, Thomas W.
Hertel and L. Alan Winters (eds.) forthcoming from the World Bank, Washington, DC.
World Bank Policy Research Working Paper 3725, October 2005 The Policy Research Working Paper Series disseminates the findings of work in progress to encourage the exchange of ideas about development issues. An objective of the series is to get the findings out quickly, even if the presentations are less than fully polished. The papers carry the names of the authors and should be cited accordingly. The findings, interpretations, and conclusions expressed in this paper are entirely those of the authors. They do not necessarily represent the view of the World Bank, its Executive Directors, or the countries they represent. Policy Research Working Papers are available online at http://econ.worldbank.org.
We thank Maros Ivanic for the simulations from the GTAP model, Thomas Hertel and Mark Horridge for comments, and Maria Kasilag for help with the logistics. We gratefully acknowledge financial support from the World Bank-Netherlands Partnership Program and the United Kingdom’s Department for International Development (DFID).
.
WPS3725
Pub
lic D
iscl
osur
e A
utho
rized
Pub
lic D
iscl
osur
e A
utho
rized
Pub
lic D
iscl
osur
e A
utho
rized
Pub
lic D
iscl
osur
e A
utho
rized
Pub
lic D
iscl
osur
e A
utho
rized
Pub
lic D
iscl
osur
e A
utho
rized
Pub
lic D
iscl
osur
e A
utho
rized
Pub
lic D
iscl
osur
e A
utho
rized
ii
Abstract
Taking price changes from the GTAP (Global Trade Analysis Project) model of world
trade, we employ a small open economy computable general equilibrium comparative static model of the Russian economy to assess the impact of global free trade and a successful completion of the Doha Agenda on the Russian economy and especially on the poor. We compare those results with the impact of Russian accession to the World Trade Organization (WTO) on income distribution and the poor. Our model incorporates all 55,000 households from the Russian Household Budget Survey as “real” households in the model. Crucially, given the importance of FDI liberalization as part of Russian WTO accession, we also include foreign direct investment and Dixit-Stiglitz endogenous productivity effects from liberalization of import barriers against goods and foreign direct investment in services.
We estimate that Russian WTO accession in the medium run will result in gains averaged
over all Russian households equal to 7.3 percent of Russian consumption (with a standard deviation of 2.2 percent of consumption) with virtually all households gaining. We find that global free trade would result in a weighted average gain to households in Russia of 0.2 percent of consumption, with a standard deviation of 0.2 percent of consumption, while a successful completion of the Doha Development Agenda would result in a weighted average gain to households of –0.3 percent of consumption (with a standard deviation of 0.2 percent of consumption). Russia, as a net food importer, loses from subsidy elimination, and the gains to Russia from tariff cuts in other countries are too small to offset these losses. These results strongly support the view that Russia’s own liberalization is more important than improvements in market access as a result of reforms in tariffs or subsidies in the rest of the world. Foremost among the own reforms is liberalization of barriers against foreign direct investment in business services.

Introduction
There are two potentially quite important events on the horizon for Russia with respect to
the World Trade Organization (WTO). First of all, Russia is negotiating accession to the World
Trade Organization and as of late 2004 had signed bilateral agreements on its accession with at
least 12 WTO members, including the European Union, China and South Korea. At the same
time, the members of the WTO are negotiating tariff and subsidy cuts under the Doha
Development Agenda. As a result of WTO member country changes in tariffs and subsidies
agreed under the Doha Development Agenda, Russia will face a new set of prices for its exports
and imports on world markets. In this paper we evaluate the impact of the likely changes in
world prices as a result of a conclusion of the Doha Development Agenda (and of global free
trade) on Russia and on poverty in Russia. We also compare these effects with the impact on
Russia of Russian WTO accession.
Russian WTO accession is primarily a set of commitments by Russia to liberalize its own
trade and, crucially, open up its foreign direct investment regime in business services. The
comparison of Russian WTO accession with the impact of the Doha Agenda on Russia then
devolves fundamentally to a question of whether Russia can gain more from trade and subsidy
reform in the rest of the world or from its own liberalization.
This paper uses the model that we have developed through two earlier papers. In Jensen,
Rutherford and Tarr (2004) we developed a small open economy model of Russia that
incorporated foreign direct investment in business services with Dixit-Stiglitz endogenous
productivity effects from investment and trade liberalization in business services and imperfectly
competitive goods sectors. We found substantial gains for Russia from its WTO accession,
deriving primarily from the liberalization of barriers against foreign direct investment in

2
services. We show that a constant returns to scale model without FDI in business services (that
we believe to be an inappropriate model specification given the importance of FDI commitments
in Russian WTO negotiations) would produce estimated gains dramatically smaller. In
Rutherford, Tarr and Shepotylo (2004) (RT&S), we extend the Jensen, Rutherford and Tarr
model by incorporating all the 55,000 households of the Russian Household Budget Survey as
agents in our general equilibrium model. That is, we build a “real household” model of the
Russian economy with endogenous productivity effects. In that paper, we show that WTO
accession could be expected to benefit virtually all the poor, but an inappropriately specified,
constant returns to scale model, without liberalization of barriers against FDI in services and
endogenous productivity effects would produce much smaller average welfare gains and the
wrong sign for the about 7 percent of the Russian population.
In this paper we employ the same model and dataset that we employed in RT&S to
examine the impact on poverty in Russia of the Doha Development Agenda as well as a result of
global free trade. Crucially, we compare these impacts with the impact on Russia of its own
liberalization through the commitments it will make as part of its WTO accession. In this process
we are able to assess the relative benefits to Russia of liberalization of countries in the rest of the
world of their tariffs or subsidies with liberalization in Russia of its barriers against FDI and
goods imports. We examine impacts on Russia overall, at the decile level, as well as on the entire
distribution of Russian households through our “real household” model of Russia.
As with the other country case studies in Hertel and Winters (forthcoming), the starting
point for the analysis of the Doha agenda and global free trade impacts are the vectors of
percentage changes in the price of exports and imports for Russia as a result of the completion of

3
the Doha agenda or global free trade. These vectors are derived from simulations of the GTAP
model. We take these new price vectors as exogenous shifts in the terms of trade facing Russia.
Some of our key results are as follows. The mean welfare gain to Russia from its WTO
accession, averaged over all households is 7.3 percent of Russian consumption (with a standard
deviation of 2.2 percent of consumption) in the medium run. We find that virtually all
households obtain at least some increase in their income. Nearly all the household gains fall
between 2.0 percent and 25 percent of consumption. Poor households do slightly better than rich
households because the wage rate of unskilled labor rises more than the return on capital. If an
inappropriately specified constant returns to scale model were employed the gains from WTO
accession would be only about 1.2 percent of consumption with about 7 percent of households
expected to lose, i.e., the WTO accession estimates are decisively affected by liberalization of
barriers against foreign direct investment in business services sectors and endogenous
productivity effects in business services and goods.
Regarding the impact on Russia of cuts in the tariffs and subsidies of other countries, we
find that global free trade (which encompasses free trade in goods outside of Russia and the
elimination of export subsidies, with domestic support for agriculture retained) would result in a
weighted average gain to households in Russia of 0.2 percent of consumption, with a standard
deviation of 0.2 percent of consumption. We estimate that a successful completion of the Doha
Development Agenda (which we model as the elimination of export subsidies, substantial cuts in
tariffs outside of Russia and reduction in domestic support for agriculture) would result in a
weighted average gain to households of –0.3 percent of consumption. Russia, as a net food
importer, loses from subsidy elimination, and the gains to Russia from tariff cuts in other

4
countries are too small to offset these losses. The impacts on Russia from these terms of trade
changes tend to favor neither the rich nor the poor.
Thus we find that, in the medium term, what other countries in the WTO do in terms of
their tariff changes or changes in export subsidies or domestic support will have a very small
effect on Russian households and poverty. On the other hand, we estimate that virtually all
households will gain from Russian WTO accession, these gains are substantial and they are very
slightly progressive. The distribution of gains across the 55,000 households is decisively affected
by the inclusion of liberalization of barriers against foreign direct investment in business services
sectors and endogenous productivity effects in business services and goods. These results
strongly support the view that Russia has by far the most to gain from its own liberalization,
especially in business services, rather than from improvements in market access as a result in
reforms in tariffs or subsidies in the rest of the world. Foremost among the source of gains from
own liberalization is the gains from liberalization of barriers against foreign direct investment in
business services. The broader implications of this is that developing countries might experience
larger gains in poverty reduction if the WTO could more effectively negotiate cuts in barriers
against FDI in services.
Despite the significant gains we estimate from WTO accession, during a transition period
it is likely that many households with displaced workers will lose as they are forced to seek new
employment. We estimate that there will be a decline in employment in light industry, the food
industry, mechanical engineering and metal-working and construction materials. Workers in
these sectors will suffer losses from transitional unemployment and will likely incur expenses
related to retraining or relocation. Some of the poorest members of the population are ill
equipped to handle these transition costs. Thus, despite a likely substantial improvement in the

5
standard of living for almost all Russians after adjustment to the WTO, government safety nets
are very important to help with the transition and especially for the poorest members of society.
We briefly describe the model and data in the next section. We focus on the evidence for
endogenous productivity effects from liberalization of barriers against imports and FDI in
services. Results are presented in section 2. We offer brief conclusions in the final section.
1. The Model
We employ a small open economy computable general equilibrium model of the Russian
economy with 55,000 households. As noted previously, this paper builds on two earlier papers
where the model and data are documented. In Jensen, Rutherford and Tarr (2004), we describe
the structure of the single representative agent model, how we disaggregated the official Russian
input-output table, and how we calculated the Russian tariff and export tax rates. In Rutherford,
Tarr and Shepotylo (2004) (RT&S) we extend the model to incorporate the entire 55,098
households of the Russian Household Budget Survey.1 We refer the reader to those papers for
more detailed documentation of the model. Given its importance to the present paper, we briefly
summarize here some evidence of the importance of liberalization of barriers against foreign
direct investment in services, productivity impacts of greater variety of imported goods and our
approach to estimating barriers to foreign direct investment in Russian business services sectors.
The key modeling features that distinguish this paper from previous applied general
equilibrium modeling exercises linking trade and poverty are that we permit foreign direct
investment in business services and additional varieties of business services that endogenously
1 Key to our capacity to solve a computable general equilibrium model with such a large number of household-
agents in the model was the development of a new algorithm. In Rutherford, Tarr and Shepotylo we explain the intuition for that algorithm and provide a graphical interpretation. In the website version of this paper, we provide the GAMS code for that algorithm.

6
increase the productivity of sectors using that service through the Dixit-Stiglitz variety effect
(see Markusen, Rutherford and Tarr, forthcoming for elaboration). We also allow for Dixit-
Stiglitz productivity effects in goods, both for final consumers and for intermediate use, as
explained in Ethier (1982). We shall show that these features have a fundamental effect on the
results for the estimated impact of WTO accession on poverty in Russia.
1.1 Competitive Sectors
There are 35 sectors in the model listed in table 1. These sectors fall into three categories:
competitive sectors producing goods and services; imperfectly competitive goods sectors; and
imperfectly competitive services sectors. The structure of production is depicted in figure 1. In
competitive sectors price equals marginal cost and imports and domestic goods are differentiated
(the Armington assumption). See de Melo and Tarr (1992) for a description of the details of how
these sectors are modeled.
1.2 Imperfectly Competitive Sectors
In imperfectly competitive goods sectors, goods are produced with a fixed cost and
constant marginal costs. Foreign firms supply the Russian market with production facilities
abroad. We assume symmetry among domestic firms as well as among foreign firms, but costs
differ between domestic and foreign firms. We have firm level competition with pricing
decisions based on large group monopolistic competition. The ratio of marginal costs to average
costs is assumed fixed, which together with our pricing assumption, implies that output per firm
is fixed. Both final and intermediate users of the output of imperfectly competitive sectors obtain
a variety-adjusted unit more cheaply when there are additional varieties on offer via the Dixit-
Stiglitz effect. Entry and exit is determined by a zero profit condition.
7
1.3 Business Services Sectors
Business services are supplied both by competitive firms on a cross border basis and,
since many services are more effectively supplied with a domestic presence, by imperfectly
competitive firms (both multinational and Russian) that have a domestic presence in Russia. For
imperfectly competitive firms the cost and pricing structure is similar to imperfectly competitive
goods producers except that production of services by multinational service providers is done in
Russia. Multinational service providers will import some of their technology or management
expertise when they decide to establish a domestic presence in Russia. Thus, their cost structure
differs from that of Russian service providers. They incur costs related to both imported inputs
and Russian primary factors, in addition to intermediate factor inputs. These services are
characterized by firm-level product differentiation. Restrictions on foreign direct investment,
right of establishment, the movement of business personnel, lack of intellectual property
protection and contract enforcement have major, direct impacts on multinational firms providing
services to the market.
The number of multinational and Russian firms that are present in the Russian market
depends on profitability in that market. For multinational firms, the barriers to foreign direct
investment affects profitability. Reduction in the constraints on foreign direct investment will
typically lead to productivity gains from the Dixit-Stiglitz variety effect because when more
varieties of services are available, buyers can obtain varieties that more closely fit their needs.
1.4 Primary Factors
Primary factors of production are capital, skilled and unskilled labor. There are five types
of capital in the model: (1) mobile capital that can be used in any sector without adjustment costs
(46 percent of the total capital stock); (2) sector-specific capital in the energy sectors, namely
8
ownership of the mineral resources in oil extraction, gas and coalmining (representing 15 percent
of total capital); (3) sector specific capital required for expansion of output in imperfectly
competitive domestic firms producing either goods or services (representing 32 percent of the
capital in the benchmark); (4) sector specific capital required for expansion of output in
imperfectly competitive foreign firms producing either goods or services (representing 5 percent
of the capital in the benchmark); and (5) ownership of licenses for monopoly rents in services
sectors (representing 2 percent of capital in the benchmark). We do not have data that would
allow us to associate specific capital holdings in given sectors with particular households. Thus,
we assume that all households that hold capital, hold the different types of capital in the same
proportions.
1.5 Household Consumer Demand
We assume each household maximizes a Cobb Douglas utility function of the aggregate
35 goods in our model subject to its budget constraint (which is factor income net of transfers).
Factor income shares, aggregated to the decile level, are reported in Table 4.2 Each of the 35
aggregate commodities is a CES (“Armington”) aggregate of imported goods or services and
goods or services produced in Russia. In imperfectly competitive goods sectors, imported and
Russian produced goods are Dixit-Stiglitz aggregates of the outputs of foreign or Russian firms.
2 Households are modeled endogenously based on the 55,000 households of the Russian Household Budget Survey
(HBS). The HBS, which is representative at the regional level, has very detailed information on household consumption expenditures, and information about age, gender, education, and occupation of each member of the household. It also has information about expenditures and savings and by implication household income. The major shortcoming of the HBS for our purposes is that it does not contain information on the sources of income of the households. For sources of household income, we must turn to the Russian Longitudinal Monitoring Survey (RLMS). The RMLS has less than 5,000 observations and is not representative of the population on the regional level. But is has extensive information on individual and household sources of income: wages and profits from first, second, third jobs; pensions and unemployment benefits; profits and dividends from accumulated assets. We have employed both small area estimation and Matching techniques to generate sources of income data for all 55,000 plus households in the HBS. We describe our procedures in Rutherford, Tarr and Shepotylo. Results from both techniques yield similar results.
9
The structure of consumer demand in imperfectly competitive services sectors (equivalent to
business services in our model) is depicted on the left side of figure 1 under “Business Services.”
Competitively supplied cross-border services and imperfectly competitive services produced in
Russia are a CES (Armington) aggregate. Services produced in Russia are a Dixit-Stiglitz
aggregate of services provided by multinational service providers and Russian service providers.
Given our elasticity assumptions, we have pure firm level product differentiation (no preference
biases for varieties according to country of origin) for all Dixit Stiglitz goods and services.
Consumer demand, as well as firm level demand, exhibits love of variety in imperfectly
competitive goods. Given that we have weak separability and homothetic functions at all levels
of consumer demand, the conditions for two-stage (or multi-stage budgeting) are satisfied. Given
the initial data on each of the households, and our assumptions on the structure of demand, we
solve for the parameter values in each of the 55,000 household utility functions that are
consistent with optimization by the households. Thus, the demand functions of all households are
dependent on their initial choices and, in general, differ from one another.3
2. Evidence on the Productivity Impact of Services Liberalization
A growing body of evidence and economic theory suggest that the close availability of a
diverse set of business services is important for economic growth. The key idea is that a diverse
set (or higher quality set) of business services allows users to purchase a quality adjusted unit of
business services at lower cost. As early as the 1960s, the urban and regional economics
literature argued that non-tradable intermediate goods (primarily producer services produced
under conditions of increasing returns to scale) are an important source of agglomeration
3 The model is solved using GAMS/MPSGE (see Rutherford, 1999) and the algorithm developed for this problem
to solve general equilibrium models with a large number of agents.

10
externalities which account for the formation of cities and industrial complexes, and account for
differences in economic performance across regions. The more recent economic geography
literature (e.g., Fujita, Krugman and Venables, 1999) has also focused on the fact that related
economic activity is economically concentrated due to agglomeration externalities (e.g.,
computer businesses in Silicon Valley, ceramic tiles in Sassuolo, Italy).
Evidence comes from a variety of sources. Ciccone and Hall (1996) show that firms
operating in economically dense areas are more productive than firms operating in relative
isolation. Hummels (1995) shows that most of the richest countries in the world are clustered in
relatively small regions of Europe, North America and East Asia, while the poor countries are
spread around the rest of the world. He argues this is partly explained by transportation costs for
inputs since it is more expensive to buy specialized inputs in countries that are far away for the
countries where a large variety of such inputs are located. Marshall (1988) shows that in three
regions in the United Kingdom (Birmingham, Leeds and Manchester) almost 80 percent of the
services purchased by manufacturers were bought from suppliers within the same region. He
cites studies which show that firm performance is enhanced by the local availability of producer
services. In developing countries, McKee (1988) argues that the local availability of producer
services is very important for the development of leading industrial sectors.
As Romer (1994) has argued, product variety is a crucial and often overlooked source of
gains to the economy from trade liberalization. In our model, it is greater availability of varieties
that is the engine of productivity growth, but we believe there are other mechanisms as well
through which trade may increase productivity. 4 Consequently, we take variety as a metaphor
for the various ways increased trade can increase productivity. Winters et al. (2004) summarize
4 Trade liberalization may induce firms to move down their average cost curves, or import higher quality
products or shift production to more efficient firms within an industry. Tybout and Westbrook (1995) find evidence of this latter type of rationalization for Mexican manufacturing firms.

11
the empirical literature by concluding that “the recent empirical evidence seems to suggest that
openness and trade liberalization have a strong influence on productivity and its rate of change.”
Some of the key articles regarding product variety are the following. Broda and Weinstein find
that increased product variety contributes to a fall of 1.2 percent per year in the “true” import
price index. Hummels and Klenow (2002) and Schott (forthcoming) have shown that product
variety and quality are important in explaining trade between nations. Feenstra et al. (1999) show
that increased variety of exports in a sector increase total factor productivity in most
manufacturing sectors in Taiwan (China) and The Republic of Korea, and they have some
evidence that increased input variety also increases total factor productivity. Finally, Feenstra
and Kee (2004) show the export variety and productivity of a country are positively correlated.
3. Barriers to Foreign Direct Investment in Services Sectors
In Russia it is relatively easy to find a number of prominent examples of barriers in the
services sectors. For example, in telecommunications, Rostelekom has a monopoly on long
distance fixed line telephone service. In its bilateral agreement on WTO accession with the
European Union, Russia has agreed to end the Rostelekom monopoly. In banking, although
Russia allows multinationals to invest in new banks in Russia, there is a prohibition on
multinationals opening branches in Russia. This distinction has been a significant point of
contention in the accession negotiations. There are also limits on how much of the insurance
market can be controlled by foreign banks. And maritime transportation within Russia is limited

12
to Russian ships. Commitments within the context of WTO accession should provide
significantly greater access to multinational service providers in these key sectors.5
In order to estimate the ad valorem equivalence of barriers to foreign direct investment,
we first commissioned surveys in telecommunications; banking, insurance and securities; and
maritime and air transportation services by Russian research institutes that specialize in these
sectors. Using these surveys as well as supplementary data, Kimura, Ando and Fujii6 employed
the methodology explained in the volume by C. Findlay and T. Warren (2000) to estimate the
barriers to FDI in the Russian services sector.
For each of these service sectors, authors in the Findlay and Warren volume evaluated
the regulatory environment across many countries; the same regulatory criteria were assessed for
all countries in a particular service sector. The price of services is then regressed against the
regulatory barriers to determine the impact of any of the regulatory barriers on the price of
services. Assuming that the international regression is valid for Russia, and using their survey-
based assessment of the regulatory environment, Kimura, Ando and Fujii estimated the ad
valorem equivalent impact of a reduction in barriers to foreign direct investment in these services
sectors. The results are reported in table 2.
5 We estimate that the barriers in air and maritime transportation are higher than in other sectors, due to strong
barriers to operation within Russia in these sectors. But since there is less international pressure in these sectors for cuts in these barriers, we believe that WTO accession will not have as significant an effect in these sectors.
6 The three papers by Kimura, Ando and Fujii as well as the underlying questionnaires are available at www.worldbank.org/trade/russia-wto.

13
4. Estimated Impacts of Russian WTO Accession
4.1 Specification of the Counterfactuals
We examine and compare the potential impact on Russia of the Doha Development
agenda as well as the impact on Russia of the changes it will make as a result of commitments it
will take on as part of its WTO accession. We first produce results for Russian WTO accession.
These results are based on our integrated “real” 55,000 household model explained in
Rutherford, Tarr and Shepotylo (2004) (RT&S). In our WTO scenario, we assume: (1) that
barriers against foreign direct investment in business services are reduced as indicated in table 2;
(2) seven sectors subject to antidumping actions in export markets receive slightly improved
prices in their market access. This is implemented as an exogenous increase in their export price
as shown in table 2; and (3) the tariff rates of all sectors are reduced by 50 percent. In all
scenarios, unless otherwise stated, we assume that the government employs taxes households in
equal percentages of household income so that government revenue remains unchanged. The
macroeconomic impacts of this scenario are presented in column 1 of table 5. In JRT, we have
shown, that the most important impact of WTO accession on Russia is the liberalization of
barriers against foreign direct investment in business services. In column 2 we present results
where we only liberalize these barriers (by the amount shown in table 2). In column 3 we reduce
the barriers against foreign direct investment in services by 50 percent of the cuts shown in table
2. In column, we present results of a scenario in which we only reduce tariff barriers—by cutting
tariff barriers by 50 percent across the board.
In columns 5 through 8 we present results of the impact of changes in world prices
deriving from reforms undertaken at the global level, primarily in the context of WTO

14
negotiations. We take the changes in world prices derived from the GTAP model as exogenous
changes in the export and import prices facing Russia. Then we run our 55,000 household model
to examine the impact of these price changes on sector output, exports, imports, household
welfare, and other economic variables. In column 5, we consider full elimination of tariffs
worldwide, full elimination of export subsidies and elimination of domestic agricultural support.
In column 6, labeled Doha, we evaluate the impact on Russia of the likely tariff reductions in the
Doha agenda, full elimination of export subsidies and cuts in domestic agricultural support and
tariffs in industrial countries, with developing countries making lesser cuts.
4.2 Aggregate Results in the Full 55,000 Household Model
Aggregate results are summarized in table 5. Welfare results in this table are obtained by
aggregating the equivalent variation gains (as a percent of consumption) of the 55,000
consumers.7
WTO Accession Scenarios. For our general WTO scenario (column 1), we obtain rather
substantial aggregate gains for a comparative state trade model equal to 7.3 percent of aggregate
consumption, with a standard deviation in the welfare gains among households of 2.2 percent of
consumption.8 We show in column 2 that the main driving force for this result is that the
reduction of Russian barriers against foreign direct investment in the services sectors.
Liberalization of barriers to foreign direct investment is responsible for an estimated welfare gain
of 5.3 percent of consumption (with a standard deviation in the welfare results among
households of 1.5 percent of consumption), or over 70 percent of the total welfare gain from
Russian WTO accession. Given that our estimates are that barriers against FDI in services are
much higher than tariff barriers and that there will be only small gains in market access, the 7 The equivalent variation of each household is weighted by its share of base year expenditures. 8 Computable general equilibrium evaluations of trade policy changes typically estimate gains of less than one
percent of GDP. See Rutherford and Tarr (2002) for a discussion and several examples.

15
relative importance of liberalization of barriers to FDI is not surprising. In column 3 we also
show the results of our estimates of the impact of only a 50 percent reduction in the barriers to
FDI, along with the same improved market access and tariff reduction that we implement in our
WTO scenario. The gains are reduced to 4.1 percent of consumption, with a standard deviation in
the welfare gain of 1.3 percent of consumption; the gains remain substantial, but significantly
reduced due to a less significant reduction in FDI barriers. A 50 percent reduction in tariff
barriers yields a welfare gain of 1.3 percent of consumption (with a standard deviation of 0.8
percent). Although the gains are significantly less than the gains from services liberalization, this
is a large gain for a country whose tariffs are not very high. The significant size of the gain is due
to the endogenous productivity effects of goods liberalization.
The intuition for these results is the following. Reduction of barriers against multinational
service providers or foreign goods producers increases the (tariff ridden) demand curve for
multinational services or foreign goods. In imperfectly competitive sectors, this induces entry of
new multinational service providers or new varieties of foreign goods until zero profit is
restored. Despite the reduction in domestic varieties, there is a net increase in varieties overall.
This serves to lower the quality-adjusted cost of purchasing the services or goods in downstream
industries, and this acts like an externality that increases total factor productivity in the
downstream using sectors.9
Since households cannot change their factor endowments between unskilled labor, skilled
labor and capital, but they can substitute among commodities consumed, impacts on factor
incomes through changes in factor prices tend to dominate the welfare impacts in this type of
9 We have shown that if we assume constant returns to scale in all sectors of the economy, the estimated welfare
gains from Russian WTO accession are reduced to 1.2 percent of consumption. These results show that incorporating liberalization of barriers to foreign direct investment in the analysis as well as the Dixit-Stiglitz-Ethier formulation for endogenous productivity effects are both crucial in explaining the rather substantial estimated gains from Russian WTO accession.

16
model.10 In the WTO scenario, the wage rate of skilled labor increases by 5.3 percent, the wage
rate of unskilled labor increases by 3.7 percent and the return on capital increases by 1.8 percent.
Although the return to capital rises relative to a basket of consumption goods, it does not rise as
much as wages. The return to capital increases less than wages because owners of “specific
capital” in imperfectly competitive sectors that are subject to increased competition from imports
or from foreign direct investment will see a reduction in the value of their returns. Returns to
mobile capital increase by over six percent, even faster than returns to skilled labor because the
economy shifts resources into the more capital intensive sectors and away from more unskilled
labor intensive sectors such as light industry and mechanical engineering and metal working.
But, the return on sector specific capital in the imperfectly competitive sectors falls, so that the
total return on capital rises less than wages. The ratio of skilled to unskilled labor in the
expanding sectors in greater than that in the contracting sectors. As a result, the wage of skilled
labor rises faster than the wage rate of unskilled labor.11
Changes in the World Trading Environment: Impacts on Russia. In columns 5 and 6 of
Table 5, we examine the impact on Russia as a result of changes in the world trading
environment. In column 5, we examine the impact of global free trade (without Russian
participation)12, the removal of all export subsidies in agriculture and the removal of domestic
10 See, for example, Harrison, Rutherford and Tarr (2003). 11 The data do not allow us to distinguish capital holdings at the household level between the various types of
capital. Thus, all households are assumed to hold the five kinds of capital in our model in equal proportions. Households that depend disproportionately on specific capital that falls in return would be expected to lose from WTO accession.
12 We assume that any commitments for tariff reduction as part of the Doha agenda will not apply to Russia, since Russia is not yet a member of the WTO and the terms of its accession agreement will define its tariff regime within the time frame of the Doha Development Agenda. Thus, we assume that Russia does not participate in these global liberalization scenarios. However, Russia is assumed to benefit from improved market access as a result of liberalization in other countries – presuming that WTO membership will be in place by the time the Doha scenario is implemented.
17
support in agriculture. We estimate that Russia’s welfare gain will be 0.2 percent of consumption
with a standard deviation among households of 0.2 percent of consumption)..
While the impact on Russia of global free trade outside of Russia and the removal of
export subsidies alone is positive, the most noticeable aspect of these estimates is how small they
are in relation to the 7.3 percent estimated gain that Russia will obtain from its commitments as
part of its WTO accession. This result follows a common strand in the literature suggesting that
the largest gains from trade liberalization come from own-liberalization and not from the actions
of other countries. In this case, we also incorporate as part of the WTO accession scenario the
liberalization of Russian barriers against foreign direct investment with endogenous productivity
effects from liberalization of trade and FDI barriers.13
In column 6, we examine possible outcomes of the Doha Development Agenda (without
any reforms in Russia). We estimate that, on average, Russia will lose about -0.3 percent of
consumption, with a standard deviation across households of 0.2 percent of consumption. These
losses are due to the terms of trade loss to Russia from paying higher prices for food imports due
to export subsidy removal. Without very substantial tariff cuts in the rest of the world to offset
the losses from removal of export subsidies in agriculture, Russia loses from the adverse terms of
trade effects of higher prices for food imports.
13 To put these numbers in perspective, Rutherford and Tarr (2002) have analytically derived the relationship
between a permanent increase in the steady state growth rate and equivalent variation. A welfare gain of 10 percent of consumption corresponds to a permanent increase in the growth rate of about 0.4 percent. Although cross country assessments of the impact of trade liberalization of growth have been criticized, several authors have estimated that trade liberalization could increase the growth rate by between one and 2.5 percent. One criticism of these regressions is that trade liberalization is often accompanied by macro stabilization, institutional reforms and other market reforms, and the trade liberalization variable in the cross country regressions may be picking up these other effects. But WTO accession involves a range of reforms, including institutional reforms necessary to accompany FDI liberalization, and trade liberalization may be a sine qua non of the overall reform process, because other interventions such as state subsidies often are unsustainable in an open economy.

18
To verify this intuition, we have separately evaluated the impact of the elimination of
export subsidies, without any change in tariffs or domestic support. We estimate that Russia will
lose –0.4 percent of consumption from the removal of export subsidies. These results are
explained by the fact that Russia is a net food importer. So elimination of export subsidies in
agriculture results in higher prices for food and agricultural products on world markets. Thus, the
terms of trade shift against Russia since as a result of the elimination of these subsidies.
4.3 Results Aggregated to the Decile Level
In order to ascertain the impact of the Doha Agenda and WTO accession on the poor, we
have separated the 55,000 households into ten deciles, with 10 percent of the households in each.
Households are ranked according to per capita income with decile 1 comprising the poorest 10
percent of the households, decile 10 the richest 10 percent and so on. We run the model with all
55,000 households. Then we aggregate the equivalent variation gains (as a percent of
consumption) of the households in each decile and present these results in table 6. We also
present in this same table the aggregated results for rural and urban households in each decile. In
addition, we present the standard deviation of the disaggregated equivalent variation results
within each decile.
WTO Accession and FDI liberalization. In columns (1) and (2) we present the results for
Russian WTO accession and Russian reduction of barriers against foreign direct investment in
services where we weight the gains of the households within each decile to obtain weighted
average mean gains for the households. We see that all ten representative households gain
significantly, but the richest household gains slightly less in percentage terms than the poorest.
This is because the return on capital increases less than the wage rate of unskilled labor. From
table 4 we can see that the rich depend more on earnings from capital than the rest of the

19
population, so the impact on their income is affected more by the relatively lower increase in the
returns to capital.14 Skilled labor is more evenly distributed across income deciles, reflecting the
fact that government employees such as researchers and teachers often receive very low wages,
and that retirees living on a pension were often skilled workers.15
Rural households typically gain less than urban households. This is due to the fact that
rural households have less education and are therefore classified as less skilled than urban
workers in the same income group, and unskilled wages do not increase as much as skilled
worker wages.
Global Free Trade and the Doha Agenda Scenarios. We see from the results in column
(4) that the impact of global free trade, removal of export subsidies and reduction in domestic
support yields very little difference in the results across deciles. Household welfare in all deciles
increases by an amount between 0.1 percent and 0.3 percent of consumption. That is, the results
for all deciles falls within 0.1 percent of the weighted average for the entire population (shown
previously in table 5) of 0.2 percent welfare increase as a percent of consumption. Similar results
apply to the Doha scenario shown in column 5—the weighted average estimated welfare gains
for virtually all deciles is within 0.1 percent of the estimated weighted average for the entire
population in the respective scenario. The standard deviations for households within the deciles
is 0.2 percent of consumption for all but one group.
14 Household income in Russia exceeds household consumption for almost all households. The reason is that
Russian has a large current account surplus. Consistency between the macro balances and the household data in construction of the Social Accounting Matrix implies that household factor income must be larger than household consumption for most households to allow for the transfer of capital to foreigners as well as to pay for investment. It follows that the change in factor income as a percent of consumption will be larger than the change in factor income as a percent of household income.
15 An individual is classified as skilled if he or she has any education post-high school. We defined skills at the individual level. We define labor and capital shares individually, and then aggregated factor shares within the household.
20
The similarity of results across deciles for these three scenarios is explained by the fact
that, in each scenario, the wage rate of unskilled labor is estimated to increase by the same
percentage as the return to capital. Since it is principally in the disparate shares of capital and
unskilled labor shares of income that the rich and poor differ, if the percentage returns to these
factor moves the same, the welfare gains can be expected to be comparable.
4.4 Results for Individual Households
Distribution of the Results. The distribution of gains from Russian WTO accession
across all 55,000 households is summarized in figure 2, along with the distribution of gains for
the poorest 10 percent and richest 10 percent of all households. The distribution in Figure 2 is
centered around a mean gain of income of 7.3 percent with a standard deviation equal to 2.2
percent of consumption. As is evident from Figure 2, we find that virtually all households will
gain in the new equilibrium, relative to the status quo. We calculate that 98 percent of the
population will gain between 3.2 and 13 percent of consumption; 99.9 percent of the households
will gain between 2 and 25 percent of consumption.16 The distribution of gains for the poorest
decile of the population is close to the distribution for the entire population, although the mean of
the gains is slightly larger, while the richest decile gains slightly less than the average of the
population, i.e., WTO accession produces slightly progressive effects for reasons already
mentioned.17
In figures 3 and 4, we plot the comparable distributions across the 55,000 households
based on the global free trade and Doha scenario. For global free trade, we estimate that 98
percent of the households will experience a change in welfare of between –0.3 and 0.7 percent of
16 For the scenario where we cut barriers to FDI by only 50 percent of the cuts in our WTO accession scenario, 98
percent of the households experience a gain of between 0.9 and 6.3 percent of consumption. 17 While households that are heavily endowed with specific capital in declining sectors will lose on average from
WTO accession, those who can form joint ventures with foreign investors will likely see the value of their specific capital holdings increase.

21
consumption. For the Doha scenario, we estimate that 98 percent of the households will
experience a change in welfare of between –0.8 and 0.2 percent of consumption. As was evident
in the results at the decile level, the impact for the rich and the poor does not differ significantly,
i.e., the impacts global free trade or Doha on Russian households are neither progressive nor
regressive.
In figure 5, we compare the distributions of gains for all Russian households from the
WTO accession, global free trade and Doha scenarios. The figure makes it very evident that
WTO accession results in dramatically larger gains for Russian households than the impact on
Russia of either global free trade or Doha. Global free trade is more beneficial than Doha for
Russian households. But the distributions of gains from global free trade and the Doha scenario
significantly overlap with each other so that a large part of the distribution from Doha is
obscured by the global free trade distribution. That is, the difference in impact on Russia
between global free trade and Doha is rather small compared with the gains we estimate that
Russia could reap from its own reforms as embodied in its WTO accession commitments.
5. Policy Implications
While this analysis has not accounted for the transition costs associated with such trade
reforms, it is clear that the process of adjustment to this new trade and investment climate is
likely to result in losses for many households. As we discuss at length in Jensen, Rutherford and
Tarr (2004), we expect to observe a decline in employment in light industry, the food industry,
mechanical engineering and metal-working and construction materials. These displaced workers
will have to find new employment. They will suffer losses from transitional unemployment and
will likely incur expenses related to retraining or relocation. Thus, despite a likely substantial

22
improvement in the standard of living for almost all Russians after adjustment to a new
equilibrium after accession to the WTO, government safety nets are very important to help with
the transition and especially for the poorest members of society who can ill afford a harsh
transition.
The central finding in this paper is that Russia will gain more from WTO accession
commitments than from a prospective Doha scenario, and this is primarily due to its own
services liberalization. We estimate that in the medium term, what other countries in the WTO
do in terms of their tariff changes or changes in export subsidies or domestic support will have a
very small effect on Russian households and poverty. On the other hand, we estimate that
virtually all households will gain from Russian WTO accession in the medium term, these gains
are substantial and they are very slightly progressive. These findings suggest that the gains to
other developing countries from participation in the WTO might be considerably enhanced if
reductions in barriers against foreign direct investment in services were included in the
negotiations. By deepening reforms to include the services sector, the prospects for enhanced
economic growth and sustained poverty reduction are much improved.

23
References
Bourguignon, Francois and Luis A. Pereira da Silva, 2003. “Conclusion: Where do we go from here?” in Bourguignon, Francois and Luis A. Pereira da Silva (editors), The Impact of Economic Policies on Poverty and Income Distribution: Evaluation Techniques and Tools, New York: World Bank and Oxford University Press.
Broda, Christian and David Weinstein, 2004. “Globalization and the Gains from Variety,” NBER Working Paper number 10314. www.nber.org/papers/w10314.
Ciccone, A. and R. Hall, 1996. “Productivity and the Density of Economic Activity,” American Economic Review, 86(1):54-70.
Daniels, P.W. 1985. Service Industries: A Geographical Appraisal, New York: Methuen & Co.
Ethier, W.J. 1982. “National and International Returns to Scale in the Modern Theory of International Trade,” American Economic Review, 72(2), 389-405.
Feenstra, R., D., Madani, T.H. Yang and C.Y. Liang, 1999. “Testing Endogenous Growth in South Korea and Taiwan,” Journal of Development Economics 60, 317-341.
Feenstra, Robert C. and Hiau Looi Kee, 2004. “On the Measurement of Product Variety in Trade," American Economic Review, 94(2), 145-149.
Findlay, Christopher and Tony Warren, eds. 2000. Impediments to Trade in Services: Measurement and Policy Implications, London: Routledge.
Fujita, Masahisa, Paul Krugman and Anthony J. Venables, 1999. The Spatial Economy: Cities, Regions, and International Trade, Cambridge: MIT Press.
Harrison, Glenn W, Thomas F. Rutherford and David G. Tarr. 1997a. “Economic Implications for Turkey of a Customs Union With the European Union,” European Economic Review, 41, 861-870.
Harrison, Glenn W, Thomas F. Rutherford and David G. Tarr. 1997b. "Quantifying the Uruguay Round," Economic Journal, 107 No. 444, September, 1405-1430.
Harrison, Glenn W, Thomas F. Rutherford and David G. Tarr. 1997c. “Trade Policy Options for Chile: A Quantitative Evaluation,” World Bank Policy and Research Working Paper No 1783. Also appeared in the World Bank Economic Review, Vol 16, Number 1, 2002.
Harrison, Glenn W, Thomas F. Rutherford and David G. Tarr. 2003. “Trade Liberalization, Poverty and Efficient Equity,” Journal of Development Economics, 71, June, 97-128.
Harrison, Glenn W, Thomas F. Rutherford, David G. Tarr and Angelo Gurgel, 2004. “Trade Policy and Poverty Reduction in Brazil,” World Bank Economic Review, 18, 289-317..
Hertel, Thomas and L. Alan Winters (eds.). forthcoming, Putting Development Back into the Doha Agenda: Poverty Impacts of a WTO Agreement
Hummels, David. 1995. “Global Income Clustering and Trade in Intermediate Goods,” Graduate School of Business, University of Chicago.

24
Hummels, David and Peter Klenow, 2002. “The Variety and Quality of a Nation’s Trade,” National Bureau of Economic Research Working Paper Number 8712.
Jensen, Jesper, and David G. Tarr. 2003. “Trade, Exchange Rate and Energy Pricing Reform in Iran: Potentially Large Efficiency Effects and Gains to the Poor,” Review of Development Economics, 7(4), November, 543-662.
Jensen, Jesper, Thomas F. Rutherford and David G. Tarr. 2004. “The Impact of Liberalizing Barriers to Foreign Direct Investment in Services: The Case of Russian Accession to the World Trade Organization,” June. Available at www.worldbank.org/trade/russia-wto.
Markusen, James, Thomas Rutherford and David Tarr. Forthcoming. “Foreign Direct Investment in Services and the Domestic Market for Expertise,” Canadian Journal of Economics. Available as Policy and Research Working Paper No. 2143, The World Bank, at www.worldbank.org/trade.
Marshall, J.N. 1988. Services and Uneven Development, London: Oxford University Press.
McKee, D.L. 1988. Growth, Development, and the Service Economy in the Third World, New York: Praeger Publishers.
Melo, Jaime de and David G. Tarr. 1992. A General Equilibrium Analysis of US Foreign Trade Policy, Cambridge, MA.: MIT Press.
Romer, Paul. 1994. “New Goods, Old Theory and the Welfare Costs of Trade Restrictions,” Journal of Development Economics,” 43(1), February, 5-38.
Rutherford, Thomas F. 1999. “Applied General Equilibrium Modeling with MPSGE as a GAMS Subsystem: An Overview of the Modeling Framework and Syntax,” Computational Economics, 14 (1/2), October, 1-46.
Rutherford, Thomas F. and David G. Tarr. 2002. “Trade Liberalization, product variety and growth in a small open economy: a quantitative assessment,” Journal of International Economics, 56 (2), March, 247-272.
Rutherford, Thomas F., David G. Tarr and Oleksandr Shepotylo. 2004. “Poverty Effects of Russia’s WTO Accession: modeling “real” households and endogenous productivity effects. Available at www.worldbank.org/trade/russia-wto.
Schott, Peter. Forthcoming. “Across-Product versus Within-Product Specialization in International Trade,” Quarterly Journal of Economics.
Tybout, James and Daniel Westbrook. 1995. “Trade Liberalization and the Dimensions of Efficiency Change in Mexican Manufacturing Industries,” Journal of International Economics, 39, 53-78.
Winters, L. Alan, Neil McCulloch and Andrew McKay. 2004. “Trade Liberalization and Poverty: The Evidence So Far,” Journal of Economic Literature 42, March, 72-115.

25
Share Intensityb/ Share Intensityc/Unskilled Labor %
Skilled Labor %
Capital %
Sectors 100.0 21 63 16Business Services:
Railway transportation 0 1 0 1 3.3 11 85 5Truck transportation 1 4 0 1 1.5 8 88 4Pipelines transportation 1 2 0 0 3.6 11 58 31Maritime transportation 2 52 1 56 0.3 14 81 5Air transportation 0 8 2 39 0.6 14 84 2Other transportation 0 2 0 3 1.1 9 85 6Telecommunications 1 11 0 5 1.2 16 79 5Financial services 0 3 0 2 1.5 10 86 4Science & science servicing 0 5 0 6 0.8 35 61 4
Subtotal: 5 3 13.9Differentiated Goods:
Ferrous metallurgy 4 18 10 37 1.9 9 85 7Non-ferrous metallurgy 2 16 17 55 2.3 12 81 7Chemical & oil-chemical industry 7 29 8 33 1.8 20 74 7Mechanical engineering & metal-working 27 36 9 17 5.2 30 66 4Timber & woodworking & pulp & paper industry 2 17 5 31 1.4 17 79 5Construction materials industry 1 8 0 2 1.6 19 75 5Light industry 17 69 1 13 0.7 63 32 5Food industry 21 30 3 6 3.3 17 76 7Other industries 1 13 0 5 0.6 22 76 3
Subtotal: 82 53 18.8Extractive Industries:
Oil extraction 1 8 18 70 2.9 1 12 87Gas 0 1 15 26 0.9 1 10 89Coalmining 0 5 1 10 1.1 2 52 47
Subtotal: 1 34 4.9Constant Returns Industries:
Electric industry 0 0 0 1 3.6 9 84 6Oil processing 1 7 6 18 0.8 3 89 8Other fuel industries 0 0 0 3 0.0 49 33 18Construction 2 3 0 0 8.6 10 86 4Agriculture & forestry 3 4 0 1 7.6 47 31 22Post 0 4 0 9 0.3 15 78 7Trade 2 2 1 1 22.9 20 53 27Public catering 0 1 0 2 0.1 19 81 1Other goods-producing sectors 1 16 0 0 0.8 23 76 1Communal & consumer services 0 0 0 0 5.6 19 72 9Public health & sports & social security 0 0 0 0 3.1 44 52 4Education & culture & art 0 1 0 0 4.0 56 40 4Geology & hydrometeorology 0 0 0 0 0.2 45 52 3Administration & public associations 0 0 0 0 4.8 22 76 1
Subtotal: 9 7 62.3a/ Due to rounding, the sum of shares as a percentage does not alwa ys equal 100.b/ Share is sector imports as a percentage of economy -wide imports. Intensity is sector imports as a percentage of sec tor consumption.-c/ Share is defined analogous to imports. Intensity is sector expor ts as a percentage of sector output.d/ After reconciliation with the Household Budget Survey.
Table 1. Structure of Value Added, Factor Shares, Imports and Exports in Russiaa/
Value Added (%)
Factor Shares as Percent of Value Added d/Imports Exports
Share Intensityb/ Share Intensityc/Unskilled Labor %
Skilled Labor %
Capital %
Sectors 100.0 21 63 16Business Services:
Railway transportation 0 1 0 1 3.3 11 85 5Truck transportation 1 4 0 1 1.5 8 88 4Pipelines transportation 1 2 0 0 3.6 11 58 31Maritime transportation 2 52 1 56 0.3 14 81 5Air transportation 0 8 2 39 0.6 14 84 2Other transportation 0 2 0 3 1.1 9 85 6Telecommunications 1 11 0 5 1.2 16 79 5Financial services 0 3 0 2 1.5 10 86 4Science & science servicing 0 5 0 6 0.8 35 61 4
Subtotal: 5 3 13.9Differentiated Goods:
Ferrous metallurgy 4 18 10 37 1.9 9 85 7Non-ferrous metallurgy 2 16 17 55 2.3 12 81 7Chemical & oil-chemical industry 7 29 8 33 1.8 20 74 7Mechanical engineering & metal-working 27 36 9 17 5.2 30 66 4Timber & woodworking & pulp & paper industry 2 17 5 31 1.4 17 79 5Construction materials industry 1 8 0 2 1.6 19 75 5Light industry 17 69 1 13 0.7 63 32 5Food industry 21 30 3 6 3.3 17 76 7Other industries 1 13 0 5 0.6 22 76 3
Subtotal: 82 53 18.8Extractive Industries:
Oil extraction 1 8 18
Share Intensityb/ Share Intensityc/Unskilled Labor %
Skilled Labor %
Capital %
Sectors 100.0 21 63 16Business Services:
Railway transportation 0 1 0 1 3.3 11 85 5Truck transportation 1 4 0 1 1.5 8 88 4Pipelines transportation 1 2 0 0 3.6 11 58 31Maritime transportation 2 52 1 56 0.3 14 81 5Air transportation 0 8 2 39 0.6 14 84 2Other transportation 0 2 0 3 1.1 9 85 6Telecommunications 1 11 0 5 1.2 16 79 5Financial services 0 3 0 2 1.5 10 86 4Science & science servicing 0 5 0 6 0.8 35 61 4
Subtotal: 5 3 13.9Differentiated Goods:
Ferrous metallurgy 4 18 10 37 1.9 9 85 7Non-ferrous metallurgy 2 16 17 55 2.3 12 81 7Chemical & oil-chemical industry 7 29 8 33 1.8 20 74 7Mechanical engineering & metal-working 27 36 9 17 5.2 30 66 4Timber & woodworking & pulp & paper industry 2 17 5 31 1.4 17 79 5Construction materials industry 1 8 0 2 1.6 19 75 5Light industry 17 69 1 13 0.7 63 32 5Food industry 21 30 3
Added (%)
Factor Shares as Percent of Value Added d/Imports Exports
Share Intensityb/ Share Intensityc/Unskilled Labor %
Skilled Labor %
Capital %
Sectors 100.0 21 63 16Business Services:
Railway transportation 0 1 0 1 3.3 11 85 5Truck transportation 1 4 0 1 1.5 8 88 4Pipelines transportation 1 2 0 0 3.6 11 58 31Maritime transportation 2 52 1 56 0.3 14 81 5Air transportation 0 8 2 39 0.6 14 84 2Other transportation 0 2 0 3 1.1 9 85 6Telecommunications 1 11 0 5 1.2 16 79 5Financial services 0 3 0 2 1.5 10 86 4Science & science servicing 0 5 0 6 0.8 35 61 4
Subtotal: 5 3 13.9Differentiated Goods:
Ferrous metallurgy 4 18 10 37 1.9 9 85 7Non-ferrous metallurgy 2 16 17 55 2.3 12 81 7Chemical & oil-chemical industry 7 29 8 33 1.8 20 74 7Mechanical engineering & metal-working 27 36 9 17 5.2 30 66 4Timber & woodworking & pulp & paper industry 2 17 5 31 1.4 17 79 5Construction materials industry 1 8 0 2 1.6 19 75 5Light industry 17 69 1 13 0.7 63 32 5Food industry 21 30 3 6 3.3 17 76 7Other industries 1 13 0 5 0.6 22 76 3
Subtotal: 82 53
Share Intensityb/ Share Intensityc/Unskilled Labor %
Skilled Labor %
Capital %
Sectors 100.0 21 63 16Business Services:
Railway transportation 0 1 0 1 3.3 11 85 5Truck transportation 1 4 0 1 1.5 8 88 4Pipelines transportation 1 2 0 0 3.6 11 58 31Maritime transportation 2 52 1 56 0.3 14 81 5Air transportation 0 8 2 39 0.6 14 84 2Other transportation 0 2 0 3 1.1 9 85 6Telecommunications 1 11 0 5 1.2 16 79 5Financial services 0 3 0 2 1.5 10 86 4Science & science servicing 0 5 0 6 0.8 35 61 4
Subtotal: 5 3 13.9Differentiated Goods:
Ferrous metallurgy 4 18 10 37 1.9 9 85 7Non-ferrous metallurgy 2 16 17 55 2.3 12 81 7Chemical & oil-chemical industry 7 29 8 33 1.8 20 74 7Mechanical engineering & metal-working 27 36 9 17 5.2 30 66 4Timber & woodworking & pulp & paper industry 2 17 5 31 1.4 17 79 5Construction materials industry 1 8 0 2 1.6 19 75 5Light industry 17 69 1 13 0.7 63 32 5Food industry 21 30 3 6 3.3 17 76 7Other industries 1 13 0 5 0.6 22 76 3
Subtotal: 82 53 18.8Extractive Industries:
Oil extraction 1 8 18 70 2.9 1 12 87Gas 0 1 15 26 0.9 1 10 89Coalmining 0 5 1 10 1.1 2 52 47
Subtotal: 1 34 4.9Constant Returns Industries:
Electric industry 0 0 0 1 3.6 9 84 6Oil processing 1 7 6 18 0.8 3 89 8Other fuel industries 0 0 0 3 0.0 49 33 18Construction 2 3 0 0 8.6 10 86 4Agriculture & forestry 3 4 0 1 7.6 47 31 22Post 0 4 0 9 0.3 15 78 7Trade 2 2 1 1 22.9 20 53 27Public catering 0 1 0 2 0.1 19 81 1Other goods-producing sectors 1 16 0 0 0.8 23 76 1Communal & consumer services 0 0 0 0 5.6 19 72 9Public health & sports & social security 0 0 0 0 3.1 44 52 4Education & culture & art 0 1 0 0 4.0 56 40 4Geology & hydrometeorology 0 0 0 0 0.2 45 52 3Administration & public associations 0 0 0 0 4.8 22 76 1
Subtotal: 9 7 62.3a/ Due to rounding, the sum of shares as a percentage does not alwa ys equal 100.b/ Share is sector imports as a percentage of economy -wide imports. Intensity is sector imports as a percentage of sec tor consumption.-c/ Share is defined analogous to imports. Intensity is sector expor ts as a percentage of sector output.d/ After reconciliation with the Household Budget Survey.
a/
Value Added (%)
Factor Shares as Percent of Value Added d/Imports Exports
Share Intensityb/ Share Intensityc/Unskilled Labor %
Skilled Labor %
Capital %
Sectors 100.0 21 63 16Business Services:
Railway transportation 0 1 0 1 3.3 11 85 5Truck transportation 1 4 0 1 1.5 8 88 4Pipelines transportation 1 2 0 0 3.6 11 58 31Maritime transportation 2 52 1 56 0.3 14 81 5Air transportation 0 8 2 39 0.6 14 84 2Other transportation 0 2 0 3 1.1 9 85 6Telecommunications 1 11 0 5 1.2 16 79 5Financial services 0 3 0 2 1.5 10 86 4Science & science servicing 0 5 0 6 0.8 35 61 4
Subtotal: 5 3 13.9Differentiated Goods:
Ferrous metallurgy 4 18 10 37 1.9 9 85 7Non-ferrous metallurgy 2 16 17 55 2.3 12 81 7Chemical & oil-chemical industry 7 29 8 33 1.8 20 74 7Mechanical engineering & metal-working 27 36 9 17 5.2 30 66 4Timber & woodworking & pulp & paper industry 2 17 5 31 1.4 17 79 5Construction materials industry 1 8 0 2 1.6 19 75 5Light industry 17 69 1 13 0.7 63 32 5Food industry 21 30 3 6 3.3 17 76 7
Share Intensityb/ Share Intensityc/Unskilled Labor %
Skilled Labor %
Capital %
Sectors 100.0 21 63 16Business Services:
Railway transportation 0 1 0 1 3.3 11 85 5Truck transportation 1 4 0 1 1.5 8 88 4Pipelines transportation 1 2 0 0 3.6 11 58 31Maritime transportation 2 52 1 56 0.3 14 81 5Air transportation 0 8 2 39 0.6 14 84 2Other transportation 0 2 0 3 1.1 9 85 6Telecommunications 1 11 0 5 1.2 16 79 5Financial services 0 3 0 2 1.5 10 86 4Science & science servicing 0 5 0 6 0.8 35 61 4
Subtotal: 5 3 13.9Differentiated Goods:
Ferrous metallurgy 4 18 10 37 1.9 9 85 7Non-ferrous metallurgy 2 16 17 55 2.3 12 81 7Chemical & oil-chemical industry 7 29 8 33 1.8 20 74 7Mechanical engineering & metal-working 27 36 9 17 5.2 30 66 4Timber & woodworking & pulp & paper industry 2 17 5 31 1.4 17 79 5Construction materials industry 1 8 0 2 1.6 19 75 5Light industry 17 69 1 13 0.7 63 32 5Food industry 21 30 3 6 3.3 17 76 7Other industries 1 13 0 5 0.6 22 76 3
Subtotal: 82 53 18.8Extractive Industries:
Oil extraction 1 8 18
Share Intensityb/ Share Intensityc/Unskilled Labor %
Skilled Labor %
Capital %
Sectors 100.0 21 63 16Business Services:
Railway transportation 0 1 0 1 3.3 11 85 5Truck transportation 1 4 0 1 1.5 8 88 4Pipelines transportation 1 2 0 0 3.6 11 58 31Maritime transportation 2 52 1 56 0.3 14 81 5Air transportation 0 8 2 39 0.6 14 84 2Other transportation 0 2 0 3 1.1 9 85 6Telecommunications 1 11 0 5 1.2 16 79 5Financial services 0 3 0 2 1.5 10 86 4Science & science servicing 0 5 0 6 0.8 35 61 4
Subtotal: 5 3 13.9Differentiated Goods:
Ferrous metallurgy 4 18 10 37 1.9 9 85 7Non-ferrous metallurgy 2 16 17 55 2.3 12 81 7Chemical & oil-chemical industry 7 29 8 33 1.8 20 74 7Mechanical engineering & metal-working 27 36 9 17 5.2 30 66 4Timber & woodworking & pulp & paper industry 2 17 5 31 1.4 17 79 5Construction materials industry 1 8 0 2 1.6 19 75 5Light industry 17 69 1 13 0.7 63 32 5Food industry 21 30 3Other industries 1 13 0 5 0.6 22 76 3
Subtotal: 82 53 18.8Extractive Industries:
Oil extraction 1 8 18
Share Intensityb/ Share Intensityc/Unskilled Labor %
Skilled Labor %
Capital %
Sectors 100.0 21 63 16Business Services:
Railway transportation 0 1 0 1 3.3 11 85 5Truck transportation 1 4 0 1 1.5 8 88 4Pipelines transportation 1 2 0 0 3.6 11 58 31Maritime transportation 2 52 1 56 0.3 14 81 5Air transportation 0 8 2 39 0.6 14 84 2Other transportation 0 2 0 3 1.1 9 85 6Telecommunications 1 11 0 5 1.2 16 79 5Financial services 0 3 0 2 1.5 10 86 4Science & science servicing 0 5 0 6 0.8 35 61 4
Subtotal: 5 3 13.9Differentiated Goods:
Ferrous metallurgy 4 18 10 37 1.9 9 85 7Non-ferrous metallurgy 2 16 17 55 2.3 12 81 7Chemical & oil-chemical industry 7 29 8 33 1.8 20 74 7Mechanical engineering & metal-working 27 36 9 17 5.2 30 66 4Timber & woodworking & pulp & paper industry 2 17 5 31 1.4 17 79 5Construction materials industry 1 8 0 2 1.6 19 75 5Light industry 17 69 1 13 0.7 63 32 5Food industry 21 30 3
Added (%)
Factor Shares as Percent of Value Added d/Imports Exports
Share Intensityb/ Share Intensityc/Unskilled Labor %
Skilled Labor %
Capital %
Sectors 100.0 21 63 16Business Services:
Railway transportation 0 1 0 1 3.3 11 85 5Truck transportation 1 4 0 1 1.5 8 88 4Pipelines transportation 1 2 0 0 3.6 11 58 31Maritime transportation 2 52 1 56 0.3 14 81 5Air transportation 0 8 2 39 0.6 14 84 2Other transportation 0 2 0 3 1.1 9 85 6Telecommunications 1 11 0 5 1.2 16 79 5Financial services 0 3 0 2 1.5 10 86 4Science & science servicing 0 5 0 6 0.8 35 61 4
Subtotal: 5 3 13.9Differentiated Goods:
Ferrous metallurgy 4 18 10 37 1.9 9 85 7Non-ferrous metallurgy 2 16 17 55 2.3 12 81 7Chemical & oil-chemical industry 7 29 8 33 1.8 20 74 7Mechanical engineering & metal-working 27 36 9 17 5.2 30 66 4Timber & woodworking & pulp & paper industry 2 17 5 31 1.4 17 79 5Construction materials industry 1 8 0 2 1.6 19 75 5Light industry 17 69 1 13 0.7 63 32 5Food industry 21 30 3 6 3.3 17 76 7Other industries 1 13 0 5 0.6 22 76 3
Subtotal: 82 53 18.8
Share Intensityb/ Share Intensityc/Unskilled Labor %
Skilled Labor %
Capital %
Sectors 100.0 21 63 16Business Services:
Railway transportation 0 1 0 1 3.3 11 85 5Truck transportation 1 4 0 1 1.5 8 88 4Pipelines transportation 1 2 0 0 3.6 11 58 31Maritime transportation 2 52 1 56 0.3 14 81 5Air transportation 0 8 2 39 0.6 14 84 2Other transportation 0 2 0 3 1.1 9 85 6Telecommunications 1 11 0 5 1.2 16 79 5Financial services 0 3 0 2 1.5 10 86 4Science & science servicing 0 5 0 6 0.8 35 61 4
Subtotal: 5 3 13.9Differentiated Goods:
Ferrous metallurgy 4 18 10 37 1.9 9 85 7Non-ferrous metallurgy 2 16 17 55 2.3 12 81 7Chemical & oil-chemical industry 7 29 8 33 1.8 20 74 7Mechanical engineering & metal-working 27 36 9 17 5.2 30 66 4Timber & woodworking & pulp & paper industry 2 17 5 31 1.4 17 79 5Construction materials industry 1 8 0 2 1.6 19 75 5Light industry 17 69 1 13 0.7 63 32 5Food industry 21 30 3 6 3.3 17 76 7Other industries 1 13 0 5 0.6 22 76 3
Subtotal: 82 53 18.8Extractive Industries:
Oil extraction 1 8 18 70 2.9 1 12 87Gas 0 1 15 26 0.9 1 10 89Coalmining 0 5 1 10 1.1 2 52 47
Subtotal: 1 34 4.9Constant Returns Industries:
Electric industry 0 0 0 1 3.6 9 84 6Oil processing 1 7 6 18 0.8 3 89 8Other fuel industries 0 0 0 3 0.0 49 33 18Construction 2 3 0 0 8.6 10 86 4Agriculture & forestry 3 4 0 1 7.6 47 31 22Post 0 4 0 9 0.3 15 78 7Trade 2 2 1 1 22.9 20 53 27Public catering 0 1 0 2 0.1 19 81 1Other goods-producing sectors 1 16 0 0 0.8 23 76 1Communal & consumer services 0 0 0 0 5.6 19 72 9Public health & sports & social security 0 0 0 0 3.1 44 52 4Education & culture & art 0 1 0 0 4.0 56 40 4Geology & hydrometeorology 0 0 0 0 0.2 45 52 3Administration & public associations 0 0 0 0 4.8 22 76 1
Subtotal: 9 7 62.3a/ Due to rounding, the sum of shares as a percentage does not alwa ys equal 100.b/ Share is sector imports as a percentage of economy -wide imports. Intensity is sector imports as a percentage of sec tor consumption.-c/ Share is defined analogous to imports. Intensity is sector expor ts as a percentage of sector output.d/ After reconciliation with the Household Budget Survey.
Table 1. Structure of Value Added, Factor Shares, Imports and Exports in Russiaa/
Value Added (%)
Factor Shares as Percent of Value Added d/Imports Exports
Extractive Industries:Oil extraction 1 8 18 70 2.9 1 12 87Gas 0 1 15 26 0.9 1 10 89Coalmining 0 5 1 10 1.1 2 52 47
Subtotal: 1 34 4.9Constant Returns Industries:
Electric industry 0 0 0 1 3.6 9 84 6Oil processing 1 7 6 18 0.8 3 89 8Other fuel industries 0 0 0 3 0.0 49 33 18Construction 2 3 0 0 8.6 10 86 4Agriculture & forestry 3 4 0 1 7.6 47 31 22Post 0 4 0 9 0.3 15 78 7Trade 2 2 1 1 22.9 20 53 27Public catering 0 1 0 2 0.1 19 81 1Other goods-producing sectors 1 16 0 0 0.8 23 76 1Communal & consumer services 0 0 0 0 5.6 19 72 9Public health & sports & social security 0 0 0 0 3.1 44 52 4Education & culture & art 0 1 0 0 4.0 56 40 4Geology & hydrometeorology 0 0 0 0 0.2 45 52 3Administration & public associations 0 0 0 0 4.8 22 76 1
Subtotal: 9 7 62.3a/ Due to rounding, the sum of shares as a percentage does not alwa ys equal 100.b/ Share is sector imports as a percentage of economy -wide imports. Intensity is sector imports as a percentage of sec tor consumption.-c/ Share is defined analogous to imports. Intensity is sector expor ts as a percentage of sector output.d/ After reconciliation with the Household Budget Survey.
Table 1. Structure of Value Added, Factor Shares, Imports and Exports in Russiaa/
Value Added (%)
Factor Shares as Percent of Value Added d/Imports Exports
Share Intensityb/ Share Intensityc/Unskilled Labor %
Skilled Labor %
Capital %
Sectors 100.0 21 63 16Business Services:
Railway transportation 0 1 0 1 3.3 11 85 5Truck transportation 1 4 0 1 1.5 8 88 4Pipelines transportation 1 2 0 0 3.6 11 58 31Maritime transportation 2 52 1 56 0.3 14 81 5Air transportation 0 8 2 39 0.6 14 84 2Other transportation 0 2 0 3 1.1 9 85 6Telecommunications 1 11 0 5 1.2 16 79 5Financial services 0 3 0 2 1.5 10 86 4Science & science servicing 0 5 0 6 0.8 35 61 4
Subtotal: 5 3 13.9Differentiated Goods:
Ferrous metallurgy 4 18 10 37 1.9 9 85 7Non-ferrous metallurgy 2 16 17 55 2.3 12 81 7Chemical & oil-chemical industry 7 29 8 33 1.8 20 74 7Mechanical engineering & metal-working 27 36 9 17 5.2 30 66 4Timber & woodworking & pulp & paper industry 2 17 5 31 1.4 17 79 5Construction materials industry 1 8 0 2 1.6 19 75 5Light industry 17 69 1 13 0.7 63 32 5Food industry 21 30 3 6 3.3 17 76 7
Share Intensityb/ Share Intensityc/Unskilled Labor %
Skilled Labor %
Capital %
Sectors 100.0 21 63 16Business Services:
Railway transportation 0 1 0 1 3.3 11 85 5Truck transportation 1 4 0 1 1.5 8 88 4Pipelines transportation 1 2 0 0 3.6 11 58 31Maritime transportation 2 52 1 56 0.3 14 81 5Air transportation 0 8 2 39 0.6 14 84 2Other transportation 0 2 0 3 1.1 9 85 6Telecommunications 1 11 0 5 1.2 16 79 5Financial services 0 3 0 2 1.5 10 86 4Science & science servicing 0 5 0 6 0.8 35 61 4
Subtotal: 5 3 13.9Differentiated Goods:
Ferrous metallurgy 4 18 10 37 1.9 9 85 7Non-ferrous metallurgy 2 16 17 55 2.3 12 81 7Chemical & oil-chemical industry 7 29 8 33 1.8 20 74 7Mechanical engineering & metal-working 27 36 9 17 5.2 30 66 4Timber & woodworking & pulp & paper industry 2 17 5 31 1.4 17 79 5Construction materials industry 1 8 0 2 1.6 19 75 5Light industry 17 69 1 13 0.7 63 32 5Food industry 21 30 3 6 3.3 17 76 7Other industries 1 13 0 5 0.6 22 76 3
Subtotal: 82 53 18.8Extractive Industries:
Oil extraction 1 8 18
Share Intensityb/ Share Intensityc/Unskilled Labor %
Skilled Labor %
Capital %
Sectors 100.0 21 63 16Business Services:
Railway transportation 0 1 0 1 3.3 11 85 5Truck transportation 1 4 0 1 1.5 8 88 4Pipelines transportation 1 2 0 0 3.6 11 58 31Maritime transportation 2 52 1 56 0.3 14 81 5Air transportation 0 8 2 39 0.6 14 84 2Other transportation 0 2 0 3 1.1 9 85 6Telecommunications 1 11 0 5 1.2 16 79 5Financial services 0 3 0 2 1.5 10 86 4Science & science servicing 0 5 0 6 0.8 35 61 4
Subtotal: 5 3 13.9Differentiated Goods:
Ferrous metallurgy 4 18 10 37 1.9 9 85 7Non-ferrous metallurgy 2 16 17 55 2.3 12 81 7Chemical & oil-chemical industry 7 29 8 33 1.8 20 74 7Mechanical engineering & metal-working 27 36 9 17 5.2 30 66 4Timber & woodworking & pulp & paper industry 2 17 5 31 1.4 17 79 5Construction materials industry 1 8 0 2 1.6 19 75 5Light industry 17 69 1 13 0.7 63 32 5Food industry 21 30 3Other industries 1 13 0 5 0.6 22 76 3
Subtotal: 82 53 18.8Extractive Industries:
Oil extraction 1 8 18
Share Intensityb/ Share Intensityc/Unskilled Labor %
Skilled Labor %
Capital %
Sectors 100.0 21 63 16Business Services:
Railway transportation 0 1 0 1 3.3 11 85 5Truck transportation 1 4 0 1 1.5 8 88 4Pipelines transportation 1 2 0 0 3.6 11 58 31Maritime transportation 2 52 1 56 0.3 14 81 5Air transportation 0 8 2 39 0.6 14 84 2Other transportation 0 2 0 3 1.1 9 85 6Telecommunications 1 11 0 5 1.2 16 79 5Financial services 0 3 0 2 1.5 10 86 4Science & science servicing 0 5 0 6 0.8 35 61 4
Subtotal: 5 3 13.9Differentiated Goods:
Ferrous metallurgy 4 18 10 37 1.9 9 85 7Non-ferrous metallurgy 2 16 17 55 2.3 12 81 7Chemical & oil-chemical industry 7 29 8 33 1.8 20 74 7Mechanical engineering & metal-working 27 36 9 17 5.2 30 66 4Timber & woodworking & pulp & paper industry 2 17 5 31 1.4 17 79 5Construction materials industry 1 8 0 2 1.6 19 75 5Light industry 17 69 1 13 0.7 63 32 5Food industry 21 30 3
Added (%)
Factor Shares as Percent of Value Added d/Imports Exports
Share Intensityb/ Share Intensityc/Unskilled Labor %
Skilled Labor %
Capital %
Sectors 100.0 21 63 16Business Services:
Railway transportation 0 1 0 1 3.3 11 85 5Truck transportation 1 4 0 1 1.5 8 88 4Pipelines transportation 1 2 0 0 3.6 11 58 31Maritime transportation 2 52 1 56 0.3 14 81 5Air transportation 0 8 2 39 0.6 14 84 2Other transportation 0 2 0 3 1.1 9 85 6Telecommunications 1 11 0 5 1.2 16 79 5Financial services 0 3 0 2 1.5 10 86 4Science & science servicing 0 5 0 6 0.8 35 61 4
Subtotal: 5 3 13.9Differentiated Goods:
Ferrous metallurgy 4 18 10 37 1.9 9 85 7Non-ferrous metallurgy 2 16 17 55 2.3 12 81 7Chemical & oil-chemical industry 7 29 8 33 1.8 20 74 7Mechanical engineering & metal-working 27 36 9 17 5.2 30 66 4Timber & woodworking & pulp & paper industry 2 17 5 31 1.4 17 79 5Construction materials industry 1 8 0 2 1.6 19 75 5Light industry
Added (%)
Factor Shares as Percent of Value Added d/Imports Exports
Share Intensityb/ Share Intensityc/Unskilled Labor %
Skilled Labor %
Capital %
Sectors 100.0 21 63 16Business Services:
Railway transportation 0 1 0 1 3.3 11 85 5Truck transportation 1 4 0 1 1.5 8 88 4Pipelines transportation 1 2 0 0 3.6 11 58 31Maritime transportation 2 52 1 56 0.3 14 81 5Air transportation 0 8 2 39 0.6 14 84 2Other transportation 0 2 0 3 1.1 9 85 6Telecommunications 1 11 0 5 1.2 16 79 5Financial services 0 3 0 2 1.5 10 86 4Science & science servicing 0 5 0 6 0.8 35 61 4
Subtotal: 5 3 13.9Differentiated Goods:
Ferrous metallurgy 4 18 10 37 1.9 9 85 7Non-ferrous metallurgy 2 16 17 55 2.3 12 81 7Chemical & oil-chemical industry 7 29 8 33 1.8 20 74 7Mechanical engineering & metal-working 27 36 9 17 5.2 30 66 4Timber & woodworking & pulp & paper industry 2 17 5 31 1.4 17 79 5Construction materials industry 1 8 0 2 1.6 19 75 5Light industry 17 69 1 13 0.7 63 32 5Food industry 21 30 3 6 3.3 17 76 7Other industries 1 13 0 5 0.6 22 76 3
Subtotal: 82 53
Share Intensityb/ Share Intensityc/Unskilled Labor %
Skilled Labor %
Capital %
Sectors 100.0 21 63 16Business Services:
Railway transportation 0 1 0 1 3.3 11 85 5Truck transportation 1 4 0 1 1.5 8 88 4Pipelines transportation 1 2 0 0 3.6 11 58 31Maritime transportation 2 52 1 56 0.3 14 81 5Air transportation 0 8 2 39 0.6 14 84 2Other transportation 0 2 0 3 1.1 9 85 6Telecommunications 1 11 0 5 1.2 16 79 5Financial services 0 3 0 2 1.5 10 86 4Science & science servicing 0 5 0 6 0.8 35 61 4
Subtotal: 5 3 13.9Differentiated Goods:
Ferrous metallurgy 4 18 10 37 1.9 9 85 7Non-ferrous metallurgy 2 16 17 55 2.3 12 81 7Chemical & oil-chemical industry 7 29 8 33 1.8 20 74 7Mechanical engineering & metal-working 27 36 9 17 5.2 30 66 4Timber & woodworking & pulp & paper industry 2 17 5 31 1.4 17 79 5Construction materials industry 1 8 0 2 1.6 19 75 5Light industry 1717 69 1 13 0.7 63 32 5Food industry 21 30 3 6 3.3 17 76 7Other industries 1 13 0 5 0.6 22 76 3
Subtotal: 82 53
Share Intensityb/ Share Intensityc/Unskilled Labor %
Skilled Labor %
Capital %
Sectors 100.0 21 63 16Business Services:
Railway transportation 0 1 0 1 3.3 11 85 5Truck transportation 1 4 0 1 1.5 8 88 4Pipelines transportation 1 2 0 0 3.6 11 58 31Maritime transportation 2 52 1 56 0.3 14 81 5Air transportation 0 8 2 39 0.6 14 84 2Other transportation 0 2 0 3 1.1 9 85 6Telecommunications 1 11 0 5 1.2 16 79 5Financial services 0 3 0 2 1.5 10 86 4Science & science servicing 0 5 0 6 0.8 35 61 4
Subtotal: 5 3 13.9Differentiated Goods:
Ferrous metallurgy 4 18 10 37 1.9 9 85 7Non-ferrous metallurgy 2 16 17 55 2.3 12 81 7Chemical & oil-chemical industry 7 29 8 33 1.8 20 74 7Mechanical engineering & metal-working 27 36 9 17 5.2 30 66 4Timber & woodworking & pulp & paper industry 2 17 5 31 1.4 17 79 5Construction materials industry 1 8 0 2 1.6 19 75 5Light industry 17 69 1 13 0.7 63 32 5Food industry 21 30 3 6 3.3 17 76 7Other industries 1 13 0 5 0.6 22 76 3
Subtotal: 82 53 18.8Extractive Industries:
Oil extraction 1 8 18 70 2.9 1 12 87Gas 0 1 15 26 0.9 1 10 89Coalmining 0 5 1 10 1.1 2 52 47
Subtotal: 1 34 4.9Constant Returns Industries:
Electric industry 0 0 0 1 3.6 9 84 6Oil processing 1 7 6 18 0.8 3 89 8Other fuel industries 0 0 0 3 0.0 49 33 18Construction 2 3 0 0 8.6 10 86 4Agriculture & forestry 3 4 0 1 7.6 47 31 22Post 0 4 0 9 0.3 15 78 7Trade 2 2 1 1 22.9 20 53 27Public catering 0 1 0 2 0.1 19 81 1Other goods-producing sectors 1 16 0 0 0.8 23 76 1Communal & consumer services 0 0 0 0 5.6 19 72 9Public health & sports & social security 0 0 0 0 3.1 44 52 4Education & culture & art 0 1 0 0 4.0 56 40 4Geology & hydrometeorology 0 0 0 0 0.2 45 52 3Administration & public associations 0 0 0 0 4.8 22 76 1
Subtotal: 9 7 62.3a/ Due to rounding, the sum of shares as a percentage does not alwa ys equal 100.b/ Share is sector imports as a percentage of economy -
69 1 13 0.7 63 32 5Food industry 21 30 3 6 3.3 17 76 7Other industries 1 13 0 5 0.6 22 76 3
Subtotal: 82 53 18.8Extractive Industries:
Oil extraction 1 8 18 70 2.9 1 12 87Gas 0 1 15 26 0.9 1 10 89Coalmining 0 5 1 10 1.1 2 52 47
Subtotal: 1 34 4.9Constant Returns Industries:
Electric industry 0 0 0 1 3.6 9 84 6Oil processing 1 7 6 18 0.8 3 89 8Other fuel industries 0 0 0 3 0.0 49 33 18Construction 2 3 0 0 8.6 10 86 4Agriculture & forestry 3 4 0 1 7.6 47 31 22Post 0 4 0 9 0.3 15 78 7Trade 2 2 1 1 22.9 20 53 27Public catering 0 1 0 2 0.1 19 81 1Other goods-producing sectors 1 16 0 0 0.8 23 76 1Communal & consumer services 0 0 0 0 5.6 19 72 9Public health & sports & social security 0 0 0 0 3.1 44 52 4Education & culture & art 0 1 0 0 4.0 56 40 4Geology & hydrometeorology 0 0 0 0 0.2 45 52 3Administration & public associations 0 0 0 0 4.8 22 76 1
Subtotal: 9 7 62.3a/ Due to rounding, the sum of shares as a percentage does not alwa ys equal 100.b/ Share is sector imports as a percentage of economy -wide imports. Intensity is sector imports as a percentage of sec tor consumption.-c/ Share is defined analogous to imports. Intensity is sector expor ts as a percentage of sector output.d/ After reconciliation with the Household Budget Survey.
a/
Value Added (%)
Factor Shares as Percent of Value Added d/Imports Exports
Share Intensityb/ Share Intensityc/Unskilled Labor %
Skilled Labor %
Capital %
Sectors 100.0 21 63 16Business Services:
Railway transportation 0 1 0 1 3.3 11 85 5Truck transportation 1 4 0 1 1.5 8 88 4Pipelines transportation 1 2 0 0 3.6 11 58 31Maritime transportation 2 52 1 56 0.3 14 81 5Air transportation 0 8 2 39 0.6 14 84 2Other transportation 0 2 0 3 1.1 9 85 6Telecommunications 1 11 0 5 1.2 16 79 5Financial services 0 3 0 2 1.5 10 86 4Science & science servicing 0 5 0 6 0.8 35 61 4
Subtotal: 5 3 13.9Differentiated Goods:
Ferrous metallurgy 4 18 10 37 1.9 9 85 7Non-ferrous metallurgy 2 16 17 55 2.3 12 81 7Chemical & oil-chemical industry 7 29 8 33 1.8 20 74 7Mechanical engineering & metal-working 27 36 9 17 5.2 30 66 4Timber & woodworking & pulp & paper industry 2 17 5 31 1.4 17
wide imports. Intensity is sector imports as a percentage of sec tor consumption.-c/ Share is defined analogous to imports. Intensity is sector expor ts as a percentage of sector output.d/ After reconciliation with the Household Budget Survey.
a/
Value Added (%)
Factor Shares as Percent of Value Added d/Imports Exports
Share Intensityb/ Share Intensityc/Unskilled Labor %
Skilled Labor %
Capital %
Sectors 100.0 21 63 16Business Services:
Railway transportation 0 1 0 1 3.3 11 85 5Truck transportation 1 4 0 1 1.5 8 88 4Pipelines transportation 1 2 0 0 3.6 11 58 31Maritime transportation 2 52 1 56 0.3 14 81 5Air transportation 0 8 2 39 0.6 14 84 2Other transportation 0 2 0 3 1.1 9 85 6Telecommunications 1 11 0 5 1.2 16 79 5Financial services 0 3 0 2 1.5 10 86 4Science & science servicing 0 5 0 6 0.8 35 61 4
Subtotal: 5 3 13.9Differentiated Goods:
Ferrous metallurgy 4 18 10 37 1.9 9 85 7Non-ferrous metallurgy 2 16 17 55 2.3 12 81 7Chemical & oil-chemical industry 7 29 8 33 1.8 20 74 7Mechanical engineering & metal-working 27 36 9 17 5.2 30 66 4Timber & woodworking & pulp & paper industry 2 17 5 31 1.4 17 79 5Construction materials industry 1 8 0 2 1.6 19 75 5Light industry 17 69 1 13 0.7 63 32 5Food industry 21 30 3 6 3.3 17 76 7
Share Intensityb/ Share Intensityc/Unskilled Labor %
Skilled Labor %
Capital %
Sectors 100.0 21 63 16Business Services:
Railway transportation 0 1 0 1 3.3 11 85 5Truck transportation 1 4 0 1 1.5 8 88 4Pipelines transportation 1 2 0 0 3.6 11 58 31Maritime transportation 2 52 1 56 0.3 14 81 5Air transportation 0 8 2 39 0.6 14 84 2Other transportation 0 2 0 3 1.1 9 85 6Telecommunications 1 11 0 5 1.2 16 79 5Financial services 0 3 0 2 1.5 10 86 4Science & science servicing 0 5 0 6 0.8 35 61 4
Subtotal: 5 3 13.9Differentiated Goods:
Ferrous metallurgy 4 18 10 37 1.9 9 85 7Non-ferrous metallurgy 2 16 17 55 2.3 12 81 7Chemical & oil-chemical industry 7 29 8 33 1.8 20 74 7Mechanical engineering & metal-working 27 36 9 17 5.2 30 66 4Timber & woodworking & pulp & paper industry 2 17 5 31 1.4 17 79 5Construction materials industry 1 8 0 2 1.6 19 75 5Light industry 17 69 1 13 0.7 63 32 5Food industry 21 30 3 6 3.3 17 76 7Other industries 1 13 0 5 0.6 22 76 3
Subtotal: 82 53 18.8Extractive Industries:
Oil extraction 1 8 18
Share Intensityb/ Share Intensityc/Unskilled Labor %
Skilled Labor %
Capital %
Sectors 100.0 21 63 16Business Services:
Railway transportation 0 1 0 1 3.3 11 85 5Truck transportation 1 4 0 1 1.5 8 88 4Pipelines transportation 1 2 0 0 3.6 11 58 31Maritime transportation 2 52 1 56 0.3 14 81 5Air transportation 0 8 2 39 0.6 14 84 2Other transportation 0 2 0 3 1.1 9 85 6Telecommunications 1 11 0 5 1.2 16 79 5Financial services 0 3 0 2 1.5 10 86 4Science & science servicing 0 5 0 6 0.8 35 61 4
Subtotal: 5 3 13.9Differentiated Goods:
Ferrous metallurgy 4 18 10 37 1.9 9 85 7Non-ferrous metallurgy 2 16 17 55 2.3 12 81 7Chemical & oil-chemical industry 7 29 8 33 1.8 20 74 7Mechanical engineering & metal-working 27 36 9 17 5.2 30 66 4Timber & woodworking & pulp & paper industry 2 79 5Construction materials industry 1 8 0 2 1.6 19 75 5Light industry 17 69 1 13 0.7 63 32 5Food industry 21 30 3 6 3.3 17 76 7Other industries 1 13 0 5 0.6 22 76 3
Subtotal: 82 53 18.8Extractive Industries:
Oil extraction 1 8 18
Share Intensityb/ Share Intensityc/Unskilled Labor %
Skilled Labor %
Capital %
Sectors 100.0 21 63 16Business Services:
Railway transportation 0 1 0 1 3.3 11 85 5Truck transportation 1 4 0 1 1.5 8 88 4Pipelines transportation 1 2 0 0 3.6 11 58 31Maritime transportation 2 52 1 56 0.3 14 81 5Air transportation 0 8 2 39 0.6 14 84 2Other transportation 0 2 0 3 1.1 9 85 6Telecommunications 1 11 0 5 1.2 16 79 5Financial services 0 3 0 2 1.5 10 86 4Science & science servicing 0 5 0 6 0.8 35 61 4
Subtotal: 5 3 13.9Differentiated Goods:
Ferrous metallurgy 4 18 10 37 1.9 9 85 7Non-ferrous metallurgy 2 16 17 55 2.3 12 81 7Chemical & oil-chemical industry 7 29 8 33 1.8 20 74 7Mechanical engineering & metal-working 27 36 9 17 5.2 30 66 4Timber & woodworking & pulp & paper industry 2 17 5 31 1.4 17 79 5Construction materials industry 1 8 0 2 1.6 19 75 5Light industry 17 69 1 13 0.7 63 32 5Food industry 21 30 3Other industries 1 13 0 5 0.6 22 76 3
Subtotal: 82 53 18.8Extractive Industries:
Oil extraction 1 8 18
Share Intensityb/ Share Intensityc/Unskilled Labor %
Skilled Labor %
Capital %
Sectors 100.0 21 63 16Business Services:
Railway transportation 0 1 0 1 3.3 11 85 5Truck transportation 1 4 0 1 1.5 8 88 4Pipelines transportation 1 2 0 0 3.6 11 58 31Maritime transportation 2 52 1 56 0.3 14 81 5Air transportation 0 8 2 39 0.6 14 84 2Other transportation 0 2 0 3 1.1 9 85 6Telecommunications 1 11 0 5 1.2 16 79 5Financial services 0 3 0 2 1.5 10 86 4Science & science servicing 0 5 0 6 0.8 35 61 4
Subtotal: 5 3 13.9Differentiated Goods:
Ferrous metallurgy 4 18 10 37 1.9 9 85 7Non-ferrous metallurgy 2 16 17 55 2.3 12 81 7Chemical & oil-chemical industry 7 29 8 33 1.8 20 74 7Mechanical engineering & metal-working 27 36 9 17 5.2 30 66 4Timber & woodworking & pulp & paper industry 2 17 5 31 1.4 17 79 5Construction materials industry 1 8 0 2 1.6 19 75 5Light industry 17 69 1 13 0.7 63 32 5Food industry 21 30 3
Added (%)
Factor Shares as Percent of Value Added d/Imports Exports
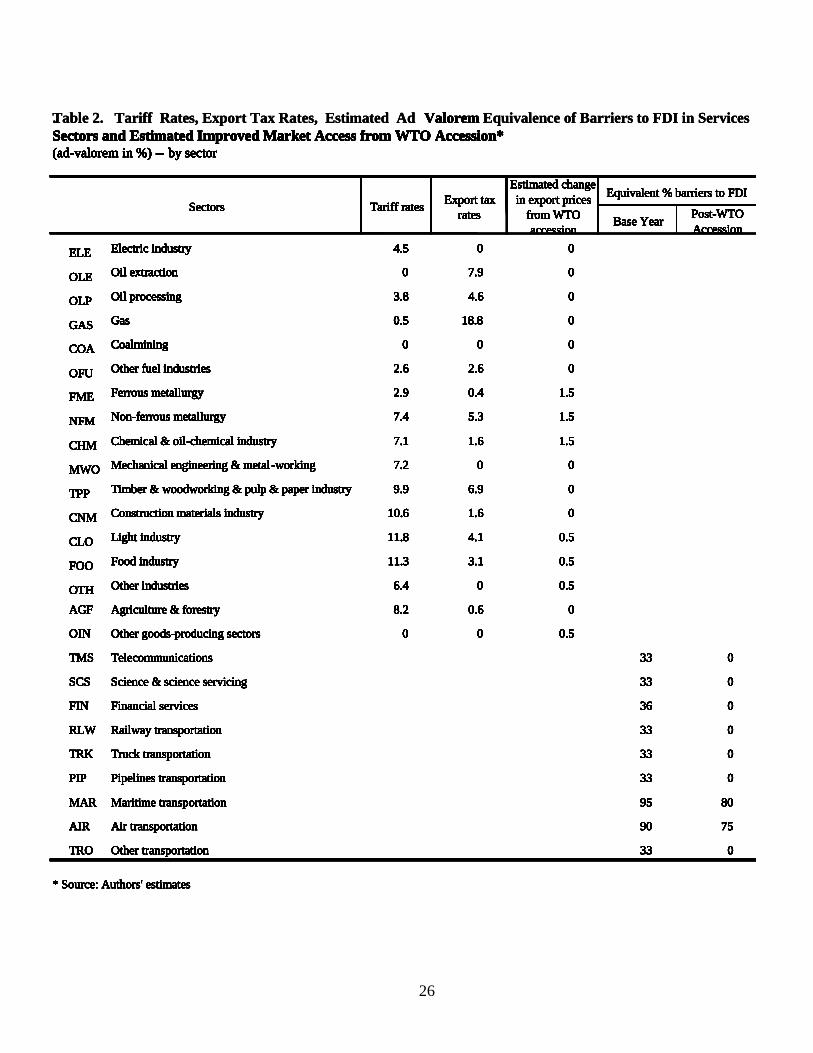
26
(ad-valorem in %) -- by sector
ELE Electric industry 4.5 0 0
OLE Oil extraction 0 7.9 0
OLP Oil processing 3.8 4.6 0
GAS Gas 0.5 18.8 0
COA Coalmining 0 0 0
OFU Other fuel industries 2.6 2.6 0
FME Ferrous metallurgy 2.9 0.4 1.5
NFM Non-ferrous metallurgy 7.4 5.3 1.5
CHM Chemical & oil-chemical industry 7.1 1.6 1.5
MWO Mechanical engineering & metal -working 7.2 0 0
TPP Timber & woodworking & pulp & paper industry 9.9 6.9 0
CNM Construction materials industry 10.6 1.6 0
CLO Light industry 11.8 4.1 0.5
FOO Food industry 11.3 3.1 0.5
OTH Other industries 6.4 0 0.5
AGF Agriculture & forestry 8.2 0.6 0
OIN Other goods-producing sectors 0 0 0.5
TMS Telecommunications 33 0
SCS Science & science servicing 33 0
FIN Financial services 36 0
RLW Railway transportation 33 0
TRK Truck transportation 33 0
PIP Pipelines transportation 33 0
MAR Maritime transportation 95 80
AIR Air transportation 90 75
TRO Other transportation 33 0
* Source: Authors' estimates
Table 2. Tariff Rates, Export Tax Rates, Estimated Ad Valorem Equivalence of Barriers to FDI in Services Sectors and Estimated Improved Market Access from WTO Accession*
SectorsEquivalent % barriers to FDI
Base Year Post-WTO Accession
Tariff rates Export tax rates
Estimated change in export prices
from WTO accession
(ad-valorem in %) -- by sector
ELE Electric industry 4.5 0 0
OLE Oil extraction 0 7.9 0
OLP Oil processing 3.8 4.6 0
GAS Gas 0.5 18.8 0
COA Coalmining 0 0 0
OFU Other fuel industries 2.6 2.6 0
FME Ferrous metallurgy 2.9 0.4 1.5
NFM Non-ferrous metallurgy 7.4 5.3 1.5
CHM Chemical & oil-chemical industry 7.1 1.6 1.5
MWO Mechanical engineering & metal -working 7.2 0 0
TPP Timber & woodworking & pulp & paper industry 9.9 6.9 0
CNM Construction materials industry 10.6 1.6 0
CLO Light industry 11.8 4.1 0.5
FOO Food industry 11.3 3.1 0.5
OTH Other industries 6.4 0 0.5
AGF Agriculture & forestry 8.2 0.6 0
OIN Other goods-producing sectors 0 0 0.5
TMS Telecommunications 33 0
SCS Science & science servicing 33 0
FIN Financial services 36 0
RLW Railway transportation 33 0
TRK Truck transportation 33 0
PIP Pipelines transportation 33 0
MAR Maritime transportation 95 80
AIR Air transportation 90 75
TRO Other transportation 33 0
* Source: Authors' estimates
ValoremSectors and Estimated Improved Market Access from WTO Accession*
SectorsEquivalent % barriers to FDI
Base Year Post-WTO Accession
Tariff rates Export tax rates
Estimated change in export prices
from WTO accession
(ad-valorem in %) -- by sector
ELE Electric industry 4.5 0 0
OLE Oil extraction 0 7.9 0
OLP Oil processing 3.8 4.6 0
GAS Gas 0.5 18.8 0
COA Coalmining 0 0
(ad-valorem in %) -- by sector
ELE Electric industry 4.5 0 0
OLE Oil extraction 0 7.9 0
OLP Oil processing 3.8 4.6 0
GAS Gas 0.5 18.8 0
COA Coalmining 0 0 0
OFU Other fuel industries 2.6 2.6 0
FME Ferrous metallurgy 2.9 0.4 1.5
NFM Non-ferrous metallurgy 7.4 5.3 1.5
CHM Chemical & oil-chemical industry 7.1 1.6 1.5
MWO Mechanical engineering & metal -working 7.2 0 0
TPP Timber & woodworking & pulp & paper industry 9.9 6.9 0
CNM Construction materials industry 10.6 1.6 0
CLO Light industry 11.8 4.1 0.5
FOO Food industry 11.3 3.1 0.5
OTH Other industries 6.4 0 0.5
AGF Agriculture & forestry 8.2 0.6 0
OIN Other goods-producing sectors 0 0 0.5
TMS Telecommunications 33 0
SCS Science & science servicing 33 0
FIN Financial services 36 0
RLW Railway transportation 33 0
TRK Truck transportation 33 0
PIP Pipelines transportation 33 0
MAR Maritime transportation 95 80
AIR Air transportation 90 75
TRO Other transportation 33 0
* Source: Authors' estimates
.Sectors and Estimated Improved Market Access from WTO Accession*
SectorsEquivalent % barriers to FDI
Base Year Post-WTO Accession
Tariff rates Export tax rates
Estimated change in export prices
from WTO accession
(ad-valorem in %) -- by sector
ELE Electric industry 4.5 0 0
OLE Oil extraction 0 7.9 0
OLP Oil processing 3.8 4.6 0
GAS Gas 0.5 18.8 0
COA Coalmining 0 0 0
OFU Other fuel industries 2.6 2.6 0
FME Ferrous metallurgy 2.9 0.4 1.5
NFM Non-ferrous metallurgy 7.4 5.3 1.5
CHM Chemical & oil-chemical industry 7.1 1.6 1.5
MWO Mechanical engineering & metal -working 7.2 0 0
TPP Timber & woodworking & pulp & paper industry 9.9 6.9 0
CNM Construction materials industry 10.6 1.6 0
CLO Light industry 11.8 4.1 0.5
FOO Food industry 11.3 3.1 0.5
OTH Other industries 6.4 0 0.5
AGF Agriculture & forestry 8.2 0.6 0
OIN Other goods-producing sectors 0 0 0.5
TMS Telecommunications 33 0
SCS Science & science servicing 33 0
FIN Financial services 36 0
RLW Railway transportation 33 0
TRK Truck transportation 33 0
PIP Pipelines transportation 33 0
MAR Maritime transportation 95 80
AIR Air transportation 90 75
TRO Other transportation 33 0
* Source: Authors' estimates
Sectors and Estimated Improved Market Access from WTO Accession*
SectorsEquivalent % barriers to FDI
Base Year Post-WTO Accession
Tariff rates Export tax rates
Estimated change in export prices
from WTO accession
(ad-valorem in %) -- by sector
ELE Electric industry 4.5 0 0
OLE Oil extraction 0 7.9 0
OLP Oil processing 3.8 4.6 0
GAS Gas 0.5 18.8 0
COA Coalmining 0 0 0
OFU Other fuel industries 2.6 2.6 0
FME Ferrous metallurgy 2.9 0.4 1.5
NFM Non-ferrous metallurgy 7.4 5.3 1.5
CHM Chemical & oil-chemical industry 7.1 1.6 1.5
MWO Mechanical engineering & metal -working 7.2 0 0
TPP Timber & woodworking & pulp & paper industry 9.9 6.9 0
CNM Construction materials industry 10.6 1.6 0
CLO Light industry 11.8 4.1 0.5
FOO Food industry 11.3 3.1 0.5
OTH Other industries 6.4 0 0.5
AGF Agriculture & forestry 8.2 0.6 0
OIN Other goods-producing sectors 0 0 0.5
TMS Telecommunications 33 0
SCS Science & science servicing 33 0
FIN Financial services 36 0
RLW Railway transportation 33 0
TRK Truck transportation 33 0
PIP Pipelines transportation 33 0
MAR Maritime transportation 95 80
AIR Air transportation 90 75
TRO Other transportation 33 0
* Source: Authors' estimates
Table 2. Tariff Rates, Export Tax Rates, Estimated Ad Valorem Equivalence of Barriers to FDI in Services Sectors and Estimated Improved Market Access from WTO Accession*
SectorsEquivalent % barriers to FDI
Base Year Post-WTO Accession
Tariff rates Export tax rates
Estimated change in export prices
from WTO accession
(ad-valorem in %) -- by sector
ELE Electric industry 4.5 0 0
OLE Oil extraction 0 7.9 0
OLP Oil processing 3.8 4.6 0
GAS Gas 0.5 18.8 0
COA Coalmining 0 0
(ad-valorem in %) -- by sector
ELE Electric industry 4.5 0 0
OLE Oil extraction 0 7.9 0
OLP Oil processing 3.8 4.6 0
GAS Gas 0.5 18.8 0
COA Coalmining 0 0 0
OFU Other fuel industries 2.6 2.6 0
FME Ferrous metallurgy 2.9 0.4 1.5
NFM Non-ferrous metallurgy 7.4 5.3 1.5
CHM Chemical & oil-chemical industry 7.1 1.6 1.5
MWO Mechanical engineering & metal -working 7.2 0 0
TPP Timber & woodworking & pulp & paper industry 9.9 6.9 0
CNM Construction materials industry 10.6 1.6 0
CLO Light industry 11.8 4.1 0.5
FOO Food industry 11.3 3.1 0.5
OTH Other industries 6.4 0 0.5
AGF Agriculture & forestry 8.2 0.6 0
OIN Other goods-producing sectors 0 0 0.5
TMS
(ad-valorem in %) -- by sector
ELE Electric industry 4.5 0 0
OLE Oil extraction 0 7.9 0
OLP Oil processing 3.8 4.6 0
GAS Gas 0.5 18.8 0
COA Coalmining 0 0 0
OFU Other fuel industries 2.6 2.6 0
FME Ferrous metallurgy 2.9 0.4 1.5
NFM Non-ferrous metallurgy 7.4 5.3 1.5
CHM Chemical & oil-chemical industry 7.1 1.6 1.5
MWO Mechanical engineering & metal -working 7.2 0 0
TPP Timber & woodworking & pulp & paper industry 9.9 6.9 0
CNM Construction materials industry 10.6 1.6 0
CLO Light industry 11.8 4.1 0.5
FOO Food industry 11.3 3.1 0.5
OTH Other industries 6.4 0 0.5
AGF Agriculture & forestry 8.2 0.6 0
OIN Other goods-producing sectors 0 0 0.5
TMS Telecommunications 33 0
SCS Science & science servicing 33 0
FIN Financial services 36 0
RLW Railway transportation 33 0
TRK Truck transportation 33 0
PIP Pipelines transportation 33 0
MAR Maritime transportation 95 80
AIR Air transportation 90 75
TRO Other transportation 33 0
* Source: Authors' estimates
Table 2. Tariff Rates, Export Tax Rates, Estimated Ad Valorem Equivalence of Barriers to FDI in Services Sectors and Estimated Improved Market Access from WTO Accession*
SectorsEquivalent % barriers to FDI
Base Year Post-WTO Accession
Tariff rates Export tax rates
Estimated change in export prices
from WTO accession
(ad-valorem in %) -- by sector
ELE Electric industry 4.5 0 0
OLE Oil extraction 0 7.9 0
OLP Oil processing 3.8 4.6 0
GAS Gas 0.5 18.8 0
COA Coalmining 0 0 0
OFU Other fuel industries 2.6 2.6 0
FME Ferrous metallurgy 2.9 0.4 1.5
NFM Non-ferrous metallurgy 7.4 5.3 1.5
CHM Chemical & oil-chemical industry 7.1 1.6 1.5
MWO Mechanical engineering & metal -working 7.2 0 0
TPP Timber & woodworking & pulp & paper industry 9.9 6.9 0
CNM Construction materials industry 10.6 1.6 0
CLO Light industry 11.8 4.1 0.5
FOO Food industry 11.3 3.1 0.5
OTH Other industries 6.4 0 0.5
AGF Agriculture & forestry 8.2 0.6 0
OIN Other goods-producing sectors 0 0 0.5
TMS Telecommunications 33 0
SCS Science & science servicing 33 0
FIN Financial services 36 0
RLW Railway transportation 33 0
TRK Truck transportation 33 0
PIP Pipelines transportation 33 0
MAR Maritime transportation 95 80
AIR Air transportation 90
0
OFU Other fuel industries 2.6 2.6 0
FME Ferrous metallurgy 2.9 0.4 1.5
NFM Non-ferrous metallurgy 7.4 5.3 1.5
CHM Chemical & oil-chemical industry 7.1 1.6 1.5
MWO Mechanical engineering & metal -working 7.2 0 0
TPP Timber & woodworking & pulp & paper industry 9.9 6.9 0
CNM Construction materials industry 10.6 1.6 0
CLO Light industry 11.8 4.1 0.5
FOO Food industry 11.3 3.1 0.5
OTH Other industries 6.4 0 0.5
AGF Agriculture & forestry 8.2 0.6 0
OIN Other goods-producing sectors 0 0 0.5
TMS Telecommunications 33 0
SCS Science & science servicing 33 0
FIN Financial services 36 0
RLW Railway transportation 33 0
TRK Truck transportation 33 0
PIP Pipelines transportation 33 0
MAR Maritime transportation 95 80
AIR Air transportation 90 75
TRO Other transportation 33 0
* Source: Authors' estimates
ValoremSectors and Estimated Improved Market Access from WTO Accession*
SectorsEquivalent % barriers to FDI
Base Year Post-WTO Accession
Tariff rates Export tax rates
Estimated change in export prices
from WTO accession
(ad-valorem in %) -- by sector
ELE Electric industry 4.5 0 0
OLE Oil extraction 0 7.9 0
OLP Oil processing 3.8 4.6 0
GAS Gas 0.5 18.8 0
COA Coalmining 0 0 0
OFU Other fuel industries 2.6 2.6 0
FME Ferrous metallurgy 2.9 0.4 1.5
NFM Non-ferrous metallurgy 7.4 5.3 1.5
CHM Chemical & oil-chemical industry 7.1 1.6 1.5
MWO Mechanical engineering & metal -working 7.2 0 0
TPP Timber & woodworking & pulp & paper industry 9.9 6.9 0
CNM Construction materials industry 10.6 1.6 0
CLO Light industry 11.8 4.1 0.5
FOO Food industry 11.3 3.1 0.5
OTH Other industries 6.4 0 0.5
AGF Agriculture & forestry 8.2 0.6 0
OIN Other goods-producing sectors 0 0 0.5
TMS Telecommunications 33 0
SCS Science & science servicing 33 0
FIN Financial services 36 0
RLW Railway transportation 33 0
TRK Truck transportation 33 0
PIP Pipelines transportation 33 0
MAR Maritime transportation 95 80
AIR Air transportation 90 75
TRO Other transportation 33 0
* Source: Authors' estimates
ValoremSectors and Estimated Improved Market Access from WTO Accession*
SectorsEquivalent % barriers to FDI
Base Year Post-WTO Accession
Tariff rates Export tax rates
Estimated change in export prices
from WTO accession
(ad-valorem in %) -- by sector
ELE Electric industry 4.5 0 0
OLE Oil extraction 0 7.9 0
OLP Oil processing 3.8 4.6 0
GAS Gas 0.5 18.8 0
COA Coalmining 0 0
(ad-valorem in %) -- by sector
ELE Electric industry 4.5 0 0
OLE Oil extraction 0 7.9 0
OLP Oil processing 3.8 4.6 0
GAS Gas 0.5 18.8 0
COA Coalmining 0 0 0
OFU Other fuel industries 2.6 2.6 0
FME Ferrous metallurgy 2.9 0.4 1.5
NFM Non-ferrous metallurgy 7.4 5.3 1.5
CHM Chemical & oil-chemical industry 7.1 1.6 1.5
MWO Mechanical engineering & metal -working 7.2 0 0
TPP Timber & woodworking & pulp & paper industry 9.9 6.9 0
CNM Construction materials industry 10.6 1.6 0
CLO Light industry 11.8 4.1 0.5
FOO Food industry 11.3 3.1 0.5
OTH Other industries 6.4 0 0.5
AGF Agriculture & forestry 8.2 0.6 0
OIN Other goods-producing sectors 0 0 0.5
TMS Telecommunications 33 0
SCS Science & science servicing 33 0
FIN Financial services 36 0
RLW Railway transportation 33 0
TRK Truck transportation 33 0
PIP Pipelines transportation 33 0
MAR Maritime transportation 95 80
AIR Air transportation 90 75
TRO Other transportation 33 0
* Source: Authors' estimates
.Sectors and Estimated Improved Market Access from WTO Accession*
SectorsEquivalent % barriers to FDI
Base Year Post-WTO Accession
Tariff rates Export tax rates
Estimated change in export prices
from WTO accession
(ad-valorem in %) -- by sector
ELE Electric industry 4.5 0 0
OLE Oil extraction 0 7.9 0
OLP Oil processing 3.8 4.6 0
GAS Gas 0.5 18.8 0
COA Coalmining 0 0 0
OFU Other fuel industries 2.6 2.6 0
FME Ferrous metallurgy 2.9 0.4 1.5
NFM Non-ferrous metallurgy 7.4 5.3 1.5
CHM Chemical & oil-chemical industry 7.1 1.6 1.5
MWO Mechanical engineering & metal -working 7.2 0 0
TPP Timber & woodworking & pulp & paper industry 9.9 6.9 0
CNM Construction materials industry 10.6 1.6 0
CLO Light industry 11.8 4.1 0.5
FOO Food industry 11.3 3.1 0.5
OTH Other industries 6.4 0 0.5
AGF Agriculture & forestry 8.2 0.6 0
OIN Other goods-producing sectors 0 0 0.5
TMS Telecommunications 33 0
SCS Science & science servicing 33 0
FIN Financial services 36 0
RLW Railway transportation 33 0
TRK Truck transportation 33 0
PIP Pipelines transportation 33 0
MAR Maritime transportation 95 80
AIR Air transportation 90 75
TRO Other transportation 33 0
* Source: Authors' estimates
Sectors and Estimated Improved Market Access from WTO Accession*
SectorsEquivalent % barriers to FDI
Base Year Post-WTO Accession
Tariff rates Export tax rates
Estimated change in export prices
from WTO accession
(ad-valorem in %) -- by sector
ELE Electric industry 4.5 0 0
OLE Oil extraction 0 7.9 0
OLP Oil processing 3.8 4.6 0
GAS Gas 0.5 18.8 0
COA Coalmining 0 0 0
OFU Other fuel industries 2.6 2.6 0
FME Ferrous metallurgy 2.9 0.4 1.5
NFM Non-ferrous metallurgy 7.4 5.3 1.5
CHM Chemical & oil-chemical industry 7.1 1.6 1.5
MWO Mechanical engineering & metal -working 7.2 0 0
TPP Timber & woodworking & pulp & paper industry 9.9 6.9 0
CNM Construction materials industry 10.6 1.6 0
CLO Light industry 11.8 4.1 0.5
FOO Food industry 11.3 3.1 0.5
OTH Other industries 6.4 0 0.5
AGF Agriculture & forestry 8.2 0.6 0
OIN Other goods-producing sectors 0 0 0.5
TMS
(ad-valorem in %) -- by sector
ELE Electric industry 4.5 0 0
OLE Oil extraction 0 7.9 0
OLP Oil processing 3.8 4.6 0
GAS Gas 0.5 18.8 0
COA Coalmining 0 0 0
OFU Other fuel industries 2.6 2.6 0
FME Ferrous metallurgy 2.9 0.4 1.5
NFM Non-ferrous metallurgy 7.4 5.3 1.5
CHM Chemical & oil-chemical industry 7.1 1.6 1.5
MWO Mechanical engineering & metal -working 7.2 0 0
TPP Timber & woodworking & pulp & paper industry 9.9 6.9 0
CNM Construction materials industry 10.6 1.6 0
CLO Light industry 11.8 4.1 0.5
FOO Food industry 11.3 3.1 0.5
OTH Other industries 6.4 0 0.5
AGF Agriculture & forestry 8.2 0.6 0
OIN Other goods-producing sectors 0 0 0.5
TMS Telecommunications 33 0
SCS Science & science servicing 33 0
FIN Financial services 36 0
RLW Railway transportation 33 0
TRK Truck transportation 33 0
PIP Pipelines transportation 33 0
MAR Maritime transportation 95 80
AIR Air transportation 90 75
TRO Other transportation 33 0
* Source: Authors' estimates
ValoremSectors and Estimated Improved Market Access from WTO Accession*
SectorsEquivalent % barriers to FDI
Base Year Post-WTO Accession
Tariff rates Export tax rates
Estimated change in export prices
from WTO accession
(ad-valorem in %) -- by sector
ELE Electric industry 4.5 0 0
OLE Oil extraction 0 7.9 0
OLP Oil processing 3.8 4.6 0
GAS Gas 0.5 18.8 0
COA Coalmining 0 0
(ad-valorem in %) -- by sector
ELE Electric industry 4.5 0 0
OLE Oil extraction 0 7.9 0
OLP Oil processing 3.8 4.6 0
GAS Gas 0.5 18.8 0
COA Coalmining 0 0 0
OFU Other fuel industries 2.6 2.6 0
FME Ferrous metallurgy 2.9 0.4 1.5
NFM Non-ferrous metallurgy 7.4 5.3 1.5
CHM Chemical & oil-chemical industry 7.1 1.6 1.5
MWO Mechanical engineering & metal -working 7.2 0 0
TPP Timber & woodworking & pulp & paper industry 9.9 6.9 0
CNM Construction materials industry
(ad-valorem in %) -- by sector
ELE Electric industry 4.5 0 0
OLE Oil extraction 0 7.9 0
OLP Oil processing 3.8 4.6 0
GAS Gas 0.5 18.8 0
COA Coalmining 0 0
(ad-valorem in %) -- by sector
ELE Electric industry 4.5 0 0
OLE Oil extraction 0 7.9 0
OLP Oil processing 3.8 4.6 0
GAS Gas 0.5 18.8 0
COA Coalmining 0 0 0
OFU Other fuel industries 2.6 2.6 0
FME Ferrous metallurgy 2.9 0.4 1.5
NFM Non-ferrous metallurgy 7.4 5.3 1.5
CHM Chemical & oil-chemical industry 7.1 1.6 1.5
MWO Mechanical engineering & metal -working 7.2 0 0
TPP Timber & woodworking & pulp & paper industry 9.9 6.9 0
CNM Construction materials industry 10.6 1.6 0
CLO Light industry 11.8 4.1 0.5
FOO Food industry 11.3 3.1 0.5
OTH Other industries 6.4 0 0.5
AGF Agriculture & forestry 8.2 0.6 0
OIN Other goods-producing sectors 0 0 0.5
TMS Telecommunications 33 0
SCS Science & science servicing 33 0
FIN Financial services 36 0
RLW Railway transportation 33 0
TRK Truck transportation 33 0
PIP Pipelines transportation 33 0
MAR Maritime transportation 95 80
AIR Air transportation 90 75
TRO Other transportation 33 0
* Source: Authors' estimates
.Sectors and Estimated Improved Market Access from WTO Accession*
SectorsEquivalent % barriers to FDI
Base Year Post-WTO Accession
Tariff rates Export tax rates
Estimated change in export prices
from WTO accession
(ad-valorem in %) -- by sector
ELE Electric industry 4.5 0 0
OLE Oil extraction 0 7.9 0
OLP Oil processing 3.8 4.6 0
GAS Gas 0.5 18.8 0
COA Coalmining 0 0 0
OFU Other fuel industries 2.6 2.6 0
FME Ferrous metallurgy 2.9 0.4 1.5
NFM Non-ferrous metallurgy 7.4 5.3 1.5
CHM Chemical & oil-chemical industry 7.1 1.6 1.5
MWO Mechanical engineering & metal -working 7.2 0 0
TPP Timber & woodworking & pulp & paper industry 9.9 6.9 0
CNM Construction materials industry 10.6 1.6 0
CLO Light industry 11.8 4.1 0.5
FOO Food industry 11.3 3.1 0.5
OTH Other industries 6.4 0 0.5
AGF Agriculture & forestry 8.2 0.6 0
OIN Other goods-producing sectors 0 0 0.5
TMS Telecommunications 33 0
SCS Science & science servicing 33 0
FIN Financial services 36 0
RLW Railway transportation 33 0
TRK Truck transportation 33 0
PIP Pipelines transportation 33 0
MAR Maritime transportation 95 80
AIR Air transportation 90 75
TRO Other transportation 33 0
* Source: Authors' estimates
Sectors and Estimated Improved Market Access from WTO Accession*
SectorsEquivalent % barriers to FDI
Base Year Post-WTO Accession
Tariff rates Export tax rates
Estimated change in export prices
from WTO accession

27
(ad-valorem in %) -- by sector
ELE Electric industry 0.2 -0.1 0.7 0.0
OLE Oil extraction 0.2 0.1 1.0 0.3
OLP Oil processing 0.2 0.1 1.0 0.3
GAS Gas 0.1 -0.1 0.5 0.2
COA Coalmining 0.2 0.9 0.9 1.1
OFU Other fuel industries 0.2 0.1 0.9 0.3
FME Ferrous metallurgy 0.2 -0.1 0.8 -0.3
NFM Non-ferrous metallurgy 0.2 -0.1 0.7 -0.7
CHM Chemical & oil -chemical industry 0.2 -0.2 0.7 -0.3
MWO Mechanical engineering & metal -working 0.2 -0.2 0.7 -0.2
TPP Timber & woodworking & pulp & paper industry 0.2 -0.2 0.8 -0.2
CNM Construction materials industry 0.2 0.0 0.8 0.2
CLO Light industry 0.3 0.1 1.5 -0.3
FOO Food industry 0.5 2.3 1.5 2.7
OTH Other industries 0.2 -0.1 0.8 -0.3
AGF Agriculture & forestry 0.1 0.4 0.7 0.9
OIN Other goods-producing sectors 0.3 0.0 0.9 -0.2
* Source: GTAP model estimates.
Global Free Trade
Doha Round or Global Free Trade *
Export prices
Import prices
Sectors
Doha Export prices
Import prices
(ad-valorem in %) -- by sector
ELE Electric industry 0.2 -0.1 0.7 0.0
OLE Oil extraction 0.2 0.1 1.0 0.3
OLP Oil processing 0.2 0.1 1.0 0.3
GAS Gas 0.1 -0.1 0.5 0.2
COA Coalmining 0.2 0.9 0.9 1.1
OFU Other fuel industries 0.2 0.1 0.9 0.3
FME Ferrous metallurgy 0.2 -0.1 0.8 -0.3
NFM Non-ferrous metallurgy 0.2 -0.1 0.7 -0.7
CHM Chemical & oil -chemical industry 0.2 -0.2 0.7 -0.3
MWO Mechanical engineering & metal -working 0.2 -0.2 0.7 -0.2
TPP Timber & woodworking & pulp & paper industry 0.2 -0.2 0.8 -0.2
CNM Construction materials industry 0.2 0.0 0.8 0.2
CLO Light industry 0.3 0.1 1.5 -0.3
FOO Food industry 0.5 2.3 1.5 2.7
OTH Other industries 0.2 -0.1 0.8 -0.3
AGF Agriculture & forestry 0.1 0.4 0.7 0.9
OIN Other goods-producing sectors 0.3 0.0 0.9 -0.2
* Source: GTAP model estimates.
Global Free Trade
Table 3. Changes in Export and Import Prices Facing Russia on World Markets as a Result of theDoha Round or Global Free Trade *
Export prices
Import prices
Sectors
Doha Export prices
Import prices
(ad-valorem in %) -- by sector
ELE Electric industry 0.2 -0.1 0.7 0.0
OLE Oil extraction 0.2 0.1 1.0 0.3
OLP Oil processing 0.2 0.1 1.0 0.3
GAS Gas 0.1 -0.1 0.5 0.2
COA Coalmining 0.2 0.9 0.9
(ad-valorem in %) -- by sector
ELE Electric industry 0.2 -0.1 0.7 0.0
OLE Oil extraction 0.2 0.1 1.0 0.3
OLP Oil processing 0.2 0.1 1.0 0.3
GAS Gas 0.1 -0.1 0.5 0.2
COA Coalmining 0.2 0.9 0.9 1.1
OFU Other fuel industries 0.2 0.1 0.9 0.3
FME Ferrous metallurgy 0.2 -0.1 0.8 -0.3
NFM Non-ferrous metallurgy 0.2 -0.1 0.7 -0.7
CHM Chemical & oil -chemical industry 0.2 -0.2 0.7 -0.3
MWO Mechanical engineering & metal -working 0.2 -0.2 0.7 -0.2
TPP Timber & woodworking & pulp & paper industry 0.2 -0.2 0.8 -0.2
CNM Construction materials industry 0.2 0.0 0.8 0.2
CLO Light industry 0.3 0.1 1.5 -0.3
FOO Food industry 0.5 2.3 1.5 2.7
OTH Other industries 0.2 -0.1 0.8 -0.3
AGF Agriculture & forestry 0.1 0.4 0.7 0.9
OIN Other goods-producing sectors 0.3 0.0 0.9 -0.2
* Source: GTAP model estimates.
Global Free Trade
Doha Round or Global Free Trade *
Export prices
Import prices
Sectors
Doha Export prices
Import prices
(ad-valorem in %) -- by sector
ELE Electric industry 0.2 -0.1 0.7 0.0
OLE Oil extraction 0.2 0.1 1.0 0.3
OLP Oil processing 0.2 0.1 1.0 0.3
GAS Gas 0.1 -0.1 0.5 0.2
COA Coalmining 0.2 0.9 0.9 1.1
OFU Other fuel industries 0.2 0.1 0.9 0.3
FME Ferrous metallurgy 0.2 -0.1 0.8 -0.3
NFM Non-ferrous metallurgy 0.2 -0.1 0.7 -0.7
CHM Chemical & oil -chemical industry 0.2 -0.2 0.7 -0.3
MWO Mechanical engineering & metal -working 0.2 -0.2 0.7 -0.2
TPP Timber & woodworking & pulp & paper industry 0.2 -0.2 0.8 -0.2
CNM Construction materials industry 0.2 0.0 0.8 0.2
CLO Light industry 0.3 0.1 1.5 -0.3
FOO Food industry 0.5 2.3 1.5 2.7
OTH Other industries 0.2 -0.1 0.8 -0.3
AGF Agriculture & forestry 0.1 0.4 0.7 0.9
OIN Other goods-producing sectors 0.3 0.0 0.9 -0.2
* Source: GTAP model estimates.
Global Free Trade
Doha Round or Global Free Trade *
Export prices
Import prices
Sectors
Doha Export prices
Import prices
(ad-valorem in %) -- by sector
ELE Electric industry 0.2 -0.1 0.7 0.0
OLE Oil extraction 0.2 0.1 1.0 0.3
OLP Oil processing 0.2 0.1 1.0 0.3
GAS Gas 0.1 -0.1 0.5 0.2
COA Coalmining 0.2 0.9 0.9
(ad-valorem in %) -- by sector
ELE Electric industry 0.2 -0.1 0.7 0.0
OLE Oil extraction 0.2 0.1 1.0 0.3
OLP Oil processing 0.2 0.1 1.0 0.3
GAS Gas 0.1 -0.1 0.5 0.2
COA Coalmining 0.2 0.9 0.9 1.1
OFU Other fuel industries 0.2 0.1 0.9 0.3
FME Ferrous metallurgy 0.2 -0.1 0.8 -0.3
NFM Non-ferrous metallurgy 0.2 -0.1 0.7 -0.7
CHM Chemical & oil -chemical industry 0.2 -0.2 0.7 -0.3
MWO Mechanical engineering & metal -working 0.2 -0.2 0.7 -0.2
TPP Timber & woodworking & pulp & paper industry 0.2 -0.2 0.8 -0.2
CNM Construction materials industry 0.2 0.0 0.8 0.2
CLO Light industry 0.3 0.1
(ad-valorem in %) -- by sector
ELE Electric industry 0.2 -0.1 0.7 0.0
OLE Oil extraction 0.2 0.1 1.0 0.3
OLP Oil processing 0.2 0.1 1.0 0.3
GAS Gas 0.1 -0.1 0.5 0.2
COA Coalmining 0.2 0.9 0.9 1.1
OFU Other fuel industries 0.2 0.1 0.9 0.3
FME Ferrous metallurgy 0.2 -0.1 0.8 -0.3
NFM Non-ferrous metallurgy 0.2 -0.1 0.7 -0.7
CHM Chemical & oil -chemical industry 0.2 -0.2 0.7 -0.3
MWO Mechanical engineering & metal -working 0.2 -0.2 0.7 -0.2
TPP Timber & woodworking & pulp & paper industry 0.2 -0.2 0.8 -0.2
CNM Construction materials industry 0.2 0.0 0.8 0.2
CLO Light industry 0.3 0.1 1.5 -0.3
FOO Food industry 0.5 2.3 1.5 2.7
OTH Other industries 0.2 -0.1 0.8 -0.3
AGF Agriculture & forestry 0.1 0.4 0.7 0.9
OIN Other goods-producing sectors 0.3 0.0 0.9 -0.2
* Source: GTAP model estimates.
Global Free Trade
Doha Round or Global Free Trade *
Export prices
Import prices
Sectors
Doha Export prices
Import prices
(ad-valorem in %) -- by sector
ELE Electric industry 0.2 -0.1 0.7 0.0
OLE Oil extraction 0.2 0.1 1.0 0.3
OLP Oil processing 0.2 0.1 1.0 0.3
GAS Gas 0.1 -0.1 0.5 0.2
COA Coalmining 0.2 0.9 0.9 1.1
OFU Other fuel industries 0.2 0.1 0.9 0.3
FME Ferrous metallurgy 0.2 -0.1 0.8 -0.3
NFM Non-ferrous metallurgy 0.2 -0.1 0.7 -0.7
CHM Chemical & oil -chemical industry 0.2 -0.2 0.7 -0.3
MWO Mechanical engineering & metal -working 0.2 -0.2 0.7 -0.2
TPP Timber & woodworking & pulp & paper industry 0.2 -0.2 0.8 -0.2
CNM Construction materials industry 0.2 0.0 0.8 0.2
CLO Light industry 0.3 0.1 1.5 -0.3
FOO Food industry 0.5 2.3 1.5 2.7
OTH Other industries 0.2 -0.1 0.8 -0.3
AGF Agriculture & forestry 0.1 0.4 0.7 0.9
OIN Other goods-producing sectors 0.3 0.0 0.9 -0.2
* Source: GTAP model estimates.
Global Free Trade
Doha Round or Global Free Trade *
Export
1.1
OFU Other fuel industries 0.2 0.1 0.9 0.3
FME Ferrous metallurgy 0.2 -0.1 0.8 -0.3
NFM Non-ferrous metallurgy 0.2 -0.1 0.7 -0.7
CHM Chemical & oil -chemical industry 0.2 -0.2 0.7 -0.3
MWO Mechanical engineering & metal -working 0.2 -0.2 0.7 -0.2
TPP Timber & woodworking & pulp & paper industry 0.2 -0.2 0.8 -0.2
CNM Construction materials industry 0.2 0.0 0.8 0.2
CLO Light industry 0.3 0.1 1.5 -0.3
FOO Food industry 0.5 2.3 1.5 2.7
OTH Other industries 0.2 -0.1 0.8 -0.3
AGF Agriculture & forestry 0.1 0.4 0.7 0.9
OIN Other goods-producing sectors 0.3 0.0 0.9 -0.2
* Source: GTAP model estimates.
Global Free Trade
Doha Round or Global Free Trade *
Export prices
Import prices
Sectors
Doha Export prices
Import prices
(ad-valorem in %) -- by sector
ELE Electric industry 0.2 -0.1 0.7 0.0
OLE Oil extraction 0.2 0.1 1.0 0.3
OLP Oil processing 0.2 0.1 1.0 0.3
GAS Gas 0.1 -0.1 0.5 0.2
COA Coalmining 0.2 0.9 0.9 1.1
OFU Other fuel industries 0.2 0.1 0.9 0.3
FME Ferrous metallurgy 0.2 -0.1 0.8 -0.3
NFM Non-ferrous metallurgy 0.2 -0.1 0.7 -0.7
CHM Chemical & oil -chemical industry 0.2 -0.2 0.7 -0.3
MWO Mechanical engineering & metal -working 0.2 -0.2 0.7 -0.2
TPP Timber & woodworking & pulp & paper industry 0.2 -0.2 0.8 -0.2
CNM Construction materials industry 0.2 0.0 0.8 0.2
CLO Light industry 0.3 0.1 1.5 -0.3
FOO Food industry 0.5 2.3 1.5 2.7
OTH Other industries 0.2 -0.1 0.8 -0.3
AGF Agriculture & forestry 0.1 0.4 0.7 0.9
OIN Other goods-producing sectors 0.3 0.0 0.9 -0.2
* Source: GTAP model estimates.
Global Free Trade
Table 3. Changes in Export and Import Prices Facing Russia on World Markets as a Result of theDoha Round or Global Free Trade *
Export prices
Import prices
Sectors
Doha Export prices
Import prices
(ad-valorem in %) -- by sector
ELE Electric industry 0.2 -0.1 0.7 0.0
OLE Oil extraction 0.2 0.1 1.0 0.3
OLP Oil processing 0.2 0.1 1.0 0.3
GAS Gas 0.1 -0.1 0.5 0.2
COA Coalmining 0.2 0.9 0.9
(ad-valorem in %) -- by sector
ELE Electric industry 0.2 -0.1 0.7 0.0
OLE Oil extraction 0.2 0.1 1.0 0.3
OLP Oil processing 0.2 0.1 1.0 0.3
GAS Gas 0.1 -0.1 0.5 0.2
COA Coalmining 0.2 0.9 0.9 1.1
OFU Other fuel industries 0.2 0.1 0.9 0.3
FME Ferrous metallurgy 0.2 -0.1 0.8 -0.3
NFM Non-ferrous metallurgy 0.2 -0.1 0.7 -0.7
CHM Chemical & oil -chemical industry 0.2 -0.2 0.7 -0.3
MWO Mechanical engineering & metal -working 0.2 -0.2 0.7 -0.2
TPP Timber & woodworking & pulp & paper industry 0.2 -0.2 0.8 -0.2
CNM Construction materials industry 0.2 0.0 0.8 0.2
CLO Light industry 0.3 0.1 1.5 -0.3
FOO Food industry 0.5 2.3 1.5 2.7
OTH Other industries 0.2 -0.1 0.8 -0.3
AGF Agriculture & forestry 0.1 0.4 0.7 0.9
OIN Other goods-producing sectors 0.3 0.0 0.9 -0.2
* Source: GTAP model estimates.
Global Free Trade
Doha Round or Global Free Trade *
Export prices
Import prices
Sectors
Doha Export prices
Import prices
(ad-valorem in %) -- by sector
ELE Electric industry 0.2 -0.1 0.7 0.0
OLE Oil extraction 0.2 0.1 1.0 0.3
OLP Oil processing 0.2 0.1 1.0 0.3
GAS Gas 0.1 -0.1 0.5 0.2
COA Coalmining 0.2 0.9 0.9 1.1
OFU Other fuel industries 0.2 0.1 0.9 0.3
FME Ferrous metallurgy 0.2 -0.1 0.8 -0.3
NFM Non-ferrous metallurgy 0.2 -0.1 0.7 -0.7
CHM Chemical & oil -chemical industry 0.2 -0.2 0.7 -0.3
MWO Mechanical engineering & metal -working 0.2 -0.2 0.7 -0.2
TPP Timber & woodworking & pulp & paper industry 0.2 -0.2 0.8 -0.2
CNM Construction materials industry 0.2 0.0 0.8 0.2
CLO Light industry 0.3 0.1 1.5 -0.3
FOO Food industry 0.5 2.3 1.5 2.7
OTH Other industries 0.2 -0.1 0.8 -0.3
AGF Agriculture & forestry 0.1 0.4 0.7 0.9
OIN Other goods-producing sectors 0.3 0.0 0.9 -0.2
* Source: GTAP model estimates.
Global Free Trade
Doha Round or Global Free Trade *
Export prices
Import prices
Sectors
Doha Export prices
Import prices
(ad-valorem in %) -- by sector
ELE Electric industry 0.2 -0.1 0.7 0.0
OLE Oil extraction 0.2 0.1 1.0 0.3
OLP Oil processing 0.2 0.1 1.0 0.3
GAS Gas 0.1 -0.1 0.5 0.2
COA Coalmining 0.2 0.9 0.9 1.1
OFU Other fuel industries 0.2 0.1 0.9 0.3
FME Ferrous metallurgy 0.2 -0.1 0.8 -0.3
NFM Non-ferrous metallurgy 0.2 -0.1 0.7 -0.7
CHM Chemical & oil -chemical industry 0.2 -0.2 0.7 -0.3
MWO Mechanical engineering & metal -working 0.2 -0.2 0.7 -0.2
TPP Timber & woodworking & pulp & paper industry 0.2 -0.2 0.8 -0.2
CNM Construction materials industry 0.2 0.0 0.8 0.2
CLO Light industry 0.3 0.1
(ad-valorem in %) -- by sector
ELE Electric industry 0.2 -0.1 0.7 0.0
OLE Oil extraction 0.2 0.1 1.0 0.3
OLP Oil processing 0.2 0.1 1.0 0.3
GAS Gas 0.1 -0.1 0.5 0.2
COA Coalmining 0.2 0.9 0.9 1.1
OFU Other fuel industries 0.2 0.1 0.9 0.3
FME Ferrous metallurgy 0.2 -0.1 0.8 -0.3
NFM Non-ferrous metallurgy 0.2 -0.1 0.7 -0.7
CHM Chemical & oil -chemical industry 0.2 -0.2 0.7 -0.3
MWO Mechanical engineering & metal -working 0.2 -0.2 0.7 -0.2
TPP Timber & woodworking & pulp & paper industry 0.2 -0.2 0.8 -0.2
CNM Construction materials industry 0.2 0.0 0.8 0.2
CLO Light industry 0.3 0.1 1.5 -0.3
FOO Food industry 0.5 2.3 1.5 2.7
OTH Other industries 0.2 -0.1 0.8 -0.3
AGF Agriculture & forestry 0.1 0.4 0.7 0.9
OIN Other goods-producing sectors 0.3 0.0 0.9 -0.2
* Source: GTAP model estimates.
Global Free Trade
Table 3. Changes in Export and Import Prices Facing Russia on World Markets as a Result of theDoha Round or Global Free Trade *
Export prices
Import prices
Sectors
Doha Export prices
Import prices
(ad-valorem in %) -- by sector
ELE Electric industry 0.2 -0.1 0.7 0.0
OLE Oil extraction 0.2 0.1 1.0 0.3
OLP Oil processing 0.2 0.1 1.0 0.3
GAS Gas 0.1 -0.1 0.5 0.2
COA Coalmining 0.2 0.9 0.9
(ad-valorem in %) -- by sector
ELE Electric industry 0.2 -0.1 0.7 0.0
OLE Oil extraction 0.2 0.1 1.0 0.3
OLP Oil processing 0.2 0.1 1.0 0.3
GAS Gas 0.1 -0.1 0.5 0.2
COA Coalmining 0.2 0.9 0.9 1.1
OFU Other fuel industries 0.2 0.1 0.9 0.3
FME Ferrous metallurgy 0.2 -0.1 0.8 -0.3
NFM Non-ferrous metallurgy 0.2 -0.1 0.7 -0.7
(ad-valorem in %) -- by sector
ELE Electric industry 0.2 -0.1 0.7 0.0
OLE Oil extraction 0.2 0.1 1.0 0.3
OLP Oil processing 0.2 0.1 1.0 0.3
GAS Gas 0.1 -0.1 0.5 0.2
COA Coalmining 0.2 0.9 0.9
(ad-valorem in %) -- by sector
ELE Electric industry 0.2 -0.1 0.7 0.0
OLE Oil extraction 0.2 0.1 1.0 0.3
OLP Oil processing 0.2 0.1 1.0 0.3
GAS Gas 0.1 -0.1 0.5 0.2
COA Coalmining 0.2 0.9 0.9 1.1
OFU Other fuel industries 0.2 0.1 0.9 0.3
FME Ferrous metallurgy 0.2 -0.1 0.8 -0.3
NFM Non-ferrous metallurgy 0.2 -0.1 0.7 -0.7
CHM Chemical & oil -chemical industry 0.2 -0.2 0.7 -0.3
MWO Mechanical engineering & metal -working 0.2 -0.2 0.7 -0.2
TPP Timber & woodworking & pulp & paper industry 0.2 -0.2 0.8 -0.2
CNM Construction materials industry 0.2 0.0 0.8 0.2
CLO Light industry 0.3 0.1 1.5 -0.3
FOO Food industry 0.5 2.3 1.5 2.7
OTH Other industries 0.2 -0.1 0.8 -0.3
AGF Agriculture & forestry 0.1 0.4 0.7 0.9
OIN Other goods-producing sectors 0.3 0.0 0.9 -0.2
* Source: GTAP model estimates.
Global Free Trade
Doha Round or Global Free Trade *
Export prices
Import prices
Sectors
Doha Export prices
Import prices
(ad-valorem in %) -- by sector
ELE Electric industry 0.2 -0.1 0.7 0.0
OLE Oil extraction 0.2 0.1 1.0 0.3
OLP Oil processing 0.2 0.1 1.0 0.3
GAS Gas 0.1 -0.1 0.5 0.2
COA Coalmining 0.2 0.9 0.9 1.1
OFU Other fuel industries 0.2 0.1 0.9 0.3
FME Ferrous metallurgy 0.2 -0.1 0.8 -0.3
NFM Non-ferrous metallurgy 0.2 -0.1 0.7 -0.7
CHM Chemical & oil -chemical industry 0.2 -0.2 0.7 -0.3
MWO Mechanical engineering & metal -working 0.2 -0.2 0.7 -0.2
TPP Timber & woodworking & pulp & paper industry 0.2 -0.2 0.8 -0.2
CNM Construction materials industry 0.2 0.0 0.8 0.2
CLO Light industry 0.3
(ad-valorem in %) -- by sector
ELE Electric industry 0.2 -0.1 0.7 0.0
OLE Oil extraction 0.2 0.1 1.0 0.3
OLP Oil processing 0.2 0.1 1.0 0.3
GAS Gas 0.1 -0.1 0.5 0.2
COA Coalmining 0.2 0.9 0.9 1.1
OFU Other fuel industries 0.2 0.1 0.9 0.3
FME Ferrous metallurgy 0.2 -0.1 0.8 -0.3
NFM Non-ferrous metallurgy 0.2 -0.1 0.7 -0.7
CHM Chemical & oil -chemical industry 0.2 -0.2 0.7 -0.3
MWO Mechanical engineering & metal -working 0.2 -0.2 0.7 -0.2
TPP Timber & woodworking & pulp & paper industry 0.2 -0.2 0.8 -0.2
CNM Construction materials industry 0.2 0.0 0.8 0.2
CLO Light industry 0.3 0.1 1.5 -0.3
FOO Food industry 0.5 2.3 1.5 2.7
OTH Other industries 0.2 -0.1 0.8 -0.3
AGF Agriculture & forestry 0.1 0.4 0.7 0.9
OIN Other goods-producing sectors 0.3 0.0 0.9 -0.2
* Source: GTAP model estimates.
Global Free Trade
Doha Round or Global Free Trade *
Export prices
Import prices
Sectors
Doha Export prices
Import prices
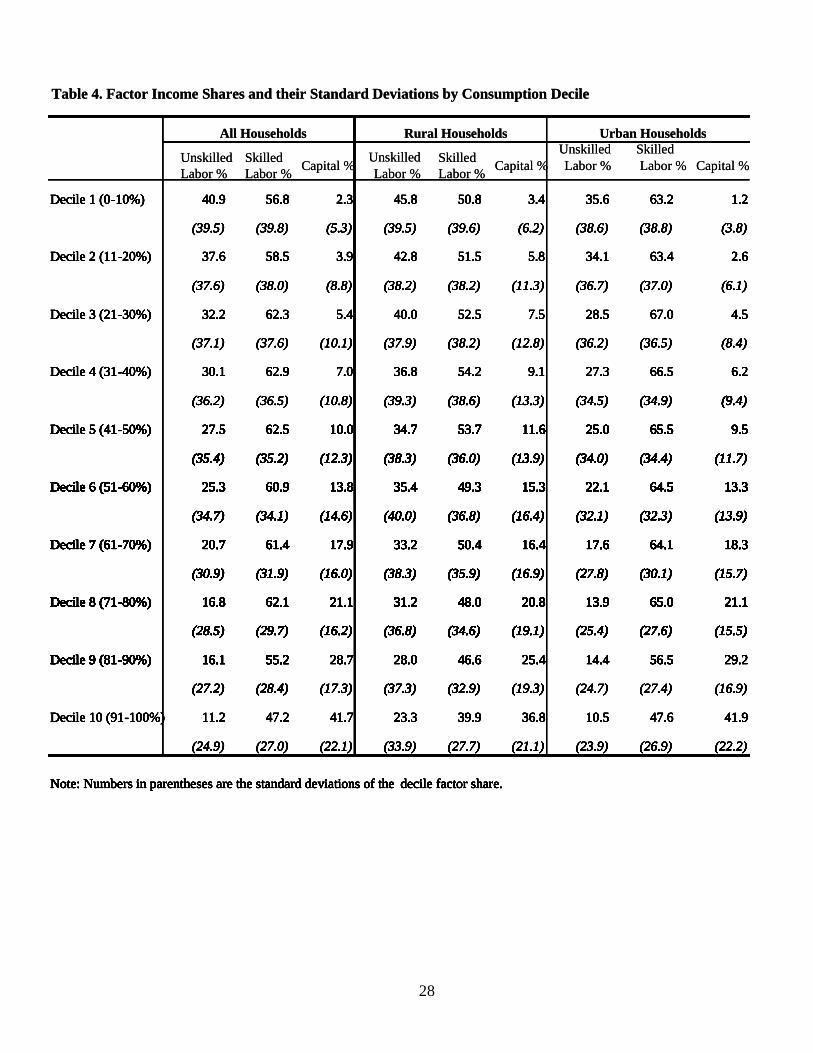
28
(38.6) (13.3) (34.5) (34.9) (9.4)
Decile 5 (41-50%) 27.5 62.5 10.0 34.7 53.7 11.6 25.0 65.5 9.5
(35.4) (35.2) (12.3) (38.3) (36.0) (13.9) (34.0) (34.4) (11.7)
Decile 6 (51-60%) 25.3 60.9 13.8 35.4 49.3 15.3 22.1 64.5 13.3
(34.7) (34.1) (14.6) (40.0) (36.8) (16.4) (32.1) (32.3) (13.9)
Decile 7 (61-70%) 20.7 61.4 17.9 33.2 50.4 16.4 17.6 64.1 18.3
(30.9) (31.9) (16.0) (38.3) (35.9) (16.9) (27.8) (30.1) (15.7)
Decile 8 (71-80%) 16.8 62.1 21.1 31.2 48.0 20.8 13.9 65.0 21.1
(28.5) (29.7) (16.2) (36.8) (34.6) (19.1) (25.4) (27.6) (15.5)
Decile 9 (81-90%) 16.1 55.2
10.0 34.7 53.7 11.6 25.0 65.5 9.5
(35.4) (35.2) (12.3) (38.3) (36.0) (13.9) (34.0) (34.4) (11.7)
Decile 6 (51-60%) 25.3 60.9 13.8 35.4 49.3 15.3 22.1 64.5 13.3
(34.7) (34.1) (14.6) (40.0) (36.8) (16.4) (32.1) (32.3) (13.9)
Decile 7 (61-70%) 20.7 61.4 17.9 33.2 50.4 16.4 17.6 64.1 18.3
(30.9) (31.9) (16.0) (38.3) (35.9) (16.9) (27.8) (30.1) (15.7)
Decile 8 (71-80%) 16.8 62.1 21.1 31.2 48.0 20.8 13.9 65.0 21.1
(28.5) (29.7) (16.2) (36.8) (34.6) (19.1) (25.4) (27.6) (15.5)
Decile 9 (81-90%) 16.1 55.2 28.7 28.0 46.6 25.4 14.4 56.5 29.2
(27.2) (28.4) (17.3) (37.3) (32.9) (19.3) (24.7) (27.4) (16.9)
Decile 10 (91-100%) 11.2 47.2 41.7 23.3 39.9 36.8 10.5 47.6 41.9
(24.9) (27.0) (22.1) (33.9) (27.7) (21.1) (23.9) (26.9) (22.2)
Note: Numbers in parentheses are the standard deviations of the decile factor share.
All Households Rural Households Urban Households
(39.3) (38.6) (13.3) (34.5) (34.9) (9.4)
Decile 5 (41-50%) 27.5 62.5 10.0 34.7 53.7 11.6 25.0 65.5 9.5
(35.4) (35.2) (12.3) (38.3) (36.0) (13.9) (34.0) (34.4) (11.7)
Decile 6 (51-60%) 25.3 60.9 13.8 35.4 49.3 15.3 22.1 64.5 13.3
(34.7) (34.1) (14.6) (40.0) (36.8) (16.4) (32.1) (32.3) (13.9)
Decile 7 (61-70%) 20.7 61.4 17.9 33.2 50.4 16.4 17.6 64.1 18.3
(30.9) (31.9) (16.0) (38.3) (35.9) (16.9) (27.8) (30.1) (15.7)
Decile 8 (71-80%) 16.8 62.1 21.1 31.2 48.0 20.8 13.9 65.0 21.1
(28.5) (29.7) (16.2) (36.8) (34.6) (19.1) (25.4) (27.6) (15.5)
Decile 9 (81-90%) 16.1 55.2
10.0 34.7 53.7 11.6 25.0 65.5 9.5
(35.4) (35.2) (12.3) (38.3) (36.0) (13.9) (34.0) (34.4) (11.7)
Decile 6 (51-60%) 25.3 60.9 13.8 35.4 49.3 15.3 22.1 64.5 13.3
(34.7) (34.1) (14.6) (40.0) (36.8) (16.4) (32.1) (32.3) (13.9)
Decile 7 (61-70%) 20.7 61.4 17.9 33.2 50.4 16.4 17.6 64.1 18.3
(30.9) (31.9) (16.0) (38.3) (35.9) (16.9) (27.8) (30.1) (15.7)
Decile 8 (71-80%) 16.8 62.1 21.1 31.2 48.0 20.8 13.9 65.0 21.1
(28.5) (29.7) (16.2) (36.8) (34.6) (19.1) (25.4) (27.6) (15.5)
Decile 9 (81-90%) 16.1 55.2 28.7 28.0 46.6 25.4 14.4 56.5 29.2
(27.2) (28.4) (17.3) (37.3) (32.9) (19.3) (24.7) (27.4) (16.9)
Decile 10 (91-100%) 11.2 47.2 41.7 23.3 39.9 36.8 10.5 47.6 41.9
(24.9) (27.0) (22.1) (33.9) (27.7) (21.1) (23.9) (26.9) (22.2)
Note: Numbers in parentheses are the standard deviations of the decile factor share.
Skilled Labor %
Unskilled Labor %
Skilled Capital %Unskilled Labor %
Skilled Labor % Capital %
Decile 1 (0-10%) 40.9 56.8 2.3 45.8 50.8 3.4 35.6 63.2 1.2
(39.5) (39.8) (5.3) (39.5) (39.6) (6.2) (38.6) (38.8) (3.8)
Decile 2 (11-20%) 37.6 58.5 3.9 42.8 51.5 5.8 34.1 63.4 2.6
(37.6) (38.0) (8.8) (38.2) (38.2) (11.3) (36.7) (37.0) (6.1)
Decile 3 (21-30%) 32.2 62.3 5.4 40.0 52.5 7.5 28.5 67.0 4.5
(37.1) (37.6) (10.1) (37.9) (38.2) (12.8) (36.2) (36.5) (8.4)
Decile 4 (31-40%) 30.1 62.9 7.0 36.8 54.2 9.1 27.3 66.5 6.2
(36.2) (36.5) (10.8) (39.3)
Table 4. Factor Income Shares and their Standard Deviations by Consumption Decile
Labor % Capital %
Decile 1 (0-10%) 40.9 56.8 2.3 45.8 50.8 3.4 35.6 63.2 1.2
(39.5) (39.8) (5.3) (39.5) (39.6) (6.2) (38.6) (38.8) (3.8)
Decile 2 (11-20%) 37.6 58.5 3.9 42.8 51.5 5.8 34.1 63.4 2.6
(37.6) (38.0) (8.8) (38.2) (38.2) (11.3) (36.7) (37.0) (6.1)
Decile 3 (21-30%) 32.2 62.3 5.4 40.0 52.5 7.5 28.5 67.0 4.5
(37.1) (37.6) (10.1) (37.9) (38.2) (12.8) (36.2) (36.5) (8.4)
Decile 4 (31-40%) 30.1 62.9 7.0 36.8 54.2 9.1 27.3 66.5 6.2
(36.2) (36.5) (10.8) (39.3) (38.6) (13.3) (34.5) (34.9) (9.4)
Decile 5 (41-50%) 27.5 62.5 10.0 34.7 53.7 11.6 25.0 65.5 9.5
(35.4) (35.2) (12.3) (38.3) (36.0) (13.9) (34.0) (34.4) (11.7)
Decile 6 (51-60%) 25.3 60.9 13.8 35.4 49.3 15.3 22.1 64.5 13.3
(34.7) (34.1) (14.6) (40.0) (36.8) (16.4) (32.1) (32.3) (13.9)
Decile 7 (61-70%) 20.7 61.4 17.9 33.2 50.4 16.4 17.6 64.1 18.3
(30.9) (31.9) (16.0) (38.3) (35.9) (16.9) (27.8) (30.1) (15.7)
Decile 8 (71-80%) 16.8 62.1 21.1 31.2 48.0 20.8 13.9 65.0 21.1
(28.5) (29.7) (16.2) (36.8) (34.6) (19.1) (25.4) (27.6) (15.5)
Decile 9 (81-90%) 16.1 55.2
10.0
(38.6) (13.3) (34.5) (34.9) (9.4)
Decile 5 (41-50%) 27.5 62.5 10.0 34.7 53.7 11.6 25.0 65.5 9.5
(35.4) (35.2) (12.3) (38.3) (36.0) (13.9) (34.0) (34.4) (11.7)
Decile 6 (51-60%) 25.3 60.9 13.8 35.4 49.3 15.3 22.1 64.5 13.3
(34.7) (34.1) (14.6) (40.0) (36.8) (16.4) (32.1) (32.3) (13.9)
Decile 7 (61-70%) 20.7 61.4 17.9 33.2 50.4 16.4 17.6 64.1 18.3
(30.9) (31.9) (16.0) (38.3) (35.9) (16.9) (27.8) (30.1) (15.7)
Decile 8 (71-80%) 16.8 62.1 21.1 31.2 48.0 20.8 13.9 65.0 21.1
(28.5) (29.7) (16.2) (36.8) (34.6) (19.1) (25.4) (27.6) (15.5)
Decile 9 (81-90%) 16.1 55.2
10.0 34.7 53.7 11.6 25.0 65.5 9.5
(35.4) (35.2) (12.3) (38.3) (36.0) (13.9) (34.0) (34.4) (11.7)
Decile 6 (51-60%) 25.3 60.9 13.8 35.4 49.3 15.3 22.1 64.5 13.3
(34.7) (34.1) (14.6) (40.0) (36.8) (16.4) (32.1) (32.3) (13.9)
Decile 7 (61-70%) 20.7 61.4 17.9 33.2 50.4 16.4 17.6 64.1 18.3
(30.9) (31.9) (16.0) (38.3) (35.9) (16.9) (27.8) (30.1) (15.7)
Decile 8 (71-80%) 16.8 62.1 21.1 31.2 48.0 20.8 13.9 65.0 21.1
(28.5) (29.7) (16.2) (36.8) (34.6) (19.1) (25.4) (27.6) (15.5)
Decile 9 (81-90%) 16.1 55.2 28.7 28.0 46.6 25.4 14.4 56.5 29.2
(27.2) (28.4) (17.3) (37.3) (32.9) (19.3)
34.7 53.7 11.6 25.0 65.5 9.5
(35.4) (35.2) (12.3) (38.3) (36.0) (13.9) (34.0) (34.4) (11.7)
Decile 6 (51-60%) 25.3 60.9 13.8 35.4 49.3 15.3 22.1 64.5 13.3
(34.7) (34.1) (14.6) (40.0) (36.8) (16.4) (32.1) (32.3) (13.9)
Decile 7 (61-70%) 20.7 61.4 17.9 33.2 50.4 16.4 17.6 64.1 18.3
(30.9) (31.9) (16.0) (38.3) (35.9) (16.9) (27.8) (30.1) (15.7)
Decile 8 (71-80%) 16.8 62.1 21.1 31.2 48.0 20.8 13.9 65.0 21.1
(28.5) (29.7) (16.2) (36.8) (34.6) (19.1) (25.4) (27.6) (15.5)
Decile 9 (81-90%) 16.1 55.2 28.7 28.0 46.6 25.4 14.4 56.5 29.2
(27.2) (28.4) (17.3) (37.3) (32.9) (19.3) (24.7) (27.4) (16.9)
Decile 10 (91-100%) 11.2 47.2 41.7 23.3 39.9 36.8 10.5 47.6 41.9
(24.9) (27.0) (22.1) (33.9) (27.7) (21.1) (23.9) (26.9) (22.2)
Note: Numbers in parentheses are the standard deviations of the decile factor share.
Unskilled
Decile 1 (0-10%) 40.9 56.8 2.3 45.8 50.8 3.4 35.6 63.2 1.2
(39.5) (39.8) (5.3) (39.5) (39.6) (6.2) (38.6) (38.8) (3.8)
Decile 2 (11-20%) 37.6 58.5 3.9 42.8 51.5 5.8 34.1 63.4 2.6
(37.6) (38.0) (8.8) (38.2) (38.2) (11.3) (36.7) (37.0) (6.1)
Decile 3 (21-30%) 32.2 62.3 5.4 40.0 52.5 7.5 28.5 67.0 4.5
(37.1) (37.6) (10.1) (37.9) (38.2) (12.8) (36.2) (36.5) (8.4)
Decile 4 (31-40%) 30.1 62.9 7.0 36.8 54.2 9.1 27.3 66.5 6.2
(36.2) (36.5) (10.8)
Decile 1 (0-10%) 40.9 56.8 2.3 45.8 50.8 3.4 35.6 63.2 1.2
(39.5) (39.8) (5.3) (39.5) (39.6) (6.2) (38.6) (38.8) (3.8)
Decile 2 (11-20%) 37.6 58.5 3.9 42.8 51.5 5.8 34.1 63.4 2.6
(37.6) (38.0) (8.8) (38.2) (38.2) (11.3) (36.7) (37.0) (6.1)
Decile 3 (21-30%) 32.2 62.3 5.4 40.0 52.5 7.5 28.5 67.0 4.5
(37.1) (37.6) (10.1) (37.9) (38.2) (12.8) (36.2) (36.5) (8.4)
Decile 4 (31-40%) 30.1 62.9 7.0 36.8 54.2 9.1 27.3 66.5 6.2
(36.2) (36.5) (10.8) (39.3) (38.6) (13.3) (34.5) (34.9) (9.4)
Decile 5 (41-50%) 27.5 62.5 10.0 34.7 53.7 11.6 25.0 65.5 9.5
(35.4) (35.2) (12.3) (38.3) (36.0) (13.9) (34.0) (34.4) (11.7)
Decile 6 (51-60%) 25.3 60.9 13.8 35.4 49.3 15.3 22.1 64.5 13.3
(34.7) (34.1) (14.6) (40.0) (36.8) (16.4) (32.1) (32.3) (13.9)
Decile 7 (61-70%) 20.7 61.4 17.9 33.2 50.4 16.4 17.6 64.1 18.3
(30.9) (31.9) (16.0) (38.3) (35.9) (16.9) (27.8) (30.1) (15.7)
Decile 8 (71-80%) 16.8 62.1 21.1 31.2 48.0 20.8 13.9 65.0 21.1
(28.5) (29.7) (16.2) (36.8) (34.6) (19.1) (25.4) (27.6) (15.5)
Decile 9 (81-90%) 16.1 55.2
(39.3) (38.6) (13.3) (34.5) (34.9) (9.4)
Decile 5 (41-50%) 27.5 62.5 10.0 34.7 53.7 11.6 25.0 65.5 9.5
(35.4) (35.2) (12.3) (38.3) (36.0) (13.9) (34.0) (34.4) (11.7)
Decile 6 (51-60%) 25.3 60.9 13.8 35.4 49.3 15.3 22.1 64.5 13.3
(34.7) (34.1) (14.6) (40.0) (36.8) (16.4) (32.1) (32.3) (13.9)
Decile 7 (61-70%) 20.7 61.4 17.9 33.2 50.4 16.4 17.6 64.1 18.3
(30.9) (31.9) (16.0) (38.3) (35.9) (16.9) (27.8) (30.1) (15.7)
Decile 8 (71-80%) 16.8 62.1 21.1 31.2 48.0 20.8 13.9 65.0 21.1
(28.5) (29.7) (16.2) (36.8) (34.6) (19.1) (25.4) (27.6) (15.5)
Decile 9 (81-90%) 16.1 55.2
10.0 34.7 53.7 11.6 25.0 65.5 9.5
(35.4) (35.2) (12.3) (38.3) (36.0) (13.9) (34.0) (34.4) (11.7)
Decile 6 (51-60%) 25.3 60.9 13.8 35.4 49.3 15.3 22.1 64.5 13.3
(34.7) (34.1) (14.6) (40.0) (36.8) (16.4) (32.1) (32.3) (13.9)
Decile 7 (61-70%) 20.7 61.4 17.9 33.2 50.4 16.4 17.6 64.1 18.3
(30.9) (31.9) (16.0) (38.3) (35.9) (16.9) (27.8) (30.1) (15.7)
Decile 8 (71-80%) 16.8 62.1 21.1 31.2 48.0 20.8 13.9 65.0 21.1
(28.5) (29.7) (16.2) (36.8) (34.6) (19.1) (25.4) (27.6) (15.5)
Decile 9 (81-90%) 16.1 55.2 28.7 28.0 46.6 25.4 14.4 56.5 29.2
(27.2) (28.4) (17.3) (37.3) (32.9)
10.0 34.7 53.7 11.6 25.0 65.5 9.5
(35.4) (35.2) (12.3) (38.3) (36.0) (13.9) (34.0) (34.4) (11.7)
Decile 6 (51-60%) 25.3 60.9 13.8 35.4 49.3 15.3 22.1 64.5 13.3
(34.7) (34.1) (14.6) (40.0) (36.8) (16.4) (32.1) (32.3) (13.9)
Decile 7 (61-70%) 20.7 61.4 17.9 33.2 50.4 16.4 17.6 64.1 18.3
(30.9) (31.9) (16.0) (38.3) (35.9) (16.9) (27.8) (30.1) (15.7)
Decile 8 (71-80%) 16.8 62.1 21.1 31.2 48.0 20.8 13.9 65.0 21.1
(28.5) (29.7) (16.2) (36.8) (34.6) (19.1) (25.4) (27.6) (15.5)
Decile 9 (81-90%) 16.1 55.2 28.7 28.0 46.6 25.4 14.4 56.5 29.2
(27.2) (28.4) (17.3) (37.3) (32.9) (19.3) (24.7) (27.4) (16.9)
Decile 10 (91-100%) 11.2 47.2 41.7 23.3 39.9 36.8 10.5 47.6 41.9
(24.9) (27.0) (22.1) (33.9) (27.7) (21.1) (23.9) (26.9) (22.2)
Note: Numbers in parentheses are the standard deviations of the decile factor share.
Labor %
(38.6) (13.3) (34.5) (34.9) (9.4)
Decile 5 (41-50%) 27.5 62.5 10.0 34.7 53.7 11.6 25.0 65.5 9.5
(35.4) (35.2) (12.3) (38.3) (36.0) (13.9) (34.0) (34.4) (11.7)
Decile 6 (51-60%) 25.3 60.9 13.8 35.4 49.3 15.3 22.1 64.5 13.3
(34.7) (34.1) (14.6) (40.0) (36.8) (16.4) (32.1) (32.3) (13.9)
Decile 7 (61-70%) 20.7 61.4 17.9 33.2 50.4 16.4 17.6 64.1 18.3
(30.9) (31.9) (16.0) (38.3) (35.9) (16.9) (27.8) (30.1) (15.7)
Decile 8 (71-80%) 16.8 62.1 21.1 31.2 48.0 20.8 13.9 65.0 21.1
(28.5) (29.7) (16.2) (36.8) (34.6) (19.1) (25.4) (27.6) (15.5)
Decile 9 (81-90%) 16.1 55.2
10.0
(38.6) (13.3) (34.5) (34.9) (9.4)
Decile 5 (41-50%) 27.5 62.5 10.0 34.7 53.7 11.6 25.0 65.5 9.5
(35.4) (35.2) (12.3) (38.3) (36.0) (13.9) (34.0) (34.4) (11.7)
Decile 6 (51-60%) 25.3 60.9 13.8 35.4 49.3 15.3 22.1 64.5 13.3
(34.7) (34.1) (14.6) (40.0) (36.8) (16.4) (32.1) (32.3) (13.9)
Decile 7 (61-70%) 20.7 61.4 17.9 33.2 50.4 16.4 17.6 64.1 18.3
(30.9) (31.9) (16.0) (38.3) (35.9) (16.9) (27.8) (30.1) (15.7)
Decile 8 (71-80%) 16.8 62.1 21.1 31.2 48.0 20.8 13.9 65.0 21.1
(28.5) (29.7) (16.2) (36.8) (34.6) (19.1) (25.4) (27.6) (15.5)
Decile 9 (81-90%) 16.1 55.2
10.0 34.7 53.7 11.6 25.0 65.5 9.5
(35.4) (35.2) (12.3) (38.3) (36.0) (13.9) (34.0) (34.4) (11.7)
Decile 6 (51-60%) 25.3 60.9 13.8 35.4 49.3 15.3 22.1 64.5 13.3
(34.7) (34.1) (14.6) (40.0) (36.8) (16.4) (32.1) (32.3) (13.9)
Decile 7 (61-70%) 20.7 61.4 17.9 33.2 50.4 16.4 17.6 64.1 18.3
(30.9) (31.9) (16.0) (38.3) (35.9) (16.9) (27.8) (30.1) (15.7)
Decile 8 (71-80%) 16.8 62.1 21.1 31.2 48.0 20.8 13.9 65.0 21.1
(28.5) (29.7) (16.2) (36.8) (34.6) (19.1) (25.4) (27.6) (15.5)
Decile 9 (81-90%) 16.1 55.2 28.7 28.0 46.6 25.4 14.4 56.5 29.2
(27.2) (28.4) (17.3) (37.3) (32.9) (19.3)
34.7 53.7 11.6 25.0 65.5 9.5
(35.4) (35.2) (12.3) (38.3) (36.0) (13.9) (34.0) (34.4) (11.7)
Decile 6 (51-60%) 25.3 60.9 13.8 35.4 49.3 15.3 22.1 64.5 13.3
(34.7) (34.1) (14.6) (40.0) (36.8) (16.4) (32.1) (32.3) (13.9)
Decile 7 (61-70%) 20.7 61.4 17.9 33.2 50.4 16.4 17.6 64.1 18.3
(30.9) (31.9) (16.0) (38.3) (35.9) (16.9) (27.8) (30.1) (15.7)
Decile 8 (71-80%) 16.8 62.1 21.1 31.2 48.0 20.8 13.9 65.0 21.1
(28.5) (29.7) (16.2) (36.8) (34.6) (19.1) (25.4) (27.6) (15.5)
Decile 9 (81-90%) 16.1 55.2 28.7 28.0 46.6 25.4 14.4 56.5 29.2
(27.2) (28.4) (17.3) (37.3) (32.9) (19.3) (24.7) (27.4) (16.9)
Decile 10 (91-100%) 11.2 47.2 41.7 23.3 39.9 36.8 10.5 47.6 41.9
(24.9) (27.0) (22.1) (33.9) (27.7) (21.1) (23.9) (26.9) (22.2)
Note: Numbers in parentheses are the standard deviations of the decile factor share.
All Households Rural Households Urban Households
(39.3) (38.6) (13.3) (34.5) (34.9) (9.4)
Decile 5 (41-50%) 27.5 62.5 10.0 34.7 53.7 11.6 25.0 65.5 9.5
(35.4) (35.2) (12.3) (38.3) (36.0) (13.9) (34.0) (34.4) (11.7)
Decile 6 (51-60%) 25.3 60.9 13.8 35.4 49.3 15.3 22.1 64.5 13.3
(34.7) (34.1) (14.6) (40.0) (36.8) (16.4) (32.1) (32.3) (13.9)
Decile 7 (61-70%) 20.7 61.4 17.9 33.2 50.4 16.4 17.6 64.1 18.3
(30.9) (31.9) (16.0) (38.3) (35.9) (16.9) (27.8) (30.1) (15.7)
Decile 8 (71-80%) 16.8 62.1 21.1 31.2 48.0 20.8 13.9 65.0 21.1
(28.5) (29.7) (16.2) (36.8) (34.6) (19.1) (25.4) (27.6) (15.5)
Decile 9 (81-90%) 16.1 55.2
10.0 34.7 53.7 11.6 25.0 65.5 9.5
(35.4) (35.2) (12.3) (38.3) (36.0) (13.9) (34.0) (34.4) (11.7)
Decile 6 (51-60%) 25.3 60.9 13.8 35.4 49.3 15.3 22.1 64.5 13.3
(34.7) (34.1) (14.6) (40.0) (36.8) (16.4) (32.1) (32.3) (13.9)
Decile 7 (61-70%) 20.7 61.4 17.9 33.2 50.4 16.4 17.6 64.1 18.3
(30.9) (31.9) (16.0) (38.3) (35.9) (16.9) (27.8) (30.1) (15.7)
Decile 8 (71-80%) 16.8 62.1 21.1 31.2 48.0 20.8 13.9 65.0 21.1
(28.5) (29.7) (16.2) (36.8) (34.6) (19.1) (25.4) (27.6) (15.5)
Decile 9 (81-90%) 16.1 55.2 28.7 28.0 46.6 25.4 14.4 56.5 29.2
(27.2) (28.4) (17.3) (37.3) (32.9)
10.0 34.7 53.7 11.6 25.0 65.5 9.5
(35.4) (35.2) (12.3) (38.3) (36.0) (13.9) (34.0) (34.4) (11.7)
Decile 6 (51-60%) 25.3 60.9 13.8 35.4 49.3 15.3 22.1 64.5 13.3
(34.7) (34.1) (14.6) (40.0) (36.8) (16.4) (32.1) (32.3) (13.9)
Decile 7 (61-70%) 20.7 61.4 17.9 33.2 50.4 16.4 17.6 64.1 18.3
(30.9) (31.9) (16.0) (38.3) (35.9) (16.9) (27.8) (30.1) (15.7)
Decile 8 (71-80%) 16.8 62.1 21.1 31.2 48.0 20.8 13.9 65.0 21.1
(28.5) (29.7) (16.2) (36.8) (34.6) (19.1) (25.4) (27.6) (15.5)
Decile 9 (81-90%) 16.1 55.2 28.7 28.0 46.6 25.4 14.4 56.5 29.2
(27.2) (28.4) (17.3) (37.3) (32.9) (19.3) (24.7) (27.4) (16.9)
Decile 10 (91-100%) 11.2 47.2 41.7 23.3 39.9 36.8 10.5 47.6 41.9
(24.9) (27.0) (22.1) (33.9) (27.7) (21.1) (23.9) (26.9) (22.2)
Note: Numbers in parentheses are the standard deviations of the decile factor share.
Skilled Labor %
Unskilled Labor %
Skilled Capital %Unskilled Labor %
Skilled Labor % Capital %
Decile 1 (0-10%) 40.9 56.8 2.3 45.8 50.8 3.4 35.6 63.2 1.2
(39.5) (39.8) (5.3) (39.5) (39.6) (6.2) (38.6) (38.8) (3.8)
Decile 2 (11-20%) 37.6 58.5 3.9 42.8 51.5 5.8 34.1 63.4 2.6
(37.6) (38.0) (8.8) (38.2) (38.2) (11.3) (36.7) (37.0) (6.1)
Decile 3 (21-30%) 32.2 62.3 5.4 40.0 52.5 7.5 28.5 67.0 4.5
(37.1) (37.6) (10.1) (37.9) (38.2) (12.8) (36.2) (36.5) (8.4)
Decile 4 (31-40%) 30.1 62.9 7.0 36.8 54.2 9.1 27.3 66.5 6.2
(36.2) (36.5) (10.8) (39.3)
Table 4. Factor Income Shares and their Standard Deviations by Consumption Decile
Labor % Capital %
Decile 1 (0-10%) 40.9 56.8 2.3 45.8 50.8 3.4 35.6 63.2 1.2
(39.5) (39.8) (5.3) (39.5) (39.6) (6.2) (38.6) (38.8) (3.8)
Decile 2 (11-20%) 37.6 58.5 3.9 42.8 51.5 5.8 34.1 63.4 2.6
(37.6) (38.0) (8.8) (38.2) (38.2) (11.3) (36.7) (37.0) (6.1)
Decile 3 (21-30%) 32.2 62.3 5.4 40.0 52.5 7.5 28.5 67.0 4.5
(37.1) (37.6) (10.1) (37.9) (38.2) (12.8) (36.2) (36.5) (8.4)
Decile 4 (31-40%) 30.1 62.9 7.0 36.8 54.2 9.1 27.3 66.5 6.2
(36.2) (36.5) (10.8) (39.3) (38.6) (13.3) (34.5) (34.9) (9.4)
Decile 5 (41-50%) 27.5 62.5 10.0 34.7 53.7 11.6 25.0 65.5 9.5
(35.4) (35.2) (12.3) (38.3) (36.0) (13.9) (34.0) (34.4) (11.7)
Decile 6 (51-60%) 25.3 60.9 13.8 35.4 49.3 15.3 22.1 64.5 13.3
(34.7) (34.1) (14.6) (40.0) (36.8) (16.4) (32.1) (32.3) (13.9)
Decile 7 (61-70%) 20.7 61.4 17.9 33.2 50.4 16.4 17.6 64.1 18.3
(30.9) (31.9) (16.0) (38.3) (35.9) (16.9) (27.8) (30.1) (15.7)
Decile 8 (71-80%) 16.8 62.1 21.1 31.2 48.0 20.8 13.9 65.0 21.1
(28.5) (29.7) (16.2) (36.8) (34.6) (19.1) (25.4) (27.6) (15.5)
Decile 9 (81-90%) 16.1 55.2
10.0
(38.6) (13.3) (34.5) (34.9) (9.4)
Decile 5 (41-50%) 27.5 62.5 10.0 34.7 53.7 11.6 25.0 65.5 9.5
(35.4) (35.2) (12.3) (38.3) (36.0) (13.9) (34.0) (34.4) (11.7)
Decile 6 (51-60%) 25.3 60.9 13.8 35.4 49.3 15.3 22.1 64.5 13.3
(34.7) (34.1) (14.6) (40.0) (36.8) (16.4) (32.1) (32.3) (13.9)
Decile 7 (61-70%) 20.7 61.4 17.9 33.2 50.4 16.4 17.6 64.1 18.3
(30.9) (31.9) (16.0) (38.3) (35.9) (16.9) (27.8) (30.1) (15.7)
Decile 8 (71-80%) 16.8 62.1 21.1 31.2 48.0 20.8 13.9 65.0 21.1
(28.5) (29.7) (16.2) (36.8) (34.6) (19.1) (25.4) (27.6) (15.5)
Decile 9 (81-90%) 16.1 55.2
10.0 34.7 53.7 11.6 25.0 65.5 9.5
(35.4) (35.2) (12.3) (38.3) (36.0) (13.9) (34.0) (34.4) (11.7)
Decile 6 (51-60%) 25.3 60.9 13.8 35.4 49.3 15.3 22.1 64.5 13.3
(34.7) (34.1) (14.6) (40.0) (36.8) (16.4) (32.1) (32.3) (13.9)
Decile 7 (61-70%) 20.7 61.4 17.9 33.2 50.4 16.4 17.6 64.1 18.3
(30.9) (31.9) (16.0) (38.3) (35.9) (16.9) (27.8) (30.1) (15.7)
Decile 8 (71-80%) 16.8 62.1 21.1 31.2 48.0 20.8 13.9 65.0 21.1
(28.5) (29.7) (16.2) (36.8) (34.6) (19.1) (25.4) (27.6) (15.5)
Decile 9 (81-90%) 16.1 55.2 28.7 28.0 46.6 25.4 14.4 56.5 29.2
(27.2) (28.4) (17.3) (37.3) (32.9) (19.3)
34.7 53.7 11.6 25.0 65.5 9.5
(35.4) (35.2) (12.3) (38.3) (36.0) (13.9) (34.0) (34.4) (11.7)
Decile 6 (51-60%) 25.3 60.9 13.8 35.4 49.3 15.3 22.1 64.5 13.3
(34.7) (34.1) (14.6) (40.0) (36.8) (16.4) (32.1) (32.3) (13.9)
Decile 7 (61-70%) 20.7 61.4 17.9 33.2 50.4 16.4 17.6 64.1 18.3
(30.9) (31.9) (16.0) (38.3) (35.9) (16.9) (27.8) (30.1) (15.7)
Decile 8 (71-80%) 16.8 62.1 21.1 31.2 48.0 20.8 13.9 65.0 21.1
(28.5) (29.7) (16.2) (36.8) (34.6) (19.1) (25.4) (27.6) (15.5)
Decile 9 (81-90%) 16.1 55.2 28.7 28.0 46.6 25.4 14.4 56.5 29.2
(27.2) (28.4) (17.3) (37.3) (32.9) (19.3) (24.7) (27.4) (16.9)
Decile 10 (91-100%) 11.2 47.2 41.7 23.3 39.9 36.8 10.5 47.6 41.9
(24.9) (27.0) (22.1) (33.9) (27.7) (21.1) (23.9) (26.9) (22.2)
Note: Numbers in parentheses are the standard deviations of the decile factor share.
Unskilled
Decile 1 (0-10%) 40.9 56.8 2.3 45.8 50.8 3.4 35.6 63.2 1.2
(39.5) (39.8) (5.3) (39.5) (39.6) (6.2) (38.6) (38.8) (3.8)
Decile 2 (11-20%) 37.6 58.5 3.9 42.8 51.5 5.8 34.1 63.4 2.6
(37.6) (38.0) (8.8) (38.2) (38.2) (11.3) (36.7) (37.0) (6.1)
Decile 3 (21-30%) 32.2 62.3 5.4 40.0 52.5 7.5 28.5 67.0 4.5
(37.1) (37.6) (10.1) (37.9) (38.2) (12.8) (36.2) (36.5) (8.4)
Decile 4 (31-40%) 30.1 62.9 7.0 36.8 54.2 9.1 27.3 66.5 6.2
(36.2) (36.5) (10.8)
Decile 1 (0-10%) 40.9 56.8 2.3 45.8 50.8 3.4 35.6 63.2 1.2
(39.5) (39.8) (5.3) (39.5) (39.6) (6.2) (38.6) (38.8) (3.8)
Decile 2 (11-20%) 37.6 58.5 3.9 42.8 51.5 5.8 34.1 63.4 2.6
(37.6) (38.0) (8.8) (38.2) (38.2) (11.3) (36.7) (37.0) (6.1)
Decile 3 (21-30%) 32.2 62.3 5.4 40.0 52.5 7.5 28.5 67.0 4.5
(37.1) (37.6) (10.1) (37.9) (38.2) (12.8) (36.2) (36.5) (8.4)
Decile 4 (31-40%) 30.1 62.9 7.0 36.8 54.2 9.1 27.3 66.5 6.2
(36.2) (36.5) (10.8) (39.3) (38.6) (13.3) (34.5) (34.9) (9.4)
Decile 5 (41-50%) 27.5 62.5 10.0 34.7 53.7 11.6 25.0 65.5 9.5
(35.4) (35.2) (12.3) (38.3) (36.0) (13.9) (34.0) (34.4) (11.7)
Decile 6 (51-60%) 25.3 60.9 13.8 35.4 49.3 15.3 22.1 64.5 13.3
(34.7) (34.1) (14.6) (40.0) (36.8) (16.4) (32.1) (32.3) (13.9)
Decile 7 (61-70%) 20.7 61.4 17.9 33.2 50.4 16.4 17.6 64.1 18.3
(30.9) (31.9) (16.0) (38.3) (35.9) (16.9) (27.8) (30.1) (15.7)
Decile 8 (71-80%) 16.8 62.1 21.1 31.2 48.0 20.8 13.9 65.0 21.1
(28.5) (29.7) (16.2) (36.8) (34.6) (19.1) (25.4) (27.6) (15.5)
Decile 9 (81-90%) 16.1 55.2
(39.3) (38.6) (13.3) (34.5) (34.9) (9.4)
Decile 5 (41-50%) 27.5 62.5 10.0 34.7 53.7 11.6 25.0 65.5 9.5
(35.4) (35.2) (12.3) (38.3) (36.0) (13.9) (34.0) (34.4) (11.7)
Decile 6 (51-60%) 25.3 60.9 13.8 35.4 49.3 15.3 22.1 64.5 13.3
(34.7) (34.1) (14.6) (40.0) (36.8) (16.4) (32.1) (32.3) (13.9)
Decile 7 (61-70%) 20.7 61.4 17.9 33.2 50.4 16.4 17.6 64.1 18.3
(30.9) (31.9) (16.0) (38.3) (35.9) (16.9) (27.8) (30.1) (15.7)
Decile 8 (71-80%) 16.8 62.1 21.1 31.2 48.0 20.8 13.9 65.0 21.1
(28.5) (29.7) (16.2) (36.8) (34.6) (19.1) (25.4) (27.6) (15.5)
Decile 9 (81-90%) 16.1 55.2
10.0 34.7 53.7 11.6 25.0 65.5 9.5
(35.4) (35.2) (12.3) (38.3) (36.0) (13.9) (34.0) (34.4) (11.7)
Decile 6 (51-60%) 25.3 60.9 13.8 35.4 49.3 15.3 22.1 64.5 13.3
(34.7) (34.1) (14.6) (40.0) (36.8) (16.4) (32.1) (32.3) (13.9)
Decile 7 (61-70%) 20.7 61.4 17.9 33.2 50.4 16.4 17.6 64.1 18.3
(30.9) (31.9) (16.0) (38.3) (35.9) (16.9) (27.8) (30.1) (15.7)
Decile 8 (71-80%) 16.8 62.1 21.1 31.2 48.0 20.8 13.9 65.0 21.1
(28.5) (29.7) (16.2) (36.8) (34.6) (19.1) (25.4) (27.6) (15.5)
Decile 9 (81-90%) 16.1 55.2 28.7 28.0 46.6 25.4 14.4 56.5 29.2
(27.2) (28.4) (17.3) (37.3) (32.9)
10.0 34.7 53.7 11.6 25.0 65.5 9.5
(35.4) (35.2) (12.3) (38.3) (36.0) (13.9) (34.0) (34.4) (11.7)
Decile 6 (51-60%) 25.3 60.9 13.8 35.4 49.3 15.3 22.1 64.5 13.3
(34.7) (34.1) (14.6) (40.0) (36.8) (16.4) (32.1) (32.3) (13.9)
Decile 7 (61-70%) 20.7 61.4 17.9 33.2 50.4 16.4 17.6 64.1 18.3
(30.9) (31.9) (16.0) (38.3) (35.9) (16.9) (27.8) (30.1) (15.7)
Decile 8 (71-80%) 16.8 62.1 21.1 31.2 48.0 20.8 13.9 65.0 21.1
(28.5) (29.7) (16.2) (36.8) (34.6) (19.1) (25.4) (27.6) (15.5)
Decile 9 (81-90%) 16.1 55.2 28.7 28.0 46.6 25.4 14.4 56.5 29.2
(27.2) (28.4) (17.3) (37.3) (32.9) (19.3) (24.7) (27.4) (16.9)
Decile 10 (91-100%) 11.2 47.2 41.7 23.3 39.9 36.8 10.5 47.6 41.9
(24.9) (27.0) (22.1) (33.9) (27.7) (21.1) (23.9) (26.9) (22.2)
Note: Numbers in parentheses are the standard deviations of the decile factor share.
Labor %

29
(results are percentage change from initial equilibrium)
WTO Reform of FDI WTO Accession 50% Reduction accession barriers only with partial of Tariff Barriers
reform of FDI in Russia only Full removal of barriers domestic support
(1) (2) (3) (4) (5) (6)
Aggregate welfare
Welfare (EV as % of consumption) 7.3 5.3 4.1 1.30.2 -0.3
(2.2) c/ (1.5) (1.3) (0.8) (0.2) (0.2)
Welfare (EV as % of GDP) 3.4 2.4 1.9 0.60.1 -0.1
Government budget
Tariff revenue (% of GDP) 0.9 1.4 0.8 0.81.3 1.3
Tariff revenue (% change) -33.2 10.9 -35.2 -38.33.9 2.6
Aggregate trade
Real exchange rate (% change) 2.6 1.1 1.8 2.0-0.9 -0.5
Aggregate exports (% change) 14.4 3.7 11.9 8.10.5 -0.6
Returns to mobile factors
Unskilled Labor (% change) 3.7 2.9 1.7 0.60.2 -0.1
Skilled Labor (% change) 5.3 2.8 3.2 1.70.0 -0.3
Capital (% change) 1.8 1.4 2.2 1.0-0.2 -0.3
Percent of Factors that must adjust
Unskilled labor 1.2 0.4 1.3 1.20.3 0.4
Skilled labor 1.4 0.7 1.0 0.6 0.2 0.3
Capital 0.5 0.1 0.4 0.3 0.3 0.4Source: Authors' estimates
c/ Numbers in parentheses are the standard deviations.
Table 5: Impact of Russian WTO Accession and the Doha Agenda Russia
Global Free Trade Doha
(results are percentage change from initial equilibrium)
WTO Reform of FDI WTO Accession 50% Reduction accession barriers only with partial of Tariff Barriers
reform of FDI in Russia only Full removal of barriers domestic support
(1) (2) (3) (4) (5) (6)
Welfare (EV as % of consumption) 7.3 5.3 4.1 1.30.2 -0.3
(2.2) c/ (1.5) (1.3) (0.8) (0.2) (0.2)
Welfare (EV as % of GDP) 3.4 2.4 1.9 0.60.1 -0.1
Tariff revenue (% of GDP) 0.9 1.4 0.8 0.81.3 1.3
Tariff revenue (% change) -33.2 10.9 -35.2 -38.33.9 2.6
Real exchange rate (% change) 2.6 1.1 1.8 2.0-0.9 -0.5
Aggregate exports (% change) 14.4 3.7 11.9 8.10.5 -0.6
Unskilled Labor (% change) 3.7 2.9 1.7 0.60.2 -0.1
Skilled Labor (% change) 5.3 2.8 3.2 1.70.0 -0.3
Capital (% change) 1.8 1.4 2.2 1.0-0.2 -0.3
Unskilled labor 1.2 0.4 1.3 1.20.3 0.4
Skilled labor 1.4 0.7 1.0 0.6 0.2 0.3
Capital 0.5 0.1 0.4 0.3 0.3 0.4Source: Authors' estimates
c/ Numbers in parentheses are the standard deviations.
on Economy-Wide Variables inRussia
Global Free Trade Doha
(results are percentage change from initial equilibrium)
WTO Reform of FDI WTO Accession 50% Reduction accession barriers only with partial of Tariff Barriers
reform of FDI in Russia only Full removal of barriers domestic support
(1) (2) (3) (4) (5) (6)
Aggregate welfare
Welfare (EV as % of consumption) 7.3 5.3 4.1 1.30.2 -0.3
(2.2) c/ (1.5) (1.3) (0.8) (0.2) (0.2)
Welfare (EV as % of GDP) 3.4 2.4 1.9 0.60.1 -0.1
Government budget
Tariff revenue (% of GDP) 0.9 1.4 0.8 0.81.3 1.3
Tariff revenue (% change) -33.2 10.9 -35.2 -38.33.9 2.6
Aggregate trade
Real exchange rate (% change) 2.6 1.1 1.8 2.0-0.9 -0.5
Aggregate exports (% change) 14.4 3.7 11.9 8.10.5 -0.6
Returns to mobile factors
Unskilled Labor (% change) 3.7 2.9 1.7 0.60.2 -0.1
Skilled Labor (% change) 5.3 2.8 3.2 1.70.0 -0.3
Capital (% change) 1.8 1.4 2.2 1.0-0.2 -0.3
Percent of Factors that must adjust
Unskilled labor 1.2 0.4 1.3 1.20.3 0.4
Skilled labor 1.4 0.7 1.0 0.6 0.2 0.3
Capital 0.5 0.1 0.4 0.3 0.3 0.4Source: Authors' estimates
c/ Numbers in parentheses are the standard deviations.
Russia
Global Free Trade Doha
(results are percentage change from initial equilibrium)
WTO Reform of FDI WTO Accession 50% Reduction accession barriers only with partial of Tariff Barriers
reform of FDI in Russia only Full removal of barriers domestic support
(1) (2) (3) (4) (5) (6)
Welfare (EV as % of consumption) 7.3 5.3 4.1 1.30.2 -0.3
(2.2) c/ (1.5) (1.3) (0.8) (0.2) (0.2)
Welfare (EV as % of GDP) 3.4 2.4 1.9 0.60.1 -0.1
Tariff revenue (% of GDP) 0.9 1.4 0.8 0.81.3 1.3
Tariff revenue (% change) -33.2 10.9 -35.2 -38.33.9 2.6
Real exchange rate (% change) 2.6 1.1 1.8 2.0-0.9 -0.5
Aggregate exports (% change) 14.4 3.7 11.9 8.10.5 -0.6
Unskilled Labor (% change) 3.7 2.9 1.7 0.60.2 -0.1
Skilled Labor (% change) 5.3 2.8 3.2 1.70.0 -0.3
Capital (% change) 1.8 1.4 2.2 1.0-0.2 -0.3
Unskilled labor 1.2 0.4 1.3 1.20.3 0.4
Skilled labor 1.4 0.7 1.0 0.6 0.2 0.3
Capital 0.5 0.1 0.4 0.3 0.3 0.4Source: Authors' estimates
c/ Numbers in parentheses are the standard deviations.
on Economy-Wide Variables inRussia
Global Free Trade Doha
(results are percentage change from initial equilibrium)
WTO Reform of FDI WTO Accession 50% Reduction accession barriers only with partial of Tariff Barriers
reform of FDI in Russia only Full removal of barriers domestic support
(1) (2) (3) (4) (5) (6)
Aggregate welfare
Welfare (EV as % of consumption) 7.3 5.3 4.1 1.30.2 -0.3
(2.2) c/ (1.5) (1.3) (0.8) (0.2) (0.2)
Welfare (EV as % of GDP) 3.4 2.4 1.9 0.60.1 -0.1
Government budget
Tariff revenue (% of GDP) 0.9 1.4 0.8 0.81.3 1.3
Tariff revenue (% change) -33.2 10.9 -35.2 -38.33.9 2.6
Aggregate trade
Real exchange rate (% change) 2.6 1.1 1.8 2.0-0.9 -0.5
Aggregate exports (% change) 14.4 3.7 11.9 8.10.5 -0.6
Returns to mobile factors
Unskilled Labor (% change) 3.7 2.9 1.7 0.60.2 -0.1
Skilled Labor (% change) 5.3 2.8 3.2 1.70.0 -0.3
Capital (% change) 1.8 1.4
(results are percentage change from initial equilibrium)
WTO Reform of FDI WTO Accession 50% Reduction accession barriers only with partial of Tariff Barriers
reform of FDI in Russia only Full removal of barriers domestic support
(1) (2) (3) (4) (5) (6)
Aggregate welfare
Welfare (EV as % of consumption) 7.3 5.3 4.1 1.30.2 -0.3
(2.2) c/ (1.5) (1.3) (0.8) (0.2) (0.2)
Welfare (EV as % of GDP) 3.4 2.4 1.9 0.60.1 -0.1
Government budget
Tariff revenue (% of GDP) 0.9 1.4 0.8 0.81.3 1.3
Tariff revenue (% change) -33.2 10.9 -35.2 -38.33.9 2.6
Aggregate trade
Real exchange rate (% change) 2.6 1.1 1.8 2.0-0.9 -0.5
Aggregate exports (% change) 14.4 3.7 11.9 8.10.5 -0.6
Returns to mobile factors
Unskilled Labor (% change) 3.7 2.9 1.7 0.60.2 -0.1
Skilled Labor (% change) 5.3 2.8 3.2 1.70.0 -0.3
Capital (% change) 1.8 1.4 2.2 1.0-0.2 -0.3
Percent of Factors that must adjust
Unskilled labor 1.2 0.4 1.3 1.20.3 0.4
Skilled labor 1.4 0.7 1.0 0.6 0.2 0.3
Capital 0.5 0.1 0.4 0.3 0.3 0.4Source: Authors' estimates
c/ Numbers in parentheses are the standard deviations.
Table 5: Impact of Russian WTO Accession and the Doha Agenda Russia
Global Free Trade Doha
(results are percentage change from initial equilibrium)
WTO Reform of FDI WTO Accession 50% Reduction accession barriers only with partial of Tariff Barriers
reform of FDI in Russia only Full removal of barriers domestic support
(1) (2) (3) (4) (5) (6)
Welfare (EV as % of consumption) 7.3 5.3 4.1 1.30.2 -0.3
(2.2) c/ (1.5) (1.3) (0.8) (0.2) (0.2)
Welfare (EV as % of GDP) 3.4 2.4 1.9 0.60.1 -0.1
Tariff revenue (% of GDP) 0.9 1.4 0.8 0.81.3 1.3
Tariff revenue (% change) -33.2 10.9 -35.2 -38.33.9 2.6
Real exchange rate (% change) 2.6 1.1 1.8 2.0-0.9 -0.5
Aggregate exports (% change) 14.4 3.7 11.9 8.10.5 -0.6
Unskilled Labor (% change) 3.7 2.9 1.7 0.60.2 -0.1
Skilled Labor (% change) 5.3 2.8 3.2 1.70.0 -0.3
Capital (% change) 1.8 1.4 2.2 1.0-
(results are percentage change from initial equilibrium)
WTO Reform of FDI WTO Accession 50% Reduction accession barriers only with partial of Tariff Barriers
reform of FDI in Russia only Full removal of barriers domestic support
(1) (2) (3) (4) (5) (6)
Welfare (EV as % of consumption) 7.3 5.3 4.1 1.30.2 -0.3
(2.2) c/ (1.5) (1.3) (0.8) (0.2) (0.2)
Welfare (EV as % of GDP) 3.4 2.4 1.9 0.60.1 -0.1
Tariff revenue (% of GDP) 0.9 1.4 0.8 0.81.3 1.3
Tariff revenue (% change) -33.2 10.9 -35.2 -38.33.9 2.6
Real exchange rate (% change) 2.6 1.1 1.8 2.0-0.9 -0.5
Aggregate exports (% change) 14.4 3.7 11.9 8.10.5 -0.6
Unskilled Labor (% change) 3.7 2.9 1.7 0.60.2 -0.1
Skilled Labor (% change) 5.3 2.8 3.2 1.70.0 -0.3
Capital (% change) 1.8 1.4 2.2 1.0-0.2 -0.3
Unskilled labor 1.2 0.4 1.3 1.20.3 0.4
Skilled labor 1.4 0.7 1.0 0.6 0.2 0.3
Capital 0.5 0.1 0.4 0.3 0.3 0.4Source: Authors' estimates
c/ Numbers in parentheses are the standard deviations.
on Economy-Wide Variables inRussia
Global Free Trade Doha
(results are percentage change from initial equilibrium)
WTO Reform of FDI WTO Accession 50% Reduction accession barriers only with partial of Tariff Barriers
reform of FDI in Russia only Full removal of barriers domestic support
(1) (2) (3) (4) (5) (6)
Aggregate welfare
Welfare (EV as % of consumption) 7.3 5.3 4.1 1.30.2 -0.3
(2.2) c/ (1.5) (1.3) (0.8) (0.2) (0.2)
Welfare (EV as % of GDP) 3.4 2.4 1.9 0.60.1 -0.1
Government budget
Tariff revenue (% of GDP) 0.9 1.4 0.8 0.81.3 1.3
Tariff revenue (% change) -33.2 10.9 -35.2 -38.33.9 2.6
Aggregate trade
Real exchange rate (% change) 2.6 1.1 1.8 2.0-0.9 -0.5
Aggregate exports (% change) 14.4 3.7 11.9 8.10.5 -0.6
Returns to mobile factors
Unskilled Labor (% change) 3.7 2.9 1.7 0.60.2 -0.1
Skilled Labor (% change) 5.3 2.8 3.2 1.70.0 -0.3
Capital (% change) 1.8
(results are percentage change from initial equilibrium)
WTO Reform of FDI WTO Accession 50% Reduction accession barriers only with partial of Tariff Barriers
reform of FDI in Russia only Full removal of barriers domestic support
(1) (2) (3) (4) (5) (6)
Aggregate welfare
Welfare (EV as % of consumption) 7.3 5.3 4.1 1.30.2 -0.3
(2.2) c/ (1.5) (1.3) (0.8) (0.2) (0.2)
Welfare (EV as % of GDP) 3.4 2.4 1.9 0.60.1 -0.1
Government budget
Tariff revenue (% of GDP) 0.9 1.4 0.8 0.81.3 1.3
Tariff revenue (% change) -33.2 10.9 -35.2 -38.33.9 2.6
Aggregate trade
Real exchange rate (% change) 2.6 1.1 1.8 2.0-0.9 -0.5
Aggregate exports (% change) 14.4 3.7 11.9 8.10.5 -0.6
Returns to mobile factors
Unskilled Labor (% change) 3.7 2.9 1.7 0.60.2 -0.1
Skilled Labor (% change) 5.3 2.8 3.2 1.70.0 -0.3
Capital (% change) 1.8 1.4 2.2 1.0-0.2 -0.3
Percent of Factors that must adjust
Unskilled labor 1.2 0.4 1.3 1.20.3 0.4
Skilled labor 1.4 0.7 1.0 0.6 0.2 0.3
Capital 0.5 0.1 0.4 0.3 0.3 0.4Source: Authors' estimates
c/ Numbers in parentheses are the standard deviations.
Russia
Global Free Trade Doha
(results are percentage change from initial equilibrium)
WTO Reform of FDI WTO Accession 50% Reduction accession barriers only with partial of Tariff Barriers
reform of FDI in Russia only Full removal of barriers domestic support
(1) (2) (3) (4) (5) (6)
Welfare (EV as % of consumption) 7.3 5.3 4.1 1.30.2 -0.3
(2.2) c/ (1.5) (1.3) (0.8) (0.2) (0.2)
Welfare (EV as % of GDP) 3.4 2.4 1.9 0.60.1 -0.1
Tariff revenue (% of GDP) 0.9 1.4 0.8 0.81.3 1.3
Tariff revenue (% change) -33.2 10.9 -35.2 -38.33.9 2.6
Real exchange rate (% change) 2.6 1.1 1.8 2.0-0.9 -0.5
Aggregate exports (% change) 14.4 3.7 11.9 8.10.5 -0.6
Unskilled Labor (% change) 3.7 2.9 1.7 0.60.2 -0.1
Skilled Labor (% change) 5.3 2.8 3.2 1.70.0 -0.3
Capital (% change) 1.8 1.4 2.2 1.0-
(results are percentage change from initial equilibrium)
WTO Reform of FDI WTO Accession 50% Reduction accession barriers only with partial of Tariff Barriers
reform of FDI in Russia only Full removal of barriers domestic support
(1) (2) (3) (4) (5) (6)
Welfare (EV as % of consumption) 7.3 5.3 4.1 1.30.2 -0.3
(2.2) c/ (1.5) (1.3) (0.8) (0.2) (0.2)
Welfare (EV as % of GDP) 3.4 2.4 1.9 0.60.1 -0.1
Tariff revenue (% of GDP) 0.9 1.4 0.8 0.81.3 1.3
Tariff revenue (% change) -33.2 10.9 -35.2 -38.33.9 2.6
Real exchange rate (% change) 2.6 1.1 1.8 2.0-0.9 -0.5
Aggregate exports (% change) 14.4 3.7 11.9 8.10.5 -0.6
Unskilled Labor (% change) 3.7 2.9 1.7 0.60.2 -0.1
Skilled Labor (% change) 5.3 2.8 3.2 1.70.0 -0.3
Capital (% change) 1.8 1.4 2.2 1.0-0.2 -0.3
Unskilled labor 1.2 0.4 1.3 1.20.3 0.4
Skilled labor 1.4 0.7 1.0 0.6 0.2 0.3
Capital 0.5 0.1 0.4 0.3 0.3 0.4Source: Authors' estimates
c/ Numbers in parentheses are the standard deviations.
on Economy-Wide Variables inRussia
Global Free Trade Doha
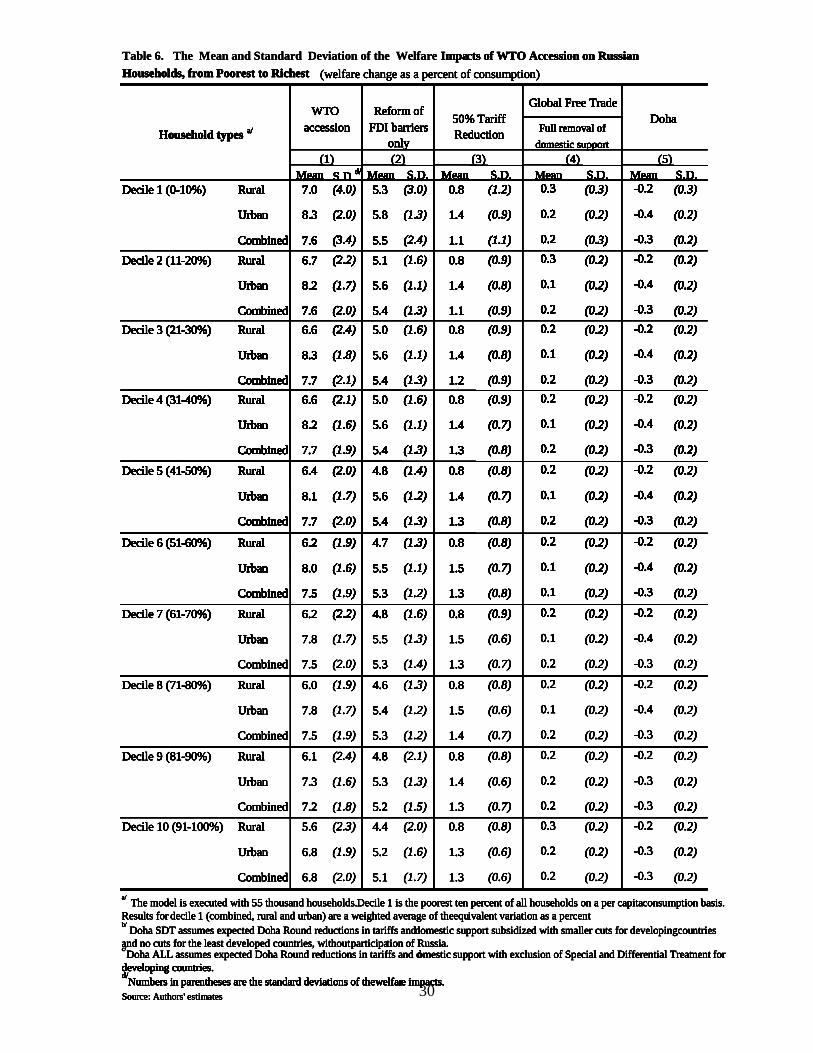
30
Mean S.D.d/ Mean S.D. Mean S.D. Mean S.D. Mean S.D.Decile 1 (0-10%) Rural 7.0 (4.0) 5.3 (3.0) 0.8 (1.2) 0.3 (0.3) -0.2 (0.3)
Urban 8.3 (2.0) 5.8 (1.3) 1.4 (0.9) 0.2 (0.2) -0.4 (0.2)
Combined 7.6 (3.4) 5.5 (2.4) 1.1 (1.1) 0.2 (0.3) -0.3 (0.2)
Decile 2 (11-20%) Rural 6.7 (2.2) 5.1 (1.6) 0.8 (0.9) 0.3 (0.2) -0.2 (0.2)
Urban 8.2 (1.7) 5.6 (1.1) 1.4 (0.8) 0.1 (0.2) -0.4 (0.2)
Combined 7.6 (2.0) 5.4 (1.3) 1.1 (0.9) 0.2 (0.2) -0.3 (0.2)Decile 3 (21-30%) Rural 6.6 (2.4) 5.0 (1.6) 0.8 (0.9) 0.2 (0.2) -0.2 (0.2)
Urban 8.3 (1.8) 5.6 (1.1) 1.4 (0.8) 0.1 (0.2) -0.4 (0.2)
Combined 7.7 (2.1) 5.4 (1.3) 1.2 (0.9) 0.2 (0.2) -0.3 (0.2)Decile 4 (31-40%) Rural 6.6 (2.1) 5.0 (1.6) 0.8 (0.9) 0.2 (0.2) -0.2 (0.2)
Urban 8.2 (1.6) 5.6 (1.1) 1.4 (0.7) 0.1 (0.2) -0.4 (0.2)
Combined 7.7 (1.9) 5.4 (1.3) 1.3 (0.8) 0.2 (0.2) -0.3 (0.2)
Decile 5 (41-50%) Rural 6.4 (2.0) 4.8 (1.4) 0.8 (0.8) 0.2 (0.2) -0.2 (0.2)
Urban 8.1 (1.7) 5.6 (1.2) 1.4 (0.7) 0.1 (0.2) -0.4 (0.2)
Combined 7.7 (2.0) 5.4 (1.3) 1.3 (0.8) 0.2 (0.2) -0.3 (0.2)
Decile 6 (51-60%) Rural 6.2 (1.9) 4.7 (1.3) 0.8 (0.8) 0.2 (0.2) -0.2 (0.2)
Urban 8.0 (1.6) 5.5 (1.1) 1.5 (0.7) 0.1 (0.2) -0.4 (0.2)
Combined 7.5 (1.9) 5.3 (1.2) 1.3 (0.8) 0.1 (0.2) -0.3 (0.2)
Decile 7 (61-70%) Rural 6.2 (2.2) 4.8 (1.6) 0.8 (0.9) 0.2 (0.2) -0.2 (0.2)
Urban 7.8 (1.7) 5.5 (1.3) 1.5 (0.6) 0.1 (0.2) -0.4 (0.2)
Combined 7.5 (2.0) 5.3 (1.4) 1.3 (0.7) 0.2 (0.2) -0.3 (0.2)
Decile 8 (71-80%) Rural 6.0 (1.9) 4.6 (1.3) 0.8 (0.8) 0.2 (0.2) -0.2 (0.2)
Urban 7.8 (1.7) 5.4 (1.2) 1.5 (0.6) 0.1 (0.2) -0.4 (0.2)
Combined 7.5 (1.9) 5.3 (1.2) 1.4 (0.7) 0.2 (0.2) -0.3 (0.2)
Decile 9 (81-90%) Rural 6.1 (2.4) 4.8 (2.1) 0.8 (0.8) 0.2 (0.2) -0.2 (0.2)
Urban 7.3 (1.6) 5.3 (1.3) 1.4 (0.6) 0.2 (0.2) -0.3 (0.2)
Combined 7.2 (1.8) 5.2 (1.5) 1.3 (0.7) 0.2 (0.2) -0.3 (0.2)
Decile 10 (91-100%) Rural 5.6 (2.3) 4.4 (2.0) 0.8 (0.8) 0.3 (0.2) -0.2 (0.2)
Urban 6.8 (1.9) 5.2 (1.6) 1.3 (0.6) 0.2 (0.2) -0.3 (0.2)
Combined 6.8 (2.0) 5.1 (1.7) 1.3 (0.6) 0.2 (0.2) -0.3 (0.2)
Source: Authors' estimates
Table 6. The Mean and Standard Deviation of the Welfare Impacts of WTO Accession on Russian Households, from Poorest to Richest (welfare change as a percent of consumption)
a/ The model is executed with 55 thousand households. Decile 1 is the poorest ten percent of all households on a per capita consumption basis. Results for decile 1 (combined, rural and urban) are a weighted average of theequivalent variation as a percentb/
Doha SDT assumes expected Doha Round reductions in tariffs and domestic support subsidized with smaller cuts for developingcountriesand no cuts for the least developed countries, withoutparticipation of Russia. c/Doha ALL assumes expected Doha Round reductions in tariffs and domestic support with exclusion of Special and Differential Treatment for developing countries.
WTO
Household types a/ accession Full removal ofdomestic support
Global Free Trade
(1) (3) (4)
d/Numbers in parentheses are the standard deviations of thewelfare impacts.
(2) (5)
Reform ofFDI barriers
only
50% Tariff Reduction
Doha
Mean S.D.d/ Mean S.D. Mean S.D. Mean S.D. Mean S.D.Decile 1 (0-10%) Rural 7.0 (4.0) 5.3 (3.0) 0.8 (1.2) 0.3 (0.3) -0.2 (0.3)
Urban 8.3 (2.0) 5.8 (1.3) 1.4 (0.9) 0.2 (0.2) -0.4 (0.2)
Combined 7.6 (3.4) 5.5 (2.4) 1.1 (1.1) 0.2 (0.3) -0.3 (0.2)
Decile 2 (11-20%) Rural 6.7 (2.2) 5.1 (1.6) 0.8 (0.9) 0.3 (0.2) -0.2 (0.2)
Urban 8.2 (1.7) 5.6 (1.1) 1.4 (0.8) 0.1 (0.2) -0.4 (0.2)
Combined 7.6 (2.0) 5.4 (1.3) 1.1 (0.9) 0.2 (0.2) -0.3 (0.2)Decile 3 (21-30%) Rural 6.6 (2.4) 5.0 (1.6) 0.8 (0.9) 0.2 (0.2) -0.2 (0.2)
Urban 8.3 (1.8) 5.6 (1.1) 1.4 (0.8) 0.1 (0.2) -0.4 (0.2)
Combined 7.7 (2.1) 5.4 (1.3) 1.2 (0.9) 0.2 (0.2) -0.3 (0.2)Decile 4 (31-40%) Rural 6.6 (2.1) 5.0 (1.6) 0.8 (0.9) 0.2 (0.2) -0.2 (0.2)
Urban 8.2 (1.6) 5.6 (1.1) 1.4 (0.7) 0.1 (0.2) -0.4 (0.2)
Combined 7.7 (1.9) 5.4 (1.3) 1.3 (0.8) 0.2 (0.2) -0.3 (0.2)
Decile 5 (41-50%) Rural 6.4 (2.0) 4.8 (1.4) 0.8 (0.8) 0.2 (0.2) -0.2 (0.2)
Urban 8.1 (1.7) 5.6 (1.2) 1.4 (0.7) 0.1 (0.2) -0.4 (0.2)
Combined 7.7 (2.0) 5.4 (1.3) 1.3 (0.8) 0.2 (0.2) -0.3 (0.2)
Decile 6 (51-60%) Rural 6.2 (1.9) 4.7 (1.3) 0.8 (0.8) 0.2 (0.2) -0.2 (0.2)
Urban 8.0
Mean S.D.d/ Mean S.D. Mean S.D. Mean S.D. Mean S.D.Decile 1 (0-10%) Rural 7.0 (4.0) 5.3 (3.0) 0.8 (1.2) 0.3 (0.3) -0.2 (0.3)
Urban 8.3 (2.0) 5.8 (1.3) 1.4 (0.9) 0.2 (0.2) -0.4 (0.2)
Combined 7.6 (3.4) 5.5 (2.4) 1.1 (1.1) 0.2 (0.3) -0.3 (0.2)
Decile 2 (11-20%) Rural 6.7 (2.2) 5.1 (1.6) 0.8 (0.9) 0.3 (0.2) -0.2 (0.2)
Urban 8.2 (1.7) 5.6 (1.1) 1.4 (0.8) 0.1 (0.2) -0.4 (0.2)
Combined 7.6 (2.0) 5.4 (1.3) 1.1 (0.9) 0.2 (0.2) -0.3 (0.2)Decile 3 (21-30%) Rural 6.6 (2.4) 5.0 (1.6) 0.8 (0.9) 0.2 (0.2) -0.2 (0.2)
Urban 8.3 (1.8) 5.6 (1.1) 1.4 (0.8) 0.1 (0.2) -0.4 (0.2)
Combined 7.7 (2.1) 5.4 (1.3) 1.2 (0.9) 0.2 (0.2) -0.3 (0.2)Decile 4 (31-40%) Rural 6.6 (2.1) 5.0 (1.6) 0.8 (0.9) 0.2 (0.2) -0.2 (0.2)
Urban 8.2 (1.6) 5.6 (1.1) 1.4 (0.7) 0.1 (0.2) -0.4 (0.2)
Combined 7.7 (1.9) 5.4 (1.3) 1.3 (0.8) 0.2 (0.2) -0.3 (0.2)
Decile 5 (41-50%) Rural 6.4 (2.0) 4.8 (1.4) 0.8 (0.8) 0.2 (0.2) -0.2 (0.2)
Urban 8.1 (1.7) 5.6 (1.2) 1.4 (0.7) 0.1 (0.2) -0.4 (0.2)
Combined 7.7 (2.0) 5.4 (1.3) 1.3 (0.8) 0.2 (0.2) -0.3 (0.2)
Decile 6 (51-60%) Rural 6.2 (1.9) 4.7 (1.3) 0.8 (0.8) 0.2 (0.2) -0.2 (0.2)
Urban 8.0 (1.6) 5.5 (1.1) 1.5 (0.7) 0.1 (0.2) -0.4 (0.2)
Combined 7.5 (1.9) 5.3 (1.2) 1.3 (0.8) 0.1 (0.2) -0.3 (0.2)
Decile 7 (61-70%) Rural 6.2 (2.2) 4.8 (1.6) 0.8 (0.9) 0.2 (0.2) -0.2 (0.2)
Urban
developing countries.
WTO
Household types a/ accession Full removal ofdomestic support
Global Free Trade
(1) (3) (4)
d/Numbers in parentheses are the standard deviations of thewelfare impacts.
(2) (5)
Reform ofFDI barriers
only
50% Tariff Reduction
Doha
Mean S.D.d/ Mean S.D. Mean S.D. Mean S.D. Mean S.D.Decile 1 (0-10%) Rural 7.0 (4.0) 5.3 (3.0) 0.8 (1.2) 0.3 (0.3) -0.2 (0.3)
Urban 8.3 (2.0) 5.8 (1.3) 1.4 (0.9) 0.2 (0.2) -0.4 (0.2)
Combined 7.6 (3.4) 5.5 (2.4) 1.1 (1.1) 0.2 (0.3) -0.3 (0.2)
Decile 2 (11-20%) Rural 6.7 (2.2) 5.1 (1.6) 0.8 (0.9) 0.3 (0.2) -0.2 (0.2)
Urban 8.2 (1.7) 5.6 (1.1) 1.4 (0.8) 0.1 (0.2) -0.4 (0.2)
Combined 7.6 (2.0) 5.4 (1.3) 1.1 (0.9) 0.2 (0.2) -0.3 (0.2)Decile 3 (21-30%) Rural 6.6 (2.4) 5.0 (1.6) 0.8 (0.9) 0.2 (0.2) -0.2 (0.2)
Urban 8.3 (1.8) 5.6 (1.1) 1.4 (0.8) 0.1 (0.2) -0.4 (0.2)
Combined 7.7 (2.1) 5.4 (1.3) 1.2 (0.9) 0.2 (0.2) -0.3 (0.2)Decile 4 (31-40%) Rural 6.6 (2.1) 5.0 (1.6) 0.8 (0.9) 0.2 (0.2) -0.2 (0.2)
Urban 8.2 (1.6) 5.6 (1.1) 1.4 (0.7) 0.1 (0.2) -0.4 (0.2)
Combined 7.7 (1.9) 5.4 (1.3) 1.3 (0.8) 0.2 (0.2) -0.3 (0.2)
Decile 5 (41-50%) Rural 6.4 (2.0) 4.8 (1.4) 0.8 (0.8) 0.2 (0.2) -0.2 (0.2)
Urban 8.1 (1.7) 5.6 (1.2) 1.4 (0.7) 0.1 (0.2) -0.4 (0.2)
Combined
Mean S.D.d/ Mean S.D. Mean S.D. Mean S.D. Mean S.D.Decile 1 (0-10%) Rural 7.0 (4.0) 5.3 (3.0) 0.8 (1.2) 0.3 (0.3) -0.2 (0.3)
Urban 8.3 (2.0) 5.8 (1.3) 1.4 (0.9) 0.2 (0.2) -0.4 (0.2)
Combined 7.6 (3.4) 5.5 (2.4) 1.1 (1.1) 0.2 (0.3) -0.3 (0.2)
Decile 2 (11-20%) Rural 6.7 (2.2) 5.1 (1.6) 0.8 (0.9) 0.3 (0.2) -0.2 (0.2)
Urban 8.2 (1.7) 5.6 (1.1) 1.4 (0.8) 0.1 (0.2) -0.4 (0.2)
Combined 7.6 (2.0) 5.4 (1.3) 1.1 (0.9) 0.2 (0.2) -0.3 (0.2)Decile 3 (21-30%) Rural 6.6 (2.4) 5.0 (1.6) 0.8 (0.9) 0.2 (0.2) -0.2 (0.2)
Urban 8.3 (1.8) 5.6 (1.1) 1.4 (0.8) 0.1 (0.2) -0.4 (0.2)
Combined 7.7 (2.1) 5.4 (1.3) 1.2 (0.9) 0.2 (0.2) -0.3 (0.2)Decile 4 (31-40%) Rural 6.6 (2.1) 5.0 (1.6) 0.8 (0.9) 0.2 (0.2) -0.2 (0.2)
Urban 8.2 (1.6) 5.6 (1.1) 1.4 (0.7) 0.1 (0.2) -0.4 (0.2)
Combined 7.7 (1.9) 5.4 (1.3) 1.3 (0.8) 0.2 (0.2) -0.3 (0.2)
Decile 5 (41-50%) Rural 6.4 (2.0) 4.8 (1.4) 0.8 (0.8) 0.2 (0.2) -0.2 (0.2)
Urban 8.1 (1.7) 5.6 (1.2) 1.4 (0.7) 0.1 (0.2) -0.4 (0.2)
Combined 7.7 (2.0) 5.4 (1.3) 1.3 (0.8) 0.2 (0.2) -0.3 (0.2)
Decile 6 (51-60%) Rural 6.2 (1.9) 4.7 (1.3) 0.8 (0.8) 0.2 (0.2) -0.2 (0.2)
Urban 8.0 (1.6) 5.5 (1.1) 1.5 (0.7) 0.1 (0.2) -0.4 (0.2)
Combined 7.5 (1.9) 5.3 (1.2) 1.3 (0.8) 0.1 (0.2) -0.3 (0.2)
Decile 7 (61-70%) Rural 6.2 (2.2) 4.8 (1.6) 0.8 (0.9) 0.2 (0.2) -0.2 (0.2)
Urban 7.8 (1.7) 5.5 (1.3) 1.5 (0.6) 0.1 (0.2) -0.4 (0.2)
Combined 7.5 (2.0) 5.3 (1.4) 1.3 (0.7) 0.2 (0.2) -0.3 (0.2)
Decile 8 (71-80%) Rural 6.0 (1.9) 4.6 (1.3) 0.8 (0.8) 0.2 (0.2) -0.2 (0.2)
Urban 7.8 (1.7) 5.4 (1.2) 1.5 (0.6) 0.1 (0.2) -0.4 (0.2)
Combined 7.5 (1.9) 5.3 (1.2) 1.4 (0.7) 0.2 (0.2) -0.3 (0.2)
Decile 9 (81-90%) Rural 6.1 (2.4) 4.8 (2.1) 0.8 (0.8) 0.2 (0.2) -0.2 (0.2)
Urban 7.3 (1.6) 5.3 (1.3) 1.4 (0.6) 0.2 (0.2) -0.3 (0.2)
Combined 7.2 (1.8) 5.2 (1.5) 1.3 (0.7) 0.2 (0.2) -0.3 (0.2)
Decile 10 (91-100%) Rural 5.6 (2.3) 4.4 (2.0) 0.8 (0.8) 0.3 (0.2) -0.2 (0.2)
Urban 6.8 (1.9) 5.2 (1.6) 1.3 (0.6) 0.2 (0.2) -0.3 (0.2)
Combined
7.7 (2.0) 5.4 (1.3) 1.3 (0.8) 0.2 (0.2) -0.3 (0.2)
Decile 6 (51-60%) Rural 6.2 (1.9) 4.7 (1.3) 0.8 (0.8) 0.2 (0.2) -0.2 (0.2)
Urban 8.0 (1.6) 5.5 (1.1) 1.5 (0.7) 0.1 (0.2) -0.4 (0.2)
Combined 7.5 (1.9) 5.3 (1.2) 1.3 (0.8) 0.1 (0.2) -0.3 (0.2)
Decile 7 (61-70%) Rural 6.2 (2.2) 4.8 (1.6) 0.8 (0.9) 0.2 (0.2) -0.2 (0.2)
Urban 7.8 (1.7) 5.5 (1.3) 1.5 (0.6) 0.1 (0.2) -0.4 (0.2)
Combined 7.5 (2.0) 5.3 (1.4) 1.3 (0.7) 0.2 (0.2) -0.3 (0.2)
Decile 8 (71-80%) Rural 6.0 (1.9) 4.6 (1.3) 0.8 (0.8) 0.2 (0.2) -0.2 (0.2)
Urban 7.8 (1.7) 5.4 (1.2) 1.5 (0.6) 0.1 (0.2) -0.4 (0.2)
Combined 7.5 (1.9) 5.3 (1.2) 1.4 (0.7) 0.2 (0.2) -0.3 (0.2)
Decile 9 (81-90%) Rural 6.1 (2.4) 4.8 (2.1) 0.8 (0.8) 0.2 (0.2) -0.2 (0.2)
Urban 7.3 (1.6) 5.3 (1.3) 1.4 (0.6) 0.2 (0.2) -0.3 (0.2)
Combined 7.2 (1.8) 5.2 (1.5) 1.3 (0.7) 0.2 (0.2) -0.3 (0.2)
Decile 10 (91-100%) Rural 5.6 (2.3) 4.4 (2.0) 0.8 (0.8) 0.3 (0.2) -0.2 (0.2)
Urban 6.8 (1.9) 5.2 (1.6) 1.3 (0.6) 0.2 (0.2) -0.3 (0.2)
Combined 6.8 (2.0) 5.1 (1.7) 1.3 (0.6) 0.2 (0.2) -0.3 (0.2)
Source: Authors' estimates
Impacts of WTO Accession on Russian Households, from Poorest to Richest (welfare change as a percent of consumption)
a/ The model is executed with 55 thousand households. Decile 1 is the poorest ten percent of all households on a per capita consumption basis. Results for decile 1 (combined, rural and urban) are a weighted average of theequivalent variation as a percentb/
Doha SDT assumes expected Doha Round reductions in tariffs and domestic support subsidized with smaller cuts for developingcountriesand no cuts for the least developed countries, withoutparticipation of Russia. c/Doha ALL assumes expected Doha Round reductions in tariffs and domestic support with exclusion of Special and Differential Treatment for developing countries.
WTO
Household types a/ accession Full removal ofdomestic support
Global Free Trade
(1) (3) (4)
d/Numbers in parentheses are the standard deviations of thewelfare impacts.
(2) (5)
Reform ofFDI barriers
only
50% Tariff Reduction
Doha
Mean S.D.d/ Mean S.D. Mean S.D. Mean S.D. Mean S.D.Decile 1 (0-10%) Rural 7.0 (4.0) 5.3 (3.0) 0.8 (1.2) 0.3 (0.3) -0.2 (0.3)
Urban 8.3 (2.0) 5.8 (1.3) 1.4 (0.9) 0.2 (0.2) -0.4 (0.2)
Combined 7.6 (3.4) 5.5 (2.4) 1.1 (1.1) 0.2 (0.3) -0.3 (0.2)
Decile 2 (11-20%) Rural 6.7 (2.2) 5.1 (1.6) 0.8 (0.9) 0.3 (0.2) -0.2 (0.2)
Urban 8.2 (1.7) 5.6 (1.1) 1.4 (0.8) 0.1 (0.2) -0.4 (0.2)
Combined 7.6 (2.0) 5.4 (1.3) 1.1 (0.9) 0.2 (0.2) -0.3 (0.2)Decile 3 (21-30%) Rural 6.6
6.8 (2.0) 5.1 (1.7) 1.3 (0.6) 0.2 (0.2) -0.3 (0.2)
Source: Authors' estimates
Impacts of WTO Accession on Russian Households, from Poorest to Richest (welfare change as a percent of consumption)
a/ The model is executed with 55 thousand households. Decile 1 is the poorest ten percent of all households on a per capita consumption basis. Results for decile 1 (combined, rural and urban) are a weighted average of theequivalent variation as a percentb/
Doha SDT assumes expected Doha Round reductions in tariffs and domestic support subsidized with smaller cuts for developingcountriesand no cuts for the least developed countries, withoutparticipation of Russia. c/Doha ALL assumes expected Doha Round reductions in tariffs and domestic support with exclusion of Special and Differential Treatment for developing countries.
WTO
Household types a/ accession Full removal ofdomestic support
Global Free Trade
(1) (3) (4)
d/Numbers in parentheses are the standard deviations of thewelfare impacts.
(2) (5)
Reform ofFDI barriers
only
50% Tariff Reduction
Doha
Mean S.D.d/ Mean S.D. Mean S.D. Mean S.D. Mean S.D.Decile 1 (0-10%) Rural 7.0 (4.0) 5.3 (3.0) 0.8 (1.2) 0.3 (0.3) -0.2 (0.3)
Urban 8.3 (2.0) 5.8 (1.3) 1.4 (0.9) 0.2 (0.2) -0.4 (0.2)
Combined 7.6 (3.4) 5.5 (2.4) 1.1 (1.1) 0.2 (0.3) -0.3 (0.2)
Decile 2 (11-20%) Rural 6.7 (2.2) 5.1 (1.6) 0.8 (0.9) 0.3 (0.2) -0.2 (0.2)
Urban 8.2 (1.7) 5.6 (1.1) 1.4 (0.8) 0.1 (0.2) -0.4 (0.2)
Combined 7.6 (2.0) 5.4 (1.3) 1.1 (0.9) 0.2 (0.2) -0.3 (0.2)Decile 3 (21-30%) Rural 6.6 (2.4) 5.0 (1.6) 0.8 (0.9) 0.2 (0.2) -0.2 (0.2)
Urban 8.3 (1.8) 5.6 (1.1) 1.4 (0.8) 0.1 (0.2) -0.4 (0.2)
Combined 7.7 (2.1) 5.4 (1.3) 1.2 (0.9) 0.2 (0.2) -0.3 (0.2)Decile 4 (31-40%) Rural 6.6 (2.1) 5.0 (1.6) 0.8 (0.9) 0.2 (0.2) -0.2 (0.2)
Urban 8.2 (1.6) 5.6 (1.1) 1.4 (0.7) 0.1 (0.2) -0.4 (0.2)
Combined 7.7 (1.9) 5.4 (1.3) 1.3 (0.8) 0.2 (0.2) -0.3 (0.2)
Decile 5 (41-50%) Rural 6.4 (2.0) 4.8 (1.4) 0.8 (0.8) 0.2 (0.2) -0.2 (0.2)
Urban 8.1 (1.7) 5.6 (1.2) 1.4 (0.7) 0.1 (0.2) -0.4 (0.2)
Combined 7.7 (2.0) 5.4 (1.3) 1.3 (0.8) 0.2 (0.2) -0.3 (0.2)
Decile 6 (51-60%) Rural 6.2 (1.9) 4.7 (1.3) 0.8 (0.8) 0.2 (0.2) -0.2 (0.2)
Urban 8.0
Mean S.D.d/ Mean S.D. Mean S.D. Mean S.D. Mean S.D.Decile 1 (0-10%) Rural 7.0 (4.0) 5.3 (3.0) 0.8 (1.2) 0.3 (0.3) -0.2 (0.3)
Urban 8.3 (2.0) 5.8 (1.3) 1.4 (0.9) 0.2 (0.2) -0.4 (0.2)
Combined 7.6 (3.4) 5.5 (2.4) 1.1 (1.1) 0.2 (0.3) -0.3 (0.2)
Decile 2 (11-20%) Rural 6.7 (2.2) 5.1 (1.6) 0.8 (0.9) 0.3 (0.2) -0.2 (0.2)
Urban
(2.4) 5.0 (1.6) 0.8 (0.9) 0.2 (0.2) -0.2 (0.2)
Urban 8.3 (1.8) 5.6 (1.1) 1.4 (0.8) 0.1 (0.2) -0.4 (0.2)
Combined 7.7 (2.1) 5.4 (1.3) 1.2 (0.9) 0.2 (0.2) -0.3 (0.2)Decile 4 (31-40%) Rural 6.6 (2.1) 5.0 (1.6) 0.8 (0.9) 0.2 (0.2) -0.2 (0.2)
Urban 8.2 (1.6) 5.6 (1.1) 1.4 (0.7) 0.1 (0.2) -0.4 (0.2)
Combined 7.7 (1.9) 5.4 (1.3) 1.3 (0.8) 0.2 (0.2) -0.3 (0.2)
Decile 5 (41-50%) Rural 6.4 (2.0) 4.8 (1.4) 0.8 (0.8) 0.2 (0.2) -0.2 (0.2)
Urban 8.1 (1.7) 5.6 (1.2) 1.4 (0.7) 0.1 (0.2) -0.4 (0.2)
Combined 7.7 (2.0) 5.4 (1.3) 1.3 (0.8) 0.2 (0.2) -0.3 (0.2)
Decile 6 (51-60%) Rural 6.2 (1.9) 4.7 (1.3) 0.8 (0.8) 0.2 (0.2) -0.2 (0.2)
Urban 8.0
Mean S.D.d/ Mean S.D. Mean S.D. Mean S.D. Mean S.D.Decile 1 (0-10%) Rural 7.0 (4.0) 5.3 (3.0) 0.8 (1.2) 0.3 (0.3) -0.2 (0.3)
Urban 8.3 (2.0) 5.8 (1.3) 1.4 (0.9) 0.2 (0.2) -0.4 (0.2)
Combined 7.6 (3.4) 5.5 (2.4) 1.1 (1.1) 0.2 (0.3) -0.3 (0.2)
Decile 2 (11-20%) Rural 6.7 (2.2) 5.1 (1.6) 0.8 (0.9) 0.3 (0.2) -0.2 (0.2)
Urban 8.2 (1.7) 5.6 (1.1) 1.4 (0.8) 0.1 (0.2) -0.4 (0.2)
Combined 7.6 (2.0) 5.4 (1.3) 1.1 (0.9) 0.2 (0.2) -0.3 (0.2)Decile 3 (21-30%) Rural 6.6 (2.4) 5.0 (1.6) 0.8 (0.9) 0.2 (0.2) -0.2 (0.2)
Urban 8.3 (1.8) 5.6 (1.1) 1.4 (0.8) 0.1 (0.2) -0.4 (0.2)
Combined 7.7 (2.1) 5.4 (1.3) 1.2 (0.9) 0.2 (0.2) -0.3 (0.2)Decile 4 (31-40%) Rural 6.6 (2.1) 5.0 (1.6) 0.8 (0.9) 0.2 (0.2) -0.2 (0.2)
Urban 8.2 (1.6) 5.6 (1.1) 1.4 (0.7) 0.1 (0.2) -0.4 (0.2)
Combined 7.7 (1.9) 5.4 (1.3) 1.3 (0.8) 0.2 (0.2) -0.3 (0.2)
Decile 5 (41-50%) Rural 6.4 (2.0) 4.8 (1.4) 0.8 (0.8) 0.2 (0.2) -0.2 (0.2)
Urban 8.1 (1.7) 5.6 (1.2) 1.4 (0.7) 0.1 (0.2) -0.4 (0.2)
Combined 7.7 (2.0) 5.4 (1.3) 1.3 (0.8) 0.2 (0.2) -0.3 (0.2)
Decile 6 (51-60%) Rural 6.2 (1.9) 4.7 (1.3) 0.8 (0.8) 0.2 (0.2) -0.2 (0.2)
Urban 8.0 (1.6) 5.5 (1.1) 1.5 (0.7) 0.1 (0.2) -0.4 (0.2)
Combined 7.5 (1.9) 5.3 (1.2) 1.3 (0.8) 0.1 (0.2) -0.3 (0.2)
Decile 7 (61-70%) Rural 6.2 (2.2) 4.8 (1.6) 0.8 (0.9) 0.2 (0.2) -0.2 (0.2)
Urban
8.2 (1.7) 5.6 (1.1) 1.4 (0.8) 0.1 (0.2) -0.4 (0.2)
Combined 7.6 (2.0) 5.4 (1.3) 1.1 (0.9) 0.2 (0.2) -0.3 (0.2)Decile 3 (21-30%) Rural 6.6 (2.4) 5.0 (1.6) 0.8 (0.9) 0.2 (0.2) -0.2 (0.2)
Urban 8.3 (1.8) 5.6 (1.1) 1.4 (0.8) 0.1 (0.2) -0.4 (0.2)
Combined 7.7 (2.1) 5.4 (1.3) 1.2 (0.9) 0.2 (0.2) -0.3 (0.2)Decile 4 (31-40%) Rural 6.6 (2.1) 5.0 (1.6) 0.8 (0.9) 0.2 (0.2) -0.2 (0.2)
Urban 8.2 (1.6) 5.6 (1.1) 1.4 (0.7) 0.1 (0.2) -0.4 (0.2)
Combined 7.7 (1.9) 5.4 (1.3) 1.3 (0.8) 0.2 (0.2) -0.3 (0.2)
Decile 5 (41-50%) Rural 6.4 (2.0) 4.8 (1.4) 0.8 (0.8) 0.2 (0.2) -0.2 (0.2)
Urban 8.1 (1.7) 5.6 (1.2) 1.4 (0.7) 0.1 (0.2) -0.4 (0.2)
Combined 7.7 (2.0) 5.4 (1.3) 1.3 (0.8) 0.2 (0.2) -0.3 (0.2)
Decile 6 (51-60%) Rural 6.2 (1.9) 4.7 (1.3) 0.8 (0.8) 0.2 (0.2) -0.2 (0.2)
Urban 8.0 (1.6) 5.5 (1.1) 1.5 (0.7) 0.1 (0.2) -0.4 (0.2)
Combined 7.5 (1.9) 5.3 (1.2) 1.3 (0.8) 0.1 (0.2) -0.3 (0.2)
Decile 7 (61-70%) Rural 6.2 (2.2) 4.8 (1.6) 0.8 (0.9) 0.2 (0.2) -0.2 (0.2)
Urban
developing countries.
WTO
Household types a/ accession Full removal ofdomestic support
Global Free Trade
(1) (3) (4)
d/Numbers in parentheses are the standard deviations of thewelfare impacts.
(2) (5)
Reform ofFDI barriers
only
50% Tariff Reduction
Doha
Mean S.D.d/ Mean S.D. Mean S.D. Mean S.D. Mean S.D.Decile 1 (0-10%) Rural 7.0 (4.0) 5.3 (3.0) 0.8 (1.2) 0.3 (0.3) -0.2 (0.3)
Urban 8.3 (2.0) 5.8 (1.3) 1.4 (0.9) 0.2 (0.2) -0.4 (0.2)
Combined 7.6 (3.4) 5.5 (2.4) 1.1 (1.1) 0.2 (0.3) -0.3 (0.2)
Decile 2 (11-20%) Rural 6.7 (2.2) 5.1 (1.6) 0.8 (0.9) 0.3 (0.2) -0.2 (0.2)
Urban 8.2 (1.7) 5.6 (1.1) 1.4 (0.8) 0.1 (0.2) -0.4 (0.2)
Combined 7.6 (2.0) 5.4 (1.3) 1.1 (0.9) 0.2 (0.2) -0.3 (0.2)Decile 3 (21-30%) Rural 6.6 (2.4) 5.0 (1.6) 0.8 (0.9) 0.2 (0.2) -0.2 (0.2)
Urban 8.3 (1.8) 5.6 (1.1) 1.4 (0.8) 0.1 (0.2) -0.4 (0.2)
Combined 7.7 (2.1) 5.4 (1.3) 1.2 (0.9) 0.2 (0.2) -0.3 (0.2)Decile 4 (31-40%) Rural 6.6 (2.1) 5.0 (1.6) 0.8 (0.9) 0.2 (0.2) -0.2 (0.2)
Urban 8.2 (1.6) 5.6 (1.1) 1.4 (0.7) 0.1 (0.2) -0.4 (0.2)
Combined 7.7 (1.9) 5.4 (1.3) 1.3 (0.8) 0.2 (0.2) -0.3 (0.2)
Decile 5 (41-50%) Rural 6.4 (2.0) 4.8 (1.4) 0.8 (0.8) 0.2 (0.2) -0.2 (0.2)
Urban 8.1 (1.7) 5.6 (1.2) 1.4 (0.7) 0.1 (0.2) -0.4 (0.2)
Combined
Mean S.D.d/ Mean S.D. Mean S.D. Mean S.D. Mean S.D.Decile 1 (0-10%) Rural 7.0 (4.0) 5.3 (3.0) 0.8 (1.2) 0.3 (0.3) -0.2 (0.3)
Urban 8.3 (2.0) 5.8 (1.3) 1.4 (0.9) 0.2 (0.2) -0.4 (0.2)
Combined 7.6 (3.4) 5.5 (2.4) 1.1 (1.1) 0.2 (0.3) -0.3 (0.2)
Decile 2 (11-20%) Rural 6.7 (2.2) 5.1 (1.6) 0.8 (0.9) 0.3 (0.2) -0.2 (0.2)
Urban 8.2 (1.7) 5.6 (1.1) 1.4 (0.8) 0.1 (0.2) -0.4 (0.2)
Combined 7.6 (2.0) 5.4 (1.3) 1.1 (0.9) 0.2 (0.2) -0.3 (0.2)Decile 3 (21-30%) Rural 6.6 (2.4) 5.0 (1.6)
Mean S.D.d/ Mean S.D. Mean S.D. Mean S.D. Mean S.D.Decile 1 (0-10%) Rural 7.0 (4.0) 5.3 (3.0) 0.8 (1.2) 0.3 (0.3) -0.2 (0.3)
Urban 8.3 (2.0) 5.8 (1.3) 1.4 (0.9) 0.2 (0.2) -0.4 (0.2)
Combined 7.6 (3.4) 5.5 (2.4) 1.1 (1.1) 0.2 (0.3) -0.3 (0.2)
Decile 2 (11-20%) Rural 6.7 (2.2) 5.1 (1.6) 0.8 (0.9) 0.3 (0.2) -0.2 (0.2)
Urban 8.2 (1.7) 5.6 (1.1) 1.4 (0.8) 0.1 (0.2) -0.4 (0.2)
Combined 7.6 (2.0) 5.4 (1.3) 1.1 (0.9) 0.2 (0.2) -0.3 (0.2)Decile 3 (21-30%) Rural 6.6 (2.4) 5.0 (1.6) 0.8 (0.9) 0.2 (0.2) -0.2 (0.2)
Urban 8.3 (1.8) 5.6 (1.1) 1.4 (0.8) 0.1 (0.2) -0.4 (0.2)
Combined 7.7 (2.1) 5.4 (1.3) 1.2 (0.9) 0.2 (0.2) -0.3 (0.2)Decile 4 (31-40%) Rural 6.6 (2.1) 5.0 (1.6) 0.8 (0.9) 0.2 (0.2) -0.2 (0.2)
Urban 8.2 (1.6) 5.6 (1.1) 1.4 (0.7) 0.1 (0.2) -0.4 (0.2)
Combined 7.7 (1.9) 5.4 (1.3) 1.3 (0.8) 0.2 (0.2) -0.3 (0.2)
Decile 5 (41-50%) Rural 6.4 (2.0) 4.8 (1.4) 0.8 (0.8) 0.2 (0.2) -0.2 (0.2)
Urban 8.1 (1.7) 5.6 (1.2) 1.4 (0.7) 0.1 (0.2) -0.4 (0.2)
Combined
0.8 (0.9) 0.2 (0.2) -0.2 (0.2)
Urban 8.3 (1.8) 5.6 (1.1) 1.4 (0.8) 0.1 (0.2) -0.4 (0.2)
Combined 7.7 (2.1) 5.4 (1.3) 1.2 (0.9) 0.2 (0.2) -0.3 (0.2)Decile 4 (31-40%) Rural 6.6 (2.1) 5.0 (1.6) 0.8 (0.9) 0.2 (0.2) -0.2 (0.2)
Urban 8.2 (1.6) 5.6 (1.1) 1.4 (0.7) 0.1 (0.2) -0.4 (0.2)
Combined 7.7 (1.9) 5.4 (1.3) 1.3 (0.8) 0.2 (0.2) -0.3 (0.2)
Decile 5 (41-50%) Rural 6.4 (2.0) 4.8 (1.4) 0.8 (0.8) 0.2 (0.2) -0.2 (0.2)
Urban 8.1 (1.7) 5.6 (1.2) 1.4 (0.7) 0.1 (0.2) -0.4 (0.2)
Combined 7.7 (2.0) 5.4 (1.3) 1.3 (0.8) 0.2 (0.2) -0.3 (0.2)
Decile 6 (51-60%) Rural 6.2 (1.9) 4.7 (1.3) 0.8 (0.8) 0.2 (0.2) -0.2 (0.2)
Urban 8.0 (1.6) 5.5 (1.1) 1.5 (0.7) 0.1 (0.2) -0.4 (0.2)
Combined 7.5 (1.9) 5.3 (1.2) 1.3 (0.8) 0.1 (0.2) -0.3 (0.2)
Decile 7 (61-70%) Rural 6.2 (2.2) 4.8 (1.6) 0.8 (0.9) 0.2 (0.2) -0.2 (0.2)
Urban 7.8 (1.7) 5.5 (1.3) 1.5 (0.6) 0.1 (0.2) -0.4 (0.2)
Combined 7.5 (2.0) 5.3 (1.4) 1.3 (0.7) 0.2 (0.2) -0.3 (0.2)
Decile 8 (71-80%) Rural 6.0 (1.9) 4.6 (1.3) 0.8 (0.8) 0.2 (0.2) -0.2 (0.2)
Urban 7.8 (1.7) 5.4 (1.2) 1.5 (0.6) 0.1 (0.2) -0.4 (0.2)
Combined 7.5 (1.9) 5.3 (1.2) 1.4 (0.7) 0.2 (0.2) -0.3 (0.2)
Decile 9 (81-90%) Rural 6.1 (2.4) 4.8 (2.1) 0.8 (0.8) 0.2 (0.2) -0.2 (0.2)
Urban 7.3 (1.6) 5.3 (1.3) 1.4 (0.6) 0.2 (0.2) -0.3 (0.2)
Combined 7.2 (1.8) 5.2 (1.5) 1.3 (0.7) 0.2 (0.2) -0.3 (0.2)
Decile 10 (91-100%) Rural 5.6 (2.3) 4.4 (2.0) 0.8 (0.8) 0.3 (0.2) -0.2 (0.2)
Urban 6.8 (1.9) 5.2 (1.6) 1.3 (0.6) 0.2 (0.2) -0.3 (0.2)
Combined
7.7 (2.0) 5.4 (1.3) 1.3 (0.8) 0.2 (0.2) -0.3 (0.2)
Decile 6 (51-60%) Rural 6.2 (1.9) 4.7 (1.3) 0.8 (0.8) 0.2 (0.2) -0.2 (0.2)
Urban 8.0 (1.6) 5.5 (1.1) 1.5 (0.7) 0.1 (0.2) -0.4 (0.2)
Combined 7.5 (1.9) 5.3 (1.2) 1.3 (0.8) 0.1 (0.2) -0.3 (0.2)
Decile 7 (61-70%) Rural 6.2 (2.2) 4.8 (1.6) 0.8 (0.9) 0.2 (0.2) -0.2 (0.2)
Urban 7.8 (1.7) 5.5 (1.3) 1.5 (0.6) 0.1 (0.2) -0.4 (0.2)
Combined 7.5 (2.0) 5.3 (1.4) 1.3 (0.7) 0.2 (0.2) -0.3 (0.2)
Decile 8 (71-80%) Rural 6.0 (1.9) 4.6 (1.3)
7.7 (2.0) 5.4 (1.3) 1.3 (0.8) 0.2 (0.2) -0.3 (0.2)
Decile 6 (51-60%) Rural 6.2 (1.9) 4.7 (1.3) 0.8 (0.8) 0.2 (0.2) -0.2 (0.2)
Urban 8.0 (1.6) 5.5 (1.1) 1.5 (0.7) 0.1 (0.2) -0.4 (0.2)
Combined 7.5 (1.9) 5.3 (1.2) 1.3 (0.8) 0.1 (0.2) -0.3 (0.2)
Decile 7 (61-70%) Rural 6.2 (2.2) 4.8 (1.6) 0.8 (0.9) 0.2 (0.2) -0.2 (0.2)
Urban 7.8 (1.7) 5.5 (1.3) 1.5 (0.6) 0.1 (0.2) -0.4 (0.2)
Combined 7.5 (2.0) 5.3 (1.4) 1.3 (0.7) 0.2 (0.2) -0.3 (0.2)
Decile 8 (71-80%) Rural 6.0 (1.9) 4.6 (1.3) 0.8 (0.8) 0.2 (0.2) -0.2 (0.2)
Urban 7.8 (1.7) 5.4 (1.2) 1.5 (0.6) 0.1 (0.2) -0.4 (0.2)
Combined 7.5 (1.9) 5.3 (1.2) 1.4 (0.7) 0.2 (0.2) -0.3 (0.2)
Decile 9 (81-90%) Rural 6.1 (2.4) 4.8 (2.1) 0.8 (0.8) 0.2 (0.2) -0.2 (0.2)
Urban 7.3 (1.6) 5.3 (1.3) 1.4 (0.6) 0.2 (0.2) -0.3 (0.2)
Combined 7.2 (1.8) 5.2 (1.5) 1.3 (0.7) 0.2 (0.2) -0.3 (0.2)
Decile 10 (91-100%) Rural 5.6 (2.3) 4.4 (2.0) 0.8 (0.8) 0.3 (0.2) -0.2 (0.2)
Urban 6.8 (1.9) 5.2 (1.6) 1.3 (0.6) 0.2 (0.2) -0.3 (0.2)
Combined
0.8 (0.8) 0.2 (0.2) -0.2 (0.2)
Urban 7.8 (1.7) 5.4 (1.2) 1.5 (0.6) 0.1 (0.2) -0.4 (0.2)
Combined 7.5 (1.9) 5.3 (1.2) 1.4 (0.7) 0.2 (0.2) -0.3 (0.2)
Decile 9 (81-90%) Rural 6.1 (2.4) 4.8 (2.1) 0.8 (0.8) 0.2 (0.2) -0.2 (0.2)
Urban 7.3 (1.6) 5.3 (1.3) 1.4 (0.6) 0.2 (0.2) -0.3 (0.2)
Combined 7.2 (1.8) 5.2 (1.5) 1.3 (0.7) 0.2 (0.2) -0.3 (0.2)
Decile 10 (91-100%) Rural 5.6 (2.3) 4.4 (2.0) 0.8 (0.8) 0.3 (0.2) -0.2 (0.2)
Urban 6.8 (1.9) 5.2 (1.6) 1.3 (0.6) 0.2 (0.2) -0.3 (0.2)
Combined 6.8 (2.0) 5.1 (1.7) 1.3 (0.6) 0.2 (0.2) -0.3 (0.2)
Source: Authors' estimates
Table 6. The Mean and Standard Deviation of the Welfare Impacts of WTO Accession on Russian Households, from Poorest to Richest (welfare change as a percent of consumption)
a/ The model is executed with 55 thousand households. Decile 1 is the poorest ten percent of all households on a per capita consumption basis. Results for decile 1 (combined, rural and urban) are a weighted average of theequivalent variation as a percentb/
Doha SDT assumes expected Doha Round reductions in tariffs and domestic support subsidized with smaller cuts for developingcountriesand no cuts for the least developed countries, withoutparticipation of Russia. c/Doha ALL assumes expected Doha Round reductions in tariffs and domestic support with exclusion of Special and Differential Treatment for developing countries.
WTO
Household types a/ accession Full removal ofdomestic support
Global Free Trade
(1) (3) (4)
d/Numbers in parentheses are the standard deviations of thewelfare impacts.
(2) (5)
Reform ofFDI barriers
only
50% Tariff Reduction
Doha
Mean S.D.d/ Mean S.D. Mean S.D. Mean S.D. Mean S.D.Decile 1 (0-10%) Rural 7.0 (4.0) 5.3 (3.0) 0.8 (1.2) 0.3 (0.3) -0.2 (0.3)
Urban 8.3 (2.0) 5.8 (1.3) 1.4 (0.9) 0.2 (0.2) -0.4 (0.2)
Combined 7.6 (3.4) 5.5 (2.4) 1.1 (1.1) 0.2 (0.3) -0.3 (0.2)
Decile 2 (11-20%) Rural 6.7 (2.2) 5.1 (1.6) 0.8 (0.9) 0.3 (0.2) -0.2 (0.2)
Urban 8.2 (1.7) 5.6 (1.1) 1.4 (0.8) 0.1 (0.2) -0.4 (0.2)
Combined 7.6 (2.0) 5.4 (1.3) 1.1 (0.9) 0.2 (0.2) -0.3 (0.2)Decile 3 (21-30%) Rural 6.6
6.8 (2.0) 5.1 (1.7) 1.3 (0.6) 0.2 (0.2) -0.3 (0.2)
Source: Authors' estimates
Table 6. The Mean and Standard Deviation of the Welfare Impacts of WTO Accession on Russian Households, from Poorest to Richest (welfare change as a percent of consumption)
a/ The model is executed with 55 thousand households. Decile 1 is the poorest ten percent of all households on a per capita consumption basis. Results for decile 1 (combined, rural and urban) are a weighted average of theequivalent variation as a percentb/
Doha SDT assumes expected Doha Round reductions in tariffs and domestic support subsidized with smaller cuts for developingcountriesand no cuts for the least developed countries, withoutparticipation of Russia. c/Doha ALL assumes expected Doha Round reductions in tariffs and domestic support with exclusion of Special and Differential Treatment for developing countries.
WTO
Household types a/ accession Full removal ofdomestic support
Global Free Trade
(1) (3) (4)
d/Numbers in parentheses are the standard deviations of thewelfare impacts.
(2) (5)
Reform ofFDI barriers
only
50% Tariff Reduction
Doha
Mean S.D.d/ Mean S.D. Mean S.D. Mean S.D. Mean S.D.Decile 1 (0-10%) Rural 7.0 (4.0) 5.3 (3.0) 0.8 (1.2) 0.3 (0.3) -0.2 (0.3)
Urban 8.3 (2.0) 5.8 (1.3) 1.4 (0.9) 0.2 (0.2) -0.4 (0.2)
Combined 7.6 (3.4) 5.5 (2.4) 1.1 (1.1) 0.2 (0.3) -0.3 (0.2)
Decile 2 (11-20%) Rural 6.7 (2.2) 5.1 (1.6) 0.8 (0.9) 0.3 (0.2) -0.2 (0.2)
Urban 8.2 (1.7) 5.6 (1.1) 1.4 (0.8) 0.1 (0.2) -0.4 (0.2)
Combined 7.6 (2.0) 5.4 (1.3) 1.1 (0.9) 0.2 (0.2) -0.3 (0.2)Decile 3 (21-30%) Rural 6.6 (2.4) 5.0 (1.6) 0.8 (0.9) 0.2 (0.2) -0.2 (0.2)
Urban 8.3 (1.8) 5.6 (1.1) 1.4 (0.8) 0.1 (0.2) -0.4 (0.2)
Combined 7.7 (2.1) 5.4 (1.3) 1.2 (0.9) 0.2 (0.2) -0.3 (0.2)Decile 4 (31-40%) Rural 6.6 (2.1) 5.0 (1.6) 0.8 (0.9) 0.2 (0.2) -0.2 (0.2)
Urban 8.2 (1.6) 5.6 (1.1) 1.4 (0.7) 0.1 (0.2) -0.4 (0.2)
Combined 7.7 (1.9) 5.4 (1.3) 1.3 (0.8) 0.2 (0.2) -0.3 (0.2)
Decile 5 (41-50%) Rural 6.4 (2.0) 4.8 (1.4) 0.8 (0.8) 0.2 (0.2) -0.2 (0.2)
Urban 8.1 (1.7) 5.6 (1.2) 1.4 (0.7) 0.1 (0.2) -0.4 (0.2)
Combined 7.7 (2.0) 5.4 (1.3) 1.3 (0.8) 0.2 (0.2) -0.3 (0.2)
Decile 6 (51-60%) Rural 6.2 (1.9) 4.7 (1.3) 0.8 (0.8) 0.2 (0.2) -0.2 (0.2)
Urban 8.0
Mean S.D.d/ Mean S.D. Mean S.D. Mean S.D. Mean S.D.Decile 1 (0-10%) Rural 7.0 (4.0) 5.3 (3.0) 0.8 (1.2) 0.3 (0.3) -0.2 (0.3)
Urban 8.3 (2.0) 5.8 (1.3) 1.4 (0.9) 0.2 (0.2) -0.4 (0.2)
Combined 7.6 (3.4) 5.5 (2.4) 1.1 (1.1) 0.2 (0.3) -0.3 (0.2)
Decile 2 (11-20%) Rural 6.7 (2.2) 5.1 (1.6) 0.8 (0.9) 0.3 (0.2) -0.2 (0.2)
Urban
(2.4) 5.0 (1.6) 0.8 (0.9) 0.2 (0.2) -0.2 (0.2)
Urban 8.3 (1.8) 5.6 (1.1) 1.4 (0.8) 0.1 (0.2) -0.4 (0.2)
Combined 7.7 (2.1) 5.4 (1.3) 1.2 (0.9) 0.2 (0.2) -0.3 (0.2)Decile 4 (31-40%) Rural 6.6 (2.1) 5.0 (1.6) 0.8 (0.9) 0.2 (0.2) -0.2 (0.2)
Urban 8.2 (1.6) 5.6 (1.1) 1.4 (0.7) 0.1 (0.2) -0.4 (0.2)
Combined 7.7 (1.9) 5.4 (1.3) 1.3 (0.8) 0.2 (0.2) -0.3 (0.2)
Decile 5 (41-50%) Rural 6.4 (2.0) 4.8 (1.4) 0.8 (0.8) 0.2 (0.2) -0.2 (0.2)
Urban 8.1 (1.7) 5.6 (1.2) 1.4 (0.7) 0.1 (0.2) -
(2.4) 5.0 (1.6) 0.8 (0.9) 0.2 (0.2) -0.2 (0.2)
Urban 8.3 (1.8) 5.6 (1.1) 1.4 (0.8) 0.1 (0.2) -0.4 (0.2)
Combined 7.7 (2.1) 5.4 (1.3) 1.2 (0.9) 0.2 (0.2) -0.3 (0.2)Decile 4 (31-40%) Rural 6.6 (2.1) 5.0 (1.6) 0.8 (0.9) 0.2 (0.2) -0.2 (0.2)
Urban 8.2 (1.6) 5.6 (1.1) 1.4 (0.7) 0.1 (0.2) -0.4 (0.2)
Combined 7.7 (1.9) 5.4 (1.3) 1.3 (0.8) 0.2 (0.2) -0.3 (0.2)
Decile 5 (41-50%) Rural 6.4 (2.0) 4.8 (1.4) 0.8 (0.8) 0.2 (0.2) -0.2 (0.2)
Urban 8.1 (1.7) 5.6 (1.2) 1.4 (0.7) 0.1 (0.2) -0.4 (0.2)
Combined 7.7 (2.0) 5.4 (1.3) 1.3 (0.8) 0.2 (0.2) -0.3 (0.2)
Decile 6 (51-60%) Rural 6.2 (1.9) 4.7 (1.3) 0.8 (0.8) 0.2 (0.2) -0.2 (0.2)
Urban 8.0
Mean S.D.d/ Mean S.D. Mean S.D. Mean S.D. Mean S.D.Decile 1 (0-10%) Rural 7.0 (4.0) 5.3 (3.0) 0.8 (1.2) 0.3 (0.3) -0.2 (0.3)
Urban 8.3 (2.0) 5.8 (1.3) 1.4 (0.9) 0.2 (0.2) -0.4 (0.2)
Combined 7.6 (3.4) 5.5 (2.4) 1.1 (1.1) 0.2 (0.3) -0.3 (0.2)
Decile 2 (11-20%) Rural 6.7 (2.2) 5.1 (1.6) 0.8 (0.9) 0.3 (0.2) -0.2 (0.2)
Urban
0.4 (0.2)
Combined 7.7 (2.0) 5.4 (1.3) 1.3 (0.8) 0.2 (0.2) -0.3 (0.2)
Decile 6 (51-60%) Rural 6.2 (1.9) 4.7 (1.3) 0.8 (0.8) 0.2 (0.2) -0.2 (0.2)
Urban 8.0
Mean S.D.d/ Mean S.D. Mean S.D. Mean S.D. Mean S.D.Decile 1 (0-10%) Rural 7.0 (4.0) 5.3 (3.0) 0.8 (1.2) 0.3 (0.3) -0.2 (0.3)
Urban 8.3 (2.0) 5.8 (1.3) 1.4 (0.9) 0.2 (0.2) -0.4 (0.2)
Combined 7.6 (3.4) 5.5 (2.4) 1.1 (1.1) 0.2 (0.3) -0.3 (0.2)
Decile 2 (11-20%) Rural 6.7 (2.2) 5.1 (1.6) 0.8 (0.9) 0.3 (0.2) -0.2 (0.2)
Urban 8.2 (1.7) 5.6 (1.1) 1.4 (0.8) 0.1 (0.2) -0.4 (0.2)
Combined 7.6 (2.0) 5.4 (1.3) 1.1 (0.9) 0.2 (0.2) -0.3 (0.2)Decile 3 (21-30%) Rural 6.6 (2.4) 5.0 (1.6) 0.8 (0.9) 0.2 (0.2) -0.2 (0.2)
Urban 8.3 (1.8) 5.6 (1.1) 1.4 (0.8) 0.1 (0.2) -0.4 (0.2)
Combined 7.7 (2.1) 5.4 (1.3) 1.2 (0.9) 0.2 (0.2) -0.3 (0.2)Decile 4 (31-40%) Rural 6.6 (2.1) 5.0 (1.6) 0.8 (0.9) 0.2 (0.2) -0.2 (0.2)
Urban 8.2 (1.6) 5.6 (1.1) 1.4 (0.7) 0.1 (0.2) -0.4 (0.2)
Combined 7.7 (1.9) 5.4 (1.3) 1.3 (0.8) 0.2 (0.2) -0.3 (0.2)
Decile 5 (41-50%) Rural 6.4 (2.0) 4.8 (1.4) 0.8 (0.8) 0.2 (0.2) -0.2 (0.2)
Urban 8.1 (1.7) 5.6 (1.2) 1.4 (0.7) 0.1 (0.2) -0.4 (0.2)
Combined 7.7 (2.0) 5.4 (1.3) 1.3 (0.8) 0.2 (0.2) -0.3 (0.2)
Decile 6 (51-60%) Rural 6.2 (1.9) 4.7 (1.3) 0.8 (0.8) 0.2 (0.2) -0.2 (0.2)
Urban 8.0 (1.6) 5.5 (1.1) 1.5 (0.7) 0.1 (0.2) -0.4 (0.2)
Combined 7.5 (1.9) 5.3 (1.2) 1.3 (0.8) 0.1 (0.2) -0.3 (0.2)
Decile 7 (61-70%) Rural 6.2 (2.2) 4.8 (1.6) 0.8 (0.9) 0.2 (0.2) -0.2 (0.2)
Urban
8.2 (1.7) 5.6 (1.1) 1.4 (0.8) 0.1 (0.2) -0.4 (0.2)
Combined 7.6 (2.0) 5.4 (1.3) 1.1 (0.9) 0.2 (0.2) -0.3 (0.2)Decile 3 (21-30%) Rural 6.6 (2.4) 5.0 (1.6) 0.8 (0.9) 0.2 (0.2) -0.2 (0.2)
Urban 8.3 (1.8) 5.6 (1.1) 1.4 (0.8) 0.1 (0.2) -0.4 (0.2)
Combined 7.7 (2.1) 5.4 (1.3) 1.2 (0.9) 0.2 (0.2) -0.3 (0.2)Decile 4 (31-40%) Rural 6.6 (2.1) 5.0 (1.6) 0.8 (0.9) 0.2 (0.2) -0.2 (0.2)
Urban 8.2 (1.6) 5.6 (1.1) 1.4 (0.7) 0.1 (0.2) -0.4 (0.2)
Combined 7.7 (1.9) 5.4 (1.3) 1.3 (0.8) 0.2 (0.2)
8.2 (1.7) 5.6 (1.1) 1.4 (0.8) 0.1 (0.2) -0.4 (0.2)
Combined 7.6 (2.0) 5.4 (1.3) 1.1 (0.9) 0.2 (0.2) -0.3 (0.2)Decile 3 (21-30%) Rural 6.6 (2.4) 5.0 (1.6) 0.8 (0.9) 0.2 (0.2) -0.2 (0.2)
Urban 8.3 (1.8) 5.6 (1.1) 1.4 (0.8) 0.1 (0.2) -0.4 (0.2)
Combined 7.7 (2.1) 5.4 (1.3) 1.2 (0.9) 0.2 (0.2) -0.3 (0.2)Decile 4 (31-40%) Rural 6.6 (2.1) 5.0 (1.6) 0.8 (0.9) 0.2 (0.2) -0.2 (0.2)
Urban 8.2 (1.6) 5.6 (1.1) 1.4 (0.7) 0.1 (0.2) -0.4 (0.2)
Combined 7.7 (1.9) 5.4 (1.3) 1.3 (0.8) 0.2 (0.2) -0.3 (0.2)
Decile 5 (41-50%) Rural 6.4 (2.0) 4.8 (1.4) 0.8 (0.8) 0.2 (0.2) -0.2 (0.2)
Urban 8.1 (1.7) 5.6 (1.2) 1.4 (0.7) 0.1 (0.2) -0.4 (0.2)
Combined 7.7 (2.0) 5.4 (1.3) 1.3 (0.8) 0.2 (0.2) -0.3 (0.2)
Decile 6 (51-60%) Rural 6.2 (1.9) 4.7 (1.3) 0.8 (0.8) 0.2 (0.2) -0.2 (0.2)
Urban 8.0 (1.6) 5.5 (1.1) 1.5 (0.7) 0.1 (0.2) -0.4 (0.2)
Combined 7.5 (1.9) 5.3 (1.2) 1.3 (0.8) 0.1 (0.2) -0.3 (0.2)
Decile 7 (61-70%) Rural 6.2 (2.2) 4.8 (1.6) 0.8 (0.9) 0.2 (0.2) -0.2 (0.2)
Urban
-0.3 (0.2)
Decile 5 (41-50%) Rural 6.4 (2.0) 4.8 (1.4) 0.8 (0.8) 0.2 (0.2) -0.2 (0.2)
Urban 8.1 (1.7) 5.6 (1.2) 1.4 (0.7) 0.1 (0.2) -0.4 (0.2)
Combined 7.7 (2.0) 5.4 (1.3) 1.3 (0.8) 0.2 (0.2) -0.3 (0.2)
Decile 6 (51-60%) Rural 6.2 (1.9) 4.7 (1.3) 0.8 (0.8) 0.2 (0.2) -0.2 (0.2)
Urban 8.0 (1.6) 5.5 (1.1) 1.5 (0.7) 0.1 (0.2) -0.4 (0.2)
Combined 7.5 (1.9) 5.3 (1.2) 1.3 (0.8) 0.1 (0.2) -0.3 (0.2)
Decile 7 (61-70%) Rural 6.2 (2.2) 4.8 (1.6) 0.8 (0.9) 0.2 (0.2) -0.2 (0.2)
Urban
developing countries.
WTO
Household types a/ accession Full removal ofdomestic support
Global Free Trade
(1) (3) (4)
d/Numbers in parentheses are the standard deviations of thewelfare impacts.
(2) (5)
Reform ofFDI barriers
only
50% Tariff Reduction
Doha
Mean S.D.d/ Mean S.D. Mean S.D. Mean S.D. Mean S.D.Decile 1 (0-10%) Rural 7.0 (4.0) 5.3 (3.0) 0.8 (1.2) 0.3 (0.3) -0.2 (0.3)
Urban 8.3 (2.0) 5.8 (1.3) 1.4 (0.9) 0.2 (0.2) -0.4 (0.2)
Combined 7.6 (3.4) 5.5 (2.4) 1.1 (1.1) 0.2 (0.3) -0.3 (0.2)
Decile 2 (11-20%) Rural 6.7 (2.2) 5.1 (1.6) 0.8 (0.9) 0.3 (0.2) -0.2 (0.2)
Urban 8.2 (1.7) 5.6 (1.1) 1.4 (0.8) 0.1 (0.2) -0.4 (0.2)
Combined 7.6 (2.0) 5.4 (1.3) 1.1 (0.9) 0.2 (0.2) -0.3 (0.2)Decile 3 (21-30%) Rural 6.6 (2.4) 5.0 (1.6)
Mean S.D.d/ Mean S.D. Mean S.D. Mean S.D. Mean S.D.Decile 1 (0-10%) Rural 7.0 (4.0) 5.3 (3.0) 0.8 (1.2) 0.3 (0.3) -0.2 (0.3)
Urban 8.3 (2.0) 5.8 (1.3) 1.4 (0.9) 0.2 (0.2) -0.4 (0.2)
Combined 7.6 (3.4) 5.5 (2.4) 1.1 (1.1) 0.2 (0.3) -0.3 (0.2)
Decile 2 (11-20%) Rural 6.7 (2.2) 5.1 (1.6) 0.8 (0.9) 0.3 (0.2) -0.2 (0.2)
Urban 8.2 (1.7) 5.6 (1.1) 1.4 (0.8) 0.1 (0.2) -0.4 (0.2)
Combined 7.6 (2.0) 5.4 (1.3) 1.1 (0.9) 0.2 (0.2) -0.3 (0.2)Decile 3 (21-30%) Rural 6.6 (2.4) 5.0 (1.6) 0.8 (0.9) 0.2 (0.2) -0.2 (0.2)
Urban 8.3 (1.8) 5.6 (1.1) 1.4 (0.8) 0.1 (0.2) -0.4 (0.2)
Combined 7.7 (2.1) 5.4 (1.3) 1.2 (0.9) 0.2 (0.2) -0.3 (0.2)Decile 4 (31-40%) Rural 6.6 (2.1) 5.0 (1.6) 0.8 (0.9) 0.2 (0.2) -0.2 (0.2)
Urban 8.2 (1.6) 5.6 (1.1) 1.4 (0.7) 0.1 (0.2) -0.4 (0.2)
Combined 7.7 (1.9) 5.4 (1.3) 1.3 (0.8) 0.2 (0.2) -0.3 (0.2)
Decile 5 (41-50%) Rural 6.4 (2.0) 4.8 (1.4) 0.8 (0.8) 0.2 (0.2) -0.2 (0.2)
Urban 8.1 (1.7) 5.6 (1.2) 1.4 (0.7) 0.1 (0.2) -0.4 (0.2)
Combined
0.8 (0.9) 0.2 (0.2) -0.2 (0.2)
Urban 8.3 (1.8) 5.6 (1.1) 1.4 (0.8) 0.1 (0.2) -0.4 (0.2)
Combined 7.7 (2.1) 5.4 (1.3) 1.2 (0.9) 0.2 (0.2) -0.3 (0.2)Decile 4 (31-40%) Rural 6.6 (2.1) 5.0 (1.6) 0.8 (0.9) 0.2 (0.2) -0.2 (0.2)
Urban 8.2 (1.6) 5.6 (1.1) 1.4 (0.7) 0.1 (0.2) -0.4 (0.2)
Combined 7.7 (1.9) 5.4 (1.3) 1.3 (0.8) 0.2 (0.2) -0.3 (0.2)
Decile 5 (41-50%) Rural 6.4 (2.0) 4.8 (1.4) 0.8 (0.8) 0.2 (0.2) -0.2 (0.2)
Urban 8.1 (1.7) 5.6 (1.2) 1.4 (0.7) 0.1 (0.2) -0.4 (0.2)
Combined
Mean S.D.d/ Mean S.D. Mean S.D. Mean S.D. Mean S.D.Decile 1 (0-10%) Rural 7.0 (4.0) 5.3 (3.0) 0.8 (1.2) 0.3 (0.3) -0.2 (0.3)
Urban 8.3 (2.0) 5.8 (1.3) 1.4 (0.9) 0.2 (0.2) -0.4 (0.2)
Combined 7.6 (3.4) 5.5 (2.4) 1.1 (1.1) 0.2 (0.3) -0.3 (0.2)
Decile 2 (11-20%) Rural 6.7 (2.2) 5.1 (1.6) 0.8 (0.9) 0.3 (0.2) -0.2 (0.2)
Urban 8.2 (1.7) 5.6 (1.1) 1.4 (0.8) 0.1 (0.2) -0.4 (0.2)
Combined 7.6 (2.0) 5.4 (1.3) 1.1 (0.9) 0.2 (0.2) -0.3 (0.2)Decile 3 (21-30%) Rural 6.6 (2.4) 5.0 (1.6)
Mean S.D.d/ Mean S.D. Mean S.D. Mean S.D. Mean S.D.Decile 1 (0-10%) Rural 7.0 (4.0) 5.3 (3.0) 0.8 (1.2) 0.3 (0.3) -0.2 (0.3)
Urban 8.3 (2.0) 5.8 (1.3) 1.4 (0.9) 0.2 (0.2) -0.4 (0.2)
Combined 7.6 (3.4) 5.5 (2.4) 1.1 (1.1) 0.2 (0.3) -0.3 (0.2)
Decile 2 (11-20%) Rural 6.7 (2.2) 5.1 (1.6) 0.8 (0.9) 0.3 (0.2) -0.2 (0.2)
Urban 8.2 (1.7) 5.6 (1.1) 1.4 (0.8) 0.1 (0.2) -0.4 (0.2)
Combined 7.6 (2.0) 5.4 (1.3) 1.1 (0.9) 0.2 (0.2) -0.3 (0.2)Decile 3 (21-30%) Rural 6.6 (2.4) 5.0 (1.6) 0.8 (0.9) 0.2 (0.2) -0.2 (0.2)
Urban 8.3 (1.8) 5.6 (1.1) 1.4 (0.8) 0.1 (0.2) -0.4 (0.2)
Combined 7.7 (2.1) 5.4 (1.3) 1.2 (0.9) 0.2 (0.2) -0.3 (0.2)Decile 4 (31-40%) Rural 6.6 (2.1) 5.0 (1.6) 0.8 (0.9) 0.2 (0.2) -0.2 (0.2)
Urban 8.2 (1.6) 5.6 (1.1) 1.4 (0.7) 0.1 (0.2) -0.4 (0.2)
Combined 7.7 (1.9) 5.4 (1.3) 1.3 (0.8) 0.2 (0.2) -0.3 (0.2)
Decile 5 (41-50%) Rural 6.4 (2.0) 4.8 (1.4) 0.8 (0.8) 0.2 (0.2) -0.2 (0.2)
Urban 8.1 (1.7) 5.6 (1.2) 1.4 (0.7) 0.1 (0.2) -0.4 (0.2)
Combined
0.8 (0.9) 0.2 (0.2) -0.2 (0.2)
Urban 8.3 (1.8) 5.6 (1.1) 1.4 (0.8) 0.1 (0.2) -0.4 (0.2)
Combined 7.7 (2.1) 5.4 (1.3) 1.2 (0.9) 0.2 (0.2) -0.3 (0.2)Decile 4 (31-40%) Rural 6.6 (2.1) 5.0 (1.6) 0.8 (0.9) 0.2 (0.2) -0.2 (0.2)
Urban 8.2 (1.6) 5.6 (1.1) 1.4 (0.7) 0.1 (0.2) -0.4 (0.2)
Combined 7.7 (1.9) 5.4 (1.3) 1.3 (0.8) 0.2 (0.2) -0.3 (0.2)
Decile 5 (41-50%) Rural 6.4 (2.0) 4.8 (1.4) 0.8 (0.8) 0.2 (0.2) -0.2 (0.2)
Urban 8.1 (1.7) 5.6 (1.2) 1.4 (0.7) 0.1 (0.2) -0.4 (0.2)
Combined 7.7 (2.0) 5.4 (1.3) 1.3 (0.8) 0.2 (0.2) -0.3 (0.2)
Decile 6 (51-60%) Rural 6.2 (1.9) 4.7 (1.3) 0.8 (0.8) 0.2 (0.2) -0.2 (0.2)
Urban 8.0 (1.6) 5.5 (1.1) 1.5 (0.7) 0.1 (0.2) -0.4 (0.2)
Combined 7.5 (1.9) 5.3 (1.2) 1.3 (0.8) 0.1 (0.2) -0.3 (0.2)
Decile 7 (61-70%) Rural 6.2 (2.2) 4.8 (1.6) 0.8 (0.9) 0.2 (0.2) -0.2 (0.2)
Urban 7.8 (1.7) 5.5 (1.3) 1.5 (0.6) 0.1 (0.2) -0.4 (0.2)
Combined 7.5 (2.0) 5.3 (1.4) 1.3 (0.7) 0.2 (0.2) -0.3 (0.2)
Decile 8 (71-80%) Rural 6.0 (1.9) 4.6 (1.3)
7.7 (2.0) 5.4 (1.3) 1.3 (0.8) 0.2 (0.2) -0.3 (0.2)
Decile 6 (51-60%) Rural 6.2 (1.9) 4.7 (1.3) 0.8 (0.8) 0.2 (0.2) -0.2 (0.2)
Urban 8.0 (1.6) 5.5 (1.1) 1.5 (0.7) 0.1 (0.2) -0.4 (0.2)
Combined 7.5 (1.9) 5.3 (1.2) 1.3 (0.8) 0.1 (0.2) -0.3 (0.2)
Decile 7 (61-70%) Rural 6.2 (2.2) 4.8 (1.6) 0.8 (0.9) 0.2 (0.2) -0.2 (0.2)
Urban 7.8 (1.7) 5.5 (1.3) 1.5 (0.6) 0.1 (0.2) -0.4 (0.2)
Combined 7.5 (2.0) 5.3 (1.4) 1.3 (0.7) 0.2 (0.2) -0.3 (0.2)
Decile 8 (71-80%) Rural 6.0 (1.9) 4.6 (1.3) 0.8 (0.8) 0.2 (0.2) -0.2 (0.2)
Urban 7.8 (1.7) 5.4 (1.2) 1.5 (0.6) 0.1 (0.2) -0.4 (0.2)
Combined 7.5 (1.9) 5.3 (1.2) 1.4 (0.7) 0.2 (0.2) -0.3 (0.2)
Decile 9 (81-90%) Rural 6.1 (2.4) 4.8 (2.1) 0.8 (0.8) 0.2 (0.2) -0.2 (0.2)
Urban 7.3 (1.6) 5.3 (1.3) 1.4 (0.6) 0.2 (0.2) -0.3 (0.2)
Combined 7.2 (1.8) 5.2 (1.5) 1.3 (0.7) 0.2 (0.2) -0.3 (0.2)
Decile 10 (91-100%) Rural 5.6 (2.3) 4.4 (2.0) 0.8 (0.8) 0.3 (0.2) -0.2 (0.2)
Urban 6.8 (1.9) 5.2 (1.6) 1.3 (0.6) 0.2 (0.2) -0.3 (0.2)
Combined
0.8 (0.8) 0.2 (0.2) -0.2 (0.2)
Urban 7.8 (1.7) 5.4 (1.2) 1.5 (0.6) 0.1 (0.2) -0.4 (0.2)
Combined 7.5 (1.9) 5.3 (1.2) 1.4 (0.7) 0.2 (0.2) -0.3 (0.2)
Decile 9 (81-90%) Rural 6.1 (2.4) 4.8 (2.1) 0.8 (0.8) 0.2 (0.2) -0.2 (0.2)
Urban 7.3 (1.6) 5.3 (1.3) 1.4 (0.6) 0.2 (0.2) -0.3 (0.2)
Combined 7.2 (1.8) 5.2 (1.5) 1.3 (0.7) 0.2 (0.2) -0.3 (0.2)
Decile 10 (91-100%) Rural 5.6 (2.3) 4.4 (2.0) 0.8 (0.8) 0.3 (0.2) -0.2 (0.2)
Urban 6.8 (1.9) 5.2 (1.6) 1.3 (0.6) 0.2 (0.2) -0.3 (0.2)
Combined
7.7 (2.0) 5.4 (1.3) 1.3 (0.8) 0.2 (0.2) -0.3 (0.2)
Decile 6 (51-60%) Rural 6.2 (1.9) 4.7 (1.3) 0.8 (0.8) 0.2 (0.2) -0.2 (0.2)
Urban 8.0 (1.6) 5.5 (1.1) 1.5 (0.7) 0.1 (0.2) -0.4 (0.2)
Combined 7.5 (1.9) 5.3 (1.2) 1.3 (0.8) 0.1 (0.2) -0.3 (0.2)
Decile 7 (61-70%) Rural 6.2 (2.2) 4.8 (1.6) 0.8 (0.9) 0.2 (0.2) -0.2 (0.2)
Urban 7.8 (1.7) 5.5 (1.3) 1.5 (0.6) 0.1 (0.2) -0.4 (0.2)
Combined 7.5 (2.0) 5.3 (1.4) 1.3 (0.7) 0.2 (0.2) -0.3 (0.2)
Decile 8 (71-80%) Rural 6.0 (1.9) 4.6 (1.3)
7.7 (2.0) 5.4 (1.3) 1.3 (0.8) 0.2 (0.2) -0.3 (0.2)
Decile 6 (51-60%) Rural 6.2 (1.9) 4.7 (1.3) 0.8 (0.8) 0.2 (0.2) -0.2 (0.2)
Urban 8.0 (1.6) 5.5 (1.1) 1.5 (0.7) 0.1 (0.2) -0.4 (0.2)
Combined 7.5 (1.9) 5.3 (1.2) 1.3 (0.8) 0.1 (0.2) -0.3 (0.2)
Decile 7 (61-70%) Rural 6.2 (2.2) 4.8 (1.6) 0.8 (0.9) 0.2 (0.2) -0.2 (0.2)
Urban 7.8 (1.7) 5.5 (1.3) 1.5 (0.6) 0.1 (0.2) -0.4 (0.2)
Combined 7.5 (2.0) 5.3 (1.4) 1.3 (0.7) 0.2 (0.2) -0.3 (0.2)
Decile 8 (71-80%) Rural 6.0 (1.9) 4.6 (1.3) 0.8 (0.8) 0.2 (0.2) -0.2 (0.2)
Urban 7.8 (1.7) 5.4 (1.2) 1.5 (0.6) 0.1 (0.2) -0.4 (0.2)
Combined 7.5 (1.9) 5.3 (1.2) 1.4 (0.7) 0.2 (0.2) -0.3 (0.2)
Decile 9 (81-90%) Rural 6.1 (2.4) 4.8 (2.1) 0.8 (0.8) 0.2 (0.2) -0.2 (0.2)
Urban 7.3 (1.6) 5.3 (1.3) 1.4 (0.6) 0.2 (0.2) -0.3 (0.2)
Combined 7.2 (1.8) 5.2 (1.5) 1.3 (0.7) 0.2 (0.2) -0.3 (0.2)
Decile 10 (91-100%) Rural 5.6 (2.3) 4.4 (2.0) 0.8 (0.8) 0.3 (0.2) -0.2 (0.2)
Urban 6.8 (1.9) 5.2 (1.6) 1.3 (0.6) 0.2 (0.2) -0.3 (0.2)
Combined
0.8 (0.8) 0.2 (0.2) -0.2 (0.2)
Urban 7.8 (1.7) 5.4 (1.2) 1.5 (0.6) 0.1 (0.2) -0.4 (0.2)
Combined 7.5 (1.9) 5.3 (1.2) 1.4 (0.7) 0.2 (0.2) -0.3 (0.2)
Decile 9 (81-90%) Rural 6.1 (2.4) 4.8 (2.1) 0.8 (0.8) 0.2 (0.2) -0.2 (0.2)
Urban 7.3 (1.6) 5.3 (1.3) 1.4 (0.6) 0.2 (0.2) -0.3 (0.2)
Combined 7.2 (1.8) 5.2 (1.5) 1.3 (0.7) 0.2 (0.2) -0.3 (0.2)
Decile 10 (91-100%) Rural 5.6 (2.3) 4.4 (2.0) 0.8 (0.8) 0.3 (0.2) -0.2 (0.2)
Urban 6.8 (1.9) 5.2 (1.6) 1.3 (0.6) 0.2 (0.2) -0.3 (0.2)
Combined 6.8 (2.0) 5.1 (1.7) 1.3 (0.6) 0.2 (0.2) -0.3 (0.2)
Source: Authors' estimates
Impacts of WTO Accession on Russian Households, from Poorest to Richest (welfare change as a percent of consumption)
a/ The model is executed with 55 thousand households. Decile 1 is the poorest ten percent of all households on a per capita consumption basis. Results for decile 1 (combined, rural and urban) are a weighted average of theequivalent variation as a percentb/
Doha SDT assumes expected Doha Round reductions in tariffs and domestic support subsidized with smaller cuts for developingcountriesand no cuts for the least developed countries, withoutparticipation of Russia. c/Doha ALL assumes expected Doha Round reductions in tariffs and domestic support with exclusion of Special and Differential Treatment for developing countries.
WTO
Household types a/ accession Full removal ofdomestic support
Global Free Trade
(1) (3) (4)
d/Numbers in parentheses are the standard deviations of thewelfare impacts.
(2) (5)
Reform ofFDI barriers
only
50% Tariff Reduction
Doha
Mean S.D.d/ Mean S.D. Mean S.D. Mean S.D. Mean S.D.Decile 1 (0-10%) Rural 7.0 (4.0) 5.3 (3.0) 0.8 (1.2) 0.3 (0.3) -0.2 (0.3)
Urban 8.3 (2.0) 5.8 (1.3) 1.4 (0.9) 0.2 (0.2) -0.4 (0.2)
Combined 7.6 (3.4) 5.5 (2.4) 1.1 (1.1) 0.2 (0.3) -0.3 (0.2)
Decile 2 (11-20%) Rural 6.7 (2.2) 5.1 (1.6) 0.8 (0.9) 0.3 (0.2) -0.2 (0.2)
Urban 8.2 (1.7) 5.6 (1.1) 1.4 (0.8) 0.1 (0.2) -0.4 (0.2)
Combined 7.6 (2.0) 5.4 (1.3) 1.1 (0.9) 0.2 (0.2) -0.3 (0.2)Decile 3 (21-30%) Rural 6.6
6.8 (2.0)
Mean S.D.d/ Mean S.D. Mean S.D. Mean S.D. Mean S.D.Decile 1 (0-10%) Rural 7.0 (4.0) 5.3 (3.0) 0.8 (1.2) 0.3 (0.3) -0.2 (0.3)
Urban 8.3 (2.0) 5.8 (1.3) 1.4 (0.9) 0.2 (0.2) -0.4 (0.2)
Combined 7.6 (3.4) 5.5 (2.4) 1.1 (1.1) 0.2 (0.3) -0.3 (0.2)
Decile 2 (11-20%) Rural 6.7 (2.2) 5.1 (1.6) 0.8 (0.9) 0.3 (0.2) -0.2 (0.2)
Urban 8.2 (1.7) 5.6 (1.1) 1.4 (0.8) 0.1 (0.2) -0.4 (0.2)
Combined 7.6 (2.0) 5.4 (1.3) 1.1 (0.9) 0.2 (0.2) -0.3 (0.2)Decile 3 (21-30%) Rural 6.6
6.8 (2.0) 5.1 (1.7) 1.3 (0.6) 0.2 (0.2) -0.3 (0.2)
Source: Authors' estimates
Impacts of WTO Accession on Russian Households, from Poorest to Richest (welfare change as a percent of consumption)
a/ The model is executed with 55 thousand households. Decile 1 is the poorest ten percent of all households on a per capita consumption basis. Results for decile 1 (combined, rural and urban) are a weighted average of theequivalent variation as a percentb/
Doha SDT assumes expected Doha Round reductions in tariffs and domestic support subsidized with smaller cuts for developingcountriesand no cuts for the least developed countries, withoutparticipation of Russia. c/Doha ALL assumes expected Doha Round reductions in tariffs and domestic support with exclusion of Special and Differential Treatment for developing countries.
WTO
Household types a/ accession Full removal ofdomestic support
Global Free Trade
(1) (3) (4)
d/Numbers in parentheses are the standard deviations of thewelfare impacts.
(2) (5)
Reform ofFDI barriers
only
50% Tariff Reduction
Doha
Mean S.D.d/ Mean S.D. Mean S.D. Mean S.D. Mean S.D.Decile 1 (0-10%) Rural 7.0 (4.0) 5.3 (3.0) 0.8 (1.2) 0.3 (0.3) -0.2 (0.3)
Urban 8.3 (2.0) 5.8 (1.3) 1.4 (0.9) 0.2 (0.2) -0.4 (0.2)
Combined 7.6 (3.4) 5.5 (2.4) 1.1 (1.1) 0.2 (0.3) -0.3 (0.2)
Decile 2 (11-20%) Rural 6.7 (2.2) 5.1 (1.6) 0.8 (0.9) 0.3 (0.2) -0.2 (0.2)
Urban 8.2 (1.7) 5.6 (1.1) 1.4 (0.8) 0.1 (0.2) -0.4 (0.2)
Combined 7.6 (2.0) 5.4 (1.3) 1.1 (0.9) 0.2 (0.2) -0.3 (0.2)Decile 3 (21-30%) Rural 6.6 (2.4) 5.0 (1.6) 0.8 (0.9) 0.2 (0.2) -0.2 (0.2)
Urban 8.3 (1.8) 5.6 (1.1) 1.4 (0.8) 0.1 (0.2) -0.4 (0.2)
Combined 7.7 (2.1) 5.4 (1.3) 1.2 (0.9) 0.2 (0.2) -0.3 (0.2)Decile 4 (31-40%) Rural 6.6 (2.1) 5.0 (1.6) 0.8 (0.9) 0.2 (0.2) -0.2 (0.2)
Urban 8.2 (1.6) 5.6 (1.1) 1.4 (0.7) 0.1 (0.2) -0.4 (0.2)
Combined 7.7 (1.9) 5.4 (1.3) 1.3 (0.8) 0.2 (0.2) -0.3 (0.2)
Decile 5 (41-50%) Rural 6.4 (2.0) 4.8 (1.4) 0.8 (0.8) 0.2 (0.2) -0.2 (0.2)
Urban 8.1 (1.7) 5.6 (1.2) 1.4 (0.7) 0.1 (0.2) -
(2.4) 5.0 (1.6) 0.8 (0.9) 0.2 (0.2) -0.2 (0.2)
Urban 8.3 (1.8) 5.6 (1.1) 1.4 (0.8) 0.1 (0.2) -0.4 (0.2)
Combined 7.7 (2.1) 5.4 (1.3) 1.2 (0.9) 0.2 (0.2) -0.3 (0.2)Decile 4 (31-40%) Rural 6.6 (2.1) 5.0 (1.6) 0.8 (0.9) 0.2 (0.2) -0.2 (0.2)
Urban 8.2 (1.6) 5.6 (1.1) 1.4 (0.7) 0.1 (0.2) -0.4 (0.2)
Combined 7.7 (1.9) 5.4 (1.3) 1.3 (0.8) 0.2 (0.2) -0.3 (0.2)
Decile 5 (41-50%) Rural 6.4 (2.0) 4.8 (1.4) 0.8 (0.8) 0.2 (0.2) -0.2 (0.2)
Urban 8.1 (1.7) 5.6 (1.2) 1.4 (0.7) 0.1 (0.2) -0.4 (0.2)
Combined 7.7 (2.0) 5.4 (1.3) 1.3 (0.8) 0.2 (0.2) -0.3 (0.2)
Decile 6 (51-60%) Rural 6.2 (1.9) 4.7 (1.3) 0.8 (0.8) 0.2 (0.2) -0.2 (0.2)
Urban 8.0
Mean S.D.d/ Mean S.D. Mean S.D. Mean S.D. Mean S.D.Decile 1 (0-10%) Rural 7.0 (4.0) 5.3 (3.0) 0.8 (1.2) 0.3 (0.3) -0.2 (0.3)
Urban 8.3 (2.0) 5.8 (1.3) 1.4 (0.9) 0.2 (0.2) -0.4 (0.2)
Combined 7.6 (3.4) 5.5 (2.4) 1.1 (1.1) 0.2 (0.3) -0.3 (0.2)
Decile 2 (11-20%) Rural 6.7 (2.2) 5.1 (1.6) 0.8 (0.9) 0.3 (0.2) -0.2 (0.2)
Urban
0.4 (0.2)
Combined 7.7 (2.0) 5.4 (1.3) 1.3 (0.8) 0.2 (0.2) -0.3 (0.2)
Decile 6 (51-60%) Rural 6.2 (1.9) 4.7 (1.3) 0.8 (0.8) 0.2 (0.2) -0.2 (0.2)
Urban 8.0
Mean S.D.d/ Mean S.D. Mean S.D. Mean S.D. Mean S.D.Decile 1 (0-10%) Rural 7.0 (4.0) 5.3 (3.0) 0.8 (1.2) 0.3 (0.3) -0.2 (0.3)
Urban 8.3 (2.0) 5.8 (1.3) 1.4 (0.9) 0.2 (0.2) -0.4 (0.2)
Combined 7.6 (3.4) 5.5 (2.4) 1.1 (1.1) 0.2 (0.3) -0.3 (0.2)
Decile 2 (11-20%) Rural 6.7 (2.2) 5.1 (1.6) 0.8 (0.9) 0.3 (0.2) -0.2 (0.2)
Urban
(2.4) 5.0 (1.6) 0.8 (0.9) 0.2 (0.2) -0.2 (0.2)
Urban 8.3 (1.8) 5.6 (1.1) 1.4 (0.8) 0.1 (0.2) -0.4 (0.2)
Combined 7.7 (2.1) 5.4 (1.3) 1.2 (0.9) 0.2 (0.2) -0.3 (0.2)Decile 4 (31-40%) Rural 6.6 (2.1) 5.0 (1.6) 0.8 (0.9) 0.2 (0.2) -0.2 (0.2)
Urban 8.2 (1.6) 5.6 (1.1) 1.4 (0.7) 0.1 (0.2) -0.4 (0.2)
Combined 7.7 (1.9) 5.4 (1.3) 1.3 (0.8) 0.2 (0.2) -0.3 (0.2)
Decile 5 (41-50%) Rural 6.4 (2.0) 4.8 (1.4) 0.8 (0.8) 0.2 (0.2) -0.2 (0.2)
Urban 8.1 (1.7) 5.6 (1.2) 1.4 (0.7) 0.1 (0.2) -
(2.4) 5.0 (1.6) 0.8 (0.9) 0.2 (0.2) -0.2 (0.2)
Urban 8.3 (1.8) 5.6 (1.1) 1.4 (0.8) 0.1 (0.2) -0.4 (0.2)
Combined 7.7 (2.1) 5.4 (1.3) 1.2 (0.9) 0.2 (0.2) -0.3 (0.2)Decile 4 (31-40%) Rural 6.6 (2.1) 5.0 (1.6) 0.8 (0.9) 0.2 (0.2) -0.2 (0.2)
Urban 8.2 (1.6) 5.6 (1.1) 1.4 (0.7) 0.1 (0.2) -0.4 (0.2)
Combined 7.7 (1.9) 5.4 (1.3) 1.3 (0.8) 0.2 (0.2) -0.3 (0.2)
Decile 5 (41-50%) Rural 6.4 (2.0) 4.8 (1.4) 0.8 (0.8) 0.2 (0.2) -0.2 (0.2)
Urban 8.1 (1.7) 5.6 (1.2) 1.4 (0.7) 0.1 (0.2) -0.4 (0.2)
Combined 7.7 (2.0) 5.4 (1.3) 1.3 (0.8) 0.2 (0.2) -0.3 (0.2)
Decile 6 (51-60%) Rural 6.2 (1.9) 4.7 (1.3) 0.8 (0.8) 0.2 (0.2) -0.2 (0.2)
Urban 8.0
Mean S.D.d/ Mean S.D. Mean S.D. Mean S.D. Mean S.D.Decile 1 (0-10%) Rural 7.0 (4.0) 5.3 (3.0) 0.8 (1.2) 0.3 (0.3) -0.2 (0.3)
Urban 8.3 (2.0) 5.8 (1.3) 1.4 (0.9) 0.2 (0.2) -0.4 (0.2)
Combined 7.6 (3.4) 5.5 (2.4) 1.1 (1.1) 0.2 (0.3) -0.3 (0.2)
Decile 2 (11-20%) Rural 6.7 (2.2) 5.1 (1.6) 0.8 (0.9) 0.3 (0.2) -0.2 (0.2)
Urban
0.4 (0.2)
Combined 7.7 (2.0) 5.4 (1.3) 1.3 (0.8) 0.2 (0.2) -0.3 (0.2)
Decile 6 (51-60%) Rural 6.2 (1.9) 4.7 (1.3) 0.8 (0.8) 0.2 (0.2) -0.2 (0.2)
Urban 8.0
Mean S.D.d/ Mean S.D. Mean S.D. Mean S.D. Mean S.D.Decile 1 (0-10%) Rural 7.0 (4.0) 5.3 (3.0) 0.8 (1.2) 0.3 (0.3) -0.2 (0.3)
Urban 8.3 (2.0) 5.8 (1.3) 1.4 (0.9) 0.2 (0.2) -0.4 (0.2)
Combined 7.6 (3.4) 5.5 (2.4) 1.1 (1.1) 0.2 (0.3) -0.3 (0.2)
Decile 2 (11-20%) Rural 6.7 (2.2) 5.1 (1.6) 0.8 (0.9) 0.3 (0.2) -0.2 (0.2)
Urban 8.2 (1.7) 5.6 (1.1) 1.4 (0.8) 0.1 (0.2) -0.4 (0.2)
Combined 7.6 (2.0) 5.4 (1.3) 1.1 (0.9) 0.2 (0.2) -0.3 (0.2)Decile 3 (21-30%) Rural 6.6 (2.4) 5.0 (1.6) 0.8 (0.9) 0.2 (0.2) -0.2 (0.2)
Urban 8.3 (1.8) 5.6 (1.1) 1.4 (0.8) 0.1 (0.2) -0.4 (0.2)
Combined 7.7 (2.1) 5.4 (1.3) 1.2 (0.9) 0.2 (0.2) -0.3 (0.2)Decile 4 (31-40%) Rural 6.6 (2.1) 5.0 (1.6) 0.8 (0.9) 0.2 (0.2) -0.2 (0.2)
Urban 8.2 (1.6) 5.6 (1.1) 1.4 (0.7) 0.1 (0.2) -0.4 (0.2)
Combined 7.7 (1.9) 5.4 (1.3) 1.3 (0.8) 0.2 (0.2) -0.3 (0.2)
Decile 5 (41-50%) Rural 6.4 (2.0) 4.8 (1.4) 0.8 (0.8) 0.2 (0.2) -0.2 (0.2)
Urban 8.1 (1.7) 5.6 (1.2) 1.4 (0.7) 0.1 (0.2) -0.4 (0.2)
Combined 7.7 (2.0) 5.4 (1.3) 1.3 (0.8) 0.2 (0.2) -0.3 (0.2)
Decile 6 (51-60%) Rural 6.2 (1.9) 4.7 (1.3) 0.8 (0.8) 0.2 (0.2) -0.2 (0.2)
Urban 8.0 (1.6) 5.5 (1.1) 1.5 (0.7) 0.1 (0.2) -0.4 (0.2)
Combined 7.5 (1.9) 5.3 (1.2) 1.3 (0.8) 0.1 (0.2) -0.3 (0.2)
Decile 7 (61-70%) Rural 6.2 (2.2) 4.8 (1.6) 0.8 (0.9) 0.2 (0.2) -0.2 (0.2)
Urban
8.2 (1.7) 5.6 (1.1) 1.4 (0.8) 0.1 (0.2) -0.4 (0.2)
Combined 7.6 (2.0) 5.4 (1.3) 1.1 (0.9) 0.2 (0.2) -0.3 (0.2)Decile 3 (21-30%) Rural 6.6 (2.4) 5.0 (1.6) 0.8 (0.9) 0.2 (0.2) -0.2 (0.2)
Urban 8.3 (1.8) 5.6 (1.1) 1.4 (0.8) 0.1 (0.2) -0.4 (0.2)
Combined 7.7 (2.1) 5.4 (1.3) 1.2 (0.9) 0.2 (0.2) -0.3 (0.2)Decile 4 (31-40%) Rural 6.6 (2.1) 5.0 (1.6) 0.8 (0.9) 0.2 (0.2) -0.2 (0.2)
Urban 8.2 (1.6) 5.6 (1.1) 1.4 (0.7) 0.1 (0.2) -0.4 (0.2)
Combined 7.7 (1.9) 5.4 (1.3) 1.3 (0.8) 0.2 (0.2) -0.3 (0.2)
Decile 5 (41-50%) Rural 6.4 (2.0) 4.8 (1.4) 0.8 (0.8) 0.2 (0.2) -0.2 (0.2)
Urban 8.1 (1.7) 5.6 (1.2) 1.4 (0.7) 0.1 (0.2) -0.4 (0.2)
Combined 7.7 (2.0) 5.4 (1.3) 1.3 (0.8) 0.2 (0.2) -0.3 (0.2)
Decile 6 (51-60%) Rural 6.2 (1.9) 4.7 (1.3) 0.8 (0.8) 0.2 (0.2) -0.2 (0.2)
Urban 8.0 (1.6) 5.5 (1.1) 1.5 (0.7) 0.1 (0.2) -0.4 (0.2)
Combined 7.5 (1.9) 5.3 (1.2) 1.3 (0.8) 0.1 (0.2) -0.3 (0.2)
Decile 7 (61-70%) Rural 6.2 (2.2) 4.8 (1.6) 0.8 (0.9) 0.2 (0.2) -0.2 (0.2)
Urban
developing countries.
WTO
Household types a/ accession Full removal ofdomestic support
Global Free Trade
(1) (3) (4)
d/Numbers in parentheses are the standard deviations of thewelfare impacts.
(2) (5)
Reform ofFDI barriers
only
50% Tariff Reduction
Doha
8.2 (1.7) 5.6 (1.1) 1.4 (0.8) 0.1 (0.2) -0.4 (0.2)
Combined 7.6 (2.0) 5.4 (1.3) 1.1 (0.9) 0.2 (0.2) -0.3 (0.2)Decile 3 (21-30%) Rural 6.6 (2.4) 5.0 (1.6) 0.8 (0.9) 0.2 (0.2) -0.2 (0.2)
Urban 8.3 (1.8) 5.6 (1.1) 1.4 (0.8) 0.1 (0.2) -0.4 (0.2)
Combined 7.7 (2.1) 5.4 (1.3) 1.2 (0.9) 0.2 (0.2) -0.3 (0.2)Decile 4 (31-40%) Rural 6.6 (2.1) 5.0 (1.6) 0.8 (0.9) 0.2 (0.2) -0.2 (0.2)
Urban 8.2 (1.6) 5.6 (1.1) 1.4 (0.7) 0.1 (0.2) -0.4 (0.2)
Combined 7.7 (1.9) 5.4 (1.3) 1.3 (0.8) 0.2 (0.2)
8.2 (1.7) 5.6 (1.1) 1.4 (0.8) 0.1 (0.2) -0.4 (0.2)
Combined 7.6 (2.0) 5.4 (1.3) 1.1 (0.9) 0.2 (0.2) -0.3 (0.2)Decile 3 (21-30%) Rural 6.6 (2.4) 5.0 (1.6) 0.8 (0.9) 0.2 (0.2) -0.2 (0.2)
Urban 8.3 (1.8) 5.6 (1.1) 1.4 (0.8) 0.1 (0.2) -0.4 (0.2)
Combined 7.7 (2.1) 5.4 (1.3) 1.2 (0.9) 0.2 (0.2) -0.3 (0.2)Decile 4 (31-40%) Rural 6.6 (2.1) 5.0 (1.6) 0.8 (0.9) 0.2 (0.2) -0.2 (0.2)
Urban 8.2 (1.6) 5.6 (1.1) 1.4 (0.7) 0.1 (0.2) -0.4 (0.2)
Combined 7.7 (1.9) 5.4 (1.3) 1.3 (0.8) 0.2 (0.2) -0.3 (0.2)
Decile 5 (41-50%) Rural 6.4 (2.0) 4.8 (1.4) 0.8 (0.8) 0.2 (0.2) -0.2 (0.2)
Urban 8.1 (1.7) 5.6 (1.2) 1.4 (0.7) 0.1 (0.2) -0.4 (0.2)
Combined 7.7 (2.0) 5.4 (1.3) 1.3 (0.8) 0.2 (0.2) -0.3 (0.2)
Decile 6 (51-60%) Rural 6.2 (1.9) 4.7 (1.3) 0.8 (0.8) 0.2 (0.2) -0.2 (0.2)
Urban 8.0 (1.6) 5.5 (1.1) 1.5 (0.7) 0.1 (0.2) -0.4 (0.2)
Combined 7.5 (1.9) 5.3 (1.2) 1.3 (0.8) 0.1 (0.2) -0.3 (0.2)
Decile 7 (61-70%) Rural 6.2 (2.2) 4.8 (1.6) 0.8 (0.9) 0.2 (0.2) -0.2 (0.2)
Urban
-0.3 (0.2)
Decile 5 (41-50%) Rural 6.4 (2.0) 4.8 (1.4) 0.8 (0.8) 0.2 (0.2) -0.2 (0.2)
Urban 8.1 (1.7) 5.6 (1.2) 1.4 (0.7) 0.1 (0.2) -0.4 (0.2)
Combined 7.7 (2.0) 5.4 (1.3) 1.3 (0.8) 0.2 (0.2) -0.3 (0.2)
Decile 6 (51-60%) Rural 6.2 (1.9) 4.7 (1.3) 0.8 (0.8) 0.2 (0.2) -0.2 (0.2)
Urban 8.0 (1.6) 5.5 (1.1) 1.5 (0.7) 0.1 (0.2) -0.4 (0.2)
Combined 7.5 (1.9) 5.3 (1.2) 1.3 (0.8) 0.1 (0.2) -0.3 (0.2)
Decile 7 (61-70%) Rural 6.2 (2.2) 4.8 (1.6) 0.8 (0.9) 0.2 (0.2) -0.2 (0.2)
Urban
8.2 (1.7) 5.6 (1.1) 1.4 (0.8) 0.1 (0.2) -0.4 (0.2)
Combined 7.6 (2.0) 5.4 (1.3) 1.1 (0.9) 0.2 (0.2) -0.3 (0.2)Decile 3 (21-30%) Rural 6.6 (2.4) 5.0 (1.6) 0.8 (0.9) 0.2 (0.2) -0.2 (0.2)
Urban 8.3 (1.8) 5.6 (1.1) 1.4 (0.8) 0.1 (0.2) -0.4 (0.2)
Combined 7.7 (2.1) 5.4 (1.3) 1.2 (0.9) 0.2 (0.2) -0.3 (0.2)Decile 4 (31-40%) Rural 6.6 (2.1) 5.0 (1.6) 0.8 (0.9) 0.2 (0.2) -0.2 (0.2)
Urban 8.2 (1.6) 5.6 (1.1) 1.4 (0.7) 0.1 (0.2) -0.4 (0.2)
Combined 7.7 (1.9) 5.4 (1.3) 1.3 (0.8) 0.2 (0.2)
8.2 (1.7) 5.6 (1.1) 1.4 (0.8) 0.1 (0.2) -0.4 (0.2)
Combined 7.6 (2.0) 5.4 (1.3) 1.1 (0.9) 0.2 (0.2) -0.3 (0.2)Decile 3 (21-30%) Rural 6.6 (2.4) 5.0 (1.6) 0.8 (0.9) 0.2 (0.2) -0.2 (0.2)
Urban 8.3 (1.8) 5.6 (1.1) 1.4 (0.8) 0.1 (0.2) -0.4 (0.2)
Combined 7.7 (2.1) 5.4 (1.3) 1.2 (0.9) 0.2 (0.2) -0.3 (0.2)Decile 4 (31-40%) Rural 6.6 (2.1) 5.0 (1.6) 0.8 (0.9) 0.2 (0.2) -0.2 (0.2)
Urban 8.2 (1.6) 5.6 (1.1) 1.4 (0.7) 0.1 (0.2) -0.4 (0.2)
Combined 7.7 (1.9) 5.4 (1.3) 1.3 (0.8) 0.2 (0.2) -0.3 (0.2)
Decile 5 (41-50%) Rural 6.4 (2.0) 4.8 (1.4) 0.8 (0.8) 0.2 (0.2) -0.2 (0.2)
Urban 8.1 (1.7) 5.6 (1.2) 1.4 (0.7) 0.1 (0.2) -0.4 (0.2)
Combined 7.7 (2.0) 5.4 (1.3) 1.3 (0.8) 0.2 (0.2) -0.3 (0.2)
Decile 6 (51-60%) Rural 6.2 (1.9) 4.7 (1.3) 0.8 (0.8) 0.2 (0.2) -0.2 (0.2)
Urban 8.0 (1.6) 5.5 (1.1) 1.5 (0.7) 0.1 (0.2) -0.4 (0.2)
Combined 7.5 (1.9) 5.3 (1.2) 1.3 (0.8) 0.1 (0.2) -0.3 (0.2)
Decile 7 (61-70%) Rural 6.2 (2.2) 4.8 (1.6) 0.8 (0.9) 0.2 (0.2) -0.2 (0.2)
Urban
-0.3 (0.2)
Decile 5 (41-50%) Rural 6.4 (2.0) 4.8 (1.4) 0.8 (0.8) 0.2 (0.2) -0.2 (0.2)
Urban 8.1 (1.7) 5.6 (1.2) 1.4 (0.7) 0.1 (0.2) -0.4 (0.2)
Combined 7.7 (2.0) 5.4 (1.3) 1.3 (0.8) 0.2 (0.2) -0.3 (0.2)
Decile 6 (51-60%) Rural 6.2 (1.9) 4.7 (1.3) 0.8 (0.8) 0.2 (0.2) -0.2 (0.2)
Urban 8.0 (1.6) 5.5 (1.1) 1.5 (0.7) 0.1 (0.2) -0.4 (0.2)
Combined 7.5 (1.9) 5.3 (1.2) 1.3 (0.8) 0.1 (0.2) -0.3 (0.2)
Decile 7 (61-70%) Rural 6.2 (2.2) 4.8 (1.6) 0.8 (0.9) 0.2 (0.2) -0.2 (0.2)
Urban
developing countries.
WTO
Household types a/ accession Full removal ofdomestic support
Global Free Trade
(1) (3) (4)
d/Numbers in parentheses are the standard deviations of thewelfare impacts.
(2) (5)
Reform ofFDI barriers
only
50% Tariff Reduction
Doha

31
Gross Output
Sector Specific
Resources
Skilled Labor
DomesticIntermediate
ImportedIntermediate
DomesticIntermediate
ImportedIntermediate
CES
CompositeIntermediateIRTS goods
CES
CompositeIntermediateCRTS goods
Value-addedBusiness Services
CES
….σ = 1
σ = 1.25
Value-added and Business Services
Leontief
Intermediate Goods
σ = 0
Leontiefσ = 0
CET
Domestic Supply
Export Supply
σ = 5
Business Service 11
CES
Business Service 1
CES
Domestic Presence Services
Cross Border Services
Cobb-Douglas
σ = 1.5 σ = 1.5
σ = 1
σ =3 σ =3
Other Services 11
Other Services 1
Leontiefσ = 0
Other Services
CES
Domestic Services
σ =3
Multinational Services
Russian Services
Capital Unskilled Labor
Cross Border
Services
CESσ =3
Domestic Services
Cross Border
Services
σ =3
Domestic Presence Services
Cross Border Services
σ =3
Multinational Services
Russian Services
….
….Cobb-Douglas….
CES
Multinational Service
Providers
Services
σ =3
Domestic Presence Services
Cross Border Services
σ =
Multinational Services
Russian Services
….
….Cobb-Douglas….
CES
ServiceProviders
Russian Firms
σ =
Foreign-based Firms
σ =
Multinational
CES CES
ServiceProviders
Russian Service
Providers
σ=3σ=3 σ=3CES σ=3
Russian Service
Providers
Gross Output
Sector Specific
Resources
Skilled Labor
DomesticIntermediate
ImportedIntermediate
DomesticIntermediate
ImportedIntermediate
CES
CompositeIntermediateIRTS goods
CES
CompositeIntermediateCRTS goods
Value-addedBusiness Services
CES
….σ = 1
σ = 1.25
Value-added and Business Services
Leontief
Intermediate Goods
σ = 0
Leontiefσ = 0
CET
Domestic Supply
Export Supply
σ = 5
Business Service 11
CES
Business Service 1
CES
Domestic Presence Services
Cross Border Services
Cobb-Douglas
σ = 1.25
Value-added and Business Services
Leontief
Intermediate Goods
σ = 0
Leontiefσ = 0
CET
Domestic Supply
Export Supply
σ = 5
Business Service 11
CES
Business Service 1
CES
Domestic Presence Services
Cross Border Services
Cobb-Douglas
σ = 1.5 σ
σ = 1
σ = σ =3
Other Services 11
Other Services 1
Leontiefσ = 0
Other Services
CES
Domestic Services
σ =
Multinational Services
Russian Services
Capital Unskilled Labor
Cross Border
Services
CESσ =3
Domestic Services
Cross Border
Services
σ =3
Domestic Presence Services
Cross Border Services
σ =
Multinational Services
Russian Services
….
….Cobb-Douglas….
CES
ServiceProviders
Russian Firms
σ =
Foreign-based Firms
σ =
Foreign-based Firms
σ =
Multinational
CES CES
ServiceProviders
Russian Service
Providers
σ=3σ=3 σ=3CES σ=3
Russian Service
Providers
Gross Output
Sector Specific
Resources
Skilled Labor
DomesticIntermediate
ImportedIntermediate
DomesticIntermediate
ImportedIntermediate
CES
CompositeIntermediateIRTS goods
CES
CompositeIntermediateCRTS goods
Value-addedBusiness Services
CES
….σ = 1
σ = 1.25
Value-added and Business Services
Leontief
Intermediate Goods
σ = 0
Leontiefσ = 0
CET
Domestic Supply
Export Supply
σ = 5
Business Service 11
CES
Business Service 1
CES
Domestic Presence Services
Cross Border Services
Cobb-Douglas
σ = 1.5 σ = 1.5
σ = 1
σ =3 σ =3
Other Services 11
Other Services 1
Leontiefσ = 0
Other Services
CES
Domestic Services
σ =3
Multinational Services
Russian Services
Capital Unskilled Labor
Cross Border
Services
CESσ =3
Domestic Services
Cross Border
Services
σ =3
Domestic Presence Services
Cross Border Services
σ =3
Multinational Services
Russian Services
….
….Cobb-Douglas….
CES
Multinational Service
Providers
Russian Firms
σ =3
Foreign-based Firms
σ =3
Figure 1: Production and Allocation of Output
Gross Output
Sector Specific
Resources
Skilled Labor
DomesticIntermediate
ImportedIntermediate
DomesticIntermediate
ImportedIntermediate
CES
CompositeIntermediateIRTS goods
CES
CompositeIntermediateCRTS goods
Value-addedBusiness Services
CES
….σ = 1
σ = 1.25
Value-added and Business Services
Leontief
Intermediate Goods
σ = 0
Leontiefσ = 0
CET
Domestic Supply
Export Supply
σ = 5
Business Service 11
CES
Business Service 1
CES
Domestic Presence Services
Cross Border Services
Cobb-Douglas
σ = 1.5 σ
σ = 1
σ = σ =3
Other Services 11
Other Services 1
Leontiefσ = 0
Other Services
CES
Domestic Services
σ =
Multinational Services
Russian Services
Capital Unskilled Labor
Cross Border
Services
CESσ =3
Domestic Services
Cross Border
Russian Firms
σ =3
Foreign-based Firms
σ =3
Gross Output
Sector Specific
Resources
Skilled Labor
DomesticIntermediate
ImportedIntermediate
DomesticIntermediate
ImportedIntermediate
CES
CompositeIntermediateIRTS goods
CES
CompositeIntermediateCRTS goods
Value-addedBusiness Services
CES
….σ = 1
σ = 1.25
Value-added and Business Services
Leontief
Intermediate Goods
σ = 0
Leontiefσ = 0
CET
Domestic Supply
Export Supply
σ = 5
Business Service 11
CES
Business Service 1
CES
Domestic Presence Services
Cross Border Services
Cobb-Douglas
σ = 1.5 σ
σ = 1
σ = σ =3
Other Services 11
Other Services 1
Leontiefσ = 0
Other Services
CES
Domestic Services
σ =
Multinational Services
Russian Services
Capital Unskilled Labor
Cross Border
Services
CESσ =3
Domestic Services
Cross Border
Services
σ =3
Domestic Presence Services
Cross Border Services
σ =
Multinational Services
Russian Services
….
….Cobb-Douglas….
CES
ServiceProviders
Russian Firms
σ =
Foreign-based Firms
σ =
Multinational
CES CES
ServiceProviders
Russian Service
Providers
σ=3σ=3 σ=3CES σ=3
Russian Service
Providers
Gross Output
Sector Specific
Resources
Skilled Labor
DomesticIntermediate
ImportedIntermediate
DomesticIntermediate
ImportedIntermediate
CES
CompositeIntermediateIRTS goods
CES
CompositeIntermediateCRTS goods
Value-addedBusiness Services
CES
….σ = 1
σ = 1.25
Value-added and Business Services
Leontief
Intermediate Goods
σ = 0
Leontiefσ = 0
CET
Domestic Supply
Export Supply
σ = 5
Business Service 11
CES
Business Service 1
CES
Domestic Presence Services
Cross Border Services
Cobb-Douglas
σ = 1.25
Value-added and Business Services
Leontief
Intermediate Goods
σ = 0
Leontiefσ = 0
CET
Domestic Supply
Export Supply
σ = 5
Business Service 11
CES
Business Service 1
CES
Domestic Presence Services
Cross Border Services
Cobb-Douglas
σ = 1.5 σ
σ = 1
σ = σ =3
Other Services 11
Other Services 1
Leontiefσ = 0
Other Services
CES
Domestic Services
σ =
Multinational Services
Russian Services
Capital Unskilled Labor
Cross Border
Services
CESσ =3
Domestic Services
Cross Border
Services
σ =3
Domestic Presence Services
Cross Border Services
σ =
Multinational Services
Russian Services
….
….Cobb-Douglas….
CES
ServiceProviders
Russian Firms
σ =
Foreign-based Firms
σ
σ = 1.25
Value-added and Business Services
Leontief
Intermediate Goods
σ = 0
Leontiefσ = 0
CET
Domestic Supply
Export Supply
σ = 5
Business Service 11
CES
Business Service 1
CES
Domestic Presence Services
Cross Border Services
Cobb-Douglas
σ = 1.5 σ
σ = 1
σ = σ =3
Other Services 11
Other Services 1
Leontiefσ = 0
Other Services
CES
Domestic Services
σ =
Multinational Services
Russian Services
Capital Unskilled Labor
Cross Border
Services
CESσ =3
Domestic Services
Cross Border
Services
σ =3
Domestic Presence Services
Cross Border Services
σ =
Multinational Services
Russian Services
….
….Cobb-Douglas….
CES
ServiceProviders
Russian Firms
σ =
Foreign-based Firms
σ =
Foreign-based Firms
σ =
Multinational
CES CES
ServiceProviders
Russian Service
Providers
σ=3σ=3 σ=3CES σ=3
Russian Service
Providers
Gross Output
Sector Specific
Resources
Skilled Labor
DomesticIntermediate
ImportedIntermediate
DomesticIntermediate
ImportedIntermediate
CES
CompositeIntermediateIRTS goods
CES
CompositeIntermediateCRTS goods
Value-addedBusiness Services
CES
….σ = 1
σ = 1.25
Value-added and Business Services
Leontief
Intermediate Goods
σ = 0
Leontiefσ = 0
CET
Domestic Supply
Export Supply
σ = 5
Business Service 11
CES
Business Service 1
CES
Domestic Presence Services
Cross Border Services
Cobb-Douglas
σ = 1.5 σ = 1.5
σ = 1
σ =3 σ =3
Other Services 11
Other Services 1
Leontiefσ = 0
Other Services
CES
Domestic Services
σ =3
Multinational Services
Russian Services
Capital Unskilled Labor
Cross Border
Services
CESσ =3
Domestic Services
Cross Border
Services
σ =3
Domestic Presence Services
Cross Border Services
σ =3
Multinational Services
Russian Services
….
….Cobb-Douglas….
CES
Multinational Service
Providers
Services
σ =3
Domestic Presence Services
Cross Border Services
σ =
Multinational Services
Russian Services
….
….Cobb-Douglas….
CES
ServiceProviders
Russian Firms
σ =
Foreign-based Firms
σ =
Multinational
CES CES
ServiceProviders
Russian Service
Providers
σ=3σ=3 σ=3CES σ=3
Russian Service
Providers
Gross Output
Sector Specific
Resources
Skilled Labor
DomesticIntermediate
ImportedIntermediate
DomesticIntermediate
ImportedIntermediate
CES
CompositeIntermediateIRTS goods
CES
CompositeIntermediateCRTS goods
Value-addedBusiness Services
CES
….σ = 1
σ = 1.25
Value-added and Business Services
Leontief
Intermediate Goods
σ = 0
Leontiefσ = 0
CET
Domestic Supply
Export Supply
σ = 5
Business Service 11
CES
Business Service 1
CES
Domestic Presence Services
Cross Border Services
Cobb-Douglas
σ = 1.25
Value-added and Business Services
Leontief
Intermediate Goods
σ = 0
Leontiefσ = 0
CET
Domestic Supply
Export Supply
σ = 5
Business Service 11
CES
Business Service 1
CES
Domestic Presence Services
Cross Border Services
Cobb-Douglas
σ = 1.5 σ
σ = 1
σ = σ =3
Other Services 11
Other Services 1
Leontiefσ = 0
Other Services
CES
Domestic Services
σ =
Multinational Services
Russian Services
Capital Unskilled Labor
Cross Border
Services
CESσ =3
Domestic Services
Cross Border
Services
σ =3
Domestic Presence Services
Cross Border Services
σ =
Multinational Services
Russian Services
….
….Cobb-Douglas….
CES
ServiceProviders
Russian Firms
σ =
Foreign-based Firms
σ
σ = 1.25
Value-added and Business Services
Leontief
Intermediate Goods
σ = 0
Leontiefσ = 0
CET
Domestic Supply
Export Supply
σ = 5
Business Service 11
CES
Business Service 1
CES
Domestic Presence Services
Cross Border Services
Cobb-Douglas
σ = 1.5 σ
σ = 1
σ = σ =3
Other Services 11
Other Services 1
Leontiefσ = 0
Other Services
CES
Domestic Services
σ =
Multinational Services
Russian Services
Capital Unskilled Labor
Cross Border
Services
CESσ =3
Domestic Services
Cross Border
Services
σ =3
Domestic Presence Services
Cross Border Services
σ =
Multinational Services
Russian Services
….
….Cobb-Douglas….
CES
ServiceProviders
Russian Firms
σ =
Foreign-based Firms
σ =
Foreign-based Firms
σ =
Multinational
CES CES
ServiceProviders
Russian Service
Providers
σ=3σ=3 σ=3CES σ=3
Russian Service
Providers
Gross Output
Sector Specific
Resources
Skilled Labor
DomesticIntermediate
ImportedIntermediate
DomesticIntermediate
ImportedIntermediate
CES
CompositeIntermediateIRTS goods
CES
CompositeIntermediateCRTS goods
Value-addedBusiness Services
CES
….σ = 1
σ = 1.25
Value-added and Business Services
Leontief
Intermediate Goods
σ = 0
Leontiefσ = 0
CET
Domestic Supply
Export Supply
σ = 5
Business Service 11
CES
Business Service 1
CES
Domestic Presence Services
Cross Border Services
Cobb-Douglas
σ = 1.5 σ = 1.5
σ = 1
σ =3 σ =3
Other Services 11
Other Services 1
Leontiefσ = 0
Other Services
CES
Domestic Services
σ =3
Multinational Services
Russian Services
Capital Unskilled Labor
Cross Border
Services
CESσ =3
Domestic Services
Cross Border
Services
σ =3
Domestic Presence Services
Cross Border Services
σ =3
Multinational Services
Russian Services
….
….Cobb-Douglas….
CES
Multinational Service
Providers
Gross Output
Sector Specific
Resources
Skilled Labor
DomesticIntermediate
ImportedIntermediate
DomesticIntermediate
ImportedIntermediate
CES
CompositeIntermediateIRTS goods
CES
CompositeIntermediateCRTS goods
Value-addedBusiness Services
CES
….σ = 1
σ = 1.25
Value-added and Business Services
Leontief
Intermediate Goods
σ = 0
Leontiefσ = 0
CET
Domestic Supply
Export Supply
σ = 5
Business Service 11
CES
Business Service 1
CES
Domestic Presence Services
Cross Border Services
Cobb-Douglas
σ = 1.5 σ = 1.5
σ = 1
σ =3 σ =3
Other Services 11
Other Services 1
Leontiefσ = 0
Other Services
CES
Domestic Services
σ =3
Multinational Services
Russian Services
Capital Unskilled Labor
Cross Border
Services
CESσ =3
Domestic Services
Cross Border
Services
σ =3
Domestic Presence Services
Cross Border Services
σ =3
Multinational Services
Russian Services
….
….Cobb-Douglas….
CES
Multinational Service
Providers
Russian Firms
σ =3
Foreign-based Firms
σ =3
Gross Output
Sector Specific
Resources
Skilled Labor
DomesticIntermediate
ImportedIntermediate
DomesticIntermediate
ImportedIntermediate
CES
CompositeIntermediateIRTS goods
CES
CompositeIntermediateCRTS goods
Value-addedBusiness Services
CES
….σ = 1
σ = 1.25
Value-added and Business Services
Leontief
Intermediate Goods
σ = 0
Leontiefσ = 0
CET
Domestic Supply
Export Supply
σ = 5
Business Service 11
CES
Business Service 1
CES
Domestic Presence Services
Cross Border Services
Cobb-Douglas
σ = 1.5 σ
σ = 1
σ = σ =3
Other Services 11
Other Services 1
Leontiefσ = 0
Other Services
CES
Domestic Services
σ =
Multinational Services
Russian Services
Capital Unskilled Labor
Cross Border
Services
CESσ =3
Domestic Services
Cross Border
Services
σ =3
Domestic Presence Services
Cross Border Services
σ =
Multinational Services
Russian Services
….
….Cobb-Douglas….
CES
ServiceProviders
Russian Firms
σ =
Foreign-based Firms
σ =
Multinational
CES CES
ServiceProviders
Russian Service
Providers
σ=3σ=3 σ=3CES σ=3
Russian Service
Providers
Gross Output
Sector Specific
Resources
Skilled Labor
DomesticIntermediate
ImportedIntermediate
DomesticIntermediate
ImportedIntermediate
CES
CompositeIntermediateIRTS goods
CES
CompositeIntermediateCRTS goods
Value-addedBusiness Services
CES
….σ = 1
σ = 1.25
Value-added and Business Services
Leontief
Intermediate Goods
σ = 0
Leontiefσ = 0
CET
Domestic Supply
Export Supply
σ = 5
Business Service 11
CES
Business Service 1
CES
Domestic Presence Services
Cross Border Services
Cobb-Douglas
σ = 1.25
Value-added and Business Services
Leontief
Intermediate Goods
σ = 0
Leontiefσ = 0
CET
Domestic Supply
Export Supply
σ = 5
Business Service 11
CES
Business Service 1
CES
Domestic Presence Services
Cross Border Services
Cobb-Douglas
σ = 1.5 σ
σ = 1
σ = σ =3
Other Services 11
Other Services 1
Leontiefσ = 0
Other Services
CES
Domestic Services
σ =
Multinational Services
Russian Services
Capital Unskilled Labor
Cross Border
Services
CESσ =3
Domestic Services
Cross Border
Services
σ =3
Domestic Presence Services
Cross Border Services
σ =
Multinational Services
Russian Services
….
….Cobb-Douglas….
CES
ServiceProviders
Russian Firms
σ =
Foreign-based Firms
σ
σ = 1.25
Value-added and Business Services
Leontief
Intermediate Goods
σ = 0
Leontiefσ = 0
CET
Domestic Supply
Export Supply
σ = 5
Business Service 11
CES
Business Service 1
CES
Domestic Presence Services
Cross Border Services
Cobb-Douglas
σ = 1.5 σ
σ = 1
σ = σ =3
Other Services 11
Other Services 1
Leontiefσ = 0
Other Services
CES
Domestic Services
σ =
Multinational Services
Russian Services
Capital Unskilled Labor
Cross Border
Services
CESσ =3
Domestic Services
Cross Border
Services
σ =3
Domestic Presence Services
Cross Border Services
σ =
Multinational Services
Russian Services
….
….Cobb-Douglas….
CES
ServiceProviders
Russian Firms
σ =
Foreign-based Firms
σ =
Foreign-based Firms
σ =
Multinational
CES CES
ServiceProviders
Russian Service
Providers
σ=3σ=3 σ=3CES σ=3
Russian Service
Providers
σ = 1.25
Value-added and Business Services
Leontief
Intermediate Goods
σ = 0
Leontiefσ = 0
CET
Domestic Supply
Export Supply
σ = 5
Business Service 11
CES
Business Service 1
CES
Domestic Presence Services
Cross Border Services
Cobb-Douglas
σ = 1.5 σ
σ = 1
σ = σ =3
Other Services 11
Other Services 1
Leontiefσ = 0
Other Services
CES
Domestic Services
σ =
Multinational Services
Russian Services
Capital Unskilled Labor
Cross Border
Services
CESσ =3
Domestic Services
Cross Border
Services
σ =3
Domestic Presence Services
Cross Border Services
σ =
Multinational Services
Russian Services
….
….Cobb-Douglas….
CES
ServiceProviders
Russian Firms
σ =
Foreign-based Firms
σ
σ = 1.25
Value-added and Business Services
Leontief
Intermediate Goods
σ = 0
Leontiefσ = 0
CET
Domestic Supply
Export Supply
σ = 5
Business Service 11
CES
Business Service 1
CES
Domestic Presence Services
Cross Border Services
Cobb-Douglas
σ = 1.5 σ
σ = 1
σ = σ =3
Other Services 11
Other Services 1
Leontiefσ = 0
Other Services
CES
Domestic Services
σ =
Multinational Services
Russian Services
Capital Unskilled Labor
Cross Border
Services
CESσ =3
Domestic Services
Cross Border
Services
σ =3
Domestic Presence Services
Cross Border Services
σ =
Multinational Services
Russian Services
….
….Cobb-Douglas….
CES
ServiceProviders
Russian Firms
σ =
Foreign-based Firms
σ =
Foreign-based Firms
σ =
Multinational
CES CES
ServiceProviders
Russian Service
Providers
σ=3σ=3 σ=3CES σ=3
Russian Service
Providers
Gross Output
Sector Specific
Resources
Skilled Labor
DomesticIntermediate
ImportedIntermediate
DomesticIntermediate
ImportedIntermediate
CES
CompositeIntermediateIRTS goods
CES
CompositeIntermediateCRTS goods
Value-addedBusiness Services
CES
….σ = 1
σ = 1.25
Value-added and Business Services
Leontief
Intermediate Goods
σ = 0
Leontiefσ = 0
CET
Domestic Supply
Export Supply
σ = 5
Business Service 11
CES
Business Service 1
CES
Domestic Presence Services
Cross Border Services
Cobb-Douglas
σ = 1.5 σ = 1.5
σ = 1
σ =3 σ =3
Other Services 11
Other Services 1
Leontiefσ = 0
Other Services
CES
Domestic Services
σ =3
Multinational Services
Russian Services
Capital Unskilled Labor
Cross Border
Services
CESσ =3
Domestic Services
Cross Border
Services
σ =3
Domestic Presence Services
Cross Border Services
σ =3
Multinational Services
Russian Services
….
….Cobb-Douglas….
CES
Multinational Service
Providers
Services
σ =3
Domestic Presence Services
Cross Border Services
σ =
Multinational Services
Russian Services
….
….Cobb-Douglas….
CES
ServiceProviders
Russian Firms
σ =
Foreign-based Firms
σ =
Multinational
CES CES
ServiceProviders
Russian Service
Providers
σ=3σ=3 σ=3CES σ=3
Russian Service
Providers
Gross Output
Sector Specific
Resources
Skilled Labor
DomesticIntermediate
ImportedIntermediate
DomesticIntermediate
ImportedIntermediate
CES
CompositeIntermediateIRTS goods
CES
CompositeIntermediateCRTS goods
Value-addedBusiness Services
CES
….σ = 1
σ = 1.25
Value-added and Business Services
Leontief
Intermediate Goods
σ = 0
Leontiefσ = 0
CET
Domestic Supply
Export Supply
σ = 5
Business Service 11
CES
Business Service 1
CES
Domestic Presence Services
Cross Border Services
Cobb-Douglas
σ = 1.25
Value-added and Business Services
Leontief
Intermediate Goods
σ = 0
Leontiefσ = 0
CET
Domestic Supply
Export Supply
σ = 5
Business Service 11
CES
Business Service 1
CES
Domestic Presence Services
Cross Border Services
Cobb-Douglas
σ = 1.5 σ
σ = 1
σ = σ =3
Other Services 11
Other Services 1
Leontiefσ = 0
Other Services
CES
Domestic Services
σ =
Multinational Services
Russian Services
Capital Unskilled Labor
Cross Border
Services
CESσ =3
Domestic Services
Cross Border
Services
σ =3
Domestic Presence Services
Cross Border Services
σ =
Multinational Services
Russian Services
….
….Cobb-Douglas….
CES
ServiceProviders
Russian Firms
σ =
Foreign-based Firms
σ
σ = 1.25
Value-added and Business Services
Leontief
Intermediate Goods
σ = 0
Leontiefσ = 0
CET
Domestic Supply
Export Supply
σ = 5
Business Service 11
CES
Business Service 1
CES
Domestic Presence Services
Cross Border Services
Cobb-Douglas
σ = 1.5 σ
σ = 1
σ = σ =3
Other Services 11
Other Services 1
Leontiefσ = 0
Other Services
CES
Domestic Services
σ =
Multinational Services
Russian Services
Capital Unskilled Labor
Cross Border
Services
CESσ =3
Domestic Services
Cross Border
Services
σ =3
Domestic Presence Services
Cross Border Services
σ =
Multinational Services
Russian Services
….
….Cobb-Douglas….
CES
ServiceProviders
Russian Firms
σ =
Foreign-based Firms
σ =
Foreign-based Firms
σ =
Multinational
CES CES
ServiceProviders
Russian Service
Providers
σ=3σ=3 σ=3CES σ=3
Russian Service
Providers
Gross Output
Sector Specific
Resources
Skilled Labor
DomesticIntermediate
ImportedIntermediate
DomesticIntermediate
ImportedIntermediate
CES
CompositeIntermediateIRTS goods
CES
CompositeIntermediateCRTS goods
Value-addedBusiness Services
CES
….σ = 1
σ = 1.25
Value-added and Business Services
Leontief
Intermediate Goods
σ = 0
Leontiefσ = 0
CET
Domestic Supply
Export Supply
σ = 5
Business Service 11
CES
Business Service 1
CES
Domestic Presence Services
Cross Border Services
Cobb-Douglas
σ = 1.5 σ = 1.5
σ = 1
σ =3 σ =3
Other Services 11
Other Services 1
Leontiefσ = 0
Other Services
CES
Domestic Services
σ =3
Multinational Services
Russian Services
Capital Unskilled Labor
Cross Border
Services
CESσ =3
=
Foreign-based Firms
σ =
Multinational
CES CES
ServiceProviders
Russian Service
Providers
σ=3σ=3 σ=3CES σ=3
Russian Service
Providers
Gross Output
Sector Specific
Resources
Skilled Labor
DomesticIntermediate
ImportedIntermediate
DomesticIntermediate
ImportedIntermediate
CES
CompositeIntermediateIRTS goods
CES
CompositeIntermediateCRTS goods
Value-addedBusiness Services
CES
….σ = 1
σ = 1.25
Value-added and Business Services
Leontief
Intermediate Goods
σ = 0
Leontiefσ = 0
CET
Domestic Supply
Export Supply
σ = 5
Business Service 11
CES
Business Service 1
CES
Domestic Presence Services
Cross Border Services
Cobb-Douglas
σ = 1.5 σ = 1.5
σ = 1
σ =3 σ =3
Other Services 11
Other Services 1
Leontiefσ = 0
Other Services
CES
Domestic Services
σ =3
Multinational Services
Russian Services
Capital Unskilled Labor
Cross Border
Services
CESσ =3
Domestic Services
Cross Border
Services
σ =3
Domestic Presence Services
Cross Border Services
σ =3
Multinational Services
Russian Services
….
….Cobb-Douglas….
CES
Multinational Service
Providers
Russian Firms
σ =3
Foreign-based Firms
σ =3
Figure 1: Production and Allocation of Output
Gross Output
Sector Specific
Resources
Skilled Labor
DomesticIntermediate
ImportedIntermediate
DomesticIntermediate
ImportedIntermediate
CES
CompositeIntermediateIRTS goods
CES
CompositeIntermediateCRTS goods
Value-addedBusiness Services
CES
….σ = 1
σ = 1.25
Value-added and Business Services
Leontief
Intermediate Goods
σ = 0
Leontiefσ = 0
CET
Domestic Supply
Export Supply
σ = 5
Business Service 11
CES
Business Service 1
CES
Domestic Presence Services
Cross Border Services
Cobb-Douglas
σ = 1.5 σ
σ = 1
σ = σ =3
Other Services 11
Other Services 1
Leontiefσ = 0
Other Services
CES
Domestic Services
Domestic Services
Cross Border
Services
σ =3
Domestic Presence Services
Cross Border Services
σ =3
Multinational Services
Russian Services
….
….Cobb-Douglas….
CES
Multinational Service
Providers
Russian Firms
σ =3
Foreign-based Firms
σ =3
Figure 1: Production and Allocation of Output
Gross Output
Sector Specific
Resources
Skilled Labor
DomesticIntermediate
ImportedIntermediate
DomesticIntermediate
ImportedIntermediate
CES
CompositeIntermediateIRTS goods
CES
CompositeIntermediateCRTS goods
Value-addedBusiness Services
CES
….σ = 1
σ = 1.25
Value-added and Business Services
Leontief
Intermediate Goods
σ = 0
Leontiefσ = 0
CET
Domestic Supply
Export Supply
σ = 5
Business Service 11
CES
Business Service 1
CES
Domestic Presence Services
Cross Border Services
Cobb-Douglas
σ = 1.5 σ
σ = 1
σ = σ =3
Other Services 11
Other Services 1
Leontiefσ = 0
Other Services
CES
Domestic Services
σ =
Multinational Services
Russian Services
Capital Unskilled Labor
Cross Border
Services
CESσ =3
Domestic Services
Cross Border
Russian Firms
σ =3
Foreign-based Firms
σ =3
Gross Output
Sector Specific
Resources
Skilled Labor
DomesticIntermediate
ImportedIntermediate
DomesticIntermediate
ImportedIntermediate
CES
CompositeIntermediateIRTS goods
CES
CompositeIntermediateCRTS goods
Value-addedBusiness Services
CES
….σ = 1
σ = 1.25
Value-added and Business Services
Leontief
Intermediate Goods
σ = 0
Leontiefσ = 0
CET
Domestic Supply
Export Supply
σ = 5
Business Service 11
CES
Business Service 1
CES
Domestic Presence Services
Cross Border Services
Cobb-Douglas
σ = 1.5 σ
σ = 1
σ = σ =3
Other Services 11
Other Services 1
Leontiefσ = 0
Other Services
CES
Domestic Services
σ =
Multinational Services
Russian Services
Capital Unskilled Labor
Cross Border
Services
CESσ =3
Domestic Services
Cross Border
Services
σ =3
Domestic Presence Services
Cross Border Services
σ =
Multinational Services
Russian Services
….
….Cobb-Douglas….
CES
ServiceProviders
Russian Firms
σ =
Foreign-based Firms
σ =
Multinational
CES CES
ServiceProviders
Russian Service
Providers
σ=3σ=3 σ=3CES σ=3
Russian Service
Providers
Gross Output
Sector Specific
Resources
Skilled Labor
DomesticIntermediate
ImportedIntermediate
DomesticIntermediate
ImportedIntermediate
CES
CompositeIntermediateIRTS goods
CES
CompositeIntermediateCRTS goods
Value-addedBusiness Services
CES
….σ = 1
σ = 1.25
Value-added and Business Services
Leontief
Intermediate Goods
σ =
Multinational Services
Russian Services
Capital Unskilled Labor
Cross Border
Services
CESσ =3
Domestic Services
Cross Border
Services
σ =3
Domestic Presence Services
Cross Border Services
σ =
Multinational Services
Russian Services
….
….Cobb-Douglas….
CES
ServiceProviders
Russian Firms
σ =
Foreign-based Firms
σ =
Multinational
CES CES
ServiceProviders
Russian Service
Providers
σ=3σ=3 σ=3CES σ=3
Russian Service
Providers
Gross Output
Sector Specific
Resources
Skilled Labor
DomesticIntermediate
ImportedIntermediate
DomesticIntermediate
ImportedIntermediate
CES
CompositeIntermediateIRTS goods
CES
CompositeIntermediateCRTS goods
Value-addedBusiness Services
CES
….σ = 1
σ = 1.25
Value-added and Business Services
Leontief
Intermediate Goods
σ = 0
Leontiefσ = 0
CET
Domestic Supply
Export Supply
σ = 5
Business Service 11
CES
Business Service 1
CES
Domestic Presence Services
Cross Border Services
Cobb-Douglas
σ = 1.25
Value-added and Business Services
Leontief
Intermediate Goods
σ = 0
Leontiefσ = 0
CET
Domestic Supply
Export Supply
σ = 5
Business Service 11
CES
Business Service 1
CES
Domestic Presence Services
Cross Border Services
Cobb-Douglas
σ = 1.5 σ
σ = 1
σ = σ =3
Other Services 11
Other Services 1
Leontiefσ = 0
Other Services
CES
Domestic Services
σ =
Multinational Services
Russian Services
Capital Unskilled Labor
Cross Border
Services
CESσ =3
Domestic Services
Cross Border
Services
σ =3
Domestic Presence Services
Cross Border Services
σ =
Multinational Services
Russian Services
σ = 0
Leontiefσ = 0
CET
Domestic Supply
Export Supply
σ = 5
Business Service 11
CES
Business Service 1
CES
Domestic Presence Services
Cross Border Services
Cobb-Douglas
σ = 1.25
Value-added and Business Services
Leontief
Intermediate Goods
σ = 0
Leontiefσ = 0
CET
Domestic Supply
Export Supply
σ = 5
Business Service 11
CES
Business Service 1
CES
Domestic Presence Services
Cross Border Services
Cobb-Douglas
σ = 1.5 σ
σ = 1
σ = σ =3
Other Services 11
Other Services 1
Leontiefσ = 0
Other Services
CES
Domestic Services
σ =
Multinational Services
Russian Services
Capital Unskilled Labor
Cross Border
Services
CESσ =3
Domestic Services
Cross Border
Services
σ =3
Domestic Presence Services
Cross Border Services
σ =
Multinational Services
Russian Services
….
….Cobb-Douglas….
CES
ServiceProviders
Russian Firms
σ =
Foreign-based Firms
σ
σ = 1.25
Value-added and Business Services
Leontief
Intermediate Goods
σ = 0
Leontiefσ = 0
CET
Domestic Supply
Export Supply
σ = 5
Business Service 11
CES
Business Service 1
CES
Domestic Presence Services
Cross Border Services
Cobb-Douglas
σ = 1.5 σ
σ = 1
σ = σ =3
Other Services 11
Other Services 1
Leontiefσ = 0
Other Services
CES
Domestic Services
σ =
Multinational Services
Russian Services
Capital Unskilled Labor
Cross Border
Services
CESσ =3
Domestic Services
Cross Border
Services
σ =3
Domestic Presence Services
Cross Border Services
σ =
Multinational Services
Russian Services
….
….Cobb-Douglas….
CES
ServiceProviders
Russian Firms
σ =
Foreign-based Firms
σ =
Foreign-based Firms
σ =
Multinational
CES CES
ServiceProviders
Russian Service
Providers
σ=3σ=3 σ=3CES σ=3
Russian Service
Providers
Gross Output
Sector Specific
Resources
Skilled Labor
DomesticIntermediate
ImportedIntermediate
DomesticIntermediate
ImportedIntermediate
CES
CompositeIntermediateIRTS goods
CES
CompositeIntermediateCRTS goods
Value-addedBusiness Services
CES
….σ = 1
σ = 1.25
Value-added and Business Services
Leontief
Intermediate Goods
σ = 0
Leontiefσ = 0
CET
Domestic Supply
Export Supply
σ = 5
Business Service 11
CES
Business Service 1
CES
Domestic Presence Services
Cross Border Services
Cobb-Douglas
σ = 1.5 σ = 1.5
σ = 1
σ =3 σ =3
Other Services 11
Other Services 1
Leontiefσ = 0
Other Services
CES
Domestic Services
σ =3
Multinational Services
Russian Services
Capital Unskilled Labor
Cross Border
Services
CESσ =3
Domestic Services
Cross Border
Services
σ =3
Domestic Presence Services
Cross Border Services
σ =3
Multinational Services
Russian Services
….
….Cobb-Douglas….
CES
Multinational Service
Providers
Services
σ =3
Domestic Presence Services
Cross Border Services
σ =
Multinational Services
Russian Services
….
….Cobb-Douglas….
CES
ServiceProviders
Russian Firms
σ =
Foreign-based Firms
σ =
Multinational
CES CES
ServiceProviders
Russian Service
Providers
σ=3σ=3 σ=3CES σ=3
Russian Service
Providers
Gross Output
Sector Specific
Resources
Skilled Labor
DomesticIntermediate
ImportedIntermediate
DomesticIntermediate
ImportedIntermediate
CES
CompositeIntermediateIRTS goods
CES
CompositeIntermediateCRTS goods
Value-addedBusiness Services
CES
….σ = 1
σ = 1.25
Value-added and Business Services
Leontief
Intermediate Goods
σ = 0
Leontiefσ = 0
CET
Domestic Supply
Export Supply
σ = 5
Business Service 11
CES
Business Service 1
CES
Domestic Presence Services
Cross Border Services
Cobb-Douglas
σ = 1.25
Value-added and Business Services
Leontief
Intermediate Goods
σ = 0
Leontiefσ = 0
CET
Domestic Supply
Export Supply
σ = 5
Business Service 11
CES
Business Service 1
CES
Domestic Presence Services
Cross Border Services
Cobb-Douglas
σ = 1.5 σ
σ = 1
σ = σ =3
Other Services 11
Other Services 1
Leontiefσ = 0
Other Services
CES
Domestic Services
σ =
Multinational Services
Russian Services
DomesticIntermediate
ImportedIntermediate
DomesticIntermediate
ImportedIntermediate
CES
CompositeIntermediateIRTS goods
CES
CompositeIntermediateCRTS goods
Value-addedBusiness Services
CES
….σ = 1
σ = 1.25
Value-added and Business Services
Leontief
Intermediate Goods
σ = 0
Leontiefσ = 0
CET
Domestic Supply
Export Supply
σ = 5
Business Service 11
CES
Business Service 1
CES
Domestic Presence Services
Cross Border Services
Cobb-Douglas
σ = 1.25
Value-added and Business Services
Leontief
Intermediate Goods
σ = 0
Leontiefσ = 0
CET
Domestic Supply
Export Supply
σ = 5
Business Service 11
CES
Business Service 1
CES
Domestic Presence Services
Cross Border Services
Cobb-Douglas
σ = 1.5 σ
σ = 1
σ = σ =3
Other Services 11
Other Services 1
Leontiefσ = 0
Other Services
CES
Domestic Services
σ =
Multinational Services
Russian Services
Capital Unskilled Labor
Cross Border
Services
CESσ =3
Domestic Services
Cross Border
Services
σ =3
Domestic Presence Services
Cross Border Services
σ =
Multinational Services
Russian Services
….
….Cobb-Douglas….
CES
ServiceProviders
Russian Firms
σ =
Foreign-based Firms
σ
σ = 1.25
Value-added and Business Services
Leontief
Intermediate Goods
σ = 0
Leontiefσ = 0
CET
Domestic Supply
Export Supply
σ = 5
Business Service 11
CES
Business Service 1
CES
Domestic Presence Services
Cross Border Services
Cobb-Douglas
σ = 1.5 σ
σ = 1
σ = σ =3
Other Services 11
Other Services 1
Leontiefσ = 0
Other Services
CES
Domestic Services
σ =
Multinational Services
Russian Services
Capital Unskilled Labor
Cross Border
Services
CESσ =3
Domestic Services
Cross Border
Services
σ =3
Domestic Presence Services
Cross Border Services
σ =
Multinational Services
Russian Services
….
….Cobb-Douglas….
CES
ServiceProviders
Russian Firms
σ =
Foreign-based Firms
σ =
Foreign-based Firms
σ =
Multinational
CES CES
ServiceProviders
Russian Service
Providers
σ=3σ=3 σ=3CES σ=3
Russian Service
Providers
Gross Output
Sector Specific
Resources
Skilled Labor
DomesticIntermediate
ImportedIntermediate
DomesticIntermediate
ImportedIntermediate
CES
CompositeIntermediateIRTS goods
CES
CompositeIntermediateCRTS goods
Value-addedBusiness Services
CES
….σ = 1
σ = 1.25
Value-added and Business Services
Leontief
Intermediate Goods
σ = 0
Leontiefσ = 0
CET
Domestic Supply
Export Supply
σ = 5
Business Service 11
CES
Business Service 1
CES
Domestic Presence Services
Cross Border Services
Cobb-Douglas
σ = 1.5 σ = 1.5
σ = 1
σ =3 σ =3
Other Services 11
Other Services 1
Leontiefσ = 0
Other Services
CES
Domestic Services
σ =3
Multinational Services
Russian Services
Capital Unskilled Labor
Cross Border
Services
CESσ =3
Domestic Services
Cross Border
Services
σ =3
Domestic Presence Services
Cross Border Services
σ =3
Multinational Services
Russian Services
….
….Cobb-Douglas….
CES
Multinational Service
Providers
Russian Firms
σ =3
Foreign-based Firms
σ =3
Gross Output
Sector Specific
Resources
Skilled Labor
DomesticIntermediate
ImportedIntermediate
DomesticIntermediate
ImportedIntermediate
CES
CompositeIntermediateIRTS goods
CES
CompositeIntermediateCRTS goods
Value-addedBusiness Services
CES
….σ = 1
σ = 1.25
Value-added and Business Services
Leontief
Intermediate Goods
σ = 0
Leontiefσ = 0
CET
Domestic Supply
Export Supply
σ = 5
Business Service 11
CES
Business Service 1
CES
Domestic Presence Services
Cross Border Services
Cobb-Douglas
σ = 1.5 σ
σ = 1
σ = σ =3
Other Services 11
Other Services 1
Leontiefσ = 0
Other Services
CES
Domestic Services
σ =
Multinational Services
Russian Services
Capital Unskilled Labor
Cross Border
Services
CESσ =3
Domestic Services
Cross Border
Services
σ =3
Domestic Presence Services
Cross Border Services
σ =
Multinational Services
Russian Services
….
….Cobb-Douglas….
CES
ServiceProviders
Russian Firms
σ =
Foreign-based Firms
σ =
Multinational
CES CES
ServiceProviders
Russian Service
Providers
σ=3σ=3 σ=3CES σ=3
Russian Service
Providers
Gross Output
Sector Specific
Resources
Skilled Labor
DomesticIntermediate
ImportedIntermediate
DomesticIntermediate
ImportedIntermediate
CES
CompositeIntermediateIRTS goods
CES
CompositeIntermediateCRTS goods
Value-addedBusiness Services
CES
….σ = 1
σ = 1.25
Value-added and Business Services
Leontief
Intermediate Goods
σ = 0
Leontiefσ = 0
CET
Domestic Supply
Export Supply
σ = 5
Business Service 11
CES
Business Service 1
CES
Domestic Presence Services
Cross Border Services
Cobb-Douglas
σ = 1.25
Value-added and Business Services
Leontief
Intermediate Goods
σ = 0
Leontiefσ = 0
CET
Domestic Supply
Export Supply
σ = 5
Business Service 11
CES
Business Service 1
CES
Domestic Presence Services
Cross Border Services
Cobb-Douglas
σ = 1.5
Foreign-based Firms
σ =
Multinational
CES CES
ServiceProviders
Russian Service
Providers
σ=3σ=3 σ=3CES σ=3
Russian Service
Providers
Gross Output
Sector Specific
Resources
Skilled Labor
DomesticIntermediate
ImportedIntermediate
DomesticIntermediate
ImportedIntermediate
CES
CompositeIntermediateIRTS goods
CES
CompositeIntermediateCRTS goods
Value-addedBusiness Services
CES
….σ = 1
σ = 1.25
Value-added and Business Services
Leontief
Intermediate Goods
σ = 0
Leontiefσ = 0
CET
Domestic Supply
Export Supply
σ = 5
Business Service 11
CES
Business Service 1
CES
Domestic Presence Services
Cross Border Services
Cobb-Douglas
σ = 1.25
Value-added and Business Services
Leontief
Intermediate Goods
σ = 0
Leontiefσ = 0
CET
Domestic Supply
Export Supply
σ = 5
Business Service 11
CES
Business Service 1
CES
Domestic Presence Services
Cross Border Services
Cobb-Douglas
σ = 1.5 σ
σ = 1
σ = σ =3
Other Services 11
Other Services 1
Leontiefσ = 0
Other Services
CES
Domestic Services
σ =
Multinational Services
Russian Services
Capital Unskilled Labor
Cross Border
Services
CESσ =3
Domestic Services
Cross Border
Services
σ =3
Domestic Presence Services
Cross Border Services
σ =
Multinational Services
Russian Services
….
….Cobb-Douglas….
CES
ServiceProviders
Russian Firms
σ =
Foreign-based Firms
σ
σ = 1.25
Value-added and Business Services
Leontief
Intermediate Goods
σ = 0
Leontiefσ = 0
CET
Domestic Supply
Export Supply
σ = 5
Business Service 11
CES
Business Service 1
CES
Domestic Presence Services
Cross Border Services
Cobb-Douglas
σ = 1.5 σ
σ = 1
σ = σ =3
Other Services 11
Other Services 1
Leontiefσ = 0
Other Services
CES
Domestic Services
σ =
Multinational Services
Russian Services
Capital Unskilled Labor
Cross Border
Services
CESσ =3
Domestic Services
Cross Border
Services
σ =3
Domestic Presence Services
Cross Border Services
σ =
Multinational Services
Russian Services
….
….Cobb-Douglas….
CES
ServiceProviders
Russian Firms
σ =
Foreign-based Firms
σ =
Foreign-based Firms
σ =
Multinational
CES CES
ServiceProviders
Russian Service
Providers
σ=3σ=3 σ=3CES σ=3
Russian Service
Providers
σ = 1.25
Value-added and Business Services
Leontief
Intermediate Goods
σ
σ
σ = 1
σ = σ =3
Other Services 11
Other Services 1
Leontiefσ = 0
Other Services
CES
Domestic Services
σ =
Multinational Services
Russian Services
Capital Unskilled Labor
Cross Border
Services
CESσ =3
Domestic Services
Cross Border
Services
σ =3
Domestic Presence Services
Cross Border Services
σ =
Multinational Services
Russian Services
….
….Cobb-Douglas….
CES
ServiceProviders
Russian Firms
σ =
Foreign-based Firms
σ =
Foreign-based Firms
σ =
Multinational
CES CES
ServiceProviders
Russian Service
Providers
σ=3σ=3 σ=3CES σ=3
Russian Service
Providers
σ = 1.25
Value-added and Business Services
Leontief
Intermediate Goods
σ = 0
Leontiefσ = 0
CET
Domestic Supply
Export Supply
σ = 5
Business Service 11
CES
Business Service 1
CES
Domestic Presence Services
Cross Border Services
Cobb-Douglas
σ = 1.5 σ
σ = 1
σ = σ =3
Other Services 11
Other Services 1
Leontiefσ = 0
Other Services
CES
Domestic Services
σ =
Multinational Services
Russian Services
Capital Unskilled Labor
Cross Border
Services
CESσ =3
Domestic Services
Cross Border
Services
σ =3
Domestic Presence Services
Cross Border Services
σ =
Multinational Services
Russian Services
….
….Cobb-Douglas….
CES
ServiceProviders
Russian Firms
σ =
Foreign-based Firms
σ
σ = 1.25
Value-added and Business Services
Leontief
Intermediate Goods
σ = 0
Leontiefσ = 0
CET
Domestic Supply
Export Supply
σ = 5
Business Service 11
CES
Business Service 1
CES
Domestic Presence Services
Cross Border Services
Cobb-Douglas
σ = 1.5 σ
σ = 1
σ = σ =3
Other Services 11
Other Services 1
Leontiefσ = 0
Other Services
CES
Domestic Services
σ =
Multinational Services
Russian Services
Capital Unskilled Labor
Cross Border
Services
CESσ =3
Domestic Services
Cross Border
Services
σ =3
Domestic Presence Services
Cross Border Services
σ =
Multinational Services
Russian Services
….
….Cobb-Douglas….
CES
ServiceProviders
Russian Firms
σ =
Foreign-based Firms
σ =
Foreign-
= 0
Leontiefσ = 0
CET
Domestic Supply
Export Supply
σ = 5
Business Service 11
CES
Business Service 1
CES
Domestic Presence Services
Cross Border Services
Cobb-Douglas
σ = 1.5 σ
σ = 1
σ = σ =3
Other Services 11
Other Services 1
Leontiefσ = 0
Other Services
CES
Domestic Services
σ =
Multinational Services
Russian Services
Capital Unskilled Labor
Cross Border
Services
CESσ =3
Domestic Services
Cross Border
Services
σ =3
Domestic Presence Services
Cross Border Services
σ =
Multinational Services
Russian Services
….
….Cobb-Douglas….
CES
ServiceProviders
Russian Firms
σ =
Foreign-based Firms
σ =
Foreign-based Firms
σ =
Multinational
CES CES
ServiceProviders
Russian Service
Providers
σ=3σ=3 σ=3CES σ=3
Russian Service
Providers

32
Figure 2: Distributions of estimated welfare gains from Russian WTO accession for the entire sample, the poorest decide, and the richest decile.
0.5
11.
52
Dis
tribu
tion
of w
elfa
re g
ains
-1.6 -1.4 -1.2 -1 -.8 -.6 -.4 -.2 0 .2 .4 .6 .8 1Welfare gains as a percent of consumption
all households the poorest decilethe richest decile
Graph is truncated in a range from - 1.6 to 1
for the entire sample, the poorest decile, and the richest decile.Figure 3. Distributions of estimated welfare gains for Russian households from global free trade
0.0
5.1
.15
.2.2
5D
istri
butio
n of
wel
fare
gai
ns
-1 2 5 8 11 14Welfare gains as a percent of consumption from WTO accession
all households the poorest decile
the richest decile
Observations in a range from 0 % to 15 % are shown.Deciles are constructed to be representative of ten percent of Russian population based on the weights of the Household Budget Survey
for the entire sample, the poorest decile, and the richest decile.Figure 3. Distributions of estimated welfare gains from Russian WTO accessionFigure 2:
Figure 3: Distributions of estimated welfare gains for Russian households from global free trade for the entire sample, the poorest decile and the richest decile.

33
020
4060
80D
istri
butio
n of
wel
fare
gai
ns
-2 -1 0 1 2 3 4 5 6 7 8 9 10 11 12 13 14 15 16
Welfare gains as a percent of consumption
Global free trade Doha-All
WTO accession
and global free trade model results compared. 55098 households sampled.Figure 5. Distributions of the estimated welfare gains: WTO accession, Doha-All,
0.5
11.
52
Dis
tribu
tion
of w
elfa
re g
ains
-1.6 -1.4 -1.2 -1 -.8 -.6 -.4 -.2 0 .2 .4 .6 .8 1Welfare gains as a percent of consumption
all households the poorest decilethe richest decile
Graph is truncated in a range from - 1.6 to 1
for the entire sample, the poorest decile, and the richest decile.Figure 4. Distributions of estimated welfare gains for Russian households from Doha-AllFigure 4: Distributions of estimated welfare gains for Russian households from Doha for the
entire sample, the poorest decile, and the richest decile.
Figure 5: Distributions of estimated welfare gains: WTO accession, Doha and global free trade model results compared. 55,098 households sampled.


![Accession to the WTO - WHO · © WTO - OMC 2004 Accession to the WTO ... WORLD TRADE ORGANIZATION ... Microsoft PowerPoint - WHOpres.ppt [Read-Only] Author:](https://img.dokumen.tips/doc/110x75/5aea95b97f8b9a90318bd175/accession-to-the-wto-wto-omc-2004-accession-to-the-wto-world-trade-organization.jpg)