Embed Size (px)
Citation preview

Examining the Effects of a $.07 per Meal Investment on Local Economic Development, Lunch Participation Rates, and Student Preferences for Fruits & Vegetables in Two Oregon School Districts
The Impact of
SEVENCENTS

ACkNowlEdgEmENTS
AuThorS/rESEArCh TEAm
FuNdINg & SuPPorTKaiser Permanente Community Fund at the Northwest Health Foundation
ECoTruST FArm To SChool ProgrAm BooSTErSAnnie’s Inc.Biamp SystemsBurgervilleFood Services of AmericaKettle FoodsNew Seasons MarketOrganic ValleyOrganically Grown CompanySafeway FoundationStahlbush Island FarmsSyscoTruitt BrothersWhole Foods MarketWillaKenzie Estate WineryWillamette Valley Wineries Association
Deborah KaneSarah Kruse, PhDMichelle Markesteyn Ratcliffe, PhD MSELStacey Ananda Sobell, MPHNell Tessman, MS
ProJECT PArTNErSGervais School District
Oregon Department of Agriculture
Oregon Department of Education
Oregon State University Extension Service’s Food Stamp Nutrition Education Program
Portland Public Schools
Eat.Think.Grow. coalition (including Growing Gardens, OSU Extension Service, Portland Public Schools, and Abernethy Elementary Garden of Wonders)
CommuNITY PArTNErSAlberta Food Co-opBales ThriftwayFood Front Cooperative GroceryKaiser Permanente Interstate CampusNew Seasons MarketPeople’s Food Co-opPortland Farm and Garden Educators NetworkSafewayWhole Foods Market

contents2 The $0.07 Question
4 Farm to School
6 oregon as a Case Study
8 Two oregon districts: PPS and gervais
9 developing the Farm to School Programs: harvest of the month and local lunch
14 Evaluating the Impact of upstream Action in the lunchroom 16 Effects of local Purchases on the oregon Economy
32 results from a School Food Service Providers Survey
34 Student Participation rates in the School meal Program
39 Student Fruit and Vegetable Consumption
42 going Beyond the Cafeteria: The Community Partner Program 46 recommendations for Improvements to the Community Partner Program
48 The $0.07 Answer

The creative, passionate, and committed nutrition service staff at gervais School district and Portland Public Schools who were critical to the success of this project, and who are true leaders in the farm to school movement:
ClArE ColumBuS director of nutrition services at Gervais School District
gITTA grEThEr-SwEENEY director of nutrition services at PPS
krISTY oBBINk director of nutrition services at PPS from 2004 to 2010
ShANNoN STEmBEr assistant director of nutrition services at PPS
BruCE SorTE at Oregon State University for donating valuable insight, skills, and time to conduct portions of the economic analyses included in this report
NEll TESSmAN for conducting a detailed and thoughtful analysis of the project’s Community Partner Program
ErIN NEIl for assisting with evaluation activities, in particular for transcribing all of our focus group recordings and interviews
The Portland Public Schools Research, Evaluation, and Assessment Department
The students, teachers, and principals who generously allowed us to conduct focus groups and surveys as part of this study:Abernethy Elementary SchoolBuckman Elementary SchoolClarendon-Portsmouth k-8 Schoolroseway heights k-8 School
Special Thanks...
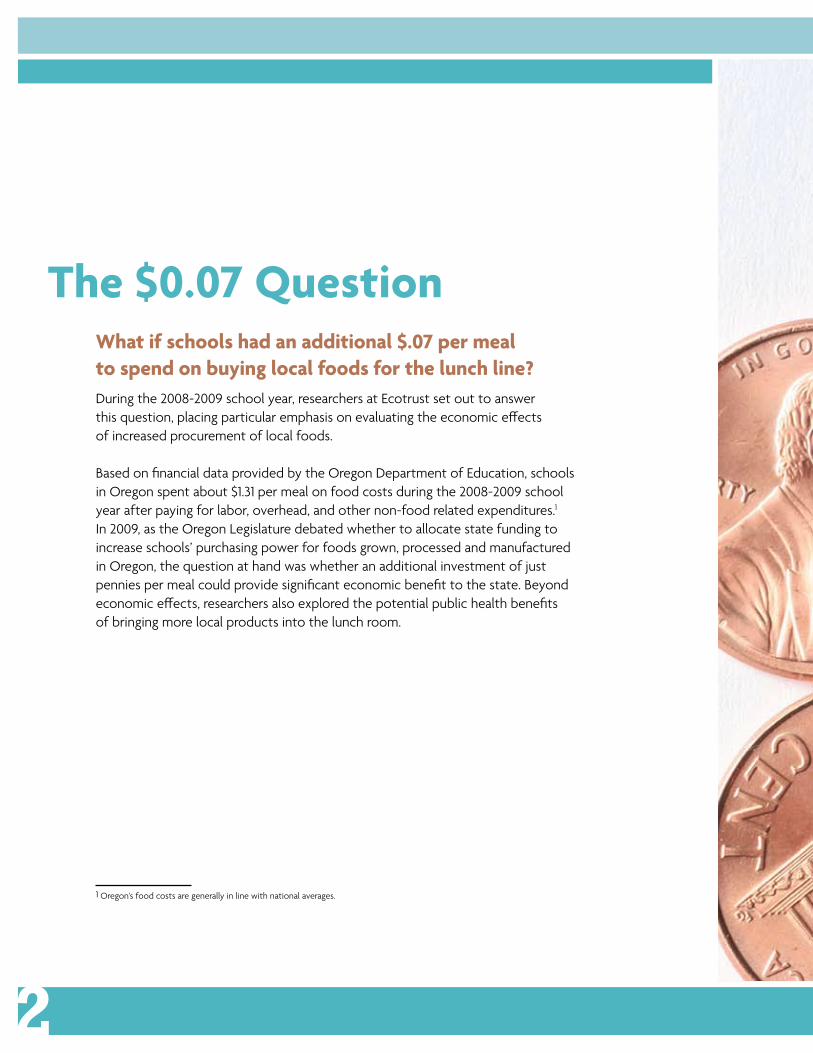
what if schools had an additional $.07 per meal to spend on buying local foods for the lunch line?During the 2008-2009 school year, researchers at Ecotrust set out to answer this question, placing particular emphasis on evaluating the economic effects of increased procurement of local foods.
Based on financial data provided by the Oregon Department of Education, schools in Oregon spent about $1.31 per meal on food costs during the 2008-2009 school year after paying for labor, overhead, and other non-food related expenditures.1 In 2009, as the Oregon Legislature debated whether to allocate state funding to increase schools’ purchasing power for foods grown, processed and manufactured in Oregon, the question at hand was whether an additional investment of just pennies per meal could provide significant economic benefit to the state. Beyond economic effects, researchers also explored the potential public health benefits of bringing more local products into the lunch room.
1 Oregon’s food costs are generally in line with national averages.
The $0.07 Question
2

3

Farm to SchoolEfforts to increase the amount of locally or regionally produced foods in the school cafeteria are often referred to as “farm to school” programs. While individual farm to school programs are shaped by their unique community, geographic region, and scope, the National Farm to School Network defines farm to school as “a program that connects schools (K-12) and local farms with the objectives of serving healthy meals in school cafeterias, improv-ing student nutrition, providing agriculture, health, and nutri-tion education opportunities, and supporting local and regional farmers.”2 As both the term and concept grow in popularity, it has broadened further to include scholastic institutions ranging from childcare facilities to colleges and universities, and juvenile deten-tion centers. Typically, farm to school efforts now also emphasize bringing healthy products from regional food processors and manufacturers into school cafeterias in addition to fresh fruits and vegetables.
The benefits of farm to school programs are considered to be numerous and varied. They include strengthening children’s and communities’ knowledge about, and attitudes toward, agriculture, food, nutrition, and the environment; increasing children’s participation in the school meals program and consumption of fruits and vegetables; increasing market opportunities for farmers, fishers, ranchers, food processors and food manufac-turers; and supporting economic development across numerous sectors.3 With a growing local foods movement in the United States and backing from the Obama administration, interest in, and support for, these programs is at an all-time high. Yet the challenges to implementing farm to school programming are significant.
2 As of 2010, it is estimated that there are well over 2,000 such programs in all 50 states. For more information, visit www.farmtoschool.org.
3 www.farmtoschool.org
4

On the supply side, these challenges include lack of knowledge and information about how to connect with potential buyers, and inadequate distribution channels for farmers and food producers. School districts that wish to source and serve more local foods may encounter infrastructural, regulatory, and economic barriers to participation. Examples include ill-equipped kitchens for preparing whole fruits and vegetables; regulations at federal, state, and/or local levels that discourage the purchase of local foods; and tight budgets that make it difficult for districts to afford the cost of whole foods as well as the labor necessary to prepare and serve them to students.
To tackle these barriers, a virtual army of farm to school advocates nationwide pursue strategies such as working with the agricultural community and food distributors to bridge the gaps between food producers and school food service, working with food processors to create minimally processed products that are cost-effective and efficient for schools to serve, and securing external funding to support complementary agriculture and garden-based educational programs.
Policy solutions have been sought at every level, from incorpor-ating nutrition guidelines in school district wellness policies to city and county local food initiatives and state and federal legislation. At the federal level, a National Farm to School Program was authorized in statute in the 2004 Child Nutrition Reauthorization, but never received federal funding, and the 2008 Farm Bill introduced a “geographic preference” that allowed school meal programs to specify a preference for local foods in their bid language. However an analysis conducted by the School Nutrition Association found that the federal meal reimbursement for the 2008-2009 school year fell $.33 short of the estimated average cost to prepare a school meal, suggesting that most districts struggle just to operate in the black.4
In a recent historic step forward for school meal reform, Congress passed the Healthy, Hunger-Free Kids Act (S. 3307) in December 2010. The Act will upgrade nutritional standards for school meals by increasing the federal reimbursement rate for school lunches by $.06 per meal for districts who comply with federal nutrition standards. This is the first real reimbursement rate increase in more than 30 years, although many advocates suggest that it is not enough to keep pace with the rising costs of food, energy, and labor. Notably, the act also awards $5 million per year in mandatory funding starting in October 2012 for farm to school programs and activities via a competitive grant and technical assistance program (up to $100,000 per project) designed to increase the use of local foods from small- and medium-size farms in schools.
4 School Nutrition Association (SNA), Saved By the Bell (2008). Saved by the Lunch Bell: As Economy Sinks, School Nutrition Program Participation Rises
5
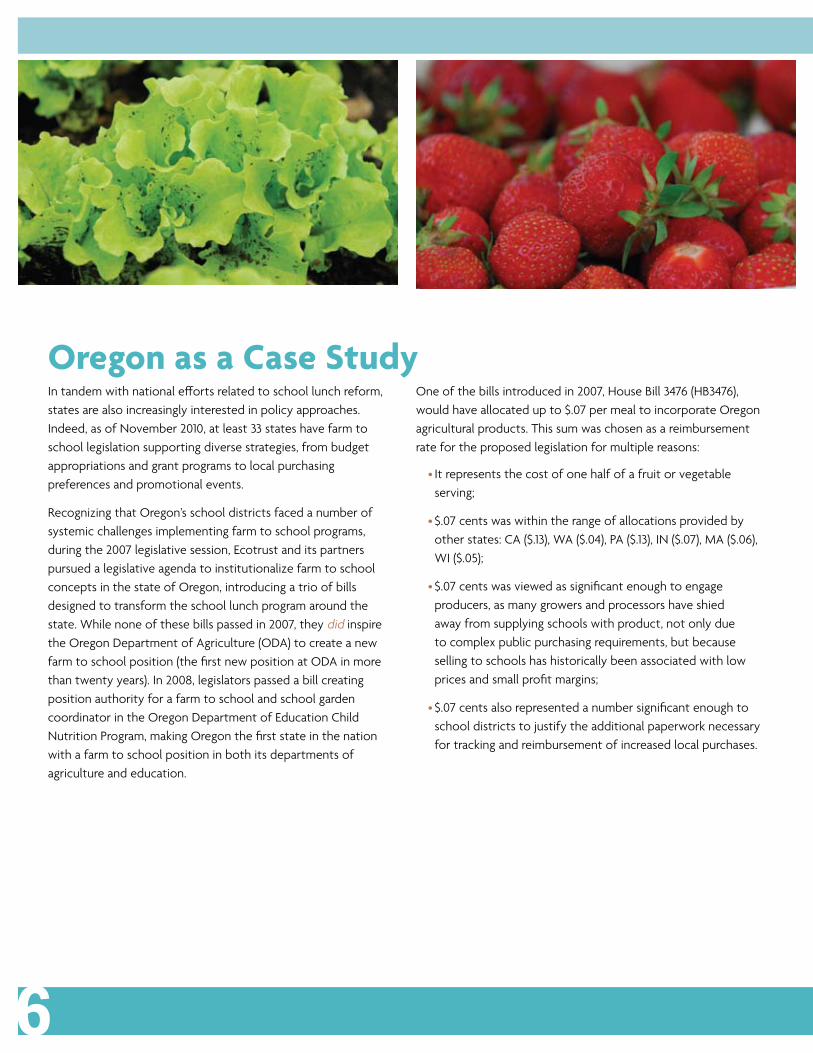
In tandem with national efforts related to school lunch reform, states are also increasingly interested in policy approaches. Indeed, as of November 2010, at least 33 states have farm to school legislation supporting diverse strategies, from budget appropriations and grant programs to local purchasing preferences and promotional events.
Recognizing that Oregon’s school districts faced a number of systemic challenges implementing farm to school programs, during the 2007 legislative session, Ecotrust and its partners pursued a legislative agenda to institutionalize farm to school concepts in the state of Oregon, introducing a trio of bills designed to transform the school lunch program around the state. While none of these bills passed in 2007, they did inspire the Oregon Department of Agriculture (ODA) to create a new farm to school position (the first new position at ODA in more than twenty years). In 2008, legislators passed a bill creating position authority for a farm to school and school garden coordinator in the Oregon Department of Education Child Nutrition Program, making Oregon the first state in the nation with a farm to school position in both its departments of agriculture and education.
One of the bills introduced in 2007, House Bill 3476 (HB3476), would have allocated up to $.07 per meal to incorporate Oregon agricultural products. This sum was chosen as a reimbursement rate for the proposed legislation for multiple reasons:
• It represents the cost of one half of a fruit or vegetable serving;
• $.07 cents was within the range of allocations provided by other states: CA ($.13), WA ($.04), PA ($.13), IN ($.07), MA ($.06), WI ($.05);
• $.07 cents was viewed as significant enough to engage producers, as many growers and processors have shied away from supplying schools with product, not only due to complex public purchasing requirements, but because selling to schools has historically been associated with low prices and small profit margins;
• $.07 cents also represented a number significant enough to school districts to justify the additional paperwork necessary for tracking and reimbursement of increased local purchases.
oregon as a Case Study
6
This history and a keen interest on the part of Oregon advocates and legislators to allocate state funding to the procurement of local foods inspired this research project and the questions: Could $.07 make a difference? And if so, what difference?
In anticipation of the 2009 legislative session, Ecotrust secured grant funding from the Kaiser Permanente Community Fund at the Northwest Health Foundation to establish an empirical base of evidence reflecting the efficacy of the proposed legislation by facilitating a “test run” of HB3476. Through this project, Upstream Action in the Lunchroom, Ecotrust provided a $.07 per meal subsidy to two Oregon school districts during the 2008-2009 school year for the express purpose of incorporating more Oregon-grown fruits, vegetables, and minimally processed (canned, frozen, etc.) products into the lunchroom, as well as allowing for the purchase of main dish meal items that contain locally produced foods. Additionally, we sought to pilot specific educational and promotional activities in each district to support the changes in the cafeteria.
A main objective of the research project was to test and refine operational procedures for how school districts might use and track such a subsidy to help streamline the implementation phase should the proposed legislation (later termed House Bill 2800—the Oregon Farm to School and School Garden Bill; see Appendix A for full text of legislation) pass in 2009. Another primary objective was to evaluate the effects of this subsidy and complementary school and community-based efforts on school lunch participation rates, children’s fruit and vegetable consump-tion, and the local economy.
7
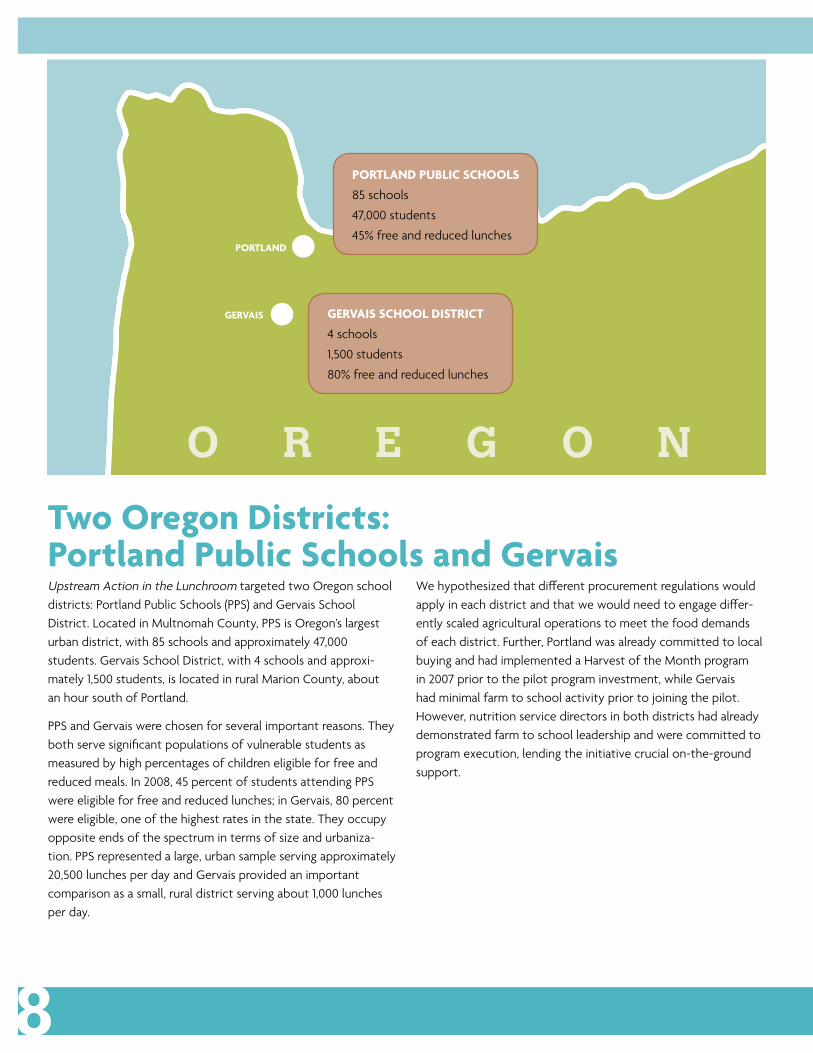
Upstream Action in the Lunchroom targeted two Oregon school districts: Portland Public Schools (PPS) and Gervais School District. Located in Multnomah County, PPS is Oregon’s largest urban district, with 85 schools and approximately 47,000 students. Gervais School District, with 4 schools and approxi-mately 1,500 students, is located in rural Marion County, about an hour south of Portland.
PPS and Gervais were chosen for several important reasons. They both serve significant populations of vulnerable students as measured by high percentages of children eligible for free and reduced meals. In 2008, 45 percent of students attending PPS were eligible for free and reduced lunches; in Gervais, 80 percent were eligible, one of the highest rates in the state. They occupy opposite ends of the spectrum in terms of size and urbaniza-tion. PPS represented a large, urban sample serving approximately 20,500 lunches per day and Gervais provided an important comparison as a small, rural district serving about 1,000 lunches per day.
We hypothesized that different procurement regulations would apply in each district and that we would need to engage differ-ently scaled agricultural operations to meet the food demands of each district. Further, Portland was already committed to local buying and had implemented a Harvest of the Month program in 2007 prior to the pilot program investment, while Gervais had minimal farm to school activity prior to joining the pilot. However, nutrition service directors in both districts had already demonstrated farm to school leadership and were committed to program execution, lending the initiative crucial on-the-ground support.
Two oregon districts: Portland Public Schools and gervais
8
PorTlANd
gErVAIS
PorTlANd PuBlIC SChoolS
85 schools
47,000 students
45% free and reduced lunches
gErVAIS SChool dISTrICT
4 schools
1,500 students
80% free and reduced lunches

Increasing students’ access to, awareness of, and knowledge about Oregon-grown fresh fruits and vegetables and minimally processed foods was a major goal of the farm to school programs. We hoped that the development of the programs would also provide the two state agencies charged with promoting farm to school in Oregon and other local and statewide farm to school leaders with the opportunity to work together to take the first steps towards statewide colla- boration, and promote a cross-disciplinary, whole-systems approach to local procurement, farm to school programming, and health.
Ecotrust, food service directors from both districts, and a diverse array of stakeholders, including Oregon State University Extension researchers, staff from the Oregon Departments of Education and Human Services, Food Stamp Nutrition Educators, and the Oregon Department of Agriculture’s Farm to School Program Manager, worked together to determine the best ways to increase access to Oregon-grown foods in the Portland and Gervais school districts (given available resources and constraints), as well as how to best implement, oversee, and gather data on cafeteria changes occurring in the districts. These meetings were some of the first in which local and statewide efforts to promote local fruits and vegetables in the school environment came together and they resulted in two primary strategies for how to spend the $.07 at each district in the 2008-2009 school year.
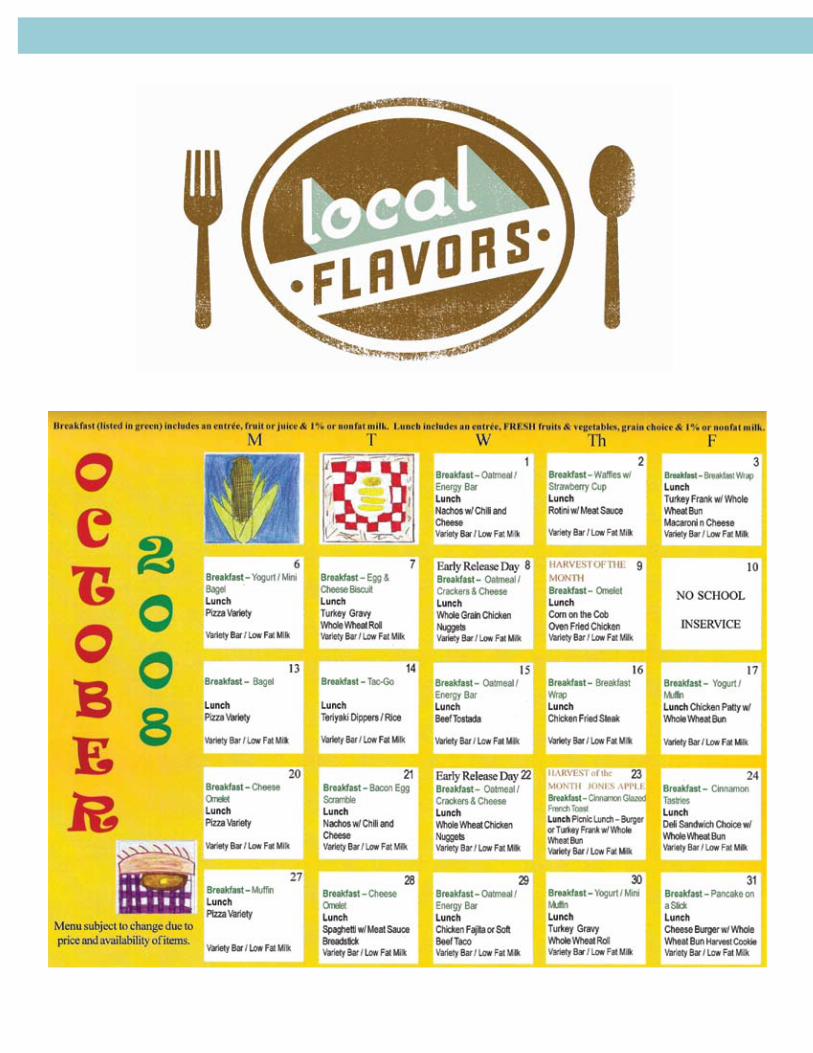
The first was via a Harvest of the Month program: Each month, one locally grown fruit or vegetable was highlighted within the school environment and served in school lunches on select Harvest of the Month days. Both Portland and Gervais developed year-long Harvest of the Month programs highlighting different products to reflect their locations, nearby farming communi-ties, student populations, and kitchen facilities. Since Portland had already established a Harvest of the Month program in 2007, a second strategy was a Local Lunch program, piloted only in Portland, featuring meals made entirely of regionally grown and minimally-processed foods, including main dishes. Product sourcing and development for main dish items involved collaboration with the Oregon Department of Agriculture’s Farm to School Program Manager at the time, Cory Schreiber, acclaimed chef and founder of Portland’s renowned local foods restaurant, Wildwood. Once a month, on “Local Lunch Days,” all featured menu items were produced locally. A third strategy involved targeting the funds towards other local purchases that would be featured on the lunch menu on a regular basis.
To support the local foods offered in both districts, the project also included efforts to educate students, families, school staff, and the greater community with messages about cafeteria changes, specifically about the Harvest of the Month and Local Lunch programs.
In conjunction with project partners, the intervention activities Ecotrust undertook to support Portland’s Harvest of the Month and Local Lunch programs and Gervais’ Harvest of the Month program included the development of:
• Informative school lunch menus for students and families;
• Information to be included in school newsletters, via a communication to principals called The Administrator’s Connection, and also shared with school garden educators via the Portland Farm and Garden Educators Network;
• Promotional materials for Harvest of the Month and Local Lunch, including calendars, posters, and logos.
developing the Farm to School Programs: harvest of the month and local lunch
9


Further, Ecotrust sought widespread community support for the changes in the cafeteria by hosting a “Local in the Lunchroom” media event and kick-off celebration for the program in Sep-tember 2008 at Atkinson Elementary in Portland. The event was attended by more than 100 key stakeholders, including local and state legislators, members of both school boards, district superin-tendents, food service staff, media, educators, food producers, and youth.
The Gervais District had key differences from PPS: smaller size, less concentrated student population, and little prior experience implementing farm to school. This led to different implementa-tion strategies in each district, and generally fewer promotional components in Gervais. For example, we provided financial backing for the design of teacher activity sheets with suggested classroom and garden activities to accompany featured Harvest of the Month items in Portland. These activity sheets, aimed at grades K-2 and 3-5, were co-developed by members of the Eat.Think.Grow. coalition, including Growing Gardens, OSU Extension Service, Portland Public Schools, and Abernethy Elementary
5 http://eatthinkgrow.pps.k12.or.us/.docs/pg/10079
12
Garden of Wonders, and posted on PPS’s website.5 They were created as a result of the extensive community support PPS already had for farm to school at that time.
In addition, in an effort to achieve a broader reach for the farm to school program in the Portland Public Schools district, Ecotrust developed and implemented a Community Partner Program through which we engaged seven grocers and one hospital cafeteria in Portland to promote the district’s Harvest of the Month program with signage and point-of-purchase promotion. We were unsuccessful at garnering grocers’ interest in a similar promotion for the Gervais School District area because of the small percentage of shoppers that Gervais students and their families comprise in that part of the Willamette Valley. Community partners used templates provided by Ecotrust, along with their own ingenuity and creativity to create original promotions to highlight and complement Portland’s efforts. A more detailed description and analysis of the Community Partner Program can be found later in this report.

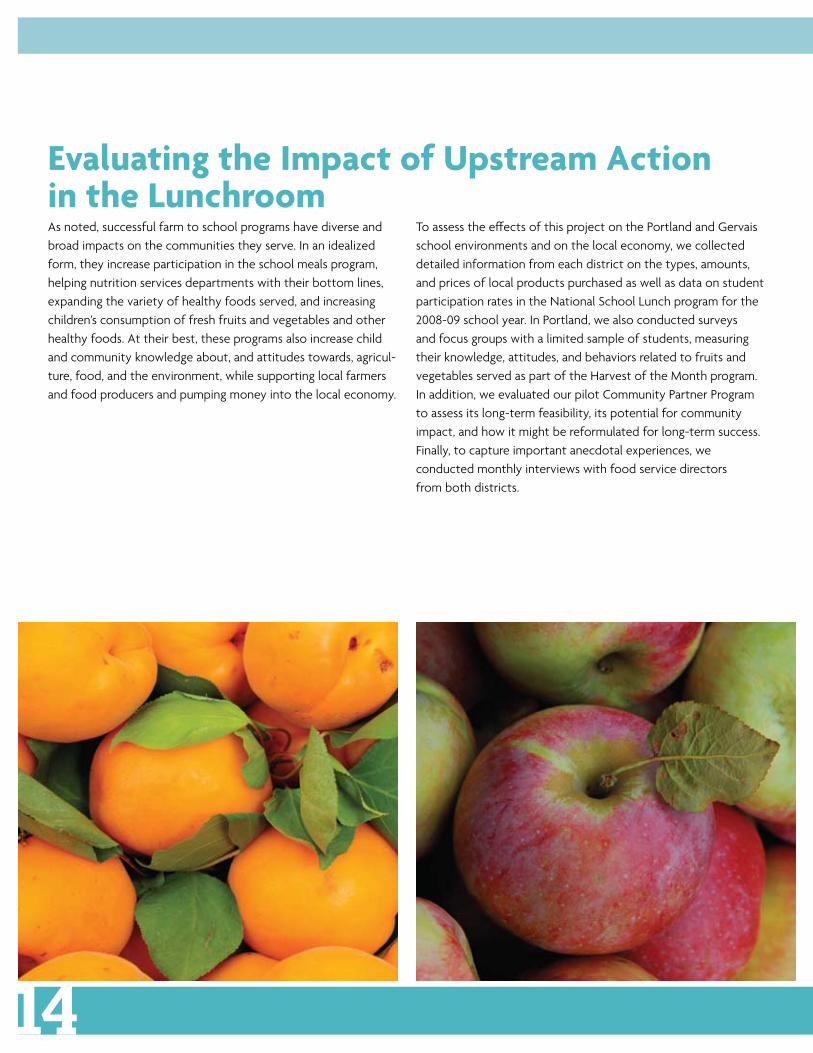
As noted, successful farm to school programs have diverse and broad impacts on the communities they serve. In an idealized form, they increase participation in the school meals program, helping nutrition services departments with their bottom lines, expanding the variety of healthy foods served, and increasing children’s consumption of fresh fruits and vegetables and other healthy foods. At their best, these programs also increase child and community knowledge about, and attitudes towards, agricul-ture, food, and the environment, while supporting local farmers and food producers and pumping money into the local economy.
To assess the effects of this project on the Portland and Gervais school environments and on the local economy, we collected detailed information from each district on the types, amounts, and prices of local products purchased as well as data on student participation rates in the National School Lunch program for the 2008-09 school year. In Portland, we also conducted surveys and focus groups with a limited sample of students, measuring their knowledge, attitudes, and behaviors related to fruits and vegetables served as part of the Harvest of the Month program. In addition, we evaluated our pilot Community Partner Program to assess its long-term feasibility, its potential for community impact, and how it might be reformulated for long-term success. Finally, to capture important anecdotal experiences, we conducted monthly interviews with food service directors from both districts.
Evaluating the Impact of upstream Action in the lunchroom
1114

15
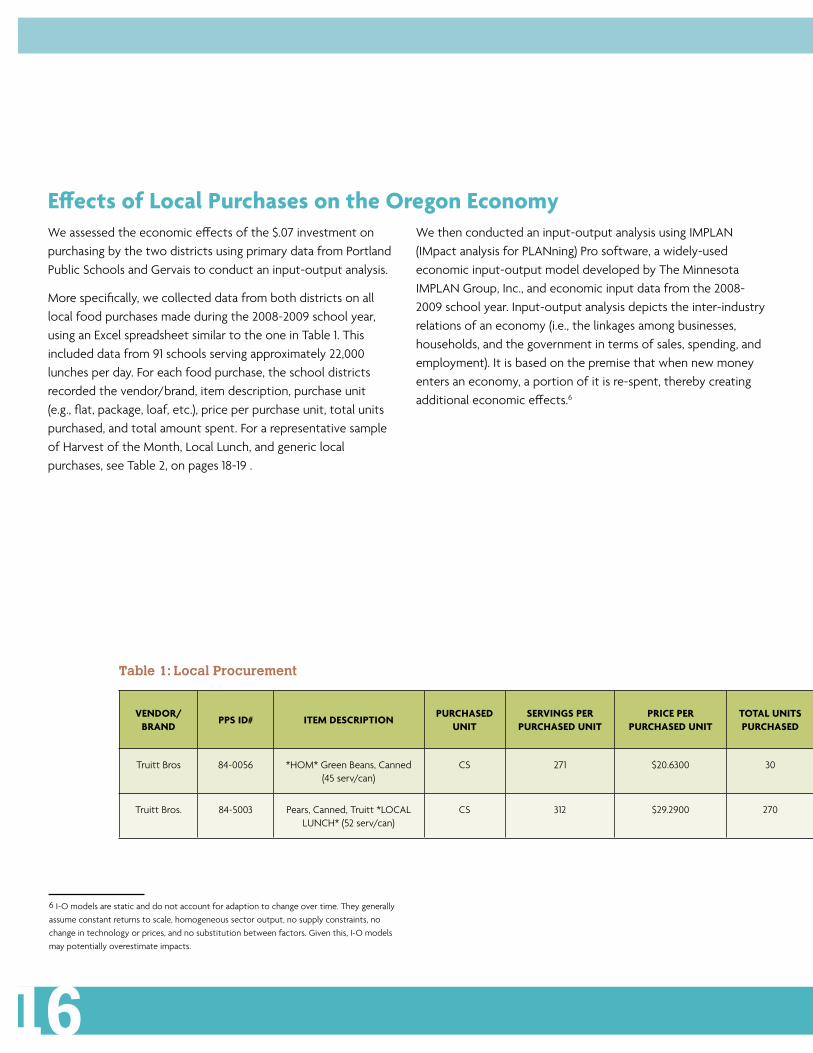
We assessed the economic effects of the $.07 investment on purchasing by the two districts using primary data from Portland Public Schools and Gervais to conduct an input-output analysis.
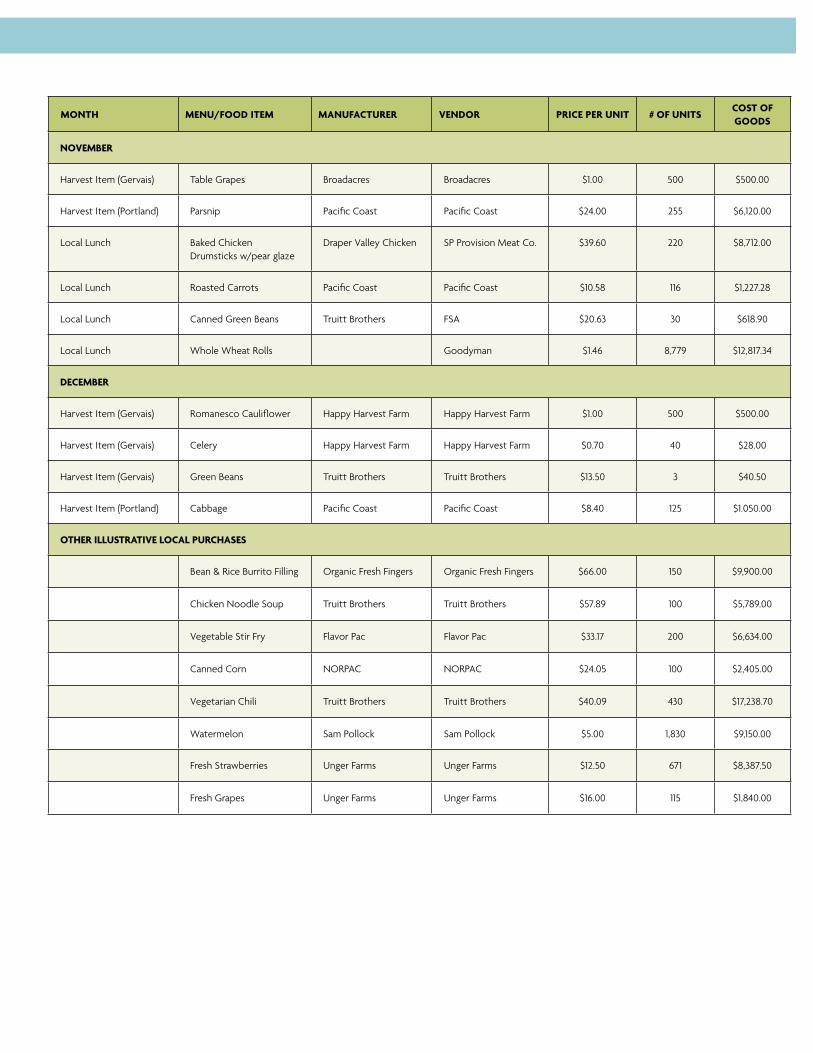
More specifically, we collected data from both districts on all local food purchases made during the 2008-2009 school year, using an Excel spreadsheet similar to the one in Table 1. This included data from 91 schools serving approximately 22,000 lunches per day. For each food purchase, the school districts recorded the vendor/brand, item description, purchase unit (e.g., flat, package, loaf, etc.), price per purchase unit, total units purchased, and total amount spent. For a representative sample of Harvest of the Month, Local Lunch, and generic local purchases, see Table 2, on pages 18-19 .
We then conducted an input-output analysis using IMPLAN (IMpact analysis for PLANning) Pro software, a widely-used economic input-output model developed by The Minnesota IMPLAN Group, Inc., and economic input data from the 2008-2009 school year. Input-output analysis depicts the inter-industry relations of an economy (i.e., the linkages among businesses, households, and the government in terms of sales, spending, and employment). It is based on the premise that when new money enters an economy, a portion of it is re-spent, thereby creating additional economic effects.6
Effects of local Purchases on the oregon Economy
16
table 1: Local Procurement
VENdor/BrANd
PPS Id# ITEm dESCrIPTIoNPurChASEd
uNITSErVINgS PEr
PurChASEd uNITPrICE PEr
PurChASEd uNITToTAl uNITS PurChASEd
ToTAl SErVINgS PurChASEd
ToTAl CoST oF goodS
orEgoN growN
orEgoN ProduCEd
orEgoN PACkEd
wA. growN, ProduCEd,
PACkEd
CA. growN, ProduCEd,
PACkEd
Truitt Bros 84-0056 *HOM* Green Beans, Canned (45 serv/can)
CS 271 $20.6300 30 1449026.54 $618.90 1 1 1 0 0
Truitt Bros. 84-5003 Pears, Canned, Truitt *LOCAL LUNCH* (52 serv/can)
CS 312 $29.2900 270 84240 $7,908.30 1 1 1 0 0
6 I-O models are static and do not account for adaption to change over time. They generally assume constant returns to scale, homogeneous sector output, no supply constraints, no change in technology or prices, and no substitution between factors. Given this, I-O models may potentially overestimate impacts.
17
table 1: Local Procurement
VENdor/BrANd
PPS Id# ITEm dESCrIPTIoNPurChASEd
uNITSErVINgS PEr
PurChASEd uNITPrICE PEr
PurChASEd uNITToTAl uNITS PurChASEd
ToTAl SErVINgS PurChASEd
ToTAl CoST oF goodS
orEgoN growN
orEgoN ProduCEd
orEgoN PACkEd
wA. growN, ProduCEd,
PACkEd
CA. growN, ProduCEd,
PACkEd
Truitt Bros 84-0056 *HOM* Green Beans, Canned (45 serv/can)
CS 271 $20.6300 30 1449026.54 $618.90 1 1 1 0 0
Truitt Bros. 84-5003 Pears, Canned, Truitt *LOCAL LUNCH* (52 serv/can)
CS 312 $29.2900 270 84240 $7,908.30 1 1 1 0 0
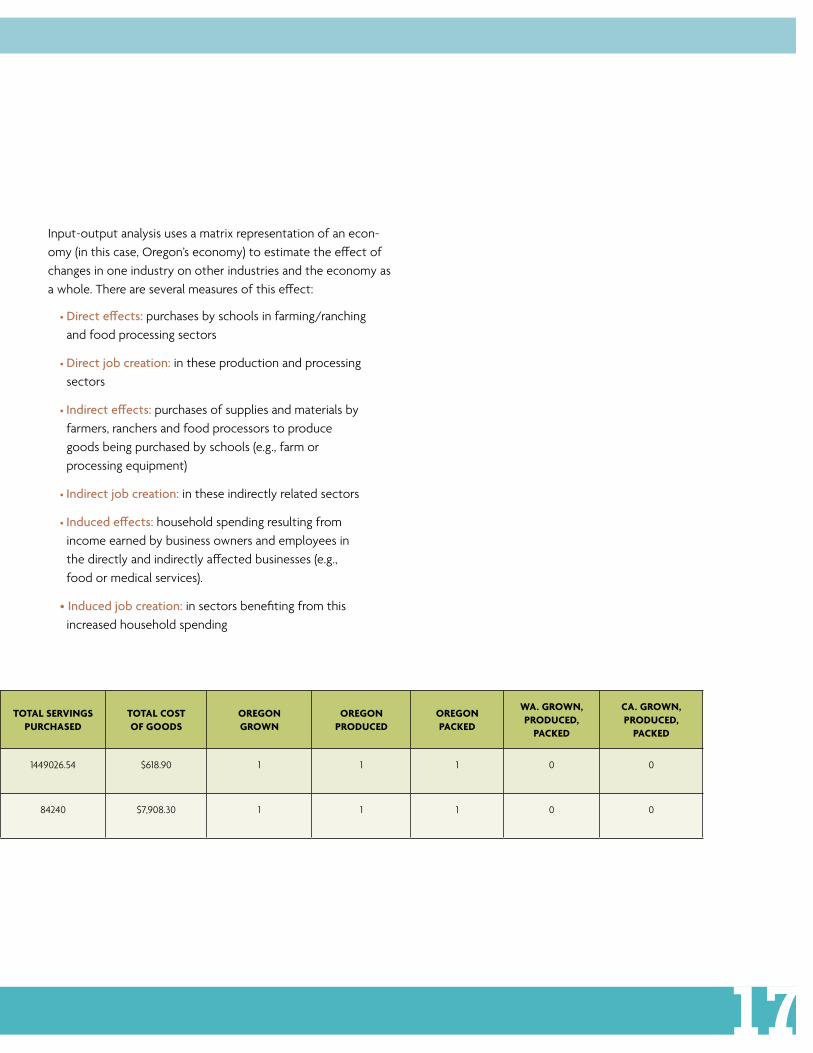
Input-output analysis uses a matrix representation of an econ-omy (in this case, Oregon’s economy) to estimate the effect of changes in one industry on other industries and the economy as a whole. There are several measures of this effect:
• Direct effects: purchases by schools in farming/ranching and food processing sectors
• Direct job creation: in these production and processing sectors
• Indirect effects: purchases of supplies and materials by farmers, ranchers and food processors to produce goods being purchased by schools (e.g., farm or processing equipment)
• Indirect job creation: in these indirectly related sectors
• Induced effects: household spending resulting from income earned by business owners and employees in the directly and indirectly affected businesses (e.g., food or medical services).
• Induced job creation: in sectors benefiting from this increased household spending

table 2: examples of Local Food Purchased with Kaiser Permanente community Fund Grant Money
moNTh mENu/Food ITEm mANuFACTurEr VENdor PrICE PEr uNIT # oF uNITSCoST oF goodS
SEPTEmBEr
Harvest Item (Gervais) Peaches Jones Farm Jones Farm $16.50 5 $82.50
Harvest Item (Gervais) Tomatoes Jones Farm Jones Farm $0.99 62 $61.38
Harvest Item (Gervais) Cantaloupe Jones Farm Jones Farm $0.42 171 $71.82
Harvest Item (Gervais) Broccoli Jones Farm Jones Farm $0.59 30 $17.70
Harvest Item (Gervais) Cauliflower Jones Farm Jones Farm $0.59 10 $5.90
Harvest Item (Gervais) Plums Jones Farm Jones Farm $17.00 3 $51.00
Harvest Item (Gervais) Apples Jones Farm Jones Farm $10.00 7 $70.00
Harvest Item (Gervais) Watermelon Jones Farm Jones Farm $0.39 180 $70.20
Harvest Item (Portland) Cucumber Pacific Coast Pacific Coast $28.00 36 $1,008.00
oCToBEr
Harvest Item (Gervais) Apples Jones Farm Jones Farm $10.00 26 $260.00
Harvest Item (Gervais) Corn on cob Jones Farm Jones Farm $0.25 400 $100.00
Harvest Item (Gervais) Cucumbers Jones Farm Jones Farm $0.80 175 $140.00
Harvest Item (Gervais) Berries Jones Farm Jones Farm $16.00 42 $672.00
Harvest Item (Gervais) Tomatoes Jones Farm Jones Farm $0.99 90 $89.10
Harvest Item (Gervais) Cauliflower Jones Farm Jones Farm $0.59 25 $14.75
Harvest Item (Gervais) Broccoli Jones Farm Jones Farm $0.59 20 $11.80
Harvest Item (Gervais) Watermelon Jones Farm Jones Farm $0.39 145 $56.55
Harvest Item (Gervais) Cantaloupe Jones Farm Jones Farm $0.42 30 $12.60
Harvest Item (Portland) Corn on cob Schlechter Farms Schlechter Farms $17.50 199 $3,482.50
Harvest Item (Portland) Corn on cob Pacifc Coast Pacific Coast $12.00 172 $2,064.00
Local Lunch Quesadilla Don Poncho FSA $11.75 405 $4,758.75
Local Lunch Shredded Cheddar Tillamook FSA $54.33 162 $8,801.46
Local Lunch Salsa Pacific Coast Pacific Coast $27.00 84 $2,268.00
Local Lunch Butter for corn Tillamook FSA $13.91 28 $389.48
Local Lunch Tortilla Chips Don Poncho FSA $16.02 130 $2,082.60
Local Lunch Canned Pears Truitt Brothers FSA $29.29 270 $7,908.30
moNTh mENu/Food ITEm mANuFACTurEr VENdor PrICE PEr uNIT # oF uNITSCoST oF goodS
NoVEmBEr
Harvest Item (Gervais) Table Grapes Broadacres Broadacres $1.00 500 $500.00
Harvest Item (Portland) Parsnip Pacific Coast Pacific Coast $24.00 255 $6,120.00
Local Lunch Baked Chicken Drumsticks w/pear glaze
Draper Valley Chicken SP Provision Meat Co. $39.60 220 $8,712.00
Local Lunch Roasted Carrots Pacific Coast Pacific Coast $10.58 116 $1,227.28
Local Lunch Canned Green Beans Truitt Brothers FSA $20.63 30 $618.90
Local Lunch Whole Wheat Rolls Goodyman $1.46 8,779 $12,817.34
dECEmBEr
Harvest Item (Gervais) Romanesco Cauliflower Happy Harvest Farm Happy Harvest Farm $1.00 500 $500.00
Harvest Item (Gervais) Celery Happy Harvest Farm Happy Harvest Farm $0.70 40 $28.00
Harvest Item (Gervais) Green Beans Truitt Brothers Truitt Brothers $13.50 3 $40.50
Harvest Item (Portland) Cabbage Pacific Coast Pacific Coast $8.40 125 $1.050.00
oThEr IlluSTrATIVE loCAl PurChASES
Bean & Rice Burrito Filling Organic Fresh Fingers Organic Fresh Fingers $66.00 150 $9,900.00
Chicken Noodle Soup Truitt Brothers Truitt Brothers $57.89 100 $5,789.00
Vegetable Stir Fry Flavor Pac Flavor Pac $33.17 200 $6,634.00
Canned Corn NORPAC NORPAC $24.05 100 $2,405.00
Vegetarian Chili Truitt Brothers Truitt Brothers $40.09 430 $17,238.70
Watermelon Sam Pollock Sam Pollock $5.00 1,830 $9,150.00
Fresh Strawberries Unger Farms Unger Farms $12.50 671 $8,387.50
Fresh Grapes Unger Farms Unger Farms $16.00 115 $1,840.00

The sum of the direct, indirect, and induced effects is the total economic effect. The sum of the direct job creation, the indirect job creation, and the induced job creation is the total job creation.
It should be noted that jobs include both full- and part-time jobs. While a full-time job typically provides more income, part-time jobs are critical to the economy and the many families that are able to achieve the equivalent of full-time jobs or more by combining part-time jobs. For more information on IMPLAN, please see www.implan.com.
Using data collected from the districts on all local purchases made during the 2008-2009 school year, researchers determined which purchases were inspired by the pilot program investment and used these data to assign each food purchase to one of IMPLAN’s industrial sectors. While IMPLAN contains 509 county-level industrial sectors7 (updated annually), we considered only the 39 sectors relevant to food production and processing. Of these 39 sectors (see Figure 1), only some are relevant to purchas-ing by schools (e.g., most schools would not purchase from the ‘wet corn milling’ or ‘oilseed farming’ sectors). We determined that 15 sectors were affected by PPS and/or Gervais purchases during the 2008–2009 school year.
It should be noted that we conducted a basic analysis and did not have the data or resources to conduct a net analysis. In the basic analysis, we presume that the direct expenditures are new expenditures that prompt additional production. This would be in contrast to substituting incentive funds for funds already being spent on school meals and producers substituting regular production, which they may export or sell elsewhere in the Oregon economy, for production they do for the local schools.
7 IMPLAN sector classification is based on the U.S. Census Bureau’s North American Industry Classification System.
20
Figure 1: 39 Food sectors
Oilseed farming
Grain farming
Vegetable and melon farming
Fruit farming
Tree nut farming
Sugarcane and sugar beet farming
All other crop farming
Cattle ranching and farming
Dairy cattle and milk production
Poultry and egg production
Animal production - except cattle and poultry
Commercial Fishing
Flour milling and malt manufacturing
Wet corn milling
Soybean and other oilseed processing
Fats and oils refining and blending
Breakfast cereal manufacturing
Sugar cane mills and refining
Beet sugar manufacturing
Chocolate and confectionery manufacturing
Nonchocolate confectionery manufacturing
Frozen food manufacturing
Fruit and vegetable canning
Fluid milk and butter manufacturing
Cheese manufacturing
Dry-condensed- and evaporated dairy product
Ice cream and frozen dessert manufacturing
Animal (except poultry and seafood) processing
Poultry processing
Seafood product preparation and packaging
Bread and bakery product manufacturing
Cookie-cracker- and pasta manufacturing
Tortilla manufacturing
Snack food manufacturing
Coffee and tea manufacturing
Flavoring syrup and concentrate manufacturing
Seasoning and dressing manufacturing
All other food manufacturing
Soft drink and ice manufacturing
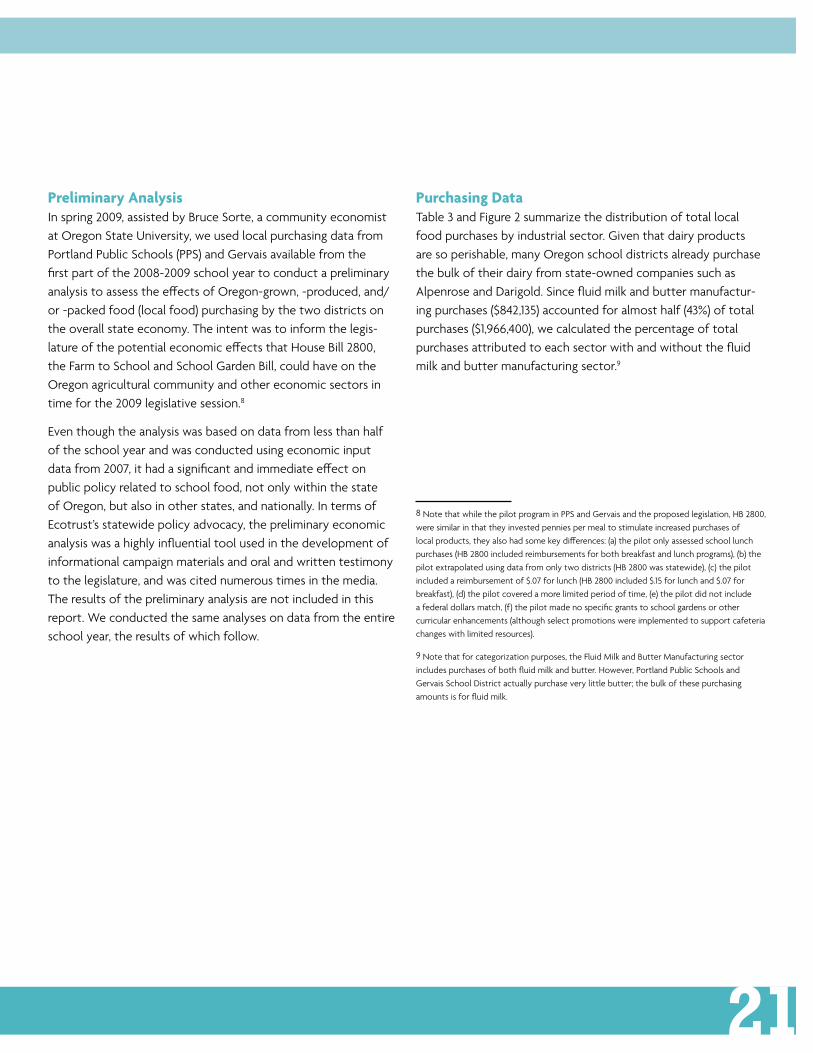
Preliminary AnalysisIn spring 2009, assisted by Bruce Sorte, a community economist at Oregon State University, we used local purchasing data from Portland Public Schools (PPS) and Gervais available from the first part of the 2008-2009 school year to conduct a preliminary analysis to assess the effects of Oregon-grown, -produced, and/or -packed food (local food) purchasing by the two districts on the overall state economy. The intent was to inform the legis-lature of the potential economic effects that House Bill 2800, the Farm to School and School Garden Bill, could have on the Oregon agricultural community and other economic sectors in time for the 2009 legislative session.8
Even though the analysis was based on data from less than half of the school year and was conducted using economic input data from 2007, it had a significant and immediate effect on public policy related to school food, not only within the state of Oregon, but also in other states, and nationally. In terms of Ecotrust’s statewide policy advocacy, the preliminary economic analysis was a highly influential tool used in the development of informational campaign materials and oral and written testimony to the legislature, and was cited numerous times in the media. The results of the preliminary analysis are not included in this report. We conducted the same analyses on data from the entire school year, the results of which follow.
8 Note that while the pilot program in PPS and Gervais and the proposed legislation, HB 2800, were similar in that they invested pennies per meal to stimulate increased purchases of local products, they also had some key differences: (a) the pilot only assessed school lunch purchases (HB 2800 included reimbursements for both breakfast and lunch programs), (b) the pilot extrapolated using data from only two districts (HB 2800 was statewide), (c) the pilot included a reimbursement of $.07 for lunch (HB 2800 included $.15 for lunch and $.07 for breakfast), (d) the pilot covered a more limited period of time, (e) the pilot did not include a federal dollars match, (f) the pilot made no specific grants to school gardens or other curricular enhancements (although select promotions were implemented to support cafeteria changes with limited resources).
9 Note that for categorization purposes, the Fluid Milk and Butter Manufacturing sector includes purchases of both fluid milk and butter. However, Portland Public Schools and Gervais School District actually purchase very little butter; the bulk of these purchasing amounts is for fluid milk.
Purchasing dataTable 3 and Figure 2 summarize the distribution of total local food purchases by industrial sector. Given that dairy products are so perishable, many Oregon school districts already purchase the bulk of their dairy from state-owned companies such as Alpenrose and Darigold. Since fluid milk and butter manufactur-ing purchases ($842,135) accounted for almost half (43%) of total purchases ($1,966,400), we calculated the percentage of total purchases attributed to each sector with and without the fluid milk and butter manufacturing sector.9
21
Oilseed farming
Grain farming
Vegetable and melon farming
Fruit farming
Tree nut farming
Sugarcane and sugar beet farming
All other crop farming
Cattle ranching and farming
Dairy cattle and milk production
Poultry and egg production
Animal production - except cattle and poultry
Commercial Fishing
Flour milling and malt manufacturing
Wet corn milling
Soybean and other oilseed processing
Fats and oils refining and blending
Breakfast cereal manufacturing
Sugar cane mills and refining
Beet sugar manufacturing
Chocolate and confectionery manufacturing
Nonchocolate confectionery manufacturing
Frozen food manufacturing
Fruit and vegetable canning
Fluid milk and butter manufacturing
Cheese manufacturing
Dry-condensed- and evaporated dairy product
Ice cream and frozen dessert manufacturing
Animal (except poultry and seafood) processing
Poultry processing
Seafood product preparation and packaging
Bread and bakery product manufacturing
Cookie-cracker- and pasta manufacturing
Tortilla manufacturing
Snack food manufacturing
Coffee and tea manufacturing
Flavoring syrup and concentrate manufacturing
Seasoning and dressing manufacturing
All other food manufacturing
Soft drink and ice manufacturing
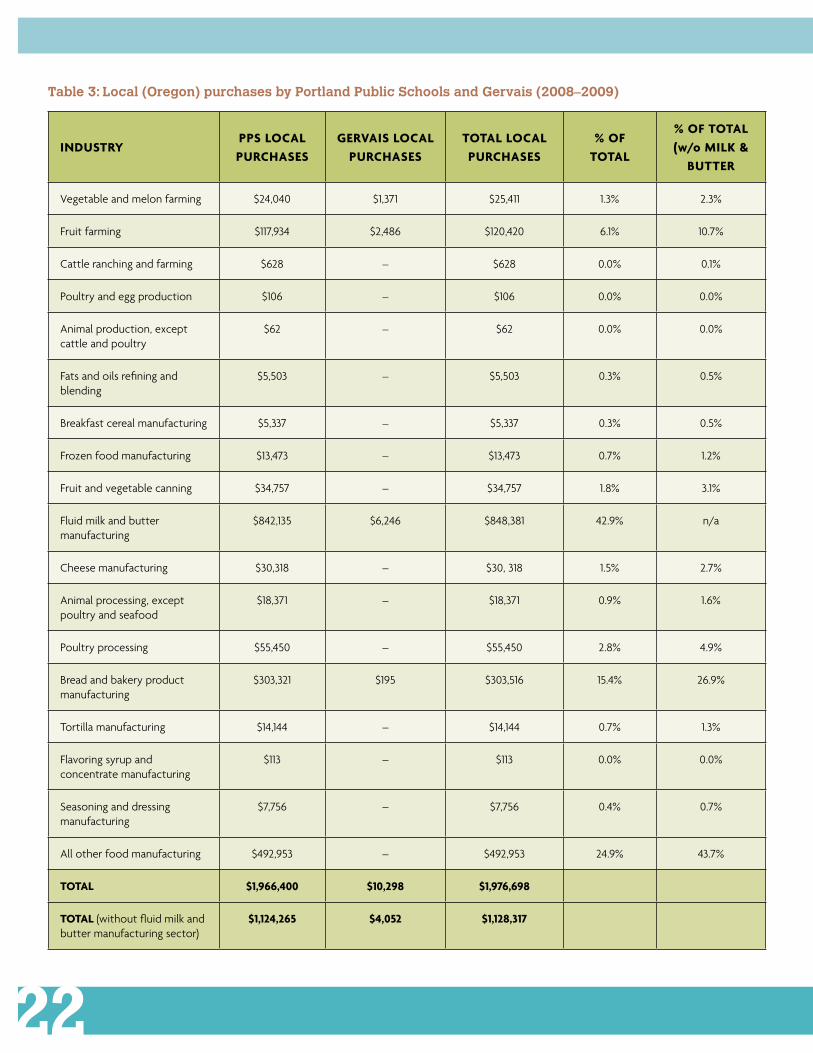
table 3: Local (oregon) purchases by Portland Public schools and Gervais (2008–2009)
INduSTrYPPS loCAl PurChASES
gErVAIS loCAl PurChASES
ToTAl loCAl PurChASES
% oF ToTAl
% oF ToTAl (w/o mIlk &
BuTTEr
Vegetable and melon farming $24,040 $1,371 $25,411 1.3% 2.3%
Fruit farming $117,934 $2,486 $120,420 6.1% 10.7%
Cattle ranching and farming $628 – $628 0.0% 0.1%
Poultry and egg production $106 – $106 0.0% 0.0%
Animal production, except cattle and poultry
$62 – $62 0.0% 0.0%
Fats and oils refining and blending
$5,503 – $5,503 0.3% 0.5%
Breakfast cereal manufacturing $5,337 – $5,337 0.3% 0.5%
Frozen food manufacturing $13,473 – $13,473 0.7% 1.2%
Fruit and vegetable canning $34,757 – $34,757 1.8% 3.1%
Fluid milk and butter manufacturing
$842,135 $6,246 $848,381 42.9% n/a
Cheese manufacturing $30,318 – $30, 318 1.5% 2.7%
Animal processing, except poultry and seafood
$18,371 – $18,371 0.9% 1.6%
Poultry processing $55,450 – $55,450 2.8% 4.9%
Bread and bakery product manufacturing
$303,321 $195 $303,516 15.4% 26.9%
Tortilla manufacturing $14,144 – $14,144 0.7% 1.3%
Flavoring syrup and concentrate manufacturing
$113 – $113 0.0% 0.0%
Seasoning and dressing manufacturing
$7,756 – $7,756 0.4% 0.7%
All other food manufacturing $492,953 – $492,953 24.9% 43.7%
ToTAl $1,966,400 $10,298 $1,976,698
ToTAl (without fluid milk and butter manufacturing sector)
$1,124,265 $4,052 $1,128,317
22

Figure 2: total local (oregon) purchases by Portland Public schools and Gervais (2008–2009)10
23
10 Only industrial sectors that made up ≥1% of total purchases without the fluid milk and butter manufacturing sector are included in this figure.
Vegetable and melon farming
Fruit farming
Frozen food manufacturing
Fruit and vegetable canning
Fluid milk and butter manufacturing
Cheese manufacturing
Other animal processing
Poultry processing
Bread & bakery product manufacturing
Tortilla manufacturing
Seasoning and dressing manufacturing
All other food manufacturing
w/o milk & butter
w/milk & butter
0% 5% 10% 15% 20% 25% 30% 35% 40% 45% 50%
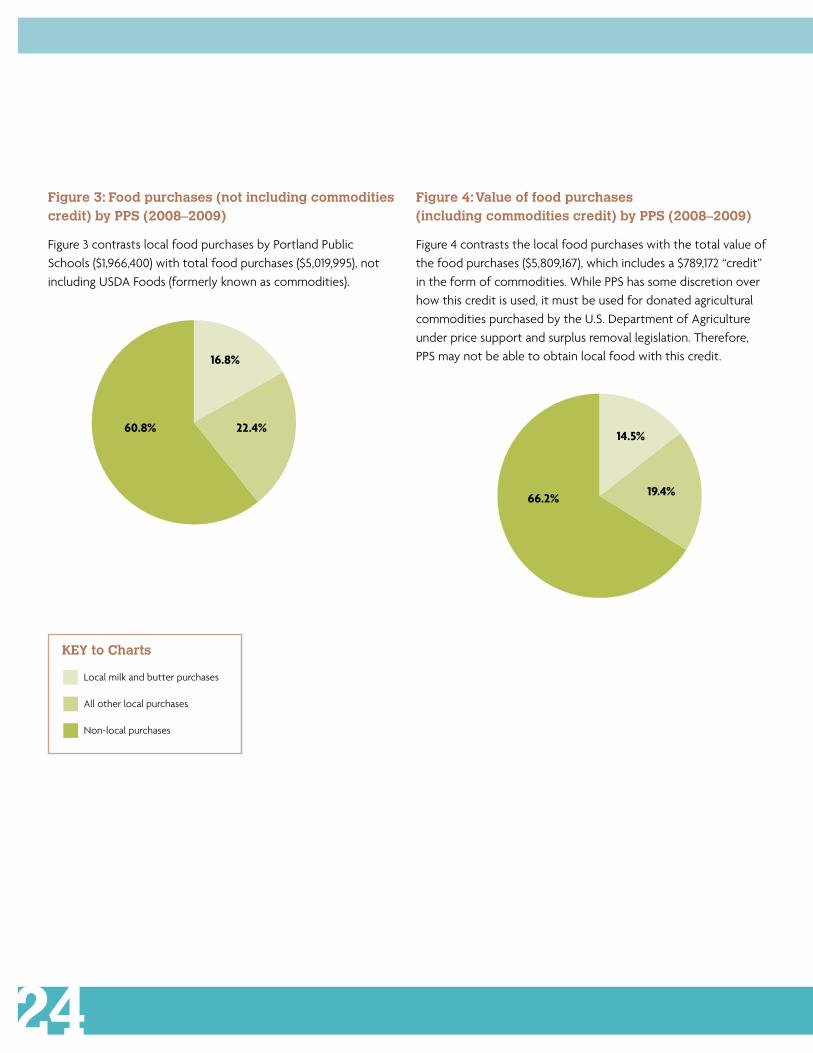
Figure 3: Food purchases (not including commodities credit) by PPs (2008–2009)
Figure 3 contrasts local food purchases by Portland Public Schools ($1,966,400) with total food purchases ($5,019,995), not including USDA Foods (formerly known as commodities).
Figure 4: Value of food purchases (including commodities credit) by PPs (2008–2009)
Figure 4 contrasts the local food purchases with the total value of the food purchases ($5,809,167), which includes a $789,172 “credit” in the form of commodities. While PPS has some discretion over how this credit is used, it must be used for donated agricultural commodities purchased by the U.S. Department of Agriculture under price support and surplus removal legislation. Therefore, PPS may not be able to obtain local food with this credit.
16.8%
22.4%60.8%14.5%
19.4%66.2%
Local milk and butter purchases
All other local purchases
Non-local purchases
KeY to charts
24
18
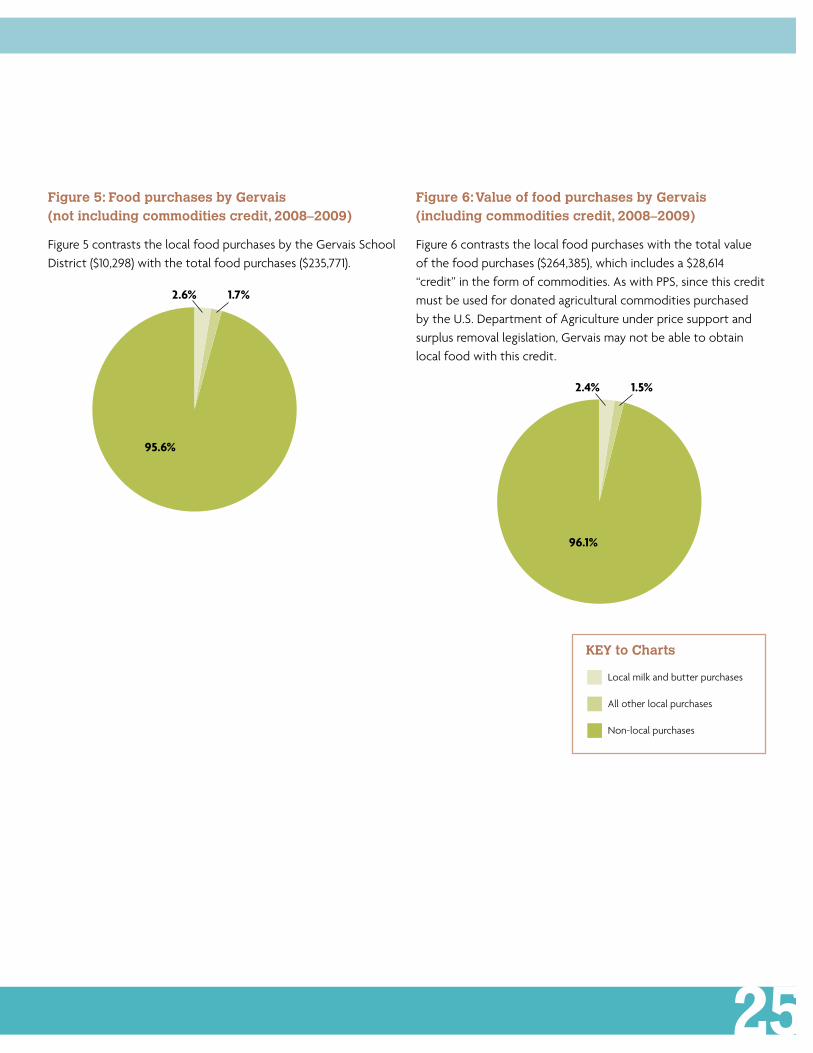
Figure 6: Value of food purchases by Gervais (including commodities credit, 2008–2009)
Figure 6 contrasts the local food purchases with the total value of the food purchases ($264,385), which includes a $28,614 “credit” in the form of commodities. As with PPS, since this credit must be used for donated agricultural commodities purchased by the U.S. Department of Agriculture under price support and surplus removal legislation, Gervais may not be able to obtain local food with this credit.
Figure 5: Food purchases by Gervais (not including commodities credit, 2008–2009)
Figure 5 contrasts the local food purchases by the Gervais School District ($10,298) with the total food purchases ($235,771).
95.6%
2.6% 1.7%
2.4% 1.5%
96.1%
Local milk and butter purchases
All other local purchases
Non-local purchases
KeY to charts
25

26
results Findings from this analysis provide important information on the types of local products purchased by these districts and the types of programs or strategies used to incorporate those products into the school meal program, the methods used to procure the products, and the effects that those purchases had on the overall state economy. During the 2008-2009 school year, a total of $160,750.02 of the Kaiser grant money was invested in the two districts to increase their purchasing power for local food.
In examining the purchases made by each district, it is clear that funds for local purchases were used differently by PPS and Gervais. In terms of the types of products purchased, PPS used the pilot program investment across multiple categories (e.g., fruits and vegetables, proteins, grains and baked goods, cheese, etc.), while Gervais focused primarily on fresh fruits and vegeta-bles. However, Gervais did greatly expand the varieties of fruits and vegetables offered over previous years thanks to the pilot
program funds. To promote their local purchases, PPS, as a district already involved in farm to school programming, expanded upon existing promotions by creating a new promotion: Local Lunch. Gervais, newer to farm to school, focused instead on developing their first Harvest of the Month program for the district.
Both school districts also leveraged the investment to purchase locally produced items that cost slightly more than items they had previously been purchasing non-locally, such as salsa. In terms of the method of procurement, new vendor relationships were formed at both schools, but Gervais focused primarily on direct purchases from farmers, while PPS used the pilot program investment to conduct direct purchases with local farmers and to procure local products through mainstream distribution channels, thus signaling a preference for local procurement in diverse ways, and influencing all aspects of the food system, not just direct market sales.
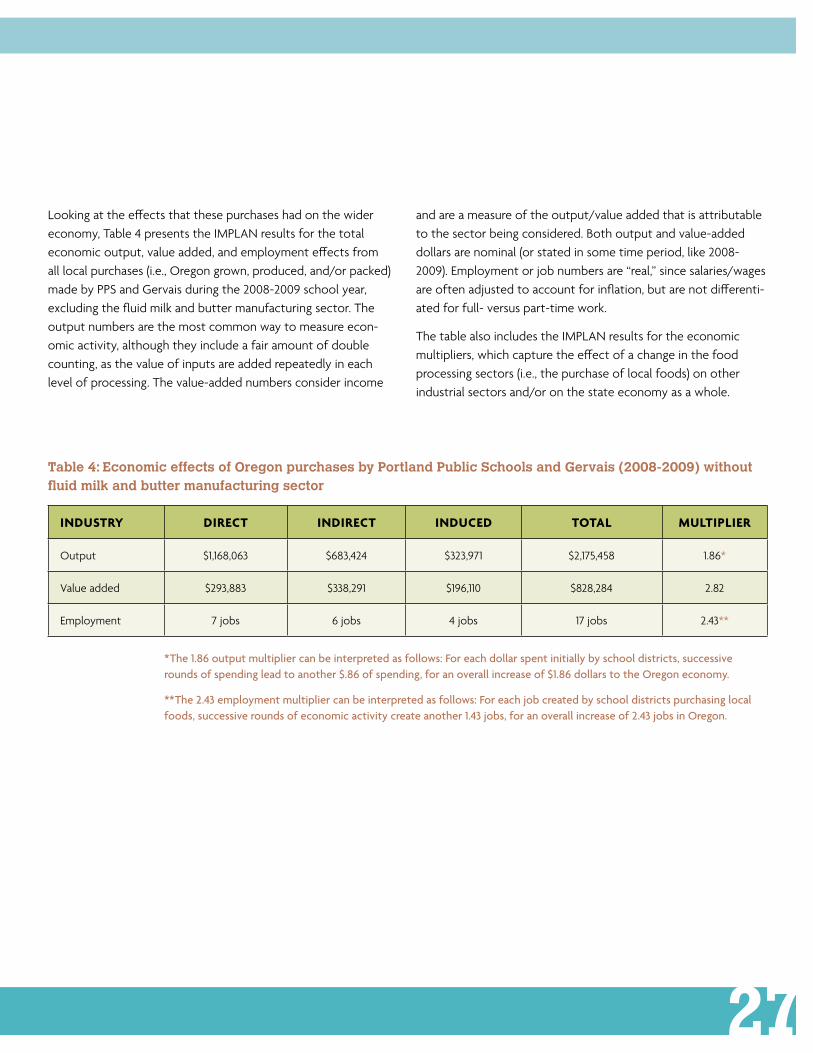
*The 1.86 output multiplier can be interpreted as follows: For each dollar spent initially by school districts, successive rounds of spending lead to another $.86 of spending, for an overall increase of $1.86 dollars to the Oregon economy.
**The 2.43 employment multiplier can be interpreted as follows: For each job created by school districts purchasing local foods, successive rounds of economic activity create another 1.43 jobs, for an overall increase of 2.43 jobs in Oregon.
table 4: economic effects of oregon purchases by Portland Public schools and Gervais (2008-2009) without fluid milk and butter manufacturing sector
INduSTrY dIrECT INdIrECT INduCEd ToTAl mulTIPlIEr
Output $1,168,063 $683,424 $323,971 $2,175,458 1.86*
Value added $293,883 $338,291 $196,110 $828,284 2.82
Employment 7 jobs 6 jobs 4 jobs 17 jobs 2.43**
27
Looking at the effects that these purchases had on the wider economy, Table 4 presents the IMPLAN results for the total economic output, value added, and employment effects from all local purchases (i.e., Oregon grown, produced, and/or packed) made by PPS and Gervais during the 2008-2009 school year, excluding the fluid milk and butter manufacturing sector. The output numbers are the most common way to measure econ-omic activity, although they include a fair amount of double counting, as the value of inputs are added repeatedly in each level of processing. The value-added numbers consider income
and are a measure of the output/value added that is attributable to the sector being considered. Both output and value-added dollars are nominal (or stated in some time period, like 2008-2009). Employment or job numbers are “real,” since salaries/wages are often adjusted to account for inflation, but are not differenti-ated for full- versus part-time work.
The table also includes the IMPLAN results for the economic multipliers, which capture the effect of a change in the food processing sectors (i.e., the purchase of local foods) on other industrial sectors and/or on the state economy as a whole.
Table 5 depicts how the concept of “inspired purchases” worked in one particular instance involving three-bean chili. On a typical day when schools served chili, they had been buying the majority of the food for the meal from outside the state. However, when we provided a per-meal reimbursement and prioritized local buy-ing, we saw that it was indeed possible to keep more school food dollars in the Oregon economy. A relatively small investment, in this case $.07 per lunch served, can inspire trade substitutions that result in more money staying in the Oregon economy.
Knowing that our initial investment of $160,750.02 inspired $461,992.10 of local food purchases, we analyzed the economic benefit of having $461,992.10 circulate throughout the Oregon economy. As noted above, we found that the $461,992.10 had an economic multiplier effect of 1.86, which suggests that every dollar we spend on school food encourages an additional $.86 of spending amongst suppliers and households.
It is possible that the multipliers would be higher if the fluid milk and butter manufacturing sector was included in the analysis; however, from an incentive program perspective, inclusion of this sector may not be appropriate for the Oregon context. More specifically, since a substantial amount of fluid milk is already being purchased locally by school districts, an incentive program for local purchases would not likely see new spending locally in this sector. For this reason, we believe that the analysis excluding the fluid milk and butter manufacturing sector is a conservative, yet more realistic, analysis.
The IMPLAN input-output analysis indicates that local (i.e., Oregon grown, produced, and/or packed) food purchasing by public schools has a substantial effect on the overall state economy. We found that an initial investment of $160,750.02 to Portland Public Schools and Gervais School District during the 2008-2009 school year inspired total purchases of $461,992.10 in local foods. This is because schools leveraged the funds available to them to substitute locally produced items for items they had been buying outside the state.
28

table 5: Local Lunch Day at Portland Public schools
on AnY otHeR DAY
ITEm VENdor PrICE/SErVINg
Chili JTM (Ohio) USDA commodity beef
$0.45
Cheese Land-O-Lakes (MN) USDA commodity cheese
$0.06
Salsa - canned Rio Viejo (FSA Private Label)
$0.03
Tortilla Chips Mission (national brand) (FSA)
$0.06
Blueberries USDA commodity fruit $0.01
Pears Pacific Coast Fruit Co. Location Unknown
$0.19
Lettuce Pacific Coast Fruit Co. Location Unknown
$0.04 (no labor needed)
Cornbread Clackamas Bakery $0.16
Total spent ($20,500)Outside the stateIn-state vendorsIn-state raw ingredients
$1.00$0.52$0.48$0.16
on LocAL LUncH DAY
ITEm VENdor PrICE/SErVINg
Chili Truitt Bothers Inc. Salem, OR
$0.56
Cheese Tillamook Cheese Tillamook, OR
$0.20
Salsa - fresh Pacific Coast Fruit Co. Locally prepared
$0.14
Tortilla Chips Don Poncho Salem, OR
$0.13
Blueberries Willamette Valley Fruit Co. Salem, OR
$0.21
Pears Walter Wells and Sons Hood River, OR
$0.28
Lettuce Pacific Coast Fruit Co. Local Product
$0.01 (labor required)
Cornbread Clackamas Bakery $0.16
Total spent ($34,645)Outside the stateIn-state vendorsIn-state raw ingredients
$1.69$0.00$1.69$1.69
29
lessons learned We gleaned important lessons about local purchasing not only by examining the results of the economic analysis, but also by using information from personal interviews with food service directors at each district to provide important details and context. Key findings from these interviews about the types of products purchased and the methods used to procure and serve them include:
• Schools that are just beginning to make local purchases will probably first incorporate more locally grown fruits and vegetables. Not only are these generally easy to source and substitute, local versions may sometimes be cheaper, and fresh fruits and vegetables are easy to promote to parents and to the local community/media.
• Schools that have some experience with local purchasing will have the knowledge and background to move the funds into other categories, including main dish products, such as meat, bread, and dairy.
• Smaller districts may find it convenient and beneficial to connect with local farmers directly, while larger districts may find it more convenient to go through their regular mainline distributor and specify a local preference.
“ThepurchaseofourproductsbyPortlandPublicSchoolsand Gervaisleddirectlytomeaningfulincrementaltonnageforgrowers andmeaningfuladditionalemploymentinouroperations.”– Peter Truitt, Truitt Bothers Inc., Salem, OR
• There is a learning curve. For example, Gervais has developed relationships with local farmers and worked to solve problems such as too many slugs in the romanesco and squished marionberries on the bottom of boxes. In the process, Gervais also discovered that cost-competitive, sweet, delicious celery was available from a local farmer.
• Increased interest in local purchasing should lead to the creation of new, school-specific products , such as local veggies pre-cut to certain sizes and processed products, such as vegetarian chili (e.g. Portland Public Schools worked with Truitt Brothers, Inc. in Salem to create a three-bean chili for the lunch line).
• Serving locally grown fresh fruits and vegetables often involves more labor/time for lunch staff, as they may be unfamiliar with and/or lack the proper equipment to prepare products.
30

31
Key findings about the potential effect of these purchases on the economy gleaned from both the economic analyses and from the interviews with food service directors include:
• A state investment will likely affect local fresh fruit and vegetable growers immediately.
• Over time, we can expect that certain local purchases will become institutionalized (as is the case with PPS, which now uses regionally farmed and milled wheat in all of its breads, buns, and pizza dough) and that state funds will be used to purchase products in other categories, such as protein, grain, and dairy.
• A range of between $.07 per meal (as in the pilot program) and $.15 per meal (HB 2800) is likely needed as a minimum incentive to try out new products and offset the added time and labor that may be necessary to find, prepare, and serve them.
• Schools can easily funnel the money through a mainline food service distributor, and the more that these companies experience requests for local products, the more likely they are to expand their local purchases and product offerings, with direct implications for the scale and effects of farm to school programming nationwide.

Spurred on by the economic recession and the need for real-time data and an evidence-based rationale to support 2009 legislative efforts promoting HB 2800, Ecotrust, with the consent of Kaiser Permanente Community Fund grantors, decided to also conduct a wider economic analysis of Oregon school food service provid-ers in early 2009. In an effort to better understand how Oregon schools might use the funding proposed under HB 2800, Ecotrust sent an online survey to more than 300 schools across the state. Eighty-three individuals responded, representing school districts all over the state — rural, urban, large, and small. We asked respondents:
If you were given an additional $.15 for every lunch served in your district for the specific purpose of buying more Oregon products, in which categories would you be most likely to seek out Oregon-grown, -processed, or -manufactured products?
The same question was asked for an additional $.07 for every breakfast served. We found that with an additional $.15 per meal for lunch, respondents said they would be most likely to purchase fresh fruits, fresh vegetables, cheese, fluid milk/butter, and beef. Similar results were found for the additional $.07 cents for breakfast, with fresh fruits, fresh vegetables, fluid milk/butter, bread and bakery products, and poultry/eggs showing up as the top categories.
We then used the survey results to inform a second economic effect analysis, again, done in collaboration with colleagues at Oregon State University. We allocated the estimated total value of HB 2800 across spending categories using the survey results. For example, the average respondent stated they would use 26 percent of their state reimbursement to purchase fresh fruit for lunch, so we allocated 26 percent of the total estimated funding coming from the bill to fresh fruit purchases.
We used six different scenarios to estimate economic benefits under a variety of potential spending behaviors by schools, and in half of these scenarios, we assumed that there would be a federal match requirement, as proposed in HB 2800. The results for all six scenarios can be seen in Table 6. It is difficult to estimate precisely how schools would use the state investment called for in HB 2800 or to what degree we would see an immediate, catalytic effect. Nonetheless, our analysis showed that across all scenarios considered, the state could expect immediate benefits across multiple sectors of the Oregon economy. These additional results from school food service staff across Oregon supported the preliminary findings from PPS and Gervais and provided tangible models of the potential benefits that a statewide investment to support the purchase of more Oregon foods in Oregon schools could provide. The information from this analysis was a vital resource in our efforts to advocate for more state funding for school food.
results from a School Food Service Providers Survey
32
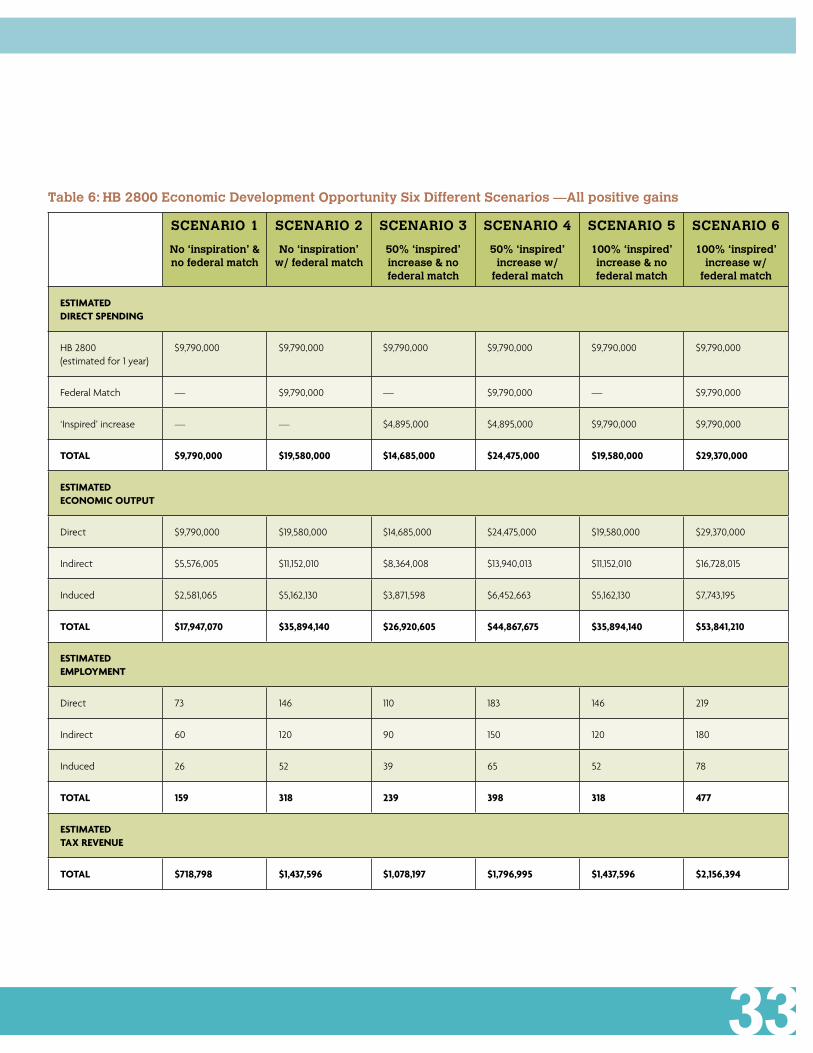
table 6: HB 2800 economic Development opportunity six Different scenarios —All positive gains
scenARIo 1
no ‘inspiration’ & no federal match
scenARIo 2
no ‘inspiration’ w/ federal match
scenARIo 3
50% ‘inspired’ increase & no federal match
scenARIo 4
50% ‘inspired’ increase w/
federal match
scenARIo 5
100% ‘inspired’ increase & no federal match
scenARIo 6
100% ‘inspired’ increase w/
federal match
ESTImATEd dIrECT SPENdINg
HB 2800 (estimated for 1 year)
$9,790,000 $9,790,000 $9,790,000 $9,790,000 $9,790,000 $9,790,000
Federal Match — $9,790,000 — $9,790,000 — $9,790,000
‘Inspired’ increase — — $4,895,000 $4,895,000 $9,790,000 $9,790,000
ToTAl $9,790,000 $19,580,000 $14,685,000 $24,475,000 $19,580,000 $29,370,000
ESTImATEd ECoNomIC ouTPuT
Direct $9,790,000 $19,580,000 $14,685,000 $24,475,000 $19,580,000 $29,370,000
Indirect $5,576,005 $11,152,010 $8,364,008 $13,940,013 $11,152,010 $16,728,015
Induced $2,581,065 $5,162,130 $3,871,598 $6,452,663 $5,162,130 $7,743,195
ToTAl $17,947,070 $35,894,140 $26,920,605 $44,867,675 $35,894,140 $53,841,210
ESTImATEd EmPloYmENT
Direct 73 146 110 183 146 219
Indirect 60 120 90 150 120 180
Induced 26 52 39 65 52 78
ToTAl 159 318 239 398 318 477
ESTImATEd TAX rEVENuE
ToTAl $718,798 $1,437,596 $1,078,197 $1,796,995 $1,437,596 $2,156,394
33

To assess the impact of the farm to school pilot programs on participation rates by students in the lunch programs at each district, we collected data from each district on attendance and participation for each day of the 2008-2009 school year. We used existing records collected by each school as part of their regular procedures, thus the data was not specifically geared towards the needs of this project. PPS and Gervais used vastly different systems to collect data. Much of the data from Gervais proved unreliable. As a result, we chose to analyze only the data from Portland Public Schools.
Over the 2008-2009 school year in PPS, the Harvest of the Month Program (HOM) occurred twice a month from September to November and January to May, and once a month in December, while the Local Lunch Program (LL) occurred once a month from October to November and January to May on the same day as the HOM Program. As mentioned previously, HOM days featured a local item (cucumber, corn on the cob, parsnip, cabbage, potato, pear, frozen mixed berries, radish, and aspara-gus) grown by Oregon farmers as part of the school lunch. On LL days, 100% of the school cafeteria menu (excluding condiments) was sourced regionally from food producers in Oregon, Wash-ington, or Northern California. See the table below for a list of HOM and LL foods and the dates they were served at PPS in the 2008-2009 school year.
Student Participation rates in the School meal Program
3334
table 7: Portland Public schools HoM and LL Days
HoM LL
moNTh ITEm dATE(S) mENu dATE
September Cucumber 10th & 24th — —
October Corn on the cob 8th & 22nd Cheese quesadilla w/Tillamook cheese and Don Pedro tortillas 22nd
November Parsnip 5th & 19th Draper Valley Farms roasted chicken w/pear glaze 19th
December Cabbage 10th — —
January Potato 8th & 21st Cascade natural beef cheeseburger w/Tillamook cheese 8th
February Pear 13th & 25th 3 bean (grown in the NW) vegetarian chili by Truitt Bros. 25th
March Mixed berries 2nd & 18th Grilled cheese sandwich w/Tillamook cheese on a bun made w/sustainably grown Shepherd’s Grain flour
18th
April Radish 8th & 23rd Pizza by Portland’s own Roadrunner Pizza on crust w/sustain-ably grown Shepherd’s Grain flour
23rd
May Asparagus 13th & 27th Zenner all beef hot dog on a bun made w/sustainably grown Shepherd’s Grain flour
27th
Although PPS did engage in some generic local purchases outside of the HOM and LL programs (i.e., not tied to either promotion), the bulk of their local purchasing was targeted towards these two promotions, and thus researchers reviewed changes in participa-tion rates on HOM and LL days vs. other days of the school year, in addition to examining changes over time. This section analyzes lunch participation data from PPS over the 2008–2009 school year to determine whether there was a difference in participation rates on HOM or LL days, as compared to all other school days, as well as changes over time.
11 We did not calculate average participation rates on HOM or LL days in June, as there were no HOM or LL days in that month.
34 35
data and methodology Over the 2008-2009 school year, 80 PPS schools collected data on total attendance; absences; eligibility for free, reduced, and paid lunches each day; and claimed lunches in each of these categories. These data were used to determine the average daily participation rate of students eligible for free, reduced, and paid lunches. Of the schools collecting data, 28 (35 percent) were elementary schools (grades K-5), 32 (40 percent) were elementary/middle schools (grades K-8), 10 (12.5 percent) were middle schools (grades 6-8), 9 (11.3 percent) were high schools (grades 9-12), and 1 (1.3 percent) included all grades, K-12.
We calculated average participation rates by dividing the number of students claiming free, reduced, and paid lunches by the number of students eligible to claim these lunches.11 The total participation rate is the sum of the free, reduced, and paid participation rates. This method, which is equivalent to taking a weighted average of the participation rates for each school, accounts for differences in school size.

table 8: overall percentage participation
HoM oR LL DAYs ALL otHeR DAYs
moNTh FrEE rEduCEd PAId ToTAl FrEE rEduCEd PAId ToTAl
September 38.8% 6.8% 15.5% 61.0% 37.9% 6.6% 15.4% 59.9%
October 39.6% 6.6% 16.0% 62.2% 41.8% 7.0% 17.8% 66.7%
November 39.5% 6.8% 15.8% 62.1% 40.1% 6.9% 15.8% 62.8%
December 40.9% 7.1% 15.7% 63.7% 39.1% 7.0% 16.6% 62.7%
January 40.7% 7.0% 16.7% 64.4% 40.9% 7.0% 15.8% 63.6%
February 41.5% 6.8% 14.8% 63.0% 41.2% 6.9% 15.5% 63.6%
March 50.0% 8.1% 18.0% 76.1% 49.8% 8.1% 18.9% 76.8%
April 41.5% 6.5% 15.3% 63.2% 42.1% 6.7% 15.6% 64.4%
May 42.0% 6.5% 14.9% 63.3% 41.8% 6.5% 15.1% 63.4%
June — — — — 40.7% 6.1% 14.7% 61.5%
results In examining the data collected from all 80 PPS schools, we found that the total participation rate for all schools was higher on HOM or LL days than on all other days in September, December, and January, while the total participation rate was lower on HOM or LL days than on all other days in October, November, and February to May. The largest difference in participation rates occurred in October (LL: cheese quesadilla with Tillamook cheese and Don Pedro tortillas, HOM: corn on
36
the cob), when participation on HOM or LL days was 4.5 percent lower than on all other days (see Table 8). Separate analyses of elementary, middle, and high schools, as well as non-traditional schools, revealed similar results. Participation over the duration of the year rose and declined slightly, but we did not find that participation rates increased significantly as compared to previ-ous years.
36
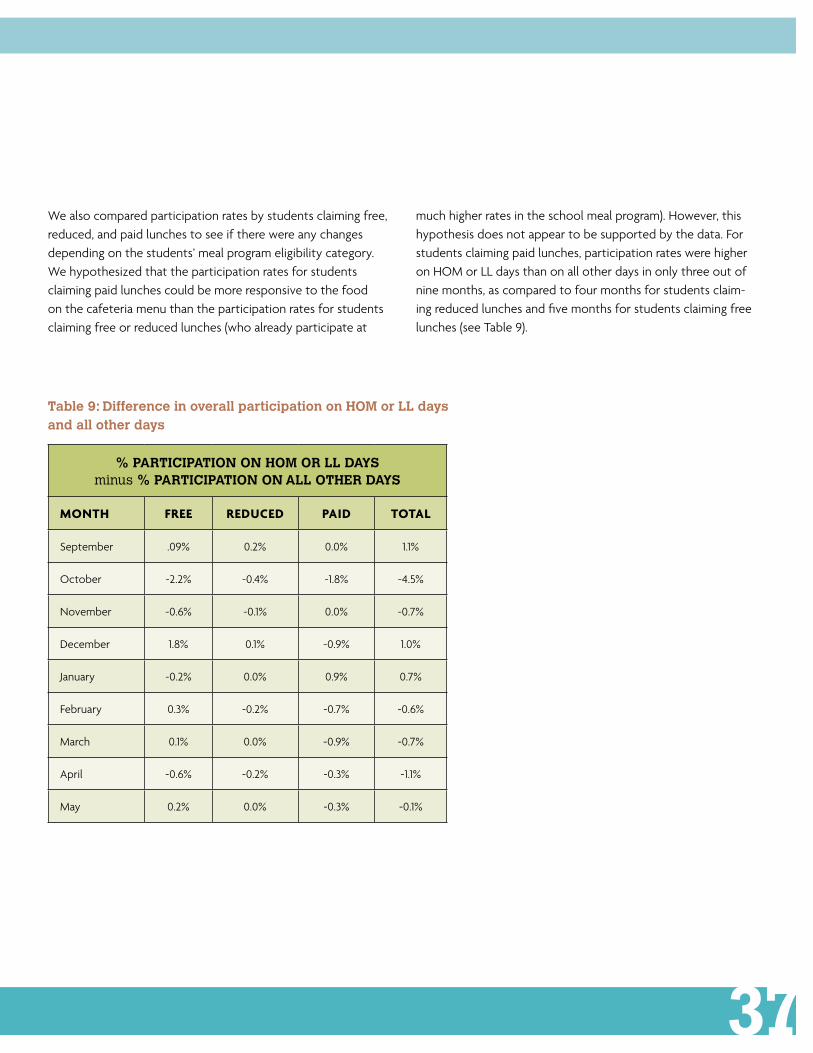
table 9: Difference in overall participation on HoM or LL days and all other days
% PARtIcIPAtIon on HoM oR LL DAYs minus % PARtIcIPAtIon on ALL otHeR DAYs
moNTh FrEE rEduCEd PAId ToTAl
September .09% 0.2% 0.0% 1.1%
October -2.2% -0.4% -1.8% -4.5%
November -0.6% -0.1% 0.0% -0.7%
December 1.8% 0.1% -0.9% 1.0%
January -0.2% 0.0% 0.9% 0.7%
February 0.3% -0.2% -0.7% -0.6%
March 0.1% 0.0% -0.9% -0.7%
April -0.6% -0.2% -0.3% -1.1%
May 0.2% 0.0% -0.3% -0.1%
We also compared participation rates by students claiming free, reduced, and paid lunches to see if there were any changes depending on the students’ meal program eligibility category. We hypothesized that the participation rates for students claiming paid lunches could be more responsive to the food on the cafeteria menu than the participation rates for students claiming free or reduced lunches (who already participate at
37
much higher rates in the school meal program). However, this hypothesis does not appear to be supported by the data. For students claiming paid lunches, participation rates were higher on HOM or LL days than on all other days in only three out of nine months, as compared to four months for students claim-ing reduced lunches and five months for students claiming free lunches (see Table 9).
In hindsight, it may have been unreasonable for us to expect to so quickly reverse a trend that has been at least 40 years in the making in terms of changing consumer preferences and school lunch programs’ attempts to compete with, or at least track, some of the offerings from fast food restaurants. It is likely to take at least a decade or two of concentrated effort to reverse the commercial push for foods higher in salt, sugar, and fat. There are many potential explanations for why this change will require a great deal of energy and financial resources over many years. They include issues such as student willingness to try new foods and the speed of the lunch line—it is difficult to “sell” students on an unfamiliar item when there is little time to educate them about new foods and without multiple opportunities for them to try the new item before committing—as well as a single menu item being offered rather than multiple choices (students at PPS often perceived this negatively), and also contextual factors that we did not assess for (such as the availability of complementary nutrition education and promotion activities, and whether or not schools have open campus policies).
Interpretation In examining participation rates in PPS’s lunch program during the 2008-2009 school year, we had hoped we might see a relatively quick increase in participation rates in addition to the higher participation on HOM and LL days as compared to all other days, and that participation rates would be more responsive for students claiming paid lunches. The analysis did not show this to be the case, and in some instances revealed the opposite to be true.
It is generally understood by those in the farm to school commu-nity that to be successful, a program must not only make changes to the food that is served in the cafeteria, but also back up those changes by connecting them to the classroom and community. The program did not include consistent district-wide educational or promotional components to support the changes in the cafe-teria simply because resources were not available to support such efforts (e.g., taste testing new foods multiple times is a proven strategy to get children to try new foods as well as develop a preference for them, but such an effort across 87 schools would require a massive deployment of money and labor). Furthermore, while there was some community support provided in PPS via a Community Partner Program with local retailers, resources were not abundant enough to create a robust program with a wide reach. Thus, it is not clear that students, school staff, or parents were aware of the changes taking place in their school cafeterias, or of the benefits to student and community health.
38
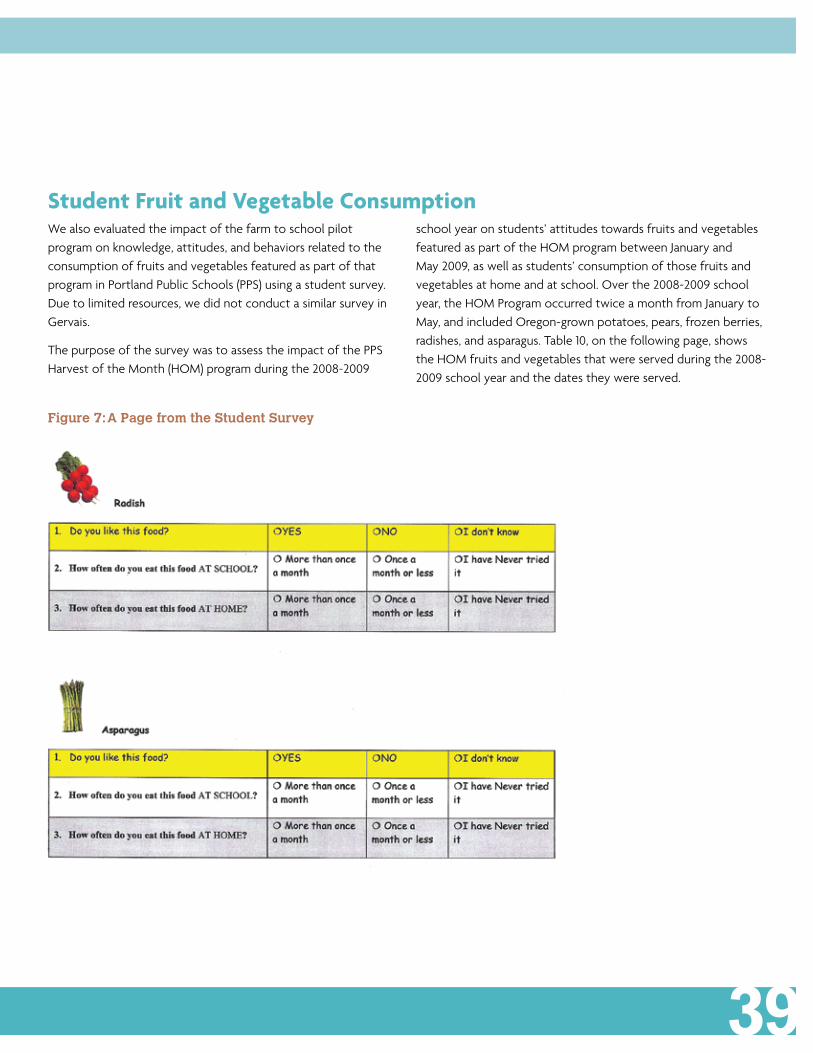
We also evaluated the impact of the farm to school pilot program on knowledge, attitudes, and behaviors related to the consumption of fruits and vegetables featured as part of that program in Portland Public Schools (PPS) using a student survey. Due to limited resources, we did not conduct a similar survey in Gervais.
The purpose of the survey was to assess the impact of the PPS Harvest of the Month (HOM) program during the 2008-2009
school year on students’ attitudes towards fruits and vegetables featured as part of the HOM program between January and May 2009, as well as students’ consumption of those fruits and vegetables at home and at school. Over the 2008-2009 school year, the HOM Program occurred twice a month from January to May, and included Oregon-grown potatoes, pears, frozen berries, radishes, and asparagus. Table 10, on the following page, shows the HOM fruits and vegetables that were served during the 2008-2009 school year and the dates they were served.
Student Fruit and Vegetable Consumption
39
Figure 7: A Page from the student survey
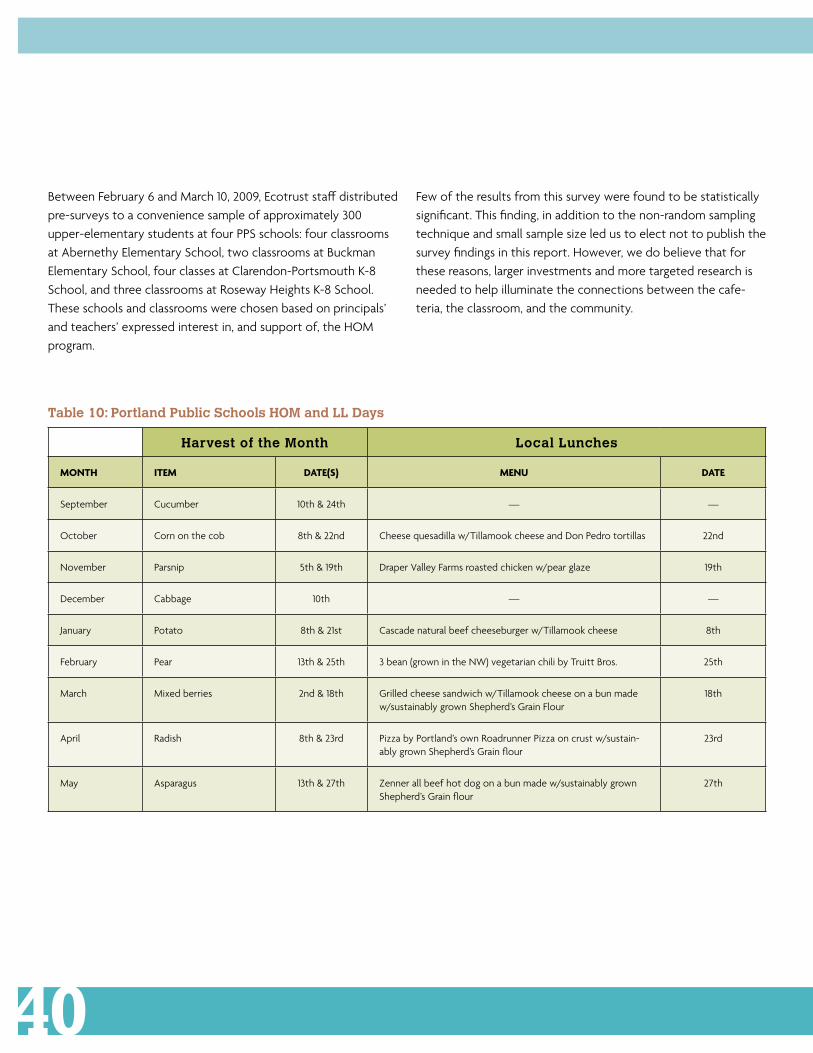
Between February 6 and March 10, 2009, Ecotrust staff distributed pre-surveys to a convenience sample of approximately 300 upper-elementary students at four PPS schools: four classrooms at Abernethy Elementary School, two classrooms at Buckman Elementary School, four classes at Clarendon-Portsmouth K-8 School, and three classrooms at Roseway Heights K-8 School. These schools and classrooms were chosen based on principals’ and teachers’ expressed interest in, and support of, the HOM program.
Few of the results from this survey were found to be statistically significant. This finding, in addition to the non-random sampling technique and small sample size led us to elect not to publish the survey findings in this report. However, we do believe that for these reasons, larger investments and more targeted research is needed to help illuminate the connections between the cafe-teria, the classroom, and the community.
table 10: Portland Public schools HoM and LL Days
Harvest of the Month Local Lunches
moNTh ITEm dATE(S) mENu dATE
September Cucumber 10th & 24th — —
October Corn on the cob 8th & 22nd Cheese quesadilla w/Tillamook cheese and Don Pedro tortillas 22nd
November Parsnip 5th & 19th Draper Valley Farms roasted chicken w/pear glaze 19th
December Cabbage 10th — —
January Potato 8th & 21st Cascade natural beef cheeseburger w/Tillamook cheese 8th
February Pear 13th & 25th 3 bean (grown in the NW) vegetarian chili by Truitt Bros. 25th
March Mixed berries 2nd & 18th Grilled cheese sandwich w/Tillamook cheese on a bun made w/sustainably grown Shepherd’s Grain Flour
18th
April Radish 8th & 23rd Pizza by Portland’s own Roadrunner Pizza on crust w/sustain-ably grown Shepherd’s Grain flour
23rd
May Asparagus 13th & 27th Zenner all beef hot dog on a bun made w/sustainably grown Shepherd’s Grain flour
27th
40

41

As a program meant to have an impact far beyond the reach of the school walls, Upstream Action in the Lunchroom also explored potential community components to complement the efforts of the two districts. Portland Public Schools (PPS) benefitted from messages about healthy local foods being echoed in the wider community via a Community Partner Program that featured PPS’s Harvest of the Month in local stores. Eight community partners in the Portland metropolitan area, from supermarkets to local food co-ops and even a hospital cafeteria (see list of partners in Figure 8), signed on to promote PPS’ Harvest of the Month program through complementary promotions, including posters, signs, recipes, demos, discounts, and more. Partners were provided with packets that included a CD with digital merchandising materials for in-store printing, including the PPS HOM program logos, HOM 2008-2009 posters in various sizes, signage corresponding to each monthly featured fruit or vegetable, and recipes and sample copy (including key messages and fun facts) for each monthly harvest. Partners also received bi-monthly communications with reminders and information about upcoming HOM fruits and vegetables and ideas for how to creatively promote the program.
CommuNITY PArTNErS INCludEd:
Alberta Co-op
Bales Thriftway Marketplace
Food Front Co-op
Kaiser Permanente Interstate Campus cafeteria
New Seasons Market
People’s Co-op
Safeway
Whole Foods Market
going Beyond the Cafeteria: The Community Partner Program
Figure 8: community Partner Program participants
4142
43
Evaluation From December 2008 through May 2009, an Ecotrust intern, Nell Tessman, gathered observational data from the eight participating partners and analyzed the program as part of her graduate thesis for Portland State University. The observational data included numbers and types of Harvest of the Month (HOM) signage used in individual stores, the numbers and types of promotions occurring in the stores, as well as examination of any other materials or activities occurring as a result of participation in the program. Tessman conducted interviews with seven individuals from six of the participating partners regarding their participa-tion in the program, as well as their ideas and recommendations for future incarnations of the program. She also interviewed two employees of Portland Public Schools (PPS) Nutrition Services regarding their impressions of the program and ideas for the upcoming school year.
The most common types of promotion employed by the partners were those supplied as pre-made templates by Ecotrust, including PPS HOM calendars and individual signs/posters for specific HOM featured fruits and vegetables (see Figure 11). In addition, some partners posted information about the program to their website and some made available HOM recipe cards produced by the Oregon Department of Agriculture’s Farm to School Coordinator, Cory Schreiber. Community partners also created several unique promotions inspired by their own ingen-uity and creativity.
Figure 9: examples of Promotions
PArTNEr PromoTIoN
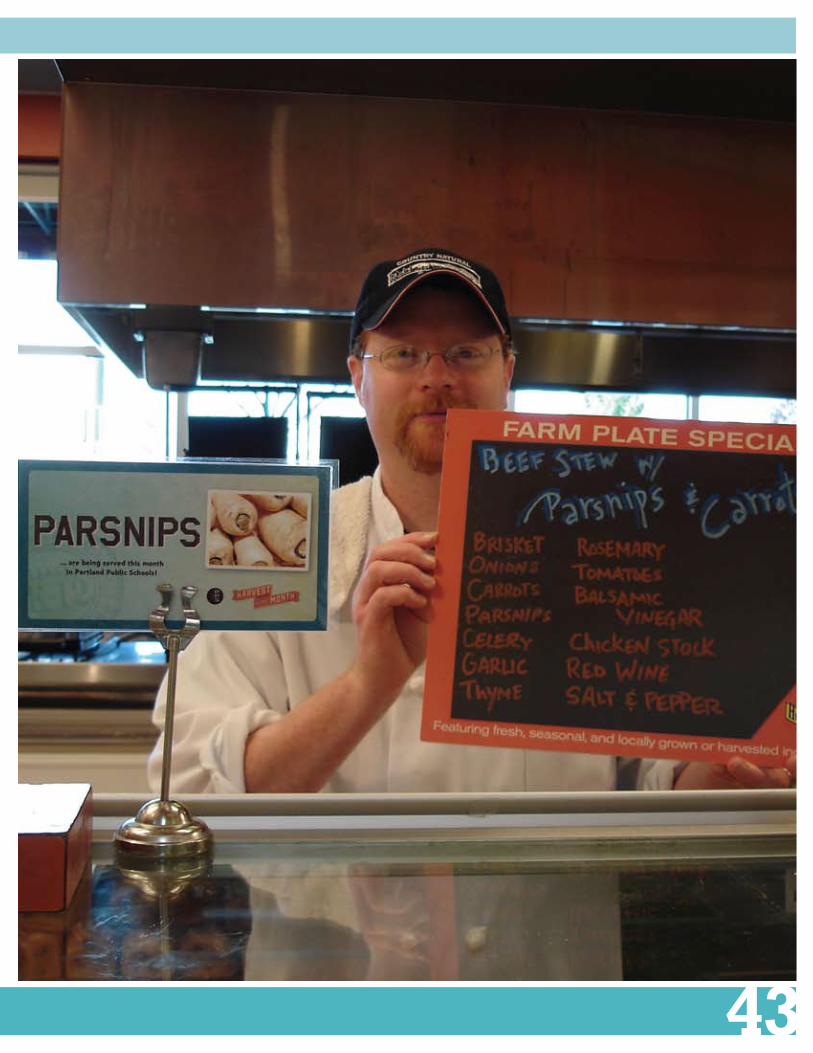
New Seasons Market Each month, New Seasons Market promoted the Harvest of the Month item at their “Solutions” demo space, located at the front of the store. During the demo, they posted the HOM signage for the produce item for a given month, and made a HOM binder available, which was divided into each month of the school year, and included all of the HOM images and recipes, as well as relevant New Seasons Market recipes featuring the same fruit or vegetable. New Seasons Market also promoted the Harvest of the Month item in their deli “Farm Plate Special” (see photo on 43).
Kaiser Permanente Interstate Campus Café
One or two days each month, the Kaiser Café served the HOM recipe for a given month alongside other cold or hot lunch items. The café also posted a large HOM calendar at the back of the café, and when serving a HOM recipe, also posted that month’s HOM signage and provided copies of the recipe to their customers.
Whole Foods Market During the month of January, Whole Foods Market partnered with a Portland elementary school, Sabin, for a “Baked Potato” promotion, in which proceeds were donated to a local school. The event was advertised in the store and on the store’s website, and included materials and signage related to HOM and Whole Foods Market’s partnership with Portland Public Schools and Ecotrust in supporting HOM. Whole Foods Market also created chalkboard replications of the HOM calendar in one of their stores (see photo on page 42).
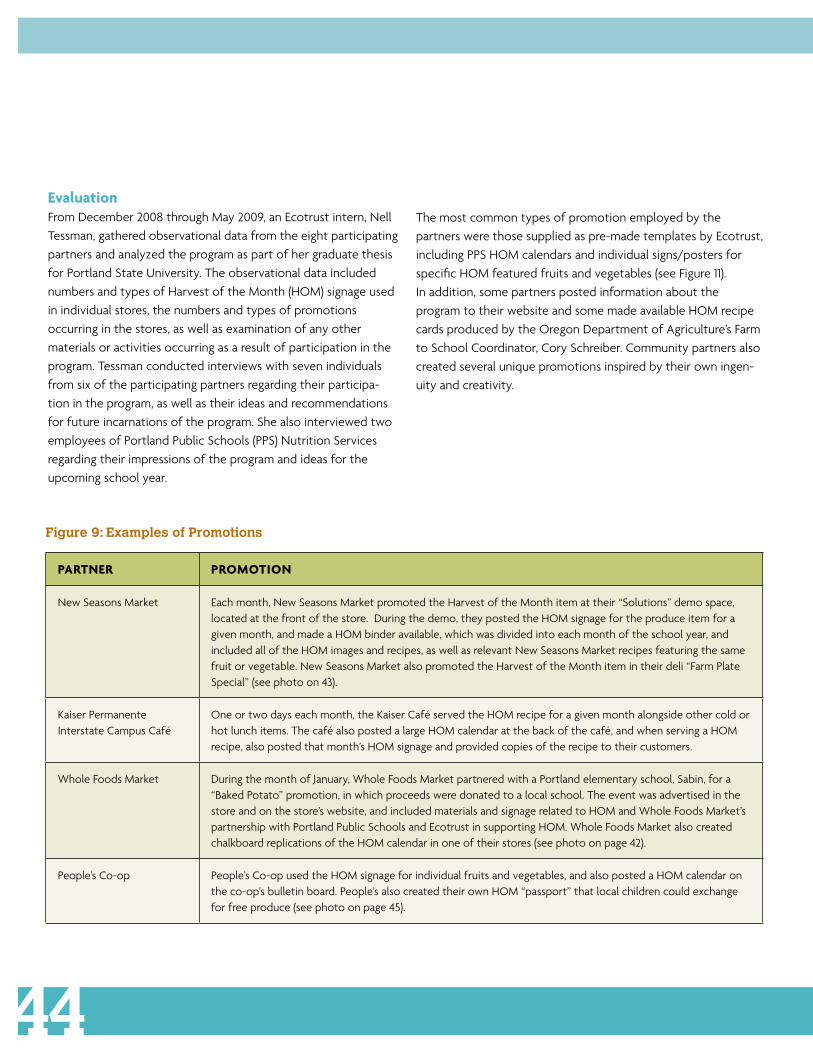
People’s Co-op People’s Co-op used the HOM signage for individual fruits and vegetables, and also posted a HOM calendar on the co-op’s bulletin board. People’s also created their own HOM “passport” that local children could exchange for free produce (see photo on page 45).
404244
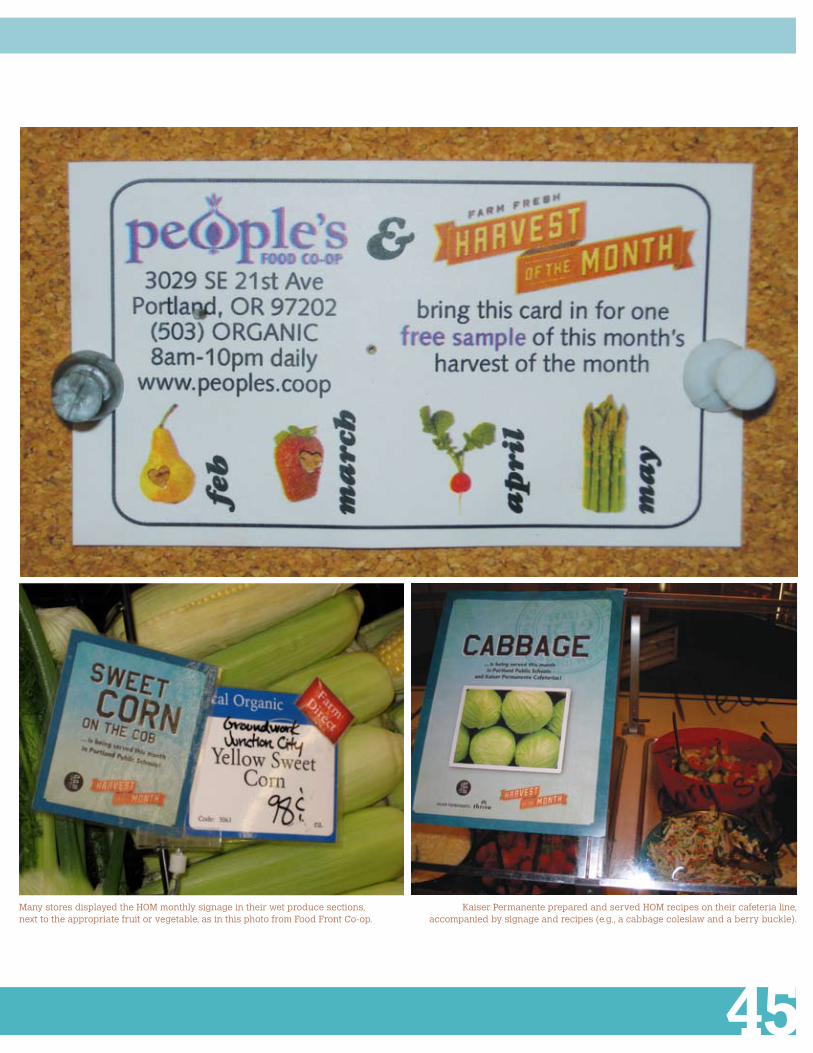
Kaiser Permanente prepared and served HOM recipes on their cafeteria line, accompanied by signage and recipes (e.g., a cabbage coleslaw and a berry buckle).
Many stores displayed the HOM monthly signage in their wet produce sections, next to the appropriate fruit or vegetable, as in this photo from Food Front Co-op.
45

1. ClArIFY ThE mESSAgE ANd moTIVATIoN For ThE ProgrAm
Each of the partners had varying understandings of the motivation behind the creation of the program, ranging from encouraging the community to purchase more locally grown foods, to encouraging healthier eating habits, to just generally supporting the activities taking place in Portland Public School cafeterias. In many cases, these understand-ings were based on a basic understanding of HOM, which was then integrated into each business’s or organization’s own priorities. These understandings were also influenced by who the partners perceived as the audience (i.e. children shopping with their parents, parents, or the broader community). In some ways, this was an advantage, as it allowed for flex-ibility within the program. However, it limited the impact the program had on improving the partners’ understanding of HOM. The message of the program and the relationship of retailers and organizations to HOM needs to be clear. The message should also inform the partners of the moti-vation for the program, and of the audience or audiences for the promotions. This clarification will help differentiate the program from other promotions taking place in stores and other venues, allowing the program to stand out from what the business or organization is already doing.
Recommendations for Improvements to the community Partner Program
2. INCrEASE VISIBlE CoNNECTIoN To STudENTS, SChoolS, FArmS, FArmErS, ANd SoCIAl JuSTICE
The Harvest of the Month promotional templates provided as part of the Community Partner Program featured prominent photos of produce, but the only connection to schools was the PPS logo, which may or may not be recognizable to community members. Many partners expressed the need for the program to draw more explicit connections to the schools and to students via messag-ing and photos. This is an important point in examining the Community Partner Program in the larger framework of farm to school and sustainability. The partners supporting the program were more likely to continue and even increase participation in the program if they had visual, personal experiences to connect their work in the retail environment to the bigger picture with schools and farms.
One partner explained: “The materials used in future incarnations of the program should highlight both the interconnected nature of the local food system, and the connection of the food system to student health and knowledge, through visual imagery as well as brief, infor-mational materials.” In addition, the materials could do more to highlight the importance of the program in the context of social justice. A further way to address food access issues would be to pursue partnerships with retailers that serve more diverse and/or lower income communities.
It was beyond the scope of this project to measure the impact that these promotions had on community members’ perceptions of PPS’s HOM program, but the program did result in many innovative and promising ideas for similar programs in the future, such as the People’s Co-op HOM passport. Insights and recommendations for future iterations of the program based on Tess-man’s store observations and a series of interviews with partners and PPS Nutrition Services staff are outlined below.
46
3. dEVEloP AddITIoNAl PArTNErShIPS wITh orgANIzATIoNS, BuSINESSES, ANd INSTITuTIoNS workINg TowArdS A SImIlAr CAuSE
Several partners suggested developing additional partner-ships with organizations and coalitions working towards a similar cause in order to expand the reach of the program. These connections could include local government, farmers’ markets, and other businesses and organizations in the community, providing information about the program to a more diverse audience while promoting the program. As one partner noted in discussing events taking place at her store, “[t]he times we have brought in a larger diversity of socioeconomic status and regions of Portland are when we partner with other organizations.” That partner recog- nized that partnering with a wider range of organizations, businesses, and institutions increased the diversity of people served by a promotion or an event, expanding the promotion or event’s networking capacity, as well as its ability to support social justice in the community.
4. INCrEASE VISIBIlITY oF ThE ProgrAm IN ThE mEdIA
Over the course of the study, only one media article was written about the Community Partner Program. Additionally, only two of the partners included the HOM on their web-sites. Several partners specifically mentioned an interest in increasing the visibility of the program in the media as a key advantage of participating in the program. Businesses and organizations want to be recognized for giving back to the community through their support of programs like HOM, and the media provides a forum for this acknowledgment. The materials provided could include general press release templates and other informational materials that partners could employ to increase the media visibility of the program using their own resources.
5. work morE INTENSIVElY wITh PArTNErS
Partners also expressed an interest in a specific training or information session that included the individuals respon-sible for implementing the promotion, such as produce staff. Partners also showed an interest in receiving a specific plan of action for conducting the promotion, including signage locations, promotional calendars, etc. One partner expressed a desire for an interactive HOM website specifi-cally for community partners that could include relevant resources and clear information about the intent of the program. Other partners highlighted additional ways they could support HOM, including tabling at in-store events and/or providing discounts and/or other financial support for teachers/schools interested in purchasing produce for in-class demonstrations or taking students on a field trip to a local farm, etc.
6. ProVIdE PrINTEd mATErIAlS While printing materials for use by all stores was beyond the
budget of this project, partners expressed that pre-made signage (e.g., laminated signs, table tents for cafes) would be ideal. Many expressed support for wider dissemination of the People’s Co-op fruit and vegetable “passport” and the development of kid-friendly recipes for HOM.
7. ProVIdE grEATEr EmPhASIS oN IN-PErSoN oPPorTuNITIES For PArTNEr INVolVEmENT
Partners expressed a desire to be more involved with the program in the schools. Suggestions were to help arrange visits to schools to eat lunch, assist in a garden, etc. (one of these was arranged with Whole Foods Market staff and was very successful).
47
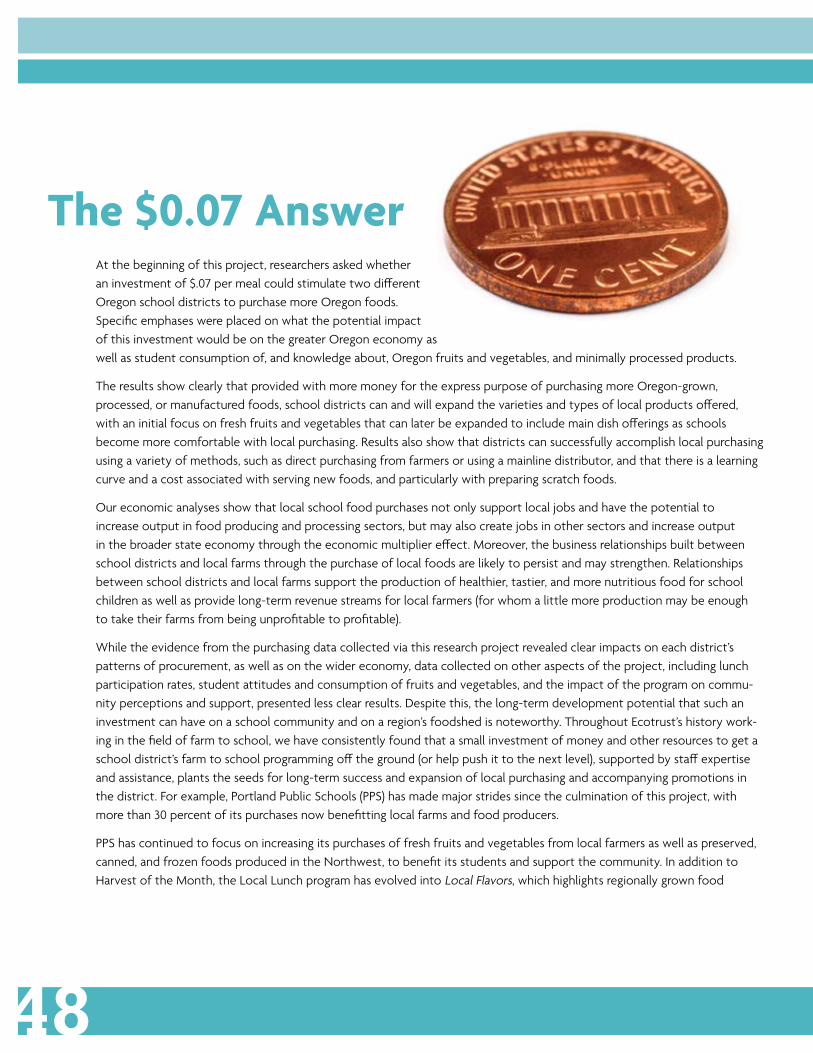
At the beginning of this project, researchers asked whether an investment of $.07 per meal could stimulate two different Oregon school districts to purchase more Oregon foods. Specific emphases were placed on what the potential impact of this investment would be on the greater Oregon economy as well as student consumption of, and knowledge about, Oregon fruits and vegetables, and minimally processed products.
The results show clearly that provided with more money for the express purpose of purchasing more Oregon-grown, processed, or manufactured foods, school districts can and will expand the varieties and types of local products offered, with an initial focus on fresh fruits and vegetables that can later be expanded to include main dish offerings as schools become more comfortable with local purchasing. Results also show that districts can successfully accomplish local purchasing using a variety of methods, such as direct purchasing from farmers or using a mainline distributor, and that there is a learning curve and a cost associated with serving new foods, and particularly with preparing scratch foods.
Our economic analyses show that local school food purchases not only support local jobs and have the potential to increase output in food producing and processing sectors, but may also create jobs in other sectors and increase output in the broader state economy through the economic multiplier effect. Moreover, the business relationships built between school districts and local farms through the purchase of local foods are likely to persist and may strengthen. Relationships between school districts and local farms support the production of healthier, tastier, and more nutritious food for school children as well as provide long-term revenue streams for local farmers (for whom a little more production may be enough to take their farms from being unprofitable to profitable).
While the evidence from the purchasing data collected via this research project revealed clear impacts on each district’s patterns of procurement, as well as on the wider economy, data collected on other aspects of the project, including lunch participation rates, student attitudes and consumption of fruits and vegetables, and the impact of the program on commu-nity perceptions and support, presented less clear results. Despite this, the long-term development potential that such an investment can have on a school community and on a region’s foodshed is noteworthy. Throughout Ecotrust’s history work-ing in the field of farm to school, we have consistently found that a small investment of money and other resources to get a school district’s farm to school programming off the ground (or help push it to the next level), supported by staff expertise and assistance, plants the seeds for long-term success and expansion of local purchasing and accompanying promotions in the district. For example, Portland Public Schools (PPS) has made major strides since the culmination of this project, with more than 30 percent of its purchases now benefitting local farms and food producers.
PPS has continued to focus on increasing its purchases of fresh fruits and vegetables from local farmers as well as preserved, canned, and frozen foods produced in the Northwest, to benefit its students and support the community. In addition to Harvest of the Month, the Local Lunch program has evolved into Local Flavors, which highlights regionally grown food
The $0.07 Answer
48

throughout PPS’s menu more often and is a natural extension of PPS’s efforts to serve more healthy, local foods. Furthermore, PPS has been able to make some significant changes to its district-wide menus that increase the options for healthy, regionally sourced food, such as serving 100 percent locally sourced whole-grain bread products at all 85 of its schools, developing a locally produced pizza, and in the 2010-2011 school year, eliminating both highly processed chicken nuggets and ranch dressing from their menu.
For all of these reasons and many others, PPS is now recognized as a national leader in farm to school programming as a member of School Food FOCUS12, a national initiative that helps large urban school districts—those with 40,000 or more students—procure more healthful, sustainably produced and regionally sourced food, so that children may perform better in school and be healthier in life.
Gervais has also continued to expand its programming in a dramatic fashion, increasing its local purchasing practices and featuring a monthly Harvest of the Month fruit or vegetable, and recently acting as a model to other local districts, Woodburn and North Marion, who partnered to co-promote the same Harvest of the Month campaign in their districts for the first time in the 2010-2011 school year.
One of the key lessons overall is that no matter how large an economic investment is made, it is imperative that changes in the cafeteria are supported by changes in the classroom and community. And indeed, this is often where resources are most lacking. Yet it is clear that children, teachers, and parents must be aware of and informed about these changes and also able to understand the impact that the food purchasing decisions made by their districts have on the health of students, the community, the economy, and on our food system. Without education and promotion, students, parents, and others may be primed to not only be unsupportive of school food, but to criticize school meal programs. This speaks to the great need for support and integration with a diverse array of community partners and support for these programs at many levels, including a particular focus on food- and garden-based education and support from local media.
Can $.07 make a difference? We believe the answer is yes. What kind of difference? That depends on how investments in school food are managed and allocated. With the recently enacted Healthy, Hunger-Free Kids Act (S. 3307) and farm to school programs receiving nationwide support, the time is ripe for investing in a strong foundation that will ensure that the economic and health benefits from these programs will be transferred into tangible and lasting results for the community.
UPDATE During the 2011 legislative session, a revised version of the Farm to School and School Garden bill introduced in 2009 received unanimous support from both the Oregon House and Senate. The 2011 version of HB 2800 appropriates $200,000 to the Oregon Department of Education to administer a competitive grants pilot program in two medium-sized Oregon school districts. The majority of the funds will reimburse these school districts an additional 15 cents per school lunch to buy Oregon foods, while 12.5% will support school garden teaching activities. See Appendix B to view the full text of the 2011 legislation.
12 www.schoolfoodfocus.org
49
APPenDIX A2009 VErSIoN oF hB 2800
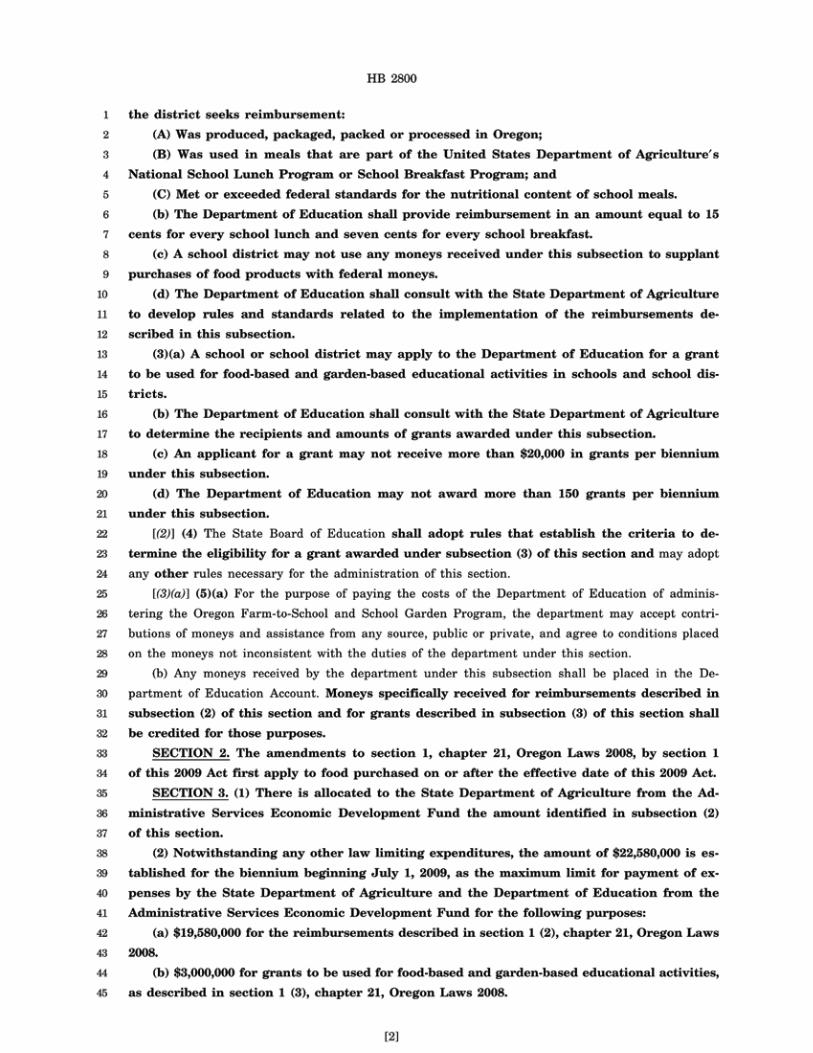


APPenDIX B2011 VErSIoN oF hB 2800

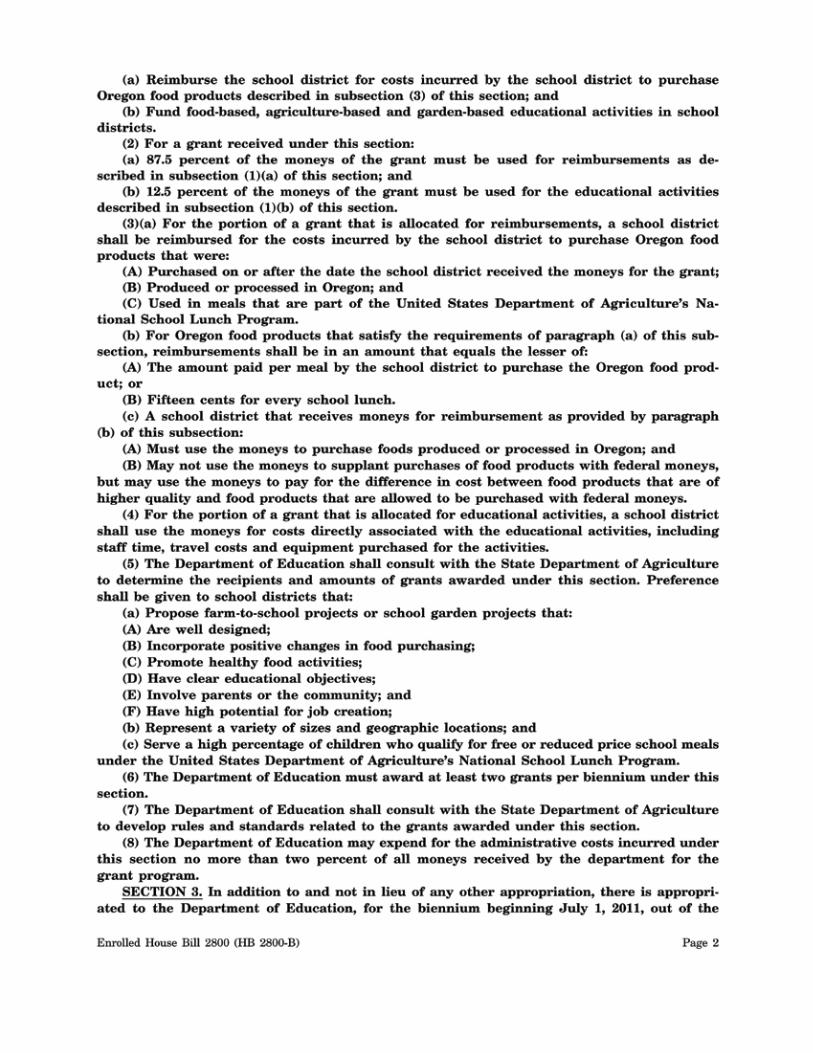


Ecotrust721 NW Ninth AvenuePortland, OR 97209(503) 227-6225 www.ecotrust.org


![The slump test: Clinical applications and interpretationsThe slump test is a series ofseven basic steps [4, 5]. Performance ofthe test involves active and pas sive movements by the](https://img.dokumen.tips/doc/110x75/60ad338c58d42029865b8252/the-slump-test-clinical-applications-and-interpretations-the-slump-test-is-a-series.jpg)


