Embed Size (px)
Citation preview

The Impact of World War
On Labour Market Inequality:
Insights from the Building Industry
by
Ronan Lyons
A Dissertation submitted toThe University of Dublin
for the degree of
M.Sc. in Economics
Department of EconomicsUniversity of Dublin
Trinity College
June, 2005

Declaration
This dissertation has not been submitted as an exercise for a degree at anyother University. Except where otherwise stated, the work described hereinhas been carried out by the author alone. This dissertation may be borrowedor copied upon request with the permission of the Librarian, University ofDublin, Trinity College. The copyright belongs jointly to the University ofDublin and Ronan Lyons.
Signature of Author . . . . . . . . . . . . . . . . . . . . . . . . . . . . . . . . . . . . . . . . . . . . . . . . . . . . . . .Ronan Lyons30 June, 2005

Acknowledgements
I would like to take the opportunity to acknowledge various forms of guidanceand assistance that have made this dissertation possible. First and foremost,I am indebted to Professor Kevin O’Rourke, without whose guidance I wouldnot have started my postgraduate research in this field. His encouragementand incisive mind have been inspirational throughout my postgraduate years.He has also been most helpful in arranging suitable funding through theCenter for the Economics of Globalization, for which I am most grateful. Iwould like to thank Paul Walsh for having the vision to bring this course tofruition. I would also like to thank Chris Minns for his willingness to listento all my ideas and trains of thought throughout and Michael Huberman andBjorn Lomborg for assistance with particular lines of enquiry. The staff atboth Trinity College library and the National Library of Ireland were alsovery helpful. I would like to thank Deirdre Mahony and Tara Mitchell forcarefully checking over the script. Lastly, I would like to thank my familyfor unflailing support throughout.

The Impact of World WarOn Labour Market Inequality:
Insights from the Building Industryby
Ronan Lyons
Submitted to the Department of Economics
on 30 June, 2005 in partial fulfillment of the
requirements for the degree of
M.Sc. in Economics
Abstract
This paper examines changes in skill premiums at the time of the two worldwars. Using occupational pay data from surveys conducted by the Interna-tional Labour Office and official national sources, it describes the effect ofthe wars on building industry skill premiums. Unlike the interwar period,both wars in general reduced skill premiums substantially, particularly WorldWar I. They both also contributed to international convergence in premiums,especially World War II. Econometric models are then developed to explainobserved changes. For World War I, military casualties and structural changeaway from agriculture are found to reduce premiums the most. For WorldWar II, such structural change is associated with higher premiums. Thegreater the union density and the higher the premium post-WWI, the morethe skill premium fell during the Second World War.

Abstract
This paper examines changes in skill premiums at the time ofthe two world wars. Using occupational pay data from surveysconducted by the International Labour Office and official na-tional sources, it describes the effect of the wars on building in-dustry skill premiums. Unlike the interwar period, both wars ingeneral reduced skill premiums substantially, particularly WorldWar I. They both also contributed to international convergencein premiums, especially World War II. Econometric models arethen developed to explain observed changes. For World WarI, military casualties and structural change away from agricul-ture are found to reduce premiums the most. For World WarII, such structural change is associated with higher premiums.The greater the union density and the higher the premium post-WWI, the more the skill premium fell during the Second WorldWar.

Summary
Starting by examining recent papers describing the US labour market during
the first half of the 20th Century, this paper broadens the extent of research
by looking at a wide cross-section of countries across three continents. In
particular, it examines changes in the building industry skill premium in each
country at the time of the two world wars. It addresses certain questions
suggested by economic theory regarding the impact on skill premiums of
military casualties, educational attainment, unionization, government control
of the economy and structural changes. After reviewing the literature on the
economic effects of the World Wars and on the history of labour markets
during the period 1900-1950, the paper then sets out the primary sources
of the data used. Using occupational pay data from surveys conducted by
the International Labour Office and official national sources, it describes the
effect of the wars on building industry skill premiums. Both wars in general
reduced skill premiums substantially, particularly World War I. In World War
I, warring countries saw larger falls in their premium than neutrals, while in
World War II, warring countries experienced a wider range of changes than in
neutral countries. Both wars also contributed to international convergence
in premiums, especially World War II. This is in contrast to the interwar
period, where increasing premiums were the norm rather than the exception.
Econometric models are developed to explain observed changes. For World
War I, military casualties and structural change away from agriculture are
found to reduce premiums the most. Unions and changes in the cost-of-living
are not systematically associated with larger falls in the premium. For World
War II, the same model has little explanatory power. Structural change away
from agriculture is associated with higher premiums, unlike World War I.
Occupied countries had on average higher premiums than other belligerents
or neutral countries. However, the greater the union density and the higher
the premium post-WWI, the more the skill premium fell during the Second
World War.

Contents
List of Tables ix
List of Figures x
1 Introduction 1
2 Theory & Underlying Concepts 42.1 Factors affecting Skill Premiums . . . . . . . . . . . . . . . . . 5
2.1.1 Supply-side . . . . . . . . . . . . . . . . . . . . . . . . 52.1.2 Demand-side . . . . . . . . . . . . . . . . . . . . . . . 72.1.3 Institutional Factors . . . . . . . . . . . . . . . . . . . 8
2.2 Hypotheses . . . . . . . . . . . . . . . . . . . . . . . . . . . . 9
3 Literature Review 113.1 The First World War . . . . . . . . . . . . . . . . . . . . . . . 12
3.1.1 The International Economy . . . . . . . . . . . . . . . 123.1.2 Case Studies . . . . . . . . . . . . . . . . . . . . . . . . 14
3.2 The Second World War . . . . . . . . . . . . . . . . . . . . . . 163.3 Developments in Labour Markets . . . . . . . . . . . . . . . . 18
3.3.1 Global Perspectives . . . . . . . . . . . . . . . . . . . . 183.3.2 National Perspectives . . . . . . . . . . . . . . . . . . . 193.3.3 International Perspectives . . . . . . . . . . . . . . . . 22
4 Data & Sources 244.1 Dependent Variable . . . . . . . . . . . . . . . . . . . . . . . . 25
4.1.1 Measuring Changes in the Skill Premium . . . . . . . . 254.1.2 World War I . . . . . . . . . . . . . . . . . . . . . . . . 264.1.3 World War II . . . . . . . . . . . . . . . . . . . . . . . 27
vii

4.2 Independent Variables . . . . . . . . . . . . . . . . . . . . . . 284.2.1 War-related variables . . . . . . . . . . . . . . . . . . . 284.2.2 Education . . . . . . . . . . . . . . . . . . . . . . . . . 294.2.3 Organised Labour . . . . . . . . . . . . . . . . . . . . . 304.2.4 Industrialization & Industrial Production . . . . . . . . 314.2.5 Government Expenditure . . . . . . . . . . . . . . . . . 324.2.6 Inflation . . . . . . . . . . . . . . . . . . . . . . . . . . 32
4.3 Summary . . . . . . . . . . . . . . . . . . . . . . . . . . . . . 32
5 Stylised Facts from the Two Wars 345.1 Trends from the First World War . . . . . . . . . . . . . . . . 355.2 Trends from the Second World War . . . . . . . . . . . . . . . 45
5.2.1 The Relationship Between the Wars . . . . . . . . . . . 575.3 Comparing the Effects of the Two Wars . . . . . . . . . . . . 58
5.3.1 A Note on International Convergence . . . . . . . . . . 605.3.2 A Note on the Interwar Period . . . . . . . . . . . . . . 615.3.3 Comparing 1914 and 1946 . . . . . . . . . . . . . . . . 63
5.4 Summary of Stylised Facts . . . . . . . . . . . . . . . . . . . . 64
6 Model & Results 676.1 The Role of War and Hosting War . . . . . . . . . . . . . . . 686.2 Explaining the Impact of War . . . . . . . . . . . . . . . . . . 70
6.2.1 The First World War . . . . . . . . . . . . . . . . . . . 706.2.2 The Second World War . . . . . . . . . . . . . . . . . . 74
6.3 The Role of World War One and the Strength of Social Insti-tutions . . . . . . . . . . . . . . . . . . . . . . . . . . . . . . . 75
6.4 Summary . . . . . . . . . . . . . . . . . . . . . . . . . . . . . 78
7 Conclusions 80
Bibliography 85
viii

List of Tables
4.1 Summary of data sources . . . . . . . . . . . . . . . . . . . . . 33
5.1 WWI: dPrem by country groups . . . . . . . . . . . . . . . . . 375.2 WWII: dPrem by country groups . . . . . . . . . . . . . . . . 475.3 International Convergence and the Wars . . . . . . . . . . . . 61
6.1 World War One: the Impact of War and Hosting War . . . . . 686.2 World War Two: the Impact of War and Hosting War . . . . . 696.3 Model of World War One Effects . . . . . . . . . . . . . . . . 716.4 Model of World War II Effects (1): The WWI Model . . . . . 746.5 Model of World War II Effects (2): Role of WWI and Unions . 76
ix

List of Figures
5-1 Proportional Change in Wage Ratio, World War I . . . . . . . 355-2 Proportional Change in Skill Premium, World War I . . . . . 365-3 Percentage Change in Skill Premium, World War I . . . . . . 365-4 WWI: dPrem and Military Casualties . . . . . . . . . . . . . . 385-5 WWI: dPrem and Mobilization . . . . . . . . . . . . . . . . . 395-6 WWI: dPrem and Inflation . . . . . . . . . . . . . . . . . . . . 405-7 WWI: dPrem and Government Expenditure . . . . . . . . . . 405-8 WWI: dPrem and Unionization . . . . . . . . . . . . . . . . . 415-9 WWI: dPrem and Changes in Enrolment . . . . . . . . . . . . 425-10 WWI: dPrem and the Changing role of Agriculture . . . . . . 435-11 WWI: dPrem and Industrial Output . . . . . . . . . . . . . . 435-12 Proportional Change in Wage Ratio, World War II . . . . . . 465-13 Proportional Change in Skill Premium, World War II . . . . . 465-14 Percentage Change in Skill Premium, World War II . . . . . . 475-15 WWII: dPrem and Military Casualties . . . . . . . . . . . . . 485-16 WWII: dPrem and Civilian Casualties . . . . . . . . . . . . . 495-17 WWII: dPrem and Civilian-Military Casualty Ratio . . . . . . 505-18 WWII: dPrem and Mobilization . . . . . . . . . . . . . . . . . 505-19 WWII: dPrem and Changes in the Price Level . . . . . . . . . 515-20 WWII: dPrem and Changes in Union Density . . . . . . . . . 525-21 WWII: dPrem and 1950 Union Density . . . . . . . . . . . . . 535-22 WWII: dPrem and Changes in Enrolment . . . . . . . . . . . 545-23 WWII: dPrem and the Changing Role of Agriculture . . . . . 555-24 WWII: dPrem and Manufacturing Production . . . . . . . . . 555-25 WWII: dPrem and the Change in Unemployment . . . . . . . 565-26 X-Y Scatter: dPrem from both Wars . . . . . . . . . . . . . . 585-27 X-Y Scatter: dPrem2 & the Level of the Premium, 1920 . . . 595-28 Comparing the effects of the Wars in 18 Countries . . . . . . . 60
x

5-29 Comparing the Wars and the Interwar Period . . . . . . . . . 625-30 Building Industry Skill Premiums, 1914 to 1946 . . . . . . . . 66
xi

Chapter 1
Introduction
1

In recent times, there has been renewed interest in inequality and what
drives it, both globally and within an economy. Internal labour market in-
equality is heavily associated with a number of differentials, namely regional,
gender, inter-industry and, in particular, skill. What are the returns to skill
and what drives changes in those returns? This paper addresses this question
from the particular viewpoint of the effect of war. To what extent did the
World Wars, and their economic consequences, affect skill premiums across
countries, both belligerent and neutral, victorious and defeated? Was it war
and casualties per se that drove these changes, or was it government in-
tervention in labour markets, union strength, inflation, demand pressures,
industrialization or some combination of these factors?
Goldin & Margo (1992), in their well known discussion of wage structure
in the United States in the mid-20th Century, coined the term the “Great
Compression” to describe the vastly reduced educational and skill premiums
of the 1940s. They attributed the compression during the 1940s to a marriage
of short-run factors, namely the impact of the World War on demand for
unskilled labour, and longer-run trends, in particular the changes in supply
and demand of skilled labour.
Goldin & Katz (1999) compare the compression of the wage structure in
the US in 1890 and 1940, and find that two periods of falling differentials
occurred, one before the early 1920s and the second in the 1940s. Only one
compression, however, that of the 1940s, was long-lasting. Both compressions
occurred at a time of “world war, inflation, tight labour markets, strong de-
mand for manual workers, rising union strength and substantial government
intervention in the labour market” (Goldin & Katz 1999, p.26).
This paper sets out to address some of the questions that follow on from
this story of labour market inequality. To what extent are the findings about
the United States generalizable to other economies in Europe and its off-
shoots? Did the compression in the labour market structure so noticeable
2

in the US occur elsewhere? If so, were the compressions relatively larger or
smaller? What drove any changes that did occur?
The data used in this paper are from the International Labour Office’s
reports and publications, supplemented where necessary by official national
or institutional statistics. They refer to the building industry, in particular to
the ratio of bricklayers’ hourly rates to unskilled labourers’, for both World
Wars.
The paper is structured as follows: in Chapter 2, the various relevant
factors suggested by economic theory as affecting the skill premium are laid
out, leading to four main hypotheses that the paper seeks to address. In
Chapter 3, the existing literature, both of the economic effects of the World
Wars and of the history of labour market inequality during the first half
of the twentieth century, is reviewed, to establish the current findings and
context of the research. Chapter 4 outlines the main economic variables used
in the research and the sources relied upon for the data. Chapter 5 sets out
the stylised facts of the data under consideration, comparing compressions
across wars and across countries, and some basic relationships between the
change in the premium and some important variables. Chapter 6 presents
the models for both World Wars and the results, while Chapter 7 concludes.
3

Chapter 2
Theory & Underlying Concepts
4
The underlying theory of this paper is the economics of the markets for
factors of production. The price of a factor of production, in labour’s case
known as a wage, is the value of the marginal product of that factor. There-
fore, a more productive factor will, ceteris paribus, earn a higher return. The
logic behind positive skill differentials, hereinafter referred to as skill premi-
ums, follows directly from this, as skilled workers are, almost by definition,
more productive than unskilled workers.1
2.1 Factors affecting Skill Premiums
Having established the economic logic behind a positive skill premium, the
next step is to discuss the various factors affecting the skill premium. Many
of these effects are peculiar, or at least particularly relevant, to the period
under discussion, namely the first half of the twentieth Century.
2.1.1 Supply-side
Education
Firstly, the extent to which the labour force is educated will affect the relative
supplies of skilled and unskilled labour. In an economy with few literate and
numerate people, there is a smaller supply of skilled labour. To attract skilled
labour, a firm will have to pay a larger premium, ceteris paribus. Similarly, in
an economy where the costs of education are high, fewer people are likely to
undertake that investment in their human capital to receive higher earnings
in the future.
There are two channels of relevance here. Firstly, the first half of the 20th
Century was one of increasing average educational attainment and access to
school, and falling costs of education. This helped change the composition of
1For the purposes of ease of exposition, and given the nature of the data under discus-sion, labour will be divided into two categories: skilled and unskilled.
5

the respective labour forces into increasingly skilled. Secondly, in addition to
making skilled workers more plentiful, more widespread education may have
made unskilled workers more productive.2
Another factor affecting the supply of skilled and unskilled labour is the
variability in aptitude and training of workers (Bry 1960). While this holds,
it is of diminishing importance during the period 1900-1950, as there was
widespread increased homogeneity (and increasing quality) of basic educa-
tion.
Trade Unions
The period 1900-1950 is also one of widespread unionization of unskilled
workers, particularly during the two World Wars. A perfect trade union acts
like the textbook monopolist, reducing the consumer surplus of the employer,
namely the surplus of the value of marginal product over the wage. Through
strikes, collective bargaining and successful campaigns for minimum wages,
unions could affect the returns for unskilled labour. This is particularly
relevant, given that the craft unions of the 19th Century were predominantly
unions of skilled workers, whereas trade unions of the early 20th Century
were much more heavily weighted in favour of unskilled workers.
Furthermore, where trade unions exist, inflation in particular may be
correlated with a falling skill premium (cf. Bry (1960), Dunlop & Rothbaum
(1955)). Unions with a broad spectrum of representation across occupations
may, and indeed did, push for incremental wage and cost-of-living increases
across the board, thus narrowing the percentage (but not the monetary)
differential between skilled and unskilled occupations.
2It is also possible, however, that during the period under consideration, the supplyof unskilled labour increased for such industries as building, as the economies coveredcontinued the process of urbanisation, i.e. with agriculture playing an increasingly lessimportant role in the economy.
6

Migration and War
Depending on the relative compositions of the home and immigrant popu-
lations, immigration can affect the skill premium. For example, large-scale
migration to an economy of unskilled workers would shift out that particular
supply curve and thus drive up the skill premium by lowering the equilib-
rium wage of unskilled workers, all else equal. Similarly, if emigration drains
a country of its unskilled labour, or at least to a greater extent than of its
skilled labour, the skill premium should narrow.
War is not unlike emigration, in its expected effects. Large military
and/or civilian casualties diminish the size of the labour force. The extent to
which unskilled labour is more likely to die on the battle-field, due to its more
plentiful supply or society’s smaller opportunity cost of its mobilisation, will
determine the impact of war on the skill premium. For a given (positive)
value of that parameter, the greater the losses in war, the greater the impact
on the differential.
There is at least one other main channel, however, for war to affect labour
market outcomes. Hosts of war, particularly wars of such widespread de-
struction as the World Wars, have some of their infrastructure, and with it
the framework necessary for a functioning economy, destroyed. As a conse-
quence, the experience of hosts of war may differ from those who fought from
a distance.
2.1.2 Demand-side
The early 20th Century saw, beginning in the USA, increased use of tech-
niques of mass production and the assembly line. This style of production has
the effect of breaking down a skilled job into a number of unskilled ones. As
a consequence, firms demand less skilled labour and more unskilled labour,
assuming that the output of the new technique is greater than the old one,
7

for a given level of costs. Related to this, the mechanisation of some unskilled
jobs increased their productivity and further allowed the substitution of cap-
ital for skilled labour. Both these factors would place downward pressure on
the premium enjoyed by skilled labour.
In times of full employment, there may be scarcities of particular types of
labour. A widespread scarcity of unskilled labour, in many ways a corollary
of full employment, would push down the skill premium. Similarly, during
depressions or troughs of business activity, one may expect the premium to
increase, as firms hoard skilled and productive workers while unemployment
means intensified competition for jobs among unskilled workers.
2.1.3 Institutional Factors
Over the course of the early twentieth Century, with the increasing organisa-
tion of labour, the extension of the franchise, the consolidation of industry,
and the permeation of the government into all aspects of the economy, in-
stitutional factors are of potential significance. Guenter (1963) noted the
increased use of collective bargaining and the tendency for centralisation of
wage determination, with a side-effect of collective bargaining being the influ-
encing of non-unionised industries within the same economy.3 It is unclear
whether the expected sign of this relationship is obvious, however. Sepa-
rately, minimum wage regulations, which, by their very nature, have a greater
positive effect on the well-being of the lower-paid than the better paid skilled
workers, may also impact on the skill premium.
3Earnings data reveal that the market can find ways of overcoming the rigiditiesimposed by agreed rates, while benefits and allowances can also have the same effect(Guenter 1963).
8

2.2 Hypotheses
In summation, then, there are four main hypotheses that it would be of
relevance to test:
1. Greater military and civilian casualties meant a larger fall in the skill
premium in warring countries than in countries that escaped the effects
of the war. The World Wars contained a varied range of combatants
and neutrals, with a wide range of different experiences, meaning that
the periods under investigation should be able to shed valuable light
on this relationship.
2. Hosts of the war were affected in a different manner to other partici-
pants. Again, capital destruction went hand in hand with the nature
of the World Wars, especially given the aerial bombardments of the
second World War.
3. The stronger the unions, and the more rapidly they grew, meant greater
falls in the skill premium. Unions grew rapidly during the World Wars,
particularly during the period 1914-20. Nonetheless, countries’ levels
of increased unionization differed greatly, allowing a cross-sectional ap-
proach to answering this question.
4. Times of inflation, particularly when trade unions were strong, had an
adverse effect on the skill premium. Once again, inflation and rapid
price change were heavily associated with the World Wars, so these
periods are relevant ones in which to examine this relationship.
In addition to these main topics, there are further questions on which
these periods may be able to shed light. These include:
5. Increasing education enrolment rates diminished the returns to skill.
9

6. Industrialisation and structural change in an economy away from agri-
culture are associated with falling skill premiums.
7. Peaks of the business cycle are associated with troughs in the skill pre-
mium.
8. Changes in a country’s skill premium during World War I affected how
that premium changed in the same country over the course of World
War II.
Lastly, the available data should allow a direct comparison of the two
World Wars themselves, to elucidate the relative economic effects on
labour markets that each had.
10

Chapter 3
Literature Review
11

This paper in essence addresses a gap in the literature, as cliometric
analyses of the impact of the world wars are a rarity, particularly cross-
sectional ones. Nonetheless, works exist that are relevant when measuring
and discussing the effect of the World Wars on labour markets. These works
fall into two main categories: works detailing the economic consequences of
one of the wars, and analyses of labour market inequality, usually long-term
perspectives.
3.1 The First World War
3.1.1 The International Economy
Works on the effect of the first World War are numerous and vary significantly
in the detail of their analysis. However, a good starting point of the analysis
of the economic effects of this war is the succinct Feinstein, Temin & Toniolo
(1997). They list four main effects of the war, the first two of which are of
more direct relevance to this paper: shocks to production and consumption,
a more rigid economic environment, a weaker financial structure and a more
fragile international monetary system.
Feinstein et al. describe two distinct exogenous shocks to production and
consumption (Feinstein et al. 1997). The first was during the war, partic-
ularly in relation to demand for increased capacity from war-related indus-
tries. As Wrigley (2000) notes, in belligerent countries especially, there were
substantial switches of industrial resources, with metal trades in particular
prospering. The second shock was after the war, when much of this capacity
for engineering, ship-building, mining and steel became superfluous.
The second main effect of the war was a more rigid economic environ-
ment generally. At a time when utmost flexibility was needed, due to the
second shock to production in five years, the opposite occurred. War had
stregthened the power and role of organised labour and trade unions, and
12

had also accelerated the growth of large corporations (and frequently large
cartels). These led to the fixing of wages and prices, with the acceptance
of and often encouragement by governments (James 2002).1 Governments
themselves experienced an upward shift in involvement in the economy, one
of the most significant general outcomes of the war (Feinstein et al. 1997).
The other effects of the war that they outline are financial in nature: a
weaker financial structure within most economies and a more fragile interna-
tional monetary system. Retrospective financing of what had initially been
envisaged as a short war and the inordinate reparations claims of the victors
took their toll on capital markets (James 2002). The long period of currency
readjustment that followed the war played a role in the relative economic
performances for the whole interwar period (Wrigley 2000). Those that al-
lowed their currencies to adjust earlier during the 1930s fared better in terms
of economic growth than the gold standard adherents (Feinstein et al. 1997).
On the global level, London was eclipsed as the financial centre of the world.
In one sense, it was replaced by New York, as the new financial centre, yet
in another by no-one, in the sense that New York was not prepared to act as
lender-of-last-resort as London had during the previous era.
There are two other important aspects to the legacy of the war. Firstly,
mention is often made of the effect of the war on economic growth in the
countries involved in the war (Broadberry & Harrison 2005, e.g). Maddison
(1976) makes the case that diminishing private capital formation during the
war hindered countries’ growth potential. Various studies done during the
interwar period attempted to estimate the cost in economic growth, produc-
tion and trade, with estimates of a four to five year cost usually accepted
(Hardach 1977). Caution must be exercised with such statistics, however,
as it is extremely difficult to develop a counterfactual of the period under
1As the interwar years progressed, however, the influence of the organised labour move-ment waned (Galenson 1976).
13

consideration, leaving out just the effect of the war.
Lastly, the war crystallized the change from the liberal world of the
pre-1914 era to the protectionist period of deglobalisation during the in-
terwar years. For European countries, war had perversely shown the value
of autarky, particularly in terms of food production, resulting in negligible
growth in world trade during the period 1913-37, with Europe the big loser
(Wrigley 2000). A liberal UK was replaced by a more protectionist USA,
as the linch-pin of the international economy (Feinstein et al. 1997). Hostile
trading blocs, protected by tariff walls, replaced a world of almost perfect
factor mobility.
3.1.2 Case Studies
Winter & Robert (1999) is a collection of papers on the impact of the war on
the three main capital cities involved, Paris, Berlin and London. In particu-
lar, they look at labour markets in detail, from the outbreak of war, and the
unemployment situation pre- and post-August 1914 through to the transition
to peace in 1918-19.
During the first year of the war, after the sharp fall in economic activity
in autumn 1914, there is a contrast between the experience of Berlin and
London, which by summer 1915 are booming, and Paris which has severe
unemployment (Lawrence 1999). For Paris, the total transition to military
ends to prevent the loss of the capital to the Central Powers, plus the loss of
raw materials in North France and Belgium, had a very different effect than
in the “booming” war economies of London and Berlin, where increased gov-
ernment spending stimulated output. The mid-years of the war saw a reversal
of fortunes for Paris and Berlin, with the former eliminating unemployment
by early 1917 while the latter saw increasing labour market tensions from
late 1916 (Bonzon 1999). London, meanwhile, continued to fare relatively
better than either of its mainland counterparts.
14

The transition to peace included the challenge of re-absorbing the vast
numbers mobilised in a short space of time and the reconversion of the war
economy to peaceful ends (Cole 1999). Central questions to be answered
included the extent to which organised labour and the government should
have a role in the running of the peacetime economy (ibid.). Of the three
economies, only in the UK was there a boom, and then only for a year (April
1919 to April 1920), with large increases in prices, wages and the money
supply.
In France, despite inflation, production did not increase substantially
in the postwar years, due to such factors as lack of investment confidence,
labour militancy and a liquidity crisis in early 1919. Nonetheless, through
forcing women and immigrants out of the labour force, and relocating rural
workers who had been mobilised into munitions plants in Paris, unemploy-
ment in Paris was eliminated by May 1920. Germany faced even more severe
problems, including revolution, a continuing blockade (until late 1919) and
widespread stikes. In Berlin, large unemployment problems persisted, leading
to legislation ordering people to return to their pre-war addresses.
In reference to wages in the construction industry itself, for all three
capitals, Manning notes that the wartime munitions industry provided a very
strong “lure for unskilled [building] labourers who could almost double their
wages” by changing industry (Manning 1999, p.260). The outbreak of the
war led to the virtual drying up of new private projects. This, combined with
both a general shortage of unskilled labour and the nature of new building
projects, such as fortifications, which did not require the more skilled trades
in the industry, caused the skill premiums in all cities to diminish during
the war.2 Mention is also made, particularly in reference to London, of the
militancy of workers, and the equalising effect this had on wages across trades
2Of interest for this paper is the extent to which these were permanent shifts in thelevel of skill premiums, as opposed to temporary adjustments to war conditions, whichwould be reversed by 1920.
15

(Manning 1999).
3.2 The Second World War
Harrison (1998) discusses the contribution of economic factors to the out-
come of the Second World War and the impact of the war on the economic
development of the major belligerents. Economic factors were to the fore
in the latter half of the war, as the advantages of the Allies over the Axis,
in terms of population, territory and, where relevant, the level of economic
development, helped grind out the victory for the Allies.
The war itself had peculiar effects on the labour markets of Europe
(Milward 1987). Like the earlier World War, it had obvious effects on birth
rates both during and after hostilities. However, in this case, the motivation
behind the German offensive was to politically and racially restructure the
continent. The devastating successes in this regard during the war led to
permanent changes in the distribution of populations. The war witnessed a
wave of intra-European migration even greater than the wave of migration
during the late 19th Century (ibid.). The Europe of 1945 was one of far fewer
ethnic minorities than before.
The war saw huge increases in employment in most countries, particularly
through the entrance of women into the labour force, except in Germany,
where young or old workers and foreigners made up the majority of the in-
crease. Great Britain suffered the most serious problems of labour shortage
during the war. However, in the USA, as elsewhere, there were many “diffi-
culties in meeting the demand for skilled labour” (Milward 1987, p.235). This
was particularly true in war-related industries such as ship-building, aircraft
and electronics, which had relatively high ratios of skilled to unskilled labour.
Similar to the first World War, unskilled labour could use the full em-
ployment and the longer hours they were working to their advantage, by
16

agitating for substantial increases in earnings. In this context of increased
union membership and higher strike activity, differentials became very im-
portant.3 Unlike the earlier World War, however, the postwar period was
one of “unprecedented growth and prosperity”, with much less prominence
of inflation or controls on exchange rates, trade and payments (Munting &
Holderness 1991, p.245). The war eradicated the unemployment which had
seemed so endemic during the 1930s and helped bring about the culture, and
expectation, of full employment in the postwar period.
Another important aspect of the second World War is its pervasive impact
on the quality of life of all citizens, not just those mobilised. Whereas the
first World War had perhaps only taken 100 000 civilian lives directly, the
second world war was one of huge civilian casualties. Concomitant with the
civilian casualties, given the nature of the air bombardments, was huge loss
of capital stock, with Poland, Yugoslavia, the USSR and the UK the worst
affected, according to some estimates (Maddison 1976).
There are interesting comparisons and contrasts between the two Wars
and the economic environments they left in their wake. Both World Wars
solidified the prime position of the USA at the centre of the world economy—
by the end of the second World War, US manufacturing exports comprised
four-fifths of the world total (James 2002). However, it was only after the
second war that the USA appreciated the responsibilities of this role. In the
design of the postwar world in the 1940s, the lesson had finally been learnt
that the huge costs of war outweigh any benefits — a lesson sorely absent
from the nationalist calls of the 1920s. It was then that the reconstruction
of the “globally integrated world that existed before the Great War [could
occur] . . . piece by piece” (James 2002, p.76). This new world, however,
while appreciating the importance of inter-dependence and trade, was very
3Milward (1987) sums up the impact of the war on labour markets by noting that itaffected not the condition of labour so much as its aspirations.
17

different to the liberal order that existed prior to 1914: capital was restricted
by exchange controls, while labour flows were even more restricted (Munting
& Holderness 1991).
3.3 Developments in Labour Markets
3.3.1 Global Perspectives
O’Rourke & Williamson (1999) discuss the development of 19th-century glob-
alisation, in particular between Europe and the “New World”, and the effects
that this increased openness had on internal inequality. Their focus, when
looking at internal inequality, is on wage-rent ratios. Nonetheless, they view
the period 1914-1950 as “the dark middle ages”, where deglobalisation went
hand in hand with divergence. This followed an era of prolonged convergence,
where commodity market integration had driven factor price convergence
(O’Rourke & Williamson 1999).
Milanovic (2003), using GDP per capita data for measures of inequal-
ity, concludes that any increased inequality between 1914 and 1945 is due
to the two World Wars, rather than the deglobalisation of the interwar pe-
riod. However, his data are GDP per capita figures, rather than hourly wage
rates, precluding any analysis of internal labour market inequality from these
findings. Bourguignon & Morrisson (2002), in their recent AER paper, look
at world inequality generally, including both between and within-country in-
equality in their analysis. Their main finding of relevance here is that within-
country inequality underwent a “substantial decline” between 1910 and 1950,
so much so that it accounted for only half as much of global inequality in
1950 as it did in 1820 (Bourguignon & Morrisson 2002, p.734).4
4At the same time, inequality between countries continued its persistent rise from 1820;this can be reconciled with O’Rourke & Williamson’s results by noting that the scope ofBourguignon & Morrison’s dataset covers a wider set of economies.
18

3.3.2 National Perspectives
United Kingdom
Knowles & Robertson (1951) discuss the skill premium in the UK over the pe-
riod 1880-1950. They take the better paid occupations to be those reflecting
greater skill required, as does this paper, and note that “in general, skill dif-
ferentials have been narrowing for a long time” (Knowles & Robertson 1951,
p.110). In particular, while the premium across the building, engineering and
shipbuilding industries was stable before the first World War and from about
1922-1939, it narrowed both during the first World War/postwar boom and
after the second World War.
The authors acknowledge the potential role for unemployment in affect-
ing the premium, given that, firstly, the more skilled workers might be more
closely married to industry and, secondly, a reserve “army” of unskilled
labour might drive down the labourer’s wage when unemployment is high.
However, they note that in practice unemployment rates seem unrelated to
skill differentials or at least appear to be outweighed by other factors (ibid.).
They also note that equal money increments and bonuses may have eroded
the skill premium over time, particularly as unions for the unskilled grew
stronger from the late 19th century on.
Looking at the skill premium in the engineering industry, Thomson &
Hunter (1978) arrive at largely the same conclusions, with the fall in the
skill premium during the second World War occurring earlier according to
their data. As with Knowles & Robertson (1951), the differential was at its
highest before the first World War.
United States of America
In the United States, the first World War coincided with a sharp fall in labour
market inequality, as measured by Keat using the coefficient of variation
19

across skilled, semi-skilled and unskilled workers in twenty industries (Keat
1960). Galenson and Smith outline the stability of the skill differential in the
period 1900-1940, except for a “temporary compression” during and after
the first World War (Galenson & Smith 1978, p.62). An interesting contrast
exists between the long-lasting effects of the second World War and the more
temporary nature of the decline in skill premiums that occurred during the
first World War (Goldin & Katz 1999).
Galenson & Smith (1978) note that the period 1940-1960 was one of “very
substantial narrowing of skill differentials”, attributing this to the second
World War and the consequent labour shortage (ibid.). This is consistent
with the so-called “Great Compression”, as described by Goldin & Margo
(1992), and mentioned earlier.
Writing just after the second World War, Ober (1948) highlights both
World Wars and their immediate aftermaths as periods of declining labour
market inequality, noting “there is good reason to conclude that much of
the narrowing in the spread of wages occurred during the First World War
and immediate postwar years” (Ober 1948, p.130). Using union scales to
calculate the building skill premium, his data show that the period 1914-16
marks the peak in the premium (at just under 100%), while 1920 marks a
low point in the premium, not breached until the falls during the Second
World War.
Taking up Ober’s finding, Muntz (1955) searches for the reasons why
the wage structure narrowed so consistently over the first half of the 20th
Century. Although outlining the potential role for trade unions, industry
and the government, he states that their influence can be easily overstated,
believing instead that market forces drove the fall. In particular, increasing
the educational attainment of the average worker, by incorporating increased
vocational education and training and by promoting educational equality be-
tween genders and races, changed the relative supply schedules. Reinforcing
20

this was the drying up of immigration and with it, the ready supply of often il-
literate, unskilled labourers from southern and eastern Europe (Muntz 1955).
France
In France, data suggest that a large decline in income inequality (as measured
by the income share of the top decile) occurred between 1914 and 1945,
notwithstanding increasing inequality during the 1920s (Piketty 2003). Skill
premiums fell from 1938 to 1952, from an average of 30% to 23% (Dunlop &
Rothbaum 1955). During the first World War, when inequality began to fall,
trade union membership doubled between 1913 and 1920, before falling back
sharply by 1922; 1919-20 was a period of major strike activity, particularly
over the length of the working week (Sellier 1978).
Germany
In Germany, too, there was widespread unionisation, in particular between
1918 and 1922 (Guenter & Leminsky 1978). Once again, over the period
1913-24, the skill premium diminished rapidly, not only during the war but
also during the hyperinflationary episode that followed (Bry 1960). During
the war, civilian industries saw their skill premiums diminish, while war-
related industries often saw theirs increase. During periods of inflation, on
the other hand, differentials fell across all industries and regions. Indeed,
by 1922, the building industry skill premium had almost disappeared. By
the end of 1923, when wages were negotiated in terms of “gold marks”, the
premium increased again, and was very stable from 1929 on to the fall of the
Nazi regime. The Nazi’s wage-rate stabilisation programme meant there were
few changes in rates, but earnings data compiled by Bry show a widening
differential from 1936 on, due to the scarcity of skilled labour. He notes that
the changes wrought by the first World War were more drastic than those
that occurred during the second, “as would be expected in view of the [Nazi]
21

controls [on wages]” (Bry 1960, p.246).
3.3.3 International Perspectives
Bry (1960) goes on to discuss the various factors affecting skill premiums, not
only in Germany but also in the United States and in Great Britain, using
building industry data for comparisons. His main finding is that there is a
strong inverse relationship between the cost-of-living and the skill premium.
In all three countries, the premium fell 1913-20, with a rebound until 1924,
after which there was stability and a gentle fall until World War II. The
premium was at its narrowest “at the close of each war and during the years
immediately following, largely owing to inflationary price rises” (Bry 1960,
p.285).
Other works comparing the occupational wage structure across countries
include studies under the auspices of the International Labour Organisation,
such as Dunlop & Rothbaum (1955) and Guenter (1963). The ILO itself,
in the preamble to the October survey of 1952, briefly examines changes in
skill differentials between 1924, 1938 and 1952 across 10 countries, but finds
“no clearly identifiable trend of . . . skill differentials in the period covered”
(ILO 1953, p.3).
Dunlop & Rothbaum (1955) lists four main questions framing compar-
isons of wage structures across countries. Firstly, the relationship between
the wage structure and the stage (and speed) of economic development may
be of note. Secondly, the wage structure may respond to situations of in-
flation, full employment or increasing productivity. Thirdly, there may be a
significant impact on wage structures of various different wage-setting mech-
anisms. Lastly, one may observe that differentials across countries are related
to the openness of countries to the world economy.
Choosing France, Italy and the USA for an international study, Dunlop
& Rothbaum (1955) observe a significant fall in the skill differential in all
22

three countries, when comparing 1938 to 1952. In Italy, the premium reached
a low just after the war, before increasing again, once prices stabilised. In
France, differentials narrowed at the start and end of the period, widening
only at the end of the war. In the USA, as discussed above, there was
continual narrowing, with the rate of narrowing increasing in the postwar
period. They note, much like Bry above, that the “size of the skill differential
in percentage terms is closely related to the movement of the price level”
(Dunlop & Rothbaum 1955, p.357). In support of this, they point to inflation
in France from 1914 on, during World War II in Italy, and after the War in
the USA.
Guenter (1963) is more reluctant to adhere to the contention that rising
price levels eat away at skill premiums. Using October Inquiry data where
possible, he also assesses the validity of the widely held belief that skill dif-
ferentials had been narrowing over the period 1938-63. The data he used
show that this is indeed the case for the majority of countries, particularly
when the start date is pre-World War II, but that it is not true for all coun-
tries. Looking just at the 1950s, he notes that premiums were higher in
developing countries, but were falling faster over the period. This suggests a
β-convergence of skill premiums internationally, a theme touched upon again
in Section 5.3.1. Of greatest relevance here is the fact that, across Europe and
its offshoots, skill differentials “tended to decline sharply during the period
1938-46, but have since remained fairly stable” (Guenter 1963, p.138).
23
Chapter 4
Data & Sources
24

4.1 Dependent Variable
The dependent variable is the change in the building industry skill premium.
The premium is based on the wages of bricklayers to unskilled labourers in
the building industry. Four pieces of information are therefore needed for one
observation: for the same prewar date, an hourly wage rate for bricklayers
and one for labourers, and the same two occupational rates again for the
same postwar date.
4.1.1 Measuring Changes in the Skill Premium
There are three different ways to look at the changes in wage structure be-
tween skilled and unskilled workers. Where w refers to wage rate, and the
subscript it refers to skilled or unskilled in time period 1 or 2, these are:
1. the change in the wage ratio, as a proportion of the prewar ratio,(ws2/wu2)−(ws1/wu1)
ws1/wu1
2. the change in the skill premium, as a proportion of the prewar premium,((ws2/wu2)−1)−((ws1/wu1)−1)
(ws1/wu1)−1
3. the (percentage) change in the skill premium, (ws2/wu2)− (ws1/wu1)
The preferred unit of change in the skill premium will be (1) above, i.e. the
proportional change in the wage ratio, as it not only weights the size of the
change (unlike 3), it also allows, by comparing ratios, for the theoretical
possibility that a negative premium might exist. Hereinafter, references to
changes in the skill premium will refer to this measure, except where oth-
erwise stated, in particular during Sections 5.1 and 5.2, which use all three
measures to outline the full nature of the changes in the premium.
25

4.1.2 World War I
The reference dates for World War I are 1914 and 1920 where possible, 1913
and one of 1921-24 otherwise (as outlined below). The majority of the depen-
dent variable data are based on figures published by the International Labour
Office. For World War I data, two series and one report were of particular use,
Wage Changes During Recent Months1, Recent Wage Changes In Various
Countries2 and the report Wage Changes in Various Countries, 1914-1925
(ILO 1926).3 Despite the breadth of these statistics, not all the necessary
information was available from ILO sources. Various national sources were
used to complement the existing statistics.
Canada The earliest postwar data for Canada in ILO sources were from
1924. To increase comparability of the wages with other countries, data from
1920 were taken from BLS (1921). Both the BLS and the ILO used data from
the Canadian Labour Gazette, thus the two observations are comparable.
France The building industry in France was not covered by the ILO re-
ports. Instead, data published by various issues of the Bulletin du Ministere
du Travail were used, as tabulated in Manning (1999, p.263).
Germany The postwar ILO data for Germany started in 1922. Hence,
the data were supplemented by those contained in Bry (1960), in particular
Tables A-4 and A-14. These data are based on statistics from the yearbook
of the Allgemeiner Deutscher Gewerkschaftsbund.
1This series was published in ILO (1923a), ILO (1923b), ILO (1923c), ILO (1924a),ILO (1924b).
2This series, covering twenty countries in three continents, was published in ILO(1928g), ILO (1928c), ILO (1928b), ILO (1928f), ILO (1928e), ILO (1928d), ILO (1928a),ILO (1929c), ILO (1929e), ILO (1929a), ILO (1929d), ILO (1929b).
3A further article, Pap (1925), was of use for Hungarian wages.
26

United States Given the breadth of statistics available for the building
industry in the Bureau of Labor Statistics’ publications, and the relative
dearth of such statistics in the ILO’s reports, data for the US are from the
former, in particular BLS (1937). The relevant data are available yearly and
for a variety of cities, but a general average was taken for 1914 and 1920 as
the particular data points.
Further Notes It has not been possible to have these two years for all
20 countries. Those with earlier start dates are Finland and Switzerland
(both 1913). Those with later postwar entries are: France, the Netherlands
and Switzerland (1921), Hungary and Romania (1923) and New Zealand
(1924). It should also be noted that the ILO data for Finland and Italy
are not from the building industry, the only available data being from the
metal engineering industry and the motor car industry respectively (both
skilled to unskilled workers). The data are from Helsinki and Milan, and
so should reflect the prevailing general equilibrium tendencies of the larger
cities. There were building data available for Italy; however, they were rates
from Caserta, a provincial town in Southern Italy, whose ratio is marble-
cutters (rather than bricklayers) to labourers and which dates from 1922.
4.1.3 World War II
For World War II, the equivalent dates are 1938 and 1946, where possible,
and 1937/9 or 1947-49 otherwise. The majority of the data come, once
again, from the International Labour Office, this time from its annual October
Inquiry, Hourly Wages of Adult Male Wage Earners in 30 Occupations.4 For
two of the main protagonists of the war, France and Germany, further sources
were required.
4Specifically, the data come from ILO (1938), ILO (1939), ILO (1940), ILO (1946),ILO (1948), ILO (1951) and ILO (1952a).
27

France Postwar data from France are taken from ILO (1948), which is
based on information contained in the Annuaire Statistique de le France.
Prewar building industry data are not widely available for France, hence
data contained in INSEE (1941) has been used to complement the ILO’s
postwar data. Unfortunately, the only available ratio available in both time
periods is an average of all towns apart from Paris, and for masons to common
labourers (as opposed to specifically building labourers).
Germany Germany did not partake in the October Survey after 1932,
when the National Socialist government came into office. For a prewar ratio,
Bry (1960) (specifically Tables A-4 and A-14) were used. The postwar ILO
data are for the Federal Republic of Germany and the earliest data published
cover October 1951. Both series are based on generally prevailing wage rates.
Note on years covered Once again, it was not possible to have the years
1938 and 1946 for all 25 countries. Austria (1937) and Finland, Portugal and
South Africa (1939) have different starting dates. Those with alternate post-
war entries are: Palestine (1944), Argentina, Italy, New Zealand, Romania
(all 1947), Austria and Norway (both 1949) and Germany (Federal Republic,
1951).
4.2 Independent Variables
4.2.1 War-related variables
Firstly, there are war-related variables, representing shocks to the labour
supply curves or to the economy generally. In total, there are seven potential
variables of relevance:
1. a categorical variable on whether the country was a host of the war
or not (host), to capture some of the effects on capital stock of the
28

destruction of war
2. a categorical variable on whether the country was at war or not (war)
3. the number of months a country was at war (ward)
4. percentage of the labour force mobilised (mob)
5. percentage of the labour force killed in combat (cas in World War I
and mild, military dead, for World War II)
6. percentage of the civilian population killed in war, World War II only
(civd)
7. ratio of civilian to military deaths, another proxy for level of involve-
ment of a particular country in World War II, and also proxying for
capital stock destruction (civmil)
For World War I, death tolls were taken from White (2005), an online source
surveying the most widely used reference materials for consensus figures on
casualties. Other statistics, including numbers mobilised and duration of
involvement in the war, come from Nicholson (2001, p.248).
For World War II, military and civilian death tolls are taken from Ellis
(1993) as are the numbers mobilised. Duration of the war is taken from Ellis
(1993) and History Place (2005). Labour force statistics, here and through-
out, are taken from Mitchell (2003a), Mitchell (2003b), Mitchell (2003c) as
well as Bureau of the Census (1961) and Leacy (1983) where appropriate.
4.2.2 Education
Secondly, as discussed in Section 2.1.1, educational attainment will affect
the level of the skill premium. Increases in enrolment rates, lagged ten years
to allow for passage through education, might be associated with downward
29

pressure on the skill premium. These data come from Mitchell (2003a),
Mitchell (2003b), Mitchell (2003c) and Lindert (2005), with the latter taking
precedence where relevant. The variable of relevance, dEdu, is the change
in enrolment, expressed as a proportion of the pre-war enrolment rate, i.e.
the relative expansion of supply of skilled labour. The totals for children of
school-going age (4-19), by which aggregate enrolment totals are weighted,
comes from census data contained in Mitchell’s International Historical Sta-
tistical series [op. cit. and hereinafter, ‘Mitchell’].
4.2.3 Organised Labour
Thirdly, the extent of the power of organised labour may affect the relative
returns to skilled and unskilled labour. There are two channels for the ef-
fects of organised labour on labour market outcomes: latent power or union
activity. The former can be measured by union membership, as a proportion
of the labour force. For changes in union membership during World War I
(dTU ), use was made both of ILO (1927), which gives union membership in
1913 and in 1920-26 in 45 countries. Labour force data, again from Mitchell’s
series, were used to give union density figures. Union activity for both wars,
strike, is measured by the average annual number of strikes occurring in a
country in the period between the end of the war and the postwar observation
and is weighted per 100000 of population, according to population estimates
which come from Mitchell.
The most widely cited data on union density for the second period come
from Ebbinghaus & Visser (1998), who have data on union density in Western
Europe from 1950, while Bureau of the Census (1961) and Leacy (1983)
contain similar information for the US and Canada. A smaller dataset, given
to the author by Michael Huberman, has unionization rates for 11 of the
countries in 1938 and 1950. Another statistic, published in ILO (1948), and
in ILO (1951) for Norway, is days lost per thousand persons employed in
30

mining, industry and transport, between 1945 and 1947. This covers 15
countries.
4.2.4 Industrialization & Industrial Production
Next, the level of a country’s industrialization and development may be im-
portant in determining the level of skill premium, as observed by Guenter
(1963). Greater industrialization may mean greater demand for building
projects or more generally unskilled labour. This is measured here by the
change in the proportion of the labour force working in the agricultural sec-
tor, between 1910/11 and 1920/21, and again between 1937/38 and 1946-50.5
Once again, the source used is Mitchell.
To capture the effect of aggregate demand in the economy, and thus
demand for labour, three potential consumption proxies were explored for
World War I. The first two come from Mitchell once again, and are per
capita coal consumption (calculated as production plus net imports) and
freight traffic on railways (metric ton per capita). The third is an index of
manufacturing production, with 1913 as base. These data come from League
of Nations (1945).
For World War II, indexed manufacturing production (with 1937 as base)
was used [Mitchell]. Neither rail traffic nor coal consumption would be ap-
propriate for the later war, as substitutes in the form of cars and oil were
taking hold to varying degrees across the economies under consideration.
Lastly, to capture change in the demand for labour in 1946 over 1938,
the change in the level of unemployment was used where possible, using ILO
(1952b). Where figures given were percentages, no adjustment was made.
Actual numbers registered as unemployed were adjusted by the rate of change
5Territorial changes in the postwar settlements significantly altered the sectoral compo-sition of Austria and Hungary (WWI) and Germany (WWII, taking the Federal Republicas postwar Germany).
31

in the labour force between the two periods.
4.2.5 Government Expenditure
As mentioned among the potential institutional factors, as well as one of the
economic effects of the first World War, the role of the government during
the war-time economy, particularly its upward shift in many economies, may
have had a long term effect on the structure of the labour market. Govern-
ment expenditure figures during the war are used as a proxy for government
involvement in and control of the economy, and are deflated back to pre-
war prices and expressed as an annual average percentage of prewar national
income. All expenditure totals, cost-of-living indices and national income
accounts are from Mitchell.
No such equivalent information is available for government expenditure
during the Second World War across a wide cross-section of countries. In
many ways, this is perhaps not so problematic, as the first war was when the
larger upward shift in government involvement in the economy occurred.
4.2.6 Inflation
One of the frequently mentioned factors in relation to diminishing skill pre-
miums is inflation, in that across-the-board increases in wages to compensate
for increased cost-of-living will diminish the percentage gap. Once again, the
increase in the cost-of-living over the prewar figure is taken from Mitchell,
for both Wars, apart from Bulgaria (in WWI) where data contained in ILO
(1926) were used.
4.3 Summary
In Table 4.1 are outlined, in brief, the main sources for the project. To
summarize, standard sources are used where possible for independent vari-
32

ables, such as Mitchell, the League of Nations and Bureau of the Census
(1961) (BofC). For war-related data, the sources used were referenced with
each other and further sources to check their accuracy. For wage data, ILO
reports are used whenever possible. National publications are used to fill in
any gaps, while Bry (1960) was instrumental for German ratios.
Table 4.1: Summary of data sources
Variable Source
Wages
ILO Reports & Series,Labour Gazette (CAN),
Monthly Labor Review (USA),Bulletin du Ministere du Travail (FRA),
Bry (GER),Annuaire Statistique (FRA)
White,Casualties, Nicholson,
Mobilization, etc. Ellis,History Place
Enrolment Mitchell, LindertLabour Force Mitchell,(by Sector) BofC, Leacy
Population by Age MitchellUnion Membership ILO
Union Density Ebbinghaus, HubermanStrikes, Days Lost ILO, BofC, Leacy
Index of League of Nations,Manufacturing Production MitchellGovernment Expenditure Mitchell
Price Indices Mitchell, ILO
33

Chapter 5
Stylised Facts from the TwoWars
34

5.1 Trends from the First World War
Depicted in Figures 5-1 to 5-3 are the proportional changes in the wage ratio
across countries between 1914 and 1920. As can be seen, the most striking
aspect of the ratios in this period is that almost all the countries experienced
a fall in the skill premium over the period, with the exception of New Zealand
(whose postwar date is, unfortunately, 1924).
Figure 5-1: Proportional Change in Wage Ratio, World War I
-0.45
-0.40
-0.35
-0.30
-0.25
-0.20
-0.15
-0.10
-0.05
0.00
0.05
AUSAUT
BELBUL
CAN DKFIN
FRAGER HU
ITA NL NZ
NORROM
ESPSW
ESW
IUK
USA
Of the other countries, those with the largest proportional falls in the wage
ratio (Measure 1 outlined in 4.1.1) are Austria, Bulgaria and France (more
than 35%) with Romania, the UK and the USA the next largest (more than
20%). Looking at premiums (5-2), rather than ratios, Germany, the Nether-
lands, Norway and Sweden join the countries mentioned above in terms of
dramatic reductions (more than 60%) in premiums. Looking at the percent-
age change, lastly (5-3), Romania, France and Bulgaria underwent the largest
changes, followed by the USA and Austria.
35

Figure 5-2: Proportional Change in Skill Premium, World War I
-1.00
-0.80
-0.60
-0.40
-0.20
0.00
0.20
AUSAUT
BELBUL
CAN DKFI
NFR
AGER HU IT
A NL NZNOR
ROMESP
SWE
SWI
UKUSA
Figure 5-3: Percentage Change in Skill Premium, World War I
-0.90
-0.80
-0.70
-0.60
-0.50
-0.40
-0.30
-0.20
-0.10
0.00
0.10
AUSAUT
BELBUL
CAN DKFIN
FRAGER HU IT
A NL NZNOR
ROMESP
SWE
SWI
UKUSA
36

Table 5.1: WWI: dPrem by country groups
Victors Defeated NeutralFrance −0.405 Bulgaria −0.361 Sweden −0.186USA −0.240 Austria −0.358 Netherlands −0.120UK −0.235 Romania −0.291 Norway −0.112Italy −0.175 Germany −0.198 Denmark −0.070
Australia −0.154 Hungary −0.145 Spain −0.037Canada −0.091 Switzerland −0.025Belgium −0.085
New Zealand 0.002Average −0.173 −0.271 −0.092St. Dev. 0.124 0.097 0.060
Among those with the smallest proportional falls are neutral Denmark,
Spain and Sweden (less than 10%).1 Following on from this, Table 5.1 breaks
countries down into three groups, victors, defeated and neutral countries.
The simple unweighted averages show a difference in the changes between all
three groups, with the defeated (whom one may expect to have had the most
severe casualties) experiencing a significantly larger fall in their premium
than the victors, and the neutral countries undergoing a smaller change than
either of the other groups.2 Omitting New Zealand, which is an outlier in
terms of change and date, does not alter this ranking, with the unweighted
average of the victors falling by a proportion of just under 20% (-0.198).
Neutral countries also had the least dispersed experiences of the War, fol-
lowed by the defeated. The victors show the greatest variance. This suggests
that the defeated as a group suffered sharp falls in the premium, while neu-
tral countries as a group experienced less significant wage compression. The
victors were more varied, with the largest fall and the only increase occuring
1As mentioned earlier, the main focus will be on proportional changes in wage ratios.2Due to its colonial role in the first World War, and ongoing fighting during the Russian
Civil War, Finland has been omitted.
37
within this group.
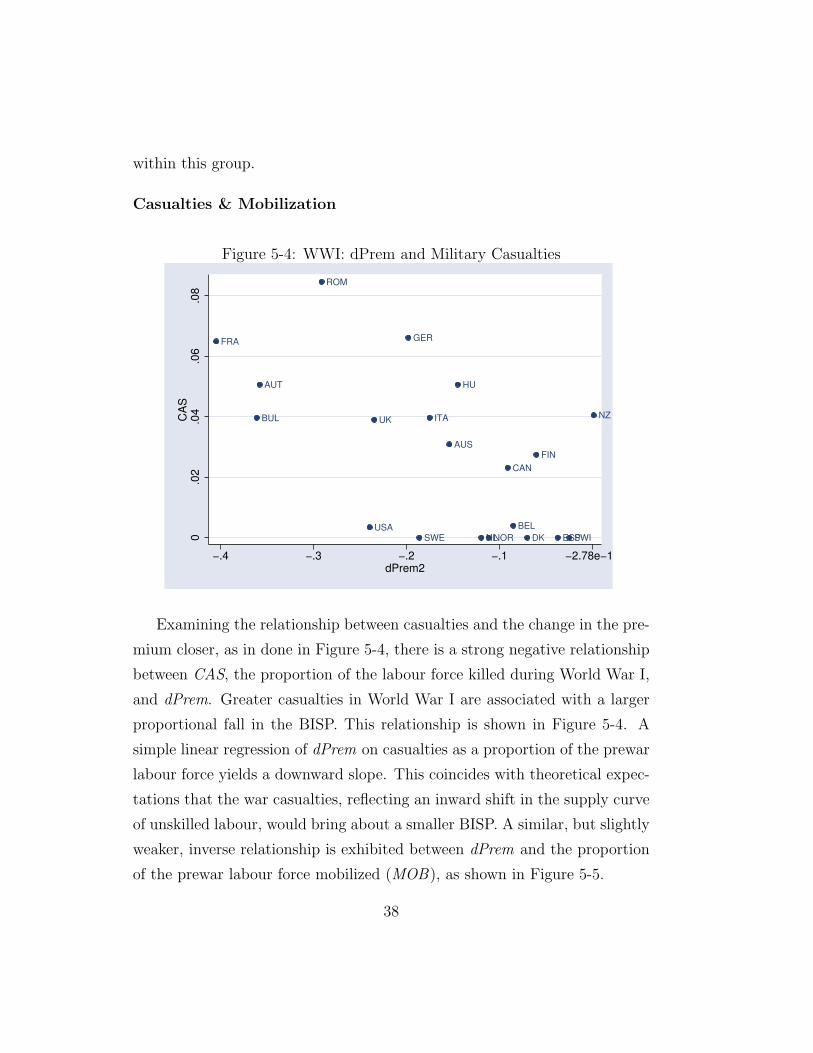
Casualties & Mobilization
Figure 5-4: WWI: dPrem and Military Casualties
AUS
AUT
BEL
BUL
CAN
DK
FIN
FRAGER
HU
ITA
NL
NZ
NOR
ROM
ESPSWE SWI
UK
USA
0.0
2.0
4.0
6.0
8
CA
S
−.4 −.3 −.2 −.1 −2.78e−17
dPrem2
Examining the relationship between casualties and the change in the pre-
mium closer, as in done in Figure 5-4, there is a strong negative relationship
between CAS, the proportion of the labour force killed during World War I,
and dPrem. Greater casualties in World War I are associated with a larger
proportional fall in the BISP. This relationship is shown in Figure 5-4. A
simple linear regression of dPrem on casualties as a proportion of the prewar
labour force yields a downward slope. This coincides with theoretical expec-
tations that the war casualties, reflecting an inward shift in the supply curve
of unskilled labour, would bring about a smaller BISP. A similar, but slightly
weaker, inverse relationship is exhibited between dPrem and the proportion
of the prewar labour force mobilized (MOB), as shown in Figure 5-5.
38

Figure 5-5: WWI: dPrem and Mobilization
AUS
AUT
BEL
CAN
DKFIN
FRA
GER
HU
ITA
NL
NZ
NOR
ROM
ESPSWE SWI
UK
USA
0.1
.2.3
.4
MO
B
−.4 −.3 −.2 −.1 −2.78e−17
dPrem2
Inflation, the Government & Unionization
One may question, however, the extent to which these falls are reflecting the
actual effect of war casualties, or are merely collinear with some other effect of
war, such as inflation, government intervention or unionization. These three
are shown in Figures 5-6, 5-7 and 5-8. Given the heavy inflations experienced
by some countries, the relationship between dPrem and the change in the cost
of living is not as straight-forward as suggested by Bry (1960) and Dunlop
& Rothbaum (1955). Taking the log of price changes [ln(dp)], as is shown in
Figure 5-6, there exists a negative relationship, i.e. the greater the rate of
change in prices (over 1914), the greater the fall in dPrem.
A similar, although somewhat stronger, negative relationship exists be-
tween a proxy for government control of the economy, i.e. average real an-
nual government expenditure as a proportion of the pre-war national income
39

Figure 5-6: WWI: dPrem and Inflation
AUS
AUT
BEL
BUL
CAN
DK
FIN
FRA
GER
ITA
NL NZ
NOR
ESP
SWE
SWIUK
USA
01
23
4
lndP
−.4 −.3 −.2 −.1 −2.78e−17
dPrem2
Figure 5-7: WWI: dPrem and Government Expenditure
AUS
AUT
CAN
DK
FRA
GER
ITA
NL
NZ
NOR
ESPSWE
SWI
UK
USA
0.2
.4.6
.8
AvG
−.4 −.3 −.2 −.1 −2.78e−17
dPrem2
40

(AvG). An aside is that Austria is a significant outlier, which may perhaps
be a function of the imprecision of cost-of-living changes from year to year
in that country.
Figure 5-8: WWI: dPrem and Unionization
AUS
AUT
BEL
BUL CAN
DK
FINFRA
GER
HU
ITA
NL
NZ
NOR
ROM
ESP
SWE
SWI
UKUSA
02
46
dT
U2
−.4 −.3 −.2 −.1 −2.78e−17
dPrem2
Lastly, regarding union strength, using the proportion of the labour force
that are members of unions to measure that strength throws up some in-
teresting results. Despite the prominence of trade unions in the literature,
and the theoretical expectation that their strength might reduce skill premi-
ums, there is no convincing evidence from a first look at the data. Growth
in unions is measured as the change in unionization as a proportion of the
prewar level of unionization. A very weak upward linear relationship ex-
ists, contrary to such expectations as outlined above, suggesting indeed that
greater union growth might lead to smaller changes in the premium.3
3It is possible that this is due to more unionized countries (in 1913) being unable to
41

Education
Figure 5-9: WWI: dPrem and Changes in Enrolment
AUS
AUT
BEL
BUL
CANDK
FIN
FRA
GER
HU
ITA
NL
NZ
NORESP
SWESWI
UKUSA
0.1
.2.3
dE
du2
−.4 −.3 −.2 −.1 −2.78e−17
dPrem2
Plotting changes in the premium and lagged changes in enrolment rates,
as is done in 5-9, shows a couple of significant outliers, notably Finland,
Bulgaria and New Zealand, all of whom have very different labour market
experiences over the period covered. For the bulk of countries, there is little to
suggest a strong relationship between higher enrolment increases and larger
proportional falls in the premium.
42

Figure 5-10: WWI: dPrem and the Changing role of Agriculture
AUS BEL
BUL
CAN
DK
FIN
FRA
GER
HU
ITA
NL
NZ
NOR
ESP
SWE
SWI
UKUSA
−.2
−.1
0.1
.2dA
gri
−.4 −.3 −.2 −.1 −2.78e−17dPrem2
Figure 5-11: WWI: dPrem and Industrial Output
AUS
AUT
BEL
CAN
DK
FIN
FRAGER
HU
ITANL
NZ
NOR
ROM
ESPSWE
SWI
UK
USA
.4.6
.81
1.2
1.4
dP
rod
−.4 −.3 −.2 −.1 −2.78e−17
dPrem2
43

Industrialisation & Aggregate Demand
Other factors that may affect changes in the skill premium include the struc-
ture and industrialisation of an economy and the demand side of an economy.
Higher proportions of the labour force in the agricultural sector are associ-
ated with lower levels of development, themselves associated with greater
skill premiums. Therefore, a shift out of agriculture may be associated with
a large fall in the skill premium. This relationship is explored in Figure 5-
10, where dAgri represents the proportional change in the percentage of the
labour force engaged in agriculture. The result is a clear positive relation-
ship, indicating the more an economy moved away from agriculture in the
period, the more its premium fell.4
Lastly, turning to the demand-side of the economy, a theoretical expec-
tation may be that times of increasing demand, associated with full employ-
ment, would be correlated with lower skill premiums, as firms have to pay
higher wages to attract unskilled labour. However, as is shown in Figure 5-
11, an opposite relationship appears to be the case over this time period. It
could be argued that manufacturing indices may not be capturing demand,
as much as they are changes in the structure of the economy. Using per
capita rail freight, however, reveals a similar (if slightly weaker) trend. This
would appear to suggest that in the postwar period, perhaps after years of
slack demand for more skilled workers such as bricklayers as private building
projects ground to a halt (cf. Manning (1999)), the resumption of regular
economic activity stimulated demand for traditional building skills.
show the same proportional growth and yet still agitating for change successfully. Takingthe raw percentage increases in unionization does change the slope; however, the R2 isless that 0.5%. Using the number of strikes during 1919 and 1920 (weighted by 100,000 ofpopulation) instead, lastly, also reveals an upward slope. Thus, the expected successes oftrade unions in achieving lower BISPs is hard to show.
4Omitting France, whose agriculture sector was quite resilient in the period 1911-1921,and Bulgaria, which appears to be in the same situation, more than doubles the R2 of asimple linear regression to 40%.
44

Summary
The overwhelming majority of countries experienced compression in the wage
structure, often considerable, as measured by the building industry skill pre-
mium, during the period 1914-1920. On average, neutral countries experi-
enced a smaller proportional decline in the premium than warring countries,
and among warring countries, defeated countries experienced greater propor-
tional falls.
There exist inverse relationships between the proportional change in the
premium and the extent of government expenditure, war casualties, mobiliza-
tion and inflation (with those relationships progressively weakening). There
appears to exist no definite relationship between change in union strength
and the premium, contrary to expectations, while there is strong evidence to
suggest a positive relationship between changes in the premium and indus-
trialization and aggregate demand.
5.2 Trends from the Second World War
Figures 5-12 to 5-14 outline the change in the skill premium, as according to
the three different measures, and are the counterparts to Figures 5-1 to 5-3.
Figure 5-12 outlines the proportional change in the skill premium between
1938 and 1946, expressed in terms of the prewar premium, for all countries.
The most noticeable difference from the equivalent figure from the first World
War is that increases in the premium are more common — more than a
quarter (7) of all skill premiums rose during the period, as opposed to the
single negligible case after the earlier war.
There is greater variability among the three different measures for World
War II than World War I. In particular, going by proportional changes in
the premium, as is done in Figure 5-13, the increase in the Finnish premium
from 6% to 28% presents a major outlier in the series. Similarly, the high
45

Figure 5-12: Proportional Change in Wage Ratio, World War II
-0.40
-0.30
-0.20
-0.10
0.00
0.10
0.20
0.30
0.40
ARGAUS
AUTBEL
CANCHI
DKFIN
FRAGER HU
IRE
ITA
LUX NL NZNO
RPAL
PORRO
M SASW
ESW
IUK
USA
Figure 5-13: Proportional Change in Skill Premium, World War II
-1.00
-0.50
0.00
0.50
1.00
1.50
2.00
2.50
3.00
3.50
4.00
ARGAUS
AUTBEL
CANCHI
DKFIN
FRAGER HU
IRE
ITA
LUX NL NZNO
RPAL
PORRO
M SASW
ESW
IUK
USA
46

level of the South African premium in 1939 means a large range for possible
decreases. Even though the proportional fall was not huge, the percentage
fall dwarves the others.
Figure 5-14: Percentage Change in Skill Premium, World War II
-2.50
-2.00
-1.50
-1.00
-0.50
0.00
0.50
ARGAUS
AUTBEL
CANCHI
DKFIN
FRAGER HU
IRE
ITA
LUX NL NZNO
RPAL
PORRO
M SASW
ESW
IUK
USA
Table 5.2: WWII: dPrem by country groups
Victors Occupied Defeated NeutralPalestine −0.322 Denmark −0.121 Romania −0.266 Portugal −0.115S. Africa −0.267 N/lands −0.010 Italy −0.195 Argentina −0.097
USA −0.202 Belgium 0.035 Austria −0.144 Switz. −0.074Canada −0.150 Norway 0.063 Hungary −0.115 Ireland −0.066
UK −0.064 Lux. 0.076 Finland 0.210 Sweden −0.028Australia −0.055 France 0.106 Germany 0.235 Chile 0.249New Z’d −0.037Average −0.157 0.025 −0.040 −0.022St.Dev. 0.112 0.082 0.224 0.136
47

Table 5.2 is the counterpart to Table 5.1, and gives the average propor-
tional change in the skill premium of four groups: victors, occupied countries,
defeated powers and neutral countries.5 Firstly, the variances of the four
groups differ substantially. Of the Axis powers, Germany and Finland [not
even an Axis power as such] underwent large increases, while other defeated
countries underwent large falls. Chile is a similar outlier among non-aligned
countries. Omitting Chile yields a standard deviation among neutral coun-
tries that is significantly smaller than all other groups (0.033). Occupied
countries saw their premium on average increase, while non-occupied victors
underwent the largest falls on average.
Casualties & Mobilization
Figure 5-15: WWII: dPrem and Military Casualties
ARG
AUS
AUT
BEL
CAN
CHIDK
FIN
FRA
GER
HU
IRE
ITA
NL
NZ
NORPOR
ROM
SA SWESWI
UK
USA
0.0
5.1
.15
MIL
D
−.4 −.2 0 .2
dPrem2
5Technically, not all countries fought on one side for the whole war, however countries’primary role has been used here.
48

Figure 5-16: WWII: dPrem and Civilian Casualties
ARG AUS
AUT
BEL
CAN CHIDKFIN
FRA
GERHU
IRE
ITA
NL
NZ
NOR
POR
ROM
SA SWESWI
UK
USA0.0
1.0
2.0
3
CIV
D
−.4 −.2 0 .2
dPrem2
In Figure 5-15, the change in the premium is shown against the numbers
of military deaths as a proportion of the labour force. Unlike the trends from
the earlier war, there is little in the way of definite trends. There are also
significant outliers, but even omitting these reveals little of interest. The
same is true for a scatter of dPrem on the proportion of the population
recorded as civilian deaths, which might be expected not only to capture
labour supply effects, but also destruction of capital stock, infrastructure,
etc.
Looking at the ratio of civilian to military casualties, which may also
capture this effect, suggests some weak evidence for a smaller reduction (or
larger increase) in the premium, the higher the ratio. Finally, looking at
the proportion of the labour force mobilized into the military, it seems that
neutral countries’ changes occur within a much more narrow band than those
involved in the war. Also, countries such as South Africa and Canada are at
49

Figure 5-17: WWII: dPrem and Civilian-Military Casualty Ratio
ARG AUS
AUT
BEL
CAN CHIDK
FIN
FRA
GER
HU
IREITA
NL
NZ
NOR
POR
ROM
SA SWESWIUK
USA05
10
CIV
MIL
−.4 −.2 0 .2
dPrem2
Figure 5-18: WWII: dPrem and Mobilization
ARG
AUS
AUT
BEL
CAN
CHIDK
FRA
GER
IRE
NL
NOR
POR
SA
SWESWI
UK
USA
0.1
.2.3
.4.5
MO
B
−.4 −.2 0 .2
dPrem2
50

one end of the spectrum, while hosts of the war, such as France and Germany,
are at the other. This issue of destruction of infrastructure and the change
in premium is explored in more detail when looking at war and war hosts, in
Section 6.1.
Inflation & Unionization
Figure 5-19: WWII: dPrem and Changes in the Price Level
ARG
AUS
AUTBEL
CAN
CHI
DK
FIN
FRA
GER
HU
IRE
ITA
NL
NZNOR
POR
ROM
SA SWESWIUK
USA
02
46
8
lndP
−.4 −.2 0 .2
dPrem2
There are no apparent trends related to price changes and changes in skill
premiums. While it is true that countries with large inflationary periods, such
as Romania and Italy, experienced significant relative falls in the premium,
others with significant inflation, such as France, Finland and Chile, actually
exhibit some of the largest increases.
Regarding changes in union density, it will be recalled that there appeared
to be no significant relationship between changes in union density and the
51

Figure 5-20: WWII: dPrem and Changes in Union Density
AUS
BEL
CAN
DKFRA
GER
IRE
NL
SWE
SWIUK
USA
−.5
0.5
1
dT
U1
−.4 −.2 0 .2
dPrem2
skill premium during World War I. For World War II, data are only available
for twelve countries. Disregarding the USA and Ireland, it would seem that
for World War II, greater growth in unions was indeed correlated with larger
falls in the skill premium, as suggested by comparing the experiences of
Canada and Australia to those of Belgium and Germany.
Evidence from number of strikes per hundred thousand of the labour force
and from days lost per thousand persons employed in mining, industry and
transport yields little in the way of further insight. However, looking at the
level of union density across 13 countries, as an indicator of the strength of
social bargaining institutions, as is done in Figure 5-21, seems to confirm
that the greater the union density, the larger the fall in the skill premium.
Interestingly, Canada has the lowest density, suggesting that the increases
from a lower level may be correlated with larger falls. The issue of unions
52

Figure 5-21: WWII: dPrem and 1950 Union Density
AUS
AUT
BEL
CAN
DK
FRA
GERIRE
ITA
NL
NOR
SWE
SWIUK
USA
.3.4
.5.6
.7
lTU
50
−.4 −.2 0 .2
dPrem2
and of the strength of wage-setting institutions is returned to in Section 6.3.
Education
In most countries, lagged educational enrolment on average rose, comparing
1938 and 1946.6 For the majority (13) of the countries, educational enrol-
ment rose while the premium fell, and for 2 countries, the opposite occurred,
suggesting at least mild support for the hypothesis that increased educational
attainment on average lowers the skill premium. However, the overall pic-
ture is far from clear, with some countries, particularly war hosts, bucking
the trend.
6Where possible, educational enrolment rates are lagged 10 years to capture the de-layed effects on the labour supply curves. This was not possible for Argentina and Chile.Changes between prewar and postwar enrolment rates were used instead.
53
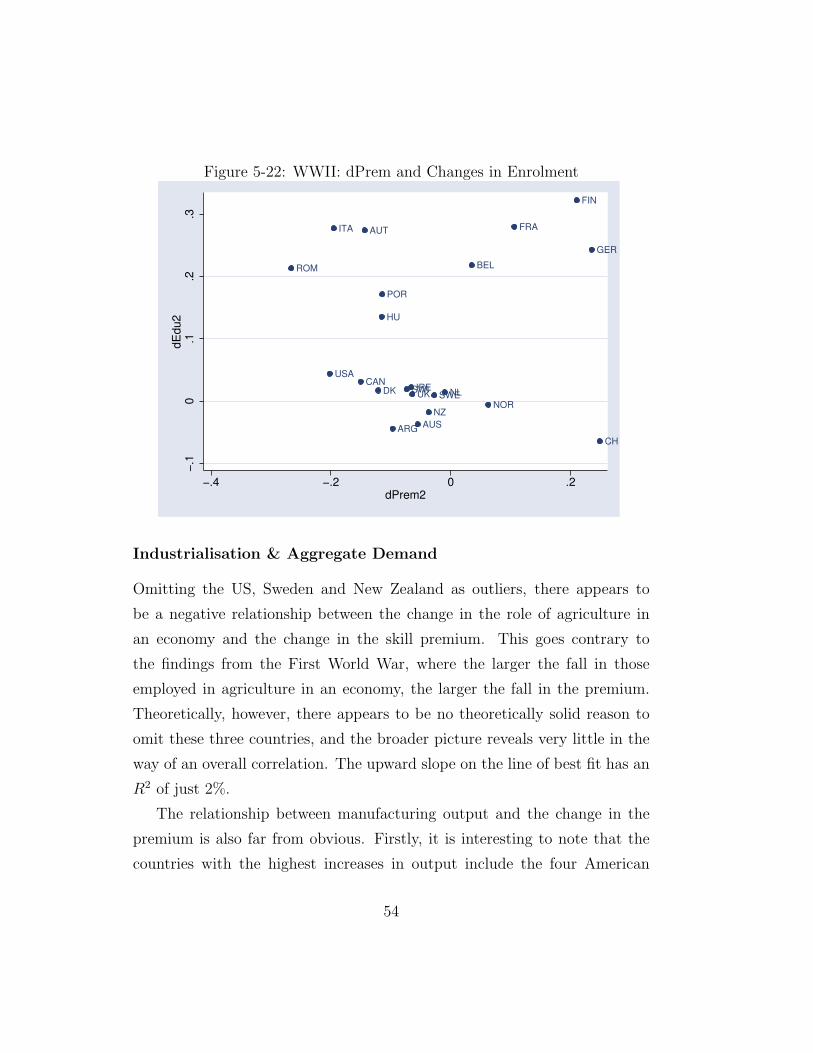
Figure 5-22: WWII: dPrem and Changes in Enrolment
ARGAUS
AUT
BEL
CAN
CHI
DK
FIN
FRA
GER
HU
IRE
ITA
NL
NZNOR
POR
ROM
SWESWI
UK
USA
−.1
0.1
.2.3
dE
du2
−.4 −.2 0 .2
dPrem2
Industrialisation & Aggregate Demand
Omitting the US, Sweden and New Zealand as outliers, there appears to
be a negative relationship between the change in the role of agriculture in
an economy and the change in the skill premium. This goes contrary to
the findings from the First World War, where the larger the fall in those
employed in agriculture in an economy, the larger the fall in the premium.
Theoretically, however, there appears to be no theoretically solid reason to
omit these three countries, and the broader picture reveals very little in the
way of an overall correlation. The upward slope on the line of best fit has an
R2 of just 2%.
The relationship between manufacturing output and the change in the
premium is also far from obvious. Firstly, it is interesting to note that the
countries with the highest increases in output include the four American
54

Figure 5-23: WWII: dPrem and the Changing Role of Agriculture
AUS
AUT
BEL
CAN
CHI
DK
FIN
FRA
GER
HU
IRE
ITA
NL
NZ
NOR
POR
ROM
SWE
SWI
UK
USA
−.3
−.2
−.1
2.7
8e−
17
.1dA
gri
−.4 −.2 0 .2dPrem2
Figure 5-24: WWII: dPrem and Manufacturing Production
ARG
AUT
BEL
CAN
CHI
DK
FIN
FRA
GER
HU
IRE
ITA
NL
NZ
NOR
ROM
SA
SWE
UK
USA
.81
1.2
1.4
1.6
1.8
dP
rod
−.4 −.2 0 .2
dPrem2
55

countries, South Africa and New Zealand. Three of these experienced large
falls in their premium. Theory suggests that at times of high output and
full employment, the premium will diminish. Both in an overall sense, and
just looking at European countries, there appears to be only at best a gentle
negative relationship between output and the premium, to confirm this.
Figure 5-25: WWII: dPrem and the Change in Unemployment
AUS
AUT BELCAN
CHI
DK
FIN
FRA
IRE
ITA
LUX
NL
NOR
POR
SA
SWE
SWI
UKUSA
0.5
11.5
2
dU
E
−.4 −.2 0 .2
dPrem2
Data on unemployment were still less than complete at the time of the
second World War. However, that said, the situation had vastly improved
compared to unemployment statistics available in 1914 and 1920. Outlined in
Figure 5-25 is the correlation between proportional changes in the premium
and changes in unemployment, 1937 and 1946 (or later where relevant). Once
again, however, no obvious relationship emerges from the data available.
56

Summary
Overall, the breadth of experiences during World War II appears to preclude
any straightforward observations regarding relationships between skill pre-
miums and the suggested variables. Neutral countries appear to have under-
gone less dramatic changes than belligerents, while war hosts and occupied
countries fared differently to those who fought from a distance. Inflation,
strike activity and enrolment in education have no systematic relationship
with changing premiums from 1938 to 1946. The same is true for the role
of agriculture, manufacturing output and unemployment. However, stronger
levels of union density does appear to be associated with larger falls in the
premium.
5.2.1 The Relationship Between the Wars
To what extent were falls in the premium during the second World War
related to those in the First World War? That is, if a country had undergone
a large transformation during the 1914-20 period, might that have reduced its
capacity to adapt during the second World War. This is explored in Figures
5-26 and 5-27, the first of which shows a scatter of the change in premiums
from both wars.7 It is obvious that there is a general upward relationship,
apart from two outliers, France and Germany (both hosts to World War).
The R2 of a simple linear regression improves from barely above zero (all
countries) to 27% (less France and Germany). This suggests similar ordinal
experiences for a country across wars — i.e. those countries experiencing a
relatively larger fall in their premium in World War One were in general in
the same ranking in World War Two.
Another way of looking at this is examining whether “room for manoeu-
vre” is a factor. A country with a relatively high skill premium has a large
7Countries covered are the sixteen for which building industry data are available forboth World Wars.
57

Figure 5-26: X-Y Scatter: dPrem from both Wars
AUS
AUT
BELCAN
DK
FRA
GER
HU
NL
NZ
NOR
ROM
SWE
SWI
UKUSA
−.4
−.3
−.2
−.1
−2.7
8e−
17
dP
rem
WW
1
−.4 −.2 0 .2
dPrem2
range of potential lower values, while countries with relatively compressed
wage structures cannot undergo a similar change, even in proportion, as it
has already “bottomed out”.8 This relationship is shown in Figure 5-27.
There is a strong downward slope (with an R2 of 47.9%), suggesting that
countries with higher premiums in 1920 did indeed experience larger propor-
tional falls during the Second World War. Removing Germany, once again
an outlier, improves the fit of the line to 55%.
5.3 Comparing the Effects of the Two Wars
Looking just at countries for which data are available for both wars, of which
there are 18, there are three interesting conclusions. Firstly, of the 18, there
are only four countries (Hungary, Italy, Romania and the US) that experience
8This holds true moreso with the measurement of ratios than with of strict premiums.
58

Figure 5-27: X-Y Scatter: dPrem2 & the Level of the Premium, 1920
AUS
AUT
BEL
CAN
DK
FRA
GER
HU
NL
NZ
NOR
ROM
SWE
SWI
UK
USA
11.2
1.4
1.6
1.8
2
Pre
m1920
−.4 −.2 0 .2
dPrem2
similar effects in both wars, in terms of both sign and size. This is reconciled
with the finding from Figure 5-26 by noting that, for the group as a whole,
the range of values has changed and new axes have been added.
Secondly, only the Second World War was associated with increasing
labour market inequality (as measured by the skill premium) in an economy.
For some of the European core (Belgium, France, Germany) and some of
Scandinavia (Finland, Norway), the latter war increased the skill premium,
unlike World War I. Only in New Zealand, and then just barely, did the
premium increase in the earlier period and then decrease in the latter.
Lastly, and following on from this, the First World War produced the
greater proportional compression. For two-thirds of the countries, there was
either an increase in the skill premium during the Second World War, or else a
smaller proportional compression. In only three countries (Canada, Denmark
59

Figure 5-28: Comparing the effects of the Wars in 18 Countries
-0.50
-0.40
-0.30
-0.20
-0.10
0.00
0.10
0.20
0.30
AUSAUT
BELCAN DK
FINFRA
GER HUIT
A NL NZNOR
ROMSW
ESW
IUK
USA
WW1
WW2
and Switzerland) did the second World War have a significantly greater effect
in compressing the skill premium. In countries such as Australia, Austria and
the UK, for example, the first World War reduced the skill premium by a
greater proportion.
5.3.1 A Note on International Convergence
An interesting question is the extent to which, if at all, the wars helped bring
about international convergence in the skill premium. Did the wars hasten
the development of an international lower bound to skill premiums to which
economies converge as they develop, and if so, which had the greater effect?9
Insights into answering this question are shown in Table 5.3, which is
based on the 18 countries available for both wars. As can be seen, the
(unweighted) average premium is at its highest before World War I and at
9Recent ILO October survey data show large convergence of OECD economies arounda building industry skill premium of about 10%.
60

Table 5.3: International Convergence and the Wars
World War I World War IIMeasure Prewar Postwar Prewar Postwar
Average premium 1.632 1.342 1.470 1.365Coeff of variation 0.296 0.254 0.329 0.233
its lowest in 1920. By 1938, it had risen again, but had not returned to
pre-WWI levels. Its fall during World War II was significant, but still did
not reduce the mean premium to the levels of 1920.
Looking at the variance however, as measured by the coefficient of varia-
tion (CV), the highest CV for the 18 countries was actually in 1938. In 1914,
the average premium was higher and it was also less spread out (proportion-
ately, as is measured by the CV, which weights by the mean). In 1938, the
average was lower and more spread out, meaning a greater likelihood that
some countries had low skill premiums. The CV for 1946 is the lowest, below
that of 1920, meaning that the spread of premiums was at its lowest then
of the four dates under investigation. Both wars lowered the average skill
premium across economies, in particular the First World War, and both wars
brought convergence in the international spread of premiums, in particular
the Second World War.10
5.3.2 A Note on the Interwar Period
With the four data points available, an initial exploration can be made re-
garding the impact on labour markets of the interwar period, and how it
compares to the effects of the two World Wars. This is done in Figure 5-29,
omitting Finland and Italy, whose 1920 figures, as discussed, are of a different
nature to their 1938 figures. Three conclusions emerge.
10These findinds are also valid if the latter dataset is expanded to include all 25 countriesavailable for World War II.
61

Figure 5-29: Comparing the Wars and the Interwar Period
-0.50
-0.40
-0.30
-0.20
-0.10
0.00
0.10
0.20
0.30
0.40
0.50
AUSAUT
BELCAN DK
FRAGER HU NL NZ
NORROM
SWE
SWI
UKUSA
WW1 WW2 Interwar
Firstly, the interwar period differs from the two wars in that increasing
premiums were the rule, rather than the exception. The premium increased
in three-quarters of the countries. Indeed, for twelve of the sixteen countries,
the interwar period was one of least pressure for labour market compression.11
Secondly, the whole period 1914-1946 was one of much change in the
labour market structures, if building industry data are valid indicators. Only
New Zealand, and to a lesser extent the Netherlands and Switzerland, show
very little change over the period under examination, in sharp contrast to
the majority of countries.
Thirdly, in terms of the typical effect of the three periods, a definite
ordinal ranking emerges. The First World War placed the greatest down-
ward pressure on the skill premium (an unweighted average fall of 16.9%,
11That is to say, the only period of increasing premiums (8 of the 12 countries), theperiod with greatest upward change in the premium (2 countries), or the period with thesmallest proportional fall (2).
62

proportionately). The Second World War is next in rank, with an average
proprtional fall of just 5.2%. The interwar period, on the other hand, was wit-
ness to an average increase, proportionately, of 13.3%. These figures, albeit
limited indicators of internal inequality, are in sharp contrast to the findings
of Milanovic (2003). Basing his results on between-country inequality mea-
sures, he concluded that war fuelled inequality, while the interwar period was
actually one of convergence. These preliminary findings on within-country
inequality suggest the opposite to be the case.
5.3.3 Comparing 1914 and 1946
The four data points also allow a comparison of skill premiums in the building
industry in 1914 and 1946, after 32 years of unprecedented economic turmoil.
The percentage change in the wage ratio, as a proportion of the 1914 ratio,
is shown in Figure 5-30. As can be seen, by far the largest fall occurs in
Romania, followed by Hungary and Austria. Over the whole period, the
premium fell in the majority of countries, but rose in two of the European
core, Belgium and Germany, who had second and fourth lowest premiums in
1914 but only the seventh and nineth lowest in 1946. In both Belgium and
Germany, of the three periods outlined in Section 5.3.2, only World War I
was associated with a fall in the premium.
Comparing 1914 and 1946, the premium also rose in Australia and Canada,
entirely a product of interwar growth in the premium. Another European
offshoot, the USA, also saw falls in the premium during the Wars mostly
undone by large interwar growth of the premium. Overall, across countries,
the unweighted average change in the premium was a fall of over one-ninth
(11.6%).
63

5.4 Summary of Stylised Facts
Both World Wars were times of widespread compression of labour markets
structures, as measured by the ratio of wages of bricklayers to labourers in
the building industry. Of the two wars, the First World War had the greater
downward pressure on the skill premium, on average, with no country show-
ing a substantial increase in the premium after the war. The Second World
War typically also decreased the premium. However, there was greater vari-
ation in the changes in the latter period, with seven countries experiencing
an increase in the premium.
In terms of relationships, the First World War suggests a range of poten-
tial relationships. Countries that lost more soldiers in war, whose govern-
ments played a larger role in the economy, that experienced greater increases
in the cost of living and that mobilized more troops experienced larger falls
in their skill premiums, as a general rule. Similarly, the more a country in-
dustrialized, the greater its fall in the premium. On the other hand, looking
across all twenty countries, unions appear to have played no systematic role
in the determination of changes in the skill premium. Lastly, an upswing in
industrial output is associated with lesser, not greater, falls in the premium.
The Second World War, however, shows little in the way of clear relation-
ships between these variables and the change in the skill premium. Neutral
countries underwent less dramatic changes than belligerents, while of those
at war, hosts often saw their premium increase, while the larger falls tended
to be in countries far away from the conflict. The postwar strength of unions
also seems to be positively related to the fall in premiums.
While the unweighted average skill premium was lower after the First
World War, the spread of skill premiums was tighter in the late 1940s than
in 1920, suggesting some international convergence in premiums. Lastly,
comparing the World Wars with the interwar period shows that the two wars
64

have much in common. The interwar period saw increasing skill premiums,
as a general rule, unlike both World Wars. These increases between 1920
and 1938 meant that the premium was actually higher in 1946 than in 1914
in Canada and Australia, and (coupled with increases in World War II) in
Belgium and Germany. Overall, though, the premium across the sixteen
countries fell between 1914 and 1946, by on average 11.6%.
65

Figure 5-30: Building Industry Skill Premiums, 1914 to 1946
-0.50
-0.40
-0.30
-0.20
-0.10
0.00
0.10
0.20
0.30
AUS AUT BEL CAN DK FRA GER HU NL NZ NOR ROM SWE SWI UK USA
66

Chapter 6
Model & Results
67

6.1 The Role of War and Hosting War
Outlined in 2.2 are various hypotheses regarding the potential impact of the
wars. The first hypothesis concerns the effect of being part of a war, of
greater military or civilian casualties, etc. The second is whether hosts of
the war were affected in a different manner to other participants. In this
section, the role of war and hosting war is explored, across both World Wars.
For the First World War, a simple regression of dprem on two categorical
variables, whether the country was at war or not, and whether it hosted the
war (for World War I, only France and Belgium were deemed to have “hosted”
the war) is shown in Table 6.1. As both the Breusch-Pagan and White tests
advised rejecting the null of constant variance, robust standard errors are
presented. This elementary regression indicates that war did indeed have a
significant downward effect on skills premiums. On the other hand, although
the coefficient is also negative, hosting the war does not appear to have had
a statistically significant effect on skill premiums.
Table 6.1: World War One: the Impact of War and Hosting War
Source SS df MS Number of obs = 20— — — — F( 2, 17) = 2.20
Model .053966868 2 .026983434 Prob > F = 0.1411Residual .20833207 17 .012254828 R-squared = 0.2057
— — — — Adj R-squared = 0.1123Total .262298938 19 .013805207 Root MSE = .11070
dprem Coeff. Std.Err. t P>t 95% Conf. Int.host −.0528627 .1271288 −0.42 0.683 −.321081 .2153556war −.1006547 .0415458 −2.42 0.027 −.1883088 −.0130007
c −.0915253 .0451937 −2.03 0.059 −.1868757 .003825
For the Second World War, the two hypotheses outlined above are ex-
plored through the same elementary regression of dPrem on two categorical
variables, war and host, this time for the twenty-five countries available for
68

that war, outlined in 6.2. With a constant of zero, or very close thereto, tak-
ing part in the war means a bigger fall (or smaller increase) in the premium
than was the case for neutral countries. Secondly, being a host to World
War II, in addition to just taking part, meant a higher premium than would
otherwise be the case. This suggests two potential explanations. Firstly,
it could be that there is a degree of substitutability between capital and
skilled labour, with higher relative demand for skilled trades where capital
destruction was greater. This would tie in with the literature on changing
management structures during the period 1900-1950, where capital and un-
skilled labour in tandem made many traditional skilled trades more obsolete.
Secondly, it could be that host countries were in greatest need of physical
reconstruction and thus had greatest demand for skilled building trades.
Table 6.2: World War Two: the Impact of War and Hosting War
Source SS df MS Number of obs = 25— — — — F( 2, 22) = 3.01
Model .117660590 2 .058830295 Prob > F = 0.0700Residual .430252003 22 .019556909 R-squared = 0.2147
— — — — Adj R-squared = 0.1434Total .547912593 24 .022829691 Root MSE = .13985
dprem Coeff. Std.Err. t P>t 95% Conf. Int.host .1493033 .0655608 2.28 0.033 .0133384 .2852681war −.1607543 .0818854 −1.96 0.062 −.3305743 .0090657
c −.0031586 .062541 −0.05 0.960 −.1328607 .1265436
In terms of regression diagnostics, the residuals for both regressions are
distributed close to the normal distribution, but for World War I the distri-
bution has fatter tails. For World War II, the distribution peaks earlier and
has a fatter end tail. Sample size must be borne in mind also, though. Tests
indicate that multicollinearity is not an issue, while heteroscedasticity is not
present in the World War II regression.
The regressions suggest the following narrative. Belligerents experienced
69

a greater proportional fall in the premium than neutrals. This holds true
for both wars. Hosts to the war, however, fared differently in both wars. In
World War I, to the extent to which the effect is significant, hosts’ premiums
fell by an even more. In World War II, however, hosts had a smaller fall or
greater increase in the premium than other warring countries. This difference
in effects of hosting war suggests the importance of distinguishing between
the nature of the wars. The First World War was a more conventional war
with fronts, while the later war was one of widespread capital destruction and
civilian casualties, the first of its kind. In labour market terms, economies
destroyed by World War II and rebuilding themselves in the early postwar
period needed to attract skill moreso than mere partakers in war from a
distance.
As mentioned, though, belligerents experienced on average greater falls.
This leads to the question as to the channels through which this worked.
Was it through greater government control of the economy, through military
and civilian casualties, through inflation, structural changes in the economy,
or some combination of these factors?
6.2 Explaining the Impact of War
6.2.1 The First World War
The cross-section for the first World War consists of twenty countries1, with
missing observations for certain variables a problem for Bulgaria and Roma-
nia in particular, but also with the number of strikes and average government
expenditure unavailable for three countries each.
Outlined in 6.3 is a fuller model of the effects of World War I on the skill
premium. pr1914 is the size of the skill premium in 1914, while cas is the
1These are: Australia, Austria, Belgium, Bulgaria, Canada, Denmark, Finland, France,Germany, Hungary, Italy, the Netherlands, New Zealand, Norway, Romania, Spain, Swe-den, Switzerland, the UK and the USA.
70
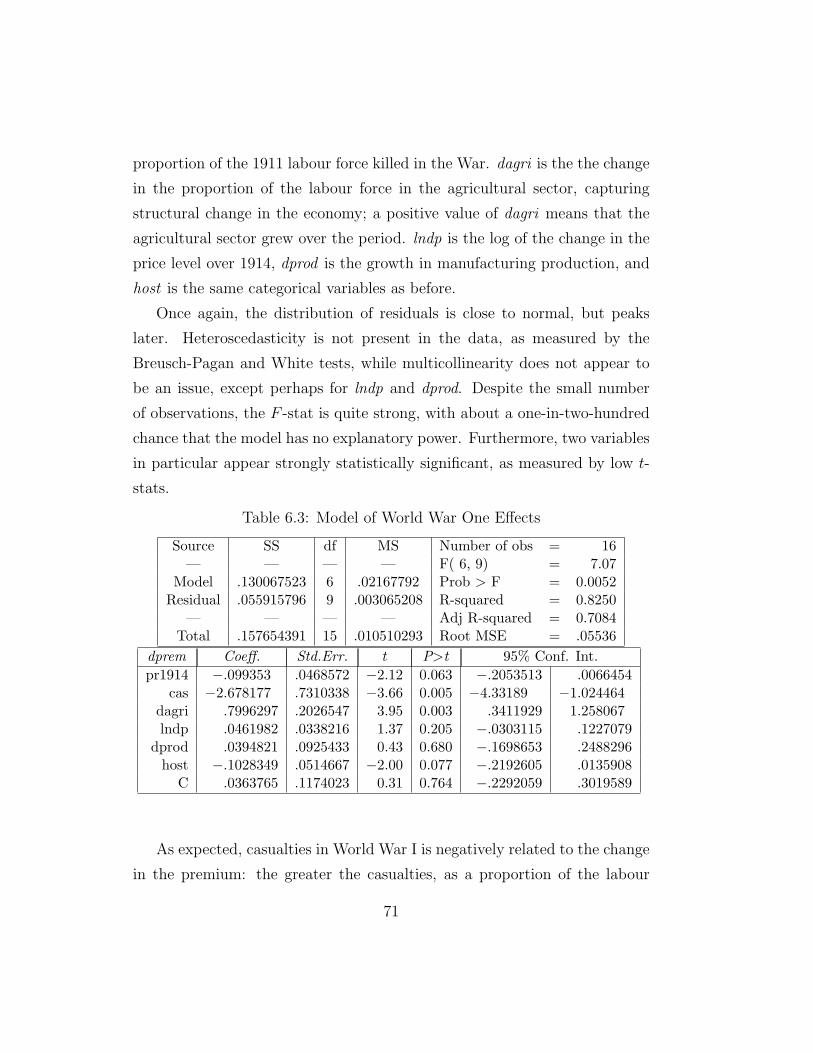
proportion of the 1911 labour force killed in the War. dagri is the the change
in the proportion of the labour force in the agricultural sector, capturing
structural change in the economy; a positive value of dagri means that the
agricultural sector grew over the period. lndp is the log of the change in the
price level over 1914, dprod is the growth in manufacturing production, and
host is the same categorical variables as before.
Once again, the distribution of residuals is close to normal, but peaks
later. Heteroscedasticity is not present in the data, as measured by the
Breusch-Pagan and White tests, while multicollinearity does not appear to
be an issue, except perhaps for lndp and dprod. Despite the small number
of observations, the F -stat is quite strong, with about a one-in-two-hundred
chance that the model has no explanatory power. Furthermore, two variables
in particular appear strongly statistically significant, as measured by low t-
stats.
Table 6.3: Model of World War One Effects
Source SS df MS Number of obs = 16— — — — F( 6, 9) = 7.07
Model .130067523 6 .02167792 Prob > F = 0.0052Residual .055915796 9 .003065208 R-squared = 0.8250
— — — — Adj R-squared = 0.7084Total .157654391 15 .010510293 Root MSE = .05536
dprem Coeff. Std.Err. t P>t 95% Conf. Int.pr1914 −.099353 .0468572 −2.12 0.063 −.2053513 .0066454
cas −2.678177 .7310338 −3.66 0.005 −4.33189 −1.024464dagri .7996297 .2026547 3.95 0.003 .3411929 1.258067lndp .0461982 .0338216 1.37 0.205 −.0303115 .1227079
dprod .0394821 .0925433 0.43 0.680 −.1698653 .2488296host −.1028349 .0514667 −2.00 0.077 −.2192605 .0135908
C .0363765 .1174023 0.31 0.764 −.2292059 .3019589
As expected, casualties in World War I is negatively related to the change
in the premium: the greater the casualties, as a proportion of the labour
71

force, the larger the proportional fall in the premium. On the other hand,
industrialization, as measured by dagri, is positively correlated with the pre-
mium; i.e. a fall in the weighting of agriculture in the composition of the
labour force is correlated with a fall in the building industry skill premium.
Both of these effects are large, with 1% of the labour force killed on the
front being associated with a proportional fall of 2.68% in the skill premium.
Similarly, for every 1% of the labour force to switch away from agriculture,
the premium fell 0.8%.
At the 10% level of statistical significance, both the level of the premium
in 1914 and the categorical variable, host, are negatively related to the change
in the skill premium. The higher the premium in 1914, the greater it fell over
the course of the war (by a factor of approximately one-tenth). Secondly,
hosts of the war saw larger falls (once again, by about 10% proportionally)
in their premium than other economies. After controlling for the specific
channels through which war affects economies, it seems that hosting the war
did have a (statistically) significant downward effect on the premium.
The two remaining variables reveal further effects, albeit not statistically
significant at the 10% level, due to the small size of the coefficients. A rise
in production is actually positively related to the premium, after controlling
for other effects such as casualties. Instead of capturing lower unemploy-
ment, and thus greater demand for unskilled labour, it is perhaps capturing
some of the structural changes in economies occurring at this time. Another
possibility, suggested in such works as Manning (1999), is that this reflects
an increased demand for skilled building labour in boom-times or periods of
reconstruction, which outweighs the increase in demand for unskilled labour.
Similarly, while controlling for such variables as casualties and industri-
alization, greater inflation is associated with a higher premium, contrary to
theoretical expectations. This does indeed go contrary to the findings of Bry
(1960) and Dunlop & Rothbaum (1955) regarding price levels and premiums
72

(in the USA, Germany, France, Italy and the UK).2
Including either or both of two further variables suggested by economic
theory and the literature results in no improvement in the model. These
variables are the proportional change in enrolment rates and the increase
in unionization. When included (individually) into the model above, they
increase the R2 by 0.002% and 0.02% respectively and significantly decrease
the R2. The coefficient on dTU is next to zero (-0.004) while the standard
error of dEdu is so large as to render the p-value close to 1.3 Interacting
the change in the price level (or log thereof) and the growth in unions, to
test the hypothesis that unions were effective during times of inflation, also
weakens the strength of the model. The evidence suggests, then, that neither
educational attainment nor trade union power had a systematic effect across
the countries under investigation during World War I.
Of the hypotheses laid out earlier, it seems then that there is little in
particular to support either the hypothesis that unions drove falling skill
premiums (Hypothesis 3 ) or that the observed changes between 1914 and
1920 are due to increased education enrolment rates (Hypothesis 5 ). Inflation
also appears not to have eroded premiums in a systematic way (Hypothesis
4 ). There is strong evidence, however, to suggest the explanation for falling
premiums during World War I lies in the main with the extent of military
casualties (Hypothesis 1 ) and of structural change in the economy (Hypothesis
6 ) and, to a lesser degree, with whether the country was a host to war or
not (Hypothesis 2 ) and with the level of the premium before the war.
2As observed, multicollinearity does not appear to be a problem with the data. If it isa problem at all, it is between these latter two insignificant variables and it could be thisthat gives signs that run contrary to expectation. Nonetheless, the correlation coefficientis not large, and the VIFs are low.
3Using activity of unions, measured by strikes, rather than latent power, does not alterthese findings. In fact, the coefficient is even smaller (0.00005). Using postwar levels ofunion density also substantially lowers the adjusted R2.
73

6.2.2 The Second World War
A natural starting point, for a more complete analysis of the Second World
War’s effect on the skill premium, is to apply the model derived above for
the First World War. This is done in Table 6.4. The most striking aspect of
the model is that its ability to explain the changes observed in World War
II appears to be very poor. The overall strength of the model is quite weak,
with the p-value associated with the F -statistic is approximately 0.3. The
variance on the equivalent variable to cas, namely mild, is very large. The
sign is also reversed. For all the other variables, the coefficients are small
and insignificant.
Table 6.4: Model of World War II Effects (1): The WWI Model
Source SS df MS Number of obs = 18— — — — F( 6, 11) = 1.40
Model .171439047 6 .028573174 Prob > F = 0.2963Residual .224138664 11 .020376242 R-squared = 0.4334
— — — — Adj R-squared = 0.1243Total .395577711 17 .023269277 Root MSE = .14275
dprem Coeff. Std.Err. t P>t 95% Conf. Int.pr1938 −.2066701 .1076482 −1.92 0.081 −.4436023 .0302621
mild .1965742 1.371073 0.14 0.889 −2.821136 3.214285dagri −.0982092 .3426071 −0.29 0.780 −.8522824 .6558639lndp −.0077328 .0260954 −0.30 0.772 −.0651683 .0497027
dprod .056054 .2554649 0.22 0.830 −.5062205 .6183286host −.001264 .1459938 −0.01 0.993 −.3225942 .3200663
C .2071245 .3071634 0.67 0.514 −.4689376 .8831867
It is also possible to include the change in the unemployment rate for
this later sample. While ostensibly allowing examination of Hypothesis 7,
that peaks in the business cycle are associated with troughs in the premium,
in reality, given the nature of the data points and the disruption of normal
economic activity during the Wars, comparing unemployment rates may not
74

actually be equivalent to comparing points in the business cycle. Indeed,
inclusion of the variable due, the change in unemployment from 1938 to
1946 does little to improve the fit of the model, and the coefficient is not
statistically significant from zero at the 15% level. Furthermore, the sample
size is reduced from 18 to 14.
Given the extent of aerial bombardment and civilian losses during World
War II, it is possible that greater civilian casualties, through capturing shocks
to labour supply, physical or human capital stocks, or the infrastructure of a
particular economy, may have a systematic relationship with changes in the
premium. However, this does not appear to be the case given the available
data. The same is true if one uses instead the ratio of civilian to military
losses as a measure of the same effects.
It seems from this evidence that the two World Wars worked in different
ways in how they affected the building industry skill premium. Whereas
structural changes and military casualties clearly had a downward effect on
the premium in the period 1914-1920, the same cannot be said according to
this specification.
6.3 The Role of World War One and the Strength
of Social Institutions
So if military casualties, changes in the price level, manufacturing output and
such factors do not explain the observed changes in the building industry skill
premium, what does?
Unfortunately data limitations, particularly on union density, consider-
ably restrict the sample size and thus the analysis. Nonetheless, outlined in
Table 6.5 are the results of the regression of dPrem on four variables, namely
the level of the building industry skill premium in 1920 (prem1920 ), the level
of union density in 1950 (ltu50 ), industrialization over the period (dagri) and
75

whether or not the country was occupied (occ).
Table 6.5: Model of World War II Effects (2): Role of WWI and Unions
Source SS df MS Number of obs = 13— — — — F( 2, 10) = 22.15
Model .156796299 4 .039199075 Prob > F = 0.0002Residual .014156973 8 .001769622 R-squared = 0.9172
— — — — Adj R-squared = 0.8758Total .170953272 12 .014246106 Root MSE = .04207
dprem Coeff. Std.Err. t P>t 95% Conf. Int.prem1920 −.5539274 .0633937 −8.74 0.000 −.7001135 −.4077413
ltu50 −.8062501 .1291453 −6.24 0.000 −1.10406 −.5084405dagri −.6491703 .1402301 −4.63 0.002 −.9725415 −.3257991
occ .0459659 .029134 1.58 0.153 −.0212172 .113149C .876424 .1162228 7.54 0.000 .6084138 1.144434
Firstly, it must be noted that the sample size is a mere thirteen countries,
thus results are far from conclusive. Indeed, it may be argued that the sample
is self-selecting, in that it represents those countries of the 25 that had the
stronger social institutions (with which the availability and perhaps level
of such variables as union density might be correlated).4 Nonetheless, the
results are suprisingly strong, as measured by t-statistics, F -statistics, and
the R2.
The variables chosen do not appear to be multicollinear, with low VIFs.
The residuals are distributed quite closely to the normal distribution, only
again with slightly fatter tails. Lastly, results for both the Breusch-Pagan
and White tests for heteroscedasticity mean that one cannot reject the null
hypothesis of constant variance.5
4The thirteen countries are: Australia, Austria, Belgium, Canada, Denmark, France,Germany, Ireland, Italy, Netherlands, Norway, Sweden, Switzerland, the UK and the USA.
5If one were to reject the null based on respective p-values of 0.23 (BP) and 0.37(White), the only noteworthy change would be to reduce the p-value associated with thevariable occ, making it significant at the 10% level.
76

The F -statistic shows that this simple model is certainly explaining a
degree of the observed changes, while the R2 and adjusted R2 indicate that
the model explains quite a lot of the variance. Both prem1920 and ltu1950
have a negative coefficient. This suggests, firstly, that the higher a coun-
try’s skill premium in 1920, the more it fell during the period 1938-46 —
supporting the suggestion in Section 5.2.1 of “room for manoeuvre”, i.e. the
level of a country’s premium after the first World War affected how its pre-
mium changed during World War II. The 1920 premium set the tone for
the following two decades, while World War II marked another shock to the
labour market. Countries with higher premiums after World War I, such as
the United States, Romania and Hungary, still had some distance to fall,
compared to those with lower 1920 premiums. Therefore, on average they
experienced larger proportional falls than those with lower 1920 premiums,
such as Switzerland, the UK and Australia.
Secondly, it indicates that the strength of unions, and by proxy the
strength of social institutions relevant to the wage-setting process, was also
an important determinant of how much wages fell during the war. The
greater union density, the larger the proportional fall in the premium. This
could be capturing solely the direct effects of unions or, as mentioned above,
in a broader sense the strength of the various institutions involved in the
wage-setting process.6
Structural change and industrialization, as measured again by dagri, is
also negatively associated with the skill premium. This is the opposite find-
ing to that for the First World War. Structural changes in the economy
away from agriculture were associated with larger skill premiums, suggesting
perhaps an increased pool of unskilled urban labour as the process of urban-
ization continued. It is also possible that war dislocated skilled labour, while
6These conclusions are robust to choice of union density dataset. A regression usingdata provided by Michael Huberman, covering 11 countries, also produced the same results.
77

also hurrying industrialization, resulting in higher premiums being associated
with the faster industrializers.
Lastly, countries occupied by the Nazis during the Second World War,
controlling for other factors, emerged with a higher premium than other
countries in the sample. This result, significant at the 10% level, may perhaps
be a function of the nature of society and economy under Nazi control. Such
control may have discouraged skill or skilled workers, forcing up the premium.
6.4 Summary
In both wars, belligerents saw their premium fall more than neutral countries.
In the Second World War, though, unlike the First, being a host to war
was associated with a higher premium (or smaller proportional fall) than
otherwise. It is likely that this is because of the more destructive nature of
the later War, in terms of infrastructure and capital stock, both human and
physical.
In particular, for World War I, over 80% of the variance in changes in
skill premium can be explained by the model described above. The change
in premium was inversely related to its starting level in 1914, whether the
country was a host of the war and in particular the proportion of the labour
force killed in the war. It was positively related to manufacturing output, the
log of change in the price level and in particular the change in the proportion
of the labour force involved in agriculture.
For the Second World War, however, the same model does not apply.
Regardless of specification, military casualties are not associated with larger
falls in the premium; if anything, they are associated with rises in the pre-
mium. None of the variables used, with the possible exception of the level of
the premium before the war, are in any way statistically significant. Turn-
ing to a model that focusses instead on the Western European countries and
78

their offshoots, the role of unions becomes clearer. Bearing in mind the small
sample size, the data indicate that the level of the premium in 1920 and the
strength of unions in 1950 are both negatively related to the proportional
change in the skill premium. Unlike World War I, structural changes in
the economy were negatively related to the premium, while being occupied
during World War II meant a higher premium than in other countries.
79

Chapter 7
Conclusions
80

This paper has examined the effect on labour markets of the two World
Wars, as measured by changes in the skill premium of the building indus-
try. Having reviewed the literature regarding both the effect of the wars on
economies and long run histories of labour market inequality, it set out the
stylised facts of the changes, as measured by official data published in ILO
sources. Cross-sectional econometric models were also developed to explain
the changes observed. Of the hypotheses outlined earlier, what can be said
of their validity?
Did greater military and civilian casualties mean a larger fall in the
skill premium in warring countries than in countries that escaped
the effects of the war? The evidence suggests that greater military casu-
alties were associated with larger falls in the building industry skill premium,
for the First World War only. For the second World War, neither military
casualties as a proportion of the labour nor civilian casualties weighted by
population were related in a systematic way to changes in the skill premium.
Were hosts of the war affected in a different manner to other par-
ticipants? For both wars, the answer appears to be yes, but the sign of
the coefficient is different. Whereas the hosts of World War I saw their pre-
mium fall by even more than others at war, those in World War II actually
had a substantially higher premium than other warring countries. Looking
specifically at countries occupied by the Nazis, there is evidence to suggest
that, controlling for structural changes and union density, as well as premium
level in 1920, occupied countries had a higher premium after the war than
non-occupied countries.
Did stronger unions, and or more rapidly growing unions, mean
greater falls in the skill premium? From the first World War, the
81

answer appears to be a sound no. There is no evidence to suggest a systematic
relationship between union growth (or levels) and changes in the premium
between 1914 and 1920. For World War II, though, one of the strongly
significant determinants of premium changes was the postwar level of union
density, at least among Western European economies and their offshoots.
The stronger the unions in a particular country in 1950, the greater the
proportional fall in the skill premium over the previous decade.
Did times of inflation, particularly when trade unions were strong,
lead to an adverse effect on the skill premium? There is little ev-
idence to suggest that inflation systematically drove down skill premiums
across the sample of countries. For World War I, the data suggest that if
anything changes in the cost of living increase the skill premium. A sugges-
tion for future research would be an analysis specifically of skill premiums
during hyperinflationary episodes to examine the relationship in greater de-
tail. For World War II, again there appears to be little in the way of a
systematic relationship between changes in the price level and in the skill
premium.
Did increasing education enrolment rates diminish the returns to
skill? While education enrolment rates are undoubtedly linked with the
supply curve of skilled labour in an economy, it does not appear to be the
case that changes observed in the skill premium across the two periods were
related to changes in enrolment. It would appear that education levels are in
the main more long-run determinants of skill premiums, while the short-run
changes here need more short-run explanations.
Are the processes of industrialisation and structural change in an
economy away from agriculture associated with falling skill pre-
82

miums? For World War I, this hypothesis holds at a strongly statistically
significant level. Greater structural changes, reflected in less of the labour
force working in agriculture, were associated with larger falls in the skill pre-
mium. During the period 1938-1946, however, the opposite appears to be the
case. World War II may have dislocated labour, while also bringing about an
upward shift in the process of industrialization, resulting in larger premiums.
Are peaks of the business cycle associated with troughs in the
skill premium? Due to the nature of the periods under consideration,
and also due to the quality of unemployment data available at all periods,
it is not possible to produce any results regarding this hypothesis. The
only indications, which come from a reduced sample during World War II,
reinforce the finding of Knowles & Robertson (1951) that there appears to
be little relationship between premiums and unemployment.
Did changes in a country’s skill premium during World War I affect
how that premium changed over the course of World War II? It
does indeed appear to be the case that the level of the postwar premium
after World War I affected the change in that premium during World War
II. The higher the premium in 1920, the greater the rate of fall during the
period 1938-46. This is coupled with the finding that the overall ranking of
countries did not alter substantially across the wars, even though the range
and axes shifted.
Concluding Remarks In conclusion, both World Wars were times of com-
pression in labour markets, as measured by the building industry skill pre-
mium. This is particularly so for the First World War, where no country
covered recorded a significant increase in the premium. There was greater
variability of experiences during the Second World War, meaning on average
83

a lower proportional fall than during World War I, but by 1946 the spread
of premiums internationally was at its lowest, compared with 1914, 1920 and
1938. Neutral countries saw a smaller fall in the premium during World
War I and a smaller range of experiences during World War II, while the
experiences of hosts differ between wars.
As noted in the introduction, the changes wrought by World War II ap-
pear to have had more long-run effects than those brought about by World
War I, at least in the United States. This paper suggests that this may be
due to the underlying causes of the changes, with changes in the period 1914-
20 attributable to military casualties and structural changes, while changes
in the premium over the period 1938-46 appear to be more due to union
density rather than casualties. The more permanent nature of union density,
as opposed to one-off shocks to the labour supply curves, suggests an intu-
itive reason for the different nature of the effects. This is perhaps an issue
for future research to address, using more observations from both postwar
periods.
Contrasting the World Wars with the interwar period reveals that the
period 1920-1938 was one of increasing labour market inequality generally
across the sample, as opposed to the wars. This is particularly true in the
USA, Australia and Canada, with the premium higher in Canada and Aus-
tralia in 1946 than 1914 as a result. On average, though, building industry
skill premiums fell between 1914 and 1946, a stylised fact attributable more
to military casualties and structural changes wrought by World War I and
union density during World War II than any interwar convergence.
84

Bibliography
BLS (1921), ‘Wages and Hours of Labor in Canada’, Monthly Labor Review
12:5, 77–79.
BLS (1937), ‘Union Scales of Wages and Hours in the Building Trades, 1937’,
Monthly Labor Review 45:5, 1184–99.
Bonzon, T. (1999), The labour market and industrial mobilization, 1915-
1917, in J. Winter & J.-L. Robert, eds, ‘Capital Cities at War: Paris,
London, Berlin 1914-1919’, Cambridge University Press, chapter 6,
pp. 164–195.
Bourguignon, F. & Morrisson, C. (2002), ‘Inequality among world citizens:
1820-1992’, American Economic Review 92, 727–744.
Broadberry, S. & Harrison, M. (2005), The Economics of World War I: an
Overview, in S. Broadberry & M. Harrison, eds, ‘The Economics of
World War I’, Cambridge University Press, chapter 1, pp. 1–35.
Bry, G. (1960), Wages in Germany, 1871-1945, Princeton University Press,
New York.
Bureau of the Census (1961), Historical statistics of the United States : colo-
nial times to 1957, U.S. Bureau of the Census, Washington, D.C.
85

Cole, J. (1999), The transition to peace, 1918-1919, in J. Winter & J.-L.
Robert, eds, ‘Capital Cities at War: Paris, London, Berlin 1914-1919’,
Cambridge University Press, chapter 7, pp. 196–225.
Dunlop, J. T. & Rothbaum, M. (1955), ‘International Comparisons of Wage
Structures’, International Labour Review 71, 347–363.
Ebbinghaus, B. & Visser, J. (1998), When Institutions Matter: Union
Growth and Decline in Western Europe, 1950-95, Technical Report 30,
MZES. Available at http://ideas.repec.org/p/erp/mzesxx/p0045.html.
Ellis, J. (1993), The World War II databook: the essential facts and figures
for all the combatants, Aurum, London.
Feinstein, C. H., Temin, P. & Toniolo, G. (1997), The European economy
between the wars, Oxford University Press, Oxford.
Galenson, W. (1976), The labour force and labour problems in Europe, 1920-
1970, in C. M. Cipolla, ed., ‘The Fontana Economic History of Europe:
the Twentieth Century - 1’, Fontana, chapter 3, pp. 133–184.
Galenson, W. & Smith, R. S. (1978), The United States, in J. T. Dunlop &
W. Galenson, eds, ‘Labor in the Twentieth Century’, Academic Press,
chapter 1, pp. 11–84.
Goldin, C. & Katz, L. F. (1999), The Returns to Skill in the
United States across the Twentieth Century, Technical Report
7126, National Bureau of Economic Research, Inc. Available at
http://ideas.repec.org/p/nbr/nberwo/7126.html.
Goldin, C. & Margo, R. A. (1992), ‘The Great Compression: The Wage
Structure in the United States at Mid-Century’, Quarterly Journal of
Economics 107, 1–34.
86

Guenter, H. (1963), ‘Changes in Occupational Wage Differentials’, Interna-
tional Labour Review 87, 136–155.
Guenter, H. & Leminsky, G. (1978), The Federal Republic of Germany, in
J. T. Dunlop & W. Galenson, eds, ‘Labor in the Twentieth Century’,
Academic Press, chapter 3, pp. 149–196.
Hardach, G. (1977), The First World War, Allen Lane, London.
Harrison, M. (1998), The economics of World War II: an overview, in M. Har-
rison, ed., ‘The Economics of World War II’, Cambridge University
Press, chapter 1, pp. 1–42.
History Place (2005), ‘The History Place - World War Two in Europe
Timeline’, Online at http://www.worldwar-2.net/timelines/timelines-
index.htm. Visited on 22 June 2005.
ILO (1923a), ‘Wage changes during recent months’, International Labour
Review 7:4, 577–603.
ILO (1923b), ‘Wage changes during recent months’, International Labour
Review 8:1, 79–96.
ILO (1923c), ‘Wage changes during recent months’, International Labour
Review 8:4, 553–560.
ILO (1924a), ‘Wage changes during recent months’, International Labour
Review 9:5, 763–778.
ILO (1924b), ‘Wage changes during recent months’, International Labour
Review 10:3, 308–324.
ILO (1926), Wage changes in various countries, 1914-1925, Technical report,
International Labour Organisation. Studies and Reports, Series D, No.
16.
87

ILO (1927), ‘Membership of Trade Unions during the Years 1921-1926’, In-
ternational Labour Review 16:3, 392–395.
ILO (1928a), ‘Recent wage changes in various countries: Austria, Poland’,
International Labour Review 18:6, 785–793.
ILO (1928b), ‘Recent wage changes in various countries: Denmark, Norway,
Sweden’, International Labour Review 18:1, 93–107.
ILO (1928c), ‘Recent wage changes in various countries: France, Belgium’,
International Labour Review 17:6, 805–883.
ILO (1928d), ‘Recent wage changes in various countries: Germany’, Interna-
tional Labour Review 18:4-5, 637–644.
ILO (1928e), ‘Recent wage changes in various countries: Netherlands,
Switzerland’, International Labour Review 18:3, 427–433.
ILO (1928f), ‘Recent wage changes in various countries: Spain’, International
Labour Review 18:2, 256–260.
ILO (1928g), ‘Wage changes in Great Britain, 1922-1927’, International
Labour Review 17:5, 722–730.
ILO (1929a), ‘Recent wage changes in various countries: Australia, New
Zealand, Union of South Africa’, International Labour Review 19:3, 423–
431.
ILO (1929b), ‘Recent wage changes in various countries: Canada’, Interna-
tional Labour Review 19:5, 711–716.
ILO (1929c), ‘Recent wage changes in various countries: Czechoslovakia,
Hungary’, International Labour Review 19:1, 90–96.
88

ILO (1929d), ‘Recent wage changes in various countries: Italy’, International
Labour Review 19:4, 561–567.
ILO (1929e), ‘Recent wage changes in various countries: United States’,
International Labour Review 19:2, 249–258.
ILO (1938), ‘Hourly Wages of Adult Male Workers in 30 Occupations, Oc-
tober 1937’, International Labour Review 37.
ILO (1939), ‘Hourly Wages of Adult Male Workers in 30 Occupations, Oc-
tober 1938’, International Labour Review 39.
ILO (1940), ‘Hourly Wages of Adult Male Workers in 30 Occupations, Oc-
tober 1939’, International Labour Review 41.
ILO (1946), Yearbook of Labour Statistics, 1944/45, International Labour
Office, Geneva.
ILO (1948), Yearbook of Labour Statistics, 1946/47, International Labour
Office, Geneva.
ILO (1951), Yearbook of Labour Statistics, 1949/50, International Labour
Office, Geneva.
ILO (1952a), ‘Hourly Wages in 43 Occupations, October 1951’, International
Labour Review 66.
ILO (1952b), ‘Statistical supplement: Unemployment’, International Labour
Review 66:1.
ILO (1953), ‘Hourly Wages of Adult Male Workers in 43 Occupations, Oc-
tober 1952’, International Labour Review 67.
INSEE (1941), Annuaire Statistique de la France, 1940, Vol. 46, INSEE,
Paris.
89

James, H. (2002), Economy, in J. Jackson, ed., ‘Europe, 1900-1945’, Oxford
University Press, chapter 4, pp. 48–76.
Keat, P. G. (1960), ‘Long-run Changes in Occupational Wage Structure,
1900-1956’, Journal of Political Economy 68, 584–600.
Knowles, K. G. & Robertson, D. J. (1951), ‘Differences between the wages
of skilled and unskilled workers, 1880-1950’, Bulletin of the Oxford Uni-
versity Institute of Statistics 13:4, 109–127.
Lawrence, J. (1999), The Transition to War in 1914, in J. Winter & J.-L.
Robert, eds, ‘Capital Cities at War: Paris, London, Berlin 1914-1919’,
Cambridge University Press, chapter 5, pp. 135–163.
Leacy, F. H. (1983), Historical Statistics of Canada (2nd electronic edition),
Statistics Canada, Toronto.
League of Nations (1945), Industrialization and World Trade, League of Na-
tions, Geneva.
Lindert, P. H. (2005), ‘Lindert Data (CUP Book)’, On-
line at http://www.econ.ucdavis.edu/faculty/fzlinder/Lindert
%20data%20CUP%20book/CUP%20data%20page.html. Visited
on 13 June 2005.
Maddison, A. (1976), Economic policy and performance in Europe, 1913-
1970, in C. M. Cipolla, ed., ‘The Fontana Economic History of Europe:
the Twentieth Century - 2’, Fontana, chapter 5, pp. 442–508.
Manning, J. (1999), Wages and purchasing power, in J. Winter & J.-L.
Robert, eds, ‘Capital Cities at War: Paris, London, Berlin 1914-1919’,
Cambridge University Press, chapter 9, pp. 255–285.
90

Milanovic, B. (2003), Income convergence during the disintegra-
tion of the world economy 1919-39, Technical Report 0303002,
Economics Working Paper Archive at WUSTL. Available at
http://ideas.repec.org/p/wpa/wuwpeh/0303002.html.
Milward, A. S. (1987), War, Economy and Society: 1939-1945, Pelican, Mid-
dlesex.
Mitchell, B. R. (2003a), International historical statistics : Africa, Asia &
Oceania, 1750-2000, Palgrave Macmillan, Basingstoke.
Mitchell, B. R. (2003b), International historical statistics : Europe, 1750-
2000, Palgrave Macmillan, Basingstoke.
Mitchell, B. R. (2003c), International historical statistics : the Americas,
1750-2000, Palgrave Macmillan, Basingstoke.
Munting, R. & Holderness, B. (1991), Crisis, Recovery and War: An eco-
nomic history of continental Europe, 1918-1945, Philip Allan, London.
Muntz, E. E. (1955), ‘The Decline in Wage Differentials Based on Skill in
the United States’, International Labour Review 72, 575–592.
Nicholson, C. (2001), The Longman Companion to the First World War,
Longman, London.
Ober, H. (1948), ‘Occupational Wage Differentials, 1907-1947’, Monthly La-
bor Review 67, 127–134.
O’Rourke, K. H. & Williamson, J. G. (1999), Globalization and history : the
evolution of a nineteenth-century Atlantic economy, MIT, London.
Pap, D. (1925), ‘The Adaptation of Wages to the Cost of Living in Hungary’,
International Labour Review 11:2, 153–168.
91

Piketty, T. (2003), ‘Income Inequality in France, 1901-1998’, Journal of Po-
litical Economy 111, 1004–1042.
Sellier, F. (1978), France, in J. T. Dunlop & W. Galenson, eds, ‘Labor in the
Twentieth Century’, Academic Press, chapter 4, pp. 197–240.
Thomson, A. W. J. & Hunter, L. C. (1978), Great Britain, in J. T. Dunlop &
W. Galenson, eds, ‘Labor in the Twentieth Century’, Academic Press,
chapter 2, pp. 85–148.
White, M. (2005), ‘Source List and Detailed Death Tolls for the
Man-made Megadeaths of the Twentieth Century’, Online at
http://users.erols.com/mwhite28/warstats.htm. Visited on 22 June
2005.
Winter, J. & Robert, J.-L. (1999), Capital Cities at War: Paris, London,
Berlin 1914-1919, Cambridge University Press, Cambridge.
Wrigley, C. (2000), The War and the international economy, in C. Wrigley,
ed., ‘The First World War and the International Economy’, Edward
Elgar, chapter 1, pp. 1–33.
92