Embed Size (px)
Citation preview

Academy of Accounting and Financial Studies Journal Volume 22, Number 1, 2018
1 1528-2635-22-1-123
THE IMPACT OF THE QUALITY OF FINANCIAL
REPORTING ON NON-FINANCIAL BUSINESS
PERFORMANCE AND THE ROLE OF
ORGANIZATIONS DEMOGRAPHIC' ATTRIBUTES
(TYPE, SIZE AND EXPERIENCE)
Ahmed Hani Al-Dmour, Brunel University London
Maysam Abbod, Brunel University London
Naim Salameh Al Qadi, Al-Balqa Applied University
ABSTRACT
Understanding the relationship between the quality financial reporting and business
performance has received great attention by academic researchers and professional recently.
However, in fact, there is lack of prior studies that have examined empirically the
relationship between the quality of financial reporting and non-financial business
performance measures in a systematic approach, which limited our understanding of the
concept of quality of financial reporting and its importance. Therefore, the purposes of this
research is to examine empirically the proposed relationship between the quality of financial
reporting and non-financial business performance in public listed companies in Jordan and
to find out whether their demographic attributes (type, size and experience) have any impact
on the quality of financial reporting.
For these purposes, a conceptual framework based on the content analysis of the
previous studies was developed. The data for this research were collected through self-
administrated questionnaire of 239 respondents from public listed companies in Stock
Amman Market database (2017). The results showed that that the components of the quality
of financial reporting are significantly influence the non-financial business performance and
the variations of the quality of financial reporting among these companies were significantly
found to be related to their size and experience and not to their type of business, which they
belong to.
Keywords: Quality of Financial Reporting, Non-Financial Business Performance,
Shareholdings Companies.
INTRODUCTION
Today, the necessity for producing quality financial report has received great attention
over the world. Providing high quality financial reporting information is important because it
will positively influence capital providers and other stakeholders in making investment, credit
and similar resource allocation decisions enhancing overall market efficiency (IASB, 2013).
For corporate information to beneficial, IASB argues that a key prerequisite quality in
financial reporting is the adherence to the objective and the qualitative characteristics of
financial reporting information. Qualitative characteristics are the attributes that make
financial information useful and consist of relevance, faithful representation, comparability,
verifiability, timeliness and understandability. The main indicators of financial information
quality from the perspective of the developers of accounting standards are relevance and
reliability, which make information useful for decision makers (Nwaobia et al., 2016).

Academy of Accounting and Financial Studies Journal Volume 22, Number 1, 2018
2 1528-2635-22-1-123
Many financial and accounting researchers have confirmed on the benefits and role of
the quality of financial reporting (Jaballah et al., 2014, Chan-Jane and Chae-Jung, 2015), they
also indicated that inadequate quality of financial reporting might negatively influence the
business performance and economic decisions. This means that the financial reporting quality
might determine managers’ willingness for engaging in activities that are not valuable. For
example, the financial reporting quality may facilitate better contracts to avoid investment
efficiency. Furthermore, it can increase investors’ ability to control the investment decisions.
Therefore, it is expected that high-quality financial reporting reduce excessive and wasting
investments (Biddle et al., 2009).
In fact, the link between financial reporting quality and financial business
performance has been critically analysed and researched. Prior studies in these issues provide
evidence that the quality of financial reporting is positively associated with the financial
performance measures such as ROI, growth rate volume of investment, earning per share
(Bolo and Hassani 2007, Klai and Omri, 2011). However, the contemporary literatures show
conflicting findings (Daw and Teru, 2015). Furthermore, the choosing performance measures
are still a major argumentative issue. Performance measurement system plays an important
role in developing strategy, evaluating the achievement of organizational objectives and
competitive advantages. Yet many stakeholders feel traditional financially oriented measures
no longer work adequately. A recent survey of US financial services companies found most
were not happy with their measurement systems (Hope et al., 2013, Ghosh and Wu 2012).
They believed there was too much emphasis on financial measures such as earnings and
accounting returns and little emphasis on drivers of value such as customer and employee
satisfaction, innovation and quality. Inadequacies in financial performance measures have led
to innovations ranging from non-financial indicators of “intangible assets” and “intellectual
capital” to “balanced scorecards” of integrated financial and non-financial measures
(Abdallah and Alnamri, 2015). Furthermore, several authors (Ghosh and Wu, 2012) indicated
that although financial measures are important, they are not sufficient for a good performance
evaluation system. The system should further include non-financial measures of performance.
Kelly (2007) justifies this by indicating that firm value is developed through various activities
that promote critical success factors. These factors include innovation, quality, productivity
and customer satisfaction.
Unlike the traditional financial performance measure, the question is still an open
whether the quality of financial reporting leads to systematic improvements in non-financial
business performance measures or not. This study, therefore, has come to test empirically the
proposed relationship between the quality of financial reporting and the non-financial
business performance in a systematic approach and to find out whether business
organizational demographic characteristics (type, size and experience) would have any
impact on the quality of financial reporting. In addition, this study aims to overcome the
above limitations of the previous studies and to improve the understandings of the importance
of the quality of financial reporting in new environmental context since the majority of
previous studies were conducted in western countries. This study will be conducted among
Jordanian shareholding companies, since many researchers indicate that within organizations,
attention must be given to the accounting standards and laws of each country because they
affect accounting management (Davila et al., 2004; Romney and Steinbart, 2017).

Academy of Accounting and Financial Studies Journal Volume 22, Number 1, 2018
3 1528-2635-22-1-123
LITERATURE REVIEW
Quality of Financial Reporting
Previous literature emphasizes that the accurate and qualified financial report is
considered an effective tool for conducting financial analysis, feasibility analysis and
interpretation. For example, Kaliski (2001) clarifies that the good financial report stresses on
financial elements and exchanged relations among them, so that the user can easily conduct
comparisons among them and then make appropriate decisions. It also highlights at the
company past and current financial performance, so that the user can make predictions about
the needed future financial performance of the company. Many studies have been conducted
to study and examine the extent of financial reporting quality, its dimensions and the
effecting variables (Botosan, 2004; Daske and Gebhardt, 2006). Other studies such as Biddle
et al. (2009), Jennifer Martinez-Ferrero, 2014 focus on studying the effect and exchanged
relationships between the quality of financial reporting and other affecting variables such as
fraud, profit manipulation, earnings, internal audit and control and corporate governance.
Financial reporting is a process of reporting financial activities of business on a
formal way. It has been considered as an essential resource for any market participant. It also
reduces the mystery and the conflict in opinion between all interested users such as managers,
investors, regulatory agencies, society and other stakeholders. Every one participates in this
process, even each operation related to this process should be submitted carefully, especially
the disclosure process, all transactions, the accounting policies and all judgments and
opinions made by the staff involved in this process (Gaynor et al., 2016). Explaining
variation in firm performance is the central focus of much of the strategy literature. A large
part of literature and previous studies try to examine quality of financial reporting and its
effects on the subsequent performance of a company. For example, Garcia-Lara et al. (2010),
Ahmed and Duellmand (2011), Gunny (2005) find that there is a positive effect for the
quality of financial reporting on the overall higher performance of the company.
Due to the fact that quality of financial report guarantees and enforces the company to
present good and accurate information, which in turn reduces the mystery and the conflict in
information provided for both shareholders and stakeholders and other market participants
interested in this report. The integrity and reliability of data produced by organizational
information systems are critical, not just for the production of reliable financial reports, but
also for overall business success (Krishnan et al. 2005). The important attributes for effective
financial management include- access to relevant information; use of that information to
enhance management standards; and assurance that the information is accurate, relevant and
secure (Barrett, 2004). Accounting information systems maintain and produce the data (e.g.
financial statements containing information about accounts and their balances) used by
organizations to plan, evaluate and diagnose operations and financial position (Peters and
Hlla, 2015), therefore, the aim of the regulators should be to make a system (accounting) that
offers maximal benefits at lowest possible costs.
Other benefits of having high-quality information from financial reporting are
mentioned in Lambert et al. (2007). He clarifies that the high-quality information guarantees
the reduction of information risk and liquidity. Other opinions are mentioned in Chen et al.
(2011): It reduces the mangers authority and power in making decisions for their own
interests and guides them to make appropriate and efficient investment decisions. Rajgopal
and Venkatachalam (2011) add that the high-quality financial reporting reduces the lack of
equivalence and the asymmetric information that arises from conflicting agency. It also helps
market agents to get full understanding about all company operations and activities by
reducing the ambiguity that surround some events (Jo and Kim, 2007). Lambert et al. (2007)

Academy of Accounting and Financial Studies Journal Volume 22, Number 1, 2018
4 1528-2635-22-1-123
mention that quality of accounting information has critical effects on market participants’
perceptions about the distribution and decisions related to the company future cash flow. On
the other hand, Chen et al. (2011) find both banks and government can get benefits of having
the high-quality financial reporting, because it has a positive effect on private firms
investment efficiency and financial performance, which in turn increases tax payment and
lending from banks. Garrett et al. (2012) state that (FRQ) gets its importance from the fact
that it helps in reducing information risk and enhancing liquidity. On the other hand, Lambert
et al. (2007) stress that FQR-provides the users with information and financial statements,
which are fundamental in debt contracting (Costello and Wittenberg-Moerman, 2011). FRQ
has many indicators that users could depend on to judge the quality of financial information
and the financial statements as a whole and not just as earnings. Some of the most important
indicators are- SEC Accounting and Auditing Enforcement Releases indicator (AAERs);
Restatements indicator; and internal controls indicator (Francis et al., 2005). Previous studies
also examined the importance of assessing (FRQ).
Dechow et al. (2010), for example, mentioned that there are three variables used for
assessing the (FQR): Properties of earnings, earnings response coefficients and external
indicators of FRQ. He states that “higher earnings quality shows the features of the firm’s
earnings process that are relevant to a specific decision made by a specific decision-maker”.
However, the most employed proxies of (FQR) in literature are: (i) Earnings quality; (ii)
Accounting conservatism; and (iii) Accruals quality. Ball et al. (2000) add another
assessment tool for measuring (FQR) through identifying degrees of accounting
conservatism, which implies a more timely incorporation of economic losses into accounting
earnings than economic gains. Earning quality has many determinants, which differ from one
company to another, the most important and common determinants are financial reporting
practices, governance and controls, auditors, capital market incentives, external factors and
the level of institutional factors for the country that the company operates on it. Nedal et al.
(2010) investigate the relationship between earnings management and ownership structure for
a sample of Jordanian industrial firms during the period 2001-2005. Earnings management is
measured by discretionary accruals. The three types of ownership studied are insiders,
institutions and block-holders. Using the Generalized Method of Moment (GMM), the results
indicate that insiders' ownership is significant and positively affect earnings management
A study by Seyed (2014) on 93 firms in Tehran Stock Exchange showed that the
financial reporting quality had a significant positive correlation with the investment
efficiency. Furthermore, it was found that there was a direct link between firm size and
growth opportunities with investment efficiency. Also, it was found that there was no
correlation between cash holdings and tangibility of assets with investment efficiency.
Umobong (2015) also examined the impact of IFRS on market performance of food and
beverages manufacturing firms in Nigeria. Earnings per share, price earnings ratio and
dividend yield were selected as performance criterion. Data were collected and divided into
pre and post IFRS-Comparative analysis and T test was done to ascertain influence of pre and
post IFRS adoption on market performance of the firms. Findings indicate that differences on
market performance between pre and post IFRS periods are not significant suggesting a weak
correlation between adoption of IFRS and market performance of quoted food and beverage
manufacturing firms in Nigeria Stock Exchange.
Quality of financial Reporting and Firm Demographic Characteristics
A key element of business organization attributes is demographic characteristics;
others are monitoring characteristics and performance characteristics (Chen and Jaggi, 2007).
Characteristics such as the size, which was referred to as the capital structure by (Shehu and
Academy of Accounting and Financial Studies Journal Volume 22, Number 1, 2018
5 1528-2635-22-1-123
Ahmad, 2013). The capital structure is of particular interest to this study. It is unlikely that
the rate of advantage of all the banks will be the same and even for the same deposit money
bank, the level might differ from year to year. The capital structure is a determinant of the
quality of financial reports of organizations (Shehu, 2013). Another important demographic
characteristic is the size of the firm. This will also have implications for the financial
reporting quality (Huang, Rose-Green, & Lee, 2012). Larger firms are able to afford a well-
structured internal control system or to engage the services of one of the top auditing
organizations for the audit of its financial statement, which is expected to improve the quality
of their financial report. On the other hand, a large organization can also be motivated to
engage in earnings management in order to maintain a certain level of profile (Waweru &
Riro, 2013) this will in turn affect the quality of its financial report. Finally, the age of the
organization (experience in business) is also likely to have repercussions for its financial
reporting quality (Huang, Rose-Green & Lee, 2012).
In their study of one hundred and thirty six (136) listed firms in the Tehran Stock
Exchange (TSE), Chalaki et al. (2012) used age of firms as a control variable and found that
age is not statistically significant with financial reporting quality. Huang et al. (2012),
Hossain (2008) also reported insignificant relationship. The result of the study of non-
financials firms in Nigeria by Kibiya et al. (2016) used firm age as a control variable and
found a significant association between age and financial reporting quality. Researchers use
different measures of age to compute the age of firm. While some use the date of
incorporation to the year of reporting (Olowokure, Tanko and Nyor (2016) others use of
listing years, which is the number of years the firm has been on the stock exchange (Haniffa
& Cook, 2002; Ojeka, Mukoro & Kanu, 2015). Scholars have the liberty to choose which
measure is more appropriate, depending on the objectives of their study. The age firm from
date of listing on the NSE, to the various reporting years is used for this study. This is
because investors have more confidence in firms listed on the stock exchange in addition to
the increased monitoring and scrutiny demanded by the stock exchange rules.
THE STUDY'S CONCEPTUAL FRAMEWORK
Based on the previous studies, financial reporting information should be relevant and
reliable to be useful in decision-makings. Relevant information should be timely gathered and
provided. Furthermore, they must be predictable and feedback-contained. Reliability includes
honesty, verifiability and impartiality (ZarifFard, 2008). The proposed framework here has
tied together the quality of financial reporting as well as non-financial business performance.
Using theoretical foundations from established quality of financial reporting literature, this
research seeks to explain the relationships between the characteristics of quality of financial
reporting and the non-financial business performance and to find out whether firm's
demographic characteristics (type, size and experience) can play as moderating variables
between the quality of financial reporting and non-financial business performance.
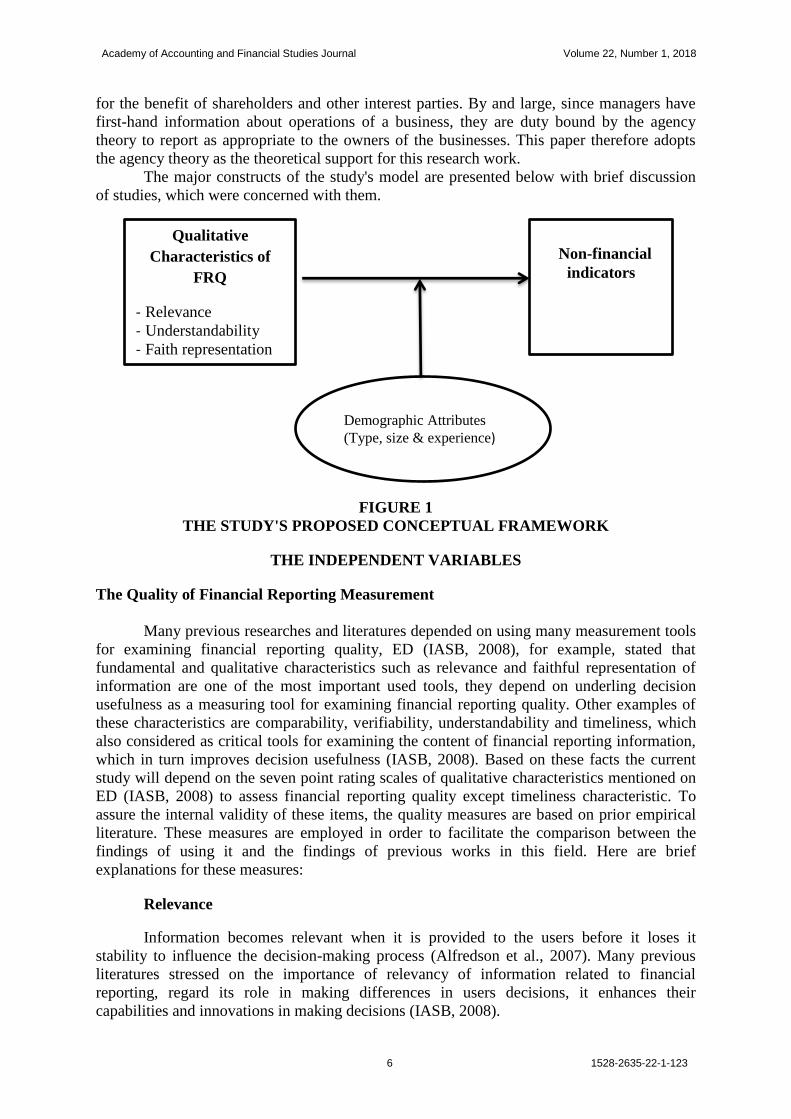
The expected relationships of the quality of financial reporting and non-financial
business performance measures are shown in (Figure 1). This study examines four major
characteristics that are considered to be relevant to assessing the quality of financial
reporting. Several theories have been used to explain the association between firm attributes
and financial reporting quality. This includes the agency theory, the political cost theory and
opportunistic theory among others. The agency theory defines the principal-agent
relationship. The principal here are shareholders while agents refer to the managers. These
parties have divergent interests, thus giving rise to agency costs, Shehata (2014). Disclosures
by way of financial reporting and regulation help to mitigate the agency problem, as it
requires that management of corporations report both mandatory and voluntary information
Academy of Accounting and Financial Studies Journal Volume 22, Number 1, 2018
6 1528-2635-22-1-123
for the benefit of shareholders and other interest parties. By and large, since managers have
first-hand information about operations of a business, they are duty bound by the agency
theory to report as appropriate to the owners of the businesses. This paper therefore adopts
the agency theory as the theoretical support for this research work.
The major constructs of the study's model are presented below with brief discussion
of studies, which were concerned with them.
FIGURE 1
THE STUDY'S PROPOSED CONCEPTUAL FRAMEWORK
THE INDEPENDENT VARIABLES
The Quality of Financial Reporting Measurement
Many previous researches and literatures depended on using many measurement tools
for examining financial reporting quality, ED (IASB, 2008), for example, stated that
fundamental and qualitative characteristics such as relevance and faithful representation of
information are one of the most important used tools, they depend on underling decision
usefulness as a measuring tool for examining financial reporting quality. Other examples of
these characteristics are comparability, verifiability, understandability and timeliness, which
also considered as critical tools for examining the content of financial reporting information,
which in turn improves decision usefulness (IASB, 2008). Based on these facts the current
study will depend on the seven point rating scales of qualitative characteristics mentioned on
ED (IASB, 2008) to assess financial reporting quality except timeliness characteristic. To
assure the internal validity of these items, the quality measures are based on prior empirical
literature. These measures are employed in order to facilitate the comparison between the
findings of using it and the findings of previous works in this field. Here are brief
explanations for these measures:
Relevance
Information becomes relevant when it is provided to the users before it loses it
stability to influence the decision-making process (Alfredson et al., 2007). Many previous
literatures stressed on the importance of relevancy of information related to financial
reporting, regard its role in making differences in users decisions, it enhances their
capabilities and innovations in making decisions (IASB, 2008).
Demographic Attributes
(Type, size & experience)
Qualitative
Characteristics of
FRQ
- Relevance
- Understandability
- Faith representation
- Comparability
Non-financial
indicators

Academy of Accounting and Financial Studies Journal Volume 22, Number 1, 2018
7 1528-2635-22-1-123
Faithful Representation
Faithful representation is the second fundamental qualitative characteristic as
elaborated in the ED, it means that all information listed in financial report must be
represented faithfully, (IASB, 2006) stated that in order to accomplish this all information
and Economic phenomena Listed in annual reports must be complete, accurate, neutral and
free from bias and errors. The reason why should take care of this is related to the fact that all
of these phenomena and transactions are changeable between time, so the annual report must
document every events and transaction carefully and accurately (IASB, 2006).
Understandability
Understandability is the third fundamental qualitative characteristic as elaborated in
the ED, it referred to the process of classifying, characterizing, categorizing, then presenting
the financial information clearly and concisely, for (IASB, 2008).
Comparability
Comparability is the fourth fundamental qualitative characteristic as elaborated in the
ED, however, during the process of preparing financial report the user may find similar
situations which are presented the same and in some cases different situations which are
presented differently. Thus comparability means the ability that the information have in
explaining and identifying similarities in and differences between two common sets or
transactions of economic phenomena (IASB, 2008). According to the ED, comparability
could be arrived by attaining consistent information by companies, this could happen by
enforcing the company to use the same accounting policies and procedures, either from
period to period within an entity or in a single period across entities(IASB, 2008).
THE DEPENDENT VARIABLE
The Non-Financial Business Performance Measures
According to Ramezan, (2013) the traditional financial business measures of
performance were no longer enough to give full picture about company competitive position
in competing markets (Ramezan et al., 2013). This implies that financial measures that
emphasize short-term indicators such as profit, turnover and cash flow are not suitable
anymore for measuring business performance and as a result, non-financial measures have
increased in importance (Tseng, 2010; Maqableh et al., 2014). In addition, there is a growing
literature on the use of non-financial measures in the West. According to Selvarajan et al.,
(2007) non-financial measures constitute measures not found in a company's charts of
accounts. Using nonfinancial measures of performance assists calculating measures and
provides data on development particularly with respect to customer needs, competitors
besides other non-financial targets that may be important in achieving profitability.
Furthermore, Bledsoe (1997 and Choe (2002) argue that non-financial performance provides
various strategic advantages, such as quality improvement and cutting down the delivery
time. Non-financial performance was used by Tuanmat and Smith (2011) to measure
organizational outcome, as with respect to product availability, product quality and sales
service and support. Sousa et al. (2006) also used productivity, customer satisfaction and
customer needs to assess the company’s performance. Furthermore, Isobe et al. (2008)
developed a list of long-term performance indicators, including new product and
technological innovations. Moreover, measuring organizations’ financial performance is

Academy of Accounting and Financial Studies Journal Volume 22, Number 1, 2018
8 1528-2635-22-1-123
intrinsically straightforward, because there are rules and guidelines that define the financial
measures. On the other hand, non-financial performance measures cannot be subject to the
same rules or guidelines. Still, the establishment of non-financial performance measures
should be related to the target settings and rewards and incentives need to be reflecting
(Otley, 2001).
An examination of the performance measurement systems in the literature
demonstrates that many management accounting scholars (Elg and Kollberg, 2009, Ghosh
and Wu 2012) incorporated non-financial performance measures, as an essential part of
management information system. Accordingly, one of the most significant arguments in this
study is that management accounting researchers back using performance measurement
diversity, in order to provide managers with adequate non-financial information on the
overall status of the organization.
In this study, respondents were asked to point out the degree of their nonfinancial
business performance relative to the industry average, using a seven-point Likert scale with
anchors “very low when comparing to industrial average” to “very high when comparing to
industrial average. Comparing the firm to the industry’s average will allow controlling for
different economic activities in the study's population (Kim et al., 2004). Thus, in arriving at
a measure for non-financial business performance, the degree of importance of each
dimension will be used as weights, with performance on each item being weighted by the
relative importance of each individual item. The items making up this scale were only
focused on non-financial performance measures. (customer satisfaction, employees
satisfaction, shareholder satisfaction, environmental performance, reputation and social
performance). These most common measures were selected in order to facilitate the
comparison with the findings of prior studies in this filed (Beest, 2009).
Research Hypotheses
Based upon the study’s conceptual framework, the study hypotheses are formulated
and proposed as summarized as below:
H01: There is no a significant relationship between the quality of financial reporting and the non-
financial business performance.
H02: There is no significant difference among business organizations in terms of the quality of
financial reporting based on their type of business sector.
H03: There is no significant difference among business organizations in terms of the quality of
financial reporting based on their size of business.
H04: There is no significant difference among business organizations in terms of the quality of
financial reporting based on their business experience.
Research Methodology
So as to obtain the empirical data needed to validate the study's conceptual model and
examine the research hypotheses, self-administrated questionnaire was used to collect the
required data. The target respondents were the shareholding companies in Jordan and the
single key respondents approach was used. The key respondent was financial/account
manager/director. The identification of the individual business organizations in the country
(Jordan) could be done by obtaining names of all companies, as well as their addresses, from
a variety of private and public sources in order to identify the type of business sector and the
range of the number of companies in each sector. Restrictions of time and financial resources
Academy of Accounting and Financial Studies Journal Volume 22, Number 1, 2018
9 1528-2635-22-1-123
could make the inclusion of all business companies impossible. Therefore, the target
population is only limited to the shareholding companies in Amman Stock Exchange Market
database (2017). Table (1) demonstrates the domain of the study's population and number of
respondents by sector.
Table 1
THE DOMAIN OF THE STUDY'S RESPONDENTS
Type of Sector No. of Companies No. of Respondents* Percentages
Service 202 162 0.80
Industries 126 77 0.61
Total 328 239 0.73
Sources: ase.com.jo 2016 A total of 328 self-administrated questionnaires were distributed to the respondents by
e-mail and hand and the response rate was 73%. 80% of the respondents were from service
sector. Initially, research assistants called the companies to have appointments to distribute
copies of the questionnaire to their companies. After respondents answered the questions, the
assistants collected the copies from them. In this survey, some variables are factual (for
example, companies' demographic information such as the type of sector, number of years in
business and number of employees), whereas others are perceptual (the quality of financial
reporting and non-financial performance business performance. The dependent variables (i.e.,
the non-financial business performance) and the independent variables (quality of financial
reporting) were measured using a seven–point Likert scale. The questionnaire's content
(constructs and measures) were mainly selected from the IASB's framework (2010) and prior
relevant studies (Tuanmat and Smith, 2011; Ghosh and Wu, 2012; Teru and Hla, 2015). They
were modified to the practice of Jordanian public listed companies’ culture context based on
the results of a pilot study and feedback from five professional academic staff in this field.
RESEARCH RESULTS
Descriptive Statistics
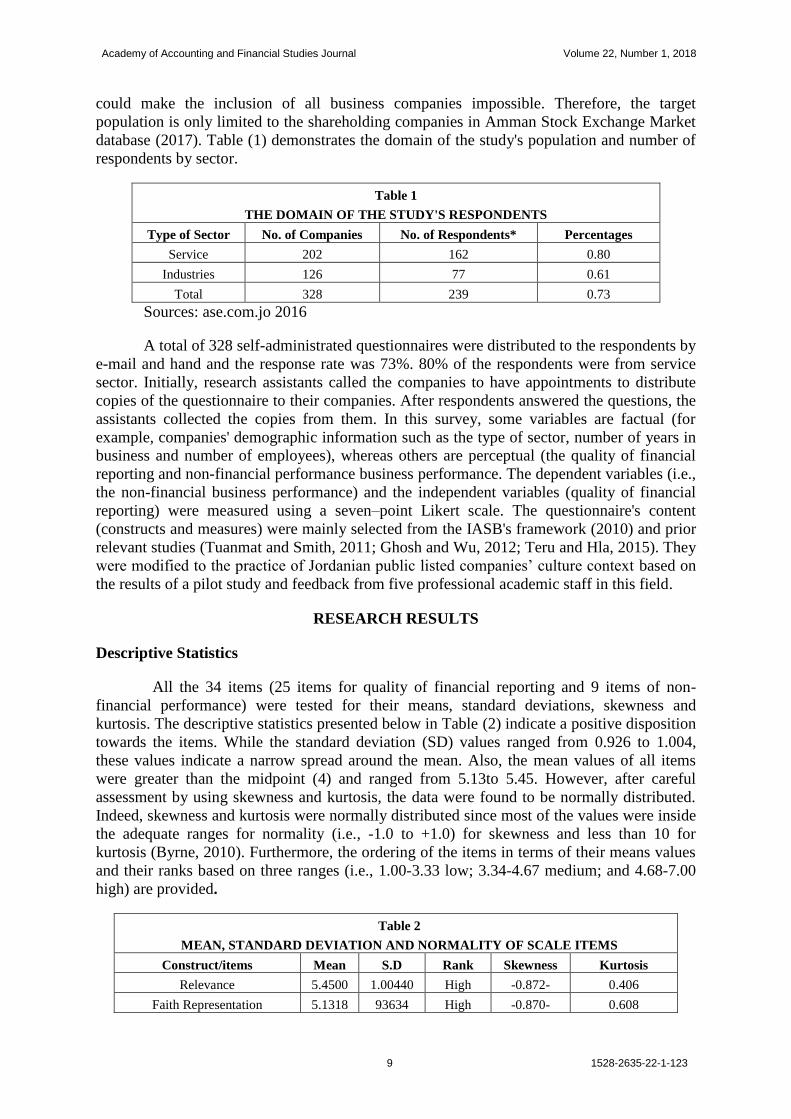
All the 34 items (25 items for quality of financial reporting and 9 items of non-
financial performance) were tested for their means, standard deviations, skewness and
kurtosis. The descriptive statistics presented below in Table (2) indicate a positive disposition
towards the items. While the standard deviation (SD) values ranged from 0.926 to 1.004,
these values indicate a narrow spread around the mean. Also, the mean values of all items
were greater than the midpoint (4) and ranged from 5.13to 5.45. However, after careful
assessment by using skewness and kurtosis, the data were found to be normally distributed.
Indeed, skewness and kurtosis were normally distributed since most of the values were inside
the adequate ranges for normality (i.e., -1.0 to +1.0) for skewness and less than 10 for
kurtosis (Byrne, 2010). Furthermore, the ordering of the items in terms of their means values
and their ranks based on three ranges (i.e., 1.00-3.33 low; 3.34-4.67 medium; and 4.68-7.00
high) are provided.
Table 2
MEAN, STANDARD DEVIATION AND NORMALITY OF SCALE ITEMS
Construct/items Mean S.D Rank Skewness Kurtosis
Relevance 5.4500 1.00440 High -0.872- 0.406
Faith Representation 5.1318 93634 High -0.870- 0.608

Academy of Accounting and Financial Studies Journal Volume 22, Number 1, 2018
10 1528-2635-22-1-123
Understandability 5.3415 0.92628 High -0.572- 0.049
Comparability 5.2380 0.96445 High -0.707- 0.134
Timeliness 5.244 0.94443 High -0.727- 0.144
Non-Financial Performance 5.0665 0.94336 High -0.787- 0.369
Data Analysis Techniques
For the analysis, the collected data was coded into SPSS Version x. The analysis part
consists of several different statistical analyses and tests including factor analysis and
multiple regression analysis. The main purpose behind the use of factor analysis techniques is
to reduce the large number of variables that underlie the quality of financial reporting into
orthogonal indices for further analysis by the regression analysis. Furthermore, by employing
the principle component analysis techniques, it may be possible to explore the patterns of
factors that underlie each major construct. It was considered an appropriate method to
overcome the potential problems of multicollinearity among the variables that pertain to each
construct. A pre-analysis was conducted to examine the appropriateness of the data for factor
analysis. The results of the factor analysis were examined using multiple criteria, including
eigenvalues, interpretability and internal consistency, as recommended by Hair et al. (2010)
.Therefore, items determined to have eigenvalues greater than one and factor loadings less
than .40 had little or no relationship with one another, hence they were discarded (Hair et al.,
2010). The results of the principle components analysis indicate that five factors can be
extracted from the quality of financial reporting. In summary, based on the preliminary
analysis, the evaluation of the data by factor analysis and reliability estimates indicated that
all scale items were appropriate and valid for further statistical analysis. Finally, Cronbach’s
alpha reliabilities were examined for each variable. Each coefficient greater than 0.60 for
adapted and 0.70 for existing scales was considered a reliable indicator of the constructs
under study (Hair et al., 2010). Reliability analysis was score ranged from 0.88 to 0.93.
Table 3
FACTORS UNDERLYING THE QUALITY OF FINANCIAL REPORTING
(1) Quality of Financial Reporting
Factors No. of items Eigenvalue % of Variance Cumulative %
Understandability 7 5.245 20.981 20.981
Relevance 7 5.117 20.468 41.449
Comparability 6 4.793 19.174 60.623
Faith representation 5 3.944 15.775 76.398
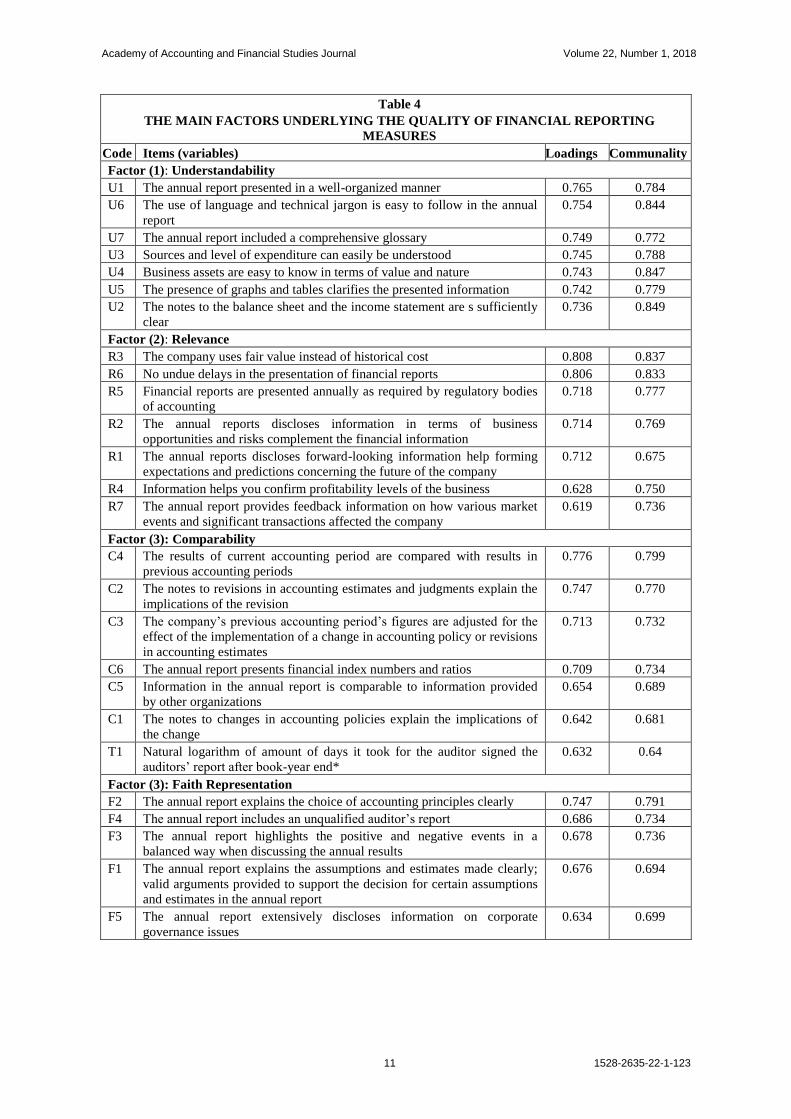
The results of the principal component analysis Table 4 indicate that four significant
factors can be extracted from this construct. This construct composed of (25) items
(variables) as presented in Table (4). The first factor, which accounts for (20.981%) of the
variance with loadings ranging from 0.73 to 0.76, can be identified as an "Understandability
factor”. The second factor, which explains 20.468% of variance with loadings range from
0.61 to 0.81, could be labelled as "Relevance” factor. The third factor which accounts for
(19.174) can be identified as "Comparability" factor and the forth factor which account for
(15.775) can be labelled as "Faith Representation". The combinations of these factors
accounts for 76.398 of the total variance in the questionnaire data as can be shown in table 3.
Academy of Accounting and Financial Studies Journal Volume 22, Number 1, 2018
11 1528-2635-22-1-123
Table 4
THE MAIN FACTORS UNDERLYING THE QUALITY OF FINANCIAL REPORTING
MEASURES
Code Items (variables) Loadings Communality
Factor (1): Understandability
U1 The annual report presented in a well-organized manner 0.765 0.784
U6 The use of language and technical jargon is easy to follow in the annual
report
0.754 0.844
U7 The annual report included a comprehensive glossary 0.749 0.772
U3 Sources and level of expenditure can easily be understood 0.745 0.788
U4 Business assets are easy to know in terms of value and nature 0.743 0.847
U5 The presence of graphs and tables clarifies the presented information 0.742 0.779
U2 The notes to the balance sheet and the income statement are s sufficiently
clear
0.736 0.849
Factor (2): Relevance
R3 The company uses fair value instead of historical cost 0.808 0.837
R6 No undue delays in the presentation of financial reports 0.806 0.833
R5 Financial reports are presented annually as required by regulatory bodies
of accounting
0.718 0.777
R2 The annual reports discloses information in terms of business
opportunities and risks complement the financial information
0.714 0.769
R1 The annual reports discloses forward-looking information help forming
expectations and predictions concerning the future of the company
0.712 0.675
R4 Information helps you confirm profitability levels of the business 0.628 0.750
R7 The annual report provides feedback information on how various market
events and significant transactions affected the company
0.619 0.736
Factor (3): Comparability
C4 The results of current accounting period are compared with results in
previous accounting periods
0.776 0.799
C2 The notes to revisions in accounting estimates and judgments explain the
implications of the revision
0.747 0.770
C3 The company’s previous accounting period’s figures are adjusted for the
effect of the implementation of a change in accounting policy or revisions
in accounting estimates
0.713 0.732
C6 The annual report presents financial index numbers and ratios 0.709 0.734
C5 Information in the annual report is comparable to information provided
by other organizations
0.654 0.689
C1 The notes to changes in accounting policies explain the implications of
the change
0.642 0.681
T1 Natural logarithm of amount of days it took for the auditor signed the
auditors’ report after book-year end*
0.632 0.64
Factor (3): Faith Representation
F2 The annual report explains the choice of accounting principles clearly 0.747 0.791
F4 The annual report includes an unqualified auditor’s report 0.686 0.734
F3 The annual report highlights the positive and negative events in a
balanced way when discussing the annual results
0.678 0.736
F1 The annual report explains the assumptions and estimates made clearly;
valid arguments provided to support the decision for certain assumptions
and estimates in the annual report
0.676 0.694
F5 The annual report extensively discloses information on corporate
governance issues
0.634 0.699
Academy of Accounting and Financial Studies Journal Volume 22, Number 1, 2018
12 1528-2635-22-1-123
TESTING HYPOTHESES
Testing the relationship between the quality of financial reporting and non-financial
business performance
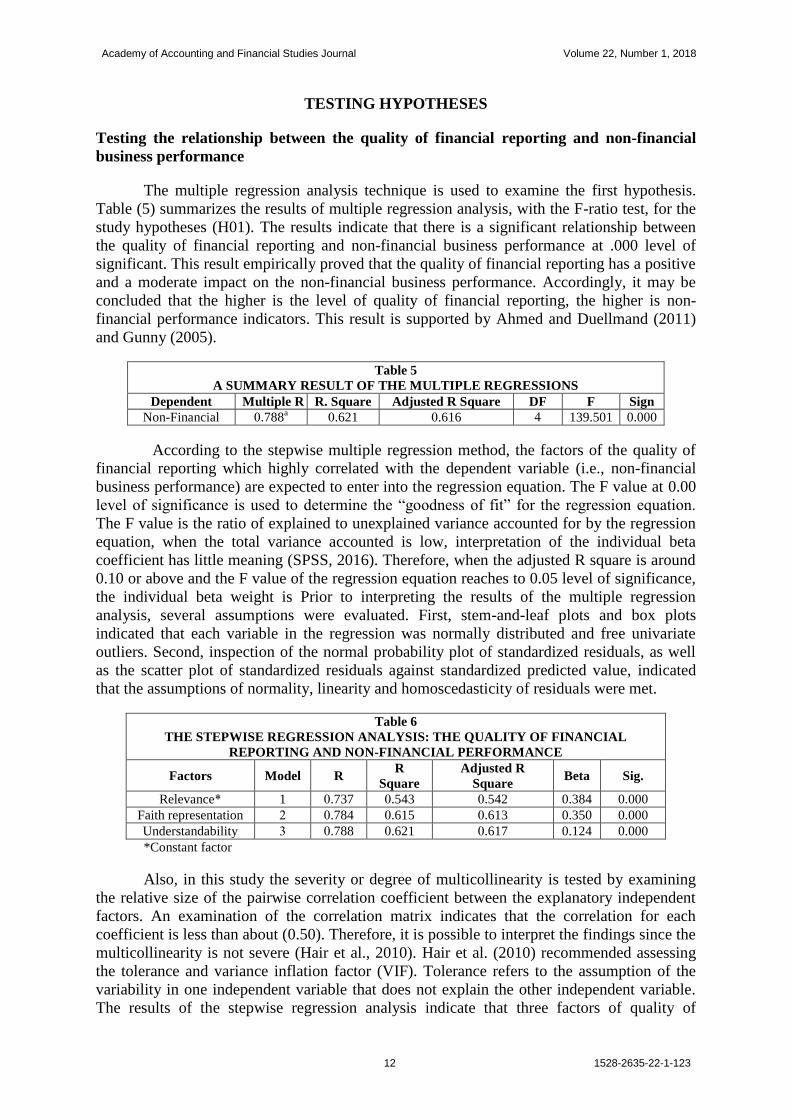
The multiple regression analysis technique is used to examine the first hypothesis.
Table (5) summarizes the results of multiple regression analysis, with the F-ratio test, for the
study hypotheses (H01). The results indicate that there is a significant relationship between
the quality of financial reporting and non-financial business performance at .000 level of
significant. This result empirically proved that the quality of financial reporting has a positive
and a moderate impact on the non-financial business performance. Accordingly, it may be
concluded that the higher is the level of quality of financial reporting, the higher is non-
financial performance indicators. This result is supported by Ahmed and Duellmand (2011)
and Gunny (2005).
Table 5
A SUMMARY RESULT OF THE MULTIPLE REGRESSIONS
Dependent Multiple R R. Square Adjusted R Square DF F Sign
Non-Financial 0.788a 0.621 0.616 4 139.501 0.000
According to the stepwise multiple regression method, the factors of the quality of
financial reporting which highly correlated with the dependent variable (i.e., non-financial
business performance) are expected to enter into the regression equation. The F value at 0.00
level of significance is used to determine the “goodness of fit” for the regression equation.
The F value is the ratio of explained to unexplained variance accounted for by the regression
equation, when the total variance accounted is low, interpretation of the individual beta
coefficient has little meaning (SPSS, 2016). Therefore, when the adjusted R square is around
0.10 or above and the F value of the regression equation reaches to 0.05 level of significance,
the individual beta weight is Prior to interpreting the results of the multiple regression
analysis, several assumptions were evaluated. First, stem-and-leaf plots and box plots
indicated that each variable in the regression was normally distributed and free univariate
outliers. Second, inspection of the normal probability plot of standardized residuals, as well
as the scatter plot of standardized residuals against standardized predicted value, indicated
that the assumptions of normality, linearity and homoscedasticity of residuals were met.
Table 6
THE STEPWISE REGRESSION ANALYSIS: THE QUALITY OF FINANCIAL
REPORTING AND NON-FINANCIAL PERFORMANCE
Factors Model R R
Square
Adjusted R
Square Beta Sig.
Relevance* 1 0.737 0.543 0.542 0.384 0.000
Faith representation 2 0.784 0.615 0.613 0.350 0.000
Understandability 3 0.788 0.621 0.617 0.124 0.000
*Constant factor
Also, in this study the severity or degree of multicollinearity is tested by examining
the relative size of the pairwise correlation coefficient between the explanatory independent
factors. An examination of the correlation matrix indicates that the correlation for each
coefficient is less than about (0.50). Therefore, it is possible to interpret the findings since the
multicollinearity is not severe (Hair et al., 2010). Hair et al. (2010) recommended assessing
the tolerance and variance inflation factor (VIF). Tolerance refers to the assumption of the
variability in one independent variable that does not explain the other independent variable.
The results of the stepwise regression analysis indicate that three factors of quality of

Academy of Accounting and Financial Studies Journal Volume 22, Number 1, 2018
13 1528-2635-22-1-123
financial reporting are found significantly related to the non-financial performance. The
direction of this relationship is positive. The findings also indicate that all of those two
explanatory independent factors are included in the regression equation. These three factors
in terms of their order of importance are: (1) Relevance (2) Faith Representation and (3)
Understandability (Table 6).
The adjusted square for these factors is 0.625 as shown in table 6. This indicates that
about 62% of the variations of the non-financial performance could be explained by only
these factors.
Testing the Variation on the Quality of Financial Reporting based on the Demographic
Attributes
The ANOVA analysis technique is also used to examine the other hypotheses (H02,
H03, H04). To assess the differences among business organizations in terms of quality of
financial reporting based on their organization’s demographic characteristics such as size,
type of business and business experience (age). As it is shown in Table 7, there are no any
significant differences among business originations in terms of quality of financial reporting
either taken separately or together due to their types of business sector (e.g. service vs.
industrial business) to which they belong. It may be concluded that type of business whether
service or industrial did not have any influence upon the quality of financial reporting, This
result is comply with the Jordanian Companies law. In accordance with Companies Law No.
22 (1997), all public shareholding companies, irrespective of their types (service or
industrial) required to prepare and issue their annual audited financial statements-their
balance sheets, income statements and cash flows statements within three months from the
end of the company’s fiscal year. Accordingly, Jordanian commercial laws have obliged
public listed companies to present audited quarterly, semi-annual, annual financial statements
and other financial reports.
Table 7
THE SIGNIFICANCE THE QUALITY OF FINANCIAL REPORTING AMONG GROUPS OF
ORGANIZATIONS BASED ON THEIR TYPE OF BUSINESS
QFR Sum of Squares Mean Square F Sig.
Relevance
Between Groups 0.288 0.288 0.285 0.594
Within Groups 347.757 1.011
Total 348.045
Understandability
Between Groups 0.057 0.057 0.066 0.797
Within Groups 295.950 0.0860
Total 296.007
Faith representation
Between Groups 0.020 0.020 0.022 0.881
Within Groups 302.451 0.879
Total 302.470
Between Groups 0.050 0.050 0.053 0.817
Within Groups 320.858 0.0933
Total 320.908
Comparability
Between Groups 0.026 0.026 0.024 0.877
Within Groups 371.315 1.079
Total 371.341
Total (All together)
Between Groups 0.000 0.000 0.000 0.985
Within Groups 252.482 0.734
Total 252.482
ANOVA test is also used to measure the differences among the business originations
in terms of the quality of financial reporting based on their size (number of employees). The
results shown in Table 7 indicate there are significant differences among business

Academy of Accounting and Financial Studies Journal Volume 22, Number 1, 2018
14 1528-2635-22-1-123
organizations in terms of the quality of financial reporting due to their size. This result
suggests that the business organization were varied in the quality of financial reporting either
taken together or separately due to their size of business.it might be concluded that size of
public listed companies could influence significantly on the quality of financial reporting.
This result is constant with other studies such as Shehu and Ahmad, 2013; Ojeka et al., 2015.
Table 8
THE SIGNIFICANCE QUALITY OF FINANCIAL REPORTING AMONG GROUPS OF
ORGANIZATIONS BASED ON THE SIZE OF BUSINESS
QFR Sum of Squares Mean Square F Sig.
Relevance
Between Groups 11.055 11.055 11.285 0.001
Within Groups 336.989 0.980
Total 348.045
Understandability
Between Groups 7.316 7.316 8.717 0.003
Within Groups 288.691 0.839
Total 296.007
Faith representation
Between Groups 15.911 15.911 19.100 0.000
Within Groups 286.560 0.833
Total 302.470
Between Groups 10.729 10.729 11.899 0.001
Within Groups 310.179 0.902
Total 320.908
Comparability
Between Groups 2.244 12.244 12.092 0.000
Within Groups 369.097 1.073
Total 371.341
Total (All together)
Between Groups 11.046 11.046 15.738 0.000
Within Groups 241.436 0.702
Total 252.482 11.055 11.285 0.001
Table 9
THE SIGNIFICANCE QUALITY OF FINANCIAL REPORTING AMONG GROUPS OF
ORGANIZATIONS BASED ON THEIR EXPERIENCE IN BUSINESS
QFR Sum of Squares Mean Square F Sig.
Relevance
Between Groups 3.030 3.030 4.021 0.043
Within Groups 345.015 1.003
Total 348.045
Understandability
Between Groups 4.511 4.511 5.323 0.022
Within Groups 291.496 0.847
Total 296.007
Faith representation
Between Groups 10.083 10.083 11.863 0.001
Within Groups 292.387 0.850
Total 302.470
Between Groups 2.114 2.114 6.281 0.039
Within Groups 318.794 0.927
Total 320.908
Comparability
Between Groups 1.825 1.825 5.699 0.035
Within Groups 369.516 1.074
Total 371.341
Total (All together)
Between Groups 4.509 4.509 6.255 0.013
Within Groups 247.973 0.721
Total 252.482
Furthermore, ANOVA test is employed to examine the difference among the business
organizations in terms of the quality of financial reporting based on their business experience
(age). The result revealed in Table 9 that there are significant differences among business
Academy of Accounting and Financial Studies Journal Volume 22, Number 1, 2018
15 1528-2635-22-1-123
organizations in terms of in the quality of financial reporting either taken together or
separately due to their business experiences (age). This result is in line with Chalaki et al.,
(2012) and Huang, Rose-Green and Lee (2012) their studies established that there is a
significant relationship between firm age and financial reporting quality. Therefore, stake
holders and regulator should expect the financial reports of a firm to improve over time
because the internal control of such firms are expected to become better structured with time
and a strong internal control is associated with financial reporting quality (Huang et al.,
2012).
CONCLUSION
Factor analysis findings results indicated that relevance, understandability, faith
representation and comparability are true measures of the quality of financial reporting in that
order. This result is supported by the previous studies (Beuselinck and Manigart, 2007;
FASB, 2013; and Beest et al., 2009). The findings indicate that the qualitative characteristics
of quality of financial reporting are relevant in predicating non-financial performance. The
findings also indicated, the power of the quality of financial reporting could explain 62% of
the variance in non-financial performance. The results also showed that relevance, faith
representation and understandability were the most important qualitative characteristics of the
quality of financial reporting that highly associated with the non-financial performance. To
best knowledge of the researchers, this result has never been examined before. Theoretically,
the vast majority of studies that have used the quality of financial reporting as a theoretical
foundation in their conceptual models have confirmed the quality of financial reporting as a
significant factor influencing financial business performance (e.g. Beuselinck and Manigart,
2007; FASB, 2013; Beest et al., 2009); Mamic, Sacar & Oluic, 2013). Furthermore, the
analysis also provides empirical evidence that the variation of the quality of financial
reporting among public listed companies in Jordan could be due to their size and business
experience but not to their types of business. This result is supported by many studies
(Chalaki et al., 2012; Huang, Rose-Green and Lee 2012).
IMPLICATIONS & LIMITATIONS
The present study has important implications for accounting managers, auditors and
financial practitioners and top managers in the surveyed companies and in similar
organizations. The authors believe that the decision-makers of business organizations could
benefit from this study’s findings with a better understanding of components of the quality of
financial reporting as well as their relationship with non-financial business performance. This
might give them a clear picture about the firm's market position in terms of these non-
financial performance measures. Furthermore, the result shows that firm age (business
experience) is significantly and positively related to financial reporting quality. This implies
that the higher the listing years of public listed companies in Jordan, the higher the financial
reporting quality. The significant impact of age on financial reporting quality in the study
may be a pointer that the monitoring rules and internal control system in Jordan are to some
extent sufficient.
However, this study is not without limitations that should be considered when
evaluating and generalizing its conclusions. These limitations discussed below can provide a
starting point for future research. The study was conducted in one country, Jordan. Although
Jordan is a valid indicator of prevalent factors in the wider MENA region and developing
countries, the lack of external validity of this research means that any generalizations of the
research findings should be taken with caution. Future research can be orientated in other
national and cultural settings and compared with the results of this study. The data analysis
Academy of Accounting and Financial Studies Journal Volume 22, Number 1, 2018
16 1528-2635-22-1-123
was cross-sectional. As with all cross sectional studies, the parameters tended to be static
rather than dynamic. This drawback limits the generalization of the study’s findings to further
situations and beyond the specific population from which the data was gathered.
REFERENCES
Abdallah, W. & Majbour A. (2015). Non-financial performance measures and the BSC of multinational
companies with multi-cultural environment. Cross Cultural Management: An International Journal,
22(4), 594-607.
Ahmed, A. & Duellman, S. (2011). Evidence on the role of accounting conservatism in monitoring managers'
investment decision. Accounting and Finance, 51(3), 6090-6633.
Ball, R., Kothari, S. & Robin, A. (2000). The effect of international institutional factors on properties of
accounting earnings. Journal of Accounting and Economics, 29(1), 1-51.
Barrett, P. (2007). Structural equation modelling: Adjudging model fit. Personality and Individual Differences,
42(5), 815-824.
Beest, V.F., Braam, G. & Boelens, S. (2009). Quality of financial reporting: Measuring qualitative
characteristics. Working Paper, Radboud University, Nijmegan, Netherlands, 1-108.
Beuselinck, C. & Manigart, S. (2007). Financial reporting quality in private equity backed companies: The
impact of ownership concentration. Small Business Economics, 29(3), 261-274.
Biddle, Hilary, Rodrigo, S. & Verdi, C. (2009). How does financial reporting quality relate to Investment
efficiency? Journal of Accounting and Economics, 48, 112-131.
Bledsoe, N.L. & Ingram R.W. (1997). Customer satisfaction through performance evaluation. Journal of Cost
Management, 43-50.
Bolo, G. & Hassani, S.A. (2007). Earnings management and its measurement: A theoretical approach. Iranian
Association of Certified Public Accountants, 4(12), 72-88.
Botosan, C. (2004). Discussion of a framework for the analysis of risk communication. The International
Journal of Accounting, 39, 289-295.
Chen, Q. & Jaggi, A. (2007). Financial accounting information, organizational complexities and corporate
governance systems. Journal of Accounting and Economics, 37(2), 167-201.
Chan-Jane, L., Tawei, W. & Chae-Jung, P. (2015). Financial reporting quality and investment decisions for
family firms. Asia Pacific Journal of Management, 1-34.
Chalaki, P., Didar, H. & Riahnezhad, M. (2012). Corporate governance attributes and financial reporting
quality: Empirical evidence from Iran. International Journal of Business and Social Science, 3(15),
223-229.
Chen, F., Hope, O.K., Li, Q. & Wang, X. (2011). Financial reporting quality and investment efficiency of
private firms in emerging markets. The Accounting Review, 86(4), 1255-1288.
Choe, J.M. (2002). The organizational learning effect of management accounting information under advanced
manufacturing technology. European Journal of Information Systems, 11, 142-158.
Cole, V., Branson, J. & Breesch, D. (2007). A review of the different methods developed to measure the
comparability of financial statements. Working paper series.
Costello, A.M. & Wittenberg-Moerman, R. (2011). The impact of financial reporting quality on debt
contracting: Evidence from internal control weakness reports. Journal of Accounting Research, 49, 97-
136.
Daske, H. & Gebhardt, G. (2006). International financial reporting standards and experts perceptions of
disclosure quality. Abacus, 42(3-4), 461-498.
Davila T, Foster G. & Pearson, A. (2005). Management accounting systems adoption decisions: Evidence and
performance implications from start-up companies. The Accounting Review, 80(4), 1039-1068.
Daw Hla1 & Susan P.T. (2015). Efficiency of accounting information system and performance measures
literature review. International Journal of Multidisciplinary and Current Research, 3(Sept/Oct 2015
issue).
Dechow, P.M., Ge, W. & Schrand, C. (2010). Understanding earnings quality: A review of the proxies, their
determinants and their consequences. Journal of Accounting and Economics, 50(2-3), 344-401.
Elg, M. & Kollberg, B. (2009). Alternative arguments and directions for studying performance measurement.
Total Quality Management, 20(4), 409-421.
FASB. (2013). Proposed accounting standards update-financial instruments-overall (subtopic 825-10),
recognition and measurement of financial assets and financial liabilities. FASB.org. Financial
Accounting Standards Board, 14 Feb. 2013. Web.
Francis, J., LaFond, R., Olsson, P. & Schipper, K. (2004). Cost of Equity and Earnings Attributes. The
Accounting Review, 79(4), 967-1010.

Academy of Accounting and Financial Studies Journal Volume 22, Number 1, 2018
17 1528-2635-22-1-123
Gaynor, M., Andrea, S.K., Molly, M. & Teri, L.Y. (2016). Understanding the relation between financial
reporting quality and audit quality. Auditing: A Journal of Practice & Theory, 35(4), 1-22.
García-Lara, J.M., Garcia, O.B. & Penalva, F. (2010). Conditional conservatism and firm investment
efficiency. Working Paper (Universidad Carlos III de Madrid, Madrid).
Ghosh, D. & Anne, W. (2012). The effect of positive and negative financial and nonfinancial performance
measures on analysts' recommendations. Behavioral Research in Accounting, 24(2), 47-64.
Gunny, K. (2005). What are the consequences of real earnings management? Working Paper, University of
Colorado.
Haniffa, R.M. & Cooke, T.E. (2002). Culture, corporate governance and disclosure in Malaysian corporations.
Journal of Accounting and Public Policy, 12, 31-44.
Hair Jr, J.F., Black, W.C., Babin, B.J. & Anderson, R.E. (2010). Multivariate data analysis: A global
perspective (Seventh Edition). Pearson Education International.
Hope, O., Thomas, W.B. & Vyas, D. (2013). Financial reporting quality of US private and public firms. The
Accounting Review, 88(5), 1715-1742.
Huang, H.W., Rose-Green, E. & Lee, C.C. (2012). CEO age and financial reporting quality. Accounting
Horizons, 26(4), 725-740.
IASB. (2008, 2013). Exposure draft on an improved conceptual framework for financial reporting: The
objective of financial reporting and qualitative characteristics of decision-useful financial reporting
information. London.
Isobe, T., Makino, S. & Montgomery, D.B. (2008). Technological capabilities and firm performance: The case
of small manufacturing firms in Japan. Asia Pacific Journal, 25, 413-428.
Jaballah, E., Yousfi, W. & Ali, Z.M. (2014). Quality of financial reports: Evidence from the Tunisian firms. E3
Journal of Business Management and Economics, 5(2), 30-38.
Jo, H. & Kim, Y. (2007). Disclosure frequency and earnings management. Journal of Financial Economics, 84,
561-590.
Jonas, G. & Blanchet, J. (2000). Assessing quality of financial reporting. Accounting horizons, 14(3), 353-363.
Kaliski, S.B. (2001). Encyclopedia of business and finance. Macmillan Reference, USA.
Kariuki, G. & Jagongo, A. (2013). Institutional investors’ perceptions on quality of financial reporting in Kenya.
International Journal of Humanities and Social Science, 3(21), 144-154.
Kelly, K.O. (2007). Feedback and incentives on nonfinancial value drivers: Effects on managerial decision
making. Contemporary Accounting Research, 24(2), 523-556.
Kibiya, M.U., Ahmad, A.C. & Amran, N.A. (2016). Audit committee characteristics and financial reporting
quality: Nigerian non-financial listed firms. The European Proceedings of Social & Behavioural
Sciences, 753-759.
Kim, H., Hoskisson, R.E. & Wan, W.P. (2004). Power dependence, diversification strategy and performance in
keiretsu member firms. Strategic Management Journal, 25(7).
Kim, J., Simunic, D., Stein, M. & Yi, C.H. (2007). Voluntary audits and the cost of debt capital for privately
held firms: Korean evidence. Working paper series.
Krishnan, R., Peters, J., Padman, R. & Kaplan, D. (2005). On data reliability assessment in accounting
information systems. Information Systems Research, 16(3), 307-326.
Lambert, R., Leuz, C. & Verrecchia, R.E. (2007). Accounting information, disclosure and the cost of capital.
Journal of Accounting Research, 45(2), 385-420.
Maines, L. & Wahlen, J. (2006). The nature of accounting information reliability: Inferences from archival and
experimental research. Accounting Horizons, 20(4), 399-425.
Maqableh, M., Karajeh, H. & Masadeh, R.E. (2014). Job scheduling for cloud computing using neural networks.
Communications and Network, 6(3), 191-201.
Martínez-Ferrero, J. (2014). Consequences of financial reporting quality on corporate performance. Evidence at
the international level. Estudios de Economía, 41(1), 49-88.
Nedal, A., Bana, A. & David, A. (2010). Ownership structure and earnings management in earnings markets: A
case of Jordan. Journal of Finance and Economics, 3(2), 1-20.
Nwaobia, A.N., Kwarbai, J.D., Kwarbai, J.D. & Ajibade, A.T. (2016). Financial reporting quality on investors
decisions. International Journal of Economics and Financial Research, 2(7), 140-147.
Ojeka, S.A., Mukoro, D.O. & Kanu, C. (2015). Does financial reporting disclosures enhance firm financial
performance in the Nigerian manufacturing companies? Mediterranean Journal of Social Sciences,
6(6), 332-337.
Olowokure, O.A., Tanko, M. & Nyor, T. (2016). Firm structural characteristics and financial reporting quality
of listed deposit money banks in Nigeria. International Business Research, 9(1), 106-115.
Otley, D. (2001). Extending the boundaries of management accounting research: Developing systems for
performance management. British Accounting Review, 33(3), 243-261.

Academy of Accounting and Financial Studies Journal Volume 22, Number 1, 2018
18 1528-2635-22-1-123
Umobong, A. & Dike, A. (2015). IFRS adoption and accounting quality of quoted manufacturing firms in
Nigeria: A cross sectional study of brewery and cement manufacturing firms. European Journal of
Accounting, Auditing and Finance Research, 3(8), 70-85.
Teru, S. & Tin Hla, D. (2015). Evaluation of the usefulness of efficiency of the accounting information system.
Business Management and Economics, 3(2350-157X).
Qingyuan, Li. & Tielin, W. (2010). Financial reporting quality and corporate investment efficiency: Chinese
experience. Nankai Business Review International, 1(2), 197-213.
Rajgopal, S. & Venkatachalam, M. (2011). Financial reporting quality and idiosyncratic return volatility.
Journal of Accounting and Economics, 51, 1-20.
Ramezan, M., Sanjaghi, M.E. & Baly, H.R. (2013). Organizational change capacity and organizational
performance. Journal of Knowledge-based Innovation in China, 5(3), 188-212.
Romney, M.B. & Steinbart, P.J. (2017). Accounting information systems. (Pearson Prentice Hall).
Sajady, M.D. & Hashemnejad (2008). Evaluation of the effectiveness of accounting information systems.
International Journal of Information Science & Technology, 6(2).
Selvarajan, T.T., Ramamoorthy, N., Flood, P.C., Guthrie, J.P., MacCurtain, S. & Liu, W. (2007). The role of
human capital philosophy in promoting firm innovativeness and performance: Test of a causal model.
The International Journal of Human Resource Management, 18(8), 1456-1470.
Seyed, M.M. (2014). The relationship between financial reporting quality and investment efficiency in Tehran
stock exchange. International Journal of Academic Research in Business and Social Sciences, 4(6),
104-130.
Shehata, N.F. (2014). Theories and determinants of voluntary disclosure. Counting and Finance Research, 3(1),
18-23
Shehu, U.H. & Ahmad, B. (2013). Firm characteristics and financial reporting quality of listed manufacturing
firms Nigeria. International Journal of Accounting, Banking and Management, 1(6), 47-63.
Shehu, U.H. (2013). Financial reporting quality, does monitoring characteristics matter? An empirical analysis
of Nigerian manufacturing sector. The Business & Management Review, 3, 147-155.
Sousa, S., Elaine, M., Aspinwal, A. & Guimaraes, R. (2006). Performance measures in English small medium
enterprises: Survey result. Benchmarking: An International Journal, 13(1), 120-134.
Tseng, T. (2010). The correlation between organizational culture and knowledge conversion on corporate
performance. Journal of Knowledge Management, 14(2), 269-284.
Tuanmat, Z. & Smith, M. (2011). The effect of changes in competition, technology and strategy on
organizational performance in small and medium manufacturing companies. Asian Review of
Accounting, 19(3), 208-220.
Waweru, N.M. & Riro, G.K. (2013). Corporate governance, firm characteristics and earnings management in an
emerging economy. Journal of Accounting Research, 11(1), 43-64.
Willekens, M. (2008), Effects of external auditing in privately held companies: Empirical evidence from
Belgium. Working paper series.