Embed Size (px)
Citation preview

TECHNICAL REPORT 5-6690-01-1TxDOT PROJECT NUMBER 5-6690-01
The Impact of the New Panama Canal Locks on Texas Ports and the Texas Economy
Robert HarrisonLeigh Boske
August 2017; Published October 2017
http://library.ctr.utexas.edu/ctr-publications/5-6690-01-1.pdf

Technical Report Documentation Page
1. Report No. FHWA/TX-17/5-6690-01-1
2. Government Accession No.
3. Recipient’s Catalog No.
4. Title and Subtitle The Impact of the New Panama Canal Locks on Texas Ports and the Texas Economy
5. Report Date August 2017; Published October 2017
6. Performing Organization Code 7. Author(s)
Robert Harrison, Leigh Boske 8. Performing Organization Report No.
5-6690-01-1
9. Performing Organization Name and Address Center for Transportation Research The University of Texas at Austin 1616 Guadalupe St., Suite 4.202 Austin, TX 78701
10. Work Unit No. (TRAIS) 11. Contract or Grant No.
5-6690-01
12. Sponsoring Agency Name and Address Texas Department of Transportation Research and Technology Implementation Office P.O. Box 5080 Austin, TX 78763-5080
13. Type of Report and Period Covered Technical Report July 2015–August 2017
14. Sponsoring Agency Code
15. Supplementary Notes Project performed in cooperation with the Texas Department of Transportation and the Federal Highway Administration.
16. Abstract This report examines the first year transits through the new Panama Canal locks and its impact on Texas deep water ports. It finds that the canal is operating efficiently and can accommodate 14,000 TEU containerships and bulk vessels up to 125,000 tons. This strengthens the position of Texas ports, both in terms of import and export supply chains. Current Panama Canal services include Asia to U.S. Atlantic and Gulf ports (containers) and Gulf to Asia ports (oils, liquefied natural gas, compressed natural gas). More services are expected in 2018 as both the bulk and container maritime sectors benefit from an increase in global trade. TxDOT should expect project requests related to landside access bottlenecks and its planners should evaluate opportunities to promote improvements to export supply chains. The report also includes links to six Policy Briefs undertaken by a class at the LBJ School of Public Affairs at The University of Texas at Austin addressing key elements of global supply chains and Texas infrastructure.
17. Key Words
Panama Canal, Texas Ports, Energy, Texas exports, TxDOT Planning, transshipments
18. Distribution Statement No restrictions. This document is available to the public through the National Technical Information Service, Springfield, Virginia 22161; www.ntis.gov.
19. Security Classif. (of report) Unclassified
20. Security Classif. (of this page) Unclassified
21. No. of pages 58
22. Price
Form DOT F 1700.7 (8-72) Reproduction of completed page authorized


The Impact of the New Panama Canal Locks on Texas Ports and the Texas Economy Robert Harrison Leigh Boske
CTR Technical Report: 5-6690-01-1 Report Date: August 2017; Published October 2017 Project: 5-6690-01 Project Title: Impact to Texas’ Multi-Modal Freight Networks: Panama Canal and South
American Markets Sponsoring Agency: Texas Department of Transportation Performing Agency: Center for Transportation Research at The University of Texas at Austin Project performed in cooperation with the Texas Department of Transportation and the Federal Highway Administration.

Center for Transportation Research The University of Texas at Austin 1616 Guadalupe St, Suite 4.202 Austin, TX 78701 http://ctr.utexas.edu/

v
Disclaimers Author's Disclaimer: The contents of this report reflect the views of the authors, who are
responsible for the facts and the accuracy of the data presented herein. The contents do not necessarily reflect the official view or policies of the Federal Highway Administration or the Texas Department of Transportation (TxDOT). This report does not constitute a standard, specification, or regulation.
Patent Disclaimer: There was no invention or discovery conceived or first actually reduced to practice in the course of or under this contract, including any art, method, process, machine manufacture, design or composition of matter, or any new useful improvement thereof, or any variety of plant, which is or may be patentable under the patent laws of the United States of America or any foreign country.
Engineering Disclaimer NOT INTENDED FOR CONSTRUCTION, BIDDING, OR PERMIT PURPOSES.
Research Supervisor: Robert Harrison

vi
Acknowledgments This report would not have been possible without the generous contributions of assistance
from numerous individuals and organizations, many of whom are specifically acknowledged in each of the six Policy Briefs given in Appendix 2 of this document.
We are also indebted to the following individuals for participating in weekly class presentations or scheduled interviews, sharing information and data, and suggesting useful contacts:
• Steve Boecking, Vice President, Hillwood Properties (developer of AllianceTexas)
• Greg Conte, Senior Data Analyst, Data Analysis and Transparency Division, Texas Comptroller of Public Accounts
• TJ Costello, Senior Data Analyst, Data Analysis and Transparency Division, Texas Comptroller of Public Accounts
• Jack Foster, Director, Systems Planning, Texas Department of Transportation
• Kent S. Marquardt, PMP, Director, Strategic Planning, Texas Department of Transportation
• Kevin McPherson, Data Analyst, Data Analysis and Transparency Division, Texas Comptroller of Public Accounts
• Theodore (Ted) Prince, Chief Operating Officer, Tiger Cool Express, LLC
• Zeke Reyna, Operational Excellence Coordinator, Research and Technology Implementation, Texas Department of Transportation
• Roger Schiller, Maritime Program Coordinator, Maritime Division, Texas Department of Transportation
• Michael Trevino, Assistant Vice President, External Communications, BNSF Railway Company
• Miha Vindis, Ph.D. Candidate / Consultant, University of Texas at Austin
• John Wesley Walker III, Software Engineer, Amazon We would also like to thank these Texas deepwater port officials for providing updates after the PRP class finished in May 2017:
• Chris Foster, Executive Director, Port of Beaumont
• Charlie Jenkins, Senior Director, Asset Management, Port of Houston Authority
• Jordan Frisby, Economic Analyst, Port of Houston Authority
• Bruce Mann, Director of Freight Mobility, Port of Houston Authority
• Ruben C. Medina, Director of Business Development, Port Corpus Christi
• Jarl Pedersen, Chief Commercial Officer, Port Corpus Christi
vii
Notes 1. Appendix 2 contains six Policy Briefs produced by LBJ School graduate students in
fulfillment of their Policy Research Project (PRP). Details of the course, student authors, and full text and references are provided in each Policy Brief. This report contains some material—data and information—reported in Policy Briefs 1, authored by Nina Lederman and Chi-Hsiang Chu and Policy Brief 2, authored by Chase Porter and Alex Payson. We explicitly recognize and thank them for their contributions.
2. Most Texas ports recently dropped “of” from their name and this report follows this practice (example: Port of Houston is now simply Port Houston). An exception in this report is the Port of Beaumont.
3. The authors thank the Journal of Commerce, Port Corpus Christi, and the Port of Beaumont for granting permission to reproduce images and tables cited in this document.
4. The Panama Canal Authority uses two terms for maximum ship sizes on its locks: Panamax for the older locks and Neopanamax for the new locks. The 2017 world fleet contains a number of ships that cannot transit the new locks because they exceed the Neopanamax limits. However, this is unlikely to impact Gulf ports adversely in the next decade, if at all.
5. This project, classified as an implementation project by the TxDOT Research and Technology Implementation Office, focused on capturing the first year of operations following the commissioning of the new Panama Canal locks. The research project upon which this work is based (0-6690) produced two reports:
o 0-6690-1: The Dynamics of U.S.-Asian-South American Waterborne Trade and the Panama Canal Expansion: Their Anticipated Impacts on Texas Ports and the State's Economy. Leigh Boske, Robert Harrison. June 2013. https://library.ctr.utexas.edu/ctr-publications/0-6690-1.pdf
o 6690-CTR-2: Trade Flows and Texas Gulf Ports: Panama Canal Expansion and
South American Markets Dan Seedah, Robert Harrison, Leigh Boske, C. James Kruse, Annie Protopapas. September 2014. https://library.ctr.utexas.edu/ctr-publications/0-6690-CTR-2.pdf
This final report, together with these two earlier reports and the Policy Briefs provided in Appendix 2, record all findings of this four-year study.

viii
Table of Contents
Executive Summary .......................................................................................................................1
Chapter 1. The Panama Canal Expansion Project .....................................................................2 1.1 History ...................................................................................................................................2 1.2 Panama Inherits the Canal .....................................................................................................3 1.3 Energy and Neopanamax Size Ships .....................................................................................5 1.4 Background Summary: Project 5-6690-1 in 2013 .................................................................8
Chapter 2. Forecasting Demand in the Global Maritime Sector 2015–2020 ..........................11 2.1 Manufacturing ......................................................................................................................11 2.2 Stockpiles .............................................................................................................................12 2.3 U.S. Trade: Exports and Imports .........................................................................................13 2.4 Bond Market ........................................................................................................................13 2.5 Recession Indicators ............................................................................................................13
Chapter 3. Texas Deepwater Ports: Activities and Panama Canal Impacts ..........................16 3.1 Port Houston ........................................................................................................................16
3.1.1 Port Houston Container Infrastructure—Existing and Planned Improvements ........... 17 3.1.2 Port Houston Non-Containerized Asian and Pacific Commodities Likely to
Benefit from the New Panama Canal Locks ............................................................... 18 3.1.3 Containerized Plastic Resins ........................................................................................ 20 3.1.4 Key Project Takeaways on Port Houston .................................................................... 23
3.2 Port Corpus Christi ..............................................................................................................24 3.3 Port of Beaumont .................................................................................................................27 3.4 Port Freeport ........................................................................................................................31
Chapter 4. The U.S. Maritime Sector, Texas, and Panama Canal Impacts as of August 2017 ......................................................................................................................34
4.1 Role of Texas Ports in U.S. Maritime Sector ......................................................................34 4.2 Challenges at Texas Ports ....................................................................................................35
Chapter 5. Summary ...................................................................................................................37
Appendix 1. Background to U.S. Intermodal Transportation System Developments ..........40
Appendix 2. LBJ School Policy Research Project (PRP) Policy Briefs ..................................46
ix
List of Figures Figure 1.1: U.S. Battleship Deployment, Panama Canal 2019 ....................................................... 2 Figure 1.2: Water Retention Ponds at the New Panama Canal Locks ............................................ 3 Figure 1.3: Impact of the New Panama Canal locks on Global Fleet Utilization 2016 .................. 4 Figure 1.4: LNG Tanker Galea Transiting the New Panama Locks, 2017 ..................................... 6 Figure 2.1: ISM’s PMI July 2016–June 2017 ............................................................................... 12 Figure 2.2: Baltic Dry Bulk Index: 2005–2016 ............................................................................ 15 Figure 3.1: Plastic Resin Employment Concentrations ................................................................ 21 Figure 3.2. Marine Containerized U.S. Cotton Exports 2016 ....................................................... 23 Figure 3.3: December 2015 First U.S. Crude Export Movement in 40 Years .............................. 25 Figure 3.4. Gulf Port Crude Oil Exports 2016 .............................................................................. 26 Figure 3.5. Port of Beaumont Commodity Categories 2016 (tonnage) ........................................ 28 Figure 3.6 Port of Beaumont General Cargo 2016 ....................................................................... 29 Figure 3.7. Jefferson Energy Terminal: existing facilities (green), under construction
(red), and planned (blue) ................................................................................................... 30 Figure 3.8: Container volumes at the Port of Freeport 2011 to 2015 (TEU) ................................ 31 Figure 3.9: Port of Freeport Oversize/Overweight Export Corridor ............................................. 33 Figure A1.1: Map of the Alameda and Class 1 Railroad Systems................................................ 42 Figure A1.2: Public-Private Partnerships: Colton Flyover, California ......................................... 44
List of Tables Table 1.1: Monthly Canal Operations ............................................................................................. 5 Table 3.1: Port Houston Details .................................................................................................... 17 Table 3.2 Examples of Port Houston Plastics Production and Packing Plants ............................. 19 Table 3.3: Major Plastic Resin Employers in Texas ..................................................................... 20 Table 3.4: 2016 Import and Export Tonnage at Port Corpus Christi: Energy and Chemical
Impacts .............................................................................................................................. 25 Table 3.5. Port Corpus Christi Pipeline Networks 2017 ............................................................... 27

1
Executive Summary
This final report details the Panama Canal’s impacts on Texas ports and the state economy. It also examines the ports’ landside links and modes, forecasting trade based on interviews with the Texas ports most likely to benefit from the newly completed (2016) locks on the Panama Canal.
The impacts of the new Panama Canal locks as of August 2017 include the following:
(a) The new locks are running smoothly and traffic volumes are higher than predicted. The impact on Gulf energy exports—liquefied natural gas (LNG), compressed natural gas (CNG), and oil—has been positive and the locks can handle a 14,000 TEU (twenty-foot-equivalent) ship. Texas ports can now serve a range of ship types and sizes, including dry bulk, liquid bulk, break bulk, and specialized designs that can benefit from larger locks. Containerships impact Port Houston and Port Freeport specifically and do not play a role at other Texas Gulf ports.
(b) Texas ports expect to grow Texas trade, especially export volumes. Ports are especially focused on the export of products based on new investments in the Texas chemical and petroleum sectors, which are now ramping up production using Texas-sourced oil and gas. The ports at Beaumont, Houston, Corpus Christi, and Brownsville are moving higher volumes of petroleum products. Port Corpus Christi is currently the leading U.S. port for oil exports and has delayed plans to build a container terminal as a result of the petroleum sector expansion.
(c) Steamship companies and alliances are offering new services that use the new Panama Canal locks. Containerships in the 10,000 TEU class can service Port Houston, although the larger containerships use routes with a direct service to U.S. Atlantic ports like Savannah. It is unclear whether the larger containerships will serve Gulf gateways through transshipment services at hubs at Panama or at Caribbean ports. Port Houston is skeptical about that potential development, based on the additional handling costs and trip times.
(d) The global economy remains weak but is expected to recover slightly in 2017 and the Bureau of Economic Analysis expects the U.S. economy to record an annual growth rate of 2.1 percent, although exports remain sensitive to U.S. dollar exchange rates. U.S. inventory levels remain higher than normal. Container shipping revenue in 2016 was lower than levels during the 2009 Great Recession and continues to impact liner services, routes, and port calls in that sector.
(e) Containership companies are striving to control costs through mergers, forming alliances on key trade lanes, cutting service and scrapping excess capacity. Deployment of larger containerships in some alliances has resulted in fewer, but larger, ships on selected routes, including some to Gulf ports. Carriers remain cautious and risk averse, so Panama Canal use will likely develop strongly only when market confidence returns and cargo volumes can be accurately estimated. Not all carriers, however, are abandoning Panamax container ships, and a Gulf port service (Houston, New Orleans, and Mobile) using Panamax ships has been proposed but not yet implemented.
2
Chapter 1. The Panama Canal Expansion Project1
1.1 History
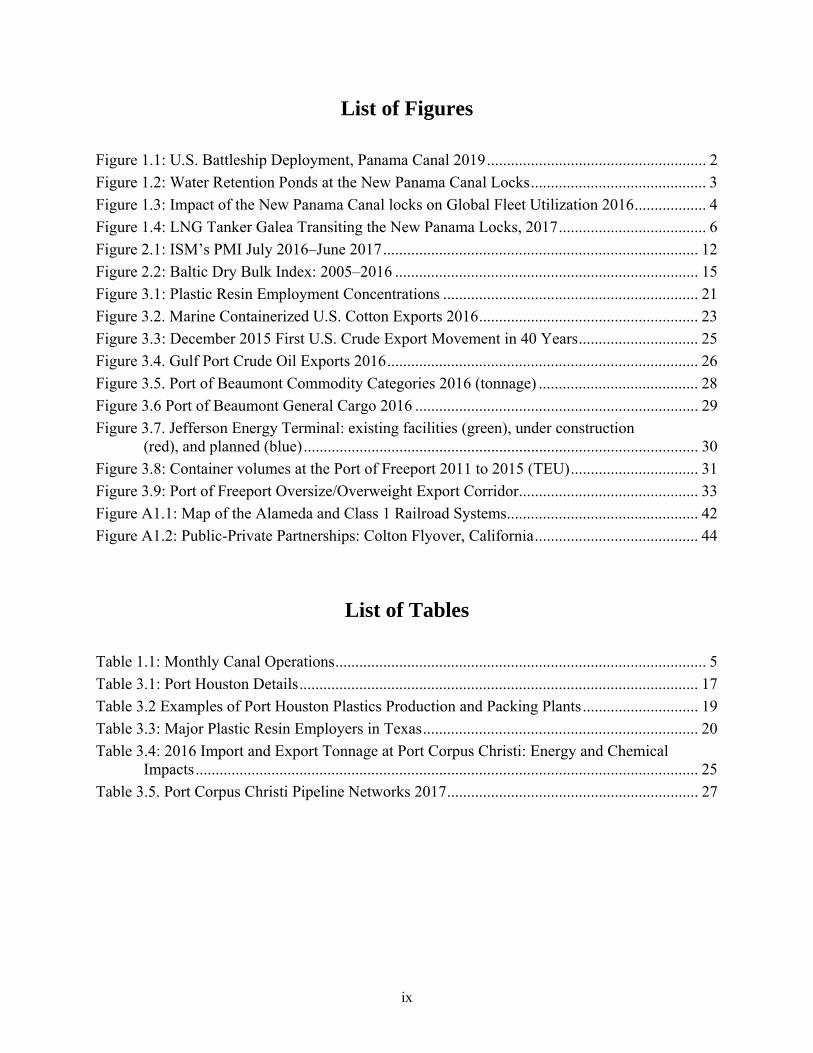
A narrow 30-mile isthmus in Panama separates the Pacific Ocean from the Caribbean Sea and in the 1880s a French consortium attempted to construct a sea-level canal following the commercial success of the Suez Canal. Disease and flooding ravaged the enterprise and plans lay dormant until the U.S., under the enthusiastic support of President Roosevelt, undertook the challenge under three conditions. The first was that it would use locks to raise ships from sea level to a lake (Gatun) formed by damming key rivers and then cut through the mountains at Culebra before moving down through locks to the other sea. The second was that the U.S. would undertake the construction and operation of the canal within a zone to be ceded to the U.S. The third was that the U.S. would support the independence of Panama from Colombia.
The canal took seven years to build and was opened officially in late 1914. It provided the U.S. with strategic military advantages—shown in Figure 1.1—as well as opening shorter routes for global and regional shipping.
Figure 1.1: U.S. Battleship Deployment, Panama Canal 2019
Its significance fell during World War II—the Gulf Intracoastal Waterway arguably played a more important role in the war—and it declined further during the 1960s. The signing of Torrijos-Carter treaties of 1977, which ceded the Canal Zone and Canal operations to Panama on December 31, 1999, was uneventful to many and met with little criticism.2
1 Appendix 2 contains two Policy Briefs that provide more details on the Canal projects and comparisons with the Suez Canal. 2 There were some exceptions. Senator Hayakawa objected on the basis that “we stole it fair and square.” Others thought the Panamanians incapable of operating the Canal effectively.

3
1.2 Panama Inherits the Canal
The Panama Canal Authority (ACP) vigorously took on the new responsibility in 2000, raising tolls to market values and investing in improving canal operations. It was immediately clear that new locks were needed and in the early 2000 it commissioned several major studies by global consultants on the impact of a second, larger set of locks. These studies produced forecasts that allowed the ACP to successfully float bonds, select contractors, and begin work in 2007. None of the consultants, however, predicted that containership size would double in the period between the start and completion dates nine years later. Nor could they have predicted the impact of fracking in the U.S. energy sector and its specific impacts on the Texas economy. The Panama Canal is limited, at times, by the amount of fresh water in the Gatun Lake and tributaries, so the design of the new locks incorporated large pond areas where displaced water could be saved for other transits, as shown in Figure 1.2. Water loss is also reduced by ships passing through two sets of locks compared to the original three sets of locks.
Figure 1.2: Water Retention Ponds at the New Panama Canal Locks
As noted in previous reports, steamship companies are now exploring ship size/route trade-offs and already the Hong Kong container carrier OOCL (Orient Overseas Container Line) has a service transiting the canal to call on U.S. South Atlantic ports. An ACP executive vice-president stated that although they thought ships would lie in the 6500-to-8000 TEU (twenty-foot-equivalent) range in the first year, actual average size recently reached 13,000 TEU3, which exceeds all Gulf port channels as currently configured. However, Gulf port container terminals could service two types of ship size: direct calls in the 9,500 TEU class and hub-and-spoke with Panamax-sized ships on Gulf rotational delivery routes. Another main impact noted by ACP is the growth of bulk tankers and liquefied natural gas (LNG) transits, from Texas, Trinidad, and the Louisiana Cheniere plant on the Neches River
The 2017 world fleet contains a relatively small percentage of ships that are unable to transit the new locks. However, Figure 1.3 shows that the new locks are capable of handling almost
3 Journal of Commerce. “New Panama Canal locks accelerating US coastal import switch.” Accessed 7/7/2017

4
80 percent of the global fleet registrations and all ships in the break bulk, LPG carrier, and car carrier categories.
Note: The graph is based on statistics provided June 20, 2016.
Figure 1.3: Impact of the New Panama Canal locks on Global Fleet Utilization 2016
Bookings have continued to grow in the first six months of 2017, despite concerns that stresses in the maritime sector would delay demand. 1.1 shows the monthly totals of total and Neopanamax ship transits as of January 2017. ACP announced lower rates for large containerships on the Atlantic-Pacific backhaul routes on August 14 2017 to protect and grow market share. It is demonstrating professional, market based approaches to operations, investment and profitability which will support Gulf port operations and growth.
0%
10%
20%
30%
40%
50%
60%
70%
80%
90%
100%
World Fleet Containership LPG Carrier LNG Carrier Car Carrier Bulk Carrier
Perc
enta
ge o
f Fle
et
Sector
New Locks
Old Locks

5
Table 1.1: Monthly Canal Operations
July 2016
August 2016
September 2016
October 2016
November 2016
December 2016
January 2017
Total 946 908 945 973 969 1043 1111
Neopanamax 59 76 81 108 103 154 160
Neopanamax % 6.24 8.37 8.57 11.10 10.63 14.77 14.40
Neopanamax Daily Average
1.9 2.45 2.7 3.48 3.43 4.97 5.16
Source: Panama Canal Authority4
The day the new lane opened, 170 Neopanamax vessels had already reserved bookings in advance for passing through the canal. Just within the first two weeks of operation, 24 Neopanamax ships passed through the new locks: 11 container ships, 11 LPG carriers, and 2 car carriers. The first Neopanamax vessel to transit the new canal was the 9,400-TEU vessel COSCO Shipping Panama. On January 26, 2016, the ship transited the new set of locks on its way from Piraeus, Greece to Asia. The number of Neopanamax vessels using the Panama Canal increased steadily from 59 in July to 154 in December 2016. By the end of the year, 581 Neopanamax vessels had passed through the expanded Panama Canal. In the first few months after opening the third lane, the ACP restricted the number of Neopanamax ships that could transit to four vessels per day, two in each direction. Later in the year, this number was increased to six Neopanamax ships per day. Recently, the OOCL containership France, rated at 13,952 TEU, transited the new locks in late June on route to Atlantic ports. Neopanamax transits moving west included Gulf and Texas exports that benefited from lower ton-mile costs on Asian lanes.
1.3 Energy and Neopanamax Size Ships
Natural gas liquefaction plants are planned at several Gulf and Texas locations, although low energy prices are slowing down both the investment funding and construction schedules. It is likely, however, that in the next seven years, LNG liquefaction plants will come on stream at the Texas ports of Corpus Christi, Beaumont/Port Arthur, and in the Houston channel. This should drive an increase in Texas deepwater port economic activity. The strength of the increase will depend on global prices, which should increase in the medium term. Currently, margins on many energy products like oils, resins, and plastics are slim and this favors the traditional locations, where many of the capital costs are already sunk, as the alternative, competitive supply chains need capital investment to complete the routing.
Figure 1.4 shows the LNG tanker GALEA passing west through the new lock system. Flagged in Singapore and owned by STSCO in London, it weighs 115,000 tons loaded and is currently on a regular route to Peru, returning empty to the Gulf area. Global demand for this commodity is predicted to rise for strategic, economic, and environmental reasons, all of which suggest that Gulf ports in general, and those in Texas in particular, are likely to face strong growth
4 Panama Canal Authority. “Advisories to Shipping,” Canal de Panamá, accessed January 07, 2017, http://www.pancanal.com/common/maritime/advisories/index.html.

6
in energy exports in the coming decade. This also suggests that the Panama Canal should capture an increased share of these ship movements.
Figure 1.4: LNG Tanker Galea Transiting the New Panama Locks, 2017
Naval architects have increased the size of containerships substantially in the first two decades of the 20th century, lowering the ton/box per mile operational costs. However, a number of countervailing issues erode this efficiency. First, there must be sufficient demand to fill the ships to the breakeven point where profit exceeds cost. Second, ships make money only when they are moving, so the larger ships were introduced to reduce port calls. Third, port terminals have to aggressively unload and load the ships, which means that some terminals must provide 24/7 service (driving up labor costs), purchase new equipment (such as cranes), and enlarge storage areas for both full and empty boxes. In addition, channel depth has to be at least 50 ft. to allow the largest ships to enter and leave port terminals. A concern for metropolitan and state planners like TxDOT is that higher volumes of boxes make their way onto highways and contribute to congestion and pollution. The supply chain impacts of large volumes of boxes arriving at gateways like marine ports still are working their way through the pricing system, sometimes creating external costs not reflected in the shipping prices.5 Bulk ship owners—for both liquid and dry commodities—ramped back from the limits that naval architects offered in the 1960s and it remains an open question as to which containership size is optimum for early 21st century containerships6.
5 Federal and sometimes state or city funds contribute to channel deepening and projects like the raising of the Bayonne Bridge at Port New York. 6 Journal of Commerce. “How Big is Big Enough? Ocean carriers say megaship sizes are maxing out. Analysts disagree.” June 26, 2017. V.18 N.13

7
As predicted in the summary of an earlier report from this study—0-6690-2 CTR—lines are sending larger ships than predicted through the Canal to U.S. East Coast ports using ships that have “cascaded” from Asia–Europe Suez routes now serviced by the largest ships described above. Multiple services using the Panama Canal are now being tested with 13,000 TEU ships displaced from Suez and other global routes. This has sharply driven up the tonnage/transit factor on the Canal to ten and revenue has increased 12.5 percent in the last eight months ending June 2017. ACP states that it has paid off 60 percent of the expansion bonds from operating revenues and will start paying the final tranche in 2019.7
In June 2017, ACP reported that it now had 15 weekly Neopanamax container services, 11 Asia–Asia East Coast, 1 pendulum, 1 Asia–Caribbean, and 2 South America West Coast–Europe services with more to come. Between June 26, 2016 and June 9, 2017, 727 Neopanamax ships used the new locks and 14 weekly Panamax loops used old locks.
An important commodity not captured in the original consultant forecasts for both ACP and Texas is energy. During the first six months of 2017 the canal transited 465 liquid petroleum gas (LPG) and 133 LNG ships (see Box 1). LPG/LNG currently moves from Texas and Louisiana to the west coast of Mexico and Asia.
ACP has admitted that improvements are needed to raise throughput while maintaining safety at the new locks. A new system, using tugs rather than stabilizing chains and electric locomotives, is still being perfected and there have been 15 reports of damage to ships. In addition the lock fenders need to be repositioned, as they were being scraped at some sites. ACP is shelving plans to build a new container terminal at Corozal, although plans to enlarge the terminals at each side of the canal are going ahead as scheduled. These could also be transshipment points for Gulf port terminals on future service strings for smaller Panamax containerships. Future ACP plans also include a logistics park, new roll-on/roll-off facility, and a foreign trade zone, so it is clear that ACP is trying to provide a full service for ship operators—perhaps including toll discounts for service—and not simply offer a bypass for maritime trade.
Asian imports through Gulf ports in 2017 have jumped 40 percent and much of this is attributed to large containerships in the 5000–8500 TEU class, impacting Port Houston for Texas imports. More significant in many respects is the growth of energy exports of the Gulf and the need to deepen channels not just for containerships but for all bulk ships, especially those moving energy in different forms to export markets along the west coast of South American and Asia.
Larger containership services are now being introduced using the Panama Canal to directly serve U.S. Atlantic ports such as Savannah, Charleston, Virginia, and ultimately New York. These pass several Caribbean hubs ports that could be used for Gulf transshipment services. Transshipment has a number of advantages for Texas ports, notably Houston, since the “hub and spoke” or “rotational” systems use smaller ships to access Gulf ports, which lowers many costs—both capital and operational—facing Gulf Port Authorities
Container slot overcapacity in the major trade lines began almost two decades ago as new, larger classes of containership entered global service8. The last three financial years have been
7 Dupin, R. “Special Coverage: Panama Canal’s Transit to the Future.” American Shipper, July 21, 2016. 8 Wilmington, R. “Post-Panamax Prevails.” Containerisation International Yearbook, London, 2001.
Box 1: LPG Transits “Gas carriers have been running the same number of ships through the old locks as last year but in 2017 they have run 431 very large gas tankers through the new locks, which was an unexpected revenue earner for us.” Jorge Quijano, ACP Administrator
8
tumultuous in the containership sector, with many steamship companies suffering massive losses. The latest news, reported in July 2017, stated that the Chinese conglomerate COSCO Shipping will take a majority share in Orient Overseas International, the holding company for the Hong Kong container carrier OOCL, making it the third-largest single company in TEU slots (2.21 million). Closely following this is another recent merger between CMA CGM9 and APL (American President Lines) at 2.19 million TEU.
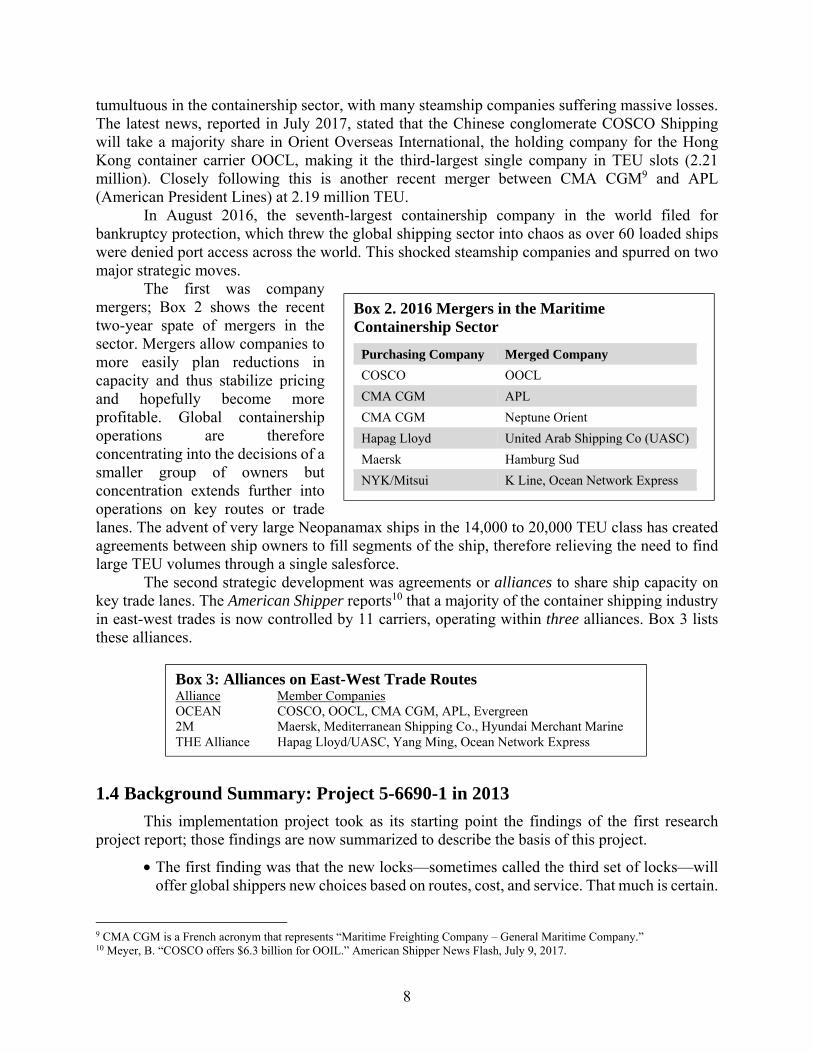
In August 2016, the seventh-largest containership company in the world filed for bankruptcy protection, which threw the global shipping sector into chaos as over 60 loaded ships were denied port access across the world. This shocked steamship companies and spurred on two major strategic moves.
The first was company mergers; Box 2 shows the recent two-year spate of mergers in the sector. Mergers allow companies to more easily plan reductions in capacity and thus stabilize pricing and hopefully become more profitable. Global containership operations are therefore concentrating into the decisions of a smaller group of owners but concentration extends further into operations on key routes or trade lanes. The advent of very large Neopanamax ships in the 14,000 to 20,000 TEU class has created agreements between ship owners to fill segments of the ship, therefore relieving the need to find large TEU volumes through a single salesforce.
The second strategic development was agreements or alliances to share ship capacity on key trade lanes. The American Shipper reports10 that a majority of the container shipping industry in east-west trades is now controlled by 11 carriers, operating within three alliances. Box 3 lists these alliances.
1.4 Background Summary: Project 5-6690-1 in 2013
This implementation project took as its starting point the findings of the first research project report; those findings are now summarized to describe the basis of this project.
• The first finding was that the new locks—sometimes called the third set of locks—will offer global shippers new choices based on routes, cost, and service. That much is certain.
9 CMA CGM is a French acronym that represents “Maritime Freighting Company – General Maritime Company.” 10 Meyer, B. “COSCO offers $6.3 billion for OOIL.” American Shipper News Flash, July 9, 2017.
Box 3: Alliances on East-West Trade Routes Alliance Member Companies OCEAN COSCO, OOCL, CMA CGM, APL, Evergreen 2M Maersk, Mediterranean Shipping Co., Hyundai Merchant Marine THE Alliance Hapag Lloyd/UASC, Yang Ming, Ocean Network Express
Box 2. 2016 Mergers in the Maritime Containership Sector
Purchasing Company Merged Company
COSCO OOCL CMA CGM APL CMA CGM Neptune Orient Hapag Lloyd United Arab Shipping Co (UASC) Maersk Hamburg Sud NYK/Mitsui K Line, Ocean Network Express

9
• The second finding was that the impact of the new locks on particular ports and trading partners will vary over time and their use by larger (post-Panamax) vessels will be linked to specific trade lanes, commodities, trends in geographic labor and transportation costs, future free-trade agreements, and advancements in maritime-related technology, among other factors.
• Beyond these two facts, there is no agreement among experts about the likely pace or scale of future port activity due to the Panama Canal expansion. Disagreements even exist among officials within the same organizations and ports. Why?
• As increasingly larger (post-Panamax) containerized and non-containerized vessels sail directly to and from U.S. ports, there will be fewer ports of call and services may be further consolidated through vessel sharing agreements among steamship lines. To maximize revenue and maintain schedule integrity, ships must spend as little time as possible in port. With few exceptions, the likely winning ports are open to speculation.
• To keep their larger vessels at sea for as long as possible, steamship lines may well increasingly use terminals in transshipment ports (such as Freeport, Bahamas; Kingston, Jamaica; Caucedo, Dominican Republic; and Colon, Panama) to transfer containers to smaller feeder ships that carry shipments throughout the Caribbean, South and Central America, and the U.S. Gulf and East Coasts. The growth in near-sourced manufacturing will further boost these feeder services. Moreover, logistics centers are being planned around Caribbean transshipment hubs. These logistics centers offer steamship lines the possibility of filling their vessels with Caribbean goods bound for Asia on their backhauls.
• Western railroads will act to protect their market share in the face of future Panama Canal competition. Over the past five years, the Burlington Northern Santa Fe (BNSF) and Union Pacific (UP) rail lines have invested $12 billion in both facilities and mainlines to serve Southern California alone. This sum is more than double the $5.2-billion cost of expanding the Panama Canal. U.S. West Coast ports and railroads have the advantage of being able to engage in differential pricing by market segment and could lower prices for services with slower transit times if they feel pressure from all-water services through the Panama Canal. Railroads also have the ability to price shipments on a door-to-door basis.
• Another major consideration is the extent to which future manufacturing will migrate from China to Southeast Asia and the Indian subcontinent, including Bangladesh and Pakistan. The closer that U.S. trading partners are located to the west and south of Singapore, the more the Suez Canal becomes the preferred route to the U.S. East Coast. As previously mentioned, two-way trade between the U.S. and Southeast Asian countries has tripled over the last 20 years.
• Finally, the lack of adequate port and surface transport infrastructure in foreign countries may well pose a significant obstacle to future trade. With the exception of Chile and Panama, growth in trade has far outpaced infrastructure development throughout Latin America. This is particularly true for Brazil, which only recently began taking steps to rectify problems. With the exception of Singapore and Malaysia, the same applies to the remainder of Southeast Asia and the Indian subcontinent.
10
The Texas economy will benefit from the new Panama Canal locks, built at no cost to the
U.S. yet strengthening economic activity in the state in ways described above. At this point, the locks still figure as future opportunities for growth rather than an established feature of Gulf trade. Weakness in the shipping sector suggests that strategic moves will be conservative in nature and subject to revision if not found profitable. Railroad systems will be priced to be competitive with Panama Canal services, limiting container import growth rates. Shippers will have more alternative supply chains, which will be good for economic growth. Direct ship calls rather than transshipment will be the predominant marine Gulf system but changes in Asian-Gulf lanes could arise relatively quickly. Any real change would come first through a trial period to see if the change creates competitive results. Most Gulf container port administrators think the current system will prevail, as will be discussed in the remaining chapters.
These strategic issues are more compelling if demand rises strongly, particular on container lanes. The next chapter considers the challenges of forecasting global trade and the role of the maritime sector in supporting both U.S. and Texas import and export supply chains.

11
Chapter 2. Forecasting Demand in the Global Maritime Sector 2015–2020
This chapter discusses the status of global maritime sector demand during the year June 2016 to May 2017, as the sector navigated one of the most difficult periods in recent history, including its response to the new Panama Canal locks. In almost all shipping categories, demand was weak and ship owners undertook a variety of actions—mergers, alliances, furloughs, premature scrappage—to balance supply and demand. Company survival itself was at stake, as was shown when Hanjin, the world’s seventh-largest containership operator, declared bankruptcy in September 2016.
The global economic situation in the first half of 2017 remains finely balanced between (a) maintaining current demand and building out into a growth cycle or (b) slipping further towards recession that may create another five years of recovery before stabilizing. Robustness of the global economy is essential for a healthy maritime shipping industry since new ship orders must be placed years ahead of actual delivery into service. Today’s economy is not what the ACP expected in 2003 when they determined the financial terms of the bonds required to finance the new locks (based on the findings of a series of consultant studies).
Five events, unidentified with any degree of precision in 2003,11 confounded the forecasts of global maritime demand as they related to Texas. These, in order, were:
1. The Great Recession of 2007–2010,
2. A strong U.S. dollar that raised prices on U.S. exports,
3. Introduction of mega containerships that significantly exceeded the dimensions of the new Panama Canal locks and Gulf Port main channels,
4. The election of President Trump and resulting U.S. withdrawal from the Trans-Pacific Partnership, and
5. The importance of global energy and chemical exports to Gulf States in general and Texas in particular.
This section examines several indicators that offer evidence on the short-term future direction of global trade. It should be recognized that measuring the U.S. economy is challenging, given the wide variety of counter-balancing impacts. Texas, however, is poised for stronger growth than most U.S. states because of oil and gas production, chemical plant expansions, and the huge benefits—almost 30 percent of gross state product—derived from NAFTA trade of all types with Mexico.
The following sectors are now presented.
2.1 Manufacturing
A weak manufacturing sector is an indicator of potential economic contraction. American consumers tend to reduce purchases of costly items, such as appliances or electrical goods, before they cut back on more basic services. In the first half of 2017, U.S. factory output recovered from 11 The Panama Canal Consultants examining demand did offer three levels of estimation—worst case (slowest economic growth and trade assumptions), best case (fastest growth assumptions), and base case (reflecting moderate growth assumptions.

12
levels of 2015/2016 showing a mild recovery in the EU and Asian economies. The Institute for Supply Management’s (ISM) manufacturing index (referred to as the PMI), one of the metrics used to measure manufacturing performance, has a breakeven value of 50 percent between growth and contraction12. The Manufacturing PMI in the U.S. rose to 57.8 in June 2017 from 54.9 in May and way above the market expectations of 55.2. The reading pointed to the strongest rate of expansion since August 2014, as output, new orders, and employment grew at a faster pace. Forecasted growth is shown in Figure 2.1 and suggests a higher 2017 output as compared to 2016, benefiting all transportation modes.
Figure 2.1: ISM’s PMI July 2016–June 201713
The ISM panel generally reflects expanding business conditions; new orders, production, employment, backlog, and exports all grew in June compared to May and supplier deliveries and inventories have been struggling to maintain the pace of production.
2.2 Stockpiles
Another classical indicator of economic contraction occurs when companies stock more products than consumers are willing to purchase. These companies generally first increase stockpiles as they wait to see the direction of market demand. If a downward trend is established, manufacturers must then either reduce new orders or stock more items than the market demands. In June, most of the key indicators rose sharply, bouncing back from some easing in the springtime months. This included new orders (up from 59.5 to 63.5), production (up from 57.1 to 62.4), exports (up from 57.5 to 59.5), and employment (up from 53.5 to 57.2). The pace of hiring in June was a 15-month high, and the strength of the export orders remained encouraging, especially given the strength of the U.S. dollar and a number of global challenges experienced over the past two years.
Two other highlights are worth mentioning. First, prices for raw materials (down from 60.5 to 55.0) continued to decelerate, pulling back from April’s pace (70.5), which was the quickest 12 See: https://www.instituteforsupplymanagement.org/ISMReport/MfgROB.cfm?navItemNumber=30118 13 See: https://tradingeconomics.com/united-states/business-confidence/forecast
13
rate since May 2011. This mirrors the slower growth in input prices seen in other data. Meanwhile, inventories (down from 51.5 to 49.0) contracted in June after expanding for two straight months in April and May. Overall, stockpiles remain quite low, which should necessitate healthy gains in production moving forward to meet additional demand.
2.3 U.S. Trade: Exports and Imports
The U.S. trade deficit14 rose in June 2016 to $45 billion up from $41 billion in May 2016, reflecting both a strong U.S. dollar and a growing weakness in global demand. Year-to-date, the goods and services deficit reflected an increase in the goods deficit of $3.8 billion to $66 billion or 2.3 percent and an increase in the services surplus of $0.3 billion to $22 billion or 4.3 percent. Analysts suggest that modest global growth and a strong currency will remain challenges for U.S. exporters going forward. The 2015 U.S. deficit in petroleum products narrowed to $82.5 billion, the lowest value since 1999. Falling oil prices reduced the value of U.S. exports of petroleum products—chemicals, petrochemicals, and oils—to $99.5 billion but U.S. imports of petroleum products fell by 45.5 percent to $182 billion, the lowest level since 2004. Imports of food, capital goods like machinery, foreign-made autos, and auto parts all set records in 2015 in part because a stronger dollar made foreign goods more competitive in the U.S. market. It should be recognized, however, that over a third of the foreign-made autos and auto parts came from Mexico and Canada and boosted the growing success of NAFTA.
2.4 Bond Market
A reliable indicator of recession has been a drop in longer-term interest rates, such as the yield on a 10-year Treasury note, along with a rise in shorter term rates such as the yield on a three-month Treasury note. When longer-term rates fall below short-term ones, it produces an inverted yield cover, which suggests that investors expect the economy to slip into recession and lower long-term rates. In early 2016, the chances that the U.S. economy might fall back into recession kept the Federal Reserve from raising rates but three rate hikes have occurred since December 14, 2016. The last, on June 14, 2017, put interest rates into the 1–1.25 percent range, reflecting a strengthening labor market and an increased growth in economic activity. The Federal Reserve is taking a cautious approach but it is now clear that the U.S. economy is on solid ground, which in turn signals stronger growth in transportation services.
2.5 Recession Indicators
Most of the recent historical recession triggers—the stock market in 2001 and housing in 2008—are currently at levels approaching those found in those years. Global stock markets are showing weaknesses in key sectors, particularly oil and banking, and prices in these and related sectors have dropped significantly over the past 12 months. Companies in a wide range of areas are also reporting lower sales and potentially lower dividends in 2017, suggesting that consumers are carefully managing their investments. Investor confidence is diminished due to slower growth in China and banking exposure to loans in a variety of countries and companies related to the energy, mining, and bulk commodity sectors. The decision of the British vote (Brexit) in May 2016 to leave the European Union (EU) was unexpected, which unnerved markets and currencies in the
14 See: http://www.bea.gov/newsreleases/international/trade/tradnewsrelease.htm
14
EU and heralds a period of uncertainty while the details are worked out and new trade alliances with the UK are determined. It appears that the UK is focusing first on a trade agreement with the U.S. but this will take time to negotiate15. Finally, the U.S. repudiation of trade agreements like the Trans Pacific Partnership (TPP), the renegotiation of NAFTA and a move back to bi-lateral trade agreements creates uncertainty and caution throughout the world.
Global trade continues to grow slowly in key sectors in 2017, a pattern that may extend well into 2018. The variations in global trade since 2000 have impacted supply and demand in all maritime sectors. Container services were first impacted by steamship companies willing to place orders—on admittedly good terms—for larger ship designs, causing an oversupply of container slots on many key routes. In the period beginning 2015, steamship companies have entered into alliances on scheduled liner routes, sharing the capacity between alliance members. This practice creates additional work at terminals, where the alliance member boxes are sorted and allocated to different carriers. These additional costs have to be absorbed into the total supply chain costs and therefore reduce the total benefits from operating larger ships.
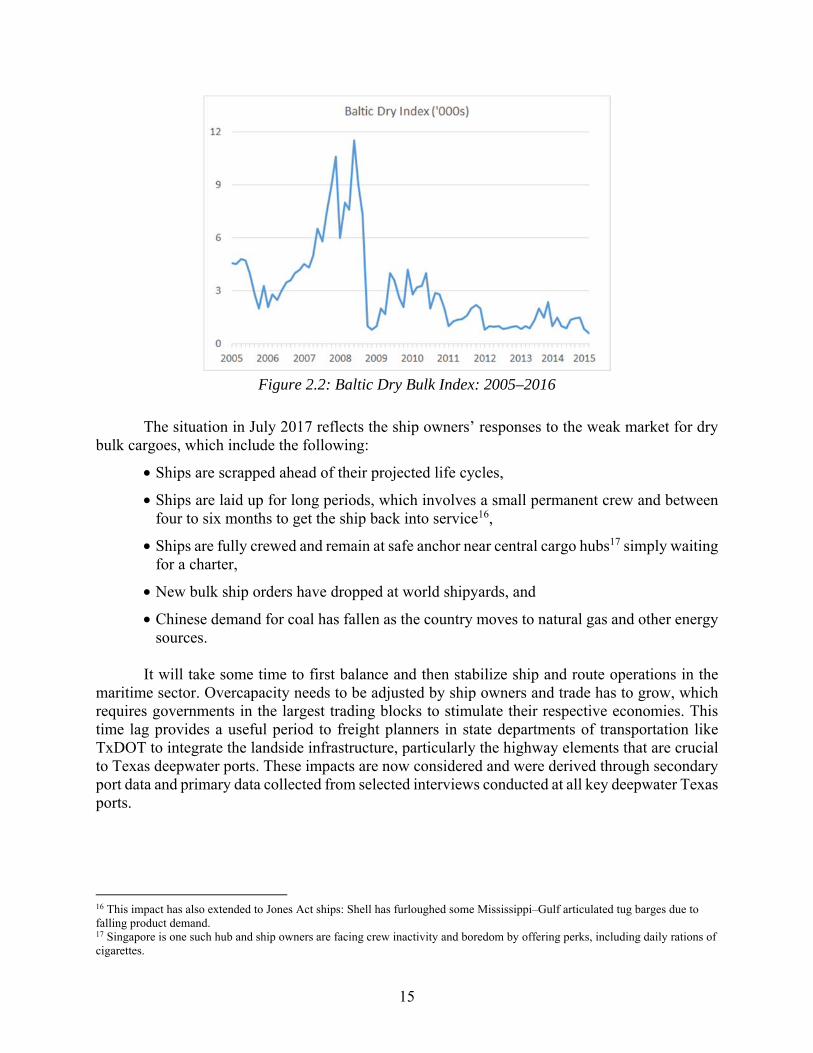
China’s economic growth has also fallen in the last two years and has impacted containerized exports to other nations. The biggest impact, however, is most evident in trade sectors where Chinese demand has been most dominant since 2011 and reflects the inputs needed by the Chinese economy which changes the focus from containers to bulk commodities. One measure used by maritime forecasters to estimate economic growth in this sector is the Baltic Dry Index. It measures the chartering rates for the ships—many large—carrying the trinity of dry commodities that reflect traditional economic growth, namely iron ore (steel), coal (energy), and grain (food). Index values for 2005–2015 are given in Figure 2.2.
The data since 2005 show that maritime dry bulk shipping demand rose strongly between 2005 and 2008, and then dropped precipitously during the period of the Great Recession. It then slightly recovered only to fall again, including the fall of 65 percent in the second quarter of 2015. The data for 2017 show a small positive increase in 2016 but still remains low around 1000 in Figure 2.2 as of July 2017. However, a note of caution is necessary because the Baltic Dry Index is a reflection of both demand and supply. Ship owners in the dry bulk sector of the global maritime industry followed their counterparts in the container ship sector in the early 2000s and ordered a significant number of new ships to come into service from 2008 onwards. Ship supply in all classes is inelastic—a percentage of the new ships are ordered in anticipation of increasing global demand—and the recession of 2007–2010 first caused the index to drop; the contraction in trade led by China has prevented a recovery in dry bulk freight rates.
15 The UK has not negotiated a trade agreement for almost three decades and had only about one-tenth of public officials at the time of the Brexit vote who could work on a new one when compared with Mexico.
15
Figure 2.2: Baltic Dry Bulk Index: 2005–2016
The situation in July 2017 reflects the ship owners’ responses to the weak market for dry bulk cargoes, which include the following:
• Ships are scrapped ahead of their projected life cycles,
• Ships are laid up for long periods, which involves a small permanent crew and between four to six months to get the ship back into service16,
• Ships are fully crewed and remain at safe anchor near central cargo hubs17 simply waiting for a charter,
• New bulk ship orders have dropped at world shipyards, and
• Chinese demand for coal has fallen as the country moves to natural gas and other energy sources.
It will take some time to first balance and then stabilize ship and route operations in the
maritime sector. Overcapacity needs to be adjusted by ship owners and trade has to grow, which requires governments in the largest trading blocks to stimulate their respective economies. This time lag provides a useful period to freight planners in state departments of transportation like TxDOT to integrate the landside infrastructure, particularly the highway elements that are crucial to Texas deepwater ports. These impacts are now considered and were derived through secondary port data and primary data collected from selected interviews conducted at all key deepwater Texas ports.
16 This impact has also extended to Jones Act ships: Shell has furloughed some Mississippi–Gulf articulated tug barges due to falling product demand. 17 Singapore is one such hub and ship owners are facing crew inactivity and boredom by offering perks, including daily rations of cigarettes.
16
Chapter 3. Texas Deepwater Ports: Activities and Panama Canal Impacts
Texas deepwater ports are the maritime trade gateways for state, regional, and national supply chains. Specialization, rather than pure competition, remains the key strategic focus for most Texas ports, although they combine forces at times to develop legislative programs of mutual benefit to promote during the State Legislative sessions. In 1992 TxDOT planning was extended to embrace all modes of transportation, although the agency still predominately addresses highway needs. In 2010 it formed a freight planning team that includes all modes—public and private—and has developed a multimodal planning focus that incorporates Texas’ deepwater ports. TxDOT also has a small Maritime Division that concentrates on working with the Army Corps of Engineers on dredging port channels and situating dredged material from the 400-mile Gulf Intracoastal Waterway that links Texas ports with other terminals in Louisiana and on the Mississippi River.
TxDOT planning concentrates mostly on improving landside connectivity, which is carried out at the District level in terms of detailed planning and construction18. TxDOT also has a Rail Division, which is also relatively small in terms of staffing, although they work with TxDOT Commissioners on specific strategic initiatives, such as gaining federal funding. TxDOT has semi-annual meetings between representatives of Texas deepwater and shallow draft ports—the Texas Ports Advisory Committee (TPAC)—and a TxDOT group comprising principally staff from the Maritime and the Transportation, Planning and Programming Divisions, particularly the freight planners. In the last two years, their work has concentrated on developing a Texas port investment program where individual ports offer matched funds to invest in specific projects that will improve port efficiencies19. However, the legislation for the program, though passed into state law, remains unfunded at this date.
Essentially, funding for almost all improvements at those ports likely to benefit from larger ships and new Asian routes has not come through TxDOT. The reality is that while some aspects of improving deepwater port connectivity are joint TxDOT-port activities, most port improvements have been left to local bonds (as in Houston) or private-port partnerships (as with Beaumont’s Jefferson Terminal or the Corpus Christi’s rail investments).
The next chapter examines operations at a selection of Texas deepwater ports and reports on the Panama Canal impacts on operations in the immediate- and medium-term planning horizons. It will consider exports as well as imports, both containerized and other commodities, which play critical roles in growing the Texas economy.
3.1 Port Houston
Port Houston is a major immediate beneficiary of the new locks simply based on the wide range of commodities handled at port facilities and terminals, especially because it is the Texas gateway for container imports and exports. The growth of the Texas population since 2000 reflects the “pull” of a large diverse economic base, anchored by the Texas Triangle, which is now
18 The new Corpus Christi Bridge ($900 million) was an exception to this process. 19 See: https://ftp.dot.state.tx.us/pub/txdot-info/tpp/giww/port-capital-plan-2015-16.pdf

17
recognized as a U.S. megaregion—one of 12—where two-thirds of the U.S. population is predicted to live and work in 205020. Table 3.1 provides basic details about Port Houston.
Table 3.1: Port Houston Details Location Harris County Channel Depth (Mean Lower Low Water)
45 feet
Channel Width 530 feet
Air Draft Dependent on location. Unlimited at container terminals. As low as 135 feet at turning basin.
Road Connectivity IH 10, IH 45, IH 610E
Rail Connectivity BNSF, Kansas City Southern, UP, Gulf Coast Rail District, Port Terminal Railroad Administration
2016 Total Exports 87 million tons Primary Export Commodities
Non-crude oils (bitumen/petrol), organic chemicals, petroleum gases, petroleum coke and bitumen products, cereals, plastics
2016 Total Imports 70,223 million tons
Primary Import Commodities
Containerized goods, crude oil, non-crude oil, various mix of other commodities (primarily pebble/concrete/rock, organic chemicals, and iron)
Port Houston, which includes facilities operated by the Port of Houston Authority (PHA)
and privately operated facilities along the Houston ship channel, is the largest port in Texas. It handles more waterborne tonnage than any other port in the United States21 and is the premier gateway for containerized cargo on the Gulf Coast. Port Houston senior managers believe they will see increased container traffic, if only due to population growth across the state of Texas. Whether the container terminals will see more vessels calling is unknown but likely. Currently, port officials are confident the terminals will service larger ships and not see fewer calls. Since its opening, the port has serviced calls by Neopanamax vessels up to 10,000 TEU that have transited the new Panama Canal locks.
3.1.1 Port Houston Container Infrastructure—Existing and Planned Improvements
The Barbours Cut facility is located in the city of Morgan’s Point at the northwest corner of Galveston Bay.22, 23 Barbours Cut is accessed by a recently deepened 45-ft channel. Landside, the container terminal is accessed by local roads that connect to SH 146 near SH 225. At the time of the last interview for this project, dray traffic congestion at Barbours Cut Boulevard and SH
20 See: http://www.america2050.org/megaregions.html for the origins of the term. Substantial work has been undertaken by federal and university entities and the subject continues to grow. See: http://ctr.utexas.edu/wp-content/uploads/pubs/0_6627_1.pdf for a Texas perspective. 21 USA Trade Online. U.S. Census Bureau. Accessed April 1, 2017. https://usatrade.census.gov/. 22 “Welcome to the Port, Port of Houston Authority.” Personal communication with officials at the Port of Corpus Christi. 23 “Port of Houston Authority Map of Properties.” Personal communication with officials at the Port of Houston.
18
146 intersection was identified as the prime highway bottleneck impacting container flow at the port. The terminal is the largest intermodal facility on the Gulf Coast. UP and BNSF both offer Class-1 railroad access to the terminal and to over 160 companies via Port Terminal Railroad Authority network.
The Barbours Cut terminal includes six continuous 1,000-ft berths. It contains a total of 47 cranes, including 11 wharf cranes (WC) and 36 rubber-tired gantry (RTG) cranes. The terminal has room for approximately 24,500 grounded TEU and can provide power outlets (termed reefer plugs) for more than 2,500 refrigerated units. The trucking entrance to the terminal includes 27 total lanes—15 inbound and 12 outbound—and 8 optical character recognition (OCR) lanes at the gate. Barbours Cut, as well as the Bayport terminal, uses heavily automated systems to facilitate quick movement at the terminals entrance and exit gates, as well as on terminal grounds. PHA has recently replaced most cranes at both terminals with cranes capable of handling Neopanamax vessels.
The Bayport container terminal is located in the Bayport Industrial District, on the west side of Galveston Bay.24 It currently offers 3,300 continuous feet of berths. It contains a total of 36 cranes—9 WC and 27 RTG units. Entrance on and off property is facilitated by 32 total lanes—20 inbound and 12 outbound lanes—with 6 OCR gates inbound and outbound.
The Bayport facility is in the middle of an expansion. At full build-out, PHA plans for Bayport to have seven berths and a yearly capacity of 2.3 million TEU per year. PHA is currently building an additional berth, and will build the remaining three as demand dictates. PHA is also improving the rail connections at Bayport.
Port Houston handles a wide variety of commodities but containerized cargo—both imports and export—play an important part in future port revenues and profits. In a Journal of Commerce interview25 Port Houston Executive Director Ray Guenther stated, “Targeted investment will boost the port container capacity to 5 million TEU and we can grow as quickly as needed to handle the larger ships that can now come through the Panama Canal.” He confirmed that “the Gulf sweet spot will be the 8,000 to 10,000 TEU ship.” This also supports current Port Houston planners who believe that transshipment at either Panama or in the Caribbean is not viable in terms of lowest TEU cost.
3.1.2 Port Houston Non-Containerized Asian and Pacific Commodities Likely to Benefit from the New Panama Canal Locks26
Port Houston includes an array of over 150 private industrial facilities that could benefit from the expanded Panama Canal.27 Private petrochemical and petroleum-based facilities line the Houston Ship Channel. Plastic resin exports in particular are expected to rise strongly at the Houston Ship Channel.28 Together, these developments, when combined with expected plastic resin ventures by various major petrochemical companies, are expected to support 500,000 TEU
24 Ibid. 25 See: https://www.joc.com/port-news/us-ports/port-houston/houston-container volumes-soar-result-new-petrochemical-plants_20160220.h 26 “USA Trade Online.” U.S. Census Bureau. Accessed April 1, 2017. https://usatrade.census.gov/. 27 Port of Entry: Houston - Port of Houston Impact to the Texas Economy, 2015. Publication. 2016. Accessed December 20, 2016. https://comptroller.texas.gov/economy/docs/ports/overview-houston.pdf. 28 “Port Houston Navigator.” Issued Fall 2016. Accessed April 29, 2017. https://issuu.com/portofhouston/docs/fall_navigator.
19
of traffic at Port Houston.29 Plastics and related products will be containerized before arriving at Port Houston container facilities, which will impact the highways within a 30-mile radius of the port—this area will be designated for overweight corridors following legislation passed in the 2017 State Legislature. Table 3.2 gives a small number of both production and packing plants that will impact Port Houston in the near future.
Table 3.2 Examples of Port Houston Plastics Production and Packing Plants
LaPorte Baytown
● A 470-kiloton/year high-density polyethylene facility; construction was completed in 2016
● A 500-kiloton/year facility scheduled for completion in 201930, 31
● A plastic resin packing plant at AmeriPort Industrial Park.32 The plant will provide off-plant packaging as well as railcar storage and switching services.
● A distribution and manufacturing facility at the Cedar Port Distribution Park. This plant, designed to handle more than two billion pounds per year of plastic resins, is expected to open before 2019.33
A number of other developments are expected around Port Houston in the coming years.
Notably, several developments are expected at or near the profiled Bayport Container Terminal, such as a 300,000-square-ft temperature-controlled facility for perishable products expected to come online by summer 2017 and a 56-acre “built-to-suit” facility with dock and rail access34, 35. There is considerable growth in other activities that will benefit Port Houston trade. Tanking operations are expanding and Enterprise PLC recently announced another facility at Morgan’s Point. Although these are on non-Port Authority land, all are likely to feed chemicals to Asia through the Panama Canal
Port Houston exported over 26.2 million tons to Asia in 2016, having shown steady growth over the past several years. These exports to Asia increased from 19.5 million tons in 2015. Petroleum gases comprised over 40 percent of all Asian exports, with nearly 3.3 million tons of non-crude oil exports and over 2.2 million tons in petroleum coke and bitumen products. Petroleum 29 “Houston Container Volumes to Soar on New Petrochemical Plant Demand.” February 20, 2016. Accessed April 09, 2017. http://www.joc.com/port-news/us-ports/port-houston/houston-container-volumes-soar-result-new-petrochemical-plants_20160220.html. 30 “INEOS, Sasol Break Ground on $500M La Porte HDPE Plant.” BIC Magazine. December 08, 2014. Accessed March 09, 2017. http://www.bicmagazine.com/expansions/downstream-subsection/ineos-sasol-hdpe-plant-laporte-groundbreaking/. 31 “LyondellBasell Will Build High Density Polyethylene Plant at La Porte, Texas, Complex.” LyondellBasell. September 9, 2016. Accessed March 15, 2017. https://www.lyondellbasell.com/en/news-events/corporate--financial-news/lyondellbasell-will-build-high-density-polyethylene-plant-at-la-porte-texas-complex/. 32 Esposito, Frank. “Resin Packaging Plant under Construction on Gulf Coast.” Plastics News. December 21, 2016. Accessed March 02, 2017. http://www.plasticsnews.com/article/20161221/NEWS/161229979/resin-packaging-plant-under-construction-on-gulf-coast. 33 Smith, Cara. “Global Plastics Distributor Nabs 200 Acres in Southeast Houston.” Bizjournals.com. October 25, 2016. Accessed April 02, 2017. http://www.bizjournals.com/houston/news/2016/10/25/global-plastics-distributor-nabs-200-acres-in.html. 34 Carder, Doug. “Cold Facility Planned for Port of Houston.” The Packer. February 17, 2016. Accessed April 1, 2017. http://www.thepacker.com/news/cold-facility-planned-port-houston. 35 Meredith, Catherine. “Ridge Development Will Develop 55 Acres at Port of Houston.” Bisnow. February 19, 2016. Accessed March 28, 2017. https://www.bisnow.com/houston/news/industrial/ridge-development-will-develop-55-acres-at-port-of-houston-56208.
20
gases nearly doubled over 2015 levels, as did petroleum coke and bitumen. Non-crude oils have stayed mostly steady.
Over 18.7 million tons of crude oil was imported from Asia through Port Houston facilities. Crude oil comprised over 40 percent of the mix, at 8.6 million tons. In addition, 1.6 million tons non-crude oil was imported. Over 2.2 million tons of iron products were imported, as was 1.3 million tons of organic chemicals. A long list of commodities also came from Asia, including furniture, plastics, wood, aluminum, ceramics, and other container traffic. Overall imports increased from 17.3 million tons in 2015 but still lower than the 2014 level of 21.8 million tons. The 2016 crude oil tonnage was up, while iron imports had fallen from 2015 figures.
3.1.3 Containerized Plastic Resins
This section draws a nexus between the LNG and plastic resins—perhaps the two commodities best positioned to benefit from the expanded Panama Canal—and Texas’ statewide infrastructure by illustrating the supply chains for these two projects.
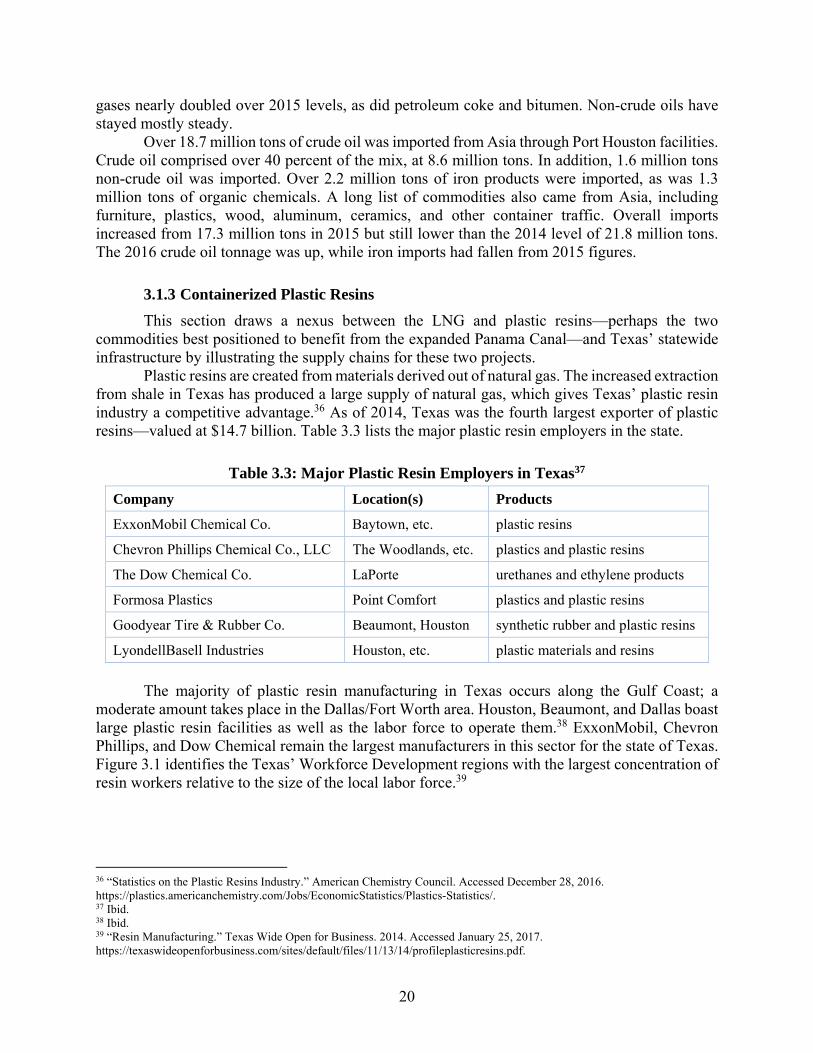
Plastic resins are created from materials derived out of natural gas. The increased extraction from shale in Texas has produced a large supply of natural gas, which gives Texas’ plastic resin industry a competitive advantage.36 As of 2014, Texas was the fourth largest exporter of plastic resins—valued at $14.7 billion. Table 3.3 lists the major plastic resin employers in the state.
Table 3.3: Major Plastic Resin Employers in Texas37 Company Location(s) Products
ExxonMobil Chemical Co. Baytown, etc. plastic resins
Chevron Phillips Chemical Co., LLC The Woodlands, etc. plastics and plastic resins
The Dow Chemical Co. LaPorte urethanes and ethylene products
Formosa Plastics Point Comfort plastics and plastic resins
Goodyear Tire & Rubber Co. Beaumont, Houston synthetic rubber and plastic resins
LyondellBasell Industries Houston, etc. plastic materials and resins
The majority of plastic resin manufacturing in Texas occurs along the Gulf Coast; a moderate amount takes place in the Dallas/Fort Worth area. Houston, Beaumont, and Dallas boast large plastic resin facilities as well as the labor force to operate them.38 ExxonMobil, Chevron Phillips, and Dow Chemical remain the largest manufacturers in this sector for the state of Texas. Figure 3.1 identifies the Texas’ Workforce Development regions with the largest concentration of resin workers relative to the size of the local labor force.39
36 “Statistics on the Plastic Resins Industry.” American Chemistry Council. Accessed December 28, 2016. https://plastics.americanchemistry.com/Jobs/EconomicStatistics/Plastics-Statistics/. 37 Ibid. 38 Ibid. 39 “Resin Manufacturing.” Texas Wide Open for Business. 2014. Accessed January 25, 2017. https://texaswideopenforbusiness.com/sites/default/files/11/13/14/profileplasticresins.pdf.

21
Figure 3.1: Plastic Resin Employment Concentrations40
The greatest demand for plastic resins lies in Asia. The information service IHS Markit shows in its chemicals forecasts that plastic resin exports from the U.S. will rise from 7.8 million metric tons to 11.2 metric tons by 2020. Asian demand for plastic resins will rise from 20.5 million metric tons to 25.3 million metric tons, over the same period. Petrochemical manufacturers in Texas are expected to increase plastic resin exports by 300,000 to 500,000 additional TEUs by 2020. The majority of these exports are destined for Asia.41
Plastics are created from hydrocarbon gas liquids and natural gas processing. In Texas, the plastic resin supply chain begins with the extraction of oil and natural gas. The oil or gas is then moved via pipeline to a refinery or gas processing plant. At the gas processing plant, natural gas is separated into methane and other natural gas liquids or NGLs, especially ethane. A pipeline again transports these products, including ethane, to a petrochemical plant—also known as a cracker facility. High-temperature furnaces in the plant crack the ethane and propane into ethylene and propylene. The ethylene and propylene travel via a pipeline to a plant where a catalyst gets added to the ethylene and propylene to form small plastic polyethylene pellets through the process of polymerization.42 Box 4 notes cracking is less costly along the Gulf Coast than using the naphtha alternative process.
40 Ibid. 41 Bonney, Joseph. “Container Line Services Hold Key to US Gulf Resin Exports.” Journal of Commerce. December 5, 2016. Accessed March 20, 2017. http://www.joc.com/port-news/us-ports/port-houston/container-line-rates-hold-key-us-gulf-resin-exports_20161205.html?destination=node%2F3310831. 42 “What Is a Cracker and Why Should I Care?” American Fuel & Petrochemical Manufacturers. 2017. Accessed February 10, 2017. http://education.afpm.org/petrochemicals/what-is-a-cracker-and-why-should-i-care/.
Box 4. Naphtha Cracking Ethylene is also produced from naphtha cracking at a higher cost. The gas vs. naphtha cracking dynamic is the key to why the U.S. Gulf Coast is globally competitive in plastics production. Jordan Frisby, Economic Analyst, Port Houston; July 2017
22
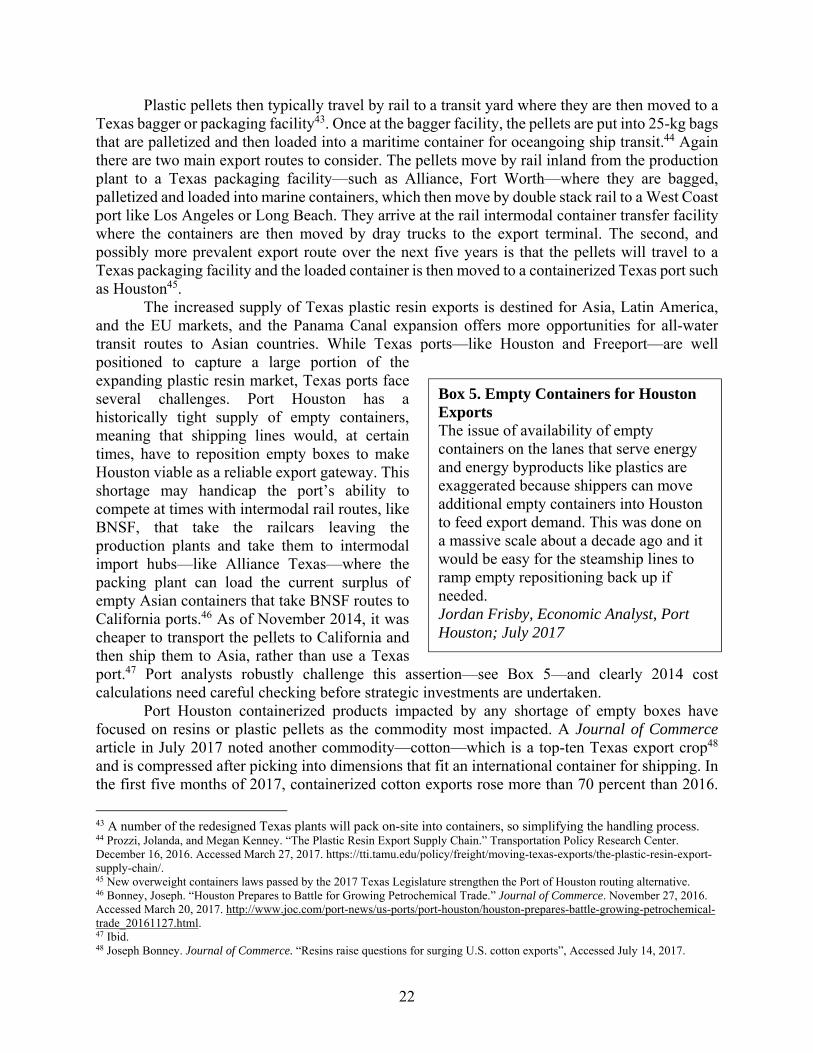
Plastic pellets then typically travel by rail to a transit yard where they are then moved to a Texas bagger or packaging facility43. Once at the bagger facility, the pellets are put into 25-kg bags that are palletized and then loaded into a maritime container for oceangoing ship transit.44 Again there are two main export routes to consider. The pellets move by rail inland from the production plant to a Texas packaging facility—such as Alliance, Fort Worth—where they are bagged, palletized and loaded into marine containers, which then move by double stack rail to a West Coast port like Los Angeles or Long Beach. They arrive at the rail intermodal container transfer facility where the containers are then moved by dray trucks to the export terminal. The second, and possibly more prevalent export route over the next five years is that the pellets will travel to a Texas packaging facility and the loaded container is then moved to a containerized Texas port such as Houston45.
The increased supply of Texas plastic resin exports is destined for Asia, Latin America, and the EU markets, and the Panama Canal expansion offers more opportunities for all-water transit routes to Asian countries. While Texas ports—like Houston and Freeport—are well positioned to capture a large portion of the expanding plastic resin market, Texas ports face several challenges. Port Houston has a historically tight supply of empty containers, meaning that shipping lines would, at certain times, have to reposition empty boxes to make Houston viable as a reliable export gateway. This shortage may handicap the port’s ability to compete at times with intermodal rail routes, like BNSF, that take the railcars leaving the production plants and take them to intermodal import hubs—like Alliance Texas—where the packing plant can load the current surplus of empty Asian containers that take BNSF routes to California ports.46 As of November 2014, it was cheaper to transport the pellets to California and then ship them to Asia, rather than use a Texas port.47 Port analysts robustly challenge this assertion—see Box 5—and clearly 2014 cost calculations need careful checking before strategic investments are undertaken.
Port Houston containerized products impacted by any shortage of empty boxes have focused on resins or plastic pellets as the commodity most impacted. A Journal of Commerce article in July 2017 noted another commodity—cotton—which is a top-ten Texas export crop48 and is compressed after picking into dimensions that fit an international container for shipping. In the first five months of 2017, containerized cotton exports rose more than 70 percent than 2016. 43 A number of the redesigned Texas plants will pack on-site into containers, so simplifying the handling process. 44 Prozzi, Jolanda, and Megan Kenney. “The Plastic Resin Export Supply Chain.” Transportation Policy Research Center. December 16, 2016. Accessed March 27, 2017. https://tti.tamu.edu/policy/freight/moving-texas-exports/the-plastic-resin-export-supply-chain/. 45 New overweight containers laws passed by the 2017 Texas Legislature strengthen the Port of Houston routing alternative. 46 Bonney, Joseph. “Houston Prepares to Battle for Growing Petrochemical Trade.” Journal of Commerce. November 27, 2016. Accessed March 20, 2017. http://www.joc.com/port-news/us-ports/port-houston/houston-prepares-battle-growing-petrochemical-trade_20161127.html. 47 Ibid. 48 Joseph Bonney. Journal of Commerce. “Resins raise questions for surging U.S. cotton exports”, Accessed July 14, 2017.
Box 5. Empty Containers for Houston Exports The issue of availability of empty containers on the lanes that serve energy and energy byproducts like plastics are exaggerated because shippers can move additional empty containers into Houston to feed export demand. This was done on a massive scale about a decade ago and it would be easy for the steamship lines to ramp empty repositioning back up if needed. Jordan Frisby, Economic Analyst, Port Houston; July 2017

23
In 2016 cotton exports rose 4 percent to 255,000 TEU. Figure 3.2 shows the destinations of U.S. cotton exports in 2016, with Asian counties dominating the market when measured in TEU. The category “other” is dominated by Mexico, where cotton, especially that grown in Texas, is shipped by rail and truck. Cotton exports from Texas through Port Houston would clearly use the Panama Canal on return services to Asia. The 2016 export volumes ranked Los Angeles/Long Beach highest at 115,000 TEU, followed by Savannah at 46,100 TEU, and Houston with 28,200 TEU.
Figure 3.2. Marine Containerized U.S. Cotton Exports 2016
As with resins, three issues underlie the concerns raised by containerized exporters: empty boxes, ship calls, and ship capacity. Port Houston has been a topic of concern from some shippers49, although the port continues to defend its ability to competitively ship exports efficiently. It has upgraded all aspects of its facilities continuously since 2000 and can handle most of the containerships in the global fleet. The container line sector remains unwilling to make significant changes as it recovers from bankruptcies, mergers, and over-capacity. However, if the sector identifies growing markets and lanes, it can easily ramp up capacity and alter call frequencies. There is every reason to be confident that Port Houston and other deepwater Texas ports can offer competitive services for shippers of resins, cotton, forest products, agriculture, and other export commodities.
3.1.4 Key Project Takeaways on Port Houston
Studying Port Houston highlights several key considerations and points relating to the expanded Panama Canal.
• Container traffic at Port Houston has grown in the last two years, particularly trade with eastern Asia. This trade already directly benefits from the expanded Panama Canal and TEU volumes are expected to grow.
49 Most recently at the May 2017 JOC Gulf Shipping Conference
24
• The nature of vessel traffic and patterns is difficult to predict. Port Houston will continue to see an increase in vessel traffic, but the size and frequency of container vessels that will call at Port Houston is as yet unknown. Larger ships will create more periods of high peak traffic at container terminals that may raise operating costs and prices.
• Port officials continue to assert that container traffic will, generally, follow the cheapest cost path. From a port’s standpoint, this requires speed and reliability dockside and high efficiencies at the inbound and outbound terminal gates and landside highway routes.
• Length of berths, storage area, and facilities directly affect the speed and reliability of a container terminal to service vessels. Delays and slowdowns dockside hurt the attractiveness of ports. “Container vessels are losing money if they are not moving” is a common maxim encountered in this research.
• Rail connections are important, but reliable road connections are vital to the movement of Port Houston containers to and from port property. This is particularly important for containerized exports of resins and plastics which can now be moved in
• Currently, backups at traffic signals at Barbours Cut Boulevard and SH 146 are negatively impacting drayage flows and this is under review with staff at the TxDOT Houston District. This was identified as one of the most important issues where TxDOT was involved and discussions are currently being held at the District level to explore various strategies to address and fund a solution.
• Containerized plastic resins for export will rise steadily during the 2018–2020 period as more Gulf and Texas petrochemical plant investments are completed and come on stream. Port Houston planners recognize that they will compete with West Coast ports in a number of Asian markets. A number of strategic pricing moves from the various members of the export supply chain to defend or increase market share is expected. On August 8, 2017, ACP announced a series of lower tolls aimed at stimulating Atlantic-to-Pacific backhauls50. Port Houston is ideally located to become the prime Gulf hub for containerized resins, especially since the 2017 Texas Legislature passed a law allowing permitted overloaded containers to operate on specific routes within a 30-mile radius of the port.
3.2 Port Corpus Christi
Port Corpus Christi is a major future global gateway for energy, although it has a narrower 2016 commodity portfolio than Port Houston, as shown in Table 3.4. Total oils and fuels tonnage (imports and exports) at Port Corpus Christi in 2016 represented over 60 percent of port overall tonnage and the share is growing as new pipelines come on stream. U.S. crude oil exports had not been allowed for over 40 years but a combination of a global glut and U.S. fracking operations (particularly in Texas) stimulated a change in U.S. legislation in late 2015 (Figure 3.3). Port Corpus Christi planners expect oil exports to have a regional impact on Gulf port tonnage.
50 Bonney, J. “Panama OKs new canal tolls aimed at big ships.” Journal of Commerce

25
Table 3.4: 2016 Import and Export Tonnage at Port Corpus Christi: Energy and Chemical Impacts
Source: Port Corpus Christ: July 2017
Source: Port Corpus Christi data, July 2017
Figure 3.3: December 2015 First U.S. Crude Export Movement in 40 Years
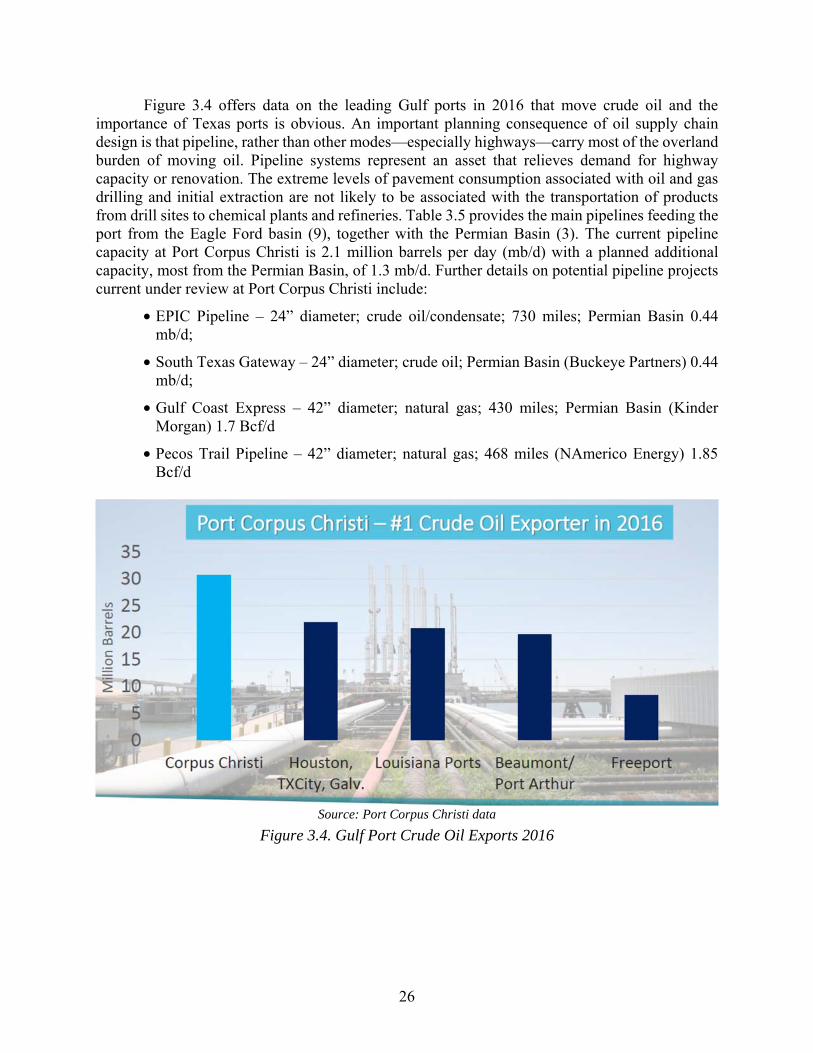
26
Figure 3.4 offers data on the leading Gulf ports in 2016 that move crude oil and the importance of Texas ports is obvious. An important planning consequence of oil supply chain design is that pipeline, rather than other modes—especially highways—carry most of the overland burden of moving oil. Pipeline systems represent an asset that relieves demand for highway capacity or renovation. The extreme levels of pavement consumption associated with oil and gas drilling and initial extraction are not likely to be associated with the transportation of products from drill sites to chemical plants and refineries. Table 3.5 provides the main pipelines feeding the port from the Eagle Ford basin (9), together with the Permian Basin (3). The current pipeline capacity at Port Corpus Christi is 2.1 million barrels per day (mb/d) with a planned additional capacity, most from the Permian Basin, of 1.3 mb/d. Further details on potential pipeline projects current under review at Port Corpus Christi include:
• EPIC Pipeline – 24” diameter; crude oil/condensate; 730 miles; Permian Basin 0.44 mb/d;
• South Texas Gateway – 24” diameter; crude oil; Permian Basin (Buckeye Partners) 0.44 mb/d;
• Gulf Coast Express – 42” diameter; natural gas; 430 miles; Permian Basin (Kinder Morgan) 1.7 Bcf/d
• Pecos Trail Pipeline – 42” diameter; natural gas; 468 miles (NAmerico Energy) 1.85 Bcf/d
Source: Port Corpus Christi data
Figure 3.4. Gulf Port Crude Oil Exports 2016
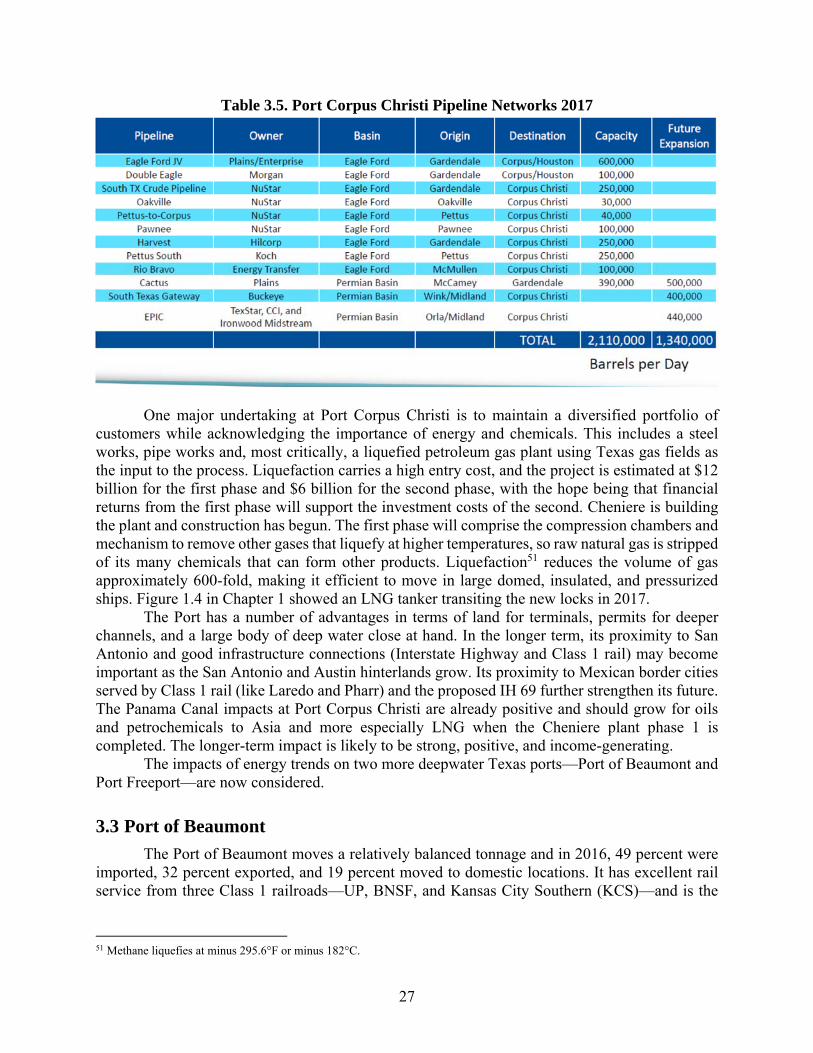
27
Table 3.5. Port Corpus Christi Pipeline Networks 2017
One major undertaking at Port Corpus Christi is to maintain a diversified portfolio of
customers while acknowledging the importance of energy and chemicals. This includes a steel works, pipe works and, most critically, a liquefied petroleum gas plant using Texas gas fields as the input to the process. Liquefaction carries a high entry cost, and the project is estimated at $12 billion for the first phase and $6 billion for the second phase, with the hope being that financial returns from the first phase will support the investment costs of the second. Cheniere is building the plant and construction has begun. The first phase will comprise the compression chambers and mechanism to remove other gases that liquefy at higher temperatures, so raw natural gas is stripped of its many chemicals that can form other products. Liquefaction51 reduces the volume of gas approximately 600-fold, making it efficient to move in large domed, insulated, and pressurized ships. Figure 1.4 in Chapter 1 showed an LNG tanker transiting the new locks in 2017.
The Port has a number of advantages in terms of land for terminals, permits for deeper channels, and a large body of deep water close at hand. In the longer term, its proximity to San Antonio and good infrastructure connections (Interstate Highway and Class 1 rail) may become important as the San Antonio and Austin hinterlands grow. Its proximity to Mexican border cities served by Class 1 rail (like Laredo and Pharr) and the proposed IH 69 further strengthen its future. The Panama Canal impacts at Port Corpus Christi are already positive and should grow for oils and petrochemicals to Asia and more especially LNG when the Cheniere plant phase 1 is completed. The longer-term impact is likely to be strong, positive, and income-generating.
The impacts of energy trends on two more deepwater Texas ports—Port of Beaumont and Port Freeport—are now considered.
3.3 Port of Beaumont
The Port of Beaumont moves a relatively balanced tonnage and in 2016, 49 percent were imported, 32 percent exported, and 19 percent moved to domestic locations. It has excellent rail service from three Class 1 railroads—UP, BNSF, and Kansas City Southern (KCS)—and is the
51 Methane liquefies at minus 295.6°F or minus 182°C.

28
busiest U.S. port for processing military equipment. The commodities handled in 2016 are provided in Figure 3.5.
Figure 3.5. Port of Beaumont Commodity Categories 2016 (tonnage)
The Port of Beaumont arguably lies at the epicenter of vehicle fuel refining in the United States, with four major refineries and numerous liquid bulk terminals located within a 20-mile radius of the port. These collectively produce approximately 60 percent of the nation’s gasoline, diesel, and jet fuel, consuming about 1.4 million barrels of crude oil every day through the refining process. Historically, the bulk of this crude oil has been supplied to the refineries by a range of oceangoing tankers, ranging from shallow draft ships for Central and South American reserves to larger tankers from Middle Eastern Sources. Most of the refineries in Southeast Texas blend heavy “sour” crude with lighter “sweet” crude oil found in the Permian Basin and Texas shale oil plays. The major petrochemical refining companies are interested in tapping the Canadian heavy oil reserves, which are economically cheaper and more politically reliable than traditional sources of heavy, sour crude.
Figure 3.6 also provides a breakdown of the general cargo types handled by the port in 2016. It has traditionally handled wood products from Latin America and agricultural exports but energy has become an important product in its commodity portfolio. The Port of Beaumont limits include a large tract north of the Neches River where a consortium, together with the port, financed the construction of the Jefferson Terminal project in 2014. The Jefferson Energy Terminal is still being expanded to produce new products and higher volumes.
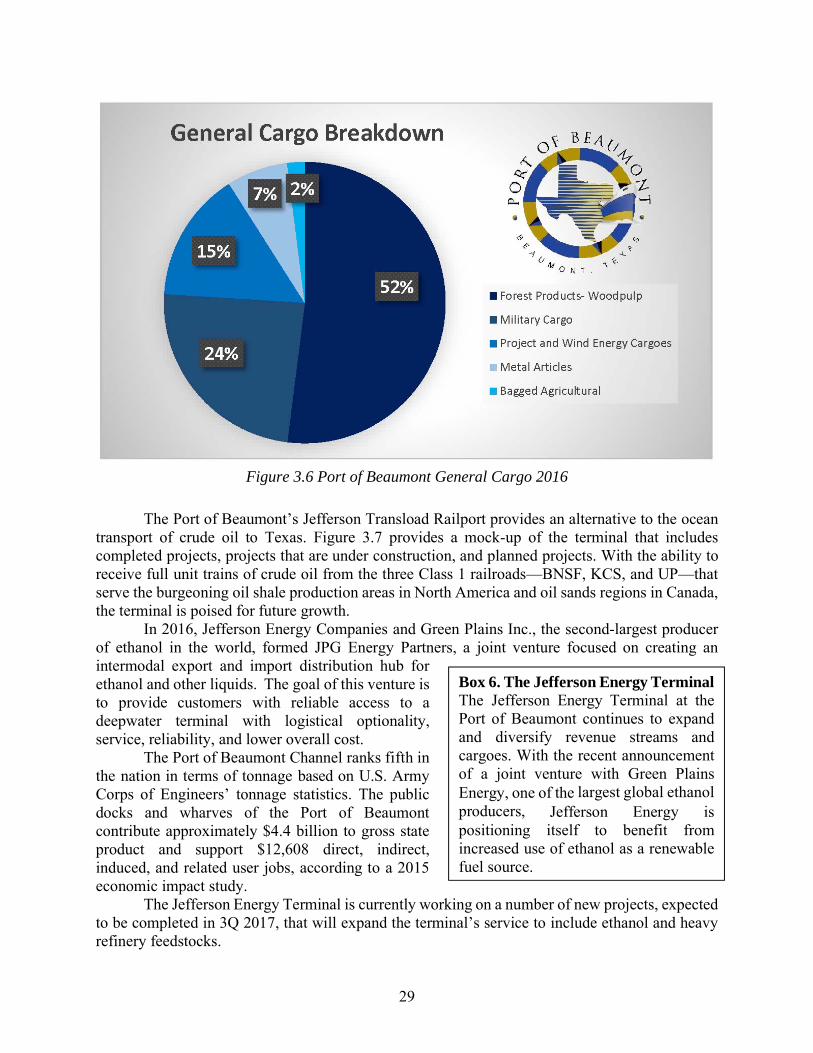
29
Figure 3.6 Port of Beaumont General Cargo 2016
The Port of Beaumont’s Jefferson Transload Railport provides an alternative to the ocean transport of crude oil to Texas. Figure 3.7 provides a mock-up of the terminal that includes completed projects, projects that are under construction, and planned projects. With the ability to receive full unit trains of crude oil from the three Class 1 railroads—BNSF, KCS, and UP—that serve the burgeoning oil shale production areas in North America and oil sands regions in Canada, the terminal is poised for future growth.
In 2016, Jefferson Energy Companies and Green Plains Inc., the second-largest producer of ethanol in the world, formed JPG Energy Partners, a joint venture focused on creating an intermodal export and import distribution hub for ethanol and other liquids. The goal of this venture is to provide customers with reliable access to a deepwater terminal with logistical optionality, service, reliability, and lower overall cost.
The Port of Beaumont Channel ranks fifth in the nation in terms of tonnage based on U.S. Army Corps of Engineers’ tonnage statistics. The public docks and wharves of the Port of Beaumont contribute approximately $4.4 billion to gross state product and support $12,608 direct, indirect, induced, and related user jobs, according to a 2015 economic impact study.
The Jefferson Energy Terminal is currently working on a number of new projects, expected to be completed in 3Q 2017, that will expand the terminal’s service to include ethanol and heavy refinery feedstocks.
Box 6. The Jefferson Energy Terminal The Jefferson Energy Terminal at the Port of Beaumont continues to expand and diversify revenue streams and cargoes. With the recent announcement of a joint venture with Green Plains Energy, one of the largest global ethanol producers, Jefferson Energy is positioning itself to benefit from increased use of ethanol as a renewable fuel source.

30
Figure 3.7. Jefferson Energy Terminal: existing facilities (green), under construction (red), and
planned (blue)
Future projects include rail loading of refined products for export to Mexico and domestic distribution. The terminal currently operates 250 acres and has room to expand. With 190 acres north of the Main Terminal, and 65 acres south of the Main Terminal, the terminal has full build-out potential of 18 million barrels of storage and four Aframax-capable docks (see Box 7).
The Jefferson Terminal has several competitive advantages, including the following:
• proximity to the Gulf of Mexico;
• the ability to handle inbound and outbound crude and refined products;
• on-site services including storage, blending, and testing;
• tank truck unloading system for handling locally sourced crude;
• ability to blend to customer’s specifications to maximize refinery product yields;
• deepwater marine dock (Aframax capable) for import or export;
Box 7. Aframax Tankers Aframax is an acronym for the Average Freight Rate Assessment (AFRA) system. The tanker design limits reflect the constraints experienced when large oil tankers enter congested sea-routes. These tankers have a limit of 120,000 deadweight tons with limits of 1400 ft. length, 180 ft. beam, and 60 ft. draft.

31
• inland marine dock (up to 4x 30,000 barrel barges simultaneously);
• foreign trade zone for duty-free and tax-advantaged import of crude oil and export of products;
• the ability to unload 120 free-flow light crude rail cars and 120 heat-assisted heavy crude (including pure bitumen) oil rail cars at the same time.
The Port of Beaumont has traditionally handled a variety of products, has strong links with
Latin America, is the largest Army deployment port in the nation, and now plays a role in strengthening Texas energy performance. At the moment, the port does not stand to benefit from the enhanced Panama Canal, but feeds refineries that may well benefit from access to Asian markets. The main strategic focus of the Port of Beaumont, however, remains the deepening and widening of the Sabine Neches Waterway because of its crucial role in future growth of the region and port customers.
3.4 Port Freeport
Freeport is currently a modest player amongst the Gulf ports handling containerized commodities and currently specializes in handling cool or refrigerated containers for the fruit trade—principally bananas. Container data for the port are shown in Figure 3.8.
Source: Journal of Commerce
Figure 3.8: Container volumes at the Port of Freeport 2011 to 2015 (TEU)
Freeport is a good example of a location that should grow strongly over the next decade. It lies in deep water, has good rail connections, and is preparing for the predicted growth in plastics, resins, and related products from a network of nearby petrochemical plants. These plants are being upgraded and enlarged to take advantage of the low-cost natural gas sources in Texas that now are

32
linked by pipeline from source to plant, thereby eliminating highway use. Its proximity to several large petrochemical plants has created an opportunity to gain share in heavy container loads of plastics and resins, and the port is pursuing a strategy to capture part of these new export products.
In the 82nd Texas Legislative Session, Freeport was allowed to build and operate an oversize/overweight (OS/OW) network in the port hinterland (shown in Figure 3.9). This network principally links the petrochemical plants undergoing expansion of capacity for plastics and resins production for export. The network was needed because many export markets like the EU allowed heavy 44 metric ton (97,000 lb.) gross vehicle loads while U.S. trucks are limited to 80,000 lb gross vehicle mass without a state or Department of Motor Vehicle permit. Plants on the Freeport network can access this network to move heavy containers loaded to the limits of the receiving country and so lower the ton-mile cost for the trip. TxDOT construction and maintenance engineers at the District and Division levels were involved in merging this network into the TxDOT on-system. Further work on this topic is currently being undertaken by CTR to develop a model to assist TxDOT in calculating the impacts and consumption of these vehicles on the highway systems.52
Texas is unusual when compared with other U.S. states in terms of support of key deepwater ports. No state money goes directly to support its ports. In 2001, Texas authorized a Port Access Account Fund (PAAF) to be funded from general revenue—a feature that almost all other U.S. states has—but the funds have never been appropriated. In an effort to secure appropriation in the 83rd Legislative Session, TxDOT and TPAC developed a two-year plan starting in 2015. The criteria are given in Box 8 and requested funds totaled $95.3 million—$43.14 million from the various ports in the program and $52.24 million from PAAF appropriations. It failed to gain Legislative support53 and the PAAF remains unfunded, despite the substantial contribution ports make to the Texas economy.
52 Project 0-6690: A Process for Designating and Managing Overweight Truck Routes in Coastal Port Regions 53 The dominant transportation need in 2015/16 was addressing the accelerated deterioration of roads serving the fracking-related oil and gas fields, which left little on the table for other modal needs, however modest.
Box 8. PAAF Selection Criteria
The PAAF established the following guidance for the development of the 2015–2016 Port Capital Program:
• The project must abide by the guidance in Texas Transportation Code, Title 4, Chapter 55, Funding of Port Security, Projects and Studies.
• Each port may submit one high-priority project in the $10 million range.
• Each project must undergo an economic, environmental, and engineer review.
• Large ports (over 1 million tons of cargo/year) share the cost of the project 50-50 with the State.
• Smaller ports (under 1 million tons of cargo/year) share the cost of the project 75-25 with the State.

33
Figure 3.9: Port of Freeport Oversize/Overweight Export Corridor
Reconstruction at the petrochemical plants ramping up plastic and resins output is not yet completed but Figure 3.9 shows that export TEUs are increasing at the port. This is unusual among container ports because most U.S. container ports deal with much larger volumes of loaded imported, rather than exported, boxes. Houston has a balance of export vs. import TEU (again unusual) and both Houston and Freeport will move to an export bias, especially where cargo is measured in weight rather than value.

34
Chapter 4. The U.S. Maritime Sector, Texas, and Panama Canal Impacts as of August 2017
4.1 Role of Texas Ports in U.S. Maritime Sector
The International Maritime Organization’s July 1, 2016, Directive “Safety of Life at Sea (SOLAS)” came into force globally without any major disruptions, although it may be difficult to measure the impact immediately. Only Israel currently double-checks all container weights, although this may change. Currently most EU ports are reporting no problems with meeting SOLAS requirements and many global ports are offering weigh station service, although most U.S. ports have refused to weigh containers on port property. Early evidence suggests that SOLAS will be fully adopted with 12 months. In addition to improving marine safety, the database of both container imports and export weights should form a useful Department of Public Safety enforcement database in Texas.
Container rates are set to rise, especially in the eastbound transpacific lanes in the August-October holiday merchandise shipping season, but not enough to stem carrier losses. Further responses are expected from carriers, including joining alliances with other carriers, and reducing services where the service slot supply-demand relationship cannot be reasonably balanced. The industry is predicted to lose as much as $10 billion in 2016, which, even if overestimated, is unsustainable.
The ports of Boston; New York and New Jersey; Savannah; Portland, Maine; and Seattle stand to share a total of $269 million for projects aimed at “improving containerized freight fluidity.” These grants include both intermodal rail and highways improvements and were part of the USDOT’s “Nationally Significant Freight and Highways Projects” program termed FASTLANE. Ports that failed to gain support can also propose support from the $4.7 billion funding from the Volkswagen settlement ($2.7 billion for emissions reduction and $2 billion for zero emissions technology). No awards were made to Texas port or border projects.
The global economy remains weak and marine shipping of all types (especially bulk) remains at overcapacity. The Suez Canal extended and increased its discounts to container ships between the U.S. East Coast and Asia, apparently focused on U.S. East Coast ports. Drewry Consultants estimate transit times on current schedules between Shanghai and New York are 30 days via Suez and 36 days via the Panama. Even so, Drewry reported that the Panama Canal gained traffic away from the Suez Canal on the Asia-U.S. East Coast ports’ routes in June 2016, so it is likely that both Panama and Suez Canal authorities will vary incentives to maintain share in the global market. Bunker fuel prices more than doubled in May, impacting route choice decisions, but prices remain highly volatile and have already started to fall again.
The Gulf is now being treated very much as a third coast by maritime planners based on recognition that its ports play a different role from those on the eastern Atlantic coast. The Panama Canal and Caribbean terminal hubs support treating this new role from a logistics planning perspective. Texas ports are not alone in seeing new container services as strategic growth areas. Mobile has been positioning itself for growth from the Panama Canal by promoting its Canadian National service, which could serve several U.S. metropolitan areas. Already one alliance has announced it will offer a Gulf service and call at Mobile using Panamax ships. Port Houston, however, remains the preeminent Texas port based on its location and wide portfolio of both import and export commodities. It is also the most important Texas port in TxDOT planning since much

35
of the import and export trade moves to and from the port terminals by truck on state and metropolitan highways.
4.2 Challenges at Texas Ports
Ports face three distinct challenges, each linked to different issues and funding sources. These challenges comprise seaside access (principally channels), port and terminal operations (capacity), and landside connections with surface modes of transport. Each can place limits on Texas port capacity and competition.
• Both East Coast and Gulf Coast ports have devoted considerable attention in their investment strategies to enhance port access that will enable them to service Neopanamax vessels after the 2015 opening of the new Panama Canal locks. An operating depth of 50 feet is generally considered the standard for those (like Florida’s ports) promoting their respective locations, even though such a depth is unlikely (and possibly unnecessary) for most Gulf Coast locations, based on simple cost-benefit analysis estimates. The reach of a deeper, wider 50-foot-deep channel would exceed 11 miles in some cases, requiring unsustainable levels of dredging and disposal. New terminals located nearer deeper water may help, but the most immediate need is to offer an access system that provides a consistent depth. In Houston, for example, this means linking the main 45-foot-deep channel with the 40-foot-deep Barbours Cut and Bayport terminal channels. Shallow-draft ports would benefit from dredging the Gulf Intracoastal Waterway to the authorized 12-foot depth and 125-foot width, since barge operators are currently traversing an operating depth of 9.5 feet, which adversely impacts barge productivity. Providing the necessary finances to fund or match federal contributions for conducting channel dredging on this scale is virtually impossible for most Texas deepwater ports; these funds are unlikely to be provided solely by the federal government given present and forecasted budget shortfalls.
• Texas ports handle a wide variety of both imported and exported commodities. Container traffic is concentrated at Houston with some specialized commodities moving through Freeport. These terminals have sufficient capacity, when expressed in terms of current and approved construction, to handle double the current TEU container volumes. In general, ports handle their operations effectively and rely upon a variety of financial mechanisms to support strategic planning on their own properties. They have been successful in transmitting their concerns to TxDOT and other agencies. Texas waterborne trade studies have identified port project needs and shared all highway projects that would benefit port operations to TxDOT District planners.
• Landside issues include terminal rail and highway chokepoints. Highway bottlenecks are being addressed in a systematic fashion, reflecting the wide variety of competing projects and limited budgets. Bayport terminal dray trucks, for example, will benefit from a recently completed freeway ramp, although congestion at the controlled access intersection at Barbours Cut and SH 145 impacts terminal productivity. The Texas economy is dominated by the Dallas/Ft. Worth-Houston-San Antonio triangle. Both import and export customers who rely on Texas deepwater ports in that region will use trucks for most of their landside movements. Rail intermodal container traffic will gain importance if Texas ports become true load centers. Yet only Houston, with woefully

36
inadequate rail access, possesses the attributes to become a true load center. Access to the port has to be examined in the broader context of the Houston rail and terminal network. A much-needed improvement would be the construction of an urban terminal yard receiving both domestic and international traffic.
• As of 2017, Texas deepwater port needs are ranked as follows: channels, landside modal connectivity, and raising port operational efficiencies.

37
Chapter 5. Summary
1. Freight moves across a variety of routes, modes, and transfer points while meeting shipper-specific needs such as speed, reliability, and cost. The new Panama Canal locks and the strategy of the Panama Canal Authority (ACP) to offer steamship companies a variety of related services—transload, bunkering, and multi-modal options—benefits both the Texas economy and its deepwater ports. Simply stated, the new lock system supports the Texas economy and is a new competitive asset for Texas ports as verified by the port administrators of Houston/Freeport, Corpus Christi, and Beaumont/Port Arthur in study visits.
2. The new locks opened on June 26, 2016, and immediately had an impact on shipping,
including both the energy and container sectors. The key containership impact was in the transpacific trade—specifically the Asia-U.S. East Coast routes—although Port Houston has benefited from handling larger containerships up to 10,000 TEU through investments in terminal operations at Bayport and Barbours Cut. The ACP also noted a growth in Neopanamax LNG/CNG and bulk oil ships. The new locks can now handle almost 80 percent of the 2016 global shipping fleet.
3. The shale oil-and-natural gas reserves, as noted in project report 0-6990-1, stimulated
U.S. and foreign manufacturers to announce multi-billion dollar investments on or near the Gulf of Mexico. In Texas, the plants form clusters on the Houston/Freeport ship channels, the Neches River, and around Port Corpus Christi, impacting the immediate deepwater ports. The investments range from retrofitting existing refineries to building new plants. A number are coming on stream, although the sharp drop in oil and gas prices has slowed construction. Nevertheless, energy, chemicals, plastics, and resin production is growing strongly in Texas and remains a key component of operations strategy at state deepwater ports.
4. The immediate impacts on TxDOT planning and operations are twofold:
(a) First, gas and oil from Texas fields—especially Eagle Ford and Permian Basins—is brought to refineries and shared between plants through a growing network of pipelines that obviate the need to use TxDOT infrastructure assets. Liquid exports, for example, can be loaded at a Texas port without ever using highways.
(b) Second, many plants coming on stream have rail access but no bagging facilities, so some products are first by moved by rail to sites near the export terminal where the commodity can be bagged, palletized, and stuffed into a marine container before being drayed to the export facility. Legislation was passed this year in the Texas Legislature’s 83rd Session to permit overloaded containers carrying such products within a 30-mile radius of Port Houston, although the routing has not yet passed city, county, and TxDOT scrutiny. However, once loaded on rail, such products can also be moved to other sites in Texas where they can then be bagged and loaded on empty marine containers moving back to West Coast ports.

38
5. Several factors over the next five years will shape the scale and routing of both Texas exports and the impact of the Panama Canal locks on Gulf trade lanes. Supply and demand conditions drive global trade, and they cannot be predicted with absolute certainty. At this moment, these key elements are forecasted to shape Texas port activity:
Demand Worldwide
(a) The World Trade Organization (WTO) reported that merchandise exports fell by 3 percent in 2016 in value terms, slowing the more significant contraction in 2015. The 2016 decrease was mostly caused by the continuing decline in exports of fuels and mining products (-14 percent in 2016). The marked decline in commodity prices in 2015 mostly halted in 2016, with the exception of energy prices. The export prices of all other major commodity groups, apart from food and beverages, decreased slightly but the decline was less than in 2015. The 2016 figures are not yet published but are believed to show similar values to 2015.The global economic outlook for 2017 continues to brighten according to the International Monetary Fund (IMF), IHS Markit, Drewry, and other organizations. For example, in April 2017, the IMF forecast a growth rate of 3.5 percent for 2017 and an expansion in global trade volume of 3.9 percent for same year. The 2017 growth rate for the U.S. economy was predicted to increase 2.3 percent. On the other hand, China’s growth rate was projected to decline to 6.6 percent in 2017.
(b) In the short and intermediate term, the volume of Panama Canal seaborne trade will depend on global economic growth in general, and Northeast Asia demand (China, Japan, and South Korea) in particular. In the long term, the eventual fate of the Trans-Pacific Partnership and NAFTA will govern the overall future of Panama Canal transit volumes related to Texas ports.
(c) Texas ports have always had strong ties with Latin America but a severe recession in Brazil and subdued growth generally in most Latin American countries, together with a strong U.S. dollar, have reduced trade volumes, particularly U.S. exports. The new Panama Canal locks offer economies of scale between the Gulf ports and Latin America’s western coastal countries and this will strengthen shipper choice when Latin American economic growth returns.
(d) Approximately 50 percent of the value-added of U.S. containerized imports entail inputs (intermediate goods) that are needed for U.S. exports and domestic manufacturing. It is important that TxDOT freight planners understand the nature of Texas export supply chains and the related infrastructure needs of manufacturers, particularly exporters, and especially those expanding their operations using Gulf Coast ports.
Supply of Maritime Services
(a) The maritime industry is slowly recovering from a series of economic setbacks, many created by its membership. The 2014 contraction in global trade, driven in part by contraction in China, drove down bulk rates and contracted the sector. This was then compounded by a glut of large containerships from orders placed
39
based on overly optimistic trade forecasts—an unfortunate characteristic of steamship company strategies since 2000. This led to the scrapping of ships (excess capacity) before normal retirement age and price competition within the sector, driving down profitability. Mergers, alliances, bankruptcy, and financial losses have weakened the sector and made it more conservative in its strategic planning.
(b) Where possible, carriers have moved displaced ships—many in the Neopanamax class—and reallocated them to more profitable lanes. Currently three such services operate on routes from Asia to U.S. East Coast ports that use the new Panama Canal locks. The Gulf ports of Mobile, New Orleans, and Houston are competing for new Neopanamax services, although the steamship companies are taking a cautious position in light of their financial resources and may not reveal new services until early 2018.
(c) Some Texas shippers have expressed concerns that the supply of empty containers will be inadequate for their traditional products (such as cotton) when plastic and resin exports grow strongly. Texas ports are reassuring users that adjustments can be made and it is also true that alternative sources of empty containers can be found elsewhere in the state—at the Alliance BNSF inland hub, for example, which cuts out Panama Canal transit because BNSF connects directly with West Coast California ports where there are more than adequate inexpensive slots on Asian backhauls.
(d) The potential role of Caribbean transshipment hubs in serving U.S. Gulf ports is also uncertain and their feasibility is countered by port strategists who argue that direct calls provide the shipper with the lowest landed cost per container. However, Dominican Republic, Jamaica, and Panama logistics hubs are being expanded, upgraded, and are intended to consolidate freight from both North and South America. If smaller Panamax ships were used for the final delivery of a transshipped container, it would immediately obviate the need to deepen Gulf channels below 45 ft., purchase Neopanamax cranes, or manage costly peak load operations.
In summary, the new Panama Canal locks benefit both Texas ports and the state economy.
The Gulf is now being treated as a third coast by maritime planners based on the recognition that its ports play a different role from those on the U.S. East and West Coasts. Texas has the modal capacity to handle energy, manufacturing, and agriculture growth but export supply chains need to be monitored by TxDOT and USDOT planners. This implementation report was narrowly focused and readers are encouraged to examine the Policy Briefs provided in Appendix 2, which cover these topics: Panama Canal utilization; Texas ports and the Panama Canal: commodities and infrastructure; global logistics hubs in Texas; Texas-Latin American trade; port competition and best practices; and transportation and trade forecasts.

40
Appendix 1. Background to U.S. Intermodal Transportation System Developments
Transportation demand is derived from the need to safely and efficiently move a wide variety of goods across state, national, regional, and global markets. The wide ranges of commodity conditions and value require different modes—a variety of modal units and transfer points between points of origin and destination. The resulting system of modes and transfers is often termed the supply chain. Currently over 50 percent of these moves involve intermediate goods—inputs moving between processing and manufacturing centers. The best examples of this can be found in the various patterns of inputs54 associated with the production of automobiles. Transportation decision-making has undergone change over the last four decades in both private and public sectors. Most large companies in the 1960s had a transportation division and vehicle fleet, served domestic markets, and faced rate monopolies in key areas, resulting in a high transportation costs relative to the final prices of their goods.
Transportation in the U.S. after 1970 changed as several factors—most notably the impacts of the modal deregulation of trucking, rail, and airlines—combined to transform U.S. modes, modal systems, and service, as shown in Box A1.1. The Interstate Highway System (IHS) was the result of legislation signed by President Eisenhower in 1956 to create a 41,000-mile national system of Interstate and Defense Highways. Construction began late in the 1950s, peaked in the 1970–1985 period, and was finally completed in 1992. It provided a major boost to truck productivity, especially when combined with the increases in truck size and weight that were legislated in 1972 (72,000 lb. GVW) and 1982 (80,000 lb. GVW). Heavier trucks operating in several western states—termed long combination vehicles—were grandfathered into the legislation. The IHS allowed companies to more than double their daily vehicle miles of travel and enabled trucking to gain market share from rail on several routes.
After the Second World War, railroads began losing both passenger traffic to automobiles and freight to trucks, forcing many companies to near-bankruptcy in the 1970s. Railroads had been regulated since 1887 and placed under the Interstate Commerce Commission (ICC), which regulated both the size of companies and administered a complex system for setting shipping rates (prices). Deregulation came in two parts. The initial legislation was entitled the Railroad Revitalization and Regulatory Reform Act (commonly known as 3R). It slowly reduced the authority of the ICC and prepared the industry for the formative Staggers Act. The latter act essentially created the current freight railroad system that The Economist magazine in 2010 termed
54 Auto plants in Mexico use components from the U.S. and vice versa; goods not in final form (components) are termed intermediate goods.
Box A1.1. U.S. Transportation Developments Post-1980
1. Interstate Highway System 1956 2. Airline Deregulation 1978 3. U.S. Rail Mergers 4. Containerization and Ship Size 5. U.S. Truck Size and Weight 6. Logistics 7. NAFTA 8. Globalization

41
“the world’s best freight rail system.”55 In 2006, the Government Accountability Office (GAO) reported to Congress that “there is widespread consensus that the freight rail industry has benefited from the Staggers Act.”56 A number of key elements contributed to this position but three are critical.
a. First, it stimulated a series of mergers that reduced over 40 Class 1 railroad companies to the current U.S. system of 2 western companies—Union Pacific (UP) and Burlington Northern Santa Fe (BNSF)—and 3 eastern companies—CSX Transportation (CSX), Norfolk Southern (NS), and Kansas City Southern (KCS). These interact with two Canadian companies—Canadian Pacific and Canadian National—while KCS has a direct system in Mexico (UP and BNSF interline at the southern U.S. border), so rail provides a significant and competitive service throughout the NAFTA market.
b. Companies were allowed to focus on freight and only provide infrastructure to the federal Rail Service (Amtrak). Rails systems through the U.S. were scrutinized and mileage reduced to form key corridors into which the American Association of Railroads claimed in 2011 that more than $480 billion has been invested since the Staggers Act57. Each year the U.S. Class 1 railroads continue substantial investment. For example, in January 2016 BNSF announced a $4.3 billion capital expenditure (capex) plan for 201658, while the UP capex was $3.8 billion59.
c. Railroad companies provide the most efficient ways to move containers across the U.S—particularly from west coast ports handling Asian trade. Over two decades rail has dominated imported containers from Asia until capacity issues at terminals and the accessing gates and roadways serving them. A massive construction project—the Alameda corridor60—was completed in 2002 that moved on-dock containers (loaded and empties) between the port terminal deep waters and the rail yards of both UP and BNSF. This traffic, which constitutes over 50 percent of loaded imported containers, is able to avoid urban gridlock by running in an 8-mile trench. It offers an alternative route in the port terminal/rail terminal link in the supply chain, shown in Figure A1.1. It did not attract as many trains as planned (currently running at a third of its capacity of 150 trains a day) but remains a valuable long-term investment. Transloading—moving goods from the maritime box to either a 53 ft. road trailer or 53 ft. domestic rail container—has increased because the empty maritime container can be moved back to the shipper, thus avoiding demurrage charges61 and taking advantage of lower ton-mile costs in the remaining part of the supply chain.
55 See: http://www.economist.com/node/16636101 “High-speed railroading. America’s system of rail freight is the world’s best. High-Speed passenger trains could ruin it.” The Economist, Print Edition. July 22, 2010. 56 Hecker, J.Z “Freight Railroads: Updated Information on Rates and Competition Issues.” Testimony before the Committee on Transportation and Infrastructure, House Representatives, Report No. GAO-07-1245T. 57 Association of American Railroads (AAR). “The Impact of the Staggers Rail Act of 1980.” 58 See: http://www.railwayage.com/index.php/freight/class-i/bnsf-announces-2016-capital-plan.html 59 UP capex fell by $550 million in 2015; see: http://texasrailadvocates.org/2016/02/06/union-pacific-capex-plan-is-3-75b-for-2016-down-from-last-year/ 60 See: http://www.railway-technology.com/projects/alameda/ 61 Fees imposed by the shipper for holding a container beyond an agreed time.

42
Source: Images at http://www.railway-technology.com/projects/alameda/
Figure A1.1: Map of the Alameda and Class 1 Railroad Systems
U.S. rail links to almost all ports are over a century old and were built when port cities were smaller and automobile use had not yet begun. Trains would pass through the city and be unloaded at storage sheds or silos for dry bulk where they were sorted for export. These were built longitudinally to the ship berths, with loading bays for rail, horse, or truck access on the innermost terminal side and bays on the ship berth side. This setup facilitated the same loading process for both imports and exports. While the loading and unloading of dry and liquid bulk ships has been an evolutionary one, smaller consignments were revolutionized by the advent of containerization. An American trucker—Malcom McLean—perfected a system, starting with loading highway truck box trailers onto ship decks and then only the boxes themselves, then designing an open (non-patent) locking system that enabled them to be carried on truck trail chassis, stacked at port terminals, loaded by dockside cranes, and stacked in the holds of cargos vessels62. He used this system to launch a U.S. steamship company63 and perfected the system that is now a major ship class in global trade—the container ship. The International Standards Organization (ISO) adopted
62 See: https://en.wikipedia.org/wiki/Containerization#Less-than-container_load 63 McLean Industries bought the Pan-Atlantic Steamship Corporation to offer containerized services and in 1960 officially changed the name to Sea-Land Service, which became the largest U.S. steamship company offering containerized services until the mid-1970s.

43
his standards to form a global standard—the twenty-foot-equivalent unit or TEU. All container movements are expressed in TEUs, irrespective of the actual size of the container64. These ships grew in size and capacity from 500 TEU in the late 1950s to 20,000 TEU in 2016.
The dimensions of the ship—length, width, and draft—grew disproportionately as capacity increased; width was greater than draft and length increased the least, although draft had the most impact on port operations. This had an impact on both Atlantic and Gulf ports, where dredging cost is a major recurring operational challenge. The purchase of new terminal cranes to reach across larger ships was also a major capital expenditure in addition to deepening and maintaining the port and terminal channels. The critical issue for naval architects designing larger ships was the dimension of the ISO standard width of 8 ft. or metric equivalent. Containers are loaded parallel to the ship’s centerline, and the larger ships—exceeding 4500 TEU—are racked65 to ensure stability (ultimately up to 12 high).
The first three phases of container ship designs could be handled by most port main 40 ft. channels—in the 1980s, all Texas ports with that draft could service ship in those phases. Critically, the ship size in the third phase (4500 TEU) could still fit the locks of the Panama Canal and were termed Panamax. Subsequent modifications, including expanded above-deck racks, have raised that figure to 5500 TEU for some commodities. The next phase took capacity to 10,000 TEU, which required at least a 45 ft. main channel. Then, in 2006 a larger class of ship was introduced by Maersk, which was rated at 14,700 TEU. Subsequently this design was modified and over 120 containerships are now in service, or on order, with capacities between 14,000 and 20,000 TEU. Ports servicing this class of containership need at least a 50 ft. main channel and terminal draft, and dock cranes with a reach of over 180 ft. The economies of scale with containerization can be profound as summarized in Box A1.266.
The challenge is to fit them into the entire transportation chain from origin to destination. This requires that all modes in a chain review and, where necessary, invest in upgrades that the ship owner does not directly incur. TxDOT, as an example, contributes to landside access at Texas ports by planning, programming, and undertaking improvements allowing truck cargo to move safely and efficiently. Railroad companies have invested in access to move cargo—like export grains and import containers—over longer land routes.
Costs for supply chain improvement projects come from a variety of public and private sources that are increasingly integrated as the size of each effort increases. The new Panama Canal locks cost over $6 billion, raised on the international market. The recent $8 billion Suez Canal 64 The highway design equivalent is the equivalent standard axle load (ESAL), a unit used to capture the wide variety of trucks and loads that a pavement must carry in a single metric. 65 Vertical rails, 8 ft. apart, are welded on the inside of the ship to guide and restrain the container, increasing stability at sea. 66 See: Intermodal Transportation, Chapter 3 “The Geography of Transportation Systems” Jean Paul Rodrigue et al., Routledge, 2013.
Box A1.2. Economies of Scale: Containerships
1. Containerized transport costs are about 20 times less than those of bulk shipping.
2. Before containers, maritime costs were between 10 to 15 percent of retail costs; now they are about 1.5 percent.
3. Moving from a 4000 TEU to a 12000 TEU containership (old to new Panama locks) lowers operating cost per container by 20 percent.
4. Large volumes of containers can raise terminal and gate costs, thereby lowering overall supply chain cost efficiencies.
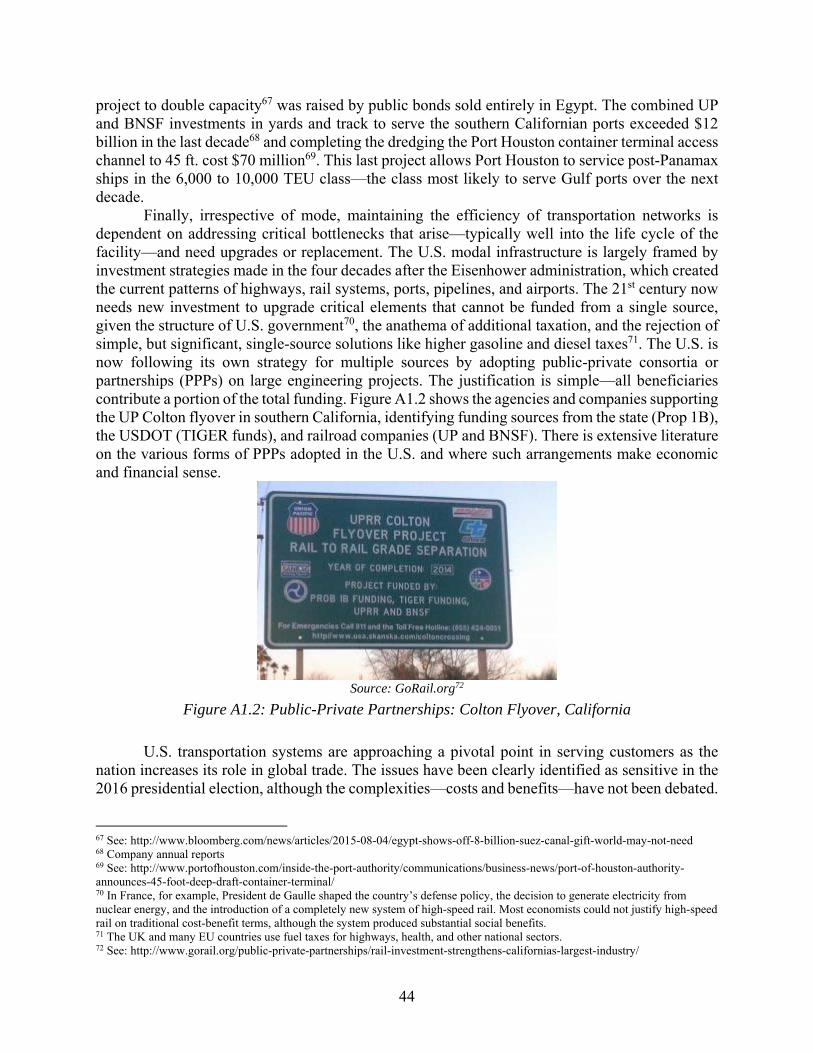
44
project to double capacity67 was raised by public bonds sold entirely in Egypt. The combined UP and BNSF investments in yards and track to serve the southern Californian ports exceeded $12 billion in the last decade68 and completing the dredging the Port Houston container terminal access channel to 45 ft. cost $70 million69. This last project allows Port Houston to service post-Panamax ships in the 6,000 to 10,000 TEU class—the class most likely to serve Gulf ports over the next decade.
Finally, irrespective of mode, maintaining the efficiency of transportation networks is dependent on addressing critical bottlenecks that arise—typically well into the life cycle of the facility—and need upgrades or replacement. The U.S. modal infrastructure is largely framed by investment strategies made in the four decades after the Eisenhower administration, which created the current patterns of highways, rail systems, ports, pipelines, and airports. The 21st century now needs new investment to upgrade critical elements that cannot be funded from a single source, given the structure of U.S. government70, the anathema of additional taxation, and the rejection of simple, but significant, single-source solutions like higher gasoline and diesel taxes71. The U.S. is now following its own strategy for multiple sources by adopting public-private consortia or partnerships (PPPs) on large engineering projects. The justification is simple—all beneficiaries contribute a portion of the total funding. Figure A1.2 shows the agencies and companies supporting the UP Colton flyover in southern California, identifying funding sources from the state (Prop 1B), the USDOT (TIGER funds), and railroad companies (UP and BNSF). There is extensive literature on the various forms of PPPs adopted in the U.S. and where such arrangements make economic and financial sense.
Source: GoRail.org72
Figure A1.2: Public-Private Partnerships: Colton Flyover, California
U.S. transportation systems are approaching a pivotal point in serving customers as the nation increases its role in global trade. The issues have been clearly identified as sensitive in the 2016 presidential election, although the complexities—costs and benefits—have not been debated.
67 See: http://www.bloomberg.com/news/articles/2015-08-04/egypt-shows-off-8-billion-suez-canal-gift-world-may-not-need 68 Company annual reports 69 See: http://www.portofhouston.com/inside-the-port-authority/communications/business-news/port-of-houston-authority-announces-45-foot-deep-draft-container-terminal/ 70 In France, for example, President de Gaulle shaped the country’s defense policy, the decision to generate electricity from nuclear energy, and the introduction of a completely new system of high-speed rail. Most economists could not justify high-speed rail on traditional cost-benefit terms, although the system produced substantial social benefits. 71 The UK and many EU countries use fuel taxes for highways, health, and other national sectors. 72 See: http://www.gorail.org/public-private-partnerships/rail-investment-strengthens-californias-largest-industry/
45
It is unlikely that bringing back jobs to the U.S., for example, will benefit those cities where those goods were traditionally manufactured. GM recently announced a $1.4 billion program to build SUVs in Arlington73, Texas, while Toyota moved its U.S. headquarters to Plano, Texas. Clearly, trade agreements like NAFTA and the Trans-Pacific Partnership must be built with a focus on the balance of concessions and not “winners and losers,” although regional impacts (such as competition between North Carolina and Detroit in a plant location decision) will continue to draw the attention of those who claim that global trade is not working. All Texas deepwater ports stand to grow their business but part of their success will depend on improving terminal-related services—both on the water and land sides—to compete for both import and export commodities. In some of these commodity markets, the new Panama Canal locks will play an important part in attracting shipper attention.
73 See: http://www.dallasnews.com/business/autos-latest-news/20151228-gm-pushing-ahead-rapidly-with-arlington-plant-expansion.ece

46
Appendix 2. LBJ School Policy Research Project (PRP) Policy Briefs
This appendix lists the participating students, project directors, and foreword provided for the PRP briefs, and then provides a link to the full text of each policy brief.
Policy Research Project Participants
Students:
• Lauren Marcotte Blair, B.A. (Psychology), B.S.B.A. (Global Economics), University of West Florida
• Chi-Hsiang Chu, B.A. (History), Tunghai University
• Ricardo Correa, B.A. (Anthropology), University of Texas at Austin
• Michael Finch, B.S. (Education), University of Tennessee
• Shujaat Ali Haq, B.Sc. (Economics), Lahore University of Management Sciences
• Nina Ledermann, B.A. (Spanish and Psychology), University of Hawaii
• Cristina Mendez, B.A. (Political Science and Psychology), Baylor University
• Noah Oaks, B.A. (Political Science), Xavier University
• Alex Payson, B.A. (Economics and International Trade), University of Central Arkansas
• Brent Perdue, B.A. (Government and History), University of Texas at Austin
• Chase Porter, J.D., University of Texas at Austin; B.S. (Civil Engineering), Texas A&M University—College Station
• Burleson Smith, B.A. (Political Science and Philosophy), Vanderbilt University Project Directors:
• Leigh B. Boske, Ph.D., Professor, Lyndon B. Johnson School of Public Affairs, The University of Texas at Austin
• Robert Harrison, Deputy Director, Center for Transportation Research, The University of Texas at Austin
Foreword
The Lyndon B. Johnson School of Public Affairs at The University of Texas at Austin has established interdisciplinary research on policy issues as the core of its education program. A major part of this program is a nine-month policy research project (PRP), in the course of which two or more faculty members from different disciplines direct the research of 10 to 20 graduate students of diverse backgrounds on public policy issues of concern to a government or nonprofit agency.
During the 2016–2017 academic year, the Texas Department of Transportation (TxDOT) funded, through a Research, Technology and Implementation (RTI) implementation project—5-6690-1—awarded to the Center for Transportation Research (CTR), a PRP addressing six key
47
transport/logistics policy issues related to impacts of the new Panama Canal locks on Texas international trade with foreign countries and domestic trade with other U.S. states. Overall direction and guidance was provided by Roger Schiller and Arielle Carchidi (TxDOT Maritime Division), who participated in classroom discussions during the academic year.
As a consequence, the following policy issues were selected for study:
1. Panama Canal Utilization; 2. Texas Ports and the Panama Canal: Commodities and Infrastructure; 3. Global Logistics Hubs in Texas; 4. Texas-Latin American Trade; 5. Port Competition and Best Practices; and 6. Transportation and Trade Forecasts.
The findings of each policy issue, together with authors and acknowledgements are given
in each separate policy brief.
Policy Briefs: Full Text
Provided here are links to the six Policy Briefs for the 2017 LBJ School Policy Research Class.
1. Panama Canal Utilization Nina Lederman and Chi-Hsiang Chu • https://library.ctr.utexas.edu/ctr-publications/5-6690-01/prp1.pdf
2. Texas Ports and the Panama Canal: Commodities and Infrastructure Chase Porter and Alex Payson • https://library.ctr.utexas.edu/ctr-publications/5-6690-01/prp2.pdf
3. Global Logistics Hubs in Texas Michael Finch and Brent Perdue • https://library.ctr.utexas.edu/ctr-publications/5-6690-01/prp3.pdf
4. Texas-Latin American Trade Burleson Smith • https://library.ctr.utexas.edu/ctr-publications/5-6690-01/prp4.pdf
5. Port Competition and Best Practices Cristina Mendez and Noah Oaks • https://library.ctr.utexas.edu/ctr-publications/5-6690-01/prp5.pdf
6. Typology of Transportation and Trade Forecasts Lauren Marcotte Blair and Shujaat Ali Haq • https://library.ctr.utexas.edu/ctr-publications/5-6690-01/prp6.pdf