Embed Size (px)
Citation preview

THE IMPACT OF THE GLOBAL ECONOMIC AND FINANCIAL CRISIS
ON FOOD SECURITY AND THE AGRICULTURAL SECTOR
OF EASTERN EUROPE AND CENTRAL ASIA
Johan F.M. Swinnen and Kristine Van Herck
LICOS Centre for Institutions and Economic Performance,
Catholic University of Leuven (KUL) www.econ.kuleuven.be/licos
Abstract
Since the 1998 Russian crisis, Eastern Europe and Central Asia were characterized by a booming economy, which had a positive impact on agricultural productivity and poverty. The recent financial crisis risks reversing the region’s recent gains and exposes the region to significant adverse economic and social impacts as the economies in Eastern Europe and Central Asia are forecast to experience the deepest contraction among all emerging and developing economies. This report analyzes the impact of the financial crisis on the agricultural sector, poverty and food security in the region. In terms of policy recommendations the paper argues that governments should focus on social security safety nets to deal with the expected increase in poverty. However, it is important emphasize that all new policies must not conflict with the longer-term reform agenda and previous reforms should not be dismantled as part of short-term policy reactions. Policies that facilitate a return to economic growth are the best strategy to reduce poverty and enhance agricultural productivity.
Version 1 December 2009
Report prepared for UN/IFI Dialogue Meeting on the Social Impacts of the Global Economic and Financial Crisis in Eastern Europe and Central Asia,
Almaty, Kazakhstan, December 2009.

Table of Contents 1 Introduction..........................................................................................................2 2 The Financial Crisis in Eastern Europe and Central Asia ..............................3
2.1 Decline in investments...................................................................................3 2.2 Decline in domestic production and export ...................................................4 2.3 Decline in remittances....................................................................................4 2.4 Effects on unemployment ..............................................................................5 2.5 Effects on exchange rates...............................................................................5 2.6 Effects on non performing loans....................................................................5
3 The agricultural sector in Eastern Europe and Central Asia..........................6 3.1 Changes in agricultural output .......................................................................6 3.2 Changes in agricultural input use...................................................................6
3.2.1 Labor use............................................................................................6 3.2.2 Capital use..........................................................................................7
3.3 Changes in productivity .................................................................................7 3.3.1 Agricultural labor productivity (ALP) ...............................................8 3.3.2 Land productivity...............................................................................8
3.4 Impact of the financial crisis on the agricultural sector.................................8 3.4.1 Reduced investments in agriculture ...................................................8 3.4.2 Reduced demand for agricultural products ........................................9 3.4.3 An increase in public intervention .....................................................9
4 Poverty and food security in Eastern Europe and Central Asia ...................10 4.1 Evolution of poverty and food security before the two crises .....................10 4.2 Impact of the food crisis on poverty and food security ...............................10
4.2.1 Impact on different socioeconomic groups......................................11 4.2.2 Impact on different countries ...........................................................11
4.3 Impact of the financial crisis on poverty and food security.........................12 4.3.1 Effect on the income of individual households................................12 4.3.2 Effect on government revenue .........................................................13
5 Policy recommendations....................................................................................14 5.1 Stimulate economic growth .........................................................................14 5.2 Promote (foreign) investments.....................................................................14 5.3 Enhance social security safety nets..............................................................15 5.4 Avoid short run policies that conflict with long run development goals.....15
6 References...........................................................................................................16 7 Tables ..................................................................................................................18 8 Figures.................................................................................................................21 Annex ........................................................................................................................33
2
1 INTRODUCTION
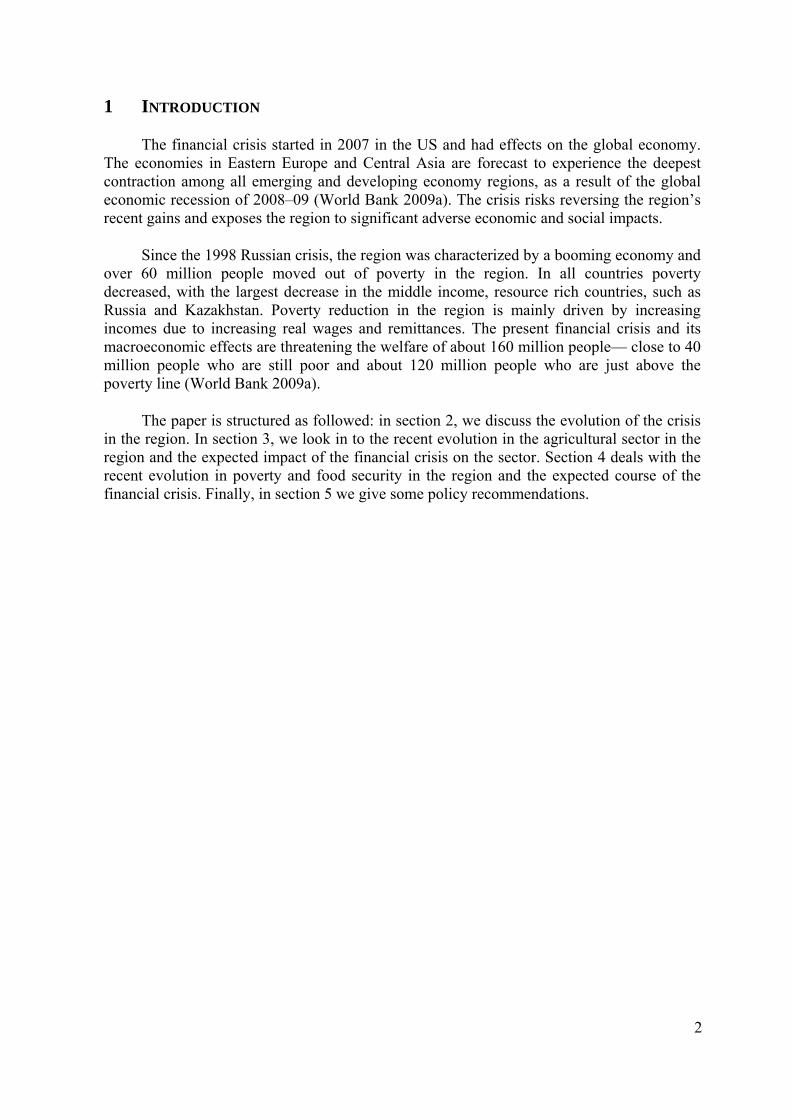
The financial crisis started in 2007 in the US and had effects on the global economy. The economies in Eastern Europe and Central Asia are forecast to experience the deepest contraction among all emerging and developing economy regions, as a result of the global economic recession of 2008–09 (World Bank 2009a). The crisis risks reversing the region’s recent gains and exposes the region to significant adverse economic and social impacts.
Since the 1998 Russian crisis, the region was characterized by a booming economy and over 60 million people moved out of poverty in the region. In all countries poverty decreased, with the largest decrease in the middle income, resource rich countries, such as Russia and Kazakhstan. Poverty reduction in the region is mainly driven by increasing incomes due to increasing real wages and remittances. The present financial crisis and its macroeconomic effects are threatening the welfare of about 160 million people— close to 40 million people who are still poor and about 120 million people who are just above the poverty line (World Bank 2009a).
The paper is structured as followed: in section 2, we discuss the evolution of the crisis in the region. In section 3, we look in to the recent evolution in the agricultural sector in the region and the expected impact of the financial crisis on the sector. Section 4 deals with the recent evolution in poverty and food security in the region and the expected course of the financial crisis. Finally, in section 5 we give some policy recommendations.

3
2 THE FINANCIAL CRISIS IN EASTERN EUROPE AND CENTRAL ASIA
In the summer of 2007, the financial crisis started in the US, triggered by the bursting of the housing bubble. In the period 2002-2006, housing prices have increased largely due favorable loan incentives which encouraged borrowers to acquire difficult mortgages in the belief they would be able to quickly refinance them at more favorable terms. However, once interest rates began to rise and housing prices in many parts of the US started to drop in 2006–2007, refinancing became more difficult. This caused high default rates on “suprime” loans1. The effect was not limited to the US economy, but was worldwide spread through asset-backed securities, such as collateralized debt obligations. These financial products enabled institutions and investors around the world to invest in the US housing market and were very popular due the long term trend in increasing housing prices. However when housing prices declined, major global financial institutions that had borrowed and invested heavily in asset-backed securities reported significant losses. Risk premiums rose rapidly and corporate borrowing was reduced.
In the past, financial markets in emerging economies have been vulnerable to shocks in the international financial system. Shocks immediately influence the financial flows because investors reduce their investments in risky financial products, such as investments in emerging countries. However the shock that affected the US financial sector in 2007 did not affect Eastern Europe and Central Asia immediately and was lagged in time (Figure 1-Figure 6).
The intensity of crisis is different between countries and it has affected mainly the resource rich countries, such as Russia, Kazakhstan and Ukraine. In general, the crisis affected the economy in the region through reduced capital flows, namely a decline in investments, a decline in domestic production and exports, and a decline in remittances (World Bank 2009b).
Recovery of the international financial markets started at the end of the second quarter of 2009. In line with the international markets, the decline in industrial output in Eastern Europe and Central Asia slowed down or even reversed in some countries and confidence indicators stabilized. However at the same time, the ripple effects of the crisis on the industry and the households became clear, with effects on unemployment, the exchange rate and the number of non-performing loans.
2.1 Decline in investments
The first sign of “infection” by the financial crisis was a decline in investments. In general, investments in emerging economies are considered as risky assets and when the financial markets in advanced countries have bad prospects, investors in general retreat from risky assets.
1 The term subprime refers to the credit quality of particular borrowers, who have weakened credit histories and a greater risk of loan default than prime borrowers.

4
As consequence of reduced capital flows, the banking system faced a decline of value of its assets and at the same time cross border lending declined, because of a lack of confidence between financial partners. In Russia and Ukraine, this lack of confidence even infected individual households as it led to a substantial increase of withdrawals from deposits.
In addition to the effect on the capital market, the financial crisis also affected the inflow of capital through FDI. The effect is expected to be less dramatic on the existing investments, because foreign investors have in general long term interests in the region. However the crisis will certainly affect new investments. In most countries, FDI inflows are expected to remain positive, although it is expected that they will decrease substantially in 2009 (Figure 7).
2.2 Decline in domestic production and export
As a consequence of the reduction in financial assets, lending to private borrowers was strongly reduced (Figure 8). In combination with lower FDI, there was an immediate effect on output and export volume. In 2008 real GDP growth declined already compared to 2007. EBRD expects that in 2009 real GDP growth will decrease in all countries in the region and in 8 of the 13 countries it is expected that GDP will even shrink compared to 2008 (Figure 9). Also export volumes contracted in 2008 considerably compared to 2007 (Figure 10).
2.3 Decline in remittances
The financial crisis caused a slowdown of migration and decline of remittances due to its negative effects on labor demand in the European Union and the resource-rich countries in Eastern Europe and Central Asia. For workers from most countries of the region, such as Armenia, Azerbaijan, Georgia, the Kyrgyz Republic, Tajikistan, Turkmenistan, and Uzbekistan, the major destinations to find employment are Russia and Kazakhstan, whereas workers from Moldova mainly leave for the European Union.
In the past 5 years, remittances and the outflow of labor in poorer countries in the region have increased substantially, because of high economic growth in the host countries of the migrants (Table 1). In the poorer countries in the region they became a major – maybe even the most important - source of income for households. A slowdown of the economy and reduction of the employment opportunities in Russia, Kazakhstan and the European Union hurts the surrounding poorer countries via reduced migration flows and remittances. This will reduce private disposable incomes and consequently reduce private consumption and residential construction. This effect is expected to be the largest in Tajikistan, which is already the poorest country in the region, but similar effects are expected in other countries that also largely depend on remittances, such Georgia, Armenia, Kyrgyz republic and Moldova.

5
2.4 Effects on unemployment
The crisis has caused a large increase in the unemployment level in many countries. In Russia, unemployment rates increased in the second quarter of 2009 by approximately 50% compared the same period in the previous year (Figure 11). This has direct effects on the domestic demand in the country. However there are also other indirect effects as a decrease of employment possibilities in the resource rich countries will also negatively affect remittances to and migration from the poorer countries in the region. This will have negative spillover effects on the domestic demand in these countries.
2.5 Effects on exchange rates
Currencies in Eastern Europe and Central Asia are generally very vulnerable to shocks in the economy. In order to increase the competitiveness of their export sectors, the currencies in some countries depreciated by more than 25% at the end of 2008 (Figure 12). This caused significant repayment problems for households and companies that had loans in foreign currencies, financial products which are particularly important in the region. In the poorer countries, a depreciation of the local exchange rates against the Russian ruble mitigated to some extent the effect of decreasing remittances.
The devaluation of the exchange rates also affected the inflation rate (Figure 13). For example, in Ukraine, prices increased approximately 25%, whereas in Armenia this was only 9%. However, in general, the effects of the financial crisis on the exchange rate and inflation were relatively moderated compared to the financial crisis at the end of the 1990s.
2.6 Effects on non performing loans
In the period from mid 2008 to mid 2009, the number of non-performing loans rose dramatically. In Russia and Ukraine, the number of non-performing loans increased in July 2009 by respectively 300% and 250% compared to the number in the same period in 2008. In Kazakhstan and Georgia the increase was even more spectacular as it has increased by more than 500% (Figure 14).

6
3 THE AGRICULTURAL SECTOR IN EASTERN EUROPE AND CENTRAL ASIA
The agricultural sector in all countries in Eastern Europe and Central Asia, except Turkey, remains affected by the transition to a more market-orientated economy in beginning of 1990s. The liberalization of the sector caused dramatic changes in agricultural output and productivity, which had a long lasting effect on the sector. Therefore, it is impossible to analyze the impact of the financial crisis, without first giving an overview what has happened in the sector in the past two decades.
In this section, we will first discuss changes in agricultural output, agricultural input use and productivity2. Finally, we discuss the possible impact of the crisis on the agricultural sector.
3.1 Changes in agricultural output
In the first five years of transition gross agricultural output strongly decreased in all countries that went from a state orientated economy to a market orientated economy (Figure 15). In the poorer countries in the region, such as Kyrgyz Republic, Uzbekistan and Turkmenistan, the decline in agricultural output was only limited, whereas in the middle income countries, such as Ukraine, Russia and Kazakhstan, agricultural output declined by more than 40%.
Despite differences in the magnitude of the decline of agricultural output, there were also differences in the time until recovery and speed of it between the poorer and the middle income countries. In the poorer countries, agricultural output started to increase again at the end of the 1990s and by the beginning of the 2000s agricultural output exceeded the pre reform level in the Kyrgyz Republic, Uzbekistan and Turkmenistan. Later, in the mid 2000s, also output levels in Armenia and Azerbaijan recovered beyond this pre-reform levels.
In Russia, Ukraine and Kazakhstan agricultural output continuously declined until the late 1990s. Since 1999 agricultural output started to recover. Despite this increase in output, recovery in agricultural output in these countries lagged behind the recovery in the poorer countries in region and output is still below the pre reform output quantity. In Kazakhstan, for example, agricultural output in 2007 was only at 63% of the pre-reform quantity.
3.2 Changes in agricultural input use
3.2.1 LABOR USE
In the centrally planned economy labor was inefficiently employed in most sectors of the economy, and several studies suggest that this was especially the case in agriculture (Brada 1989; Bofinger 1993). Consequently the shift to a more efficient allocation of labor in
2 All countries in the region, expect Turkey, have liberalized their economies in 1990 and therefore all figures and tables start in this year. For Turkey, this year is purely arbitrary. We also choose to keep the focus of the discussion of this section on the countries that went from a state oriented economy to a market orientated economy, although all tables will also show the evolution of output and productivity in Turkey.

7
the economy was expected to coincide with a re-allocation of agricultural labor and, more specifically, an outflow of labor from agriculture to other sectors.
This prediction did not totally coincide with the reality. In some countries, such Russia and Kazakhstan, agricultural employment was relatively stable and it even increased in countries such Armenia, Kyrgyz Republic, and Uzbekistan during the first five years of transition (Table 2). In these countries, agriculture is said to have provided a buffer role during transition, both in terms of labor allocation and in terms of food security (Seeth et al. 1998).
More recently, agricultural employment started to decrease in most countries in the region. However, in some countries, such as Tajikistan and Turkmenistan, agricultural employment is still increasing and recently agricultural employment in these countries increased to more than 150% of the pre reform level of employment.
3.2.2 CAPITAL USE
The most dramatic changes in input use in the first years after transition were changes in capital use. In this section, we illustrate these changes based on changes in tractor use and changes in fertilizer use.
Initially, tractor use in the region was relatively stable as in many countries agricultural reforms were implemented slowly and soft budget constraints still applied (Table 2). However, in the following years, when reforms were implemented, tractor use decreased strongly. For example, after 15 years of transition, tractor use in Russia decreased more than 60% and in Kazakhstan, it even decreased by 79%.
Fertilizer use followed a similar pattern as tractor use, but it even declined more dramatically (Table 2). In the first four years of transition, fertilizer use declined already, but in the following years the decline accelerated and by the mid 2000s fertilizer use fell to approximately 20% of the pre-reform fertilizer use. In some countries, such as Kazakhstan, Armenia or Russia, it declined to less than 10% of the pre-reform fertilizer use.
3.3 Changes in productivity
The measure for productivity is total factor productivity, but comparable estimates for the different countries in the region are scarce3. Therefore, we will only consider partial productivity estimates, such labor productivity and land productivity.
3 An important study that gives an overview of total factor productivity estimates for most countries in the region is Lerman, Csaki and Feder (2004).

8
3.3.1 AGRICULTURAL LABOR PRODUCTIVITY (ALP)
ALP declined in all countries in the region, but like in the case of agricultural output the magnitude of the decline and the time until recovery was different among countries (Figure 16). In Uzbekistan, for example, ALP declined by less than 20% compared to the pre reform era, while in Armenia ALP declined by 60% in the first five years of transition. The decline in ALP was the result of two effects. First, agricultural output declined strongly in all countries and second, outflow of agricultural employment was limited and in some countries agricultural employment even increased. From the mid 1990s, the decline in ALP started to slow down and since the beginning of the 2000s ALP has recovered slowly.
3.3.2 LAND PRODUCTIVITY
In the first years of transition, agricultural yields of the productions, that we studied (grains, sugar beet and cotton), decreased in all countries. In some countries, yields decreased dramatically, for example, between 1990 and 1995, grain yields in Kazakhstan decreased by more than 10% per year (Figure 17), sugar beet yields in Belarus decreased by more than 8% per year (Figure 18) and cotton yields in Tajikistan decreased even by more than 12% per year in the same period (Figure 19).
In the period 1995-2000, yields started to increase again and in Tajikistan and Uzbekistan grain yields reached already at the end of the 1990s the pre reform yield. In Russia, Belarus and Ukraine recovery was slower, but at the mid 2000s yields were increasing in all countries and currently some yields exceed the pre reform level.
3.4 Impact of the financial crisis on the agricultural sector
The crisis is expected to have a negative impact on the recent productivity growth in both the poorer countries and the middle income countries. There are three reasons for this: reduced investments in agriculture, reduced demand for agricultural products and an increase in public intervention.
3.4.1 REDUCED INVESTMENTS IN AGRICULTURE
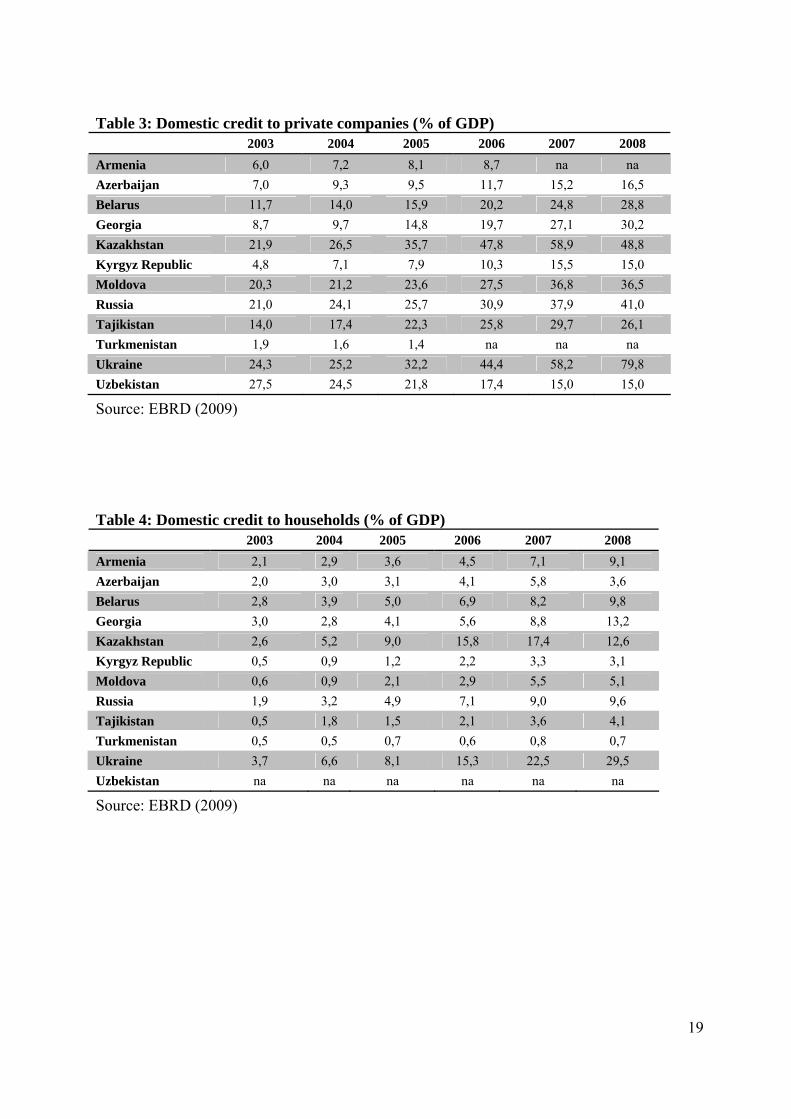
The financial crisis reduces investments in agriculture through two different channels. First, it reduces the supply of loans offered as banks are more reluctant to lend out money. Consequently, banks charge higher interest rates and make tougher collateral demands. In combination with the unstable macroeconomic environment, this makes it more difficult for private borrowers to get loans. This is expected to slow down or reverse the growth in private credit that started in the beginning of the 2000s (Table 3 and Table 4). A reduction in private credit due to the financial crisis will also mean a reduction in rural credit and if rural credit is reduced, it could be expected that investments by agricultural companies and individual households in the agricultural sector will be reduced too.

9
Second, it is expected that food processing companies reduce their investments in the region as consequence of the financial crisis. This is likely for both domestic and foreign investments. In the past years, FDI increased in the region. Investments in the food industry have played an important role in the reintroduction of vertically coordinated supply chains and the provision of credit to farmers in the post transitional period. Vertical coordination of the supply chain was the solution for processors to guarantee to supply a certain quantity and, later on, also a certain quality. FDI in particular played an important role here.
One could expect an overall decrease in investments, because banks are expected to provide less credit to private companies and individual households and foreign investors are expected to reduce their investments. This could cause a stabilization in the recent productivity growth, depending on the extent to which the sector depends on formal credit.
3.4.2 REDUCED DEMAND FOR AGRICULTURAL PRODUCTS
The financial crisis is expected to lead to an decrease of domestic demand for higher value agricultural products and a switch to basic products due to a decrease of the household’s disposable income. This decrease in income is caused by an increase in unemployment levels, macroeconomic instability and a decrease in remittances. In many countries, poverty is still high and there are inefficient social security systems, which cause that even small losses in income will be difficult to cope with. Households in Kazakhstan and Turkey, were found to cope with it by switching to lower quality food and cutting non-essential spending (Hoelscher and Alexander 2009). In 2008, dairy consumption in Russia for the first time in last 10 years decreased (Serova 2008).
3.4.3 AN INCREASE IN PUBLIC INTERVENTION
The governments in some of the countries, such as Russia and Kazakhstan, reacted to the crisis by increasing their expenditures on agriculture (Serova 2008). In Russia, the government provided 25 billion RUR to Rosselkhozbank, the Russian agricultural bank, at a special interest rate and 4 billion RUR to Rosagroleasing, a stated owned leasing company of agricultural equipment. In addition to this, some supported banks are obliged to provide 100% subsidized loans for certain agricultural projects. Finally, the Russian government also provided 60 billion RUR for agricultural budget in 2008 and another 21 billion for the agricultural budget in 2009-2010. In Kazakhstan, the government injected $1 billion into agriculture to deal with the crisis.
These government interventions could be positive if they boost investments and help to stabilize or maybe enforce the growth in agricultural productivity. However, one should be careful that the increase in government intervention in the agricultural sector, does not lead to a (partial) reversal of reforms in the agricultural sector, which could have a negative effect on the efficiency.

10
4 POVERTY AND FOOD SECURITY IN EASTERN EUROPE AND CENTRAL ASIA
Poverty and food security was improving strongly in Eastern Europe and Central Asia before crisis periods hit the region. First, in the first semester of 2008, the region was confronted with rising food prices as consequence of a worldwide food crisis. Later, in the second semester of the same year, a second shock affected the region, when the effects of the worldwide financial crisis became clear. These two crises have fed on each other. Although the food and financial crisis developed from different underlying causes, they are interacting through their implications for financial and economic stability, food security, and political security. The food crisis has added to general inflation and macroeconomic imbalances to which governments must respond with financial and monetary policies. At the same time, the financial crisis and the accompanying decrease in economic growth have pushed food prices to lower levels by decreasing demand for agricultural commodities. Further, as capital becomes scarcer and more expensive and as consumer spending stagnates, the expansion of agricultural production to address the food crisis has been cut short (Von Braun 2008).
In this section, we discuss the evolution of poverty and food security in the period before the food crisis. Then we look in to the effects of the recent food crisis and finally we discuss the expected impact of the financial crisis.
4.1 Evolution of poverty and food security before the two crises
A World Bank study reports a significant decline in poverty during 1998–2003 (Alam et al. 2005). In 1998, approximately 20% of the population was living in poverty, whereas this was down to 12% in 2003. The decrease in poverty was the most important in the middle income, resource rich countries, such as Russia, Kazakhstan and Ukraine, but also in the poorer countries in the region managed to decrease the number of poor in their country.
The most important driving factor behind the poverty reduction is the overall high economic growth in the region in that period. Given the importance of economic growth in poverty reduction, it could be expect that poverty reduction in the region even accelerated in the past five years as the economic growth rates in the region were even more pronounced compared to the period 1998-2003.
Despite these positive findings, there are still some concerns with relation to the spatial dimensions of poverty reduction. In general, poverty rates are higher in rural areas than in the capital city or other urban areas (Macours and Swinnen 2005). In the period 1998-2003, both rural and urban poverty decline substantially, but rural poverty is not catching up and therefore grows in relative importance (Macours and Swinnen 2005).
4.2 Impact of the food crisis on poverty and food security
World market prices for major food commodities such as grains and vegetable oils have been rising sharply since the 2006 growing by a rate of more than 60% of previous levels. This was driven by a low stock-to-use ratio. Over a number of years, consumption was higher than production, shortfalls in grain production due to regional droughts reduced

11
the supply, and also the disappearance of intervention stocks in USA and the EU worked in this direction. In combination with increased world demand due to higher imports from emerging countries, a growing world population and changing food patterns in developing economies, this situation resulted in a sharp increase in food prices (Kray 2008).
4.2.1 IMPACT ON DIFFERENT SOCIOECONOMIC GROUPS
The impact of higher food prices differs substantially among socioeconomic groups and typologies of households. In general, higher food prices can substantially hurt poor net food consumers (especially in countries where food still accounts for a large share in their household budget), while they have a positive effect on the income of net food producers. Urban poorer households – wage earners and net buyers of food – are likely to be more negatively affected than rural groups, as they usually are net food consumers of food products.
However, it is important to note that there are differences within the farmers’ group. In fact, in many countries there is a significant group of farmers with very small holdings, who do not cultivate enough land for self-production and are in fact net food buyers. These subsistence farmers represent a substantial part of the rural and even total population. A World Bank study found that in 2003 20 % of the population in Georgia, 24 % in Kazakhstan, and 40 % in Moldova, rely on their own farming activities as the main source of their livelihood (Alam et al. 2005). In addition to subsistence farmers also agricultural laborers are net buyers of food products and will be negatively affected by the food crisis. In most countries of the region, except for Armenia, agricultural laborers represent a significant group in agricultural employment as the agricultural sector is mainly dominated by large agricultural enterprises (Table 5).
In case that market imperfections do not avoid the transmission of high food prices to smallholders, the group of farmers that will have the possibility to profit from the rising food prices are the net food producers. In the short run, higher food prices increase the income of these farmers. In the long run, high food prices are not only be expected to increase agricultural incomes, but also to increase investments in the agricultural sector. This will positively affected productivity, as well as produce some indirect effects on non-agricultural rural income (e.g. trade and services). The size of this multiplier effect will of course depend on the share of the increased agricultural rents ultimately invested and spent in rural areas. However, unless agriculture is a major component of the total GDP of agriculture-based countries, it is unlikely that the beneficial economy-wide effects of increased food production will offset in a major way the negative direct effects of increased prices on the urban poor (FAO 2008).
4.2.2 IMPACT ON DIFFERENT COUNTRIES
The food crisis affected especially the poorer countries, such Tajikistan and Kyrgyz Republic, which are traditionally net importers of food products and have a large share of net buyers of agricultural products.
12
In Tajikistan especially urban households rely exclusively on markets for their food supply and they are most likely to experience food insecurity (World Food Programme 2008a). In the autumn of 2008 15% of the urban Tajik population were severely food insecure, while another 22% were moderately food insecure. In rural areas food security was slightly better as only 11% of the rural households were classified as severely food insecure and 23% of rural households were moderately food insecure4. These numbers were similar to the previous assessment of food security in the beginning of the same year In some regions, the situation has improved, but deteriorated in others. In one region 70% of the interviewed households respond to cope with increasing food prices through reduced consumption (World Food Programme 2008b). The data show that one of the main issues is access to food as most of the households are still finding it hard to purchase food and for many the only way is to rely on remittances or borrowing. Therefore increasing food prices are expected to have negative implications on food security.
Similar findings are found in Kyrgyz Republic. In the autumn of 2008, 21% of all households were found to be severely food insecure and another 13% were moderately food insecure. There was a slight increase in the proportion of severely food insecure households in urban areas from the 1st to the 3rd quarter of 2008, possibly reflecting more economic difficulties for these households who depend on the market for the majority of their food and thus face larger expenses than rural households (Dhur 2008).
4.3 Impact of the financial crisis on poverty and food security
The financial crisis and the accompanying slow down of the economy reversed the increase in commodity prices, which could be expected to have benefits for the food security and poverty of net consumers of food. However, at the same time, a reduction in real wages and employment and a decline in remittances are expected to negatively affecting the income of all households in the region and increasing poverty and food insecurity.
4.3.1 EFFECT ON THE INCOME OF INDIVIDUAL HOUSEHOLDS
In Tajikistan, it is estimated that a 30 percent decline in remittances would cut the consumption of households in the poorest quintile between 17 percent (rural) and 21 percent (urban) and increase headcount poverty from 53 percent to nearly 58 percent (World Bank 2009a). In January 2009, 50% of the households with migrants have not received any remittances in the past three months, and among the remittances recipients, 60% reported receiving less than usual. This trend is also confirmed by income data and by the fact that
4 Severely and moderately food insecure households are determined by crossing groups of households according to their levels of food consumption and food access, as follows:
• Food consumption indicator: kilocalorie intake per capita per day (2-week food diary); 3 ‘food consumption’ groups: o Poor food consumption: kcal intake < 1800 kcal/cap./day; about 80% standard requirements; o Borderline: kcal intake 1801-2099 kcal/cap./day; 80-99% standard requirements o Acceptable: kcal intake ≥ 2100 kcal/capita/day.
• Food access indicator: consumption expenditures per capita (monthly recall of all expenditures and valuation of food coming from own production); 3 ‘food access’ groups: o Poor access: bottom wealth quintile, expenditures < extreme poverty line; o Average access: 2nd and 3rd wealth quintiles; expenditures between extreme poverty line and poverty line or just above poverty line; o Good access: 4th and top wealth quintiles; expenditures well above poverty line.
13
43% of households estimate their economical situation as worse than last year, while only 1% of households indicate that their situation is better. At the same time, the economic situation is forcing households to take on new debts, mostly to buy and stock food (and feed). Half of the households surveyed have taken on new debts and 1/3 of them will not be able to repay them before 2 months. All the severely food insecure households borrow money exclusively for buying food. Shopkeepers also confirmed receiving more demand for credit (World Food Programme 2009).
Also in Russia, a middle income country, the first figures show that the poverty is increasing again. In the summer of 2009, the Russian statistical agency, Rosstat, reported in that the population below the national poverty line increased by almost one-third—from 13.4 percent of the population in the last quarter of 2008 to 17.4 percent during the first quarter of 2009—or, an additional 6 million individuals in poverty (World Bank 2009b).
4.3.2 EFFECT ON GOVERNMENT REVENUE
The financial crisis also negatively affects the government budgets, in addition to the effect on the households’ incomes discussed,. This could have a negative impact on government spending on social assistance programs, while these in fact need to be expanded given the expected increase in poverty. Governments also need to consider changing the eligibility criteria of the current programs or to introduce new programs, because some of the individuals that will fall into poverty because of the crisis may not be easily reached by existing social protection programs. For example, returning migrants who do not qualify for unemployment insurance.
Currently, total spending on social assistance averages 1.7 percent of GDP in the region but there is substantial variation across countries, ranging from 0.5 percent of GDP in Tajikistan through 2.0 percent in Ukraine, which is still substantially lower than in the OECD countries where social spending on average augment to 2,5% of GDP (World Bank 2009b).
Besides the total spending, also the coverage and the targeting accuracy vary between countries. Coverage rates - the share of households in the poorest quintile of the population reached by social assistance programs - vary between 0 and 80 percent (Figure 20). Belarus and Russia have the highest coverage rates, followed by moderate rates in Armenia, Azerbaijan and Turkey, while the low-income countries in the region have the lowest coverage rates, reaching only 30 percent of the poorest quintile in Georgia and the Kyrgyz Republic and barely 1 percent in Tajikistan.
The targeting accuracy of social benefits - the share of benefits going to the poorest quintile of households - is rather poor in the region (Figure 21). In several countries the poorest quintile receives less than a third of the safety net benefits. It is remarkable that the countries that have a high coverage rates, not necessary have a high targeting accuracy. For example, at 80 percent, the Russian Federation has relatively good coverage, but only 30 percent of total benefits go to the poorest quintile.
14
5 POLICY RECOMMENDATIONS
5.1 Stimulate economic growth
The best strategy to reduce poverty, improve the food security and enhance the agricultural productivity in the past, has been an increase in economic growth. Economic growth and the consequent increase in employment alternatives, have a positive effect on households’ income and through taxes and other government revenues also on the government budget. These effects will reduce poverty in two ways. First, an increase of households’ income has a direct effect on poverty and second, the increase in government budget can be used to enhance social safety nets, helping to push the poor over the poverty line.
In the agricultural sector, growth of the non-agricultural economy is necessary to absorb the surplus labor. In the region, a further reduction of overemployment in the sector is crucial to enhance productivity and growth of agricultural output. Additionally, economic growth enhances investments and research in the sector, two evolutions that can contribute to an increase in productivity, which is necessary to increase agricultural incomes and reduce rural poverty.
5.2 Promote (foreign) investments
Increased investments have been a major driving force behind the recent economic growth. In the agri-food industry in other more economic advanced transition countries, such as the new member states of the EU, foreign investments has been one of the, if not the, main engine behind productivity growth, quality improvements, and enhanced competitiveness. The inflow of FDI in the food industry and the associated pressure on the domestic firms to restructure will lead to important changes in the agricultural supply chain.
The task of the government will be to provide a favorable institutional and policy environment for stimulating more FDI. They can do this by providing a favorable institutional and regulatory climate for foreign investors. In this perspective it is important that the governments continue the reform process that started at the beginning of the 1990s.
Currently, there is a marked slowdown in reforms relative to previous years, but the number of reforms that are dismantled is still well below the that of the crisis that affected the region in the 1998 (EBRD 2009). This slow down can be explained by at least three reasons. First, most governments in the region have been “fire fighting” in order to mitigate the worst effects of the crisis and had no time to spend on more fundamental reforms. Second, reforms are usually accompanied with short term pain in order to achieve long term benefit. In an economic harsh period such reforms become politically more difficult to implement. Third, some reforms, such as privatization, require private investors, which are scarce and will offer a lower price in current environment. However, despite these concerns, it will be important for the governments in the region to continue with the reform process in order to attract more investors as the economy recovers.

15
5.3 Enhance social security safety nets
Social safety nets need to be strengthened to deal with the expected increase in poverty. However, the concrete measures that need to be taken differ between countries as social assistance systems in the region largely vary in size and targeting performance. Crucial will be to expand some of the well-performing programs and reform the relatively less effective interventions.
Another crucial reform that needs to be taken in all countries is scaling up targeted programs that reach the poorest quintile of the population. Most countries in the region, have at least one well-targeted program where a high proportion of benefits reaches the poorest quintile of households. Examples of well targeted programs include the Unified Monthly Benefit in the Kyrgyz Republic, the Family Benefit Program in Armenia and the Targeted Social Assistance Programs in Azerbaijan and Georgia, which deliver between 55 and 60 percent of their benefits to the poorest quintile. But their coverage—the share of the poorest quintile reached by these programs—is generally less than 35 percent and should be expanded (World Bank 2009b).
Finally, the governments in the region also need to consider to introduce new poverty-focused programs that focus on the people that will fall into poverty because of the crisis and that are not reached by the existing social security programs, such as for example, migrant workers that return to their home countries.
5.4 Avoid short run policies that conflict with long run development goals
In the current environment, it is very important that governments do not implement inappropriate “panic” policies that may have welfare consequences far larger than the welfare losses resulting directly from the shocks themselves. In 2007-08, some countries imposed trade restrictions and price controls in response to rising food prices. Such policies redistributed income away from rural food producers to urban consumers (who tend to be richer). The net social impact may be even larger when considering the impact of such policies on production incentives and the likely spillover impacts of restrictive trade policies on neighboring countries.
Additionally, it is important that policy responses do not conflict with the key longer-term reform agenda. For example, many of the restrictive trade and price controls that governments in the region adopted in response to the food price increases in 2007 have not been reversed and with lower food prices, these policies could be expected to further increase the poverty gap between urban and rural areas.

16
6 REFERENCES
Ah Poe, C. (2009), “Impact of the global financial crisis: Case study Armenia”, World Food Programme, VAM Food Security Analysis, Rome.
Alam, A., Murthi, M., Yemtsov, R., Murrugarra, E., Dudwick, N., Hamilton, E. and E. Tiongson (2005), “Growth, Poverty, and Inequality: Eastern Europe and the Former Soviet Union”, World Bank, Washington D.C.
Barth, J., Caprio, G. and R. Levine (2008), “Bank Regulations Are Changing: For Better or Worse?”, Policy Research Working Paper 4646, World Bank, Washington D.C.
Bofinger, P. 1993. “The Output Decline in Central and Eastern Europe: A Classical Explanation”, Discussion Paper Series, Center for Economic Policy Research, London.
Brada, J.C. 1989. “Technical Progress and Factor Utilization in Eastern European Economic Growth”, Economica, Vol. 56, pp. 433-448.
Brownbridge M. and S Canagarajah (2009), “How should fiscal policy respond to the economic crisis in the low income Commonwealth of Independent States? Some pointers from Tajikistan”, Policy Research Working Paper 4970, World Bank, Washington D.C.
Dhur, A. (2008), “Food Security Assessment in the Kyrgyzstan Republic”
EBRD (2009), “Transition Report 2009: Transition in crisis?”, European Bank for Reconstruction and Development, London.
FAO (2008), “Growing Demand on Agriculture and Rising Prices of Commodities: An opportunity for smallholders in low-income, agricultural-based countries?”, Paper prepared for the Round Table organized during the Thirty-first session of IFAD's Governing Council, 14 February 2008.
Gorton, M. and J. White (2007), “Transformation and Contracting in the Supply Chains of the Former Soviet Union: Evidence from Armenia, Georgia, Moldova, Ukraine and Russia”, in Swinnen, J.F.M. (ed.), “Global Supply Chains, Standards and the Poor”, Wallingford, Oxfordshire: CABI Publishing.
Hoelscher, P. and G. Alexander (2009), “Social Protection in Eastern Europe and Central Asia- Before, During and After the Crisis”, UNICEF Regional Office for CEE/CIS.
Kray H. (2008), “Agricultural Commodities. Price trends and Policy Responses”, Presentation at the World Bank Workshop ‘Addressing the Food Price Crisis in Europe and Central Asia’.

17
Lerman, Z., Csaki, C. and G. Feder (2004), Agriculture in Transition: Land Policies and Evolving Farm Structures in Post-Soviet Countries, Lanham: Lexington Books, Lanham.
Macours, K., and J.F.M. Swinnen (2002) “Patterns of Agrarian Transition”, Economic Development and Cultural Change, Vol. 50(2), pp. 265-294.
Macours, K. and J.F.M. Swinnen (2005), “Rural-Urban Poverty Differences in Transition Countries”, World Development, Vol. 36 (11), pp. 2170-2187.
Seeth, H.T., Chachnov, S., Surinov, A. and J. von Braun (1998) “Russian Poverty: Muddling Through Economic Transition with Garden Plots.” World Development, Vol. 26(9), pp. 1611-23.
Serova (2008), “Impact of the global financial crisis on Russian and Kazakh agriculture”, Presentation at the FAO-UNDP Europe and Central Asia Regional Consultation, 4-5 December 2008, Budapest.
Von Braun, J. (2008), “Food and Financial crisis: Implications for the Poor”, Food Policy Report, International Food Policy Research Institute, Washington D.C.
World Bank (2009a), “The Crisis Hits Home: Stress Testing Households in Europe and Central Asia”, World Bank Report No. 50158-ECA, Washington DC.
World Bank (2009b), “Turmoil at Twenty - Recession, Recovery, and Reform in Central and Eastern Europe and the Former Soviet Union”, World Bank, Washington D.C.
World Food Programme (2008a), “Rural Tajikistan Emergency Food Security Assessment: A Joint Food Security, Livelihoods, Agriculture and Nutrition Assessment”, World Food Programme, Rome.
World Food Programme (2008a), “Tajikistan: Food Security Bulletin”, World Food Programme, Rome.
World Food Programme (2009), “Tajikistan: Food Security Bulletin”, World Food Programme, Rome.

18
7 TABLES
Table 1: Workers remittances, compensation of employees and migrant transfers (US $ million) 2003 2004 2005 2006 2007 2008 2009e Armenia 162 435 498 658 846 1062 743 Azerbaijan 171 228 693 813 1287 1554 1087 Belarus 222 257 255 340 354 448 339 Georgia 235 303 346 485 695 732 534 Kazakhstan 147 166 178 187 223 192 131 Kyrgyz Republic 78 189 322 481 715 1232 1011 Moldova 487 705 920 1182 1498 1897 1491 Russia 1453 2495 3012 3344 4713 6033 5506 Tajikistan 146 252 467 1019 1691 2544 1815 Turkmenistan n.a. n.a. n.a. n.a. n.a. n.a. n.a. Ukraine 330 411 595 829 4503 5769 4472 Uzbekistan n.a. n.a. n.a. n.a. n.a. n.a. n.a.
Source: World Bank staff estimates based on the International Monetary Fund's Balance of Payments Statistics Yearbook 2008
Table 2: Change in Input Use Labor use Tractor use Fertilizer use 1995 2000 2005 1995 2000 2005 1994 1998 2002 Armenia 194 179 174 119 117 128 23 15 17 Azerbaijan 97 137 136 90 91 52 n.a. n.a. n.a. Belarus 86 67 54 92 58 44a 34 44 35 Georgia 74 65 58 71 73 64 39 24 20 Kazakhstan 89 n.a. n.a. 78 23 21 42 2 11 Kyrgyz Republic 135 164 140 99 102 88 n.a. n.a. n.a. Moldova Russia 100 113 92 82 58 37 30 8 9 Tajikistan 131 134 155 84 65 59 32 16 12 Turkey Turkmenistan 121 140 157a n.a. n.a. n.a. 51 23 30 Ukraine 106 100 123 92 62 69 65 55 47 Uzbekistan 112 99 91 n.a. n.a. n.a. 46 59 52 a Data from 2004 b Data from 2003 Source: National statistics, ILO and FAOSTAT
19
Table 3: Domestic credit to private companies (% of GDP) 2003 2004 2005 2006 2007 2008 Armenia 6,0 7,2 8,1 8,7 na na Azerbaijan 7,0 9,3 9,5 11,7 15,2 16,5 Belarus 11,7 14,0 15,9 20,2 24,8 28,8 Georgia 8,7 9,7 14,8 19,7 27,1 30,2 Kazakhstan 21,9 26,5 35,7 47,8 58,9 48,8 Kyrgyz Republic 4,8 7,1 7,9 10,3 15,5 15,0 Moldova 20,3 21,2 23,6 27,5 36,8 36,5 Russia 21,0 24,1 25,7 30,9 37,9 41,0 Tajikistan 14,0 17,4 22,3 25,8 29,7 26,1 Turkmenistan 1,9 1,6 1,4 na na na Ukraine 24,3 25,2 32,2 44,4 58,2 79,8 Uzbekistan 27,5 24,5 21,8 17,4 15,0 15,0
Source: EBRD (2009)
Table 4: Domestic credit to households (% of GDP) 2003 2004 2005 2006 2007 2008 Armenia 2,1 2,9 3,6 4,5 7,1 9,1 Azerbaijan 2,0 3,0 3,1 4,1 5,8 3,6 Belarus 2,8 3,9 5,0 6,9 8,2 9,8 Georgia 3,0 2,8 4,1 5,6 8,8 13,2 Kazakhstan 2,6 5,2 9,0 15,8 17,4 12,6 Kyrgyz Republic 0,5 0,9 1,2 2,2 3,3 3,1 Moldova 0,6 0,9 2,1 2,9 5,5 5,1 Russia 1,9 3,2 4,9 7,1 9,0 9,6 Tajikistan 0,5 1,8 1,5 2,1 3,6 4,1 Turkmenistan 0,5 0,5 0,7 0,6 0,8 0,7 Ukraine 3,7 6,6 8,1 15,3 22,5 29,5 Uzbekistan na na na na na na
Source: EBRD (2009)

20
Table 5: Individual land use Individual land use in 2000
(% of total land use) Armenia 90 Azerbaijan n.a. Belarus 12 Georgia 44 Kazakhstan 24 Kyrgyz Republic 37 Moldova 20 Tajikistan 9 Turkmenistan 8 Russia 13 Ukraine 17 Uzbekistan 14
Note: Data on individual land use are from 1998, 1999 or 2000, depending on the data availability. Source: Csaki and Tuck (2000) and Macours and Swinnen (2002)

8 FIGURES
Figure 1: Evolution of the spread of the crisis
■Crisis index of 1 ■Crisis index of 2 ■ Crisis index of 3 ■ Crisis index of 4 Note: The index ranges from 1 to 4 and is the sum of the following sub indices:
- A 25% (or more) depreciation of the nominal interest rate with respect to the US - A 20% (or more) decrease of nominal house price index with respect to the pre crisis index - Two (or more) months decrease in production in the previous six months - Two (or more) consecutive months of decline in net credit in the previous six months
Source: EBRD (2009)
21
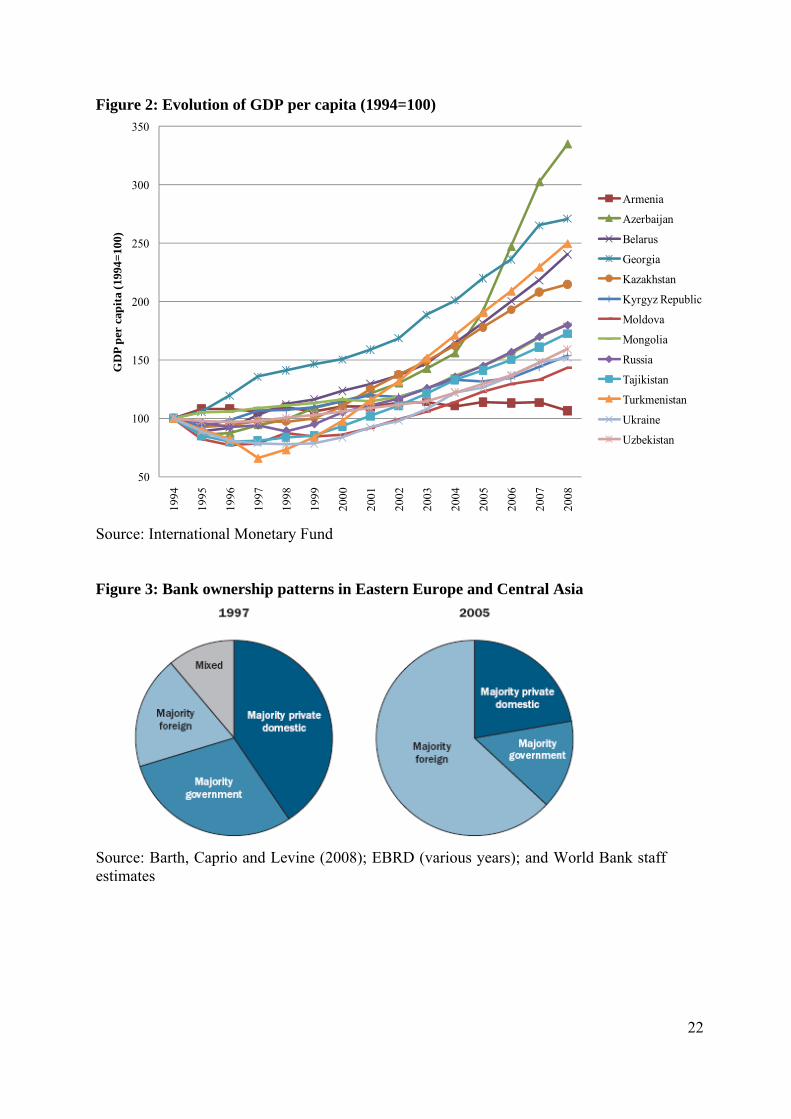
Figure 2: Evolution of GDP per capita (1994=100)
50
100
150
200
250
300
350
1994
1995
1996
1997
1998
1999
2000
2001
2002
2003
2004
2005
2006
2007
2008
GD
P pe
r ca
pita
(199
4=10
0)
Armenia
Azerbaijan
Belarus
Georgia
Kazakhstan
Kyrgyz Republic
Moldova
Mongolia
Russia
Tajikistan
Turkmenistan
Ukraine
Uzbekistan
Source: International Monetary Fund Figure 3: Bank ownership patterns in Eastern Europe and Central Asia
Source: Barth, Caprio and Levine (2008); EBRD (various years); and World Bank staff estimates
22

Figure 4: Evolution of the non-performing loans (% of total loans)
0
2
4
6
8
10
12
14
16
18
20
2003 2004 2005 2006 2007 2008
Non
per
fom
ing
loan
s (%
of t
otal
loan
s) Armenia
Azerbaijan
Belarus
Georgia
Kazakhstan
Kyrgyz Republic
Moldova
Russia
Tajikistan
Turkmenistan
Ukraine
Source: EBRD (2009)
Figure 5: Foreign Direct Investments (FDI)
0
500
1000
1500
2000
2500
3000
3500
4000
1992
1993
1994
1995
1996
1997
1998
1999
2000
2001
2002
2003
2004
2005
2006
2007
2008
FDI (
US$
per
capi
ta)
Armenia
Azerbaijan
Belarus
Georgia
Kazakhstan
Kyrgyzstan
Republic of Moldova
Russian Federation
Tajikistan
Turkmenistan
Ukraine
Uzbekistan
Source: UNCTAD online database
23

Figure 6: Evolution of commodity prices
50
100
150
200
250
300
nov/
07
dec/0
7
jan/0
8
feb/
08
mrt/
08
apr/0
8
mei/
08
jun/
08
jul/0
8
aug/
08
sep/
08
okt/0
8
nov/
08
dec/0
8
jan/0
9
feb/
09
mrt/
09
apr/0
9
mei/
09
jun/
09
jul/0
9
aug/
09
sep/
09
okt/0
9
Price
inde
x (20
05=1
00)
Food Agricultural Raw materials Metals Oil
Source: IMF online database Figure 7: Evolution of the FDI inflow (US$ per capita)
0
100
200
300
400
500
600
700
1996
1997
1998
1999
2000
2001
2002
2003
2004
2005
2006
2007
2008
2009
FDI i
nflo
w (U
S$ p
er ca
pita
)
Armenia
Belarus
Georgia
Moldova
Ukraine
Russia
Kazakhstan
Kyrgyz Republic
Tajikistan
Turkmenistan
Uzbekistan
Note: Data for 2007 and 2009 are estimates Source: EBRD (2009)
24

Figure 8: Lending to private borrowers in the transition region (%)
Note: The transition region also includes the Central and Eastern European countries that are already a member of the EU. Source: EBRD (2009)
Figure 9: Growth in real GDP (%)
-20
-15
-10
-5
0
5
10
15
20
25
30
Arm
enia
Azer
baija
n
Bela
rus
Geo
rgia
Mol
dova
Kaz
akhs
tan
Kyr
gyz R
epub
lic
Mon
golia
Russ
ia
Tajik
istan
Turk
ey
Turk
men
istan
Ukr
aine
Uzbe
kista
n
Gro
wth
in r
eal G
DP (%
)
2007
2008
2009
Note: Data for 2008 are preliminary actual, mostly official government estimates and data for 2009 represents EBRD projections. Source: IMF and EBRD (2009)
25

Figure 10: Decline in export volume (%)
-60
-40
-20
0
20
40
60
80
Armenia Belarus Kazakhstan Kyrgyz Republic
Moldova Russian Federation
Turkey Ukraine
Cha
nge i
n m
erch
andi
se ex
port
s (ye
ar to
yea
r per
cent
age c
hnag
e)
2008Q22008Q32008Q42009Q12009Q2
Source: WTO online trade database
Figure 11: Growth in unemployment (%)
0
2
4
6
8
10
12
14
16
18
Belarus Moldova Russia Turkey Ukraine
Une
mpl
oym
ent r
ate (
%)
2008Q2
2008Q3
2008Q4
2009Q1
2009Q2
Source: ILO online database
26

Figure 12: Change in exchange rate
0
10
20
30
40
50
60
70
Ukraine Kazakhstan Turkey Armenia Georgia Russia Tajikistan Kyrgyz Republic
Dep
rect
iati
on (
%)
Notes: Maximum depreciation between the third quarter of 2008 and the first quarter of 2009. Exchange rate defined as local currency against the US dollar. Source: IMF
Figure 13: Annual inflation (%)
0
10
20
30
40
50
60
70
2001 2002 2003 2004 2005 2006 2007 2008 2009e
Ann
ual i
nfla
tion
(%)
Armenia
Azerbaijan
Belarus
Georgia
Kazakhstan
Kyrgyz Republic
Moldova
Russia
Tajikistan
Turkmenistan
Ukraine
Uzbekistan
Note: Figures for 2009 are estimates Source: IMF (2009)
27
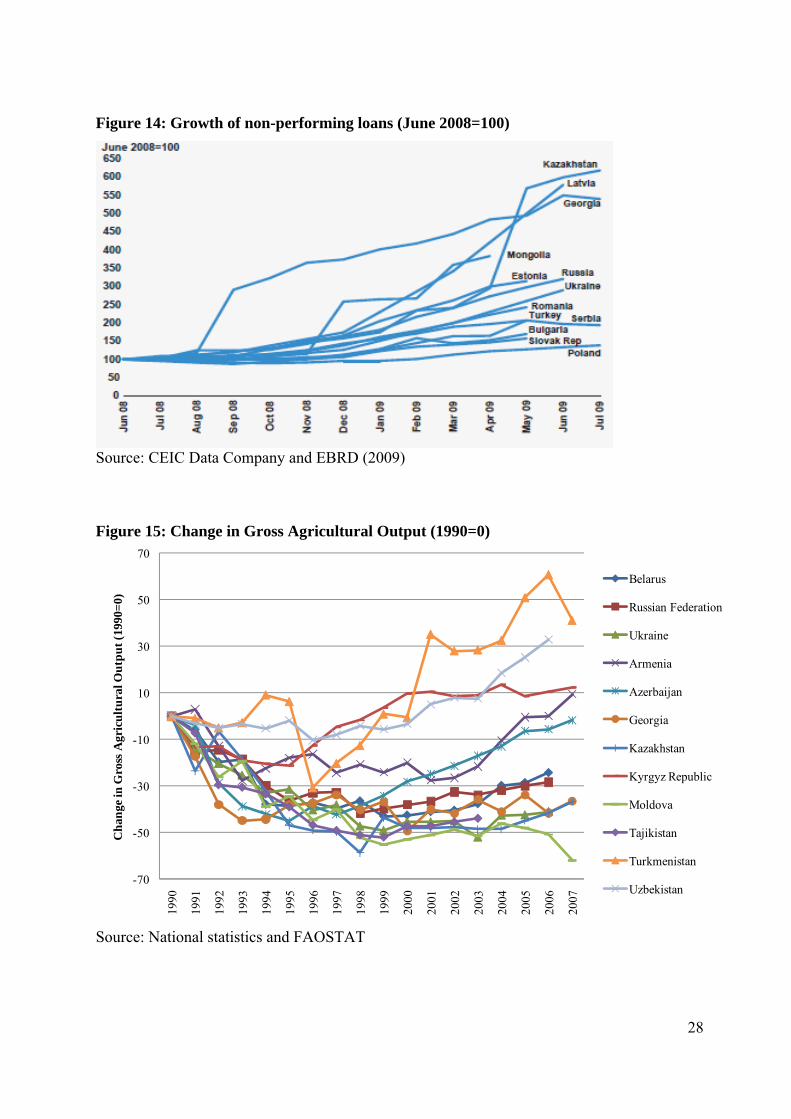
Figure 14: Growth of non-performing loans (June 2008=100)
Source: CEIC Data Company and EBRD (2009)
Figure 15: Change in Gross Agricultural Output (1990=0)
-70
-50
-30
-10
10
30
50
70
1990
1991
1992
1993
1994
1995
1996
1997
1998
1999
2000
2001
2002
2003
2004
2005
2006
2007
Cha
nge i
n G
ross
Agr
icul
tura
l Out
put (
1990
=0)
Belarus
Russian Federation
Ukraine
Armenia
Azerbaijan
Georgia
Kazakhstan
Kyrgyz Republic
Moldova
Tajikistan
Turkmenistan
Uzbekistan
Source: National statistics and FAOSTAT
28

Figure 16: Change in ALP (1990=0)
-80
-60
-40
-20
0
20
40
60
1990
1991
1992
1993
1994
1995
1996
1997
1998
1999
2000
2001
2002
2003
2004
2005
2006
2007
Cha
nge i
n A
LP (1
990=
0)
Armenia
Azerbaijan
Belarus
Georgia
Kyrgyz Republic
Moldova
Russian Federation
Tajikistan
Turkmenistan
Ukraine
Uzbekistan
Source: National statistics, ILO and FAOSTAT
29

Figure 17: Change in grain yieldsa (1990=0)
-60
-40
-20
0
20
40
60
80
100
120
140
1990
1991
1992
1993
1994
1995
1996
1997
1998
1999
2000
2001
2002
2003
2004
2005
2006
2007
Cha
nge
in g
rain
yie
ld (1
990=
0)
Belarus
Russia
Ukraine
Kazakhstan
Kyrgyzstan
Tajikistan
Turkmenistan
Uzbekistan
a Yields based on a three year moving average Source: National statistics and FAOSTAT
30

Figure 18: Change in sugar beet yieldsa (1990=0)
-40
-30
-20
-10
0
10
20
30
40
1990
1991
1992
1993
1994
1995
1996
1997
1998
1999
2000
2001
2002
2003
2004
2005
2006
2007
Cha
nge i
n su
gar b
eet y
ield
(199
0=0)
Belarus
Russian Federation
Ukraine
a Yields based on a three year moving average Source: National statistics and FAOSTAT Figure 19: Change in cotton yieldsa (1990=0)
-60
-40
-20
0
20
40
60
1990
1991
1992
1993
1994
1995
1996
1997
1998
1999
2000
2001
2002
2003
2004
2005
2006
2007
Chan
ge in
cotto
n yi
eld (1
990=
0)
Kazakhstan
Kyrgyzstan
Tajikistan
Turkmenistan
Uzbekistan
a Yields based on a three year moving average Source: National statistics and FAOSTAT
31
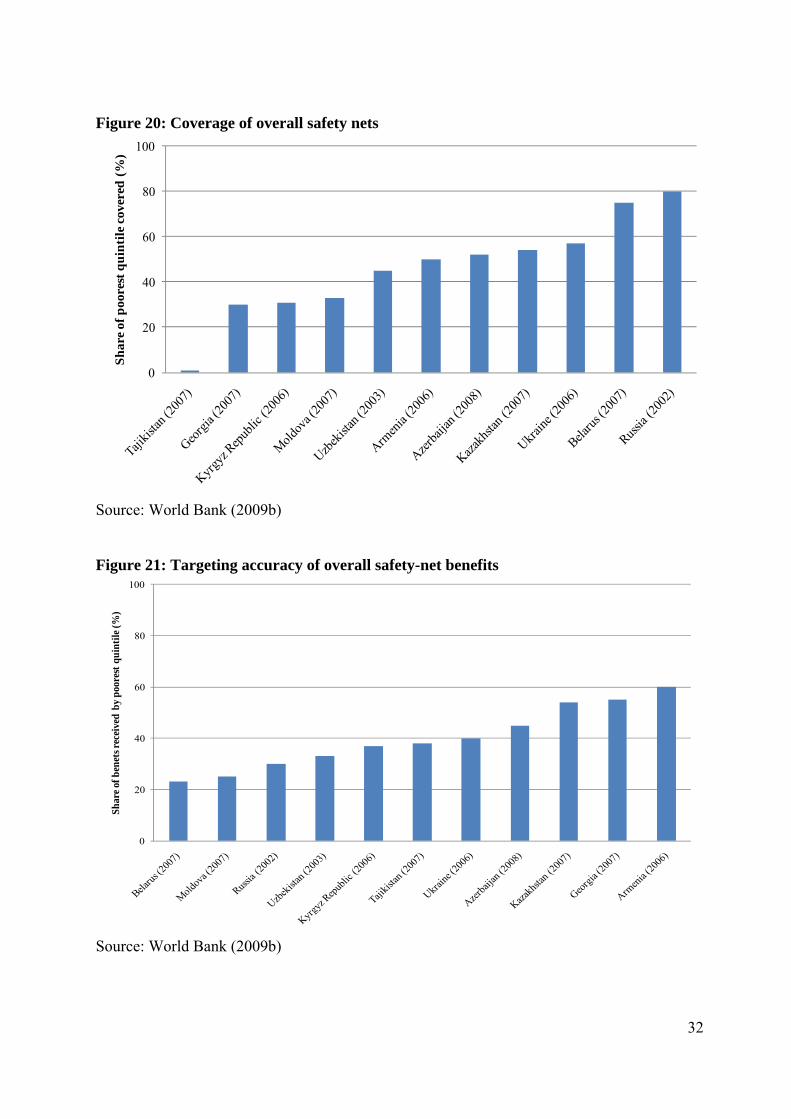
Figure 20: Coverage of overall safety nets
0
20
40
60
80
100
Shar
e of
poo
rest
qui
ntile
cov
ered
(%
)
Source: World Bank (2009b)
Figure 21: Targeting accuracy of overall safety-net benefits
0
20
40
60
80
100
Shar
e of b
enet
s rec
eive
d by
poo
rest
qui
ntile
(%)
Source: World Bank (2009b)
32

ANNEX 1
Spread of financial crisis in the Eastern Europe and Central Asia region based on EBRD crisis index
The EBRD distinguishes three phases in the evolution of the present financial and economic crisis: a “Not affected” period (July 2007 to September 2008), “Crisis” period (September 2008 to March 2009) and “Stabilization” period (April 2009-present) (EBRD 2009. The figure below describes the spread of the crisis in the region based on a crisis index constructed by EBRD. It shows that in March 2008 the crisis had only a limited effect on the countries in Eastern Europe and Central Asia, but one year later the crisis had spread over the entire region. The intensity of crisis is different between countries and it has affected mainly the resource rich countries, such as Russia, Kazakhstan and Ukraine.
Figure: Evolution of the spread of the crisis
■Crisis index of 1 ■Crisis index of 2 ■ Crisis index of 3 ■ Crisis index of 4 Note: The index ranges from 1 to 4 and is the sum of the following sub indices:
- A 25% (or more) depreciation of the nominal interest rate with respect to the US - A 20% (or more) decrease of nominal house price index with respect to the pre crisis index - Two (or more) months decrease in production in the previous six months - Two (or more) consecutive months of decline in net credit in the previous six months
Source: EBRD (2009)
33

“Not affected” period (July 2007 to September 2008)
Until September 2008, the economy in Eastern Europe and Central Asia was growing strongly and the region became well integrated in the world economy. Despite the first signs of the financial crisis on the world market, credit growth continued, with exception for Kazakhstan where credit booms started to reverse even before the global crisis. Domestic demand was soaring and GDP per capita rose on average by more than 6%.
Figure: Evolution of GDP per capita (1994=100)
50
100
150
200
250
300
350
1994
1995
1996
1997
1998
1999
2000
2001
2002
2003
2004
2005
2006
2007
2008
GD
P pe
r ca
pita
(199
4=10
0)
Armenia
Azerbaijan
Belarus
Georgia
Kazakhstan
Kyrgyz Republic
Moldova
Mongolia
Russia
Tajikistan
Turkmenistan
Ukraine
Uzbekistan
Source: International Monetary Fund
There are several reasons why the financial crisis in the US had not immediately spillover effects on the economy in Eastern Europe and Central Asia (EBRD 2009).
First, the credit market in the region was more stable than it was at the time of the Asian crisis at the end of the 1990s. Since 1997, the share of foreign banks grow substantially (Barth, Capri and Levine 2008; EBRD 2009).
34

Figure: Bank ownership patterns in Eastern Europe and Central Asia
Source: Barth, Caprio and Levine (2008); EBRD (various years); and World Bank staff estimates
These foreign investors were crucial for the stabilization and amelioration of the financial system in the region, because they introduced new products and better practices in the regions’ financial sector. The restructuring of the banking sector led to an increase in credit supply to private companies and households (see table below), a decrease in the non performing loans (see Figure below) and an increase in the profitability. Additionally, foreign banks could be expected to be more resistant to the negative effects of the crisis as in many cases they received substantial financial support from the governments in their home countries.
Table: Domestic credit to private companies and households (% of GDP) 2003 2004 2005 2006 2007 2008 Armenia 8,1 10,1 11,7 13,2 na na Azerbaijan 9,0 12,3 12,6 15,8 21,0 20,1 Belarus 14,5 17,9 20,9 27,1 33,0 38,6 Georgia 11,7 12,5 18,9 25,3 35,9 43,4 Kazakhstan 24,5 31,7 44,7 63,6 76,3 61,4 Kyrgyz Republic 5,3 8,0 9,1 12,5 18,8 18,1 Moldova 20,9 22,1 25,7 30,4 42,3 41,6 Russia 22,9 27,3 30,6 38,0 46,9 50,6 Tajikistan 14,5 19,2 23,8 27,9 33,3 30,2 Turkmenistan 2,4 2,1 2,1 na na na Ukraine 28,0 31,8 40,3 59,7 80,7 109,3 Uzbekistan na na na na na na
Source: EBRD (2009)
35

Figure: Evolution of the non-performing loans (% of total loans)
0
2
4
6
8
10
12
14
16
18
20
2003 2004 2005 2006 2007 2008
Non
perf
omin
g loa
ns (%
of to
tal l
oans
)
Armenia
Azerbaijan
Belarus
Georgia
Kazakhstan
Kyrgyz Republic
Moldova
Russia
Tajikistan
Turkmenistan
Ukraine
Source: EBRD (2009)
Second, since the beginning of the 2000s, foreign investments in different sectors of the economy have strongly increased. Most of these investors have long term strategic interests in the region and are not expected to withdraw their investment capital.
Figure: Foreign Direct Investments (FDI)
0
500
1000
1500
2000
2500
3000
3500
4000
1992
1993
1994
1995
1996
1997
1998
1999
2000
2001
2002
2003
2004
2005
2006
2007
2008
FDI (
US$
per
capi
ta)
Armenia
Azerbaijan
Belarus
Georgia
Kazakhstan
Kyrgyzstan
Republic of Moldova
Russian Federation
Tajikistan
Turkmenistan
Ukraine
Uzbekistan
Source: UNCTAD online database
Third, the resource-rich countries in the region, such as Russia, Kazakhstan and Ukraine, still benefited from high commodity prices in this period, which stimulate economic growth and
36

domestic demand. Oil prices increased to levels higher than 100US$ at the start of the third quarter of 2008, and at the same time also prices for metals and non-energy commodities reached record levels.
Figure: Evolution of commodity prices
50
100
150
200
250
300
nov/
07
dec/0
7
jan/0
8
feb/
08
mrt/
08
apr/0
8
mei/
08
jun/
08
jul/0
8
aug/
08
sep/
08
okt/0
8
nov/
08
dec/0
8
jan/0
9
feb/
09
mrt/
09
apr/0
9
mei/
09
jun/
09
jul/0
9
aug/
09
sep/
09
okt/0
9
Price
inde
x (20
05=1
00)
Food Agricultural Raw materials Metals Oil
Source: IMF online database
“Crisis” period (September 2008 to March 2009)
In September 2008, the bankruptcy of the American investment bank, Lehman Brothers, led to an acceleration of the worldwide spread of crisis. Risk premiums for products in emerging markets strongly increased and cross border lending decreased. In addition to this worldwide effect, the position of countries in Eastern Europe and Central Asia particularly worsened by the collapse of commodity prices, due to a reduction of worldwide demand and bad economic forecasts. Especially oil prices were hit and by the end of the year, they more than halved. In Russia and Georgia, the confidence was also undermined by their conflict in August 2008. In general, the crisis affected the economy in the region through reduced capital flows, namely a decline in investments, a decline in domestic production and exports, and a decline in remittances (World Bank 2009b).
37

38
Annex 2
DECLINE IN REMITTANCES
The financial crisis caused a slowdown of migration and decline of remittances because of its negative effects on labor demand in the European Union and the resource-rich countries in Eastern Europe and Central Asia. For workers from most countries in Central Asia, such as Armenia, Azerbaijan, Georgia, the Kyrgyz Republic, Tajikistan, Turkmenistan, and Uzbekistan, the major destinations to find employment are Russia and Kazakhstan, whereas workers from Moldova mainly leave for the European Union.
In the past 5 years, remittances and the outflow of labor in poorer countries in the region have increased substantially, because of high economic growth in the host countries of the migrants. In the poorer countries in the region they became a major - maybe even the most important - source of income for households. The table below shows that in Tajikistan remittances represent approximately 50% of GDP, but also in Kyrgyz Republic and Moldova the domestic economies in dependent also to a large extent on remittances, which amounted around to 30% of GDP.
Table: Workers remittances, compensation of employees and migrant transfers in 2008
(% of GDP)
Armenia 8.90 Azerbaijan 3.40
Belarus 0.70 Georgia 5.70
Kazakhstan 0.10 Kyrgyz Republic 27.9
Moldova 31.4 Russia 0.40
Tajikistan 49.6 Turkmenistan n.a.
Ukraine 3.20 Uzbekistan n.a.
Source: World Bank staff estimates based on the International Monetary Fund's Balance of Payments Statistics Yearbook 2008
A slowdown of the economy and reduction of the employment opportunities in Russia, Kazakhstan and the European Union hurts the surrounding poorer countries via reduced migration flows and remittances. The fall in remittances will reduce private disposable incomes and consequently reduce private consumption and residential construction. This effect is expected to be the largest in Tajikistan, which is already the poorest country in the region, but similar effects are expected in other countries that also largely depend on remittances, such Georgia, Armenia, Kyrgyz republic and Moldova.

Although data are limited, the first results on the evolution of labor flows and remittances confirm the expectations. In Armenia, figures show a substantial decrease in migration flows to CIS countries in the first quarter of 2009 compared to same period in 2008 (Ah Poe 2009). In January, departures decreased by 9%, in February by 14% and in March by 25% against the same month of the previous year.
Figure: Decline in migration to CIS countries from Armenia
Jan Feb Mar2008 39168 38327 464232009 35571 33128 34772
0
5000
10000
15000
20000
25000
30000
35000
40000
45000
50000
Mig
ratio
n to
CIS
coun
trie
s ( p
erso
ns)
Source: Ah Poe (2009)
Also remittances are expected to decreases substantially. In Tajikistan remittances are projected to fall at least one third in 2009 from their 2008 levels (Brownbridge and Canagarajah 2009).
Figure: Monthly remittances in Tajikistan (million US $)
Source: Brownbridge and Canagarajah (2009)
39
40
Annex 3
Patterns of Agricultural growth in the Region
While agriculture in the region reviewed experienced a decline in the 1990s, but in the past decade there was a substantive growth in term of productivity and output. However, there were substantial differences between countries.
We can distinguish between groups of countries that have a different “pattern” of output and productivity changes. First, there is the group of poor Central Asian countries, such as Armenia, Azerbaijan, Kyrgyz Republic and Tajikistan, that are characterized by more poverty and the absence of a good social security system, labor intensive agricultural systems and slower progress in overall reforms. In these countries, agriculture played a buffer role and a labor sink. Reforms caused a strong shift from large scale towards individual farming – especially when land distribution in kind to households was introduced after the failure of the share distribution system became evident. The reforms also caused a substantial inflow of agricultural labor into agriculture, and growth in the importance of more labor-intensive sectors, such as horticulture and livestock. This caused a decrease in labor productivity while land productivity (yields) grew. Although there has been substantial growth in yields, labor productivity is still now substantially below pre-reform levels.
Second, there is a group of middle income countries in the region, such as Kazakhstan, Russia and Ukraine. In these countries, there was almost no outflow of agricultural labor and, since output fell substantially in the 1990s, agricultural labor productivity declined strongly. Reforms were implemented only slowly and soft budgets continued, which favored the large-scale farms and constrained restructuring, with limited efficiency gains. Only after the Russian crisis in 1998 the macroeconomic situation improve with enhanced competitiveness of the domestic agricultural sector through exchange rate devaluations and the inflow of revenues from increasing oil and mineral prices. This affected in particular Russia and Kazakhstan. Ukraine implemented a series of important reforms in the late 1990s. Since then, agricultural productivity has increased in these countries as liquidity in the economy and investments in agriculture increased. Surplus employment started to decline gradually. Another important factor in the growth of productivity in the 2000s were increased investments in the food industry which benefited agriculture through vertical integration.
The tables below show the changes in agricultural output, input use, labor productivity and yields in the past 2 decades.

41
Table: Change in Gross Agricultural Output GAO Index Average annual growth rate
(% per year) 1995 2000 2005 1990-1995 1995-2000 2000-2005 Armenia 82 80 100 -3.3 -0.3 4.8 Azerbaijan 55 72 94 -10.9 5.7 5.4 Belarus 61 58 71 -8.8 -1.2 4.5 Georgia 62 51 66 -8.2 -3.4 6.0 Kazakhstan 53 52 55 -10.5 1.1 1.2 Kyrgyz Republic 79 110 109 -4.6 6.9 -0.1 Moldova 66 47 52 -7.1 -5.8 2.1 Russia 64 62 70 -8.5 -0.3 2.5 Tajikistan 61 53 n.a. -9.0 -2.6 2.0 Turkey 103 117 124 0.6 2.8 1.3 Turkmenistan 106 99 151 1.4 0.8 9.6 Ukraine 69 55 58 -7.1 -4.0 1.5 Uzbekistan 98 97 125 -0.3 -0.2 5.4
Source: National statistics and FAOSTAT
Table: Change in Input Use Labor use Tractor use Fertilizer use 1995 2000 2005 1995 2000 2005 1994 1998 2002Armenia 194 179 174 119 117 128 23 15 17 Azerbaijan 97 137 136 90 91 52 n.a. n.a. n.a. Belarus 86 67 54 92 58 44a 34 44 35 Georgia 74 65 58 71 73 64 39 24 20 Kazakhstan 89 n.a. n.a. 78 23 21 42 2 11 Kyrgyz Republic 135 164 140 99 102 88 n.a. n.a. n.a. Moldova Russia 100 113 92 82 58 37 30 8 9 Tajikistan 131 134 155 84 65 59 32 16 12 Turkey Turkmenistan 121 140 157a n.a. n.a. n.a. 51 23 30 Ukraine 106 100 123 92 62 69 65 55 47 Uzbekistan 112 99 91 n.a. n.a. n.a. 46 59 52
a Data from 2004 b Data from 2003 Source: National statistics, ILO and FAOSTAT

42
Table: Change in Agricultural Labour Productivity ALP Index Average annual growth rate
(% per year) 1995 2000 2005 1990-1995 1995-2000 2000-2005 Armenia 42 45 57 -14.34 1.25 5.39 Azerbaijan 57 53 69 -9.99 -0.78 5.50 Belarus 72 85 132 -5.79 3.75 9.19 Georgia 84 79 113 -2.60 -0.73 8.10 Kazakhstan 60 n.a. n.a. -8.23 n.a. n.a. Kyrgyz Republic 58 67 78 -9.98 2.88 3.43 Moldova 58 41 65 -9,11 -5,54 10,10 Russia 63 55 76 -8.50 -2.45 6.91 Tajikistan 46 39 40a n.a. -2.95 1.01 Turkey 46 141 179 2,52 5,23 5?50 Turkmenistan 88 71 84b -2.40 -2.00 5.42 Ukraine 65 55 47 -8.34 -2.93 -2.94 Uzbekistan 88 98 138 -2.33 2.31 7.22
a Data in 2003 b Data in 2004 Source: National statistics, ILO and FAOSTAT
Table: Change in Grain yields Grain yield Index Average annual growth rate
(% per year) 1995 2000 2005 1990-1995 1995-2000 2000-2005Belarus 79 68 87 -4.56 -2.86 5.07 Kazakhstan 54 93 76 -10.91 12.46 -3.95 Kyrgyz Republic 63 93 99 -8.70 8.34 1.31 Russia 70 79 95 -6.83 2.97 3.97 Tajikistan 81 101 150 -3.43 5.41 8.68 Turkmenistan 76 70 123 -4.83 -0.62 11.96 Ukraine 67 62 73 -7.44 -1.32 3.39 Uzbekistan 98 154 228 -0.22 9.55 8.22
Calculations are based on three-year moving average Source: National statistics and FAOSTAT

43
Table: Change in Sugar beet yields Sugar beet Index Average annual growth rate
(% per year) 1995 2000 2005 1990-1995 1995-2000 2000-2005 Belarus 65 84 110 -8.15 5,46 5.60 Russia 69 86 131 -7.15 4,81 8.71 Ukraine 83 74 110 -3.62 -2.29 8.42
Calculations are based on three-year moving average Source: National statistics and FAOSTAT
Table: Change in Cotton yields Cotton yield Index Average annual growth rate
(% per year) 1995 2000 2005 1990-1995 1995-2000 2000-2005 Kazakhstan 69 74 83 -6.90 1.91 2.36 Kyrgyz Republic 74 111 124 -5.71 8.58 2.56 Tajikistan 51 57 67 -12.29 2.08 3.80 Turkmenistan 72 58 53 -6.04 -3.74 -1.41 Uzbekistan 90 82 95 -2.13 -1.59 3.00
Calculations are based on three-year moving average Source: National statistics and FAOSTAT
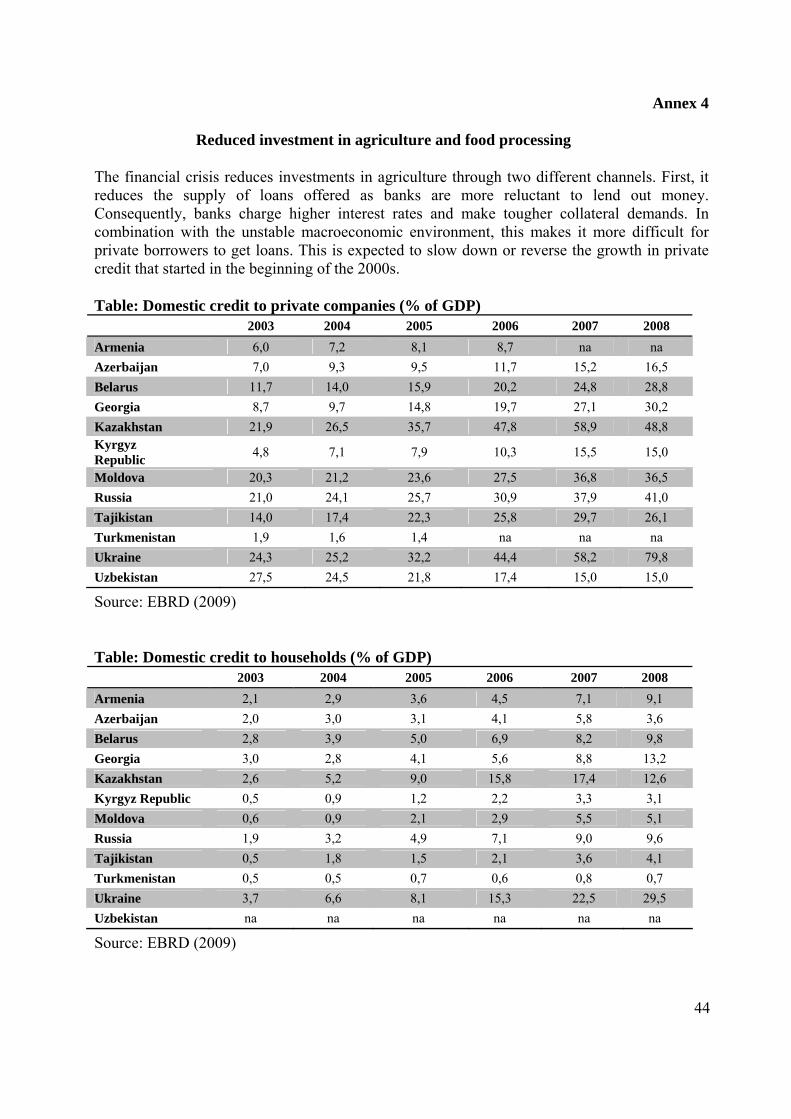
44
Annex 4
Reduced investment in agriculture and food processing
The financial crisis reduces investments in agriculture through two different channels. First, it reduces the supply of loans offered as banks are more reluctant to lend out money. Consequently, banks charge higher interest rates and make tougher collateral demands. In combination with the unstable macroeconomic environment, this makes it more difficult for private borrowers to get loans. This is expected to slow down or reverse the growth in private credit that started in the beginning of the 2000s.
Table: Domestic credit to private companies (% of GDP) 2003 2004 2005 2006 2007 2008 Armenia 6,0 7,2 8,1 8,7 na na Azerbaijan 7,0 9,3 9,5 11,7 15,2 16,5 Belarus 11,7 14,0 15,9 20,2 24,8 28,8 Georgia 8,7 9,7 14,8 19,7 27,1 30,2 Kazakhstan 21,9 26,5 35,7 47,8 58,9 48,8 Kyrgyz Republic 4,8 7,1 7,9 10,3 15,5 15,0
Moldova 20,3 21,2 23,6 27,5 36,8 36,5 Russia 21,0 24,1 25,7 30,9 37,9 41,0 Tajikistan 14,0 17,4 22,3 25,8 29,7 26,1 Turkmenistan 1,9 1,6 1,4 na na na Ukraine 24,3 25,2 32,2 44,4 58,2 79,8 Uzbekistan 27,5 24,5 21,8 17,4 15,0 15,0
Source: EBRD (2009)
Table: Domestic credit to households (% of GDP) 2003 2004 2005 2006 2007 2008 Armenia 2,1 2,9 3,6 4,5 7,1 9,1 Azerbaijan 2,0 3,0 3,1 4,1 5,8 3,6 Belarus 2,8 3,9 5,0 6,9 8,2 9,8 Georgia 3,0 2,8 4,1 5,6 8,8 13,2 Kazakhstan 2,6 5,2 9,0 15,8 17,4 12,6 Kyrgyz Republic 0,5 0,9 1,2 2,2 3,3 3,1 Moldova 0,6 0,9 2,1 2,9 5,5 5,1 Russia 1,9 3,2 4,9 7,1 9,0 9,6 Tajikistan 0,5 1,8 1,5 2,1 3,6 4,1 Turkmenistan 0,5 0,5 0,7 0,6 0,8 0,7 Ukraine 3,7 6,6 8,1 15,3 22,5 29,5 Uzbekistan na na na na na na
Source: EBRD (2009)

In Russia credit to individual households increased from 1.9% of GDP in 2003 to almost 10% of GDP in 2008, but also in poorer countries in the region, credit markets started to grow. In Tajikistan, the poorest country in the region, credit supplied to individual households increased from 0.5% of GDP in 2003 to more than 4% of GDP in 2008. Recent figures confirm the expectations and show that since mid 2008 credit supplied to private borrowers has decreased substantially.
Figure: Lending to private borrowers in the transition region (%)
Note: The transition region also includes the Central and Eastern European countries that are already a member of the EU. Source: EBRD (2009)
A reduction in private credit due to the financial crisis will also mean a reduction in rural credit and if rural credit is reduced, it could be expected that investments by agricultural companies and individual households in the agricultural sector will be reduced too.
Second, it is expected that food processing companies reduce their investments in the region as consequence of the financial crisis. This is likely for both domestic and foreign investments. In the past years, FDI increased in the region. In 1996, FDI in the primary sector in Russia was approximately 4 billion rubles whereas in 2003 it had increased to more than 100 billion rubles.
45

Figure: FDI in the primary sector in Russia
0
20
40
60
80
100
120
1996 1997 1998 1999 2000 2001 2002 2003
Billi
on ru
bles
Source: Serova (2008)
Investments in the food industry have played an important role in the reintroduction of vertically coordinated supply chains and the provision of credit to farmers in the post transitional period. The disruption of agri-food chain, the macro economic instability and the reforms of the legal institutions after transition made that contract enforcement was no longer guaranteed and all parties in the supply chain were confronted with hold-up problems. Farmers were not willing to supply to a processor because they feared payment delays or even non-payments. If they wanted to supply they often lacked the basic input factors or expertise to produce a certain quantity or quality. Vertical coordination of the supply chain was the solution for processors to guarantee to supply a certain quantity and, later on, also a certain quality. FDI in particular played an important role here.
In a case study on Moldova, Armenia, Georgia, Russia, and Ukraine, Gorton and White (2004) found that foreign investors use significantly more contract support measures, such as farm assistance programs, than their domestic counterparts. These programs are found to have vertical spill-over effects on both the quantity and the quality produced, but foreign investments are also found to have spill-over effects on domestic companies, who started to adopt similar contract support measures.
One could expect an overall decrease in investments, because banks are expected to provide less credit to private companies and individual households and foreign investors are expected to reduce their investments. This could cause a stabilization in the recent productivity growth, depending on the extent to which the sector depends on formal credit.
46

Annex 5
Evolution of poverty and food security before the two crises
A World bank study reports a significant decline in poverty during 1998–2003 (Alam et al. 2005). In 1998, approximately 20% of the population was living in poverty, whereas this was only 12% in 2003.
Figure: Distribution of population by poverty status (1998-9 and 2002-3)
215,1264,2
160,7
153,3
10261,2
0%
10%
20%
30%
40%
50%
60%
70%
80%
90%
100%
1998-9 2002-3
% o
f the
pop
ulat
ion
Poor (less than $ 2,15 per day)
Vulnerable (between $ 2,15 and $ 4,30 per day)
Non poor (more than $ 4,30 per day)
Note: In million persons and in percent to population. Poverty lines converted to local currencies using 2000 PPP. Data refer to ECA Region as defined by the World Bank, and Turkey is included in the aggregate figures. Source: World Bank staff estimates using ECA Household Surveys Archive The decrease in poverty was the most important in the middle income, resource rich countries, such as Russia, Kazakhstan and Ukraine, but also in the poorer countries in the region managed to decrease the number of poor in their country.
47

Figure: Changes in poverty in the region (% of the population)
0
10
20
30
40
50
60
70
80
90
100
1998
/99
2003
2002
2003
1998
2002
1997
2003
2001
2003
2000
2003
1998
2003
1997
2002
1999
2003
2002
2003
2000
/01
2003
Armenia Azerbajian Belarus Georgia Kazakhstan Kyrgyz Republic
Moldova Russia Tajikistan Ukraine Uzbekistan
Pove
rty
(% o
f the
pop
ulat
ion)
Above $2.15 but below $4.30
Below $2.15 a day
Source: World Bank staff estimates using ECA Household Surveys Archive
In addition, to a reduction in poverty, income inequality decreased in most countries in the region, except for Georgia and Tajikistan (World Bank 2005). These findings in relation to poverty reduction are also reflected in food security as in all countries, expect for Uzbekistan, undernourishment decreased substantially compared to the end of the 1990s.
Table: Prevalence of undernourishment in total population (%) 1990-92 1995-97 2003-05 WB analytical classification Armenia 46 34 21 Lower middle income Azerbaijan 27 27 12 Lower middle income Belarus <5 <5 <5 Lower middle income Georgia 47 24 13 Lower middle income Kazakhstan <5 <5 <5 Lower middle income Kyrgyz Republic 17 13 <5 Low income Moldova <5 <5 <5 Lower middle income Russian Federation <5 <5 <5 Upper middle income Tajikistan 34 42 34 Low income Turkey <5 <5 <5 Lower middle income Turkmenistan 9 9 6 Lower middle income Uzbekistan 5 5 14 Low income
Source: FAO (2009)
48
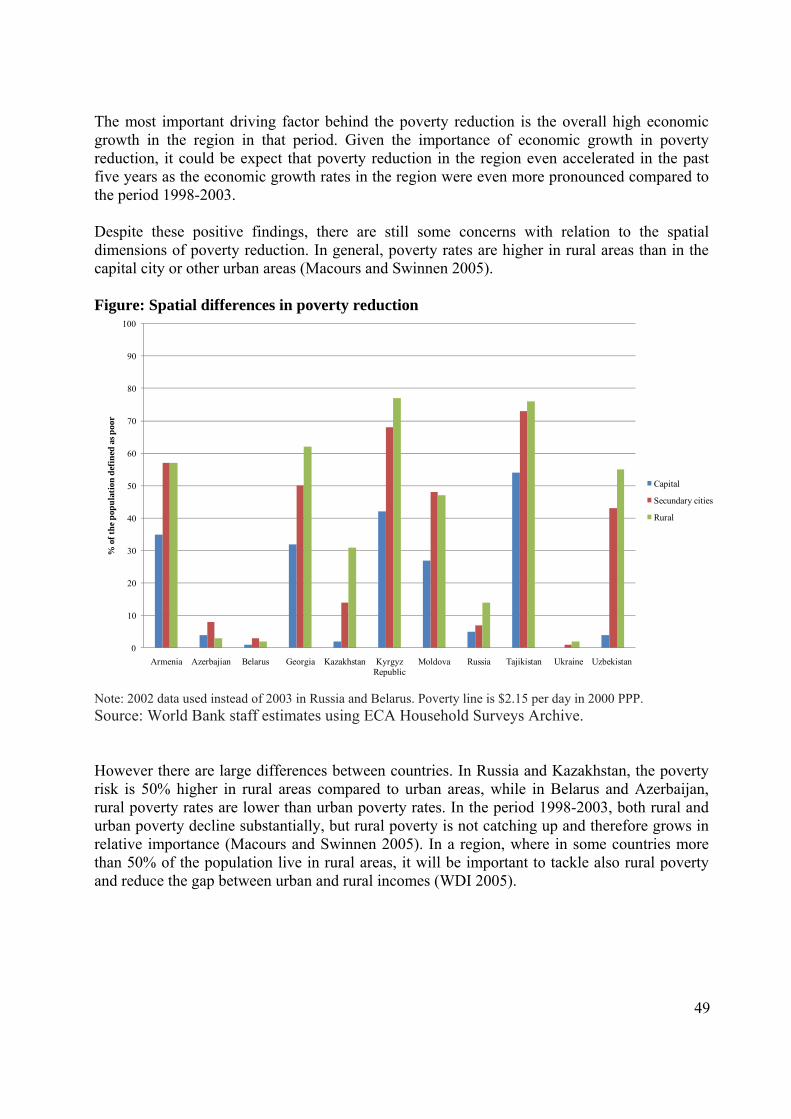
The most important driving factor behind the poverty reduction is the overall high economic growth in the region in that period. Given the importance of economic growth in poverty reduction, it could be expect that poverty reduction in the region even accelerated in the past five years as the economic growth rates in the region were even more pronounced compared to the period 1998-2003. Despite these positive findings, there are still some concerns with relation to the spatial dimensions of poverty reduction. In general, poverty rates are higher in rural areas than in the capital city or other urban areas (Macours and Swinnen 2005).
Figure: Spatial differences in poverty reduction
0
10
20
30
40
50
60
70
80
90
100
Armenia Azerbajian Belarus Georgia Kazakhstan Kyrgyz Republic
Moldova Russia Tajikistan Ukraine Uzbekistan
% o
f the
pop
ulat
ion
defin
ed a
s poo
r
Capital
Secundary cities
Rural
Note: 2002 data used instead of 2003 in Russia and Belarus. Poverty line is $2.15 per day in 2000 PPP. Source: World Bank staff estimates using ECA Household Surveys Archive. However there are large differences between countries. In Russia and Kazakhstan, the poverty risk is 50% higher in rural areas compared to urban areas, while in Belarus and Azerbaijan, rural poverty rates are lower than urban poverty rates. In the period 1998-2003, both rural and urban poverty decline substantially, but rural poverty is not catching up and therefore grows in relative importance (Macours and Swinnen 2005). In a region, where in some countries more than 50% of the population live in rural areas, it will be important to tackle also rural poverty and reduce the gap between urban and rural incomes (WDI 2005).
49