Embed Size (px)
Citation preview

45
* Institute of Economics, Hungarian Academy of Sciences: [email protected]. The research was supported by the Hungarian National Scientific Research Fund (OTKA, reg. no. 68355).
ABSTRACT: The paper is searching for an answer to the question how the British model affected economic development in its mother country, the United Kingdom. The statistical analysis, models of mathematical economics and econometric investigation make it probable to conclude that there was a substantial difference in success between the Thatcherite and the Blairite economic policies; the latter proved more effective. It is particularly remarkable that the Blairite model, connecting privatisation with a successful employment policy, reduced unemployment and social sensitivity, has not only speeded up economic growth but also improved economic equilibrium, curtailing, among others, the budget deficit.
KEY WORDS: economic policy; economic theory; growth models; international analyses and comparisons; globalisation.
APSTRAKT: Studija traži odgovor na pi-tanje na koji način je Britanski model uti-cao na privredni razvoj u Velikoj Britaniji. Statistička analiza, modeli matematičke ekonomije i ekonometrijsko istraživanje čine verovatnim zaključak da postoji su-štinska razlika u uspešnosti Tačerovske i Blerovske ekonomske politike, pri čemu se ova poslednja pokazala kao efikasnija. Po-sebno je primetno da Blerov model, pove-zujući privatizaciju sa uspešnom politikom zapošljavanja, smanjenom nezaposlenošću i socijalnom osetljivošću, nije samo ubrzao privredni rast, već je i poboljšao ekonom-sku ravnotežu, smanjujući, između ostalog, budžetski deficit.
KLJUČNE REČI: ekonomska politika; ekonomska teorija; modeli rasta; međuna-rodne analize i upoređenja; globalizacija.
György Simon, Jr.* DOI:10.2298/EKA0775045S
THE IMPACT OF THE BRITISH MODEL ON ECONOMIC GROWTH
UTICAJ BRITANSKOG MODELA NA PRIVREDNI RAST
ORIGINALNI NAUČNI RADOVI / SCIENTIFIC PAPERS
JEL Classification: E10, F43, O40

46
György Simon, Jr.
1. Introduction
In our days, the investigation of United Kingdom’s economic development is important not only because of the country’s role in world economy but perhaps still more because the economic policy hallmarked by the names of Margaret Thatcher and Tony Blair serves in many respects as a model for other countries including Hungary and Serbia. To what extent have Thatcherism and Blairism proved effective in their motherland? This is the question to be answered by the present paper relying on a statistical analysis and then on models of mathematical economics and an econometric investigation covering more than half a century of British economic development from 1950 to 2005. Thus, the results of the Thatcherite and Blairite periods are comparable with both each other and the preceding period since the early 1950s.
In specialist literature, Spencer (1984) evinced that the finding of oil in the North Sea had had very little effect on the exchange rate until the late 1970s. Bean and Crafts (1995), analysing the post-war growth performance of British economy, emphasised the role of government policy and institutions. According to Middleton (2000), that performance can be understood in terms of a complex interaction of market and non-market failures. The United States and major countries of continental Europe “overtook” the British economy primarily by transferring resources from low productivity agriculture into more efficient manufacturing and services. Booth (2001) stated that over the course of the twentieth century, the British economy had not performed badly, either relative to its growth potential or the actual record of comparable economies, and denied that enterprise culture had suffered from any kind of pathology. Card and Freeman (2002) emphasised that the reform process begun in 1979 had made Britain more market-conform than its European competitors and halted the almost century-long economic decline. Crafts and Mills (2005) ascertained that total factor productivity in British and West German manufacturing between 1950 and 1996 was initially put back by a rising supply price of capital goods, the problem which largely disappeared in the later globalisation period.
2. Main characteristics of economic development and economic policy
Britain’s post-World War II economic development in respect of economic policy can be divided into several phases.

The Impact of the British model on economic growth
47
Prior to 1979, the economic policies of alternating Conservative and Labour 1. governments were based on the French tradition of state planning and control as well as on the German tradition of close co-operation between capital and labour. The public sector created by Labour was practically left untouched by the Conservatives.1The election of May 1979 was won by the Conservative Party, which 2. laid the main emphasis in economic policy, instead of full employment, on financial stabilisation, offering a new, neo-liberal model for Europe. The Thatcher–Major government reduced the income tax and subsidies to businesses, limited the influence of trade unions, began the deregulation, abolished foreign exchange controls, and greatly facilitated the international integration of financial markets and production. Its wide-ranging privatisation programme covered the oil, steel, automotive, aerospace and food industries; manufacture of computers; telecommunications and postal services; railway transport; electricity, gas and water supply, as well as the sale of public housing to tenants. The sale of public corporations, along with the tax and pension reforms, made it possible to create a “shareholder democracy”, though in certain cases a small portion of share ownership, for strategic or political reasons, remained with the state. More efficient management resulted in diminishing costs and intensifying competitiveness. At the same time, privatisation led to the loss of tens of thousands of jobs in coal mining and steel industry, as well as to underinvestment and a decline in the quality of services in transport.2
In May 1997, an electoral victory was gained by the renewed Labour under 3. the leadership of Tony Blair, which previously had already broken with the traditional leftist ideology championing nationalisation and envisaged the creation of a society where power, wealth and opportunity would be in the hands of the many, not the few, and the enterprise of the market and rigour of competition would be joined with the forces of partnership and co-operation. This centrist New Labour essentially pursued the previous Thatcherite course in the field of privatisation and deregulation, as well as in transforming the health service, education and the pension system, but also carried out several new reforms on the basis of public-private partnership. The Blair government has created a special training and employment system called the New Deal of rights and responsibilities that achieved notable results in the field of employment policy and embraced a policy of redistribution to the less well-off.3
1 Gillingham (2003), pp. 117–120.2 Ibid., pp. 139–141, 167–179; Rosser and Rosser (2004), pp. 575–579.3 Gillingham (2003), pp. 399–409; Havas (2003), pp. 246–258.

48
György Simon, Jr.
The foundations of the British model are a market economy, resting on private property and guided by competition, and constitutionality. Its essence is the freedom of competition and markets, the central role of individual success. Its characteristics are deregulation, liberalisation, a free-market price and wage formation, a limited role of trade unions and state intervention. Its key element is the flexibility, efficiency of labour. Business enterprises are managed by anonymous owners preferring stock exchange financing.4
This model originally restricted monetary policy solely to the goal of price stabilisation and opposed any attempts by the monetary and fiscal authorities to influence production and employment.5 The measures of monetarist economic policy based on free competition are productivity, efficiency, competitiveness and profitability.6 To reduce the social inequalities that had increased in the course of Thatcherite reforms, the New Labour announced the “third way” rejecting both the social insensitiveness of neo-liberalism and the traditional nationalising aspirations of the Left.7
How have the economic policies characterised above affected Britain’s economic development? In this part, we are to search for an answer to that question with the help of a statistical analysis, keeping in view that a successful economic development is characterised by a rapid and efficient economic growth, as well as by ensuring the existing or restoring the upset economic equilibrium.
The success of an economic policy can be described by indices constructed with the aid of basic macro indicators.8 The structure of these indices is such that their negative values are favourable, whereas the positive ones are unfavourable. Among the indices figure the average annual growth rate of GDP, as the most important characteristic of economic growth, and the four basic indicators connected with economic equilibrium: inflation (consumer price index), the rate of unemployment,9 the general government and the current account balance in percentage of GDP (see Table 1).
4 Marján (2005), pp. 70–71.5 Handa (2005), p. 371.6 Arday (1993), p. 7.7 Havas (2003), p. 249.8 Veress (1997), pp. 239–240.9 Inflation and unemployment exert a particularly great influence on public opinion, therefore,
as indicated below, can also be considered as components of the so-called misery index.

The Impact of the British model on economic growth
49
Table 1. Calculated macro indices of the United Kingdom between 1951 and 2005 (average of annual values, per cent)
Indicator 1951–2005 1951–1978 1979–1996 1997–2005a) Inflation (consumer
price index)b) Rate of
unemployment
5.9
4.9
6.6
2.2
6.4
8.3
2.6
5.4c) Misery index (a+b) 10.8 8.8 14.7 8.0d) Average annual
growth rate of GDP (calculated at 1995 prices) 2.5 2.6 2.1 2.8
e) Unpopularity index (a–3d) -1.6 -1.2 0.1 -5.8
f) General government balance in percentage of GDP
g) Current account balance in percentage of GDP
0.6
-0.7
1.6
-0.2
-2.5
-1.6
-0.9
-1.6h) Disequilibrium
index –(f+2g) -0.8 1.2 5.7 4.1Total (c+e+h) 8.4 8.8 20.5 6.3
Sources: Yearbook of Labour Statistics (ILO, Geneva), various volumes; Mitchell (1988), pp. 584–586, 592–593; Harper (2006), pp. 15, 22, 111, 290; Eurostat, (2006), p. 75.
What conclusions can be drawn from investigating the period 1950–2005?
The rate of economic growth in Britain’s economy as compared to other 1. developed countries was not slow. It is a significant result that, in the period of Blairite economic policy, the decelerating tendency stopped and, what is more, changed into acceleration.10
Neither the pre-Thatcherite nor the Thatcherite economic policy managed to 2. bring down inflation to a level corresponding to the Maastricht criteria, yet it was accomplished in the Blairite period.
10 In 2006, the growth rate of GDP in the UK amounted to 2.8 per cent (source: New Cronos Eurostat database).

50
György Simon, Jr.
The previously low unemployment significantly increased in the second 3. period. On the other hand, in the Blairite period, it considerably diminished, though it was still higher than in the first period. In the second period, the general government balance changed from positive 4. into negative, but remained within the Maastricht criteria. In the Blairite period, the deficit significantly decreased.11 In the second and third periods, the current account balance became somewhat 5. more unfavourable but did not create serious difficulties. The government’s popularity reached the highest level in the Blairite period, 6. when not only had growth speeded up, but economic equilibrium was also improving (see Table 1).
In the process of economic development, the structure of Britain’s economy underwent a change (see Table 2). The weight of agriculture and industry (mining; manufacturing; electricity, gas and water supply) significantly lessened, whereas that of services considerably increased, which, among others, was related to the expansion of computing systems and software, management consultancy, advertising and market research. The transformation of the energy sector was connected with self-sufficiency achieved in terms of crude oil and natural gas and with the decline of coal mining. Within manufacturing, the fastest-developing sectors have been chemicals and electrical engineering. The growth in motor vehicle production has occurred among foreign-owned, especially Japanese, companies investing in the United Kingdom. The steel industry, after a period of restructuring following privatisation, substantially increased its productivity, output and exports during the 1990s. Textiles, clothing and footwear have been in decline because British companies have faced increasing difficulties competing with imports from Asia. Employment in agriculture has declined steadily in spite of the efforts to create alternative employment opportunities in rural areas.
The improvement of the economy’s innovation performance makes it imperative to raise the general skill level of the workforce. Effective policies can help the economy to absorb innovations, adapt work processes to take advantage of new technologies and so boost productivity.12 In all this, a prominent part is played by informatics, the emergence of information society. The latter’s level of development is characterised by the fact that in 2004 there were 628 Internet users per thousand people in the United Kingdom, 630 in the United States, 587
11 The ratio of public debt to gross domestic product (GDP) rose from 34.0 per cent in 1990 to 42.8 per cent in 2005, but even so it stayed well below the 60 per cent Maastricht threshold. Source: Eurostat (2006), p. 77.
12 OECD (2005), p. 8.

The Impact of the British model on economic growth
51
Tabl
e 2.
UK
val
ue a
dded
and
em
ploy
men
t by
econ
omic
act
ivity
(p
er c
ent,
natio
nal e
cono
my
= 10
0.0)
Year
Val
ue a
dded
(at c
urre
nt p
rice
s)*
Empl
oym
ent
Agr
i-cu
lture
A-B
Min
ing
C
Man
u-fa
ctur
ing
D
Elec
tric
ity,
gas a
ndw
ater
supp
lyE
Serv
ices
F-Q
Agr
i-cu
lture
A-B
Min
ing
C
Man
u-fa
ctur
ing
D
Elec
tric
ity,
gas a
ndw
ater
supp
lyE
Serv
ices
F-Q
1950
1955
1960
1965
1970
1975
1980
1985
1990
1995
2000
2004
5.5
4.5
3.8
3.2
2.9
2.8
2.3
2.1
1.9
1.8
1.0
1.0
4.8
4.7
4.0
3.0
2.0
2.3
7.0 7.9 2.7
2.5
2.9
2.1
33.8
35.4
35.0
33.4
32.2
30.0
27.1
25.0
23.0
21.6
17.9
14.1
2.0
2.3
2.6
3.1
3.1
3.1
3.3
2.8
2.3
2.4
1.9
1.6
53.9
53.1
54.6
57.3
59.8
61.8
60.3
62.2
70.1
71.7
76.3
81.2
6.6
5.8
5.1
3.9
3.3
2.8
2.7
2.6
2.1
2.0
1.5
1.3
3.6
3.5
3.0
2.4
1.6
1.4
1.7
1.3
0.9
0.4
0.4
0.3
39.3
40.6
38.3
37.6
37.9
33.9
30.7
25.0
22.2
18.9
17.1
13.5
1.8
1.8
1.8
1.9
1.8
1.6
1.6
1.4
1.2
0.9
0.7
0.6
48.7
48.3
51.8
54.2
55.4
60.3
63.3
69.7
73.6
77.8
80.3
84.3
* Gro
ss v
alue
add
ed in
clud
ing
Fina
ncia
l Int
erm
edia
tion
Serv
ices
Indi
rect
ly M
easu
red
(FIS
IM).
Sour
ces:
Nat
iona
l Acc
ount
s (O
ECD
, Par
is), Y
earb
ook
of L
abou
r Sta
tistic
s (IL
O, G
enev
a), v
ario
us v
olum
es; D
ye a
nd S
osim
i (20
06),
p. 1
10.

52
György Simon, Jr.
in Japan, 443 in the euro zone, while the world average was merely 139.13 Thus, it can be asserted that the British model has, in the given respect, facilitated the achievement of internationally advanced results.
Table 3. Percentage shares of the United Kingdom, European integration organisations, the United States and Japan in world trade
YearUnited
KingdomEC/EU EFTA United States Japan
exports imports exports imports exports imports exports imports exports imports
1950196019731981198619952005
11.1 9.0 5.3 5.3 5.2 4.9 3.6
12.310.4 6.8 5.2 5.9 5.3 4.6
-25.138.532.538.841.837.5
-23.539.233.236.639.136.9
-15.9 6.1 4.9 6.5 2.5 2.3
-18.5 8.2 5.4 6.4 2.2 1.7
18.016.612.712.411.111.8 8.9
16.213.013.013.817.915.316.5
1.4 3.2 6.7 7.910.3 9.0 5.8
1.63.66.87.26.06.74.9
Source: International Financial Statistics Yearbook (IMF, Washington, D.C.), various volumes.
In foreign trade, traditionally pivotal to the British economy, the joint share of exports and imports in GDP rose from 45.4 per cent in 1950 to 56.2 per cent in 2005.14 At the same time, under the conditions of a relatively rapid growth in world economy, the United Kingdom’s share in world trade contracted from 11.7 to 4.1 per cent, whereas the country’s share in EC/EU trade declined from 15.6 per cent at the time of accession in 1973 to 11 per cent in 2005 (Table 3).
Since the 1960s, Britain’s chief trading ties have shifted from its former empire to the European Union, which in 1960 was responsible for 28.2 per cent and in 2005 for 49.6 per cent of UK trade in tangible goods. At the same time, the relative weight of EFTA rose only slightly, from 3.1 to 5.0 per cent, and that of the United States from 11 to 11.9 per cent. The joint share of developed industrial countries increased from 59.5 per cent in 1960 to 82.4 per cent in 1990 and then declined to 71.9 per cent through 2005 (Table 4).
The Thatcher government identified the national interest and the general interest of capital with furthering of Britain’s integration into the world economy. In
13 World Bank (2006), pp. 303–304.14 Harper (2006), p. 15.

The Impact of the British model on economic growth
53
Tabl
e 4.
UK
fore
ign
trad
e by
are
a
Cou
ntry
/gro
upIn
per
cent
age
of e
xpor
tsIn
per
cent
age
of im
port
s19
6019
7319
7919
9019
9720
0519
6019
7319
7919
9019
9720
05
Uni
ted
Stat
es
Japa
nEu
rope
an U
nion
* EFT
AC
anad
aA
ustr
alia
New
Zea
land
Dev
elop
ed in
dust
rial
co
untr
ies,
tota
lC
ount
ries
of E
aste
rn
Euro
pe**
OPE
CO
ther
dev
elop
ing
coun
trie
s
9.7
0.8
28.4 3.3
5.9 7.1 3.3
58.5 2.1
2.5
36.9
12.5 2.3
42.2 4.9
3.4
3.4
1.4
70.1 3.4
6.6
19.9
9.9
1.5
50.6 5.1
1.9
2.1
0.8
71.9 2.9
9.0
16.2
12.5 2.5
57.8 3.6
1.8
1.6
0.4
80.2 1.0
5.4
13.4
12.1 2.4
55.9 3.3
1.2
1.4
0.2
76.5 1.3
5.5
16.7
15.1 1.9
51.4 3.7
1.6
1.2
0.2
75.1 3.8
4.7
16.4
12.3 0.9
28.0 2.9
8.1
4.3
3.9
60.4 3.0
4.0
32.6
10.4 2.8
43.9 5.6
4.7
2.2
1.8
71.4 2.7
9.5
16.4
10.4 3.2
52.6 6.9
2.7
1.0
0.9
77.7 2.5
6.8
13.0
11.4 5.4
57.8 6.9
1.8
0.8
0.4
84.5 1.0
2.4
12.1
13.2 4.9
54.5 5.2
1.3
0.7
0.3
80.1 3.0
1.8
15.1
8.7
3.3
47.8 6.3
1.6
0.8
0.2
68.7 5.1
2.2
24.0
Tota
l10
0.0
100.
010
0.0
100.
010
0.0
100.
010
0.0
100.
010
0.0
100.
010
0.0
100.
0* F
igur
es fo
r 14
mem
ber c
ount
ries
. **
Incl
udin
g th
e fo
rmer
Sov
iet U
nion
.So
urce
s: A
nnua
l Abs
trac
t of S
tatis
tics (
Her
Maj
esty
’s St
atio
nery
Offi
ce, L
ondo
n), v
ario
us v
olum
es; I
MF
(200
6), p
p. 3
86–3
88.

54
György Simon, Jr.
economic policy, the emphasis shifted from the development of manufacturing to the promotion of direct investment and international trade. Within the framework of integration policy, Britain, in 1990, joined the Exchange Rate Mechanism of the European Monetary System but, because of a speculative attack on the pound, left it in 1992. In 1993, the Major government had the Maastricht Treaty ratified with the exception of its monetary union and social policy chapters. Since then the situation has changed in such a way that in 1997 Britain became a full participant in the social policy chapter of the Maastricht Treaty but has not yet acceded to the monetary union.15
Table 5. UK foreign trade by commodity
Co-de
Commodity groupIn percentage of exports In percentage of imports
1960 1973 1990 2004 1960 1973 1990 2004
01234
56
7
85-89
Food and live animalsBeverages and tobaccoCrude materialsFuelsAnimal and vegetable oils and fatsChemicalsManufactures classified chiefly by materialMachinery and transport equipmentMiscellaneous manufacturesManufactured goods, totalOther commodities andtransactions
3.02.63.33.6
0.28.7
27.1
42.0
6.083.8
3.5
4.23.03.13.1
0.110.4
23.7
40.2
9.183.4
3.1
4.22.72.17.6
0.112.7
15.3
40.4
12.881.2
2.1
3.42.21.99.4
0.116.8
12.8
41.0
12.082.6
0.4
30.03.1
22.010.3
1.23.8
17.8
7.5
3.732.8
0.6
17.22.4
11.811.0
0.85.5
20.2
21.5
8.255.4
1.4
8.31.54.56.2
0.38.6
17.4
37.4
14.477.8
1.4
6.82.02.36.7
0.211.1
12.9
41.4
15.881.2
0.8
0-9 Total 100.0 100.0 100.0 100.0 100.0 100.0 100.0 100.0
Source: Annual Abstract of Statistics (Her Majesty’s Stationery Office, London), various volumes.
In the commodity structure of UK foreign trade, large-scale changes have occurred since the 1960s primarily in terms of imports: the share of agricultural produce, crude materials and fuels radically diminished, while that of manufactured
15 Dinan (2000), pp. 511–512; Gillingham (2003), pp. 161–169, 176–178.

The Impact of the British model on economic growth
55
goods, first of all machinery and transport equipment, augmented from just one-third in 1960 to more than four-fifths in 2004. All this was connected with a successful development of agriculture, oil and gas production, as well as with the intensifying world economic competition in the field of manufacturing. In exports, the share of manufactured goods has barely changed, corresponding to the more than 80 per cent level typical for developed countries (Table 5).
Table 6. Direct investment flows between 1961 and 2005.
Country/group1961–1978 1979–1996 1997–2005 1961–2005
In percentage of
world stock
(2005)In billion U.S. dollars capital
exports
capital
importsinflows outflows inflows outflows inflows outflows inflows outflows
UK
Euro zone*
EU-15
US
Japan
19.9
68.2
91.2
34.3
1.7
35.2
53.8
94.2
137.8
14.2
252.2
639.6
954.9
675.7
9.1
389.0
912.9
1404.1
650.0
320.4
667.3
2651.9
3542.1
1453.6
59.5
1013.7
3374.6
4631.6
1331.5
280.2
939.4
3359.7
4588.2
2163.6
70.3
1437.9
4341.3
6129.9
2119.3
614.8
11.6
36.4
51.1
19.2
3.6
8.1
31.0
41.7
16.0
1.0
* Figures for 12 member countries.Sources: Balance of Payments Statistics Yearbook (IMF, Washington, D.C.), various volumes; UNCTAD (2006), pp. 303–306.
An important characteristic of individual countries’ development nowadays is to what proportion they ensure the world’s high-technology exports. With respect to the United Kingdom, this indicator was 5.1 per cent in 2004, while Japan accounted for 9.8, the United States for 17 and the euro zone for 28.4 per cent. Considering the different population figures, these are, from a UK viewpoint, favourable values, referring to the efficiency of the British model. This conclusion is confirmed by the data according to which the share of high technology in total manufactured exports was 24 per cent in Britain, corresponding to Japan’s level, in contrast with the 20 per cent world average. The same indicator amounted to merely 16 per cent in the euro zone and only in the case of the United States was significantly higher, 32 per cent.16
16 World Bank (2006), pp. 307–308.

56
György Simon, Jr.
From the above, it seems possible to draw a conclusion that the British model has positively affected the country’s foreign trade, especially its qualitative characteristics.
An important feature of today’s globalising world economy is the increasing cross-country and cross-regional flows of direct investment. It is well perceptible from data in Table 6. We can see that, in comparison with the years preceding the Thatcher era (1961–1978), capital imports and exports expanded by leaps and bounds in the formative period of the British model, which is valid not only for the United Kingdom, but also for the other developed countries and regions of the world (euro zone, EU-15).
What was the role of capital imports and exports in Britain’s economic development? As ascertained from Table 6, in the period 1961–2005, direct investment outflows were more than one and a half times larger than the inflows. The cumulative net balance amounted to nearly $500 billion. Therefore, this factor may have rather decelerated than accelerated UK economic growth.17 As also seen from Table 6, whereas in the case of Britain, similarly to Japan, net capital exports dominated to the end, it took a turn for the United States. Until the oil price explosion of 1979, the US had been a net capital exporter. But thereafter it became a net capital importer, though not in a too large measure.
How was direct investment stock distributed by economic activity? As seen from Table 7, UK capital imports were earlier connected mainly with manufacturing and later with services, the weight of manufacturing having greatly decreased. The situation developed on the whole similarly for capital exports, too.
In 2004, Britain’s most important partners according to their share in the inward and outward direct investment stock were the United States (22.6 and 33.1%), the Netherlands (20.4 and 13.1%) and Luxembourg (12.3 and 1.8%). At the same time, the EU-15 together accounted for 45.4 per cent of UK capital imports and for 52.5 per cent of capital exports.18
In the developed countries, international capital flows are not only an additional source of investments but also a means of economic expansion, high-technology exports, pressing comparative advantages and, together with that, an efficiency
17 In 2005, the cumulative capital imports amounted to 37.1 and capital exports to 56.2 per cent of British GDP. Source: UNCTAD (2006), p. 308.
18 HMSO (2006), pp. 328, 331.

The Impact of the British model on economic growth
57
Tabl
e 7.
UK
inw
ard
and
outw
ard
dire
ct in
vest
men
t pos
ition
by
econ
omic
act
ivity
Cod
eSe
ctor
In p
erce
ntag
e of
cap
ital i
mpo
rts
In p
erce
ntag
e of
cap
ital e
xpor
ts19
8419
8719
9019
9520
0020
0319
8419
8719
9019
9520
0020
03
A-B C D E F-Q
Agr
icul
ture
Min
ing
Man
ufac
turi
ngEl
ectr
icity
, gas
an
dw
ater
supp
lySe
rvic
es
0.05
33.8
340
.79 -
25.3
3
0.23
27.0
135
.40 -
37.3
6
0.15
22.8
635
.91 -
41.0
8
0.05
21.8
431
.48
2.27
44.3
6
0.05
8.84
23.7
4
4.01
63.3
6
0.04
11.0
026
.65
2.55
59.7
6
0.86
32.4
631
.85 -
34.8
3
1.08
23.0
235
.98 -
39.9
2
0.73
18.3
839
.00 -
41.8
9
0.24
14.9
044
.78
0.30
39.7
8
0.04
9.39
26.7
0
2.58
61.2
9
0.02
11.4
525
.53
0.91
62.0
9
A-Q
Tota
l10
0.00
100.
0010
0.00
100.
0010
0.00
100.
0010
0.00
100.
0010
0.00
100.
0010
0.00
100.
00
Sour
ce: I
nter
natio
nal D
irec
t Inv
estm
ent S
tatis
tics Y
earb
ook
(OEC
D, P
aris)
, var
ious
vol
umes
.

58
György Simon, Jr.
factor.19 Investigating direct investment flows, it can be stated in summary that the British model has also ensured, in the given respect, conditions similar to other developed countries. However, that factor has not considerably affected Britain’s economic growth, unlike e.g. Ireland.
3. The growth mechanism and the British model
Economic policy affects the functioning of growth mechanism in many fundamental respects:
encourages or retards the mobilisation of economic resources, i.e. capital and 1. labour, the increase in their quantity and the improvement in their quality (e.g. education); creates such conditions that contribute or do not contribute to the optimal 2. allocation and efficient use (privatisation, nationalisation) of factors; shapes or influences the international conditions of economic growth 3. (integration and currency policies, etc.).
Mindful of all that, the efficiency of the British model in the given respect can be evaluated from the viewpoint, as already discussed above, whether it has accelerated economic growth, increased economic efficiency and employment.
Table 8. The dynamics of GDP, investment and exports in the UK and the world market oil price (average annual change in per cent)
Denomination 1951–2005 1951–1978 1979–1996 1997–2005GDP 2.5 2.6 2.1 2.8Investment 3.6 4.0 2.4 4.6Exports 4.3 4.3 4.1 4.5World-market oil price
5.8 7.6 1.7 8.8
Source: calculated from the Appendix. This also concerns the further tables.
In our days, it is mostly the investment- and export-led economic growth that is considered as efficient and, accordingly, the economic policy encouraging a more rapid growth of investment and exports than of gross domestic product
19 Erdős (2006), p. 18.

The Impact of the British model on economic growth
59
(GDP).20 This is, however, a not sufficiently comprehensive and adequate criterion to our mind. Data on the British economy show (see Table 8)21 that economic development in all the three periods met the requirement at issue. At the same time, we have already seen that the results differed a lot.
Models of mathematical economics, namely production functions, open the door to an approximate mapping of the functioning of growth mechanism and, as a result, to the investigation of the role of fundamental factors determining economic growth. Here we are searching for an answer to the question whether the different efficacy of diverse economic policies can be demonstrated with the help of such models. Let us see from this viewpoint the neoclassical model widely used today.22 In this model, the elasticity of output by time (λ), the so-called total factor productivity (TFP), is the indicator expressing the effect of technical progress on economic growth and productivity. From its change, with certain reservations, conclusions can be drawn about the impact of economic policy, in our case the British model, on economic growth. The reservations are primarily connected with the fact that in the model, human capital is not taken into consideration; therefore, the deviations of TFP may derive, not for a little part, from the differences, changes in magnitude of human capital. How did total factor productivity change in Britain’s economy (Table 9)?
Table 9. Total factor productivity in UK economy (per cent)
Denomination 1951–2005 1951–1978 1979–1996 1997–2005National economy 1.3 1.3 1.1 1.6Manufacturing 1.9 1.5 2.2 2.5
20 Ibid., p. 26.21 In the table, the dynamics of world-market oil price is also shown with one-year lag. This
indicator will be needed in the next part of the paper.22 The standard neoclassical model (Solow 1956) can be written down in the following form:
Y = AoKαL1-αeλ∆t, where Y is output, Ao is a multiplier of efficiency, K is fixed capital, L is
labour and t is time. For variables, for the sake of simplicity, the t index was not written out. ∆t is the number of years (t-to) elapsed from some initial moment (to), α, 1-α and λ are the elasticity of output by fixed capital, labour and time, respectively. The model assumes that, in a situation of equilibrium, the parameter α corresponds to the profit share, including the share of amortisation in the GDP, which regarding the developed countries is usually taken as 1/3. We proceeded that way in the course of our investigation, too.

60
György Simon, Jr.
In manufacturing, the value of TFP was mostly much higher than in the total national economy. This is not a British peculiarity, experience shows that the situation is similar in other countries. The cause is the role of human capital, first of all the activity of scientists and engineers engaged in research and development (R&D), which is today relatively most intensive in certain fields of manufacturing, namely in engineering and chemicals.
It is presumably in part the increasing weight of human capital with which the tendential growth of the value of TFP in the British economy is connected. The latter, however, is not a general phenomenon: in several developed countries, e.g. Japan and Germany, just the opposite tendency can be observed.23 Therefore, in this respect, the positive impact of the British model can be assumed. At the same time, it is apparent that TFP in the Thatcherite period grew only in manufacturing, though to a relatively large extent, while at the level of national economy it somewhat diminished. A favourable change in both fields occurred in the period of Blairite economic policy.
On the basis of the outlined, it is obvious that a more accurate result can be obtained with a growth model considering the role of human capital, namely education and R&D, too. This has been attempted by the endogenous growth models.24 The solution is made difficult by the fact that human capital, first of all education, is not to a little extent a factor of complementary character, its effect is interwoven with physical capital. Here we are to utilise an endogenous model 25 reckoning with the effect of both education and R&D, as well as learning by doing; and being, at the same time, similarly to the neoclassical model, homogeneous of degree one. It also enables us to compare efficiency and productivity, respectively, to the international level, to the results that would be ensured by some factor combination in the case of world-level efficiency, since the parameters of the model were determined on the basis of a worldwide investigation using data on 131 countries, so in such a sense, a world model is at issue.
The general form of the model is: Y = gM exp[FK (GI +GM + GHR)], where Y is the volume of output, namely GDP and value added, respectively, in dollars, at purchasing power parity (PPP), M is the number of working years, the parameter g is the output per working year produced without fixed capital,26 FK is the capital
23 See e.g. Simon and Simon (2005); Simon, Jr. (2006).24 See e.g. Romer (1986, 1994); Lucas (1988); Mankiw et al. (1992); Barro and Sala-i-Martin
(2004). For a critical evaluation of endogenous models, see Solow (1994); Jones (1995). 25 See Simon (2005). 26 363 dollars at 1985 price level. We converted the economic indicators at 1995 prices (see

The Impact of the British model on economic growth
61
intensity function, approximately the natural logarithm of K/L ratio, K is fixed capital, L is the number of employed, GI, GM, GHR are functions determining the elasticity of output by capital intensity, mapping the combined effect of physical and human capital, the mechanism of technical progress. For the investigation, we used the parameters of the world model, applying the following version of the function in a logarithmic form.27
Δ lnY = Δ ln M +Δ FK (GI + GM) + Δ FK GHR + Δε (1)
Putting the data on UK economy (see the Appendix) in relation (1), ∆ε characterises the deviations from the world level. The results of investigation for the national economy are contained in Table 10. and for manufacturing in Table 11.
Table 10. Factors of UK economic growth
Indicator1951–2005 1951–1978 1979–1996 1997–2005
annual average
per cent
annual average
per cent
annual average
per cent
annual average
per cent
Δln Y 0.02448 100.0 0.02582 100.0 0.02073 100.0 0.02781 100.0
Δln M 0.00388 15.3 0.00331 12.8 0.00293 14.1 0.00755 27.1
ΔFK(GI+GM) 0.01823 74.5 0.02109 81.7 0.02172 104.8 0.01361 48.9
ΔFKGHR 0.00212 8.7 0.00249 9.6 0.00177 8.5 0.00172 6.2
Δε 0.00025 1.0 -0.00107 -4.1 -0.00569 -27.4 0.00493 17.8
the Appendix) to the 1985 price level on the basis of US data, using the following indices (1995/1985): 1.321 for GDP, 1.188 for manufacturing value added, and 1.31 for fixed capital.
27 See the functions of the endogenous model in the Appendix. For a detailed exposition of the model, see Simon (2005).
62
György Simon, Jr.
Table 11. Factors of productivity growth in UK manufacturing
Indicator
1951–2005 1951–1978 1979–1996 1997–2005
annual average
per cent
annual average
per cent
annual average
per cent
annual average
per cent
Δln (YM /M) 0.03070 100.0 0.02653 100.0 0.03414 100.0 0.03691 100.0
ΔFK(GI+GM) 0.02521 82.1 0.02774 104.6 0.02139 62.7 0.02525 68.4
Δ FKGHR 0.00773 25.2 0.00526 19.8 0.00795 23.3 0.01467 39.7
Δε -0.00224 -7.3 -0.00648 -24.4 0.00480 14.0 -0.00301 -8.1
What conclusions can be drawn from the empirical results obtained with the endogenous model? The most important statements can be made considering the deviations from the world level (∆ε).
Regarding the entire investigated period, the efficiency of British economy at 1. the macro level was slightly higher and in manufacturing somewhat lower than the international one. The results of the period before 1979 were in both fields more unfavourable 2. than the world level, particularly in manufacturing. The Thatcherite period brought a substantial improvement in the case 3. of manufacturing; while national economic efficiency was significantly worsening. In the Blairite period, the situation turned round: the macroeconomic efficiency 4. exceeded the international level, whereas in manufacturing it became to a certain extent lower than the latter.
The role of human capital, namely the combined effect of education and R&D (ΔFKGHR), was especially significant in manufacturing. Here, regarding the whole period, it ensured approximately one-fourth of productivity growth. At the same time, in the partial periods, its weight was tendentially increasing and, in the Blairite period, has already resulted in nearly two-fifths of rise in productivity. In the endogenous model, one more important factor connected with human capital is explicitly taken into consideration, namely the effect of learning by doing (in the function GI), which on applying relation (1), does not appear separately in the empirical results. Its role in the British economy was also considerable. The changes in the rate of economic growth have already been discussed. As seen
The Impact of the British model on economic growth
63
from the data above, the increase in manufacturing productivity was most rapid in the Blairite period, too, exceeding not only its average, but also the results of both preceding periods.
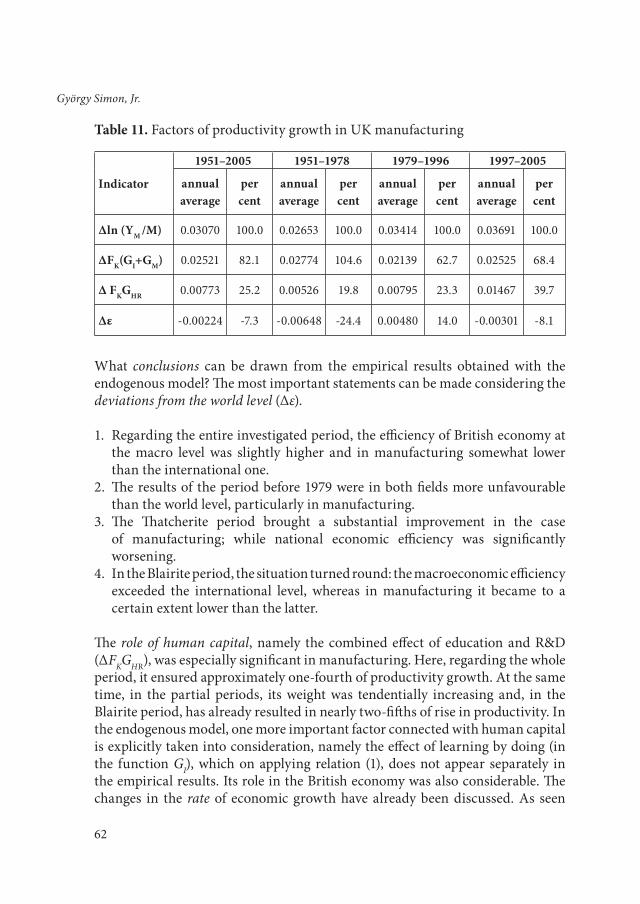
Table 12. Dynamics of growth factors in the UK economy (average annual change, per cent)
Factor 1951–2005 1951–1978 1979–1996 1997–2005L, M 0.39 0.33 0.29 0.76K 2.70 3.12 2.35 1.95H/L 0.49 0.33 0.64 0.71Rt-2 3.11 4.33 1.81 1.93
To what extent did Britain’s economic policy facilitate the mobilisation of economic resources? For this question, we can draw conclusions from the dynamics of growth factors (Table 12). A general regularity, valid in the investigated period for the UK economy, too, is that fixed capital grows more rapidly than the number of employed; thus, capital intensity, K/L, becomes higher. A fundamental condition of rising capital intensity is the R&D activity and the more developed technology created by this means simultaneously necessitating the employment of a more qualified workforce.
As seen from Table 12, regarding the mobilisation of workforce resources, the Blairite period was the most successful. Also in that period, education increased relatively most rapidly; as well as, in relation to the previous period, the number of scientists and engineers engaged in R&D. On the other hand, the growth of fixed capital, unlike investment, is of a slightly decelerating tendency, mainly because technical progress necessitates a quickening replacement of capital, which makes use of an increasing part of investment. Overall, it seems probable that, in terms of the mobilisation of economic resources, it was the economic policy of the third period that proved relatively best.
4. The role of international economic conditions and economic policy
In today’s globalising world economy, economic growth is, not to a little extent, affected by international economic conditions. This effect in respect of individual countries prevails in different ways and degrees, as a function of the country’s endowments (e.g. whether it possesses significant oil and natural gas resources)

64
György Simon, Jr.
and economic policy. Our investigation led to the result that Britain’s economic growth was significantly affected by world-market oil price formation. At the same time, the exchange rate, namely that of the national currency against the dollar, according to the regression analysis, did not prove a significant factor, unlike e.g. Japan and Germany, which presumably is chiefly connected with the fact that UK foreign trade takes place for the most part with the help of not the dollar but the pound sterling.
The world-market energy prices, notably the rising crude oil and associated natural gas prices, today significantly affect the terms of trade, deteriorate the situation of oil- and gas-importing countries, rearrange the internal price conditions, alter, mostly unfavourably, the profitability of enterprises and, in connection with all that, retard economic growth. In the case of the British economy, possessing significant oil and natural gas resources, the change in the terms of trade was not considerable, whereas the rearrangement of price conditions substantially influenced growth, especially in manufacturing.
Mindful of the outlined, we have examined how great the role of world-market oil prices and other factors in the UK economy was in the trends of GDP, investment and manufacturing value added (MVA) in the period 1950–2005. We set out from the fact that the change rate of GDP, investment and MVA, respectively, equals the rate that would have been achieved had the world-market oil prices not changed in relation to the base year, namely to 1950 (nT),28 as well as the modifications caused by oil price changes and other factors. For GDP as a dependent variable, relation (2) was used. An analogous model was applied with respect to investment and MVA.
ln(Yt /Yt0) = nT Δt + no ln Pot + Σ t noΣ ln Pot + ε (2)
In the model, Yt is the volume of GDP in the reference year, Yto is that in the base year, nT, no, noΣ are the parameters of the model, Δt = t-to, Pot is the world-market oil price index (1950 = 1),29 ln is the sign of natural logarithm and ε is a logarithmic residual. The parameter estimation was made by the ordinary least squares (OLS) method on the basis of annual data for the period 1950–2005 (55 observations). The results of regression analysis are contained in Table 13.
28 Such a growth rate is called the equilibrium one. A conditional equilibrium is at issue which, depending on conditions, may imply different growth rates by country.
29 As referred to earlier, we reckon with one-year lag in connection with the world-market oil price.

The Impact of the British model on economic growth
65
Table 13. Main characteristics of the GDP, investment and MVA model in the UK economy*
Denomination nT no noΣ R2
GDP 0.0272(5.72)
-0.0276(-3.54)
-0.00118(-3.35)
0.996
Investment 0.0520(5.70)
-0.1423(-4.82)
-0.00758(-5.00)
0.986
MVA 0.0304(5.70)
-0.0850(-4.87)
-0.00744(-5.45)
0.979
* In parentheses are the t statistics.
What conclusions can be drawn from the investigation?
The accuracy of estimation is very favourable: the determination (1. R2) in the case of GDP is more than 99 per cent and, in terms of the two other indicators, it is also above 95 per cent. The parameters are significant.The 2. deviations from equilibrium growth are connected negatively with world-market oil price formation. It is the price change in the preceding year that is effective to a relatively largest extent, but a substantial role is played by the cumulative effect of oil prices, too. In the British economy, the world-market oil prices have retarded more the 3. growth of investment and MVA than that of GDP.
Using relation (2), one can examine more closely how the world-market oil prices affected Britain’s economic growth and how great the role of other factors was. The results of investigation are contained in Table 14.
Table 14. The role of world-market oil price and other factors in deviations from the equilibrium growth rate in the United Kingdom (equilibrium growth rate = 100)*
Indicator Denomination 1951– 2005 1951–1978 1979-1996 1997–2005
GDP
Fact 90.0 94.9 76.2 91.2Deviation fromequilibrium -10.0 -5.1 -23.8 -8.8World-market oil price -12.0 -8.9 -13.8 -18.1Other factors 2.0 3.8 -10.0 9.3

66
György Simon, Jr.
Investment
Fact 67.2 75.2 45.2 85.9Deviation fromequilibrium
-32.8 -24.8 -54.8 -14.1
World-market oil price
-36.6 -25.2 -44.6 -56.4
Other factors 3.8 0.4 10.2 42.3
MVA
Fact 48.6 77.4 23.3 9.6Deviation fromequilibrium -51.4 -22.6 -76.7 -90.4World-market oil price -51.3 -29.1 -70.3 -82.6Other factors -0.1 6.5 -6.4 -7.8
* Calculated from the logarithmic values.
It can be ascertained that, regarding the entire investigated period, the growth rate of GDP lagged 10, that of investment more than 30, that of MVA more than 50 per cent behind the level that could have been reached in the case of a constant world-market oil price. The role of other factors was not significant. For the individual partial periods, a more refined picture was obtained. What does it mean at a closer look?
As seen from the empirical results, in several periods, a significant role was played by the other factors behind which mostly economic policy effects can be supposed. In the Blairite period, a positive effect is observable for the GDP and still more for investment. In the Thatcherite period, there was a positive deviation in the case of investment, whereas the rate of economic growth was reduced by the effect of other factors. On the basis of empirical results, it is also likely that economic policy did not manage to substantially influence the growth rate of manufacturing in a positive direction after 1979.
Overall, it can be stated that international economic conditions also significantly affected Britain’s economy, but the negative effects were partly counterbalanced by the British model, particularly its Blairite version.
5. Conclusions
What main conclusions can be drawn from the investigation about the impact of the British model on economic development? To my mind, the most important

The Impact of the British model on economic growth
67
conclusion is that there is a substantial difference in successfulness between the first, Thatcherite and the second, Blairite version of the model.
All the three methods of investigation, namely the statistical, economic-mathematical and econometric analyses, support the conclusion that the Blairite version of the British model is more efficient than the Thatcherite one, which has been expressed, among others, by the fact that economic growth speeded up, the equilibrium indicators of UK economy improved and unemployment was substantially reduced.
A successful employment policy and the government’s social sensitivity can be pointed out as the most important peculiarities that ensured the success of the “third way” in Britain. It is very remarkable that such a policy does not lead to a breakdown of general government equilibrium but is capable of simultaneously reducing unemployment, speeding up economic growth and curtailing the budget deficit.
Appendix
UK main macroeconomic and manufacturing indicators and the world-market oil price index
Indicator 1950 1978 1996 2005Y 396 816 1185 1522
YM 103 199 226 232K 1243 2974 4514 5369
KM 195 488 567 576I 43.8 131 200 299L 22.76 24.97 26.32 28.17
LM 8.94 8.22 5.05 3.72H/L 7.45 8.17 9.16 9.76Rt-2 32.2 105.5 145.8 173.2
RM t-2 24.6 76.8 104.0 123.5Z 7.43 7.01 6.15 5.78
Ot-1 10 2069 2263 1546PO 1 7.80 10.63 22.63PCP 0.056 0.335 1.025 1.288U 314 1321 2340 1352E 41.9 134.6 278.8 415.3

68
György Simon, Jr.
Sources: Annual Abstract of Statistics; Capital Stock, Capital Consumption and Non-financial Balance Sheets (HMSO, London); National Accounts Statistics; Statistical Yearbook; International Trade Statistics Yearbook; Energy Statistics Yearbook (UN, New York); National Accounts; Labour Force Statistics; Flows and Stocks of Fixed Capital; Economic Outlook (OECD, Paris); Yearbook of Labour Statistics (ILO, Geneva); UNESCO Statistical Yearbook Paris; FAO Production Yearbook. Rome; International Financial Statistics Yearbook (IMF, Washington, D.C.), various volumes; Barro and Lee (2000); New Cronos Eurostat database.
Legend to the table
Y = GDP at purchasing power parity (PPP), in dollars of 1995 (USD billion); YM = manufacturing value added (MVA) at PPP, in dollars of 1995 (USD billion);K = average annual gross fixed capital (with dwellings) at PPP, in dollars of 1995 (USD billion);KM = average annual manufacturing gross fixed capital (with dwellings) at PPP, in dollars of 1995 (USD billion); I = investment (gross fixed capital formation) at PPP, in dollars of 1995 (USD billion);L = average annual number of employed (millions);LM = average annual number of employed in manufacturing (millions);H /L = number of schooling years per capita (for population aged 15 and over);Rt-2 = number of scientists and engineers engaged in R&D (considering a two-year lag, thousands);RM t-2 = number of manufacturing scientists and engineers engaged in R&D (considering a two-year lag, thousands);Z = arable land (million hectares); Ot-1 = oil and natural gas resources (at the end of the year preceding the reference year, in million tonnes of oil equivalent);PO = world-market oil price index considering a two-year lag (1950 = 1);PCP = personal consumption price index (1995 = 1);U = number of unemployed (thousands);E = exports (of goods and services) in dollars of 1995 (USD billion).
Rates of conversion to 1995 dollar (conversion to PPP was made on the basis of New Cronos Eurostat database):
United Kingdom: Y, E = 0.624 pounds sterling/ dollar, K, I = 0.621 pounds sterling / dollar, YM = 0.620 pounds sterling / dollar.

The Impact of the British model on economic growth
69
Functions of the endogenous model
GI = 1-exp{- FK [gI FK exp(gL Δt exp(-FK/5)) + gZ FZ ]};
GM = gM FK2 exp[-FK /2 – gMZ FZ + gO FO exp(- FH
3 /3)];
GHR = gHR (FH FR )
2 exp( – FK /3).
∆ t = t – 1950, where 1950 is the base year. The estimated values of the parameters are as follows: gI
= 0.0033, gL = 0.028, gZ = 0.0372, gM = 0.317, gMZ = 0.43, gO = 0.16, gHR = 0.00883.
The meaning of variables of the intensity functions (see below) has already been given above, nK, nH, nR, nZ and nO are normalising coefficients, ln is the sign of natural logarithm. The values of variables mostly refer to the year t; the time index, for the sake of simplicity, is put out only in the case of retarded effects.
FK = ln[(L+nKK)/L] (capital intensity function);
FH = ln [(L+ nH H)/L] (education function);
FR = ln [(L+ nR Rt-2)/L] (research intensity function);
FZ = ln [(L+ nZ Z)/L] (arable land intensity function);
FO = ln [(L+ nO Ot-1)/L (mineral resource intensity function).
Normalising coefficients: nK = 1/0.250 (in dollars of 1985); nH = 1; nR = 1000, nZ = 1; nO = 1/200.
For the economic justification of the model and the method of parameter estimation, see Simon (2005). Among the countries drawn into the investigation, the United Kingdom figured together with 130 other countries, therefore it did not influence considerably the obtained parameter values.
Arday L. (1993), “A ‘létező thatcherizmus’ sikerei és kudarcai”, In: Arday L. and Németh Gy. (eds.), Margaret Thatcher: Nagy-Britannia átalakulása az 1980-as években, Batthyány Alapítvány, Budapest, pp. 7–13.
REFERENCES

70
György Simon, Jr.
Barro, R. J. and Lee, J. W. (2000), International Data on Educational Attainment: Updates and Implications, CID Working Paper 42, Center for International Development at Harvard University, Cambridge, Massachusetts. Appendix Data Tables, Internet: www.cid.harvard.edu/ciddata/ciddata.html
Barro, R. J. and Sala-i-Martin, X. (2004), Economic Growth, MIT Press, Cambridge, Massachusetts.
Bean, Ch. R. and Crafts, N. (1995), British Economic Growth since 1945: Relative Economic Decline…and Renaissance?, CEPR Discussion Paper 1092, Centre for Economic Policy Research, London.
Booth, A. (2001), The British Economy in the Twentieth Century, Palgrave Macmillan, Houndmills, Basingstoke, Hampshire and New York.
Card, D. and Freeman, R. B. (2002), What Have Two Decades of British Economic Reform Delivered?, NBER Working Paper 8801, National Bureau of Economic Research, Cambridge, Massachusetts.
Crafts, N. and Mills, T. C. (2005), “TFP Growth in British and German Manufacturing, 1950–1996”, The Economic Journal, Vol. 115, No. 505, pp. 649–670.
Dinan, D. (ed.) (2000), Encyclopedia of the European Union, Macmillan Press, London.
Dye, J. and Sosimi, J. (eds.) (2006), United Kingdom National Accounts. The Blue Book 2006, Office for National Statistics, Her Majesty’s Stationery Office, London.
Erdős T. (2006), Növekedési potenciál és gazdaságpolitika, Akadémiai Kiadó, Budapest.
Eurostat (2006), EC economic data pocket book, 2/2006. Luxembourg.
Gillingham, J. (2003), European Integration, 1950–2003: Superstate or New Market Economy?, Cambridge University Press, New York.
Handa, J. (2005), Monetary Economics, Routledge, London and New York.
Harper, D. (ed.) (2006), Economic Trends. Annual Supplement No. 32, Office for National Statistics, Her Majesty’s Stationery Office, London.
Havas, P. (2003), “The Renewal of Social Democracy and the “Third Way” of the British Labour Party”, International Problems, Vol. 55, No. 2, pp. 237–260.
HMSO (2006), Annual Abstract of Statistics, Her Majesty’s Stationery Office, London.
IMF (2006), Direction of Trade Statistics. Quarterly, Washington, D.C. (September).

The Impact of the British model on economic growth
71
Jones, Ch. I. (1995), “R&D-Based Models of Economic Growth”, Journal of Political Economy, Vol. 103, No. 4, pp. 759–784.
Lucas, R. E., Jr. (1988), “On the Mechanics of Economic Development”, Journal of Monetary Economics, Vol. 22, No. 1, pp. 3–42.
Mankiw, N. G., Romer, D. and Weil, D. N. (1992), “A Contribution to the Empirics of Economic Growth”, Quarterly Journal of Economics, Vol. 107, No. 2, pp. 407–437.
Marján A. (ed.) (2005), Az Európai Unió gazdasága. Minden, amit az EU gazdasági és pénzügyi politikáiról tudni kell, HVG Kiadói Rt., Budapest.
Middleton, R. (2000), The British Economy since 1945: Engaging with the Debate, Macmillan Press, Basingstoke – St. Martin’s Press, New York.
Mitchell, B. R. (1988), British Historical Statistics, Cambridge University Press, Cambridge.
OECD (2005), Economic Surveys: United Kingdom, Vol. 20 (November), Supplement No. 2. Paris.
Romer, P. M. (1986), “Increasing Returns and Long-Run Growth”, Journal of Political Economy, Vol. 94, No. 5, pp. 1002–1037.
Romer, P. M. (1994), “The Origins of Endogenous Growth”, Journal of Economic Perspectives, Vol. 8, No. 1, pp. 3–22.
Rosser, J. B., Jr. and Rosser, M. V. (2004), Comparative Economics in a Transforming World Economy, MIT Press, Cambridge, Massachusetts.
Simon Gy. (2005), “Növekedéselmélet – világmodell – gazdaságfejlesztési stratégia”, Külgazdaság, Vol. 49, No. 3, pp. 31–51.
Simon Gy., Jr. (2006), “A gazdasági növekedés problémái Németországban I–II”, Statisztikai Szemle, Vol. 84, No. 1, pp. 6–24 and Vol. 84, No. 2, pp. 130–149.
Simon Gy. and Simon Gy., Jr. (2005), “The Japanese Economic Enigma”, International Problems, Vol. 57, No. 4, pp. 449–483.
Solow, R. M. (1956), “A Contribution to the Theory of Economic Growth”, Quarterly Journal of Economics, Vol. 70, No. 1, pp. 65–94.
Solow, R. M. (1994), “Perspectives on Growth Theory”, Journal of Economic Perspectives, Vol. 8, No. 1, pp. 45–54.

72
György Simon, Jr.
Spencer, P. D. (1984), “The Effect of Oil Discoveries on the British Economy – Theoretical Ambiguities and the Consistent Expectations Simulation Approach”, The Economic Journal, Vol. 94, No. 375, pp. 633–644.
UNCTAD (2006), World Investment Report, United Nations, New York and Geneva.
Veress J. (ed.) (1997), Bevezetés a gazdaságpolitikába, Aula Kiadó, Budapest.
World Bank (2006), World Development Indicators, Washington, D.C.