Embed Size (px)
Citation preview

The Impact of Sea Level Rise on an Urban Flood Control System
October 10, 2014
Robert Miskewitz, Ph.D. and Sean Walsh

• Sea level in the NY/NJ
metropolitan region (including the Hackensack Meadowlands) has risen 0.23-0.38 cm/year, or a total of 25 cm over the last 100 years (Yin et al., 2009 and Gornitz et al., 2002).
• Sea levels are predicted to rise by
18–60 cm by the 2050s, and 24–108 cm by the 2080s over late 20th century levels (Gornitz et al., 2002).
East Riser Tide Gate
Gornitz, V., S. Couch and E.K. Hartig, 2002: Impacts of sea-level rise in the New York City metropolitan area. Global Planet Change, 32, 61-88.
Yin et al. Model projections of rapid sea-level rise on the northeast coast of the United States. Nature Geoscience, March 15, 2009; DOI: 10.1038/ngeo462
This work was recently published in: Journal of Environmental Science and Health, Part A Hazardous Materials and Environmental Engineering. Vol.48(4)
East Riser Tide Gate
Teterboro Airport
Hackensack River

• Hackensack Meadowlands is 34 km2 of wetlands with an average elevation, 0.30 meters above the high water mark .
• 17 Tide Gates located throughout the Meadowlands to protect upland areas during high tide. • Hub for rail (Amtrak and NJ Transit), air transportation (Teterboro Airport) and trucking
(NJ Turnpike) facilities (NJMC, 2004). • Population of 450,000 and a workforce of 80,000 (NJMC, 2004). • $10 million in flood plain management projects from 2003 to 2010 (NJMC, 2011).
Meadowlands Flooding Issues
EVIN R. WEXLER/STAFF PHOTOGRAPHER, NorthJersey.com New Jersey Meadowlands Commission. NJMC Master Plan. Rep. Lyndhurst, NJ: NJMC, 2004. Print. New Jersey Meadowlands Commissions. NJMC Installs New Tide Gates to Manage Flooding in Carlstadt. NJMC. 16 June 2010. Web. 21 May 2011.
<http://njmc.wordpress.com/2010/06/16/tidegates/>.

Study Site: • East Riser Tide Gate located in Moonachie, NJ. • Constructed in 1981 to prevent upland flooding at
trucking depots, industrial sites and Teterboro Airport.
• Total drainage area is 25 hectares. • Average elevation >2 meters above sea level.
• Tide gates function as one way valve controlled by hydraulic head across structure.
• Upstream > downstream = gates open.
• Upstream < downstream = gates close.
• Flow through gate is function of hydraulic head gradient and orifice size.
Downstream Upstream
Sean Walsh 2009

Determining the Impact of Sea Level Rise Hypothesis: Increased sea level will reduce the ability of tide gates to prevent upland flooding by impacting drainage through the gate. Experimental Design: • Develop model of drainage area including tide gate. • Calibrate model using field measurements. • Simulate drainage using NJ Design Storms for sea level rise
scenarios.

Watershed Model Rainfall – Runoff simulated with Hydrologic Engineering Center Hydrologic Modeling System (HEC-HMS) from US Army Corps of Engineers. • Watershed divided into 3 contributing
subbasins as delineated by drainage points using ArcHydro.
• Characteristics for each sub basin determined using digital landuse, soils, and survey layers.
• Boundary condition was rainfall measurements collected at Teterboro Airport.
• Runoff hydrograph created for each subbasin and that runoff is routed into select nodes of HEC RAS model.
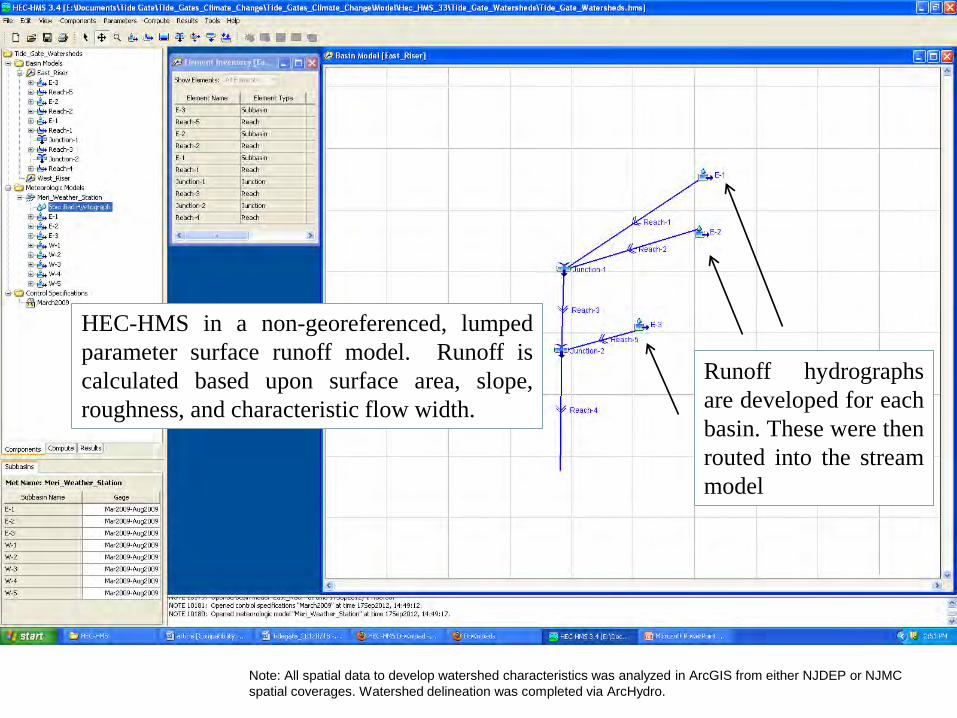
Note: All spatial data to develop watershed characteristics was analyzed in ArcGIS from either NJDEP or NJMC spatial coverages. Watershed delineation was completed via ArcHydro.
HEC-HMS in a non-georeferenced, lumped parameter surface runoff model. Runoff is calculated based upon surface area, slope, roughness, and characteristic flow width.
Runoff hydrographs are developed for each basin. These were then routed into the stream model

Rainfall and predicted runoff from subbasin E-3 0
0.5
1
1.5
2
2.50
10
20
30
40
50
60
3/8/2009 0:00 4/27/2009 0:00 6/16/2009 0:00 8/5/2009 0:00 9/24/2009 0:00
Prec
ipita
tion
(in/h
r)
Run
off (
cfs)
Predicted Runoff (cfs)Precipitation (mm)
The model responds quickly to each rainfall event, then drops to zero flow. This pattern is expected for an urbanized highly impervious area.

River Flow simulated with Hydrologic Engineering Center River Analysis System (HEC-RAS) from the US Army Corps of Engineers.
Note: All spatial data to develop river channel characteristics was analyzed in ArcGIS from either NJDEP or NJMC spatial coverages. Cross section morphology was determined via 2-foot Lidar survey contours furnished by NJMC.
Indicates location at which runoff hydrographs were routed into the model

Watershed-1 Watershed-2 Watershed-3
Reach Length (m) 792 294 312
# of Cross Sections 24 5 4
Manning’s n Value (ROB,
LOB and Center)
0.045 0.045 0.045
Sea Level Rise Study HEC-RAS is a one-dimensional river flow model with the capability to predict water level through a flow network. Model predictions were calculated via solution of the one-dimensional continuity and momentum equations.
In-line structure can be included in the model domain. A flap gate was used with proscribed opening and closing conditions. Opening condition is greater than 7.62 cm water gradient upstream to downstream, closing condition is less than 7.62 cm water gradient.

-5
-4
-3
-2
-1
0
1
2
3
4
5
Wat
er E
leva
tion
(ft N
AVD
88)
Downstream
Gate
Gate opens
Rainstorm
Slope of water level while gate is closed is directly associated
with the amount of water coming downstream
Water elevation measurements on either side of the tide gate

Location of tidal boundary
condition
In-line tide structure was built into the HEC-RAS model to the specifications outline in plans furnished by NJMC. The tide gate is built into a dyke that runs along the east side of Berry’s Creek and it facilitates drainage. The gate consists of four steel flap gates hinged at the top which are designed to open with 7.62 cm of head on the upstream side.

Sea Level Rise Study

Field Measurements
• Water level upstream and downstream of tide gate collected every ten minutes.
• Rainfall data collected at the NOAA weather station at Teterboro Airport
• Data collection began March 3, 2009 and continued for 6 month period

Measured water level time series
-5
-4
-3
-2
-1
0
1
2
3
4
5
3/28/2009 0:00 4/7/2009 0:00 4/17/2009 0:00 4/27/2009 0:00 5/7/2009 0:00 5/17/2009 0:00 5/27/2009 0:00 6/6/2009 0:00
Wat
er E
leva
tion
(ft N
AVD
88)
DownstreamUpstream
No surface runoff
Surface runoff resulting in elevated upstream water level elevation

Water level Prediction Calibration W
ater
Sur
face
Ele
vatio
n (ft
NAV
D88
)
Low Tide Predicted Accurately
High Tide not predicted as accurately
Entire Record
Peak Elevations
Nash-Sutcliffe Coefficient
0.83 0.67
Standard Error (cm)
0.12 0.7
Sea Level Test Cases
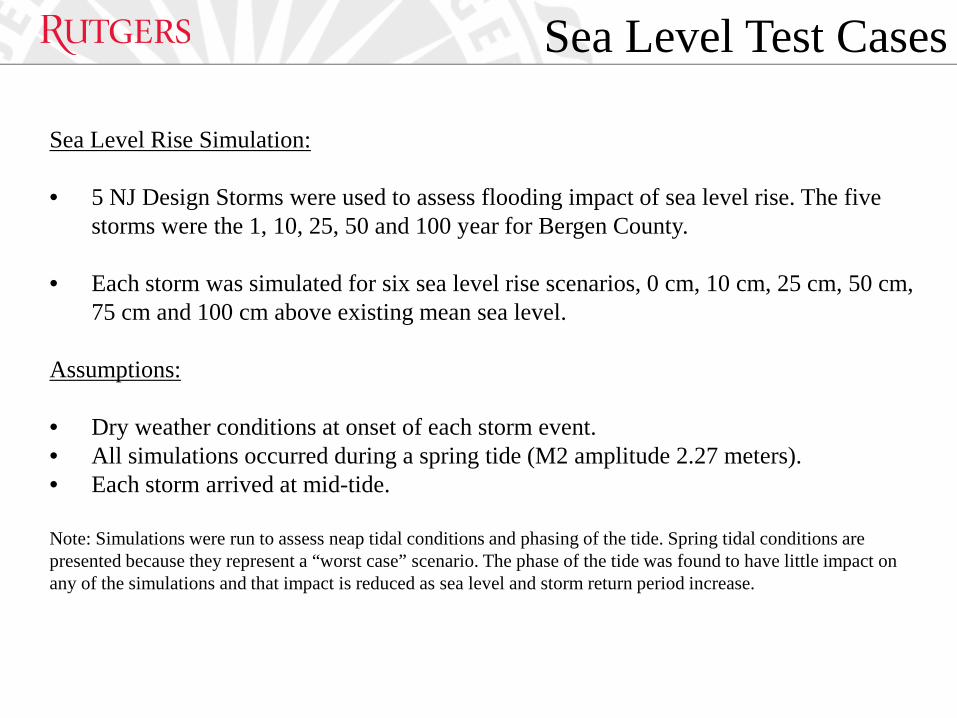
Sea Level Rise Simulation: • 5 NJ Design Storms were used to assess flooding impact of sea level rise. The five
storms were the 1, 10, 25, 50 and 100 year for Bergen County.
• Each storm was simulated for six sea level rise scenarios, 0 cm, 10 cm, 25 cm, 50 cm, 75 cm and 100 cm above existing mean sea level.
Assumptions: • Dry weather conditions at onset of each storm event. • All simulations occurred during a spring tide (M2 amplitude 2.27 meters). • Each storm arrived at mid-tide. Note: Simulations were run to assess neap tidal conditions and phasing of the tide. Spring tidal conditions are presented because they represent a “worst case” scenario. The phase of the tide was found to have little impact on any of the simulations and that impact is reduced as sea level and storm return period increase.
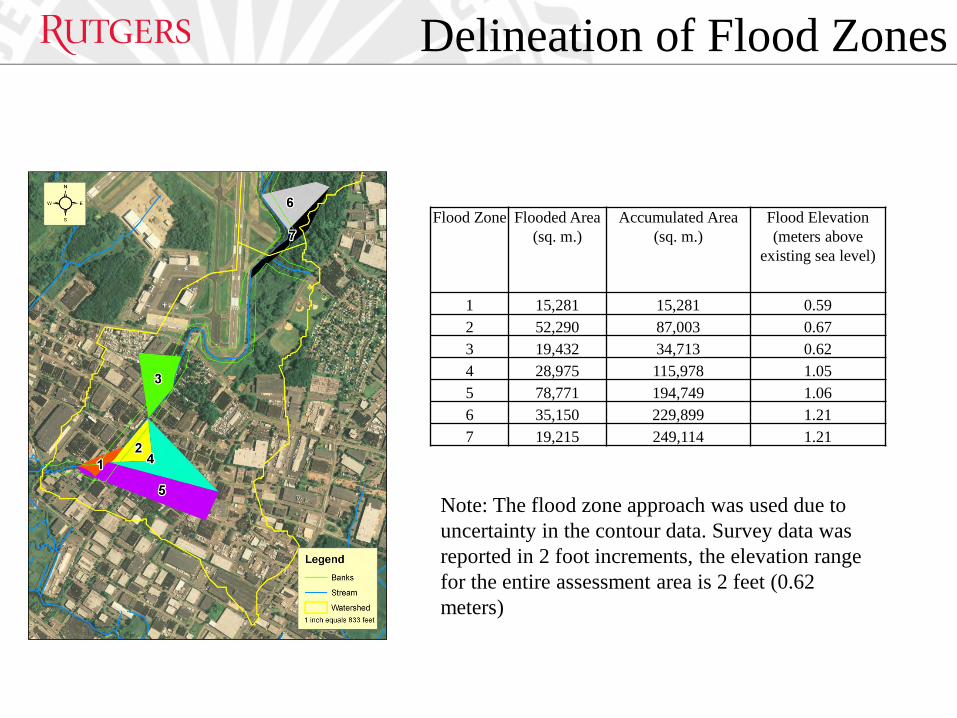
Delineation of Flood Zones
Flood Zone Flooded Area (sq. m.)
Accumulated Area (sq. m.)
Flood Elevation (meters above
existing sea level)
1 15,281 15,281 0.59 2 52,290 87,003 0.67 3 19,432 34,713 0.62 4 28,975 115,978 1.05 5 78,771 194,749 1.06 6 35,150 229,899 1.21 7 19,215 249,114 1.21
Note: The flood zone approach was used due to uncertainty in the contour data. Survey data was reported in 2 foot increments, the elevation range for the entire assessment area is 2 feet (0.62 meters)
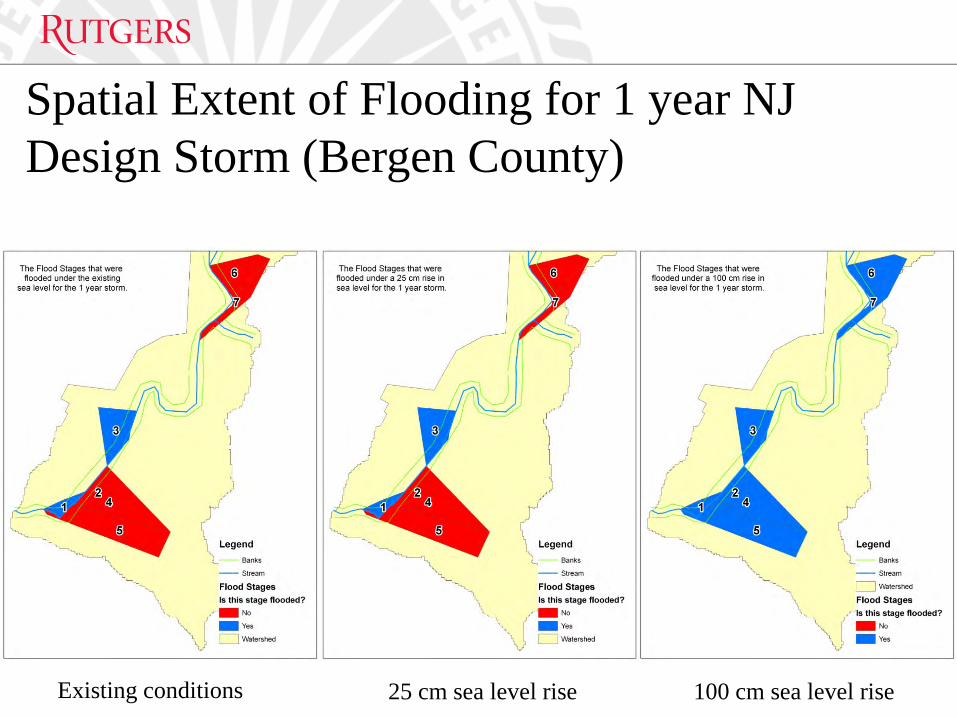
Spatial Extent of Flooding for 1 year NJ Design Storm (Bergen County)
Existing conditions 100 cm sea level rise 25 cm sea level rise

Maximum Flood Depth Calculated for Each Flooding Scenario
Scenario 1 Year Storm 10 Year Storm 25 Year Storm 50 Year Storm 100 Year Storm
Maximum Depth of Flooding (meters)
Maximum Depth of Flooding (meters)
Maximum Depth of Flooding (meters)
Maximum Depth of Flooding (meters)
Maximum Depth of Flooding (meters)
Existing 0.91 1.13 1.23 1.24 1.27 10 cm 0.94 1.17 1.26 1.29 1.32 25 cm 0.98 1.22 1.29 1.34 1.38 50 cm 1.01 1.24 1.34 1.40 1.45 75 cm 1.08 1.30 1.45 1.55 1.64 100 cm 1.32 1.47 1.60 1.67 1.73 Note: Depth is measured from existing mean sea level
There is a critical point that exists between the 75 cm and 100 cm for small storms (<50 year return period) and 50 cm and 100 cm for larger storms where the flooding depth increases sharply.

Flood Duration Calculated for Each Flood Scenario
At 106 cm Sea Level Rise Flood will be permanent condition. This is within the estimate of 24 cm to 108 cm for 2080 (Gornitz et al., 2002)

Potential Solutions to Flooding
• Alteration of gate size and function will have no impact upon the duration
or depth of flooding. o Since the stream is relatively narrow near the gate the upstream
friction controls the flow more than the size of the gate opening.
• Alteration of drainage area. o Reduced friction in the stream to simulate straightening or paving
drainage channels (unrealistic). It had some effect, but it was minor. o Source control appears to be realistic, but where do you infiltrate
water to in filled marshland where groundwater is ~ 0.6 m or less below grade?
• Active pumping (Exists in nearby Losen Slote tide gate).
Conclusions
• Backwater effects due to sea level rise will impact the function of
tide gates as flood protection infrastructure.
• Flooding will increase steadily as the sea level increases until it reaches a critical point when the tide gate will cease to protect the upland areas.
• This study only investigated the impact of mean sea level rise, the impact of storm surge was not investigated, though it is anticipated that a surge associated with a slow moving storm could produce a temporary condition that would lead to flooding as a result of the backwater effects on a tide gate.