Embed Size (px)
Citation preview

THE IMPACT OF REGIONALISM ON TRADE IN EUROPE *
Kari E.O. Alho
ETLA, The Research Institute of the Finnish Economy
Lönnrotinkatu 4 B, 00120 Helsinki, Finland
E-mail: [email protected]
Abstract. Using the classical gravity model we try to reach a more systematic viewthan previously in the literature of the impact of regionalism on the intensity of mu-tual integration through trade in Europe. We find that European trade is significantlyinfluenced by various regional agreements and intensities of trade are strongly asym-metric between the regions. EMU has a positive impact on bilateral trade intensity,and its effect on total European trade of its member countries is also significantlypositive. Both between the EU and CEE countries there are, respectively, significantdifferences with respect to the intensity in this trade.
Key words. Trade, EU, EMU, CEE, gravity model
JEL code. F10, F15
* This is a part of the project Integration, Location and Growth within the NorthernDimension, carried out jointly by ETLA and Turku School of Economics and fi-nanced by the Academy of Finland. I thank Professor Markku Rahiala of Oulu Uni-versity for hints and comments related to the statistical problems in the paper, Profes-sor Mika Widgrén of Turku School of Economics and participants in the Finnish-Estonian EU Enlargement workshop in Tallinn in November 2002 for comments, andArja Räihä at ETLA for data gathering. The usual disclaimer applies.

1
1. Introduction
Europe is covered by a range of regional economic agreements, which have an impact
on trade barriers and mutual integration through trade. There is the EU internal mar-
ket, EMU with a single currency, the EEA (European Economic Area) establishing
free trade relations between the EU and EFTA countries, and the Europe Agreements
covering EU-CEE economic relations. There are also countries outside these agree-
ments, of which Russia is the biggest.1 The basic characteristic of these agreements is
that the EU is in the centre of this regionalism while other countries form the periph-
ery. In other words, there is a hub-and-spoke system of trade agreements, an apt term
introduced by Baldwin (1994). The situation is as depicted by Figure 1.
The aim of this paper is to analyse in a systematic way the impact of these various
regional economic agreements in Europe on the intensity of trade between the Euro-
pean countries. To that end, we use data on mutual trade flows in 1999, the first year
of EMU. The fact that EMU is a subset of the EU has to be taken into account in the
interpretation of the results of the estimations, but it does not change the basic for-
mulation of the model, where we separate both the EU and EMU into two individual
regions.
There has recently been an intense debate on the effects of a currency union on trade,
following the spectacular result by Rose (2000) that a currency union expands, ceteris
paribus, bilateral trade by as much as 235 per cent. This was challenged by Persson
(2001), who, through a careful and extensive analysis of this ‘treatment’ effect, con-
1 There are also a number of smaller regional trade agreements by non-EU countries in Europe. SeeSapir (2001a) for a complete listing of them.
2
cluded that the impact of a currency union on mutual trade is much lower, varying
between 15 and 65 per cent. This estimate, however, is not statistically significantly
different from zero. Rose (2001) responded again, sticking to his original estimate.
Flandreau and Maurel (2001) extended the analysis by providing an explanation be-
hind the large impact of a monetary union on trade. Rose and van Wincoop (2001)
applied the estimate of the impact of a currency union on bilateral trade in their ex-
amination of the impact of potential currency unions, using the concept of aggregate
trade resistance (generalised barrier) suggested by Anderson and van Wincoop
(2001). For EMU 11, Rose and van Wincoop (2001) found that the currency union
increases trade within the region by 58 per cent.
Here we employ a standard gravity model to consider the same question. Our results
with respect to EMU are similar to those of Rose and van Wincoop (2001): the trade
intensity prevailing within the Euro Area is some 50 per cent higher than that pre-
vailing within the EU single market, and this difference is statistically significant. A
more relevant issue, however, from a policy point of view, may be the effect of a cur-
rency union on total, not just bilateral, trade of its member countries, as there may be
both trade creation and trade diversion connected to a currency union. Examining this
wider context, then, we find that EMU has a positive impact on total trade in the re-
gion. To obtain more empirical evidence on this, we also estimate the model using
data from 1995. In this pre-EMU situation the intensity of mutual trade between the
EMU countries was also higher than that in the internal market, which suggests a
smaller impact of EMU on mutual trade than that revealed by the 1999 data as such.

3
The gravity model has become the standard workhorse in empirical trade analysis.
Here our aim is to utilise it in a more systematic way than has been the case in the
past to determine the impact of European regionalism on trade. Earlier similar analy-
ses on trade in connection with European integration have been carried out by, e.g.,
Baldwin (1994) and Sapir (2001b). In contrast to the models used in the earlier lit-
erature, our model allows for asymmetry in trade intensities and respective trade bar-
riers between the regions, i.e., they may be different in exports and imports between
the regions. Empirically, we also find that this asymmetry is a very essential factor
characterising European trade.
Figure 1. The main regional blocs and bilateral trade flows in Europe since EMU
EMUEU
CEE
EFTAEA
RUS
4
The paper is organised as follows. In Section 2 we outline the basic gravity model and
present estimation results for a model without the regional dummy matrices repre-
senting the regional agreements. In that section, we also report the estimation results
of the full model, and discuss the regional impacts and the results of statistical tests on
them. In Section 3 we extend the basic model to take into account the eastern en-
largement of the EU to include the CEE countries, and disaggregate trade between the
EU and the CEECs into country-wise impacts, from the point of view of either the EU
or the CEE countries. We again test for asymmetry and find significant differences in
the intensities of this trade by country. Section 4 concludes.
2. The basic model and its extension to include regional impacts
As already mentioned, we distinguish the following regional economic agreements in
Europe: the EU with its internal market, EMU with a single currency, Europe Agree-
ments between the EU and the CEE countries, the free trade agreement between the
EFTA countries and the EU, and the Partnership and Cooperation Agreement between
Russia and the EU. So, we have altogether five trading areas covering 27 European
countries and 20 bi-regional trading relations, for exports and imports, between these
countries belonging to the above five regional economic agreements. In addition, we
have internal, within-bloc impacts for four trading blocs (excluding, of course, Rus-
sia). We define the concept of trade intensity as the ratio of exports from region i to
region j to the average trade intensity within the internal market of the EU, controlling
for the impact of differences in other factors explaining trade between i and j, on the
one hand, and the average situation within the EU single market, on the other. So, we

5
estimate a total of 23 pairwise regional intensities relative to that prevailing within the
EU internal market. This means that an essential element in the paper is that we allow
for asymmetry in trade barriers in exports from region i to j and in exports from j to i,
and test for their existence.
The basic model is the following gravity equation, which allows a role for both stan-
dard explanatory variables and regional dummies for all the regional agreements in
Europe:
log(Xij) = C + β1logYj + β2logYi + β3logDISTij + β4logAj + β5logAi +(1)
β6logPOPj + β7logPOPi + β7BORij + β8ISLj + β9ISLi + ),(5
1,
jiDmk
kmkm∑=
β ,
where Xij is the value of exports from country i to j, and the subscript i denotes the
exporting country and j the importing country. The explanatory variables used are
GDP at current prices of the exporting and importing countries, denoted by Yi and Yj,
the distance between the regions, DIST, measured by the road distance between the
capitals of the respective countries, the area of the region, denoted by Ai and Aj, the
size of population, POPi and POPj, the dummy variable BOR denoting whether the
countries i and j have a common border (unity) or not (zero), and the dummy ISL de-
noting whether the country is an island or not. The rest of the model consists of the
above mentioned regional integration indicators, i.e., Dkm(i,j) denotes the regional
dummy variables for exports from country group k to country group m, and is unity if
the exporting country i belongs to region k and the importing country j belongs to re-
gion m, and zero otherwise. All variables except the dummies are expressed in loga-
rithms.

6
We estimate the model for a single year, 1999, the first year after the advent of EMU.
All the estimations were carried out using SUR. First, let us look at the estimation re-
sults of the basic gravity model (1) without regional impacts, which are presented in
Table 1.
Table 1. Regression results of the basic gravity model without regional integration indicators
Variable Coefficient t-value
Constant -6.511 -19.459
Yj 0.762 44.6235
Yi 0.914 47.702
DISTij -1.204 -67.604
Aj -0.010 -0.762
Ai 0.144 6.628
POPj 0.086 3.147
POPi -0.116 -3.458
BORij 0.431 17.222
ISLj -0.038 -0.840
ISLi 0.164 2.687
RC2
0.868
* All explanatory variables are in logs, except the border and island variables, which are 0-1dummy variables.

7
The estimation results are quite straightforward, with almost all of the coefficients
being statistically highly significant and of the plausible sign, as is the normal case in
empirical work using gravity models. The gravity model explains a much higher share
of the total variation in European trade than it does that of global trade. Here the R-
square is over 85 per cent while in the annual estimations for global trade by Rose
(2000) it was around two thirds.
Let us now turn to the estimation of the full model with regional dummies. The F-
statistic expressing their importance as a group in the model receives the value 46.87,
and is highly significant, the probability being much less than 0.1 per cent. So we get
our first plausible result:
Outcome 1. The various regional economic agreements in Europe, as a whole, have a
significant impact on European trade.
Let us then turn to study the coefficients of the individual regional integration dum-
mies. Their interpretation is straightforward; the partial impact of variable Dkm with
an estimated coefficient of bkm, as a per cent deviation from the intensity prevailing in
the EU single market, is equal to )1(100 −kmbe . Determining the impact of EMU re-
quires elaboration. The total effect of EMU on trade consists of its direct effect and
the indirect effect related to the simultaneous EU membership. So, we have,
bEMU,m(total) = bEMU,m + bEU,m and (2)
bm,EMU(total) = bm,EMU + bm,EU,

8
for m = CEE, EFTA and Russia. The standard error of the total coefficient has to be
calculated separately using this definition of the combined effect.2
For purposes of illustration, we present the impacts of regional agreements in Europe
in graphical form; see Figure 2. In each of the figures below, the title refers to the ex-
porting region, while the respective importing regions are denoted on the horizontal
axis.
2 This was estimated with the aid of the Wald test on a constraint imposed on the sum of the two coef-ficients. If W is the value of the χ2 -statistic that the total effect b(tot) of EMU is zero, we can solve forthe standard error s of the total estimate b(tot) from the definition of W, which gives s2
= (btot)2/W.

9
Figure 2. The effects of regional economic agreements on exportsfrom the title region to the respective destination regions,percentage deviations from the intensity prevailing on averagein the EU internal market *
EU
-30.9
-63.4
-28.3
-68.1
6.4 10.0 5.612.5
-80
-60
-40
-20
0
20
EMU CEE EFTA RUSImpact
St. error
EMU
52.4
19.0
57.8
29.0
64.4
7.1 7.3 7.9 7.913.5
0
20
40
60
80
EMU EU CEE EFTA RUS
Impact
St. error

10
EMU, total effect
-42.2
-7.6
-47.6
9.0 7.812.1
-60
-40
-20
0
20
40
CEE EFTA RUSImpact
St. error
CEE
-16.1
13.5
-4.8 -4.5
-35.1
26.0
11.54.1
11.7 11.7 11.7 15.4
-60
-40
-20
0
20
40
EU EMU EMU,total
CEE EFTA RUS
Impact
St. error
EFTA
-27.8
-8.8
-34.2
-73.9 -67.3-84.0
10.9 8.5 11.4 12.3 16.7 19.5
-100
-80
-60
-40
-20
0
20
40
EU EMU EMU,total
CEE EFTA RUS
Impact
St. error

11
RUS
76.027.8
124.9
590.9
102.3
18.8 11.9 19.6 19.8 20.8
0
100
200
300
400
500
600
700
EU EMU EMU, total CEE EFTA
Impact
St. error
* The standard errors are the original ones multiplied by one hundred.
It is noteworthy that the EU experiences a drawback, which can be characterised as
trade diversion, in all of its trade in Europe, except in imports from Russia, as all the
respective intensities are below that within the EU single market. In contrast, the
EMU has a higher trade intensity with all regions than that prevailing within the sin-
gle market on average. The trade creating effect of EMU is clear, because the inten-
sity is as much as 50 per cent higher among the EMU member countries than within
the single market.
The effect of EMU on the total trade of its member countries is estimated by calcu-
lating the weighted sum of the above impact coefficients, using the respective export
and import shares of the EMU countries as weights. The effect on total trade of the
EMU countries, again as compared to the average intensity prevailing within the EU
countries, is somewhat smaller than the bilateral impact, and is 44.7 per cent (t-

12
statistic for this weighted coefficient is 9.44) in total exports and 29.0 per cent (t-
statistic is 6.61) in total imports.3 4 So, we have
Outcome 2. The total impact of EMU is positive on the bilateral and total European
trade of its member countries, but smaller than its impact on mutual trade.
We shed some more light on this issue after commenting on the rest of the impact co-
efficients in Figure 2.
In terms of their exports, the CEE countries are in a slightly negative, or roughly neu-
tral position, not differing statistically very much from zero, but the EFTA countries
are clearly on the negative side throughout. The biggest positive intensity is in exports
from Russia to the CEE countries. This can be explained by the fact that Russia ex-
ports a lot of its oil via the Baltic countries and that it also has at least something left
of its old trading relations with the Eastern European countries. It may also be so that
the definition of the distance variable for a large country, like Russia, is problematic.
Table 2 shows the results of tests for symmetry of the bilateral trade intensities,
caused in part by trade barriers. As can be seen, in the majority of the cases the hy-
pothesis of symmetry is clearly rejected. Also the joint test of equality of all the pair-
wise trade barriers is rejected by a wide margin. So we reach the outcome,
Outcome 3. The trade intensities in Europe are not symmetric.
3 For calculation of the relevant standard error, see Footnote 2 above.

13
Table 2. Testing for symmetry of the trade intensities
Trade barriers between
regions (1) and (2)χ2-test on the equality ofthe intensities
EU / EMU 43.64***
EU / CEE 41.27***
EU/EFTA 0.00
EU/RUS 59.14***
EMU/CEE 13.39***
EMU/EFTA 9.04**
EMU/RUS 1.99
CEE/EFTA 34.81***
CEE/RUS 80.10***
EFTA/RUS 80.19***
All intensities symmetric,
F-test
19.24***
** p < 0.01, *** p < 0.001
Let us still return to the effect of EMU. It would not be correct to identify the above
result of forming the currency union as its impact on trade, as it may also be an indi-
cation that countries that trade intensively with each other are also more prone to form
a currency union and find it as a project with a small risk of asymmetric shocks. If the
selection of the EMU countries in the union’s initial stage in 1999 also depended on
4 Frankel and Rose (2002), in their global trade analysis, also reached the result that belonging to a

14
the magnitude of their mutual trade, we would have a case of sample selection bias in
our estimation. It may, however, be too far-reaching to make such a claim, as this de-
cision is likely to have been settled more on political, non-economic grounds. If this is
the case, then we should not worry about inconsistency of the above estimates. In or-
der to shed more light on this issue, we also estimated the model with data from 1995,
before EMU. The EMU dummy now receives a coefficient which is clearly lower
than that estimated with the 1999 data, although remains positive; see Figure 3. Ac-
cordingly, the EMU countries had earlier, for some reason, an already high intensity
of mutual trade, which dampens the impact of creation of EMU on trade as such.
Comparing the regression results using 1995 data to those using 1999 data suggests
then that the marginal impact of EMU on mutual trade is at most of the order of 20
per cent.
As above, we also calculated the impact of belonging to the EMU region on the
total trade of its future member countries in 1995. Now, this effect is 20.5 per cent
in EMU exports (the t-statistic being 4.7) and 13 per cent in imports (t-statistic
3.5). So, again, the total impact is smaller than that on mutual trade, but in both
total imports and exports the trade intensity between EMU countries has risen
markedly during the period from 1995 to 1999.
currency union points toward trade creation rather than trade diversion.

15
Figure 3. The bilateral trade intensity between the EMU countries in 1995 and 1999, in relation to the average intensity prevailing in the EU internal market, per cent
0
10
20
30
40
50
60
1995 1999
%
Impact
St.dev
3. EU-CEE trade relations
The coming accession of the CEE candidate countries to the EU, being at the moment
the most paramount project of the Union, has aroused a lot of interest also within the
research community as to the effects of enlargement. Above we have, i.a., estimated
the bloc-wise impacts between the EU and CEE as two regional units. To get a more
detailed view of the structure of trade between them, we can split these relations fur-
ther in two ways into country-wise effects so that we look at them from either the EU-
15 countries’ (a) or the CEECs’ (b) point of view, as illustrated in Figure 4.

16
Figure 4. Disaggregation of EU-CEE into trade by individual countries
The basic model was, accordingly, enlarged to include additional dummy matrices
Dkm in equation (1) to allow for estimation of the country-wise intensities present in
Figure 4. The results of these estimations are shown in Figures 5 and 6 (the exact im-
pacts and their standard errors are reported in the Appendix). These figures report the
level of intensity, in per cent, of EU-CEE trade in relation to the average intensity
prevailing in the EU inner market. Again, these intensities are corrected for the influ-
ence of differences in other factors between the CEECs and the EU-15 countries, such
as income levels and distances to the EU single market.
EU CEE
(a)
EU CEE
(b)
Trade by EU countries with the CEE region
Trade by CEE countries with the EU region with

17
Figure 5. EU-CEE trade intensities in 1999 from the point of view of the EU-15 countries, in relation to that prevailing within EU single market, per cent
0
20
40
60
80
100
120
FRABEL
NLD ITA UK
IRL
GRCPRT
AUTESP
SWE
DNKGER FIN
EU country
% Export
Import

18
Figure 6. EU-CEE trade intensities in 1999 from the point of view of the CEE countries, in relation to that prevailing within EU single market, per cent
0
20
40
60
80
100
120
EST LVA LTU POL HUN CZE SVK SVN BGR ROU
CEE country
%
Export
Import
All the intensities are, as expected, clearly below that prevailing within the EU single
market, with a few exceptions. Among the EU countries, Finland in exports and Ger-
many in imports are at the EU level of intensity, while from the CEE countries, Hun-
gary has integrated most intensively with the EU both in exports and imports. Let us
then test formally for the equality of the intensities in Figures 5 and 6; see Table 3.
19
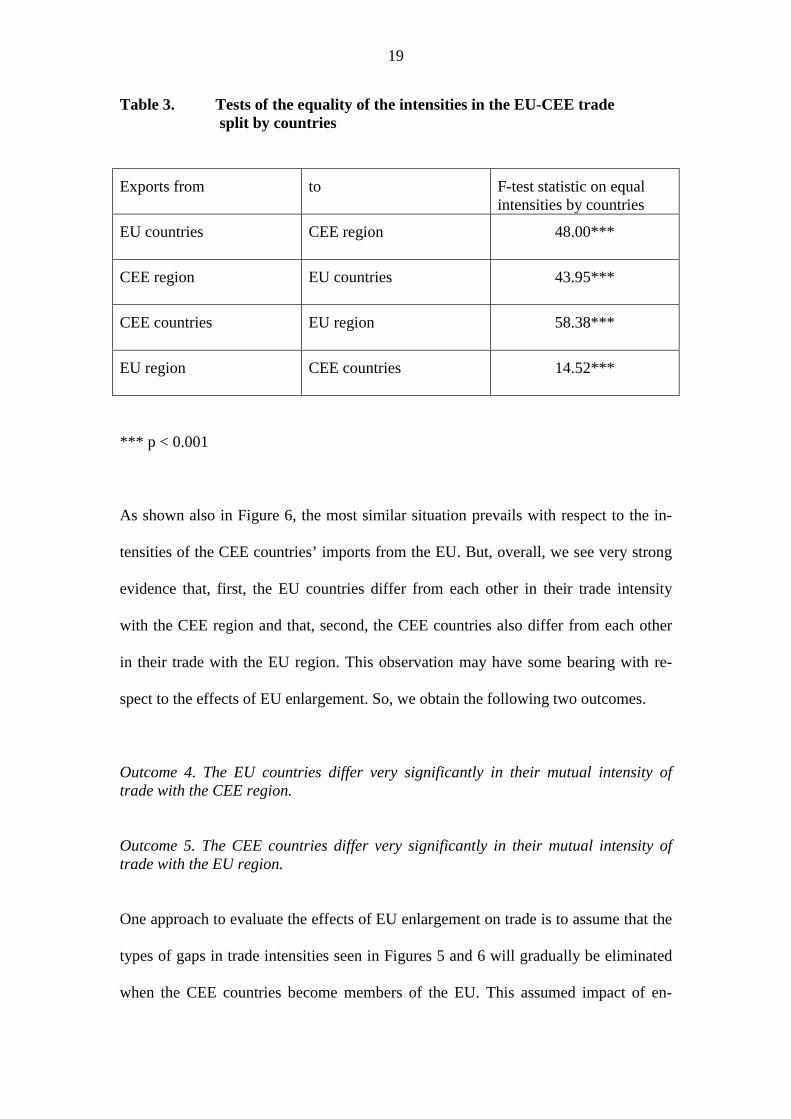
Table 3. Tests of the equality of the intensities in the EU-CEE trade split by countries
Exports from to F-test statistic on equalintensities by countries
EU countries CEE region 48.00***
CEE region EU countries 43.95***
CEE countries EU region 58.38***
EU region CEE countries 14.52***
*** p < 0.001
As shown also in Figure 6, the most similar situation prevails with respect to the in-
tensities of the CEE countries’ imports from the EU. But, overall, we see very strong
evidence that, first, the EU countries differ from each other in their trade intensity
with the CEE region and that, second, the CEE countries also differ from each other
in their trade with the EU region. This observation may have some bearing with re-
spect to the effects of EU enlargement. So, we obtain the following two outcomes.
Outcome 4. The EU countries differ very significantly in their mutual intensity oftrade with the CEE region.
Outcome 5. The CEE countries differ very significantly in their mutual intensity oftrade with the EU region.
One approach to evaluate the effects of EU enlargement on trade is to assume that the
types of gaps in trade intensities seen in Figures 5 and 6 will gradually be eliminated
when the CEE countries become members of the EU. This assumed impact of en-

20
largement can then be fed as an input into a CGE model, as done by Lejour et al.
(2001), where they also disaggregated total trade by industry, or into a global econ-
omy macro model as in the Alho et al. (2001) study on enlargement.
4. Conclusions
In this paper we have presented a systematic evaluation of the various regional eco-
nomic agreements on trade in Europe. Disaggregation of this kind appears to reveal
significant differences in trade intensities, both within and between, the regions in
Europe. The intensities are also asymmetric between countries in a region, as the dia-
saggregation of trade between the EU and the applicant CEE countries showed. This
leads to the conclusion that there still is room and need for further European integra-
tion to produce an equal standing in trade between the participating countries.

21
Appendix. Estimates of the EU-CEE trade intensities and their standard errors in relation to that in the EU internal market, 1999, per cent *
Exportsfrom i to j
Intensity St. error Exportsfrom i to j
Intensity St. error
FRACEE 51.5 9.3 CEEFRA 52.4 12.8
BELCEE 105.8 9.2 CEEBEL 74.7 15.7
NLDCEE 70.0 8.9 CEENLD 87.2 17.1
ITACEE 95.3 9.2 CEEITA 91.7 13.5
UKCEE 37.6 9.4 CEEUK 51.9 16.0
IRLCEE 68.9 9.0 CEEIRL 30.1 17.3
GRCCEE 27.0 10.8 CEEGRC 30.3 20.0
PRTCEE 22.1 9.6 CEEPRT 36.9 18.1
AUTCEE 44.9 8.8 CEEAUT 34.9 14.2
ESPCEE 58.0 9.2 CEEESP 56.8 15.1
SWECEE 75.9 9.1 CEESWE 59.2 12.4
DNKCEE 48.3 10.8 CEEDNK 38.1 14.5
GERCEE 77.2 9.7 CEEGER 110.5 11.8
FINCEE 100.6 8.8 CEEFIN 30.2 12.9
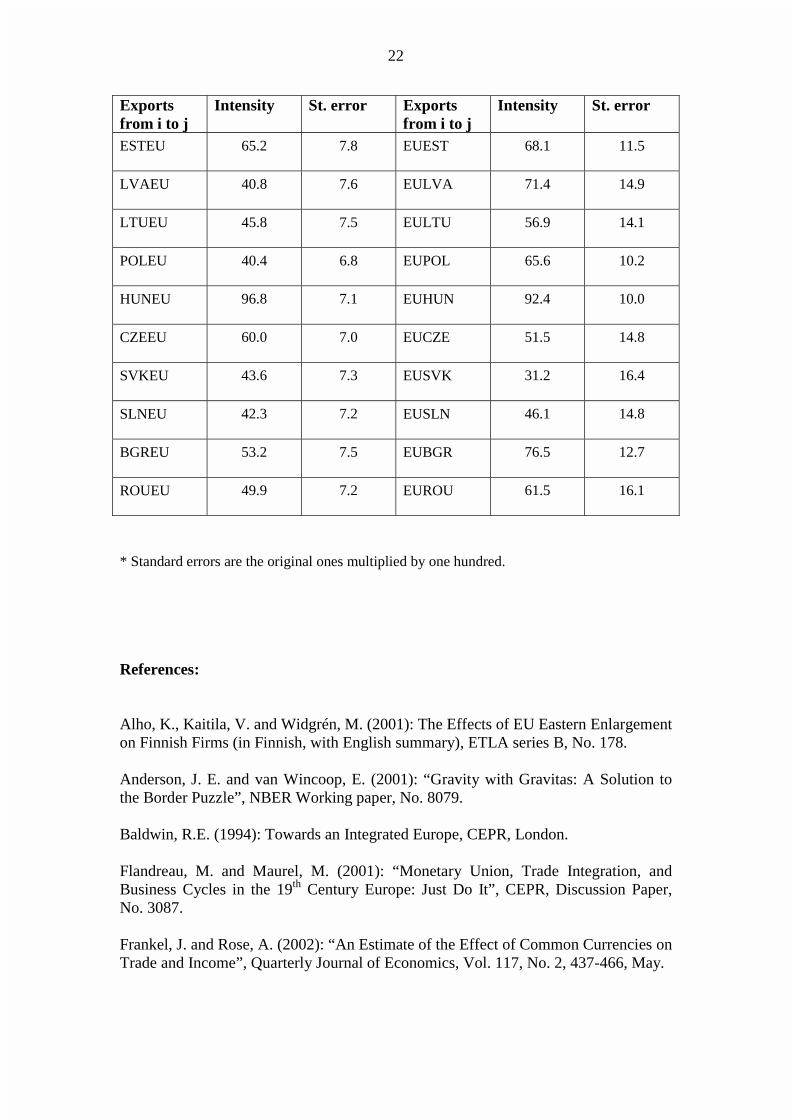
22
Exportsfrom i to j
Intensity St. error Exportsfrom i to j
Intensity St. error
ESTEU 65.2 7.8 EUEST 68.1 11.5
LVAEU 40.8 7.6 EULVA 71.4 14.9
LTUEU 45.8 7.5 EULTU 56.9 14.1
POLEU 40.4 6.8 EUPOL 65.6 10.2
HUNEU 96.8 7.1 EUHUN 92.4 10.0
CZEEU 60.0 7.0 EUCZE 51.5 14.8
SVKEU 43.6 7.3 EUSVK 31.2 16.4
SLNEU 42.3 7.2 EUSLN 46.1 14.8
BGREU 53.2 7.5 EUBGR 76.5 12.7
ROUEU 49.9 7.2 EUROU 61.5 16.1
* Standard errors are the original ones multiplied by one hundred.
References:
Alho, K., Kaitila, V. and Widgrén, M. (2001): The Effects of EU Eastern Enlargementon Finnish Firms (in Finnish, with English summary), ETLA series B, No. 178.
Anderson, J. E. and van Wincoop, E. (2001): “Gravity with Gravitas: A Solution tothe Border Puzzle”, NBER Working paper, No. 8079.
Baldwin, R.E. (1994): Towards an Integrated Europe, CEPR, London.
Flandreau, M. and Maurel, M. (2001): “Monetary Union, Trade Integration, andBusiness Cycles in the 19th Century Europe: Just Do It”, CEPR, Discussion Paper,No. 3087.
Frankel, J. and Rose, A. (2002): “An Estimate of the Effect of Common Currencies onTrade and Income”, Quarterly Journal of Economics, Vol. 117, No. 2, 437-466, May.

23
Lejour, A., de Mooij, R. and Nahuis, R. (2001): EU Enlargement: Economic Impactsfor Countries and Industries, CPB Document, No. 011.
Persson, T. (2001): “Currency Unions and Trade: How Large Is the Treatment Effect”Economic Policy, Vol. 33, 435-448, October.
Rose, A.K. (2000): “One Money, One Market: Estimating the Effect of Common Cur-rencies on Trade”, Economic Policy, Vol. 30, 7-33, April
Rose, A.K. (2001): “Currency Unions and Trade: The Effect Is Large“, EconomicPolicy, Vol. 33, 449-461, October.
Rose, A.K. and van Wincoop, E. (2001): “National Money as a Barrier to Interna-tional Trade: The Real Case for Currency Union“, The American Economic Review,Vol. 91, No. 3, 386-390, May.
Sapir, A. (2001a): Trade Regionalism in Europe: Towards an Integrated Approach, inJ. von Hagen and M. Widgrén (eds.), Regionalism in Europe, Geometries and Strate-gies after 2000, Kluwer Academic Publishers, 45-54.
Sapir, A. (2001b): “Domino Effects in Western European Regional Trade”, EuropeanJournal of Political Economy, Vol. 17, No. 2, 377-388, June.