Embed Size (px)
Citation preview

RESEARCH Open Access
The impact of rainfall time series withdifferent length in a landslide warningsystem, in the framework of changingprecipitation trendsSamuele Segoni*, Ascanio Rosi, Daniela Lagomarsino, Riccardo Fanti and Nicola Casagli
Abstract
Background: This study explores some possible impacts that climate change could have in regional scale landslideearly warning systems based on rainfall thresholds. The early warning system of the Emilia Romagna region (Italy),was used as a case of study to assess how much the changing precipitation trends can affect the rainfallparameters used by the warning system and to assess whether the predictive power is higher when its thresholdsare defined using long (60 years) rainfall time series or using a shorter (10 years) but more recent dataset.
Results: In our case of study, the use of recent but limited rainfall time series, although more representative of thecontemporary rainfall regime, is a worse predictor compared to the longest possible rainfall datasets. The analysis of60-years-long rainfall series facilitated the identification of extreme and anomalous events, as they better stand outfrom the average time series.
Conclusions: This study proves that early warning systems should not be considered as a static product: the rainfallthresholds should be regularly updated, the measuring network should be maintained, and the dismissal of oldestsensors should be carefully evaluated as their long time series improve the forecasting effectiveness or warningsystems.
Keywords: Rainfall, Landslide, Early warning, Climate change
BackgroundLandsliding is a natural hazard that is responsible forcasualties and economical losses worldwide (Petley2012). In temperate and Mediterranean climates, rainfallis the most common triggering factor, therefore landslideearly warning systems at regional scale are generallybased on the exceedance of statistical rainfall thresholds(Guzzetti et al. 2007; Guzzetti et al. 2008; Tiranti andRabuffetti 2010; Cannon et al. 2011; Segoni et al. 2015a;Cucchi et al. 2015). Such thresholds are commonly de-veloped from two kinds of input data: a rainfall datasetand a landslide inventory. Neglecting any aspect relatedto the triggering mechanism, which is very site specificand that could be hardly generalized at the regional
scale, statistical techniques are used to find an empiricalrelationship between landslide initiation and rainfall pa-rameters and to define a mathematical formula (thresh-old) that separates rainfall conditions associated tolandsliding and rainfall conditions that are not. In the lit-erature, a wide variety of rainfall parameters have beeneffectively used to define rainfall thresholds, includingintensity and duration (Cannon et al. 2011; Segoni et al.2014a, b; Caine 1980; Guzzetti et al. 2008; Rosi et al.2012; Nikolopoulos et al. 2015), cumulative event rainfalland duration (Innes 1983; Vennari et al. 2014), cumula-tive event rainfall and soil saturation (Ponziani et al.2012), antecedent rainfall (Govi and Sorzana 1980; Gladeet al. 2000), antecedent rainfall as measured over a givenduration (Pasuto and Silvano 1998; Wilson 2000;Chleborad 2003) and other parameters (Guzzetti et al.2007 and references therein).
* Correspondence: [email protected] of Earth Sciences, University of Firenze, Via La Pira 4, 50121Florence, Italy
Geoenvironmental Disasters
© The Author(s). 2016 Open Access This article is distributed under the terms of the Creative Commons Attribution 4.0International License (http://creativecommons.org/licenses/by/4.0/), which permits unrestricted use, distribution, andreproduction in any medium, provided you give appropriate credit to the original author(s) and the source, provide a link tothe Creative Commons license, and indicate if changes were made.
Segoni et al. Geoenvironmental Disasters (2016) 3:21 DOI 10.1186/s40677-016-0057-6

This variety of parameters depends mainly on the quan-tity and quality of data (e.g. peak intensity cannot be prop-erly assessed when rainfall data are measured at dailyintervals) and on the physical constrains of the study area,above all the landslide typology (Lagomarsino et al. 2015).Indeed, there is a general agreement in recognizing thatdebris flows and shallow landslides are preferentially trig-gered by short and intense rainfalls (Campbell 1974;Crosta 1998), therefore, when trying to predict shallowmovements, intensity – duration thresholds are tradition-ally preferred (Caine 1980; Guzzetti et al. 2008). Con-versely, deep-seated landslides are usually influenced byprolonged and less intense rainfall events (Bonnard andNoverraz 2001; Martelloni et al. 2012); therefore, theantecedent rain plays a crucial role and rainfallthresholds are often based on rainfall parameters thatrefer to time intervals that may range from a fewdays (Crosta 1998; Heyerdahl et al. 2003) to severalmonths (Lagomarsino et al. 2013; De Vita 2000).Rainfall thresholds have been defined at every scale of
analysis; in particular, they can be conveniently used inregional scale landslide warning systems (Martelloni etal. 2012; Giannecchini et al. 2012; Lagomarsino et al.2013; Segoni et al. 2015a; Tiranti and Rabuffetti 2010).All warning systems based on rainfall thresholds havethe same basic principle: the formula representing thethreshold is valid for the past and is considered validalso for the future; thus, if the system predicts rainfallconditions similar to those that in the past were associ-ated to landslide initiations, a warning is issued.This assumption is weakened by climate change and
consequent changing of precipitation trends, which havebeen observed by many scientists (IPCC 2013; Parmesanand Yohe 2003). Concerning landslide rainfall thresh-olds, some authors pointed out that their validity is lim-ited in time as constant updates are necessary toaccount for the changing precipitation characteristics(Floris et al. 2010; Arnone et al. 2013; Rosi et al. 2015).Some authors point out that these changing trends havetangible consequences in the definition of statisticalrainfall thresholds (Wilson 2000; Floris et al. 2010;Quadrelli et al. 2001; Martina et al. 2010), hence theneed of performing periodic updates of the thresholds tohave a fully functional operating EWS (Lagomarsino etal. 2013; Rosi et al. 2015).Moreover, the recent changes in precipitation regimes
bring to another issue in rainfall thresholds analysis: onone hand, statistical analyses are more robust if a longdataset is used and, according to the basic principles ofstatistics, the longest available time series should beused. On the other hand, if current rainfall regimes aredifferent from those of a few decades ago, then only amore limited and recent dataset could be consideredrepresentative of the present precipitation regime and
rainfall-landsliding relationship. To our knowledge, thisambiguity has not been fully addressed in the existingliterature and the present study proposes a case of studyto contribute to fill this gap.This study aims to explore some possible impacts that
climate changes can have in a regional scale landslideearly warning system based on rainfall thresholds. TheEmilia Romagna region (Italy), along with its early warningsystem named SIGMA (Sistema Integrato Gestione Moni-toraggio Allerta) (Martelloni et al. 2012; Lagomarsino et al.2013), was used as a case of study to: i) assess how muchthe changing precipitation trends are affecting the rainfallparameters used by the early warning system; ii) assesswhether the early warning system provides better resultswhen its thresholds are defined using long (60 years) rain-fall time series or using a shorter (10 years) but more re-cent dataset.
MethodsTest site: Emilia Romagna regionEmilia Romagna is a region in northern Italy that can bedivided in two parts: the northern and eastern part is oc-cupied by the alluvial plain of the Po River, while thesouthern and western part is occupied by the Apennines(Fig. 1).The regional landslide warning system focuses only on
landslide prone areas; therefore, the flat area of the Poplain is not encompassed in this study.The Apennines are a thrust and fold belt with a very
complex tectonic and geological setting. In the studyarea, the bedrock consists mainly of flysch, which iscomposed of alternating massive rocks (mainly sand-stones and calcarenites) and pelitic layers of variablethickness (Vai and Martini 2001). Argillaceous geologicalformations are abundant as well and, during the Holo-cene, they were pervasively affected by large landslideswith recurrent periods of reactivation.Emilia Romagna is very susceptible to landsliding: here
the national inventory of landslides (IFFI) reports 70,037among active, dormant and inactive landslides (Trigila etal. 2010). The most frequent phenomena are deep-seated rotational–translational slides (affecting mainlyflysch), slow earth flows (occurring in clayey lithologies)and complex movements (typically rotational failures atthe head progressively changing into translational move-ments throughout the body and toe) (Martelloni et al.2012; Bianchi and Catani 2002; Benedetti et al. 2005).Rapid shallow landslides are recurrent as well and someauthors report an increased frequency in the last fewyears (Lagomarsino et al. 2013; Martina et al. 2010).IFFI inventory is considered one of the most complete
landslides inventory of Italy, and it can be used to pro-vide an overview on landslide phenomena in EmiliaRomagna (Segoni et al. 2015b), as it provides accurate
Segoni et al. Geoenvironmental Disasters (2016) 3:21 Page 2 of 12

mapping of all landslide bodies and useful additionalinformation (e.g. state of activity or landslide typ-ology). However, it could not be used to develop thewarning system and to carry out the elaborationsaccounted for in this manuscript, because it does notprovide the exact timing of triggering of each land-slide, which is a mandatory information to develop,calibrate and validate rainfall thresholds and warningsystems (Guzzetti et al. 2007; Rosi et al. 2015). There-fore, the landslide database used in this work is a re-gional inventory made up of official records of theregional civil protection agency, spanning through theyears 2004 to 2010, and containing 1680 landslides.In most of the cases, the timing of the landslides isknown with daily detail, thus matching perfectly thedaily outputs of SIGMA warning system. However,this database was compiled for administrative pur-poses: it contains information about the damagedproperties but does not always provide further detailsabout landslides; thus, most of the times, the land-slide typology is unknown.Landslides affecting Emilia Romagna are triggered by
rainfall and two different kinds of precipitation eventscan be associated with the initiation of different land-slide typologies: deep-seated landslides and earthflowsare usually activated by moderate-intensity but excep-tionally prolonged periods of rainfalls (Martelloni et al.2012; Benedetti et al. 2005), while shallow landslides arecommonly caused by short but exceptionally intenserainstorms.
The study area is characterized by a typical Mediterra-nean climate with warm and dry summers (approxi-mately from May to October) and mild/cool and wetwinters (approximately from November to April).
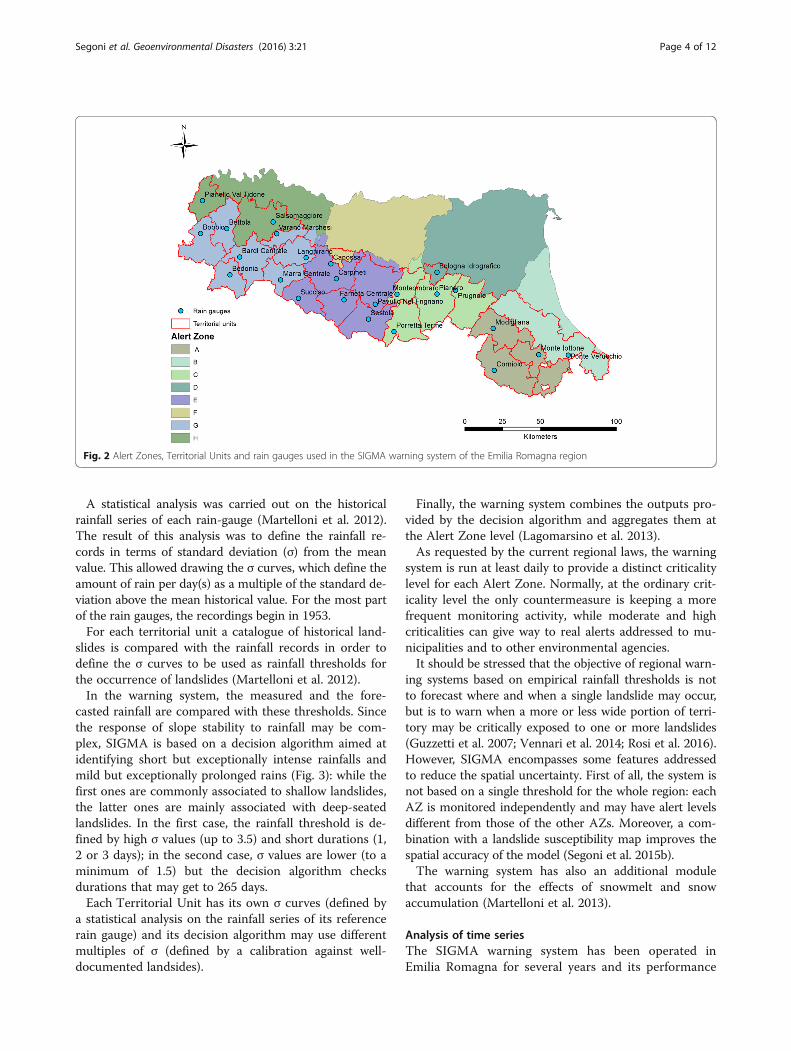
SIGMA early warning systemTo account for the hazard connected to rainfall triggeredlandslides in Emilia Romagna, the regional Civil Protec-tion Agency uses a warning system called SIGMA (Sis-tema Integrato Gestione Monitoraggio Allerta), which isbased on empirical rainfall thresholds. The system is ex-plained in detail in Martelloni et al., (2012) and Lago-marsino et al. (2013), and that can be briefly outlined asfollows.The Emilia Romagna region is subdivided into 8 Alert
Zones (AZ) and each of them is monitored by a variablenumber of rain gauges (for a total of 25 in the wholeregion). Each rain gauge is considered representative ofa Territorial Unit (TU), defined on the basis of relativelyhomogeneous geological, geomorphological and topo-graphical characteristics (Fig. 2) (Martelloni et al. 2012;Lagomarsino et al. 2013).All rain gauges satisfy the following characteristics: i)
presence of a long historical series of rainfall recordings(60 years in most of the cases); ii) connection to a re-gional network that allows remote real-time measure-ments at hourly time steps; iii) representativeness of theTU meteorology, as demonstrated by a quantitativecomparison with all other rain gauges of the same TU(Lagomarsino et al. 2013).
Fig. 1 Location of the study area; the test site is limited to the landslide susceptible areas, which correspond to the hilly andmountainous territories
Segoni et al. Geoenvironmental Disasters (2016) 3:21 Page 3 of 12
A statistical analysis was carried out on the historicalrainfall series of each rain-gauge (Martelloni et al. 2012).The result of this analysis was to define the rainfall re-cords in terms of standard deviation (σ) from the meanvalue. This allowed drawing the σ curves, which define theamount of rain per day(s) as a multiple of the standard de-viation above the mean historical value. For the most partof the rain gauges, the recordings begin in 1953.For each territorial unit a catalogue of historical land-
slides is compared with the rainfall records in order todefine the σ curves to be used as rainfall thresholds forthe occurrence of landslides (Martelloni et al. 2012).In the warning system, the measured and the fore-
casted rainfall are compared with these thresholds. Sincethe response of slope stability to rainfall may be com-plex, SIGMA is based on a decision algorithm aimed atidentifying short but exceptionally intense rainfalls andmild but exceptionally prolonged rains (Fig. 3): while thefirst ones are commonly associated to shallow landslides,the latter ones are mainly associated with deep-seatedlandslides. In the first case, the rainfall threshold is de-fined by high σ values (up to 3.5) and short durations (1,2 or 3 days); in the second case, σ values are lower (to aminimum of 1.5) but the decision algorithm checksdurations that may get to 265 days.Each Territorial Unit has its own σ curves (defined by
a statistical analysis on the rainfall series of its referencerain gauge) and its decision algorithm may use differentmultiples of σ (defined by a calibration against well-documented landsides).
Finally, the warning system combines the outputs pro-vided by the decision algorithm and aggregates them atthe Alert Zone level (Lagomarsino et al. 2013).As requested by the current regional laws, the warning
system is run at least daily to provide a distinct criticalitylevel for each Alert Zone. Normally, at the ordinary crit-icality level the only countermeasure is keeping a morefrequent monitoring activity, while moderate and highcriticalities can give way to real alerts addressed to mu-nicipalities and to other environmental agencies.It should be stressed that the objective of regional warn-
ing systems based on empirical rainfall thresholds is notto forecast where and when a single landslide may occur,but is to warn when a more or less wide portion of terri-tory may be critically exposed to one or more landslides(Guzzetti et al. 2007; Vennari et al. 2014; Rosi et al. 2016).However, SIGMA encompasses some features addressedto reduce the spatial uncertainty. First of all, the system isnot based on a single threshold for the whole region: eachAZ is monitored independently and may have alert levelsdifferent from those of the other AZs. Moreover, a com-bination with a landslide susceptibility map improves thespatial accuracy of the model (Segoni et al. 2015b).The warning system has also an additional module
that accounts for the effects of snowmelt and snowaccumulation (Martelloni et al. 2013).
Analysis of time seriesThe SIGMA warning system has been operated inEmilia Romagna for several years and its performance
Fig. 2 Alert Zones, Territorial Units and rain gauges used in the SIGMA warning system of the Emilia Romagna region
Segoni et al. Geoenvironmental Disasters (2016) 3:21 Page 4 of 12

is episodically evaluated (Martelloni et al. 2012; Lago-marsino et al. 2013; Lagomarsino et al. 2015). In thiswork, a different version of SIGMA (S10 henceforth)is applied and compared to the original one (S60henceforth). The only different feature of S10 is that,to obtain the σ curves, the statistical analyses are per-formed using only the rainfall records of the last10 years, instead of using the complete historical timeseries of each rain gauge (typically about 60 years).The analyses are carried out on 22 out of 25 raingauges: the remaining three have shorter time series(up to 30 years), and were excluded from the ana-lyses, as their time series are not long enough for thepurpose of this work.To assess if climate change affects the rainfall re-
gime of Emilia Romagna, which in turn may affectthe regional landslide early warning system, the σcurves of S60 and the σ curves of S10 were com-pared, along with some basic statistical properties(mean annual precipitation, mean daily precipitation,percentage of rainy days) of the different rainfalldatasets.In a second part of the study, the rainfall records
from 2004 to 2010 were used to simulate the per-formance of S10 if used in the regional early warn-ing system. The landslide database of the sameperiod was compared with the model daily outputsto count both correct predictions and errors (falsealarms and missed alarms). The performances of S10were compared to those obtained by S60 in the samereference period, which had previously been pub-lished (Lagomarsino et al. 2013).
ResultsVariation in rainfall valuesFirst, for every reference rain gauge used by SIGMA, wecompared the mean annual and daily precipitation values(MAP and MDP) as measured over the last 60 years withthose calculated for the last 10 years. As can be seen fromTable 1, there is a high variability, as several rain gaugesshow negligible or small variations, some show a markedincrease and some a marked decrease in some or in allvariables taken into account. Overall, the average yearlyand daily amounts of rainfall of the last 10 years show asmall decrease (−1%) with respect to the last 60 years.Figure 4 shows that eastern territorial units are character-ized by a marked decrease in MAP values, while in therest of the region the spatial distribution of MAP varia-tions does not seem to follow a regular scheme and doesnot correlate with latitude/longitude, nor with elevation(plot in upper right corner of Fig. 4).The same irregular pattern is observed when the rainy
days (percentage, in a year, of days with total precipita-tion over 1 mm) are taken into account.A more complete insight on the Emilia Romagna rain-
fall changing trends can be obtained comparing the σcurves. Basically, σ curves express how much precipita-tions of a given duration and amount can be considered“exceptional”, where the exceptionality is statisticallyassessed in terms of multiples of the standard deviation.Figure 5 compares the σ curves obtained using 10 years
and 60 years datasets in some rain gauges, in order tohighlight the main common trends and the main differ-ences that could be encountered in the territorial unitsof Emilia Romagna.
Fig. 3 The decisional algorithm at the core of the SIGMA warning system. C1-3 is the cumulative rainfall measured on the last day, the last twodays and the last three days. C4-63/265 is the cumulative rainfall measured in the last 4 days, 5 days, … up to 63 days in the dry season or up to265 days in the wet season. The figure gives as an example the σ levels of TU number 4. Further details can be found in Martelloni et al. 2012
Segoni et al. Geoenvironmental Disasters (2016) 3:21 Page 5 of 12

Table 1 Comparison between mean annual precipitation (MAP) and mean daily precipitation (MDP) as measured over the last60 years and the last 10 years
Rain Gauge 2003–2013 1953–2013 Variation (%)
MAP (mm) MDP (mm) Rainy daysa(%) MAP (mm) MDP (mm) Rainy daysa(%) MAP Rainy daysa
Bardi 1007.4 2.8 21.2 1043.9 2.9 28.9 -3.5 -7.7
Bedonia 1368.8 3.8 23.2 1379.7 3.8 30.7 -0.8 -7.5
Bettola 901.6 2.5 19.7 876.0 2.4 19.3 2.9 0.4
Bobbio 828.6 2.3 19.1 890.6 2.4 25.6 -7.0 -6.5
Bologna 814.0 2.2 18.6 781.1 2.1 27.2 4.2 -8.6
Canossa 828.6 2.3 20.0 792.1 2.2 11.7 4.6 8.3
Corniolo 1157.1 3.2 22.9 1270.2 3.5 22.3 -8.9 0.6
Farneta 978.2 2.7 22.7 970.9 2.7 28.0 0.8 -5.3
Langhirano 861.4 2.4 20.1 854.1 2.3 20.9 0.9 -0.8
Marra 1361.5 3.7 21.4 1372.4 3.8 37.1 -0.8 -15.8
Modigliana 887.0 2.4 20.7 912.5 2.5 23.9 -2.8 -3.2
MonteIottone 788.4 2.2 26.0 890.6 2.4 30.0 -11.5 -4.0
Monteombraro 919.8 2.5 21.1 963.6 2.6 25.2 -4.5 -4.1
Pavullo 748.3 2.1 19.1 850.5 2.3 26.2 -12.0 -7.1
Pianello val Tidone 839.5 2.3 19.7 741.0 2.0 13.7 13.3 6.0
Pianoro 876.0 2.4 21.3 887.0 2.4 34.7 -1.2 -13.4
Porretta Terme 1233.7 3.4 23.5 1200.9 3.3 40.7 2.7 -17.3
Prugnolo 788.4 2.2 19.2 781.1 2.1 14.2 0.9 5.0
Salsomaggiore 934.4 2.6 19.4 901.6 2.5 23.6 3.6 -4.2
Sestola 1314.0 3.6 25.1 1335.9 3.7 31.9 -1.6 -6.8
Succiso 1974.7 5.4 26.1 1941.8 5.3 31.5 1.7 -5.4
Varano Marchesi 952.7 2.6 20.1 1011.1 2.8 13.1 -5.8 7.1aNumber of days with rainfall exceeding 1 mm/day
Fig. 4 Variation in the mean annual precipitation measured in the reference rain gauge of each territorial unit; in the upper right corner themean annual precipitation variations are plotted versus the elevation of the reference rain gauge
Segoni et al. Geoenvironmental Disasters (2016) 3:21 Page 6 of 12

In general, the σ curves pertaining to the last decadeare markedly lower than the σ curves pertaining to thelast 60 years (Fig. 5). Only two pluviometers have slightlyhigher (Bologna) or substantially similar (Modigliana) σcurves. This is verified especially for high multiples of σ,while for lower σ multiples (i.e. 1.5σ and 2.0σ curves) 4
rain gauges (e.g. Farneta – Fig. 5) show similar or highercurves when the 10 years period is taken into account.Another interesting feature is that in almost all cases,for very short durations (i.e. a few days), the 3.0 σ curvescalculated in 10 years are higher than those calculated in60 years, even if at longer duration the trend is inverse.
Fig. 5 Comparison of σ curves calculated using 10 years and 60 years datasets. Most of the regional rain gauges have a trend similar to Corniolorain gauge (a). However, a few cases exists where differences in σ curves are less marked (b). The location of the rain gauges is displayed in Fig. 2
Segoni et al. Geoenvironmental Disasters (2016) 3:21 Page 7 of 12

The only exceptions are Verano Marchesi, Pavullo,Monte Ombraro, Modigliana and Corniolo, which allhave negative MAP variations (Table 1).A common feature to all TUs is that the differences
between high (e.g. 3.0σ) and low (e.g. 1.5σ) σ curves issmaller if they are calculated using the last 10 years, ra-ther than using the full 60 years dataset. This is particu-larly evident for long durations, when the curves seemto converge.Generally, and especially for high multiples of σ, the σ
curves drawn using a 10 years dataset show an irregularpattern, with “flat” curve segments alternating with steepincrements.
Variation in SIGMA resultsThe main objective of this work is to check if the per-formance of the warning system can be improved usingσ curves calculated on the last 10 years. To this end, analternate version of SIGMA warning system (S10) wasimplemented using the 10 years σ curves defined in theprevious section. In each TU, the decision algorithm wascalibrated against past known landslides as in Martelloniet al. (2012). Afterwards, we simulated the performance
of S10 using the rainfall measurements of the period2004–2010 and we performed a validation: for each ter-ritorial unit, the simulated daily outputs of SIGMA werecompared to the existing landslide database and classi-fied as true positives (TP, correct prediction of land-slide), true negatives (TN, no threshold exceedance andno landslide occurrence), false positives (FP, thresholdexceedance and no landslide) and false negatives (FN, nothreshold exceedance and landslide occurrence).Concerning S60, the results of a validation procedure
carried out with identical methodology are known(Lagomarsino et al. 2013). The validation statistics of bothS10 and S60 were combined to define common perform-ance indexes widely used in literature (Martelloni et al.2012; Lagomarsino et al. 2015; Begueria 2005), in order toquantitatively compare the performances of S10 and S60(Tables 2 and 3):
Sensitivity: Se = TP/(TP + FN); expressing the capabilityto properly classify rainfalls that triggered landslides;Specificity: Sp = TN/(TN + FP); expressing thecapability to properly classify rainfalls that did nottrigger landslides;
Table 2 Results of performance analysis and validation statistics of the S10 thresholds
Rain Gauge TP TN FP FN Se Sp PPP NPP Eff LR
Bardi 77 2384 88 6 0.93 0.96 0.47 1.00 0.96 26.06
Bedonia 19 2459 75 2 0.90 0.97 0.20 1.00 0.97 30.57
Bettola 25 2438 87 5 0.83 0.97 0.22 1.00 0.96 24.19
Bobbio 44 2413 84 14 0.76 0.97 0.34 0.99 0.96 22.55
Bologna 2 2427 126 0 1.00 0.95 0.02 1.00 0.95 20.26
Canossa 8 2440 98 9 0.47 0.96 0.08 1.00 0.96 12.19
Corniolo 54 2352 145 4 0.93 0.94 0.27 1.00 0.94 16.03
Farneta 74 2362 91 28 0.73 0.96 0.45 0.99 0.95 19.56
Langhirano 28 2417 96 24 0.54 0.96 0.23 0.99 0.95 14.10
M. Lottone 72 2340 142 1 0.99 0.94 0.34 1.00 0.94 17.24
M. Ombraro 30 2419 94 12 0.71 0.96 0.24 1.00 0.96 19.10
Marra 13 2441 94 7 0.65 0.96 0.12 1.00 0.96 17.53
Modigliana 60 2394 92 9 0.87 0.96 0.39 1.00 0.96 23.50
P. Verucchio 42 2388 122 3 0.93 0.95 0.26 1.00 0.95 19.20
Pavullo 59 2354 108 34 0.63 0.96 0.35 0.99 0.94 14.46
Pianello Val Tidone 11 2409 132 3 0.79 0.95 0.08 1.00 0.95 15.13
Poretta Terme 145 2295 89 26 0.85 0.96 0.62 0.99 0.95 22.71
Prugnolo 14 2430 97 14 0.50 0.96 0.13 0.99 0.96 13.03
Salsomaggiore 60 2410 75 10 0.86 0.97 0.44 1.00 0.97 28.40
Sestola 125 2324 76 30 0.81 0.97 0.62 0.99 0.96 25.47
Succiso 33 2442 70 10 0.77 0.97 0.32 1.00 0.97 27.54
Varano Marchesi 66 2400 84 5 0.93 0.97 0.44 1.00 0.97 27.49
TOTAL 1061 52738 2165 256 0.81 0.96 0.33 1.00 0.96 20.43
Segoni et al. Geoenvironmental Disasters (2016) 3:21 Page 8 of 12

Positive prediction power: PPP = TP/(FP + TP); theprobability of correctly classifying a rainfall thattriggered landslides;Negative predication power: NPP = TN/(TN + FN); theprobability of correctly classifying a rainfall that nottriggered landslides.Efficiency: Eff = (TP + TN)/(TP + TN + FP + FN); thepercentage of correct predictions.Likelihood ratio: LR = Se/(1-Sp); a measure of theoverall performances.
DiscussionChanging rainfall trendsIn several zones of the Mediterranean area, the recentclimatic trends are leading to shorter and more intenserainfalls (Floris et al. 2010). The trends observed inEmilia Romagna for the last 10 years seem coherent withthis assumption. As noted by other studies (Tomozeiu etal. 2000), the influence of local factors such as topog-raphy and the proximity of Adriatic Sea to the East pre-vent a homogeneous response in the various TUs and,apparently, regular spatial patterns cannot be identified.However, we verified a general reduction of rainy days
per year with respect to the average annual precipita-tions indicating a drying trend.The presence of a trend leading to short and intense
precipitations is corroborated by the analysis of the σcurves, which provide relevant information about therainfall trends of the various territorial units. In addition,the comparison between σ10 and σ60 curves revealedcomparable behavior in the various territorial units.In almost all TUs, at long durations and for mid-low σ
values, σ curves are lower for S10 than for S60. As in-stance, for Bardi rain gauge (Fig. 6), 200 mm of rain in15 days correspond to 2.5σ from the average 60 yearsvalue and to 3σ from the average 10 years value. Thisoutcome suggests that, at present days, events character-ized by very large rainfall amount fallen over very longdurations are less common than some decades ago.At short durations, we observed the opposite trend.
As can be seen from Fig. 6, 140 mm of rain in 3 dayscould be considered exceptional if compared to the rain-fall of the last 60 years (value above the 3σ curve ofS60). However, if the reference period is reduced to thelast 10 years, the same amount is less anomalous andless critical (value below the 3σ curve of S10). Thismeans that short and intense rainfalls have become
Table 3 Results of performance analysis and validation statistics of the S60 thresholds
Rain Gauge TP TN FP FN Se Sp PPP NPP Eff LR
Bardi 78 2398 74 5 0.94 0.97 0.51 1.00 0.97 31.39
Bedonia 19 2462 72 2 0.90 0.97 0.21 1.00 0.97 31.84
Bettola 25 2453 72 5 0.83 0.97 0.26 1.00 0.97 29.22
Bobbio 46 2400 97 12 0.79 0.96 0.32 1.00 0.96 20.42
Bologna 2 2402 151 0 1.00 0.94 0.01 1.00 0.94 16.91
Canossa 8 2437 101 9 0.47 0.96 0.07 1.00 0.96 11.83
Corniolo 55 2387 110 3 0.95 0.96 0.33 1.00 0.96 21.53
Farneta 74 2343 110 28 0.73 0.96 0.40 0.99 0.95 16.18
Langhirano 39 2403 100 13 0.75 0.96 0.28 0.99 0.96 18.77
M. Lottone 72 2374 108 1 0.99 0.96 0.40 1.00 0.96 22.67
M. Ombraro 30 2415 98 12 0.71 0.96 0.23 1.00 0.96 18.32
Marra 13 2465 70 7 0.65 0.97 0.16 1.00 0.97 23.54
Modigliana 61 2382 104 8 0.88 0.96 0.37 1.00 0.96 21.13
P. Verucchio 43 2394 116 2 0.96 0.95 0.27 1.00 0.95 20.68
Pavullo 60 2373 89 33 0.65 0.96 0.40 0.99 0.95 17.85
Pianello Val Tidone 12 2385 156 2 0.86 0.94 0.07 1.00 0.94 13.96
Poretta Terme 145 2285 99 26 0.85 0.96 0.59 0.99 0.95 20.42
Prugnolo 14 2432 95 14 0.50 0.96 0.13 0.99 0.96 13.30
Salsomaggiore 62 2356 129 8 0.89 0.95 0.32 1.00 0.95 17.06
Sestola 125 2322 78 30 0.81 0.97 0.62 0.99 0.96 24.81
Succiso 33 2455 57 10 0.77 0.98 0.37 1.00 0.97 33.82
Varano Marchesi 66 2396 88 5 0.93 0.96 0.43 1.00 0.96 26.24
TOTAL 1082 52719 2174 235 0.82 0.96 0.33 1.00 0.96 20.74
Segoni et al. Geoenvironmental Disasters (2016) 3:21 Page 9 of 12

more common than in the past decades and a higherrainfall amount is needed to consider a storm as excep-tional, because more rainfall is needed to diverge signifi-cantly from the average values.In addition, also the shape of S10 curves pertaining
to the highest multiples of σ shows evidences of atrend with increasing short-intense precipitation. Infact, as can be seen in Figs. 5 and 6, the curves haveflat portions where at increasing time the rainfallamount and the σ level remain stationary. These flatportions are usually followed by steep segments ofthe curve. This characteristic progressively diminishesat decreasing σ multiples and is completely absentfrom S60 curves. This feature could be partially dueto the reduced sample of the S10 time series, but itis also in accordance with the observed changingtrends. In fact, because of the frequency of short dur-ation and high intensity rainstorms, the moderateduration and intensity rainfalls are being progressivelyreplaced by a complex concatenation of shorter butvery intense episodes alterning with periods of norain.
Consequences in early warning system performanceThe last and most important part of this work focuses onthe actual implications of changing precipitation trends inthe effectiveness of the landslide forecasting system ofEmilia Romagna. In simple words: provided that the rain-fall regime is changing, is it better to update the rainfallthresholds of the warning system and to calibrate them
against only the most recent and anomalous years of rain,or is it better to use the longest possible rainfall datasets,even if they may contain data pertaining to a rainfall re-gime that is different from the present one? According tothe results of our analyses, we verified that, overall, theuse of recent but limited rainfall time series results inpoorer predictions than for the entire data series (S60)(Tables 2 and 3): in the test periods, 21 hazardous events,which were correctly predicted by S60, were missed byS10. This drawback is not compensated by the slight de-crease of the false positive rate. Indeed, we verified a slightdecrease in the value of the likelihood ratio (from 20.74 to20.43), which is commonly being used to assess with a sin-gle statistic the global performance of a model (Begueria2005; Lagomarsino et al. 2015).If we look at the performance of the single territorial
units (Tables 2 and 3), we observe a heterogeneous be-havior. In 12 out of 22 TUs, S10 results in poorer pre-dictions than S60. In 4 TUs, the capability of detectinglandslides does not increase, however the number offalse alarms is reduced, therefore the performance of thewarning system is slightly improved. In 3 TUs, the num-ber of correctly forecasted landslides diminishes, but thisdrawback is partially balanced by a decrease of falsealarms. In 3 TUs, changes in performances were negli-gible. The use of S10 instead of S60 does not bringmarked improvements in any of the TUs.We also tried to investigate whether the use of S10
instead of S60 could produce some improvements atleast in the forecasting of high-criticality events, that
Fig. 6 Zoom of the σ curves at short durations, Bardi rain gauge
Segoni et al. Geoenvironmental Disasters (2016) 3:21 Page 10 of 12

SIGMA identifies checking only higher multiples ofstandard deviations over short periods of time (3 daysmaximum, see Fig. 3). Basically, this subsample in-cludes only short and exceptionally intense rainfalls.Again, the use of S10 produces in general poorer pre-dictions than S10. Only in 5 TUs we verified a cer-tain improvement (a slight reduction of false alarms),in 7 TUs false alarms are reduced but as a drawbacksome missed predictions are introduced, while in 8circumstances the result is pejorative both in terms ofmissed alarms and true positives.We explain these outcomes with the characteristics of
the model at the core of the SIGMA warning system: thedecisional algorithm is based on the concept that landslidesoccur in the case of rainfall events that can be consideredexceptional either for the rainfall amount or for the dur-ation (Figure 3). The analysis of 60-years-long rainfall seriesease the identification of extreme and anomalous eventsbecause they better stand out from the average time series.This is a crucial point, as for similar warning systems it
is fundamental to identify rainfalls that may trigger land-slides. Since the variation of meteorological forcing im-plies a variation in the activity of the geomorphologicalprocesses that shape the landscape, the application ofsimilar early warning systems is even more effective (andneeded at the same time) in a changing climate context.
ConclusionWe compared the last 10 years with the last 60 years ofmeasurements from the rain gauges used by the regionallandslide warning system of Emilia Romagna region(Italy). Considering some basic rainfall statistics used bythe warning system, we observed variations in the localrainfall trends, with oscillations that are not homoge-neously distributed in the territory and with relevant dif-ferences among the territorial units.However, some indicators seem in accordance with the
trend observed in other Mediterranean areas, that areleading to shortest and more intense rainfalls. This wasconfirmed in particular by the analysis of the σ curves,which express how much a precipitation of a given dur-ation and amount can be considered “exceptional”, wherethe exceptionality is statistically assessed in terms of mul-tiples of the standard deviation. In particular, we observedthat, nowadays, rainfalls of short duration (i.e. a few days)need to have higher amounts to consistently diverge fromthe average values observed in the past decades. This out-come suggests that the climate change is bringing to rele-vant changes (even if not spatially homogeneous throughEmilia Romagna) in the rainfall time series: intense rain-falls are concentrated on shorter durations than in thepast decades and short events with extreme intensity areincreasing in frequency.
The observed changes in rainfall trends could infer achange in landslide activity, with relevant implicationsfor natural hazards assessment and civil protection activ-ity. It is therefore of paramount importance to drawsome conclusions that have a relevant impact in appliedmeteorology and in the operational applications of rain-fall threshold to early warning systems.First, this study clearly points out that, when landslides
early warning systems are based on the identification ofanomalous rainfall values by means of statistical analysesof rainfall time series, their effectiveness does not in-crease if only recent datasets are considered. In our caseof study, the use of a short dataset representative of therecent changes in rainfall trends does not improve theidentification of landslide occurrence. On the contrary,the use of long datasets (60 years in this work), providesthe best results as it eases the identification of extremerainfall values, which can stand out more markedly fromthe general trend observed over past decades.In a period in which local civil protection agencies are
planning the reorganization of their instrumental net-works, these results suggest that it is of chiefly importanceto maintain a certain degree of continuity for rain gaugeswith long time series and the dismissing or the displace-ment of “old” instruments should be considered carefully.Furthermore, since the study pointed out that the longer
the rainfall series, the better the warning system results,we can infer the importance of a constant update of thethresholds as soon as new data are available: the increasedcalibration sample leads to more robust and representativestatistical analyses and helps to better account for theongoing changes in precipitation trends and for thesubsequent changes in the activity of geomorphologicalprocesses.
AcknowledgmentsThis research has been financed by the Civil Protection Agency of the EmiliaRomagna region. ARPA Emilia-Romagna (Regional Agency for EnvironmentalProtection in the Emilia-Romagna region), is fully acknowledged for havingprovided part of the data used in this work.
Authors’ contributionsSS conceived and designed the research and drafted the manuscript. ARcarried out the analysis on the rainfall data and took care of the figures. DLcarried out the analysis on SIGMA warning system and performed thevalidation. RF participated in designing the study and helped in drafting themanuscript. NC participated in designing the study and revised themanuscript. All authors read and approved the final manuscript.
Competing interestsThe authors declare that they have no competing interests.
Received: 26 October 2016 Accepted: 12 November 2016
ReferencesArnone, E., D. Pumo, F. Viola, L.V. Noto, and G. La Loggia. 2013. Rainfall statistics
changes in Sicily. Hydrology and Earth System Sciences 17: 2449–2458.Begueria, S. 2005. Validation and evaluation of predictive models in hazard
assessment and risk management. Natural Hazards 37: 315–329.
Segoni et al. Geoenvironmental Disasters (2016) 3:21 Page 11 of 12

Benedetti, A., N. Casagli, V. Bosi, S. Dapporto, S. Ciolli, M. Palmieri, and F. Zinoni.2005. Modello statistico per la previsione operativa dei fenomeni franosi nellaregione Emilia-Romagna. Bollettino della Societa Geologica Italiana 124:333–344.
Bianchi, F., and F. Catani. 2002. Landscape dynamics risk management inNorthern Apennines (Italy). In Development and application of computertechniques to environmental studies, vol. 1, ed. C.A. Brebbia and P. Zannetti,319–328. Southampton: WIT.
Bonnard, C.H., and F. Noverraz. 2001. Influence of climate change on largelandslides: assessment of long term movements and trends. In Proceedings ofthe international conference on landslides causes impact and countermeasures,121–138. Essen: Gluckauf.
Caine, N. 1980. The rainfall intensity-duration control of shallow landslides anddebris flows. Geografiska Annaler 62: 23–27.
Campbell, R.H. 1974. Debris flows originating from soil slips during rainstorms inSouthern California. Quarterly Journal of Engineering Geology 7: 339–349.
Cannon, S., E. Boldt, J. Laber, J. Kean, and D. Staley. 2011. Rainfall intensity-duration thresholds for postfire debris-flow emergency response planning.Natural Hazards 59: 209–236.
Chleborad, A.F. 2003. Preliminary evaluation of a precipitation threshold foranticipating the occurrence of landslides in the Seattle, Washington Area, USGeological Survey Open-File Report 03, 463.
Crosta, G.B. 1998. Regionalization of rainfall thresholds: an aid to landslide hazardevaluation. Environmental Geology 35: 131–145.
Cucchi, A., I.Q. Valsecchi, M. Alberti, P. Fassi, M. Molari, and G. Mannucci. 2015.The alerting system for hydrogeological hazard in Lombardy Region,northern Italy: rainfall thresholds triggering debris-flows and “equivalentrainfall” method. Natural Hazards and Earth System Science Discussion 3:269–290.
De Vita, P. 2000. Fenomeni di instabilità delle coperture piroclastiche dei MontiLattari, di Sarno e di Salerno (Campania) ed analisi degli eventi pluviometricideterminanti. Quaderni di Geologia Applicata 7: 213–235.
Floris, M., A. D’Alpaos, C. Squarzoni, R. Genevois, and M. Marani. 2010. Recentchanges in rainfall characteristics and their influence on thresholds for debrisflow triggering in the Dolomitic area of Cortina d’Ampezzo, north-easternItalian Alps. Natural Hazards and Earth System Sciences 10: 571–580.
Giannecchini, R., Y. Galanti, and G. D’Amato Avanzi. 2012. Critical rainfallthresholds for triggering shallow landslides in the Serchio River Valley(Tuscany, Italy). Natural Hazards and Earth System Sciences 12: 829–842.doi:10.5194/nhess-12-829-2012.
Glade, T., M.J. Crozier, and P. Smith. 2000. Applying probability determination torefine landslide-triggering rainfall thresholds using an empirical “antecedentdaily rainfall model”. Pure and Applied Geophysics 157: 1059–1079.
Govi, M., and P.F. Sorzana. 1980. Landslide susceptibility as function of criticalrainfall amount in Piedmont basin (Northwestern Italy). StudiaGeomorphologica Carpatho-Balcanica 14: 43–60.
Guzzetti, F., S. Peruccaci, M. Rossi, and C.P. Stark. 2007. Rainfall thresholds for theinitiation of landslides in central and southern Europe. Meteorology andAtmospheric Physics 98: 239–267.
Guzzetti, F., S. Peruccacci, M. Rossi, and C.P. Stark. 2008. The rainfall intensity-duration control of shallow landslides and debris flows: an update. Landslides5: 3–17.
Heyerdahl, H., C.B. Harbitz, U. Domaas, F. Sandersen, K. Tronstad, F. Nowacki, A.Engen, O. Kjekstad, G. Devoli, S.G. Buezo, M.R. Diaz, and W. Hernandez. 2003.Rainfall induced lahars in volcanic debris in Nicaragua and El Salvador:practical mitigation. In Proceedings of international conference on fast slopemovements—prediction and prevention for risk mitigation, IC-FSM2003,275–282. Naples: Patron Publication.
Innes, J.L. 1983. Debris flows. Progress in Physical Geography 7: 469–501.IPCC – International Panel on Climate Change, 2013. Climate Change 2013: The
Physical Science Basis. Contribution of Working Group I to the FifthAssessment Report of the Intergovernmental Panel on Climate Change.1535 pp. Cambridge and New York: Cambridge University Press.
Lagomarsino, D., S. Segoni, R. Fanti, and F. Catani. 2013. Updating and tuning aregional-scale landslide early warning system. Landslides 10: 91–97.
Lagomarsino, D., S. Segoni, A. Rosi, G. Rossi, A. Battistini, F. Catani, and N. Casagli.2015. Quantitative comparison between two different methodologies todefine rainfall thresholds for landslide forecasting. Natural Hazards and EarthSystem Sciences 15: 2413–2423. doi:10.5194/nhess-15-2413-2015.
Martelloni, G., S. Segoni, R. Fanti, and F. Catani. 2012. Rainfall thresholds for theforecasting of landslide occurrence at regional scale. Landslides 9: 485–495.
Martelloni, G., S. Segoni, D. Lagomarsino, R. Fanti, and F. Catani. 2013. Snowaccumulation/melting model (SAMM) for integrated use in regional scalelandslide early warning systems. Hydrology and Earth System Sciences 17:1229–1240.
Martina, M.L.V., M. Berti, A. Simoni, E. Todini, and S. Pignone. 2010. Un approcciobayesiano per individuare le soglie di innesco delle frane. In Rainfall-inducedlandslides: mechanisms, monitoring techniques and nowcasting models forearly warning systems, vol. 2, ed. L. Picarelli, P. Tommasi, G. Urcioli, and P.Versace. Naples: CIRAM.
Nikolopoulos, E.I., M. Borga, F. Marra, S. Crema, and L. Marchi. 2015. Debris flowsin the eastern Italian Alps: seasonality and atmospheric circulation patterns.Natural Hazards and Earth System Sciences 15: 647–656.
Parmesan, C., and G. Yohe. 2003. A globally coherent fingerprint of climatechange impacts across natural systems. Nature 421: 37–42.
Pasuto, A., and S. Silvano. 1998. Rainfall as a triggering factor of shallow massmovements. A case study in the Dolomites, Italy. Environmental Geology 35:184–189.
Petley, D. 2012. Global patterns of loss of life from landslides. Geology 40:927–930.
Ponziani, F., C. Pandolfo, M. Stelluti, N. Berni, L. Brocca, and T. Moramarco. 2012.Assessment of rainfall thresholds and soil moisture modeling for operationalhydrogeological risk prevention in the Umbria region (central Italy).Landslides 9: 229–237.
Quadrelli, R., V. Pavan, and F. Molteni. 2001. Winter Mediterranean precipitationvariability and its links with upper-air large scale circulation anomalies.Climate Dynamics 5–6: 457–466.
Rosi, A., S. Segoni, F. Catani, and N. Casagli. 2012. Statistical and environmentalanalyses for the definition of a regional rainfall thresholds system forlandslide triggering in Tuscany (Italy). Journal of Geographical Sciences 22:617–629.
Rosi A, Lagomarsino D, Rossi G, Segoni A, Battistini A, Casagli N, 2015. UpdatingEWS rainfall thresholds for the triggering of landslides. Natural Hazards.doi: 10.1007/s11069-015-1717-7
Rosi A, Peternel T, Jemec-Auflič M, Komac M, Segoni S, and Casagli N. 2016.Rainfall thresholds for rainfall-induced landslides in Slovenia. Landslides.doi: 10.1007/s10346-016-0733-3
Segoni, S., A. Rosi, G. Rossi, F. Catani, and N. Casagli. 2014a. Analysing therelationship between rainfalls and landslides to define a mosaic of triggeringthresholds for regional scale warning systems. Natural Hazards and EarthSystem Sciences 14: 2637–2648.
Segoni S, Rossi G, Rosi A, and Catani F. 2014a. Landslides triggered by rainfall: asemiautomated procedure to define consistent intensity-duration thresholds.Computers and Geosciences. 63: 123–131
Segoni, S., A. Battistini, G. Rossi, A. Rosi, D. Lagomarsino, F. Catani, S. Moretti, andN. Casagli. 2015a. Technical note: an operational landslide early warningsystem at regional scale based on space–time-variable rainfall thresholds.Natural Hazards and Earth System Sciences 15: 853–861.
Segoni, S., D. Lagomarsino, R. Fanti, S. Moretti, and N. Casagli. 2015b. Integrationof rainfall thresholds and susceptibility maps in the Emilia Romagna (Italy)regional-scale landslide warning system. Landslides 12: 773–785.
Tiranti, D., and D. Rabuffetti. 2010. Estimation of rainfall thresholds triggeringshallow landslides for an operational warning system implementation.Landslides 7: 471–481.
Tomozeiu, R., A. Busuioc, V. Marletto, F. Zinoni, and C. Cacciamani. 2000.Detection of changes in the summer precipitation time series of the regionEmilia-Romagna, Italy. Theoretical and Applied Climatology 67: 193–200.
Trigila, A., C. Iadanza, and D. Spizzichino. 2010. Quality assessment of the Italianlandslide inventory using GIS processing. Landslides 7: 455–470.
Vai, G.B., and I.P. Martini. 2001. Anatomy of an orogen: the Apennines and adjacentMediterranean basins, 636. London: Kluwer Academic Publishers.
Vennari, C., S.L. Gariano, L. Antronico, M.T. Brunetti, G. Iovine, S. Peruccacci, O.Terranova, and F. Guzzetti. 2014. Rainfall thresholds for shallow landslideoccurrence in Calabria, southern Italy. Natural Hazards and Earth SystemSciences 14: 317–330.
Wilson RC. 2000. Climatic variations in rainfall thresholds for debris-flow activity.In Proceedings of the EGS Plinius Conference on Mediterranean Storms,Maratea, Italy, 415-424. Cosenza: Bios.
Segoni et al. Geoenvironmental Disasters (2016) 3:21 Page 12 of 12


![National 5 Weather Factors affecting Rainfall[Date] Today I will: - Understand the four different factors which influence the rainfall](https://img.dokumen.tips/doc/110x75/56649e7d5503460f94b7f3d7/national-5-weather-factors-affecting-rainfalldate-today-i-will-understand.jpg)


