Embed Size (px)
Citation preview
ON THE EXPLANATION OF FACTORS AFFECTING
E-COMMERCE ADOPTION
Dongwon Lee
Information and Decision Sciences Department Carlson School of Management
University of Minnesota Minneapolis, MN 55455 Phone: (612) 624-9323 Fax: (612) 626-1316
E-mail: [email protected]
Jinsoo Park Information and Decision Sciences Department
Carlson School of Management University of Minnesota Minneapolis, MN 55455 Phone: (612) 624-1301
Fax: (612) 626-1316 E-mail: [email protected]
Joongho Ahn
College of Business Administration Seoul National University
Seoul, 151-742, Korea Phone: +82-2-880-6953 Fax: +82-2-888-4264
E-mail: [email protected]
Working Paper Last revised on December 2000.

ON THE EXPLANATION OF FACTORS AFFECTING E-COMMERCE ADOPTION
Abstract
The Internet has grown at a remarkable pace since the emergence of the World-Wide Web in the early 1990s. While electronic commerce (e-Commerce) has become an important issue with the growth of the Internet, there has been insufficient empirical research concerning its adoption by Internet users. In this paper, we propose the e-Commerce Adoption Model (e-CAM), which attempts to examine important factors that predict a consumer’s online purchasing behavior. e-CAM integrates the technology acceptance model with the theories of perceived risk to explain the adoption of e-Commerce. Specifically, we examine the impact of the following factors on the consumer’s purchasing behavior: perceived ease of use, perceived usefulness, perceived risk with products/services, and perceived risk in the context of online transaction. We test the e-CAM model using the structural equation modeling technique. Most of the causal relationships between the constructs postulated by our model are well supported, accounting for 33.4 percent of the total variance in e-Commerce adoption. In sum, our study finds that all of the antecedent constructs directly and/or indirectly affect the consumer’s adoption of e-Commerce. Therefore, the findings suggest that firms providing products/services through e-Commerce should consider these contextual factors in order to facilitate consumers’ adoption behavior.
Keywords: e-Commerce, Technology Acceptance Model, Perceived Risk, Perceived Ease of Use, Perceived Usefulness

- 1 -
1. INTRODUCTION
The explosive increase of Internet users has led to dramatic shifts in the way of conducting
business. From our daily lives to commercial transactions between businesses, the Internet has
profoundly impacted and changed the way we do business. e-Commerce presents enormous
opportunities for both consumers and businesses in the world.
While e-Commerce has proliferated with the growth of the Internet, there have been
insufficient empirical research efforts concerning its status and consumer behavior over the
Internet. We believe that there may be some valid factors to explain the consumer’s adoption of
e-Commerce. In this study, we propose and validate the e-Commerce Adoption Model (e-CAM),
which is derived from the theoretical foundations of prior research in the theories of perceived
risk as well as the technology acceptance model. Specifically, we examine the impact of the
following factors on the consumer’s purchasing behavior: perceived ease of use, perceived
usefulness, perceived risk with products/services, and perceived risk in the context of online
transaction. We demonstrate not only what contextual constructs make a consumer adopt or
reject e-Commerce as a purchasing vehicle of products/services, but also how these contextual
differences influence the consumer’s adoption behavior.
The remainder of this paper is organized into the following five sections. The first
section provides a brief review of the literature on technology acceptance model and theories of
the perceived risk. Next, we present our research model and a set of research hypotheses based
on the theories in the preceding section. Then, we discuss our research methods used to test the
proposed model and present the analysis and results of our study. Finally, we make conclusion
by discussing the implications of our study, followed by presenting limitations and future
research direction.

- 2 -
2. THEORETICAL BACKGROUND
2.1. Technology Acceptance Model
IS researchers have made significant efforts in building theories to examine and predict the
determinant factors of information technology (IT) acceptance. The technology acceptance
model (TAM) adapts the belief-attitude-intention-behavior relationship to a user’s IT acceptance.
The purpose of TAM is to explain and predict IT acceptance and facilitate design changes before
users have experience with a system. TAM predicts user acceptance based on two specific
behavioral beliefs: perceived ease of use (PEU) and perceived usefulness (PU), which determine
an individual’s behavior intention (BI) to use an IT ((Davis et al. 1989)).
Significant empirical researches have examined the TAM’s overall explanatory power
and measurement validity in different settings characterized by constructs, type of IS, etc.
Originally investigating e-mail, word processing and graphics software, TAM has been extended
its application to diverse types of IS, such as DBMS ((Szajna 1996)), personal computing
((Agarwal et al. 1999)), and some other software ((Venkatesh 1999); (Venkatesh et al. 2000)).
Furthermore, several recent studies ((Lederer et al. 2000); (Lin et al. 2000); (Teo et al. 1999))
have examined TAM to analyze users’ behavior on the Internet, specifically the WWW.
Based on empirical evidence, the attitude construct (A) was left out from the original
TAM model because it did not fully mediate the effect of PU on behavioral intention (BI)
((Venkatesh 1999)). In addition, several studies ((Gefen et al. 1997); (Lederer et al. 2000);
(Straub et al. 1995); (Teo et al. 1999)) have disregarded the effect of PEU/PU on A and/or BI.
Instead, they focus on the impact of PEU and/or PU directly on the actual system usage. As our
research focuses on consumers’ actual usage on e-Commerce, we adapt the TAM model by
dropping A and BI, as illustrated in Figure 1.

- 3 -
Perceived Ease ofUse (PEU)
PerceivedUsefulness (PU)
PurchasingBehavior (PB)
Figure 1: Adapted TAM Model
Consumers can access thousands of online sites and purchase anything from groceries to
books and cars without traveling to a store site or adjusting his schedules around the store’s
hours. Recognizing that customers may want products/services delivered as soon as possible,
many e-Commerce sites offer next-day or second-day delivery. Furthermore, e-Commerce
consumers can view catalogs of different products/services and read extensive information
detailing their features and performance while information acquisition was time-consuming and
difficult prior to the outset of the Internet. Therefore, we recognize ease of information search,
ease of ordering, ease of using customer service, and overall ease of use as consumers’ PEU. In
addition, we measure PU by the following factors: saving of money, saving of time, vast selection
of products/services, and overall usefulness.
2.2. Theories of Perceived Risk
Since Bauer ((Bauer 1960)) first proposed that consumer behavior be seen as risk taking,
valuable empirical researches have attempted to identify various types of perceived risk in the
context of consumers’ purchase behavior.
2.2.1. Perceived Risk with Product/Service
Cox and Rich ((Cox et al. 1964)) refer to perceived risk as the overall amount of uncertainty
perceived by a consumer in a particular purchase situation. Jacoby and Kaplan ((Jacoby et al.
1972)) classified consumers’ perceived risk into the following five types of risk: physical,

- 4 -
psychological, social, financial, and performance (functional). Chaudhuri ((Chaudhuri 1998))
stated that low levels of perceived risk in products are related to high levels of positive feelings
during consumption. Sweeney et al. ((Sweeney et al. 1999)) defined perceived risk as the
subjective expectation of a loss and included financial and performance risk, which can be
viewed as an expectation of a future cost.
As we cannot directly see or touch product/service in the electronic market,
product/service delivered to consumers may not perform as expected. In addition, consumers
may bear the expenses such as shipping and handling when returning or exchanging the
product/service. Among the five risk types that Jacoby and Kaplan ((Jacoby et al. 1972))
propose, we recognized functional loss and financial loss as risk types related to product/service.
Further, we may waste time, convenience, and effort getting it adjusted or replaced when
purchased products/services fail. Although time is non-monetary effort and varies among
individuals, we recognize time as a cost that consumers must pay for products/services
((Sweeney et al. 1999)). After purchasing product/service over the Internet, consumers may find
a product/service of equal or higher quality at a lower price. Thus, we recognized another
perceived risk, opportunity loss, which is the risk that by taking one action a consumer will miss
out on doing something else he/she would really prefer to do.
Finally, we define perceived risk with product/service (PRP) as the overall amount of
uncertainty or anxiety perceived by a consumer in a particular product/service when the
consumer purchases online. Further, we identify five types of PRP: functional loss, financial
loss, time loss, opportunity loss, and overall perceived risk with product/service.

- 5 -
2.2.2. Perceived Risk in the Context of Online Transaction
Several research on the context of online transaction ((Hoffman et al. 1999); (Jarvenpaa et al.
1999); (Swaminathan et al. 1999)) suggest that consumer’s confidence or trust will be improved
by increasing the transparency of the transaction process, keeping to a minimum the personal
data required from the consumer, and making clear the legal status of any information provided.
Bhimani ((Bhimani 1996)) suggests the fundamental requirements for e-Commerce that satisfies
the following security issues: authentication, authorization, availability, confidentiality, data
integrity, nonrepudiation, and selective application services. Swaminathan et al. ((Swaminathan
et al. 1999)) assert that consumers evaluate online vendors before they do online transactions and
therefore vendors’ characteristics play an important role in facilitating the transaction. Rose et al.
((Rose et al. 1999)) state that if people do their transactions with dishonest merchants or if
sensitive information is stored on unsecured databases, security threats exist even where data is
perfectly secure in transmission.
Therefore, we define perceived risk in the context of online transaction (PRT) as a
possible transaction risk that consumers can face when exposed to electronic means of doing
commerce. Finally, four types of PRT are identified as follows: privacy, security
(authentication), nonrepudiation, and overall perceived risk on online transaction.
Perceived Risk inthe context of
Transaction (PRT)
Perceived Riskwith Product/Service (PRP)
PurchasingBehavior (PB)
Figure 2: Perceived Risk Model

- 6 -
Based on previous research on the perceived risk, we propose a theoretical model that
postulates perceived risks as the antecedents to the adoption as represented in Figure 2.
3. RESEARCH FRAMEWORK
3.1. Research Hypotheses
In this section, we propose several hypotheses regarding consumers’ adoption of e-Commerce
based on each construct that was derived from the pervious literature.
3.1.1. Perceived Risk in the Context of Online Transaction
As suggested in numerous studies, a commonly recognized barrier to the diffusion and adoption
of e-Commerce has been the lack of security and privacy over the Internet. Messages on the
Internet are being passed in a shared domain, and therefore consumers are not yet comfortable
with sending personal information across the Internet ((Rose et al. 1999)). Most online vendors
allow consumers to pay through credit card, which effectively limits the number of consumers
immediately. Security concerns with respect to exposure of credit card information to hackers or
unknown vendors is still a major anxiety for consumers ((Swaminathan et al. 1999)). According
to the study of Hoffman et al. ((Hoffman et al. 1999)), 95% of Web users have declined to
provide personal information to Web sites at one time or another when asked, and 40% who have
provided demographic data have gone to the trouble of fabricating it. Further, Bhimani
((Bhimani 1996)) state that consumers may be afraid that online vendors can deny an agreement
after the transaction. The higher concerns for privacy, security, and vendors’ trust a consumer
perceives in the e-Commerce transactions, the lower the usefulness of e-Commerce will be for
the consumer. In this context, we believe that consumers’ PRT would decrease their usefulness

- 7 -
(PU), and ultimately discourage consumers from their adoption on e-Commerce. Accordingly,
we propose the following hypotheses:
H-1a: PRT is negatively related to PU.
H-1b: PRT negatively affects consumer’s purchasing behavior in e-Commerce (PB).
3.1.2. Perceived Risk with Product/Service
As Sweenley ((Sweeney et al. 1999)) mentioned that each of a consumer’s risk types is
interdependent, it is assumed that the anxiety or uncertainty with product/service (PRP) is
correlated to PRT. Online consumers may also feel anxiety when they do transactions on the
Internet because of the intangibility characteristics of the product/service. PRP, therefore,
reduces consumers’ overall usefulness that the consumers obtain from shopping on the Internet.
Further, PRP will put a damper on consumer’s adoption of e-Commerce. Therefore, the
following hypotheses are proposed:
H-2a: PRP is positively correlated with PRT.
H-2b: PRP is negatively related to PU.
H-2c: PRP negatively affects PB.
3.1.3. Perceived Ease of Use
Information systems that users perceive easier to use and less complex will increase the
likelihood of its adoption and usage ((Teo et al. 1999)). According to several research on TAM
((Davis et al. 1989); (Teo et al. 1999)), PEU has been shown to influence behavior (i.e., IT
adoption) through two causal ways: (1) a direct effect on behavior and (2) an indirect effect on
behavior via PU. Therefore we propose the following hypotheses:
H-3a: PEU is positively related to PU.
H-3b: PEU positively affects PB.
- 8 -
3.1.4. Perceived Usefulness
Numerous empirical studies have already validated the relationship between PU and user
acceptance of information systems. Therefore, it is expected that consumers will adopt e-
Commerce if they perceive e-Commerce would help them to attain desired performance. In this
context, we propose a hypothesis as follows.
H-4: PU positively affects PB.
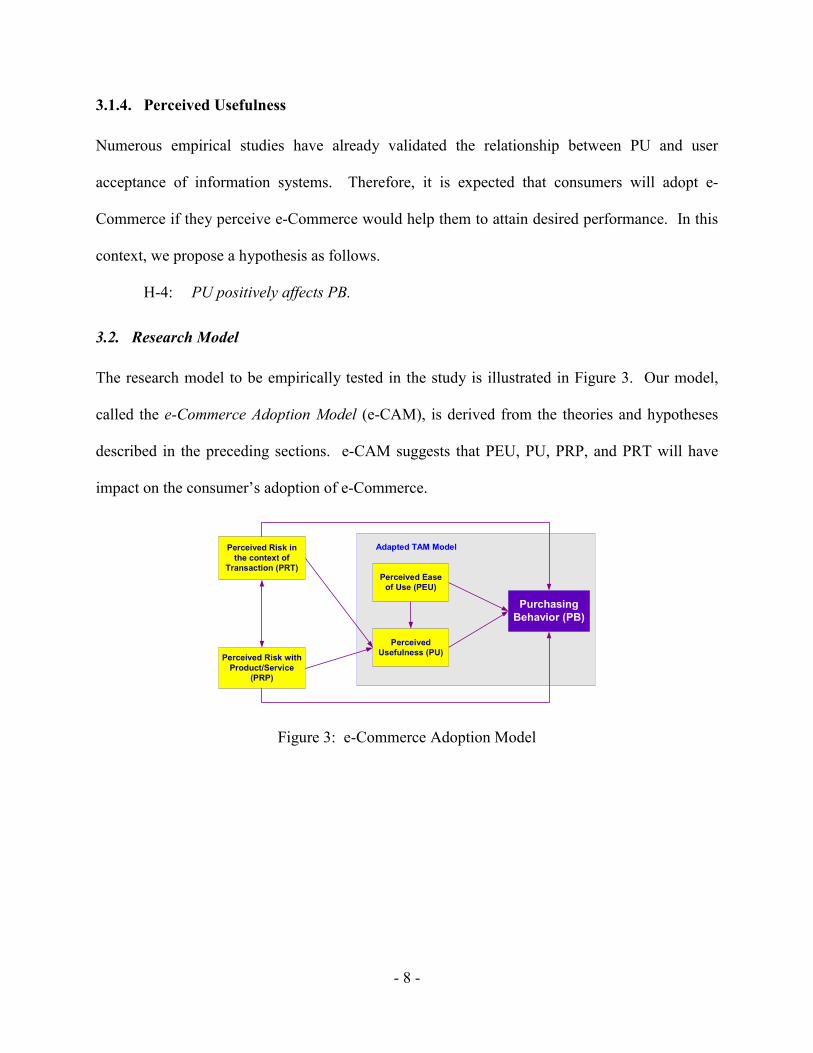
3.2. Research Model
The research model to be empirically tested in the study is illustrated in Figure 3. Our model,
called the e-Commerce Adoption Model (e-CAM), is derived from the theories and hypotheses
described in the preceding sections. e-CAM suggests that PEU, PU, PRP, and PRT will have
impact on the consumer’s adoption of e-Commerce.
Perceived Easeof Use (PEU)
PerceivedUsefulness (PU)
PurchasingBehavior (PB)
Perceived Risk withProduct/Service
(PRP)
Perceived Risk inthe context of
Transaction (PRT)
Adapted TAM Model
Figure 3: e-Commerce Adoption Model

- 9 -
4. RESEARCH METHODS
4.1. Questionnaires Generation
With regard to the independent variables, we derived questions to measure the PU and PEU
constructs based on Davis’s TAM model and the PRP and PRT constructs from the earlier
research on perceived risk. Measurement of the PEU construct stresses on how comfortable
consumers will be with e-Commerce as a purchasing medium. For the measurement of the PU
construct, the influence of e-Commerce on consumers is emphasized. In order to measure the
PRP construct, we focus on the risk factors regarding product/service that discourage consumers
from doing online transaction. For the measurement of the PRT construct, transaction security
and privacy on the Internet are stressed.
The dependent variable of the study, the consumer’s online purchasing behavior (PB),
was measured in two ways: (i) the frequency of online purchases, and (ii) the total amount spent
on online purchases. We referred to the previous research and survey on the Internet usage, such
as the GVU's 10th WWW User Surveys ((GVU's WWW User Survey Team 1998)), to develop
the questions regarding the dependent variable and other demographic variables.
The questionnaires were initially pretested with several graduate students who enrolled in
a large University and resulted in removing and rewording some unclear questions. Finally, the
questionnaires are mainly divided into five categories: e-Commerce Usage (3 items), PEU (4
items), PU (4 items), PRP (5 items), PRT (4 items). Each item of independent variables was
assessed with a 7-point scale with end points of ‘strongly disagree’ and ‘strongly agree.’ With
regard to the dependent variables, the frequency of online purchases was measured with 5-point
scales ranging from ‘none’ to ‘more than 10 times,’ and the total amount spent on online
purchases with 8-point scales ranging from ‘none’ to ‘more than $2,000.’

- 10 -
4.2. Sample & Procedures
As Tan and Teo ((Tan et al. 2000)) state, Web-based surveys are appropriate when the target
subjects are Internet users and a short time frame for responses is required. This study was
carried out through the Web-based survey methodology because our study focuses on consumers
who have ever experienced the Internet. The questionnaires were posted on the Web using Java
Servlet, and we utilized JavaScript to check for missing responses and prompt users to answer
them.
Subjects for the study were mostly undergraduate and MBA students at two major
Universities in the United States. As incentives for participation, subjects received participation
credit and we promised to send an executive summary of the results to the respondents.
Although numerous studies have used student subject for developing and validating theories on
IT diffusion and adoption, this subject may cause a sampling bias (i.e., external validity problem).
However, we believe that the students will finally grow to be the most active Internet users and
influential consumers in the online market, and therefore understanding of potential consumers’
needs in e-Commerce is very imperative to predict future trends on the adoption of e-Commerce.
The survey lasted about a month and elicited a total of 183 responses. Among these responses,
176 were valid for the analysis.
4.3. Data Analyses
4.3.1. General Statistics
Males and females consist of 66.5% and 33.5% of respondents respectively, quite similar to the
result of the GVU’s 10th WWW User Surveys ((GVU's WWW User Survey Team 1998))
(66.4%: 33.6%). The ages of the overall majority of respondents are between 16 and 35 (89.2%).
Further, all the respondents are highly educated with at least some college experience, which is

- 11 -
also similar to the result of the GVU’s surveys (87.8%). With regard to the connection speed,
approximately 42% of the respondents have high connection speed faster than 56 kb/sec. This
result is coherent to the finding of a survey that fewer than half are very interested in having a
high-speed connection ((Rose et al. 1999)). More than half of the respondents access the Internet
primarily at home, and most of the respondents have more than 2 years of experience on the
Internet.
4.3.2. Online Purchasing Statistics
As shown in Table 1, the majority of respondents (93.2%) have visited an online shopping mall,
and most of the visitors (87.5%) have purchased product/service via the Internet at least once.
Online Shopping-Mall Visiting Experience • Yes 164 (93.2%) • No 12 (6.8%)
Total Amount of Online Purchasing • None 22 (12.5%) • Less than $50 19 (10.8%) • $50–$99 21 (11.9%) • $100–$199 24 (13.6%) • $200–$499 37 (21.0%) • $500–$999 21 (11.9%) • $1,000–$2,000 8 (4.5%) • More than $2,000 24 (13.6%)
Frequency of Online Purchasing • None 22 (12.5%) • 1–2 times 50 (28.4%) • 3–5 times 64 (36.4%) • 6–10 times 20 (11.4%) • More than 10 times 20 (11.4%)
Table 1: On-Line Purchasing Statistics
4.4. Validating the Instruments
4.4.1. Reliability
In this study, the internal consistency reliability is measured by applying the Cronbach’s alpha
test to the individual scales and the overall measure as reported in Table 2. As the alpha values
for all the constructs in our study are greater than the guideline of .70 as specified by Nunally
((Nunally 1978)), we conclude that the scales can be applied for the analysis with acceptable
reliability.

- 12 -
Factors and Scale Items Mean SD Cronbach αααα
Perceived Ease of Use (PEU) .7793 • Easy to locate desired information 5.392 1.361 • Easy to use from any location at any time 5.886 1.402 • Easy to use the customer service 4.386 1.496 • Overall PEU 5.551 1.180
Perceived Usefulness (PU) .8432 • Save money 5.114 1.090 • Save time 5.733 1.187 • Provide wide variety of products/ services 5.443 1.286 • Overall PU 5.818 1.075
Perceived Risk with Product/Service (PRP) .8107 • Functional loss 4.983 1.263 • Time loss 5.324 1.336 • Financial loss 5.244 1.565 • Opportunity loss 4.824 1.351 • Overall PRP 4.796 1.055
Perceived Risk in the Context of Transaction (PRT) .8746 • Privacy 5.142 1.484 • Security (Credit card) 4.296 1.818 • Non-repudiation 4.085 1.676 • Overall PRT 4.023 1.632
Purchase Behavior (PB) .8267 • Total Amount of Online Purchasing (Last 6 months) 4.528 2.119 • Frequency of Online Purchasing (Last 6 months) 2.909 1.158
Table 2: Cronbach’s Alpha for the Scales
4.4.2. Construct Validity
Implementing the dataset of 176 responses, the data was examined using principal components
analysis as the extraction technique and Varimax as the method of rotation. An exploratory
factor analysis conducted in this study found a 5-factor structure with 19 scales loading with
eigenvalues greater than 1.0 that accounted for 70.58% of the total variance. Items intended to
measure the same construct demonstrated markedly higher factor loadings (>.50) on a single
component as represented in Table 3. Consequently, the instrument of our study shows adequate
validity for further analysis.

- 13 -
Factor Loading Measured Items
PRT PRP PU PEU PB
• Easy to search/locate desired information -.154 -.008 .282 .690 -.049 • Easy to use from any location at any time .043 -.146 .397 .667 .150 • Easy to use the customer service -.191 .039 .006 .715 .215 • Overall easy to use -.069 -.042 .430 .746 .139 • Save money -.147 .064 .533 .340 .439 • Save time -.103 -.107 .728 .328 .107 • Provide wide variety of products/ services -.264 -.075 .739 .160 .050 • Overall useful -.178 -.046 .784 .361 .254 • Functional loss .064 .794 -.001 .000 -.133 • Time loss .149 .800 -.054 -.096 .035 • Financial loss .340 .509 .251 -.147 -.262 • Opportunity loss .239 .646 -.297 .196 -.128 • Overall PRP .318 .837 -.090 -.075 -.167 • Privacy .763 .262 .049 -.160 -.028 • Security (Credit card) .806 .162 -.249 -.014 -.095 • Non-repudiation .784 .215 -.243 -.109 -.188 • Overall PRT .761 .209 -.257 -.170 -.250 • Electronic Purchasing Times -.147 -.207 .179 .128 .865 • Electronic Purchasing Amount -.228 -.203 .179 .162 .855
Eigenvalue 6.868 2.961 1.357 1.202 1.022 Percent of Variance 36 146 15 583 7 144 6 325 5 378
Table 3: Factor Analysis for Construct Validity
5. RESULTS
We examined our e-CAM model using structural equation modeling (SEM) technique. SEM
technique not only allows researchers to analyze a set of latent constructs much like independent
and dependent variables in regression analysis ((Segars et al. 1993)), but also provides
researchers with a comprehensive means assessing and modifying theoretical models
((Karahanna et al. 1999)).
5.1. Fitness of the e-CAM Model
The construct validity of the model’s scales was also evaluated using confirmatory factor
analysis (CFA). AMOS (Analysis of MOment Structures) with maximum likelihood estimation
was used to analyze the data. As there is no single recommended fit measure for the structural

- 14 -
equation model, a variety of measures are proposed in numerous literatures ((Chau 1997);
(Segars et al. 1993)) as represented in Table 4.
Fit Measures Recommended Values e-CAM
Chi-square (χ2) p ≥ .05 220.22 (p=.00)
χ2 / Degree of freedom (DF) ≤ 3.0 1.529
Root mean square residual (RMR) ≤ .05 .220
Goodness-of-fit index (GFI) ≥ .90 .889
Adjusted goodness-of-fit index (AGFI) ≥ .80 .854
Normed fit index (NFI) ≥ .90 .889
Nonnormed fit index (NNFI) ≥ .90 .950
Comparative fit index (CFI) ≥ .90 .958
R t f i ti (RMSEA) ≤ 08 055
Table 4: Fit Measures for e-CAM
A Chi-square (χ2) statistic indicates that our model does not fit the data (Chi-square =
220.22; p≤ .05). However, as Chi-square is a direct function of sample size, in small sample size
like our study, the statistic may lead to inaccurate probability value ((Chau 1997)). Instead, we
assessed our model using other multiple fit criteria, such as χ2/DF, RMR, GFI, AGFI, NFI, NNFI,
CFI, and RMSEA. The value of χ2/DF is around 1.529, which is below the desired cutoff value
of 3.0 as recommended by several literatures ((Chau 1997); (Segars et al. 1993)). In addition, the
GFI and AGFI values are .889 and .854 respectively, indicating a reasonable fit, while GFI is
somewhat lower than the recommended value. Further, the NFI (.889), NNFI (.950), CFI (.958),
and RMSEA (0.55) are all adequate levels. Therefore, our model is reasonably acceptable to
assess the results for the SEM technique.
5.2. Hypotheses Testing
The results of the multivariate test of the structural model are presented in Table 5. The table
shows the square multiple correlation (R2) as well as the path coefficients including direct and

- 15 -
indirect effects. The explained variance in perceived usefulness is .580. Further, the model as a
whole explains .334 of the variance in e-Commerce Adoption.
Perceived Usefulness (PU) Purchasing Behavior (PB)
Direct Total Direct Indirect Total
PRT -.237 -.237 -.285 -.117 -.402 PRP .077 .077 -.443 .038 -.405 PEU .613 .613 .143 .302 .445 PU .493 .493
R2 .580 .334
Table 5: Direct/Indirect Effects between the Constructs
Consistent with hypotheses H-1a, PRT is negatively related to PU. The data show that
PRT has strong direct effect on PU (β = -.237, p = .000). Inconsistent with hypotheses H-2b,
PRP has no significant relationship with PU. The data show that PRP has little effect on PU (β
= .077, p = .337). As expected in Hypotheses H-1b and H-2c, PRT and PRP both negatively
affect the adoption of e-Commerce (i.e., purchasing behavior). The data show that PRT (H-1b)
and PRP (H-2c) are strongly associated with the adoption (PRT: β = -.285, p = .024; PRP: β = -
.443, p = 010). Further, as expected in hypothesis H-2a, PRT and PRP are highly correlated
(correlation = .580, p = .000). In accordance with TAM, PU has positive direct effects on the
adoption of e-Commerce (β = .493, p = .030) while PEU is little directly related to the adoption.
As represented in Table 6, PEU has strong positive effects on PU (H-3a: β = .613, p = .000), yet
the direct effect of PEU on the adoption is insignificant (H-3b: β = .143, p = .462). However, it
should be noted that PEU has significant indirect effect (.302) on the adoption of e-Commerce.

- 16 -
Hypothesis Causal Relationship β1) S.E.2) C. R.3) P4) Result
H-1a PRT→PU (−) -.237 .054 -4.394 .000 Supported H-1b PRT→PB (−) -.285 .126 -2.264 .024 Supported H-2a PRT↔PRP (+) .580 .142 5.363 .000 Supported H-2b PRP→PU (−) .077 .080 .961 .337 Rejected H-2c PRP→PB (−) -.443 .175 -2.525 .010 Supported H-3a PEU→PU (+) .613 .066 9.283 .000 Supported H-3b PEU→PB (+) .143 .194 .736 .462 Rejected H-4 PU→PB (+) .493 .227 2.173 .030 Supported
1) Regression Coefficient; 2) Standard Error of β; 3) Critical Ratio (= β / S.E.); 4) Statistical Significance of the Test
Table 6: Hypotheses Testing Results
5.3. Summary of the Results
As presented in Table 6, most of causal relationships between the constructs postulated by our
model are well supported. The results suggest that PU, PRT, and PRP have significant direct
effects on consumer’s adoption of e-Commerce. Although direct effect of PEU (β = .143) on the
adoption is not significant, PEU mostly has indirect effect (β = .302) on the adoption through the
mediating construct (i.e., PU) as reported in Table 5. We believe that this result is mainly due to
the respondent characteristics. In other words, the subjects in our study are quite knowledgeable
about the Internet use, and therefore, PEU would not necessarily be a significant determining
factor on consumers’ purchasing behavior. Further, the insignificant direct effect of PEU is not
unexpected but shows the same pattern as found in several prior TAM research ((Gefen et al.
1997); (Gefen et al. 1998); (Szajna 1996)). With regard to the impact of PRT, the result is
consistent with Rose et al.’s study ((Rose et al. 1999)) as they think it as the most important
impediment to B2C e-Commerce. Inconsistent with our hypotheses (H-2b), PRP has little
relationship (β = .077) with PU. Instead, PRP has strong direct effect (β = -.443) on the adoption
of e-Commerce. The result shows that consumers’ PU on e-Commerce is not influenced
significantly by the risk, which is derived from product/service itself. Rather, e-Commerce

- 17 -
consumers take into account more about the risk involved in the transactions, such as privacy,
security and nonrepudiation, when they perceive e-Commerce as useful. In sum, all the
determinant factors of the consumer’s purchasing behavior (i.e., PEU, PU, PRT, and PRP) have
significant total effects on the adoption of e-Commerce including direct/indirect effects. Figure
4 illustrates many of the significant structural relationship among the constructs in our study.
PEU
PU(R2=.580)
PB(R2=.334)
PRP
PRT
Siginificant Path ( ***: p<.001; **: p < .01; *: p<.05)
Non-significant Path (p > .05)
-.285*
-.443**
-.237***
.077
.613***
.493*
.143
.580***
Figure 4: Result of testing the e-CAM model
6. DISCUSSION
In this research, most of the causal relationships between the constructs postulated by our model
were well supported, accounting for .334 of the variance in PB. Therefore, the e-CAM model
holds much promise for helping researcher and practitioners better understanding why
consumers adopt or reject e-Commerce for a purchasing vehicle.
6.1. Implications
The findings of this study have significant implications in the perspective of research on e-
Commerce consumer behavior. Our study provides further evidence on the appropriateness of
using the TAM model to measure the different dimensions of actual usage on e-Commerce. As

- 18 -
expected from the previous TAM research, two specific behavioral beliefs (i.e., PEU and PU)
well explain the adoption of e-Commerce. In addition, the results from our study have shown
that other factors with regard to perceived risk (i.e., PRT and PRP) help us better understand the
e-Commerce adoption. Therefore, in the e-Commerce setting, the power of the TAM model will
be greatly enhanced by taking into account the impact of the perceived risks. In sum, our study
has significant contributions to the theories of perceived risk as well as the TAM model by
providing empirical evidence that PEU, PU, PRT, and PRP are important factors that influence
the consumer’s adoption of e-Commerce.
The findings of the study also suggest important practical implications for businesses. It
is evident from this study that to convert Internet browsers into real buyers, PEU and PU must be
enhanced and the PRP and PRT reduced. From the perspective of a consumer’s perceived risk,
the consumer is willing to purchase product/service from an online vendor that is perceived low
risk, even if the consumer’s PEU or PU is relatively low ((Jarvenpaa et al. 1999)). As shown in
the results of our study, consumers consider the PRT (i.e., privacy, security, nonrepudiation, etc.)
as one of the important factors when they purchase on the Internet. Thus, diminishing such risk
is considerably important to online vendors. To lower the PRT, online vendors should establish
a robust mechanism, which utilize state-of-art Internet technologies. However, as criminals will
always exist in our society, if credit card is lost or stolen in a physical place, anyone can abuse
the card information ((Ratnasingham 1998)). Hence, it is more important that online vendors
enable consumers to place full trust on the privacy, security, integrity and availability of vendor
information. Further, online vendors should build trust with consumers by giving them complete
confidence on the product/service that they provide. We believe this can be achieved when
online vendors improve the following service quality factors, reliability, responsiveness,

- 19 -
assurance, and empathy ((Kettinger et al. 1997)). In sum, online vendors should consider these
contextual factors in order to facilitate consumer adoption behavior.
6.2. LIMITATIONS AND FUTURE RESEARCH DIRECTION
Like any research, our study has certain limitations. First, our sampling pool was restricted to
mainly academic circles, and therefore, most of the respondents were highly educated and well
experienced regarding the Internet. In addition, results of the study might also be biased given
the youth. Therefore, examining with more diverse Web users, such as older, less educated, and
less experienced on the Internet, may enable us to construct and validate more generalized model.
Second, the proposed model explains only 33.4% of the total variance of consumers’ e-
Commerce adoption behavior. The explanation power is relatively low, compared with previous
TAM studies. This means our model might have missed some important factors to the
consumer’s behavior on e-Commerce. In this exploratory study, due to the sampling limitations,
some factors regarding individual differences, such as gender, education, income, and Internet
experience, were deliberately left out. Further, we do not include some characteristics of
product/service, such as low asset specificity and ease of description (standardization), which
also differentiate the products/services correctly sold over the Internet, thereby can draw
consumers to purchase. Therefore, it is suggested that additional applicable factors including
individual differences and product/service characteristics be identified and included in future
research for better understanding of consumers’ behavior and the state of e-Commerce. Finally,
the measures for the construct of online purchasing behavior used in our study are self-reported;
thereby the respondents may not correctly answer their experience due to their limited memory.
Although self-reported measures are used in numerous studies, and the interchangeability of self-
report and objective usage measures remains a controversial point in IS research ((Straub et al.

- 20 -
1995), (Venkatesh et al. 2000)), we believe that future research can develop more objective and
accurate measures, such as an analysis of consumers’ actual visit and purchase log on real e-
Commerce site.
REFERENCES
Agarwal, R., and Prasad, J. "Are individual differences germane to the acceptance of new information technologies?," Decision Sciences (30:2) 1999, pp 361-391.
Bauer, R. "Consumer Behavior as Risk Taking," 43rd National Conference of the American Marketing Association, in Proceedings of the 43rd National Conference of the American Marketing Association, Dec., 1960, pp. 389-398.
Bhimani, A. "Securing the Commercial Internet," Communications of the ACM (39:6) 1996, pp 29-35.
Chau, P.Y.K. "Reexamining a Model for Evaluating Information Center Success Using a Structural Equation Modeling Approach," Decision Sciences (28:2) 1997, pp 309-334.
Chaudhuri, A. "Product Class Effects on Perceived Risk: The Role of Emotion," International Journal of Research in Marketing (15:2), May 1998, pp 157-168.
Cox, D.F., and Rich, S.U. "Perceived Risk and Consumer Decision Making - The Case of Telephone Shopping," Journal of Marketing Research (1:4) 1964, pp 32-39.
Davis, F.D., Bagozzi, R.P., and Warshaw, P.R. "User Acceptance of Computer Technology: A Comparison of Two Theoretical Models," Management Science (35:8) 1989, pp 982-1003.
Gefen, D., and Keil, M. "The Impact of Developer Responsiveness on Perceptions of Usefulness and Ease of Use: An Extension of the Technology of the Technology Acceptance Model," Database for Advances in Information Systems (29:2) 1998, pp 35-49.
Gefen, D., and Straub, D.W. "Gender Differences in the Perception and Use of E-mail: An Extension to the Technology Acceptance Model," MIS Quarterly (21:4) 1997, pp 389-400.
GVU's WWW User Survey Team "GVU's 10th WWW User Surveys," Geographic, Visualization, and Usability (GVU) Center, 1998.
Hoffman, D.L., Novak, T.P., and Peralta, M. "Building Consumer Trust Online," Communications of the ACM (42:4) 1999, pp 80-85.
Jacoby, J., and Kaplan, L.B. "The Components of Perceived Risk," 3rd Annual Conference of the Association for Consumer Research, Association for Consumer Research, in Proceedings of the 3rd Annual Conference of the Association for Consumer Research, 1972, pp. 382-393.
Jarvenpaa, S.L., and Tractinsky, N. "Consumer Trust in an Internet Store: A Cross-Cultural Validation," Journal of Computer-Mediated Communication (5:2) 1999.
Karahanna, E., and Straub, D.W. "The Psychological Origins of Perceived Usefulness and Ease-of-use," Information & Management (35:4) 1999, pp 237-250.
Kettinger, W.J., and Lee, C.C. "Pragmatic Perspective on Measurement of Information Service Quality," MIS Quarterly (21:2) 1997, pp 223-228.

- 21 -
Lederer, A.L., Maupin, D.J., Sena, M.P., and Zhuang, Y. "The Technology Acceptance Model and the World Wide Web," Decision Support Systems (29:3) 2000, pp 269-282.
Lin, J.C.-C., and Lu, H. "Towards an Understanding of Behavioral Intention to Use a Web Site," International Journal of Information Management (20:3) 2000, pp 197-208.
Nunally, J. Psychometric Theory, (2nd ed.) McGraw-Hill, New York, NY, 1978. Ratnasingham, P. "The Importance of Trust in Electronic Commerce," Internet Research:
Electronic Networking Applications and Policy (8:4) 1998, pp 313-321. Rose, G., Khoo, H., and Straub, D.W. "Current Technological Impediments to Business-to-
Consumer Electronic Commerce," Communications of the AIS (1:16) 1999, pp 1-74. Segars, A.H., and Grover, V. "Re-Examining Perceived Ease of Use and Usefulness: A
Confirmatory Factor Analysis," MIS Quarterly (17:4) 1993, pp 517-527. Straub, D., Limayem, M., and Karahanna-Evaristo, E. "Measuring System Usage: Implications
for IS Theory Testing," Management Science (41:8) 1995, pp 1328-1342. Swaminathan, V., Lepkowska-White, E., and Rao, B.P. "Browsers or Buyers in Cyberspace? An
Investigation of Factors Influencing Electronic Exchange," Journal of Computer-Mediated Communication (5:2) 1999.
Sweeney, J.C., Soutar, G.N., and Johnson, L.W. "The Role of Perceived Risk in the Quality-Value Relationship: A Study in a Retail Environment," Journal of Retailing (75:1), Spring 1999, pp 771-705.
Szajna, B. "Empirical Evaluation of the Revised Technology Acceptance Model," Management Science (42:1) 1996, pp 85-92.
Tan, M., and Teo, T.S.H. "Factors Influencing the Adoption of Internet Banking," Journal of the AIS (1:5) 2000, pp 1-42.
Teo, T.S.H., Lim, V.K.G., and Lai, R.Y.C. "Intrinsic and Extrinsic Motivation in Internet Usage," Omega (27:1) 1999, pp 25-37.
Venkatesh, V. "Creation of Favorable User Perceptions: Exploring the Role of Intrinsic Motivation," MIS Quarterly (23:2) 1999, pp 239-260.
Venkatesh, V., and Davis, F.D. "A Theoretical Extension of the Technology Acceptance Model: Four Longitudinal Field Studies," Management Science (46:2) 2000, pp 186-204.