Embed Size (px)
Citation preview

-1-
The Impact of Ownership Structure on the Dividend Policy of Japanese Firms
with Free Cash Flow Problem
Aristotelis Stouraitis
Lingling Wu
Department of Economics and Finance
City University of Hong Kong
September 16, 2004
* Contact information: Aristotelis Stouraitis (the author who will attend the conference and present the
paper), Tel: (852) 2788 8450, Fax: (852)2788 8806, Email: [email protected]. Lingling Wu, Tel:
(852)2788 7393, Email: [email protected]. Address : Department of Economics & Finance,
City University of Hong Kong, 83 Tat Chee Avenue, Kowloon Tong, Hong Kong

-2-
The Impact of Ownership Structure on the Dividend Policy of Japanese Firms with
Free Cash Flow Problem
Abstract
This paper, using 986 observations of listed Japanese firms between the years 1992 to 2000,
explore the implications of the free cash flow hypothesis concerning the disciplinary role of
ownership structure in dividend policy. We find evidence in support of the hypothesis that a
positive relation exists between dividends and free cash flow and it’s greater for low-growth
firms than for the high-growth firms. The results also show that the impact of managerial
ownership and bank ownership on dividend yield is positive particularly for the low growth firms.
This is inconsistent with the view that the managerial ownership and institutional ownership
reduce the need for the dividend mechanism. Finally, there is evidence that the Keiretsu
classification affects relations between ownership structure and dividend payouts. Overall, the
dividend policy appears to be used by Japanese low-growth firms to control the overinvestment
problem. Free cash flow hypothesis is to some degree supported.
JEL classification codes: G32 G34 G35
Keywords: Ownership Structure, Dividend Policy, Free Cash Flow

-3-
1. Introduction
Why does a firm pay dividends? This question has been the subject of debate for many years, In
the pre-Miller and Modigliani era, it was believed that increasing dividends would always
increase market value. Miller and Modigliani (1961) establish that in a perfect capital market,
given an investment policy, dividend is irrelevant in determining share value. Empirically,
however, we have observed that a change in dividend policy does have a significant impact on
the share price. Different researchers have concentrated on different types of imperfections in the
market in order to rationalize why dividends matter. Of these, a plausible idea is that corporate
dividend policy addresses agency problems between shareholders and managers (Rozeff, 1982;
Easterbrook, 1984; Jensen, 1986). According to these agency theories, unless profits are paid out
to shareholders as dividends, they may be committed to unprofitable projects that provide private
benefits for the managers. Rozeff (1982) and Easterbrook (1984) argues that the payment of
dividends expose companies to the possible need to raise external funds, and hence subjects them
to greater monitoring by capital markets. Jensen (1986) argues that paying dividends reduces the
discretionary resources under managerial control and so helps to mitigate the overinvestment
problem.
In this study, we examine the implication of the free cash flow hypothesis in corporate dividend
policy, and focus specifically on cross-sectional relations between dividend payout policy and
ownership structure and free cash flow. Given the severity of the overinvestment problem,
relations between dividend payouts and ownership structure, free cash flow may be conditioned
on the existence of growth opportunities. This research examines how the sensitivity of relations
between dividend payouts and ownership structure, free cash flow varies cross-sectionally with
growth opportunities.
Previous studies have shown that in countries like the US, firm ownership is relatively dispersed,
leading to a limited ability of owners to monitor or control management’s use of free cash flow.
Thus the dividend payout is one of the primary control mechanisms whereby shareholders can
reduce management access to or abuse of discretionary funds. In countries with 1) a higher
concentration of ownership 2) extensive cross-shareholding and 3) strong banking relationship,
like Japan, dominant shareholders are believed to have both the incentives and the ability to keep
management in check.
Tests using a sample of 986 observations for 350 firms from 1992 to 2000 period indicate that
the sensitivity of managerial ownership and bank ownership to dividend payouts varies directly
with the relative abundance of growth opportunities. we find that dividend payouts for
low-growth firms are significantly related to managerial ownership and bank ownership. In

-4-
contrast, there are no significant relations between dividend payouts and managerial ownership,
bank ownership for high-growth firms.
We also investigate associations between free cash flow and dividend payouts. Consistent with
the prediction by Jensen (1986), there is a strong positive relation between the level of free cash
flow and dividend payouts. Furthermore, association between free cash flow and dividend
payouts is stronger for low-growth firms.
The rest of the paper is organized as follows. Section 2 reviews the previous theoretical and
empirical research. Section 3 explains the Japanese institutional background. Section 4 describes
the empirical framework. The empirical results are presented in Section 5-6 and Section 7
concludes.
2. Dividend payouts, Ownership Structure and Agency Cost Theory
2.1 Dividends and Agency Costs
Corporate dividend policy has been viewed as a control mechanism that mitigates agency
conflicts between shareholders and managers. Jensen and Meckling (1976) suggest that one way
to reduce agency costs of equity is to pay a larger proportion of its earnings as dividends to its
stockholders. A high dividend payout ratio will result in lower “discretionary” cash flows
available to be squandered away by managers. Rozeff (1982) argues that dividend payments are
part of the firm’s optimal monitoring/bonding package and serve to reduce agency costs.
Easterbrook (1984) lists some of the mechanisms by which dividends and the consequent raising
of capital can control agency costs. Agency costs “are less serious if the firm is constantly in the
market for new capital. When it issues new securities, the firm’s affairs will be reviewed by an
investment banker or some similar intermediary acting as a monitor for the collective interest of
shareholders, and by the purchasers of the new instruments”.
2.2 Free cash flow hypothesis
The free cash flow hypothesis is a variant of the agency argument based on the Principal-Agent
framework. According to this framework, dividends are used by shareholders as a device to
reduce overinvestment by managers. Jensen(1986) argues that managers with substantial free
cash flow tend to invest it in wasteful projects rather than pay it out to shareholders, because
managerial compensation and perquisites increase even with poor investments. These
unnecessary investments lead to poor performance, creating conflicts between shareholders and
managers. Jensen emphasizes the disciplinary role of dividends that restrain managerial
unprofitable expansionary tendencies by limiting financial resources available to managers.
Dividend payments represent an ongoing commitment to maintain higher payments in future
periods, because firms are reluctant to cut dividends and have been greeted by a significant

-5-
negative stock market reaction when they do. Jensen suggests that dividends should be paid out
in ways that instigate managers to gorge the cash beyond the optimal amount. This implies that
free cash flow positively determines dividend payments.
2.3 Ownership structure and dividend policy
One criticism of the agency cost theory is that if managers want to overinvest or spend more on
jets, what is the mechanism that will force them self-commit to an action that will prevent them
from doing so? Several authors address this issue in the context of ownership structure
2.3.1 Institutional Ownership
There are several important ways in which institutions differ from individual investors. In
general, institutions manage large pools of funds and therefore invest larger amounts in each
stock. Because they have larger amounts at stake, they should have incentives to devote
resources to monitoring (Grossman and Hart, 1980; Shleifer and Vishny,1986).
Institutions are also likely to be better informed than are individual investors. Not only do
institutions devote resources to gathering information, but they are also sometimes privy to
corporate information that individual investors do not have ( Michaely and Shaw,1994).
However, the prediction on the relationship between dividend policy and institutional ownership
are mixed.
The first line of research suggests a positive relation. Zeckhauser and pound (1990) suggest the
arm’s length view of investment held by many institutional investors, coupled with the incentives
to free ride with respect to monitoring activities, implies that institutional shareholders are
unlikely to provide direct monitoring themselves. The institutions, rather than providing
monitoring themselves, forces firms to increase their dividends in order that they are
subsequently forced to go to the external capital market for future funds. Eckbo and Verma
(1994) argue that institutional shareholders will prefer free cash flow to be distributed in the
form of dividends in order to reduce the agency costs of free cash flow. From this perspective, it
may be argued that institutional shareholders may counter a tendency for managers to prefer the
excessive retention of cash flow and, by virtue of their voting power, force managers to pay out
dividends. Moh’d, Perry and Rimbey (1994) and Short, Zhang, and Keasey (2002) also provide
additional support.
The second line of research suggests a negative relation. Jensen and Meckling (1976) argue that
external monitoring activity is an important controlling element when agency conflict exists. If
large institutional investors act as monitoring agents, and if dividends are paid to reduce agency
cost, then according to this theory, there should be a substitute relation between dividend policy
and institutional ownership. This implies a negative relationship between the percentage of
-6-
shares held by institutions and the dividend payout. D’Souz, and Saxena (1999) provide the
empirical evidence.
2.3.2 Managerial Ownership
There are several lines of argument on the role of managerial ownership. The first line of
argument suggest that managerial ownership may better aligning the interest of management
and shareholders and helps mitigate free cash flow problems. Therefore it results in a higher
level of total payouts when managers hold more shares. ( White,1996; Fenn and Liang,2001).
The second line of argument suggest that insider stock ownership provides direct incentive
alignment between managers and shareholders while dividends serve as a bonding mechanism
reducing management’s scope for making unprofitable investment out of internal funds. Thus,
insider stock ownership and dividend policy are viewed as substitute means of addressing
potential agency problem. This approach expects that dividend payouts are negatively related to
insider stock holdings, which is verified by a number of studies. (Rozeff, 1982; Crutchley and
Hansen, 1989; Dempsey and Laber, 1992; Jensen, Solberg and Zorn,1992; Moh’d, Perry and
Rimbey ,1995; Agrawal and Jayaraman, 1994; Holder, Langrehr and Hexter, 1998; Chen and
Steiner,1999; Short, Zhang, and Keasey, 2002; )
The third line of argument suggests non-monotonic relation. Shleifer and Vishny (1989)
developed managerial entrenchment model. They argue that at a certain level of insider-holdings
managers have effective control and engage in non-value maximizing behavior as the relative
cost of such behavior are outweighted by the relative benefit. Empirical articles have shown that
managerial ownership is not a linear function of agency costs. Morck, Shleifer and Vishny (1988)
and McConnell and Servaes (1990) found insider ownership is related to performance in a
nonlinear fashion. Schooley and Barney (1994) report a nonmonotonic relation between CEO
stock ownership and dividend yield. Farinha (2003) documented the U-shaped relationship
between insider ownership and dividend payout in the UK. He argues that it stems from the
effects of managerial entrenchment.
3. Japanese Institutional Background
Japan offers us a valuable opportunity to examine issues related to dividend policy under an
institutional setup quite different from that in U.S., such as the main bank, the
cross-shareholding among corporations. This distinctive Japanese institutional background may
result in important difference between Japanese and U.S. firms in terms of corporate monitoring
and information sharing. Since, most theoretical explanations of dividends rely on agency and
information issues, they would suggest different choices of dividend policy in Japan.
3.1 Main bank
-7-
Aoki, Patrick and Sheard (1994) highlight a significant governance role played by the main bank
for Japanese firms. The main bank effectively monitors the client firms by becoming
well-informed about the firm (Diamond, 1984)). The main bank’s equity stake in the client firm
mitigates agency costs between creditors and shareholders (Prowse (1990)). The main bank
sometimes intervenes the management of the client firm that performs poorly by appointing bank
employees to the board of directors in the client firm (Kaplan and Minton,1994; Kang and
Shivdasani, 1995; Morck and Nakamura, 1999). In case of financial distress, the main bank acts
as a guarantor for other creditors, reducing the cost related to the restructuring of the client firm
(Hoshi, Kashyap and Sharfstein,1990)..
In contrast, several authors suggest that there is a cost in having a main bank. Firms relying on
the main bank for financing are likely to be constrained in raising the additional capital when the
banking sector as a whole has a financial difficulty (Kang and Stulz, 2000). The main bank can
extract surplus from the client firms due to its monopolistic power of information production
(Rajan, 1992). In a similar context, the main bank has an incentive to force the client firms to
undertake low-risk, negative NPV projects (Weinstein and Yafeh, 1998). Firms that do not
depend on bank borrowing exhibit higher profitability than the matched sample of firms that
have a main bank ( Kang and Shivdasani, 1999).
3.2 Keiretsu Group
There exist differences between keiretsu or industrial groups centered around affiliated banks
and financial institutions and unaffiliated independent firms with weaker banking ties. Japanese
industrial organization is characterized by groups of enterprises (keiretsu) composed of firms
based in different industries but bound by ties of fractional ownership and reliant on a large
commercial bank as the major but not sole lender. The large shareholders of keiretsu firms often
are also large creditors of the firm as well as important long-term commercial business partners.
The keiretsu and non-keiretsu firms are facing different liquidity constraints in their investment
spending. Investment spending is very sensitive to liquidity constrains for non-keiretsu firms, but
not so for keiretsu firms. Since keiretsu firms are likely to have better access to financing sources,
keiretsu firms seemingly face less liquidity constraints in making investment decision.
The differences in institutional arrangements between keiretsu and non-keiretsu firms may
influence the behavior of shareholders as monitors. Kester (1990) describes the corporate
governance system of keiretsu firms in terms of a complex interaction between shareholdings,
credit holding and long-term business relationship that exist between the firm and its stake
holders. Aoki, Patric, and Sheard (1994), and Berglof and Perotti (1994) suggest a two-tier
monitor system. In the first stage, corporate cross-shareholders serve as the monitors under
-8-
normal circumstances because they have specific industry knowledge and observe each others’
performance through their business relations. In the second stage, the financial institutions take
an active intervention role when member firms get into financial distress, replacing incumbent
managers and requiring restructuring and liquidation of assets.
3.3 Managerial equity ownership
Because the well-known keiretsu structure and influential bank shareholders, the agency
problems between Japanese managers and shareholders are considered to be minimal (e.g.
Nakatani, 1984; Hoshi, Kashyap and Scharfstein, 1990, 1991; and Prowse, 1990). The manager
ownership, as a way of aligning interests between managers and shareholders, has been viewed
as an unnecessary corporate governance mechanism.
However Kang and Stulz (1998), Mock and Nakamura (1999), and Weinstein and Yafeh (1998)
questioned the effectiveness of bank oversight in Japan. Morck and Nakamura (1999) argue that
for independent firms, bank equity holders pursue their interests as creditors at the expense of
their equity claims. Gibson(1995) and Kang and Stulz (2000) argue that poor bank health may
adversely affect their dependent firms’ investment prospects, which, in turn, would affect their
ability to monitor effectively. This particular contention is especially relevant to the late 1980’s
and early 1990’s as it is well known that Japanese banks have been experiencing significant
financial difficulties during this time period. In light of these findings, Morck and Nakamura
(1999) contend that some independent firms may require corporate control mechanisms other
than bank oversight. Due to the decline in power of Japanese banks, the rarity of incentive-based
compensation contracts for Japanese managers, and the fact that many Japanese firms are not
affiliated with a keiretsu group, the managerial-ownership may represents an alternative
mechanism to ensure that firms operate efficiently.
Thus, the unique Japanese institutional arrangements provide an interesting backdrop to
investigate whether cash flow theory explanation for dividend policy still apply given the
differences.
4. Empirical framework
4.1 Hypotheses
If one assumes, as suggested by Jensen (1986), that managers receive utility from increasing the
size of the firm, the control function of dividend payouts on the overinvestment problem varies
with the firm’s growth opportunities. Management may have an incentive to pay out as few
dividends as possible at shareholders’ expense. The overinvestment problem is less important
and may be trivial for firms with many growth opportunities, because the objectives of managers
and shareholders are more likely to coincide. On the other hand, when good projects are not
-9-
available, managers with substantial free cash flow must find ways to spend it and hence choose
poor projects. Thus, the overinvestment problem is higher for low-growth firms than for
high-growth firms, and divergence of interests between shareholders and managers over the
firm’s payout policy are more severe in firms with few growth opportunities. These firms can
limit management’s temptation to overinvest by paying out a larger percentage of their earnings.
Their high-growth counterparts with lots of investment opportunities are likely to pay low
dividends because they have profitable uses for the capital. For this reason, we expect stronger
relations between free cash flow and dividend payouts for low-growth firms.
Hypothesis I: relations between the level of free cash flow and dividend payouts are positive and
are stronger for firms with low growth opportunities.
Most of the existing agency explanations of payout rely on the implicit assumption that firms can
get refinanced on the capital markets when they need funds to undertake new investment projects.
Consequently, the strategy that minimizes agency costs is to maintain a high payout (to reduce
the amount of free cash flow and to avoid overinvestment problems) and to raise new outside
capital whenever and attractive investment opportunity emerges. Outside shareholders are
harmed by a potential overinvestment and therefore they have preferences for high payout, which
curbs the amount of corporate resources that can be spent by management on value reducing
projects. Managerial ownership helps to align interests of management and shareholders that
may yield the reduction of agency costs stemming from payout smaller. Consequently, payout
ratios in a firm with managerial block holdings may be low because the severity of
manager-shareholder agency conflict is low. This traditional agency view generates a set of
hypothesis that the payout is negatively related with the managerial ownership.
Institutional investors are more effective at monitoring management than retail investors. Due to
the size of their investments and the resources at their disposal, institutional investors have
greater incentive and ability to gather and analyze information pertaining to their investments, as
well as a greater ability to discipline management and push for changes when management
performs poorly. Pound (1988) suggests that institutional investors serve as an alternative
mechanism to control the overinvestment problem. Agrawal and Mandelker (1990) indicate that
institutional investors provide valuable monitoring services and act as a restraint to opportunistic
behavior by managers. Therefore, institutional investors may help in reducing the firm’s agency
cost and become a substitute for payout.
According to the interpretation in the previous studies regarding the substitutive relation between

-10-
managerial ownership, institutional ownership and dividend payouts in controlling the agency
cost of overinvestment, the negative relation between managerial ownership, institutional
ownership and dividend payouts should be more pronounced form firms with few growth
opportunities.
Hypothesis II: relations between managerial ownership, institutional ownership and dividend
payouts are negative and are stronger for firms with low growth opportunities.
4.2 Model
titititi
tititititititi
ERNSIZEPSTDLevFCFessBuNonbankBankManagerialDP
,,9,8,7
,6,5,4,3,2,1, sinεβββ
ββββββ
+++
++++++=
Dependent variable
We use dividend yield (Smith and Watts, 1992; Agrawal and Jayaraman, 1994; Gul, 1999; Fenn
and Liang, 2001) to represent the firm’s payout policy since the management may manipulates
the profits and the dividend payout ratio will also be affected.
Dividend yield = Cash dividends per share / Price per share
Stock repurchase were made to be legally available in 1997 for managerial stock option
preparations and were made generally available for Japanese corporations as a financial tools in
2002. There is little observation of stock repurchase during our sample period 1992-2000. Hence
we didn’t consider the stock repurchase.
Independent variable
The key variables are ownership variables and Free cash flow.
1) Managerial ownership
Due to the decline in power of Japanese banks, the rarity of incentive-based compensation
contracts for Japanese managers, the manager ownership is an important governance device in
Japan. We measure managerial ownership by the percentage of total shares outstanding held by
the president and chairman. The coefficient on managerial ownership is expected to be negative.
2) Institutional ownership
To check how the identities of institutional owners matter for dividend policy, we employ bank
ownership, nonbank financial ownership and business corporate ownership.
BANK= percentage of shares owned by banks
NONBANK= percentage of shares owned by insurance companies and trusts;
BUSINESS= percentage of shares owned by corporate block holders;
-11-
The coefficient of institutional ownership is expected to be negative.
3) Free cash flow
Jensen (1986) defines free cash flow as cash flow left after firms have invested all available
positive NPV projects. The most commonly used FCF definition is the one suggested by Lehn
and Poulsen (1989).
The coefficient on Free Cash Flow is expected to be positive.
FCF= (Operating income before depreciation – Interest expenses – Taxes – Preferred dividends)/
Book value of assets
4) Leverage ratio
LEV = equityofvaluemarketsliabilitietotal
receivablenoteandaccountssliabilitietotal
+
−
As leverage increases, the probability of financial distress, and hence, external financing costs
increase. As argued by Rozeff (1982), dividend payments may be viewed as quasi-fixed charges
that can substitute for higher fixed costs or interest payments. As fixed costs rise, the dividend
must decline to avoid the additional cost of external financing. Debt is also an alternative method
of disgorging free cash flow (Jensen, 1986; Berger, Ofek, and Yermack; 1997). Jensen, Solberg
and Zorn (1992) report a negative causal relation from debt levels to dividend payments.
Johnson (1995) also supports the argument that debt and dividends are substitute. We expect that
firms that rely more on debt to disgorge free cash flow will rely less on dividends. The
coefficient on Leverage ratio is expected to be negative.
5) Investment
Investment =(expenditure for plant, equipment +R&D)/Book value of asset.
Myers and Majluf (1984) contend that firms may have to choose between dividend payments and
capital expenditures ( investments). Coefficient on investment is expected to be negative.
6) Profitability.
Profitability = operating income divided by sales;
A positive relationship between profitability and dividends seems plausible, all else constant
(Rozeff,1982; Jensen , Solverg and Zorn, 1992). The coefficient on profitability is expected to be
positive.
7) External financing cost: risk and firm size
Firms with relatively low financing costs can distribute more cash to shareholders because they
know that external funds can be raised relatively inexpensively. As proxies for external financing

-12-
costs, we employ two variables, risk and firm size. Firms with higher operating and financial
leverage would have higher costs of external financing. The standard deviation of the firm’s
monthly stock returns over the previous five years is a measure of risk, patterned after Holder,
Langrehr and Hexter (1998).
Larger firms are generally regarded as having more stable cash flows and having less
information asymmetry, which result in lower financing costs (Smith and Watts,1992; Opler
and Titman, 1993; Fenn and Liang, 2001). Larger firms also have higher agency costs (Jensen
and Meckling, 1976). It needs more dividends to reduce the agency costs. We measure firm size
as the natural logarithm of the book value of assets.
PSTD = standard deviation of operating income to sales over 5 years
SIZE = natural log of total assets;
We hypothesize that the coefficient on business risk is negative and the coefficient on size is
positive.
8) Dummy variable:
Keiretsu dummy is equal to 1 if being keiretsu member, otherwise equal to 0. Nakatani (1984)
keiretsu firms pay lower dividends because inter-corporate shareholdings are financed through
borrowings and receiving dividends limits the right of the firm to using tax-deductibility of
interest payments. He also suggests that the lower dividends may be explained in terms of the
fact that keiretsu firms have less incentive to use dividends as a signal. The coefficient on
Keiretsu dummy is expect to be negative.
Year dummy is included to control for contemporaneous macroeconomic shocks.
4.3 Methodology
The hypothesis is tested using OLS regression. The OLS methodology assumes that all
exogenous variables are uncorrelated with the residual terms. In the case that the regressors are
endogenous, this basic assumption of the OLS estimator is violated and the resulting estimates
are biased and inconsistent. The managerial ownership, debt policy, investment policy and
dividend policy are integral parts of corporate decision making in the agency framework. The
Institutional ownership along with other control variables is external to the firm and therefore
they are not corporate decision variables. The managerial ownership, the leverage and
investment may be endogenous variable and correlated with the regressions’ error terms.
To control for possible biases due to reverse causality, we use 2SLS. An alternative method is
using a one-year lag between dividend payouts and explanatory variables. To control for industry
effects, we also make regression with all variables except for year dummy and keiretsu dummy
defined as differences from industry mean.

-13-
4.4 Data
4.4.1 Sample Selection
In constructing the sample, we initially take the list of firms and the financial accounting data
from the Pacific-Basin Capital Markets (PACAP) database. We use a sample period that spans
for 9 years from 1992 to 2000. For the purpose of the lagged analysis, the sample period actually
used for estimation on dividend yield payouts runs from 1993 to 2000 and for all explanatory
variables from 1992 to 1999. We do not include utility and financial companies in the sample
because their ownership structure and dividend payouts are likely to be significantly different
from other firms in the sample. This yield a sample of 986 firms observations. To be included in
the sample for further analysis, we require that the data on managerial ownership is available.
The observations should have no missing value for dividend yield, free cash flow, investment,
and standard deviation of operating income to sales over 5 years. Some firms pay dividends
when their earnings are negative. These firms are excluded from the sample following Agrawal
and Jayaraman (1994).
A breakdown of low-growth and high-growth firms by year, industry and keiretsu classification
is provided in table-1. For each year, firms are ranked according to their end-of-fiscal year
market-to-book value (Growth Opportunities). The bottom quartile firms are placed in the
low-growth subsample and the top quartile firms are placed in the high-growth subsample. Panel
A shows that the sample the low-growth sample contains 484 observations for 161 firms, while
the high-growth sample consists of 502 observations for 189 firms. The samples distributed
evenly over the 9 sample period.
Panel B presents industry distribution of the two samples. Both samples contain 6 industry
groups. Firms in manufacturing industries ( industry codes between 301 and 315) represent
42.98% of low-growth firms, and 63.74% of high-growth firms.
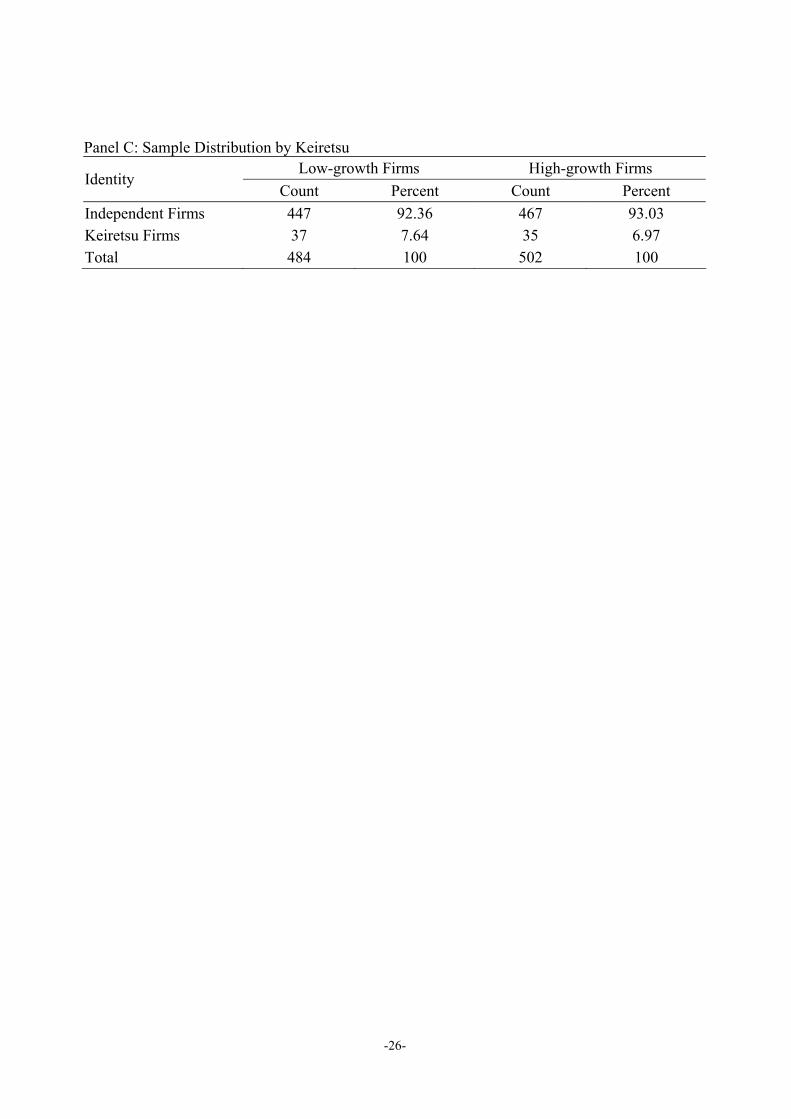
Panel C show the Keiretsu and Independent Firms in the sample. The low-growth firms contain
37 keiretsu members and 447 independent firms. The high-growth sample contains 35 keiretsu
members and 467 independent firms.
4.4.2 Descriptive Statistics
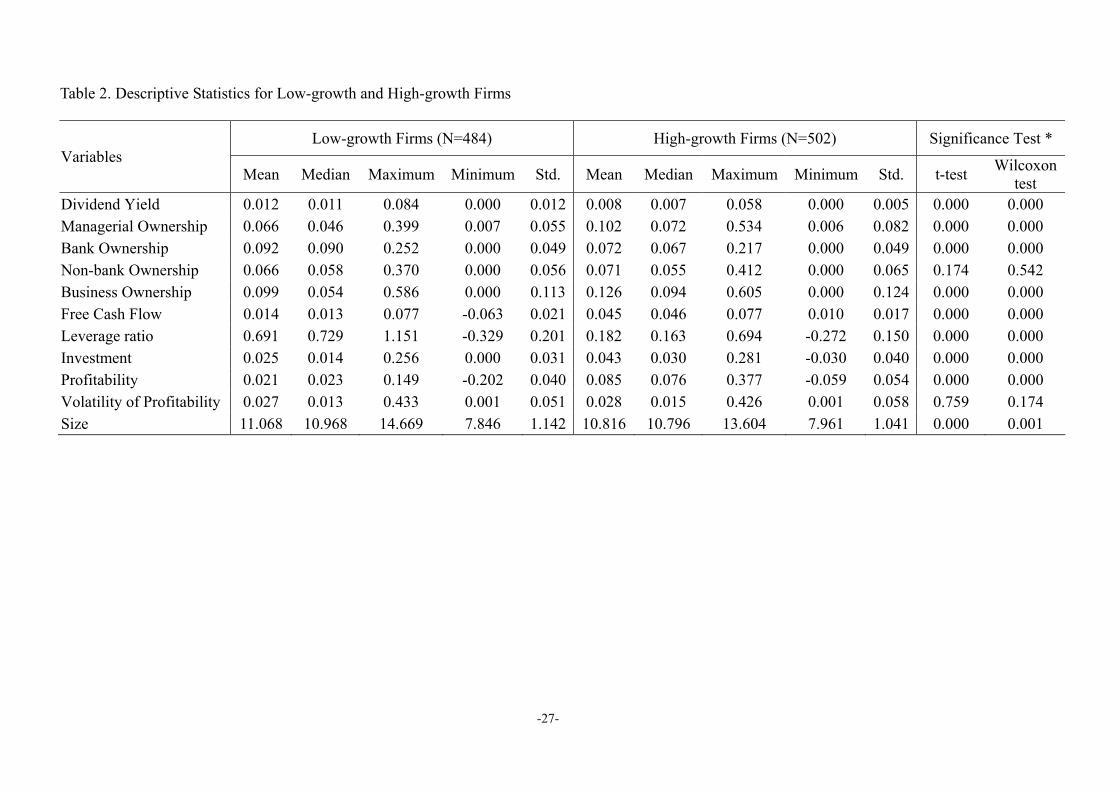
Table 2 provides descriptive statistics for low-growth and high-growth firms. column 1 identifies
the variables used in the study, column 2 through 6 provide statistics for the low-growth sample,
column 7 through 11 provide statistics for the high-growth sample. The last column reports the
p-value for the difference of mean (median) between low-growth and high-growth firms. The
first entry is p-value based on the t-test, and the second entry is p-value based on the Wilcoxon
test.
-14-
There is evidence that dividend yield is significantly higher for low-growth firms than
high-growth firms. The mean (median) Dividend yield for the low-growth sample is 0.012
(0.011), compared to a mean (median) of 0.008(0.007) for the high-growth sample. Both t-test
and Wilcoxon test indicate that the difference between the two sample is significant (p<0.01).
The result is consistent with the argument that dividend payouts are used as a bonding
mechanism to control agency costs of free cash flow and also consistent with the earlier findings
( Smith and Watts, 1992; Gavor and Gavor, 1993; Gul, 1999).
The difference in the ownership structure between the two samples is significant. The mean
(median) managerial ownership for the low-growth sample is 0.066(0.046), compared to a mean
(median) of 0.102(0.072) for the high-growth firms. The mean (median) bank ownership for the
low-growth sample is 0.092(0.090), compared to a mean (median) of 0.072(0.067) for the
high-growth firms. The mean (median) business ownership for the low-growth sample is
0.099(0.054), compared to a mean (median) of 0.126(0.094) for the high-growth firms. Both
t-test and a Wilcoxon test indicate that the differences are significant. The mean (median)
non-bank ownership for the low-growth sample is 0.066(0.058), compared to a mean (median) of
0.071(0.055) for the high-growth firms. The t-test and the Wilcoxon test show that the difference
is not significant.
Both the t-test and Wilcoxon test reveals that free cash flow is significantly lower for
low-growth firms ( mean of 0.014, median of 0.013) than for high-growth firms (mean of 0.045,
median of 0.046). (p<0.01). Possible explanation is that profitability is significantly different
between low-growth firms (mean of 0.021, median of 0.013) and high-growth firms (mean of
0.085, median of 0.076) (p<0.01).
The leverage ratio is significantly higher for low-growth firms (mean of 0.691, median of 0.729)
than high-growth firms (mean of 0.182, median of 0.163).
The investment is significantly lower for low-growth firms (mean of 0.025, median of 0.014)
than high-growth firms (mean of 0.043, median of 0.030).
The size are also significantly different between low-growth firms (mean 11.068, median of
10.968) and high-growth firms (mean of10.816, median of 10.796) (p<0.01).
The volatility of profitability is not significantly different between low-growth firms and
high-growth firms.
5. Regressing Results of Managerial Ownership and Dividend Payout by Growth Opportunities
Table 3, Table 4 and Table 5 presents the results for the impact of growth opportunities on
relations between ownership structure and dividend payouts. Three stages of regressions are run
using OLS, 2SLS, and one year lag data.
-15-
5.1 The results of 2SLS
Table 4 presents the estimates of the two stage least square. Column 2 and 3 provide the
regression estimates for low-growth and high-growth firms with the dividend payout ratio as the
dependent variable. A t-statistics appears in parentheses below each coefficient and is adjusted
for the heteroskedasticity in residuals using the White (1980) method. All regressions provide the
estimates obtained after adjusting for year effects. The validity of the instruments is supported by
the Sargan Test. The Hausman test confirms the potential bias of OLS and the need for 2SLS,
although the evidence for the endogeneity of Leverage is not strong.
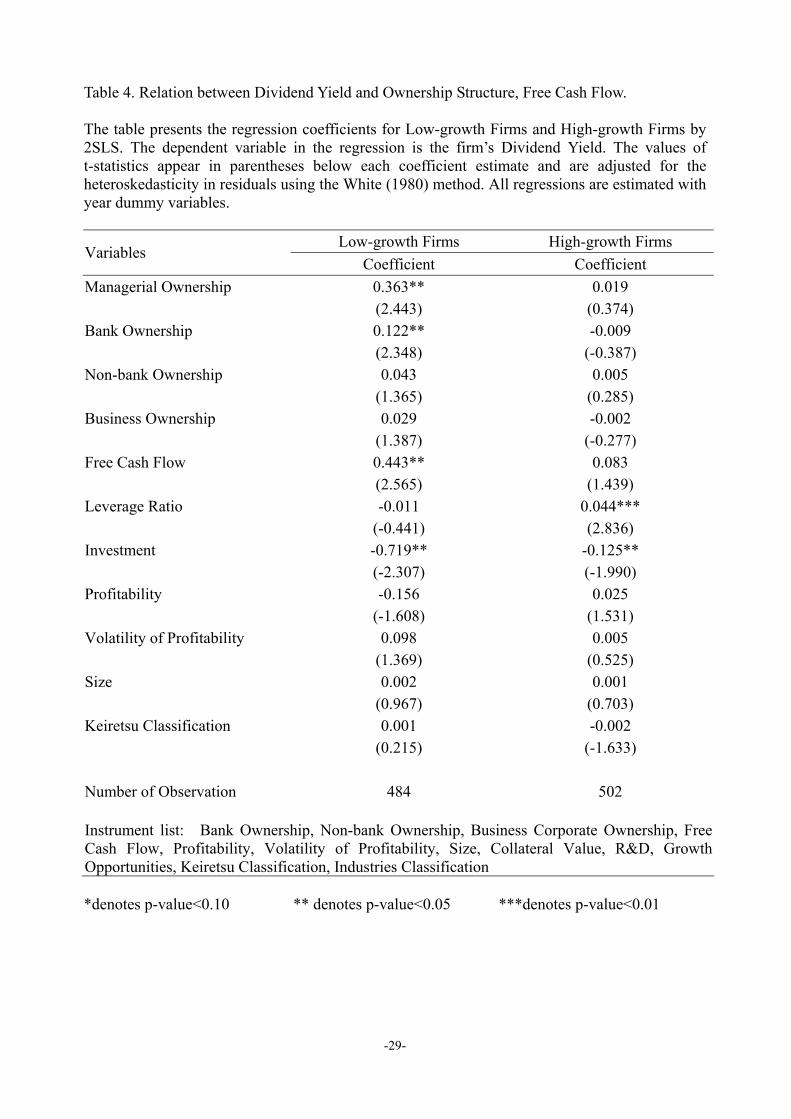
There is evidence that free cash flow leads to an increase in dividend yield and the effect is
stronger for low-growth firms. The results show that the coefficient on free cash flow for
low-growth firms is 0.443 (p<0.05), the coefficient for high-growth firms is 0.083 (insignificant).
These findings support the first hypothesis that relations between free cash flow and dividend
yield are positive and are more pronounced for low-growth firms. (The OLS method get similar
result).
Turning to the role of ownership structure, relations between ownership variable and dividend
yields appear to differ dramatically with growth opportunities. For low-growth firms, managerial
ownership has very pronounced effects on dividend yield. Higher dividend yield are observed
when managers hold a higher percentage of firm shares. The coefficient is 0.363 (p<0.05) on
managerial ownership. The possible explanation could be the remuneration of the managers is
linked to the amount of dividend. The shareholders use the compensation contract to induce
managers to distribute more of their available earnings or cash as dividends when there are less
positive NPV projects.
The result show higher bank ownership induce higher dividend yield. The coefficient is 0.122
(p<0.05) on bank ownership. The coefficient on non-bank ownership and business ownership are
0.043 and 0.029 respectively. Both are insignificant. The significantly positive sign of bank
ownership is not expected. The possible explanation is that bank investors reduce agency costs
not directly by monitoring the management of the firms, but by forcing the firms to raise outside
equity regularly which subjects them to the scrutiny of the capital markets. It is also consistent
with the Aoki (1988, pp.127-142), which suggests that the banks would prefer client firms to be
more generous in their dividend payments. (The OLS method show a little different results. The
coefficient on non-bank ownership and business ownership are significant negative. The
coefficient on bank ownership is positive but insignificant. Since there may be endogenous
variable problem with OLS, we trust the results of 2SLS).
For high-growth firms, the coefficient is 0.019 on managerial ownership, -0.009 on bank

-16-
ownership, 0.005 on non-bank ownership and -0.002 on business ownership respectively, but all
are insignificant.
Most of control variables have signs in line with expectations. The coefficient on leverage ratio
is -0.011 (insignificant) for low-growth firms, 0.044 (p<0.01) for high-growth firms. These
finding suggest that there is substitution between dividend payout and leverage ratio in
controlling free cash flow problems for low-growth firms, but not for high growth firms.
Significantly negative coefficient on the investment, -0.719(p<0.05) for low-growth firms,
-0.125(p<0.05) for high-growth firms, indicates that firms have to choose between dividend
payments and investments.
The dividend increases as a function of firm size, with 0.002 (insignificant) for low-growth firms
and 0.001(insignificant) for high-growth firms. This supports the view that firms avoid the
commitment to higher dividends when the external financing cost is high. It also suggests that
larger firms have higher agency costs and relatively lower transaction cost than small firms.
The exceptions are the negative coefficient on profitability and positive coefficients on volatility
of profitability and Keiretsu for the low-growth firms. All are insignificant.
5.2 The results of one year lag
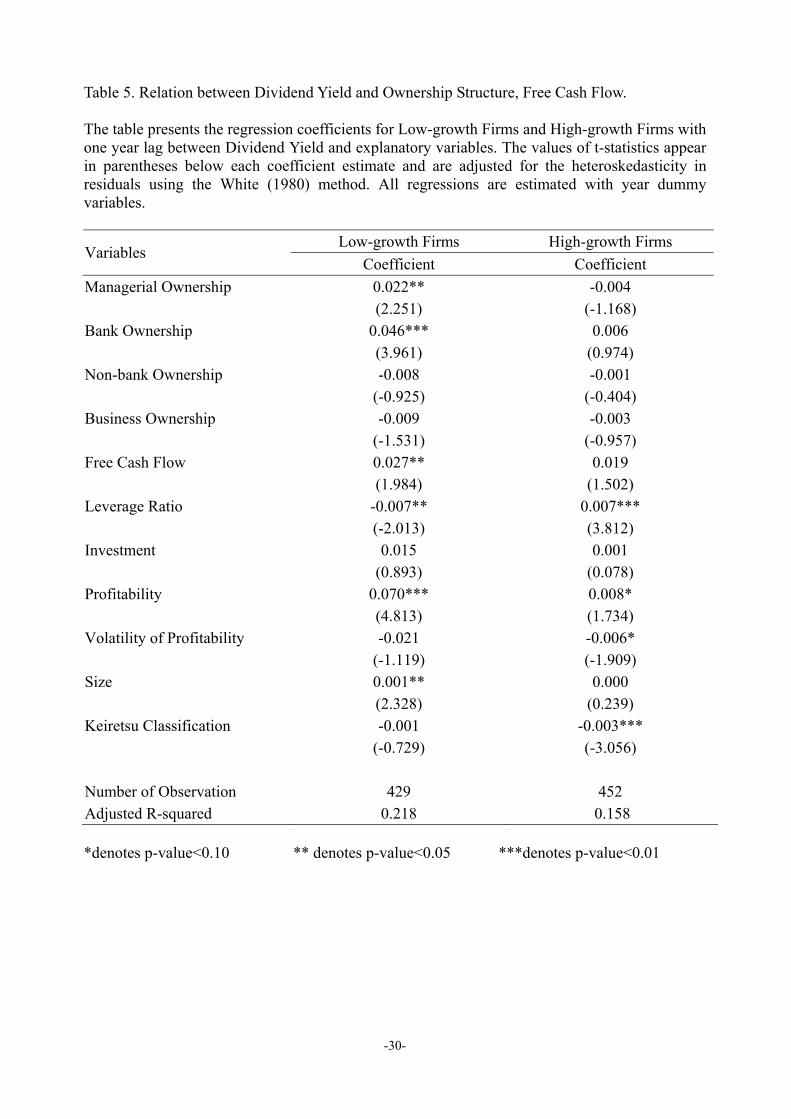
The results for regression using lagged dependent variable for the year 1992 to 1999 are reported
in Table 5. The results show that for the low-growth firms, the free cash flow is significantly and
positively related with the dividend yield. Managerial ownership and bank ownership have
significant positive influence on the dividend yield. They are similar to the results of 2SLS.
For the high-growth firms, the free cash flow is positively related with the dividend yield but
insignificant. The managerial ownership, non-bank ownership and business ownership are
negatively related with the dividend yield while the bank ownership is positively related with
dividend yield. All the results are insignificant.
The coefficient on Leverage ratio suggest that there is substitution between dividend payout and
leverage ratio in controlling free cash flow problems for low-growth firms, but not for high
growth firms.
The positive coefficient on the Profitability indicates that firms generating more earnings pay
higher dividends.
The dividend is inversely related to Volatility of Profitability. In line with the argument that
managers are reluctant to cut dividends (e.g. Kalay, 1980). Firms with unstable earnings pay out
less in dividends in an attempt to both keep their dividend payment stable and avoid the cost
external financing.
The positive sign on size supports the view that firms avoid the commitment to higher dividends

-17-
when the external financing cost is high.
The negative signs for the Keiretsu Classification are consistent with the expectations that
keiretsu firms pay lower dividends.
The exception is the positive coefficient on investment, which is insignificant.
6. Regressing Results of Managerial Ownership and Dividend Payout by Growth Opportunities
and Keiretsu Classification.
Previous empirical studies suggest that there exit two distinct systems of corporate governance
between the independent firms and the keiretsu members. The independent firms are much more
similar to U.S. firms in their arms-length relationships with financiers and trading partners. The
weaker ties that exist between independent firms and their stakeholders suggest that methods of
monitoring and influencing management may rely more directly on the size of the shareholder’s
equity holdings, as is the case in the U.S. Hence further test are conducted to examine the role of
keiretsu vs. non-keiretsu firms.
6.1 Descriptive statistics
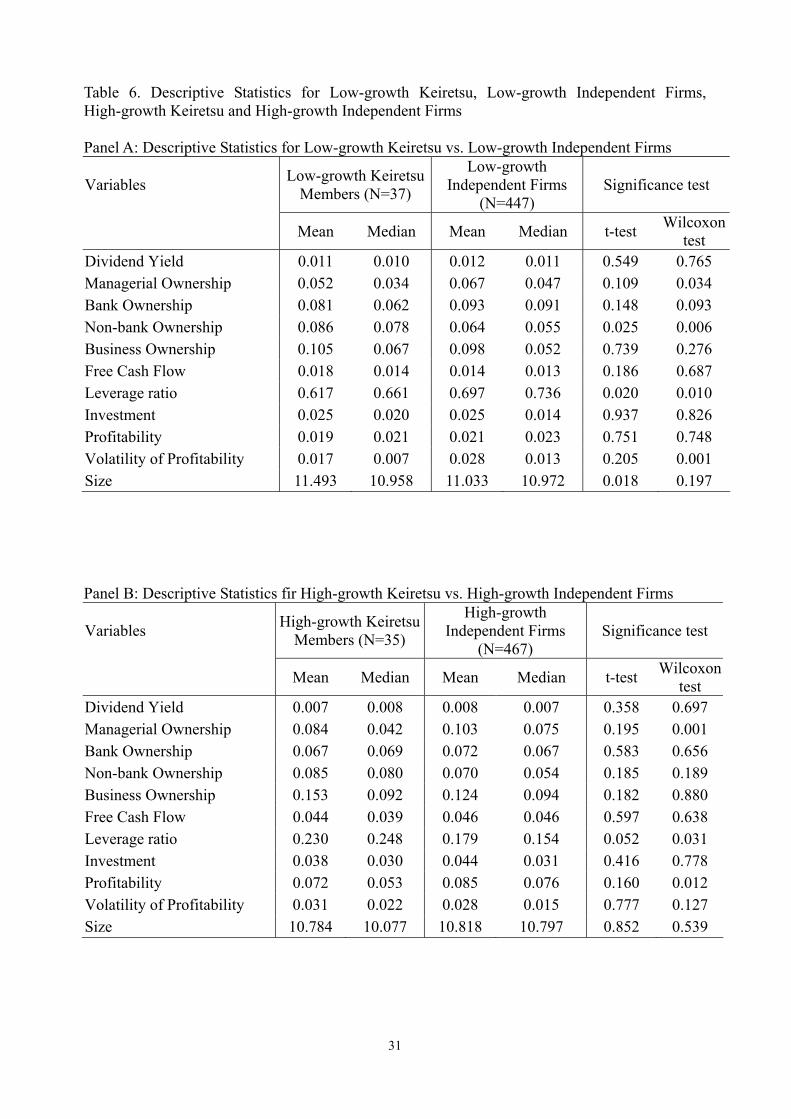
Table 6 shows the comparison of firm characteristics for the four kinds of firms. The column 1
identifies the variables used in the study, the column 2 through 5 provide statistics for the two
subsamples compared. The column 6 to 7 reports the p-value for the difference of means test
between the two kinds of firms. The column 6 is based on the t-test and the column 7 is based on
the Wilcoxon two-sample test. If both p-values are less than 0.10, we identify the difference as
significant.
The panel A compares the low-growth keiretsu firms vs. low-growth independent firms. The
mean (median) of non-bank ownership for low-growth keiretsu firms is 0.086(0.078), compared
to 0.064(0.055) for independent firms. The mean (median) of Leverage ratio for low-growth
keiretsu firms is 0.617(0.661), compared to 0.697(0.736) for independent firms. The differences
are significant. The differences between the other variables are not significant.
The panel B compares the high-growth keiretsu firms vs. high-growth independent firms. The
mean (median) of leverage for high-growth keiretsu firms is 0.230(0.248), compared to
0.179(0.154) for independent firms. The differences are significant.
Panel C compares the low-growth Keiretsu firms and high-growth Keiretsu firms. The
differences in dividend yield, Free Cash Flow, Leverage ratio, Investment, Profitability, Volatility
of Profitability and Size are significant. The mean (median) of Dividend Yield for low-growth
Keiretsu firms is 0.011(0.010), compared to 0.007(0.008) for high-growth firms. The mean
(median) of Free Cash Flow for low-growth Keiretsu firms is 0.018(0.014), compared to
0.044(0.039) for high-growth firms. The mean (median) of leverage for low-growth Keiretsu
-18-
firms is 0.617(0.661), compared to 0.230 (0.248) for high-growth firms. The mean (median) of
Investment for low-growth Keiretsu firms is 0.025(0.020), compared to 0.038(0.030) for
high-growth firms. The mean (median) of Profitability for low-growth Keiretsu firms is
0.019(0.021), compared to 0.072(0.053) for high-growth firms. The mean (median) of Volatility
of Profitability for low-growth Keiretsu firms is 0.017(0.007), compared to 0.031(0.022) for
high-growth firms. The mean (median) of Size opportunities for low-growth Keiretsu firms is
11.493(10.958), compared to 10.784(10.077) for high-growth firms.
Panel D compare the low-growth independent firms and high-growth independent firms. The
mean (median) of Dividend Yield for low-growth Keiretsu firms is 0.012 (0.011), compared to
0.008(0.007) for high-growth firms. The mean (median) of Managerial Ownership for
low-growth Keiretsu firms is 0.067(0.047), compared to 0.103(0.075) for high-growth firms.
The mean (median) of Bank Ownership for low-growth Keiretsu firms is 0.093 (0.091),
compared to 0.072 (0.067) for high-growth firms. The mean (median) of Business Ownership for
low-growth Keiretsu firms is 0.098 (0.052), compared to 0.124 (0.094) for high-growth firms.
The mean (median) of Free Cash Flow for low-growth Keiretsu firms is 0.014 (0.013), compared
to 0.046 (0.046) for high-growth firms. The mean (median) of leverage for low-growth Keiretsu
firms is 0.697(0.736), compared to 0.179 (0.154) for high-growth firms. The mean (median) of
Investment for low-growth Keiretsu firms is 0.025(0.014), compared to 0.085(0.076) for
high-growth firms. The mean (median) of Profitability for low-growth Keiretsu firms is
0.021(0.023), compared to 0.085 (0.076) for high-growth firms. The mean (median) of Volatility
of Profitability for low-growth Keiretsu firms is 0.028(0.013), compared to 0.028 (0.015) for
high-growth firms. The mean (median) of Size opportunities for low-growth Keiretsu firms is
11.033(10.972), compared to 10.818 (10.797) for high-growth firms.
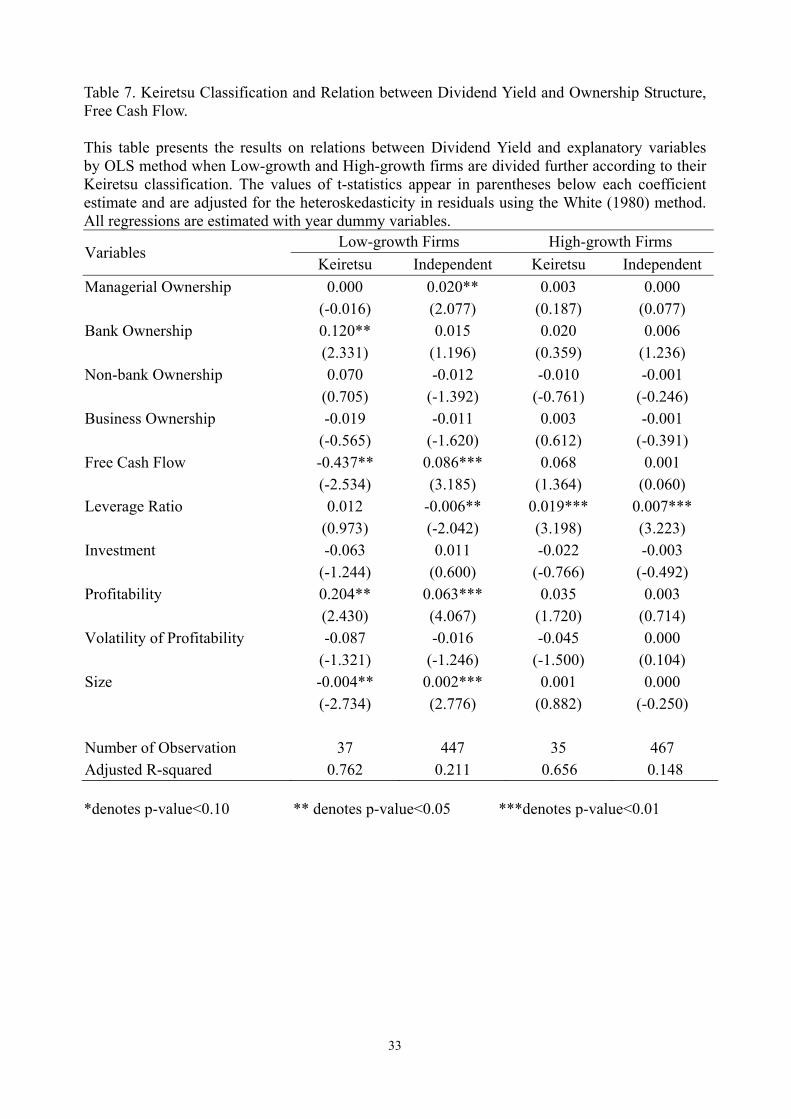
6.2 Regressing results
Further tests are conducted to examine the role of Keiretsu vs. Non-keiretsu firms. As in the
earlier case, three set of regression are run; using the OLS, 2-SLS and lagged dependent variable.
The results are reported in Table 7, Table 8, and Table 9.
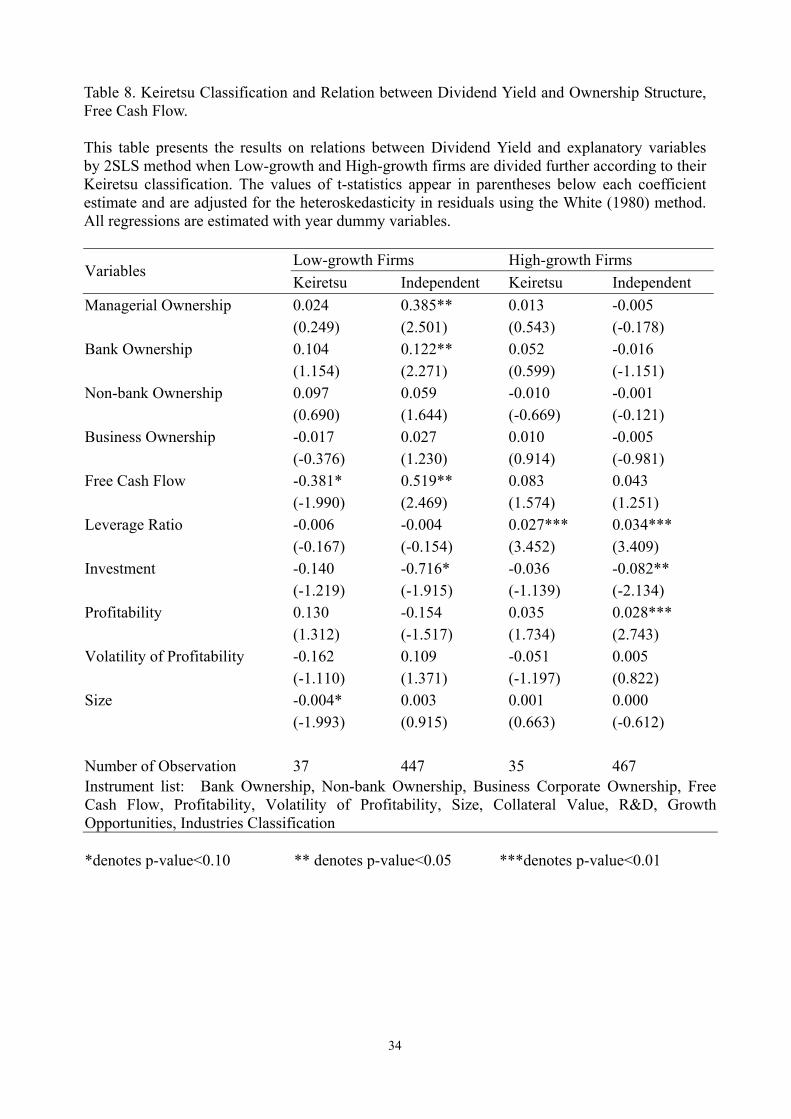
Table 8 presents the estimates of the two stage least square. The results of independent firms are
in principal consistent with the results for the previous ones. The coefficient on free cash flow for
low-growth independent firms is 0.519 (p<0.05), much high than 0.043 (insignificant) for
high-growth firms.( OLS method has the similar results.)
For low-growth independent firms, managerial ownership and bank ownership have very
pronounced effects on dividend yield. The coefficient is 0.385 (p<0.05) and 0.122(p<0.05)
respectively. The coefficient on non-bank ownership and business ownership are insignificant.

-19-
(By the OLS method, only the coefficient of managerial ownership is significantly positive). For
high-growth independent firms, dividend yield is negatively related with the managerial
ownership and institutional ownership. But the results are all insignificant. This suggests the
Low-growth independent firms have greater agency costs of free cash flow and use more
dividends to control the problem. The managers and bank tend to pay more dividends when they
hold more shares. The high-growth independent firms didn’t use the dividend to control the
agency problem.
For the keiretsu firms, a number of deviations are worth noting. For the low-growth keiretsu
firms, the relation between the dividend yield and free cash flow is significantly negative. The
coefficients on managerial ownership, bank and non-bank ownership are positive and
insignificant. The coefficient on business ownership is negative and insignificant. (By OLS
method, the relation between the dividend yield and bank ownership is positive and significant,
which show the bank investors elicit higher dividend for the low-growth keiretsu firms. other
results are similar).
For the high-growth keiretsu firms, the coefficient on free cash flow is positive but insignificant.
The relation between the dividend and ownership variables is all insignificant, which show the
high-growth keiretsu firms didn’t use dividend policy to monitor the problem of free cash flow.
The result of Keiretsu firms doesn’t lend much support to the Hypotheses of free cash flow. The
possible explanation may be that the keiretsu-member firms, face less information asymmetries
and agency conflicts than the independent firms. (Dewenter and Warther, 1998). The backbone of
the free cash flow hypothesis is the agency problem between management and shareholders. In
Keiretsu firms, if the affiliated financial institutions and the major corporate shareholders
monitor the managers effectively, then dividend payments may not be necessary to reduce
managers’ tendency to overinvest free cash flow.
The results for regression using lagged dependent variable for the year 1992 to 1999 are reported
in Table 9, which are similar to that of 2SLS
To control for industry effect, all variables except for the year dummy and keiretsu dummy are
defined as differences from industry means. The results, which are not reported in this paper, are
consistent with the previous findings that dividend payouts are significant related with free cash
flow only for low-growth firms.
7. Conclusions
The purpose of this study is to explore the implications of the Free Cash Flow hypothesis
concerning the disciplinary role of managerial and institutional ownership in corporate dividend

-20-
policy. The investigation is motivated by the work of Rozeff (1982) and Jensen (1986) on
divergence of interests between shareholders and managers over the payout policy. We
consistently observe a positive relation between the dividend yield and the free cash flow,
controlling for leverage, investment, profitability, risk and size. There is also evidence that
relation between the level of free cash flow and dividend payouts are stronger for low-growth
firms. The result suggests that dividend policy appear to be used by Japanese firms to control the
overinvestment problem. Free cash flow hypothesis is to some degree supported.
Results indicate that the sensitivity of managerial and institutional ownership to dividend payouts
depends on growth opportunities. Managerial ownership and institutional ownership appears to
have a very pronounced effect on dividend payout for low-growth firms, while there is no
apparent link for high-growth firms. The impact of managerial ownership on dividend yield is
found to be positive particularly for the low growth firms. This is inconsistent with the view that
the managerial ownership reduces the need for the dividend mechanism, but consistent with
White (1996) and Fenn and Liang (2001). The possible explanation may be the remuneration of
the managers is linked to the amount of dividend. In fact, the executive bonuses are positively
correlated with the dividend policy (Xu, 1997). The result show strong support for a significant
and positive association effect between dividend payout policy and bank ownership for the
low-growth firms. The finding does not support the theory that the institutional ownership
substitute for dividend in controlling overinvestment problem. But the evidence support the
prediction in Zeckhauser and pound (1990), Moh’d, Perry and Rimbey (1995) and Short, Zhang,
and Keasey (2002). An alternative explanation may be that due to less influence of the bank now
in Japan, the level of institutional monitoring is insufficient; hence this influential group of
shareholders pushes for higher payouts to induce capital market monitoring.
Given the specific institutional features of Japanese market, we find that the Keiretsu firms
doesn’t use dividend as a disciplinary mechanism to control the free cash flow problem. The
possible explanation may be that the keiretsu-member firms face less information asymmetries
and agency conflicts than the independent firms because of the close monitoring by the major
corporate shareholders and the affiliated financial institutions.
Overall, this study suggests that the free cash flow theory is relevant to an understanding of
corporate dividend policy in Japan. Conflicts of interest between shareholders and managers over
the payout policy vary with the growth opportunities. But managerial and institutional ownership
did not substitute for dividend in mitigating the agency conflict for companies with more serious
free cash flow problem.
-21-
Reference Agrawal, A., and Jayaraman, N. (1994). "The Dividend Policies of All-Equity Firms: A Direct Test of the Free Cash Flow Theory." Managerial and Decision Economics 15: 139-148. Agrawal, A., and Mandelker, G. N. (1990). " Large shareholders and the monitoring of managers: The case of anti-takeover charter amendments." Journal of Financial and Quantitative Analysis 25: 143-161. Aoki, M., Patrick, H., and Sheard, P. (1994). The Japanese Main Bank System: and Introductory Overview. The Japanese Main Bank System: its Relevance for Developing and Transforming Economies. M. A. a. H. Patrick. New York, Oxford University Press. Berger, P. G., Ofek, E., and Yermack, D. (1997). "Managerial entrenchment and capital structure decisions." Journal of Finance 52: 1411-1438. Berglof, E., and Perotti, E. (1994). "The Governance Structure of the Japanese Financial Keiretsu." Journal of Financial Economics 36: 259-284. Chen, R. C., and Steiner, T. L. (1999). "Managerial Ownership and Agency Conflicts: A Nonlinear Simultaneous Equation Analysis of Managerial Ownership, Risk Taking, Debt Policy and Dividend Policy." Financial Review 34: 119-136. Crutchley, C. E., and Hansen, R.S. (1989). "A Test of the Agency Theory of Managerial Ownership, Corporate Leverage, and Corporate Dividends." Financial Management 18: 36-46. D'Souza, J., and Saxena, A. K. (1999). "Agency cost, market risk, investment opportunities and dividend policy - an international perspective." Managerial Finance 25: 35-44. Dempsey, S. J., and Laber, G. (1992). "Effects of agency and transaction costs on dividend payout ratios: further evidence of the agency-transaction cost hypothesis." The Journal of Financial Research 15: 317-321. Diamond, D. W. (1984). "Financial Intermediation and Delegated Monitoring." Review of Economic Studies 52: 393-414. Easterbrook, F. H. (1984). "Two Agency-cost Explanations of Dividends." American Economic Review 74(650-659). Eckbo, B. E., and Verma, S. (1994). "Managerial Share Ownership, Voting Power, and Cash Dividend Policy." Journal of Corporate Finance 1: 33-62. Farinha, J. (2003). "Dividend policy, corporate governance and the managerial entrenchment hypothesis: an empirical analysis." Journal of business finance and accounting 30): 1173-1209. Fenn, G., and Liang, N. (2001). "Corporate payout policy and managerial stock incentives." Journal of Financial Economics 60: 45-72. Gibson, M. S. (1995). Can bank health affect investment? Evidence from Japan. Journal of Business 68: 281–308.
-22-
Grossman, S. J., and Hart, O. D. (1988). "One Share-One Vote and the Market for Corporate Control." Journal of Financial Economics. 20: 175-203. Gul, F. A. (1999). "Growth opportunities, capital structure and dividend policies in Japan." Journal of Corporate Finance 5: 141-168. Holder, M. E., Langrehr, F. W., and Hexter, J. L. (1998). "Dividend policy determinants: an investigation of the influences of stakeholder theory." Financial Management 27: 73-82. Hoshi, T., Kashyap, A., and Sharfstein, D. (1990). "The Role of Banks in Reducing the Costs of Financial Distress in Japan." Journal of Financial Economics 27: 67-88. Hoshi, T., Kashyap, A., and Sharfstein, D. (1991). "Corporate Structure, Liquidity, and Investment: Evidence from Japanese Industrial Groups." Quarterly Journal of Economics 106: 33-60. Jensen, G. R., Solberg, D.P., and Zorn, T.S. (1992). "Simultaneous Determination of Insider Ownership, Debt, and Dividend Policies." Journal of Financial and Quantitative Analysis 27: 247-263. Jensen, M. C. (1986). "Agency Cost of Free Cash Flow, Corporate Finance, and Takeovers." American Economic Review 76(323-329). Jensen, M. C., and Meckling, W.H. (1976). "Theory of the Firm: Managerial Behavior, Agency Cost and Ownership Structure." Journal of Financial Economics 3: 305-360. Johnson, S. A. (1995). "Dividend Payout and the Valuation Effects of Bond Announcements." Journal of Financial and Quantitative Analysis 30: 407-423. Kang, J. K., and Shivdasani, A. (1999). "Alternative Mechanism for Corporate Governance in Japan: an Analysis of Independent and Bank-affiliated Firms." Pacific-Basin Finance Journal 7: 1-22. Kang, J. K., and Stulz, R. (2000). "Do Banking Shocks Affect Borrowing Firm Performance? Analysis of the Japanese Experience." Journal of Business 73: 1-23. Kaplan, S., and Minton, B.A. (1994). "Appointments of Outsiders to Japanese Boards: Determinants and Implications for Managers." Journal of Financial Economics 36: 225-258. McConnell, J., and Servaes, H. (1990). "Additional Evidence on Equity Ownership and Corporate Value." Journal of Financial Economics 27: 595-612. Michaely, R., and Shaw,W. (1994). "The Pricing of Initial Public Offerings: Tests of the Adverse Selection and Signaling Theories." Review of Financial Studies 7: 279-320. Miller, M., and Modigliani, F. (1961). "Dividend Policy, Growth and the Valuation of Shares." Journal of Business 34: 411-433. Moh'd, M., Perry, L., and Rimbey, J. (1994). "An Investigation of the Dynamic Relationship between Agency Theory and Dividend Policy." Financial Review 30: 367-385.
-23-
Morck, R., and Nakamura, M. (1999). "Banks and Corporate Control in Japan." Journal of Finance 54: 319-339. Morck, R., Shleifer A., and Vishny, R. (1988). "Management Ownership and Corporate Performance: An Empirical Analysis." Journal of Financial Economics 20: 293-315. Nakatani (1984). “The Economic Role of Financial Corporate Grouping” in M. Aoki, ed.: “The Economic Analysis of the Japanese Firm.” North Hollank, 227-258. Opler, T., and Titman, S. (1993). "The Determinants of Leverage Buyout Activity: Free Cash Flow versus Financial Distress Costs." Journal of Finance 48: 1985-1999. Pound, J. (1988). "Proxy contests and the efficiency of shareholder oversight." Journal of Financial Economics 20: 237-265. Prowse, S. (1990). "Institutional Investment Patterns and Corporate Financial Behavior in the United States and Japan." Journal of Financial Economics 27: 43-66. Rajan, R. (1992). "Insiders and Outsiders: the Choice between Relationship and Arm's Length Debt." Journal of Finance 47: 1367-1400. Rozeff, M. S. (1982). "Growth, Beta and Agency Costs as Determinants of Dividend Payout Ratios." Journal of Financial Research 3: 249-259. Schooley, D. K., and Barney, L.D. (1994). "Using Dividend Policy and Managerial Ownership to Reduce Agency Costs." Journal of Financial Research 17: 363-373. Shleifer A. and Vishny, R. (1986). "Large Shareholders and Corporate Control." Journal of Political Economy 94: 461-488. Shleifer A., a. V., R. (1989). "Management Entrenchment: The Case of Manager-specific Investment." Journal of Financial Economics 25: 123-140. Short, H., Zhang H., and Keasey,K. (2002). "The link between dividend policy and institutional ownership." Journal of Corporate Finance 8: 105-122. Smith, C. W., and Watts, R.L. (1992). "The Investment Opportunity Set and Corporate Financing, Dividend, and Compensation Policies." Journal of Financial Economics 32: 263-292. Weinstein, D. E., and Yafeh, Y. (1998). "On the Costs of a Bank Centered Financial System: Evidence from the Changing Main Bank Relations in Japan." Journal of Finance 53: 635-762. White, L. (1996). "Executive Compensation and Dividend Policy." Journal of Corporate Finance 2: 335-358. Zeckhauser, R., and Pound, J. (1990). Are large shareholders effective monitors? an investigation of share ownership and corporate performance. Asymmetric Information, Corporate Finance, and Investment. R. G. Hubbard. Chicago, University of Chicago Press.

-24-
Table 1. Year Industry and Keiretsu Distribution for low-growth and High-growth Firms Panel A: Sample Distribution by Year
Low-growth firms High-growth firms Year
Number Percent Number Percent 1992 49 10.12 48 9.56 1993 55 11.36 55 10.96 1994 53 10.95 51 10.16 1995 57 11.78 45 8.96 1996 65 13.43 61 12.15 1997 56 11.57 58 11.55 1998 44 9.09 73 14.54 1999 48 9.92 62 12.35 2000 57 11.78 49 9.76 Total 484 100 502 100

-25-
Panel B: Sample Distribution by Industry Low-growth firms High-growth firms Industry
code Industry Name Count Percent Count Percent
CONSTRUCTION 201 Construction 123 25.41 15 2.99 sub total 123 25.41 15 2.99
MANUFACTURING 301 Foods 13 2.69 35 6.97 302 Textile 16 3.31 2 0.4 303 Pulp and Paper 6 1.24 304 Chemicals 23 4.75 46 9.16 306 Petroleum 4 0.83 5 1 307 Glass and Ceramics 8 1.65 6 1.2 308 Iron and Steel 6 1.24 7 1.39 309 Nonferrous Metals 11 2.27 3 0.6 310 Metal Products 26 5.37 2 0.4 311 Machinery 43 8.88 35 6.97 312 Electric Machinery 17 3.51 99 19.72
313 Transportation Equipment 13 2.69 7 1.39
314 Precision Equipment 9 1.86 12 2.39 315 Other Manufacturing 13 2.69 61 12.15 sub total 208 42.98 320 63.74
WHOLESALE AND RETAIL 401 Wholesale 73 15.08 18 3.59 402 Retail 34 7.02 71 14.14 sub total 107 22.1 89 17.73
REAL ESTATE 601 Real Estate 23 4.75 2 0.4 sub total 23 4.75 2 0.4
TRANSPORTATION AND COMMUNICATION 701 Land Transportation 2 0.41 1 0.2 702 Shipping 2 0.41 4 0.8
704 Warehousing and Wharfing 6 1.24 1 0.2
sub total 10 2.06 6 1.2 SERVICES
901 Services 13 2.69 70 13.94 sub total 13 2.69 70 13.94 Total 484 100 502 100
-26-
Panel C: Sample Distribution by Keiretsu
Low-growth Firms High-growth Firms Identity
Count Percent Count Percent Independent Firms 447 92.36 467 93.03 Keiretsu Firms 37 7.64 35 6.97 Total 484 100 502 100
-27-
Table 2. Descriptive Statistics for Low-growth and High-growth Firms
Low-growth Firms (N=484) High-growth Firms (N=502) Significance Test * Variables
Mean Median Maximum Minimum Std. Mean Median Maximum Minimum Std. t-test Wilcoxon test
Dividend Yield 0.012 0.011 0.084 0.000 0.012 0.008 0.007 0.058 0.000 0.005 0.000 0.000 Managerial Ownership 0.066 0.046 0.399 0.007 0.055 0.102 0.072 0.534 0.006 0.082 0.000 0.000 Bank Ownership 0.092 0.090 0.252 0.000 0.049 0.072 0.067 0.217 0.000 0.049 0.000 0.000 Non-bank Ownership 0.066 0.058 0.370 0.000 0.056 0.071 0.055 0.412 0.000 0.065 0.174 0.542 Business Ownership 0.099 0.054 0.586 0.000 0.113 0.126 0.094 0.605 0.000 0.124 0.000 0.000 Free Cash Flow 0.014 0.013 0.077 -0.063 0.021 0.045 0.046 0.077 0.010 0.017 0.000 0.000 Leverage ratio 0.691 0.729 1.151 -0.329 0.201 0.182 0.163 0.694 -0.272 0.150 0.000 0.000 Investment 0.025 0.014 0.256 0.000 0.031 0.043 0.030 0.281 -0.030 0.040 0.000 0.000 Profitability 0.021 0.023 0.149 -0.202 0.040 0.085 0.076 0.377 -0.059 0.054 0.000 0.000 Volatility of Profitability 0.027 0.013 0.433 0.001 0.051 0.028 0.015 0.426 0.001 0.058 0.759 0.174 Size 11.068 10.968 14.669 7.846 1.142 10.816 10.796 13.604 7.961 1.041 0.000 0.001
-28-
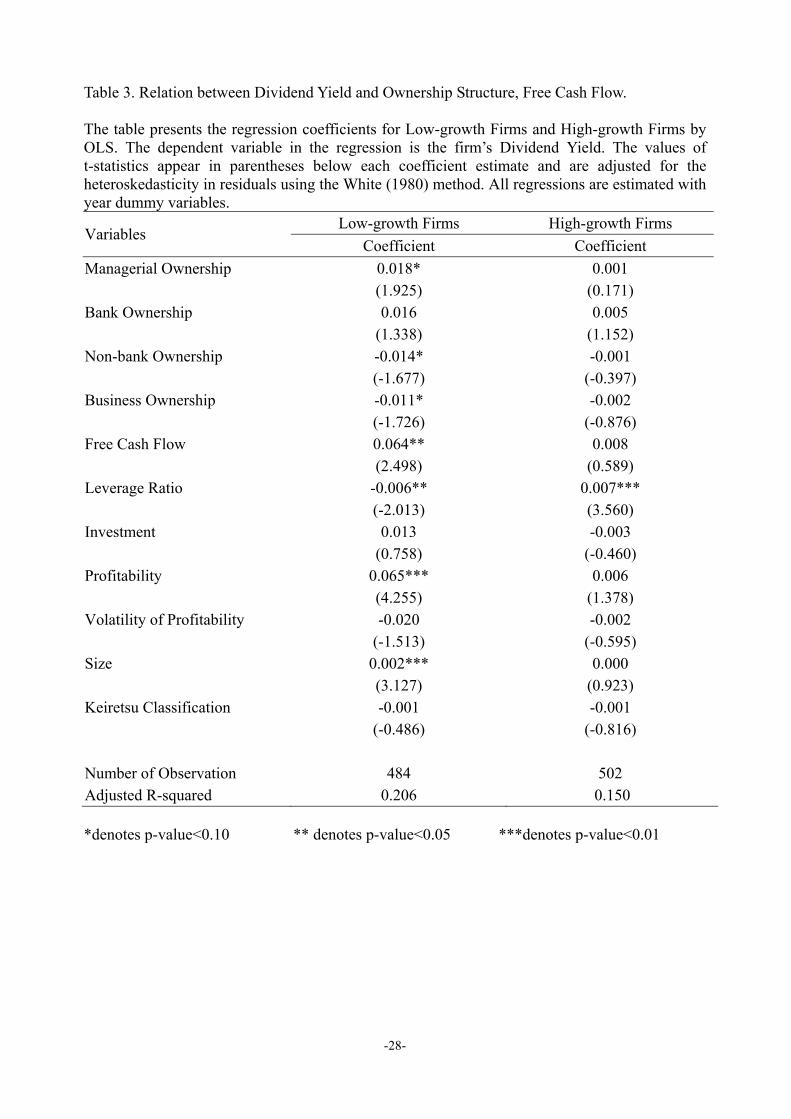
Table 3. Relation between Dividend Yield and Ownership Structure, Free Cash Flow. The table presents the regression coefficients for Low-growth Firms and High-growth Firms by OLS. The dependent variable in the regression is the firm’s Dividend Yield. The values of t-statistics appear in parentheses below each coefficient estimate and are adjusted for the heteroskedasticity in residuals using the White (1980) method. All regressions are estimated with year dummy variables.
Low-growth Firms High-growth Firms Variables
Coefficient Coefficient Managerial Ownership 0.018* 0.001 (1.925) (0.171) Bank Ownership 0.016 0.005 (1.338) (1.152) Non-bank Ownership -0.014* -0.001 (-1.677) (-0.397) Business Ownership -0.011* -0.002 (-1.726) (-0.876) Free Cash Flow 0.064** 0.008 (2.498) (0.589) Leverage Ratio -0.006** 0.007*** (-2.013) (3.560) Investment 0.013 -0.003 (0.758) (-0.460) Profitability 0.065*** 0.006 (4.255) (1.378) Volatility of Profitability -0.020 -0.002 (-1.513) (-0.595) Size 0.002*** 0.000 (3.127) (0.923) Keiretsu Classification -0.001 -0.001 (-0.486) (-0.816) Number of Observation 484 502 Adjusted R-squared 0.206 0.150 *denotes p-value<0.10 ** denotes p-value<0.05 ***denotes p-value<0.01
-29-
Table 4. Relation between Dividend Yield and Ownership Structure, Free Cash Flow. The table presents the regression coefficients for Low-growth Firms and High-growth Firms by 2SLS. The dependent variable in the regression is the firm’s Dividend Yield. The values of t-statistics appear in parentheses below each coefficient estimate and are adjusted for the heteroskedasticity in residuals using the White (1980) method. All regressions are estimated with year dummy variables.
Low-growth Firms High-growth Firms Variables
Coefficient Coefficient Managerial Ownership 0.363** 0.019 (2.443) (0.374) Bank Ownership 0.122** -0.009 (2.348) (-0.387) Non-bank Ownership 0.043 0.005 (1.365) (0.285) Business Ownership 0.029 -0.002 (1.387) (-0.277) Free Cash Flow 0.443** 0.083 (2.565) (1.439) Leverage Ratio -0.011 0.044*** (-0.441) (2.836) Investment -0.719** -0.125** (-2.307) (-1.990) Profitability -0.156 0.025 (-1.608) (1.531) Volatility of Profitability 0.098 0.005 (1.369) (0.525) Size 0.002 0.001 (0.967) (0.703) Keiretsu Classification 0.001 -0.002 (0.215) (-1.633) Number of Observation 484 502 Instrument list: Bank Ownership, Non-bank Ownership, Business Corporate Ownership, Free Cash Flow, Profitability, Volatility of Profitability, Size, Collateral Value, R&D, Growth Opportunities, Keiretsu Classification, Industries Classification *denotes p-value<0.10 ** denotes p-value<0.05 ***denotes p-value<0.01
-30-
Table 5. Relation between Dividend Yield and Ownership Structure, Free Cash Flow. The table presents the regression coefficients for Low-growth Firms and High-growth Firms with one year lag between Dividend Yield and explanatory variables. The values of t-statistics appear in parentheses below each coefficient estimate and are adjusted for the heteroskedasticity in residuals using the White (1980) method. All regressions are estimated with year dummy variables.
Low-growth Firms High-growth Firms Variables
Coefficient Coefficient Managerial Ownership 0.022** -0.004 (2.251) (-1.168) Bank Ownership 0.046*** 0.006 (3.961) (0.974) Non-bank Ownership -0.008 -0.001 (-0.925) (-0.404) Business Ownership -0.009 -0.003 (-1.531) (-0.957) Free Cash Flow 0.027** 0.019 (1.984) (1.502) Leverage Ratio -0.007** 0.007*** (-2.013) (3.812) Investment 0.015 0.001 (0.893) (0.078) Profitability 0.070*** 0.008* (4.813) (1.734) Volatility of Profitability -0.021 -0.006* (-1.119) (-1.909) Size 0.001** 0.000 (2.328) (0.239) Keiretsu Classification -0.001 -0.003*** (-0.729) (-3.056) Number of Observation 429 452 Adjusted R-squared 0.218 0.158 *denotes p-value<0.10 ** denotes p-value<0.05 ***denotes p-value<0.01
31
Table 6. Descriptive Statistics for Low-growth Keiretsu, Low-growth Independent Firms, High-growth Keiretsu and High-growth Independent Firms Panel A: Descriptive Statistics for Low-growth Keiretsu vs. Low-growth Independent Firms
Variables Low-growth Keiretsu Members (N=37)
Low-growth Independent Firms
(N=447) Significance test
Mean Median Mean Median t-test Wilcoxon test
Dividend Yield 0.011 0.010 0.012 0.011 0.549 0.765 Managerial Ownership 0.052 0.034 0.067 0.047 0.109 0.034 Bank Ownership 0.081 0.062 0.093 0.091 0.148 0.093 Non-bank Ownership 0.086 0.078 0.064 0.055 0.025 0.006 Business Ownership 0.105 0.067 0.098 0.052 0.739 0.276 Free Cash Flow 0.018 0.014 0.014 0.013 0.186 0.687 Leverage ratio 0.617 0.661 0.697 0.736 0.020 0.010 Investment 0.025 0.020 0.025 0.014 0.937 0.826 Profitability 0.019 0.021 0.021 0.023 0.751 0.748 Volatility of Profitability 0.017 0.007 0.028 0.013 0.205 0.001 Size 11.493 10.958 11.033 10.972 0.018 0.197 Panel B: Descriptive Statistics fir High-growth Keiretsu vs. High-growth Independent Firms
Variables High-growth Keiretsu Members (N=35)
High-growth Independent Firms
(N=467) Significance test
Mean Median Mean Median t-test Wilcoxon test
Dividend Yield 0.007 0.008 0.008 0.007 0.358 0.697 Managerial Ownership 0.084 0.042 0.103 0.075 0.195 0.001 Bank Ownership 0.067 0.069 0.072 0.067 0.583 0.656 Non-bank Ownership 0.085 0.080 0.070 0.054 0.185 0.189 Business Ownership 0.153 0.092 0.124 0.094 0.182 0.880 Free Cash Flow 0.044 0.039 0.046 0.046 0.597 0.638 Leverage ratio 0.230 0.248 0.179 0.154 0.052 0.031 Investment 0.038 0.030 0.044 0.031 0.416 0.778 Profitability 0.072 0.053 0.085 0.076 0.160 0.012 Volatility of Profitability 0.031 0.022 0.028 0.015 0.777 0.127 Size 10.784 10.077 10.818 10.797 0.852 0.539

32
Panel C: Descriptive Statistics for Low-growth Keiretsu vs. High-growth Keiretsu Firms
Variables Low-growth Keiretsu Members (N=37)
High-growth Keiretsu Members (N=35) Significance test
Mean Median Mean Median t-test Wilcoxon test
Dividend Yield 0.011 0.010 0.007 0.008 0.048 0.080 Managerial Ownership 0.052 0.034 0.084 0.042 0.094 0.189 Bank Ownership 0.081 0.062 0.067 0.069 0.212 0.265 Non-bank Ownership 0.086 0.078 0.085 0.080 0.961 0.770 Business Ownership 0.105 0.067 0.153 0.092 0.135 0.604 Free Cash Flow 0.018 0.014 0.044 0.039 0.000 0.000 Leverage ratio 0.617 0.661 0.230 0.248 0.000 0.000 Investment 0.025 0.020 0.038 0.030 0.057 0.029 Profitability 0.019 0.021 0.072 0.053 0.000 0.000 Volatility of Profitability 0.017 0.007 0.031 0.022 0.097 0.002 Size 11.493 10.958 10.784 10.077 0.074 0.073 Panel D: Descriptive Statistics for Low-growth Independent vs. High-growth Independent Firms
Variables Low-growth
Independent Firms (N=447)
High-growth Independent Firms
(N=467) Significance test
Mean Median Mean Median t-test Wilcoxon test
Dividend Yield 0.012 0.011 0.008 0.007 0.000 0.000 Managerial Ownership 0.067 0.047 0.103 0.075 0.000 0.000 Bank Ownership 0.093 0.091 0.072 0.067 0.000 0.000 Non-bank Ownership 0.064 0.055 0.070 0.054 0.145 0.384 Business Ownership 0.098 0.052 0.124 0.094 0.001 0.000 Free Cash Flow 0.014 0.013 0.046 0.046 0.000 0.000 Leverage ratio 0.697 0.736 0.179 0.154 0.000 0.000 Investment 0.025 0.014 0.044 0.031 0.000 0.000 Profitability 0.021 0.023 0.085 0.076 0.000 0.000 Volatility of Profitability 0.028 0.013 0.028 0.015 0.995 0.703 Size 11.033 10.972 10.818 10.797 0.002 0.003
33
Table 7. Keiretsu Classification and Relation between Dividend Yield and Ownership Structure, Free Cash Flow. This table presents the results on relations between Dividend Yield and explanatory variables by OLS method when Low-growth and High-growth firms are divided further according to their Keiretsu classification. The values of t-statistics appear in parentheses below each coefficient estimate and are adjusted for the heteroskedasticity in residuals using the White (1980) method. All regressions are estimated with year dummy variables.
Low-growth Firms High-growth Firms Variables
Keiretsu Independent Keiretsu Independent Managerial Ownership 0.000 0.020** 0.003 0.000 (-0.016) (2.077) (0.187) (0.077) Bank Ownership 0.120** 0.015 0.020 0.006 (2.331) (1.196) (0.359) (1.236) Non-bank Ownership 0.070 -0.012 -0.010 -0.001 (0.705) (-1.392) (-0.761) (-0.246) Business Ownership -0.019 -0.011 0.003 -0.001 (-0.565) (-1.620) (0.612) (-0.391) Free Cash Flow -0.437** 0.086*** 0.068 0.001 (-2.534) (3.185) (1.364) (0.060) Leverage Ratio 0.012 -0.006** 0.019*** 0.007*** (0.973) (-2.042) (3.198) (3.223) Investment -0.063 0.011 -0.022 -0.003 (-1.244) (0.600) (-0.766) (-0.492) Profitability 0.204** 0.063*** 0.035 0.003 (2.430) (4.067) (1.720) (0.714) Volatility of Profitability -0.087 -0.016 -0.045 0.000 (-1.321) (-1.246) (-1.500) (0.104) Size -0.004** 0.002*** 0.001 0.000 (-2.734) (2.776) (0.882) (-0.250) Number of Observation 37 447 35 467 Adjusted R-squared 0.762 0.211 0.656 0.148 *denotes p-value<0.10 ** denotes p-value<0.05 ***denotes p-value<0.01
34
Table 8. Keiretsu Classification and Relation between Dividend Yield and Ownership Structure, Free Cash Flow. This table presents the results on relations between Dividend Yield and explanatory variables by 2SLS method when Low-growth and High-growth firms are divided further according to their Keiretsu classification. The values of t-statistics appear in parentheses below each coefficient estimate and are adjusted for the heteroskedasticity in residuals using the White (1980) method. All regressions are estimated with year dummy variables.
Low-growth Firms High-growth Firms Variables
Keiretsu Independent Keiretsu Independent Managerial Ownership 0.024 0.385** 0.013 -0.005 (0.249) (2.501) (0.543) (-0.178) Bank Ownership 0.104 0.122** 0.052 -0.016 (1.154) (2.271) (0.599) (-1.151) Non-bank Ownership 0.097 0.059 -0.010 -0.001 (0.690) (1.644) (-0.669) (-0.121) Business Ownership -0.017 0.027 0.010 -0.005 (-0.376) (1.230) (0.914) (-0.981) Free Cash Flow -0.381* 0.519** 0.083 0.043 (-1.990) (2.469) (1.574) (1.251) Leverage Ratio -0.006 -0.004 0.027*** 0.034*** (-0.167) (-0.154) (3.452) (3.409) Investment -0.140 -0.716* -0.036 -0.082** (-1.219) (-1.915) (-1.139) (-2.134) Profitability 0.130 -0.154 0.035 0.028*** (1.312) (-1.517) (1.734) (2.743) Volatility of Profitability -0.162 0.109 -0.051 0.005 (-1.110) (1.371) (-1.197) (0.822) Size -0.004* 0.003 0.001 0.000 (-1.993) (0.915) (0.663) (-0.612) Number of Observation 37 447 35 467 Instrument list: Bank Ownership, Non-bank Ownership, Business Corporate Ownership, Free Cash Flow, Profitability, Volatility of Profitability, Size, Collateral Value, R&D, Growth Opportunities, Industries Classification *denotes p-value<0.10 ** denotes p-value<0.05 ***denotes p-value<0.01

35
Table 9. Keiretsu Classification and Relation between Dividend Yield and Ownership Structure, Free Cash Flow. This table presents the results on relations between Dividend Yield and explanatory variables with one year lag between them. The Low-growth and High-growth firms are divided further according to their Keiretsu classification. The values of t-statistics appear in parentheses below each coefficient estimate and are adjusted for the heteroskedasticity in residuals using the White (1980) method. All regressions are estimated with year dummy variables.
Low-growth Firms High-growth Firms Variables
Keiretsu Independent Keiretsu Independent Managerial Ownership -0.065 0.023** -0.003 -0.004 (-1.526) (2.290) (-0.169) (-1.013) Bank Ownership 0.027 0.045*** 0.047 0.007 (0.618) (3.561) (0.568) (1.079) Non-bank Ownership -0.082 -0.008 0.008 -0.001 (-1.336) (-0.950) (0.348) (-0.356) Business Ownership -0.076*** -0.009 -0.001 -0.002 (-2.985) (-1.465) (-0.078) (-0.563) Free Cash Flow -0.039 0.032** -0.041 0.023 (-0.326) (2.291) (-0.799) (1.563) Leverage Ratio 0.021** -0.008** 0.011* 0.007*** (2.426) (-2.386) (1.767) (3.519) Investment 0.003 0.014 0.022 -0.001 (0.074) (0.755) (0.904) (-0.160) Profitability 0.008 0.072*** 0.039 0.007 (0.133) (4.587) (1.039) (1.468) Volatility of Profitability -0.140** -0.018 -0.064 -0.003 (-2.089) (-0.936) (-1.537) (-0.957) Size -0.001 0.001** 0.000 0.000 (-0.703) (2.061) (-0.120) (-0.912) Number of Observation 39 390 39 413 Adjusted R-squared 0.642 0.220 0.456 0.122 *denotes p-value<0.10 ** denotes p-value<0.05 ***denotes p-value<0.01