Embed Size (px)
Citation preview

E-Leader Budapest 2010
1
The Impact of Organizational Culture on Innovation Management Léo F. C. Bruno, Ph.D Professor of Leadership Fundação Dom Cabral, Brazil Abstract The study sought to investigate the impact of the Organizational Culture, personal values profile (micro-culture) of the involved executives and organizations’ culture (mezzo-culture) of the analyzed organizations, on the management of innovation. A sample of 400 executives of 48 organizations was selected, involving large and medium size ones of several segments having product and service development activities. Four closed instruments were applied, being two of them Likert type (opinion) – personal values and organization cultural traits inventories, and the other two of diagnosis type – innovation essential internal conditions (enablers) and customer-oriented processes. In the case of the last two instruments the Delphi technique was used for data gathering, leading to the value innovation index of each researched organizations. The results have shown an unbalance on the personal values profile of the involved executives, showing a typical managers´ profile, rather then a leaders’ one, as well as an inadequate average organization cultural index, both results negative as far as innovation activities are concerned. On the other hand the study showed a moderate to high positive relation between personal values balance and the organization cultural adequacy index, being these two variables positively related with the value innovation index of the involved organizations as depicted by the findings. Key-words: innovation, personal values, organizational culture, leadership and value innovation index. INTRODUCTION AND LITERATURE REVIEW 1.Values Many personal aspects will interact to determine the actions of a person in a leadership role. Perceptions, attitudes, motivations, personality, skills, knowledge, experience, confidence, and commitment are a few of the variables which are important for understanding the behavior of people. They are no less important for understanding the behavior of people at work, whether they are leaders or not. However, this study will highlight what may well be the crucial and underlying determinant of leaders’ behavior - values. According to Spranger (1928), an early and influential writer, values are defined as the constellation of likes, dislikes, viewpoints, shoulds, inner inclinations, rational and irrational judgments, prejudices, and association patterns that determine a person’s view of the world. The importance of a value system is that once internalized it becomes, consciously or subconsciously, a standard or criterion for guiding one’s action. Thus the study of leaders’ values is extremely important to the study of leadership. A number of studies have been done to uncover the values leaders and managers actually have. The most influential theory is based upon the thinking of Spranger (1928) who defined several types of value orientation as shown in Table 1, and has been

E-Leader Budapest 2010
2
developed by Guth and Tagiuri (1965). They studied the expressed values of 653 American executives, using a closed instrument, of rank order type, detecting that the executives in the sample in terms of group averages presented a predominance of economic, political and practical values. Additional support to these findings is available in the studies of England (1967) involving a survey of 1,072 American managers. A follow-up study of England’s results some seven years later found that managers’ values had not shifted (LUCK, 1974). The idea that managers as a group tend to emphasize the importance of economic, or practical, ends is intuitively appealing; after all, the theory and research of the managerial process suggests that persons with such values would be compatible with it. Other important facts hindering any change in the value system orientation are: a) managers are selected by others having similar values, b) the job of managing reinforces the pragmatic orientation, and c) values are in the axiomatic core of the individuals, therefore they tend to be stable over time. Table 1 Five Types of Value Orientation
1. The economic man is primarily oriented toward what is useful. He is interested in the practical aspects of the business world; in the manufacture, marketing, distribution and consumption of goods; in the use of economic resources; and in the accumulation of tangible wealth (protestant ethics). He is thoroughly “practical” and fits well the stereotype of the businessman.
2. The theoretical man is primarily interested in the discovery of truth, in the systematic ordering of his knowledge. In pursuing this goal he typically takes a “cognitive” approach, looking for identities and differences, with relative disregard for the beauty or utility of objects, seeking only to observe and to reason. His interests are empirical, critical, and rational.
3. The political man is oriented toward power, not necessarily in politics, but in whatever area he works. Most leaders have a high power orientation. Competition play a large role during all his life. For some men, this value is uppermost, driving them to seek personal power, influence, and recognition in a continuous basis.
4. The aesthetic man finds his main interest in the artistic aspects of life, although he need not be a creative artist. He values form and harmony. He views experience in terms of grace, symmetry, or harmony. Lives the here and now with enthusiasm.
5. The social man is primarily oriented toward the well-being of the people. His essential value is love of people – the altruistic or philanthropic aspect of love. The social man values people as ends, and tends to be kind, sympathetic, and unselfish.
Source: Adapted from Guth and Tagiuri (1965). 1.1. The Importance of Values Values will affect not only the perceptions of appropriate ends, but also the perceptions of the appropriate means to those ends. From the concept and development of organization strategies, structures and processes, to the use of particular leadership styles and the evaluation of subordinate performance, value systems will be persuasive.

E-Leader Budapest 2010
3
Fiedler (1967) came up with a leadership theory based upon the argument that managers cannot be expected to adopt a particular leadership style if it is contrary to their value orientations. An influential theory of leadership (COVEY, 1990) is based upon four dimensions: personal, interpersonal, managerial, and organizational. Not by accident the personal dimension is considered the core dimension. Incidentally it encompasses the value profile of the individual. Tannenbaum and Schmidt suggested that there are at least four internal forces that influence a manager’s leadership style: value system, confidence in employees, personal inclinations, and feelings of security in an uncertain situation. Again value system plays an important role. In short, people decide according to the value system they spouse, in other words values and attitudes are important because they may shape behavior, and behavior will influence people. 1.2. Values and the Leaders of Tomorrow Employees will be the essential resources of twenty-first century organizations. These employees can be categorized into several generations, each with special motivation needs. Kuzins (1999) suggests that managers and leaders need to understand people, whatever their age. They need to find out their skills, strengths, and whatever motivates them. In short they have to recognize that everyone is different and deal with each employee as an individual. On the other hand there are some important considerations that the leader of tomorrow will be confronted with: a) the phenomenon of unemployment, as a consequence of the extraordinary fast development of mechanization and automation, and the economic apparatus centered in the idea of currency stability, which instead of absorbing all the units of human energy creates a growing number of idle hands, and, even worse, brains; b) the phenomenon of research – who can say whither our combined knowledge of the atom, of hormones, of the cell and the laws of heredity will take us?; and c) the need for true union, that is to say full associations of human beings organically ordered, which will lead us to differentiation in terms of society; it should not be confounded with agglomeration which tends to stifle and neutralize the elements which compose it. Therefore, responsible influence, leadership centered in collective objectives, coherence and fecundity, are the four criteria to be pursued in developing the leaders of tomorrow. Summarizing we need to put into practice the ideas presented by Nanus (1995) in his book Visionary Leadership, that is to say, an organization’s senior leaders need to set directions and create a customer focus, clear and visible values, and high expectations, which should balance the needs of all stakeholders; ensuring the creation of strategies, systems, and methods for achieving excellence, innovation, and building knowledge and capabilities, including the development of leadership. Finally, the democratization of the concept of leadership, and at the same time, as an activity, primarily focused on people and their needs, as proposed by Safty (2003), is a must. 2. Organizational Culture One of the broadest studies on organizational culture in the world was carried out at the
end of the 1970s. The ILO (International Labour Office), headquartered in Geneva,
asked Professor Hofstede and a group of experts to carry out a study on work-related
cultural differences in over 50 countries throughout the world and to find out how such
E-Leader Budapest 2010
4
differences affect the validity of management techniques and their philosophy in
different countries.
The result achieved was that management should adapt itself to local conditions, mainly
as to a country’s cultural and social values, traditions and systems.
Some time later, and basing themselves mainly on Hofstede, Barros & Prates (1996)
carried out a study on the main cultural traits present in Brazilian organizations by
surveying the perception of 2500 executives and managers from large, mid and small-
sized companies in the Southeast and the South of Brazil. The Barros & Prates paper
(1996) studied local cultural traits within a Brazilian environment.
The study showed that managers brought a management style that reflected the
characteristics of local culture into their organizations.
The current study is based on the model proposed by Barros & Prates and it seeks to
create a methodology to draw the cultural profile of an organization and analyze how it
is used in the company's strategic analysis. From such an analysis we then make
recommendations for the organization that is being studied.
An organization’s development is closely linked to its cultural development. A
company’s values, beliefs, rites, myths, laws, technology, morals, work and
management are all molded on the society it is inserted in through its historic and
anthropological makeup.
According to Bethlem (1999), people are culturally different, as they have received
different influences through education and thus they have a diverse set of motives and
goals. Among the greatest challenges facing managers are (1) adapting the company to
the external environment and (2) internal integration for organizational performance.
The problem focused on this study is the inexistence of data that refers to aspects of
culture in organizations that can contribute to strategic planning, mainly during the
stage of strategic analysis. As we currently live in a society whose markets are very
much in evidence, a moment that is characterized as the age of information, a time when
changes are happening at great speed, companies must have a culture of great flexibility
to face problems related to uncertainty that are generated by this society that grows
increasingly demanding, mainly as to adapting itself to the characteristics of the
environment. Strategic planning has been a very useful tool and it helps company
managers very much. As this planning goes through a stage of internal analysis, we
intend to use this research to prepare a methodology to measure the elements that make
up organizational culture, as they are very important for the company’s internal

E-Leader Budapest 2010
5
integration. In many cases, cultural barriers are established and these will constitute a
true bottleneck to organizational performance.
According to Tylor, cited by Willens (1962), culture is “that complex whole that
includes knowledge, beliefs, the arts, morals and customs, as well as all the capabilities
acquired by man as a member of society".
Everything we can imagine is part of a society's culture. Therefore, this complex whole
led Edward B. Reuter, cited by Lenhard (1982), to propose to organize cultural content
by segmenting it, as below:
a – material culture - instrument and equipment building and handling tools;
b - manifest social behaviors patterns – just as when dealing with material objects, so
it is when sharing experiences among people, as members of any society need a greater
or a lesser, but not always a large number of skills and routines on how to carry out their
activities;
c - mental patterns - behavior techniques and standards do not exist by themselves, but
they serve the needs and desires of Man. Such desires produce feelings and attitudes in
relation to objects (material, social and nonmaterial), which, by turn, are traditional for
the most part and, although rooted in individual minds, are culturally conformed.
Society attributes value to certain objects (that is, it bears feelings and attitudes in
relation to them) and such consensus is essential to its cohesion. It is therefore important
to transmit it to the new generations;
d - social organization - a ranking of positions and social relations, rules and values,
power distribution, institutions such as the family and organizations, property, the state,
etc., ensures a properly balanced society;
e - symbolic elements - symbols are perceptible phenomena that are socially used to
mean that which is inaccessible to the senses. Every society has a system of
communication and thought symbols that include oral and written language and the
special languages of mathematics, logics, etc., that is, the sensorial phenomena to which
abstract meanings are attributed; and
f - thoughts organization - scientific, philosophic and religious systems built through
symbols that stem from a society but that do not identify themselves with this society's
system of feelings, attitudes and values.
According to Freitas (1991), culture is "something that is shared in the minds of the
members of the community, such as the beliefs, values and ideas that people support in
common". Bethlem corroborates with Freitas by citing the definition of culture

E-Leader Budapest 2010
6
according to the ILO study, which states that "culture is defined as the collective
programming of the mind that distinguishes the members of one group from those of
another".
The current study sought to use the main organizational culture traits observed by
Barros & Prates (1996) in their work, which proposes "a cultural action model in
business management". This model is based on reflections on the reading about
Brazilian culture (DaMata, 1984, 1987; Barbosa, 1992), as well as on the theme of
national cultures (Hofstede, 1980; Bolinger & Hofstede, 1987) and on the results of a
survey about the main cultural traits present in Brazilian companies from the perception
of 2500 executives and managers from 520 from large, mid and small-sized companies
in the Southeast and the South of Brazil. The traits observed will be used in this
research and they are: Power Concentration, Flexibility, Paternalism, Personal Loyalty,
Personalism, Impunity, Conflict Avoidance, Expectant Posture and Formalism.
2.1. The Barros & Prates Model
The model proposed aims to deal with Brazilian culture in business management as a
way to understand cultural action in an integrated way. This means that, when thinking
about modeling Brazilian culture one must take into account not only the typical
cultural trait in an isolated way and describe it but, mainly, its integration with other
traits. This will lead to a cause and effect network within which those traits will
influence each other mutually. From such a perspective, this Brazilian cultural action
model was proposed for business management - a model of the Brazilian management
style that portrays a multi-faceted cultural system with various facets, but one that acts
simultaneously through several components. The model can be characterized as
a system made up by four subsystems: the institutional (or formal) one, the personal (or
informal) one, the one of the leaders, and that of those who are led, each one presenting
common cultural traits and also special traits that articulate the set as a whole.
These subsystems intersect each other at various points where common cultural traits
can be found. There are four intersections which are characterized by power
concentration, personalism, expectant posture and conflict avoidance, distributed thus:
1) power concentration in the intersection of the leader and formal subsystems; 2)
expectant posture in the intersection of the followers and formal subsystems; 3)
personalism in the intersection of the leaders and personal; 4) conflict avoidance in the
intersection of the followers and personal subsystems, according to Figure 1 below.

E-Leader Budapest 2010
7
Figure 1 - Common cultural traits stemming from the intersection of subsystems.
Source: PRESTES, Fernando C.; CALDAS, Miguel P., 1997.
These subsystems are also articulated through special cultural traits that, on final
analysis, are the ones responsible for the whole system not rupturing. At the same time,
these are the points that should alter in degree or nature so as to achieve effective
change. Such traits are Paternalism, Personal Loyalty, Formalism and Flexibility. To
complete the list of the most important Brazilian traits we should highlight Impunity in
the institutional subsystem (formal), which bears strong reflexes on the Brazilian
cultural action system, as it can reinforce or undermine the maintenance and stability of
the whole system.
The combination of all the traits cited is what makes up and operates the model called
Cultural Action System, as shown in Figure 2.
Power Concentration Personalism
Expectant Posture
Conflict Avoidance
Followers
Personal
Leaders
Formal

E-Leader Budapest 2010
8
Leaders
Followers
PersonalFormal
Expectant
Posture
Conflict
Avoidance
Flexibility
For
mal
ism
Per
sona
l
Loya
lty
Power
ConcentrationPersonalism
Paternalism
Impunity
Figure 2 - An integrated vision of the proposed model Cultural Action System
Source: PRESTES, Fernando C.; CALDAS, Miguel P., 1997.
A description of all the elements that make up the Cultural Action System model is
presented in Appendix 1.
3. The Value Innovation Development Model
Having reframed the company’s strategic logic around value innovation, senior executives must ask at least four questions in order to pursue a new value curve: Which of the factors that our industry takes for granted should be eliminate? Which factors should be reduced well below the industries´ standard? Which factors should be reduced well below the industries´ standard? What factors should be created that the industry has never offered? To assure profitable growth one need to answer the full set of questions, rather than one or two. Value innovation is the simultaneous pursuit of radically superior value for buyers and lower costs for organizations. How can senior executives promote value innovation? No single measurement will ever describe a companies´ stocks and flows of value innovation. Just as financial accounting look at a number of indexes – return on sales, return on investment, cash value added, to name a few – to paint a picture of financial performance, value innovation accounting needs to look at corporate performance from several points of view. On the other hand, what might be a key indicator for one company could be trivial for another, depending on the industry environment. Yet the existence of so many possible measurements creates the risk that companies will use too many of them, cluttering their corporate dashboard with instrumentation and, in the end, learning nothing important because they know so much about what is not important. Therefore, three principles should guide a company in choosing what to measure:

E-Leader Budapest 2010
9
• Keep it simple – shoot for no more than a dozen measurements, • measure what is strategically important – in this domain there are no simple
recipes, the capacity to learn from experience and to conduct critical analysis is essential, and
• measure activities that produce value innovation – lots of stuff that companies measure is only sketchily related to value innovation.
In any way, a navigation tool, like a model, may help a lot in driving a company for high growth. Yet, a navigation tool should not only tell you where you are but also show you where you should be going. In order to perform this, the Value Innovation Development (VID) Model is suggested (Bruno, 2005). The VID model is a comprehensive approach to market and value innovation – based corporate management, on two levels, enablers (essential conditions) and processes (customer oriented), aiming at assuring a strategic and articulated logic across the company businesses, designed to increase its market value, achieved through the interaction of technology, market and organization abilities. The model is based on the evaluation of nine major dimensions divided in two groups:
• essential conditions – encompassing “strategy”, “processes”, “organization”, “linkages” and “learning”; and
• customer – oriented processes – involving the processes of “understand” markets and customers, “create” superior customer offerings, “gain” profitable customers, and “retain” profitable customers.
In the strategy dimension there are no simple recipes for success, the important point is the capacity to learn from experience and having critical analysis ability. In order to succeed companies also need effective implementation mechanisms, also called processes, to move innovations from idea or opportunity through reality. These processes involve systematic problem-solving and work best within a clear decision – making framework which should help the company to stop, as well as, to continue development depending on how things are going. Also are required skills in project management, risk management and parallel development of both the market, and technology streams. In the organization dimension there is the fact that innovation depends on having a supporting organizational context in which creative ideas can emerge and be effectively deployed. Organizational conditions are a critical part of innovation management, and involve working with structures, attraction and relation of human capital (reward and recognition systems), and communication patterns. Within the dimension of linkages it is meant the development of close and rich interactions with the external environment – markets, suppliers of technology and other relevant players to the business. Finally, developing innovation management involves a learning process concerned with creating the conditions within which a learning organization can begin to operate, with shared problem identification and solving, and with the ability to capture and accumulate learning about technology and management of the innovation process. These five dimensions together constitute what in the VID model is called enablers. In order to create an overall picture regarding the enablers a closed instrument was developed involving the five before mentioned dimensions. For each one of these dimensions some statements were developed in order to enable a judgment using a score varying from “o” (not true at all) to “5” (very true) (see Appendix 3).

E-Leader Budapest 2010
10
This instrument will lead us to an average score for the enablers. The second group of dimensions are related to the customer – oriented processes, which has to do with the value – added orientation. Lets explore these dimensions a little deeper. In order to understand markets and customers the following investigations should be done:
• data collection and integration, • customer data analysis, and • customer segmentation.
Regarding to create superior customer offerings the following aspects should be analyzed:
• products/services offers and prices, • communication and branding, • multi-client ownership, and • affinity partnership.
As far as gain profitable customers, the following elements must be considered:
• multi-channel management, • e-commerce, and • sales force automation
Finally, in order to retain profitable customers, the following assessments should be conducted.
• Customer service/customer care, • Loyalty programs, and • Customer satisfaction.
In order to create an overall picture regarding these processes a closed instrument was developed involving the before mentioned four dimensions. For each one of these dimension some statements were developed in order to enable a judgment using, again, a score varying from “0” (none) to “5” (ideal) (see Appendix 3). This instrument will enable us to have an average score for processes. The advantage of the model is that it will lead us to compute what is called the value innovation index (VII) by multiplying the final scores for enablers and process. This index maximum score will be “1”, once the enablers and process values are taken as relative figures. This maximum score means that the organization (imaginary company) reached perfection, as far as managing innovation is concerned, it covers the total area. Figure 6 presents the conceptual framework of the model.

E-Leader Budapest 2010
11
Figure 3 – Value Innovation Development Model Framework Source: Bruno (2005). The value innovators scored high in the value innovation index, not necessarily developing new technologies but in pushing the value they offer customers to new frontiers. They are pioneers in their industries. At the other extreme are the settlers, business with value curves that conform to the basic shape of the industry. The settlers VII score is generally low. The migrators lies somewhere in between. Such businesses extend the Value Curve of the industry by giving customers more for less, but they don’t alter its basic shape. They have moderate VII scores. Figure 4 shows the graphic interpretation of the model, where the scores of nine imaginary companies (A to I) were plotted.

E-Leader Budapest 2010
12
Figure 4 – Value Innovation Development Model Source: Bruno (2005).
Analyzing the chart, company (or business unit) “A” is the worst case, typically a settler, while “I” is a winner company (or business unit), typically a pioneer. Another advantage of using such a model, is the fact that the responses to the closed instruments’ specific dimensions may reveal significant room for improvements in enablers and processes, as is depicted in Figure 5, which shows a gap per considered dimension.
high growth path
F “migrators”
E D
A
C
B
“settlers”
“pioneers”
H I
1
0
1
0.5 -
VII = PxE
0.5
Best Company: I P = 0.9 and E = 0.8
VII = 0.72
value innovation trajectory
EN
AB
LER
S, E
PROCESSES, P
G

E-Leader Budapest 2010
13
Figure 5 – Gap analysis by dimension Source: Bruno (2005). The self-assessment of own performance in each dimension of the Value Innovation Development model will show the company’s current profile a useful exercise for a management team pursuing growth is to plot aside the current profile. A useful exercise for a management team pursuing growth is to plot aside the current profile a planned one following the logic of a new positioning of the company (or business unit) at the pioneer – migrator – settler map, defining, therefore, a possible value innovation trajectory, aiming at the “pioneer” area of the model. Research Questions The study sought to answer the following research questions:
1. What is the personal values profile of the executives involved in the research? 2. What is the personal values balance of these executives? 3. What is the cultural profile of the researched organizations? 4. What is the cultural adequacy index of these organizations? 5. Is there a relation between the executives’ personal values balance and the
cultural adequacy index of their organizations? 6. Is there a relation between executives’ personal values balance and the value
innovation index of their organizations? 7. Is there a relation between cultural adequacy index and the value innovation
index of these organizations?
E-Leader Budapest 2010
14
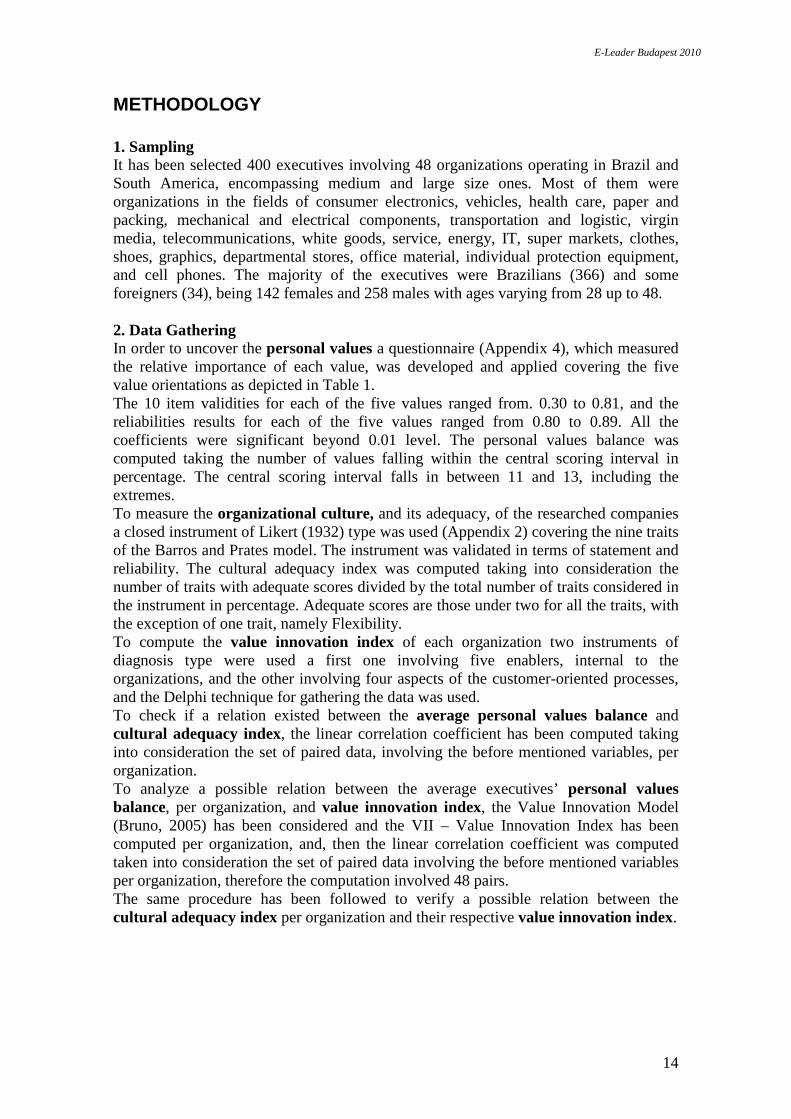
METHODOLOGY 1. Sampling It has been selected 400 executives involving 48 organizations operating in Brazil and South America, encompassing medium and large size ones. Most of them were organizations in the fields of consumer electronics, vehicles, health care, paper and packing, mechanical and electrical components, transportation and logistic, virgin media, telecommunications, white goods, service, energy, IT, super markets, clothes, shoes, graphics, departmental stores, office material, individual protection equipment, and cell phones. The majority of the executives were Brazilians (366) and some foreigners (34), being 142 females and 258 males with ages varying from 28 up to 48. 2. Data Gathering In order to uncover the personal values a questionnaire (Appendix 4), which measured the relative importance of each value, was developed and applied covering the five value orientations as depicted in Table 1. The 10 item validities for each of the five values ranged from. 0.30 to 0.81, and the reliabilities results for each of the five values ranged from 0.80 to 0.89. All the coefficients were significant beyond 0.01 level. The personal values balance was computed taking the number of values falling within the central scoring interval in percentage. The central scoring interval falls in between 11 and 13, including the extremes. To measure the organizational culture, and its adequacy, of the researched companies a closed instrument of Likert (1932) type was used (Appendix 2) covering the nine traits of the Barros and Prates model. The instrument was validated in terms of statement and reliability. The cultural adequacy index was computed taking into consideration the number of traits with adequate scores divided by the total number of traits considered in the instrument in percentage. Adequate scores are those under two for all the traits, with the exception of one trait, namely Flexibility. To compute the value innovation index of each organization two instruments of diagnosis type were used a first one involving five enablers, internal to the organizations, and the other involving four aspects of the customer-oriented processes, and the Delphi technique for gathering the data was used. To check if a relation existed between the average personal values balance and cultural adequacy index, the linear correlation coefficient has been computed taking into consideration the set of paired data, involving the before mentioned variables, per organization. To analyze a possible relation between the average executives’ personal values balance, per organization, and value innovation index, the Value Innovation Model (Bruno, 2005) has been considered and the VII – Value Innovation Index has been computed per organization, and, then the linear correlation coefficient was computed taken into consideration the set of paired data involving the before mentioned variables per organization, therefore the computation involved 48 pairs. The same procedure has been followed to verify a possible relation between the cultural adequacy index per organization and their respective value innovation index.
E-Leader Budapest 2010
15
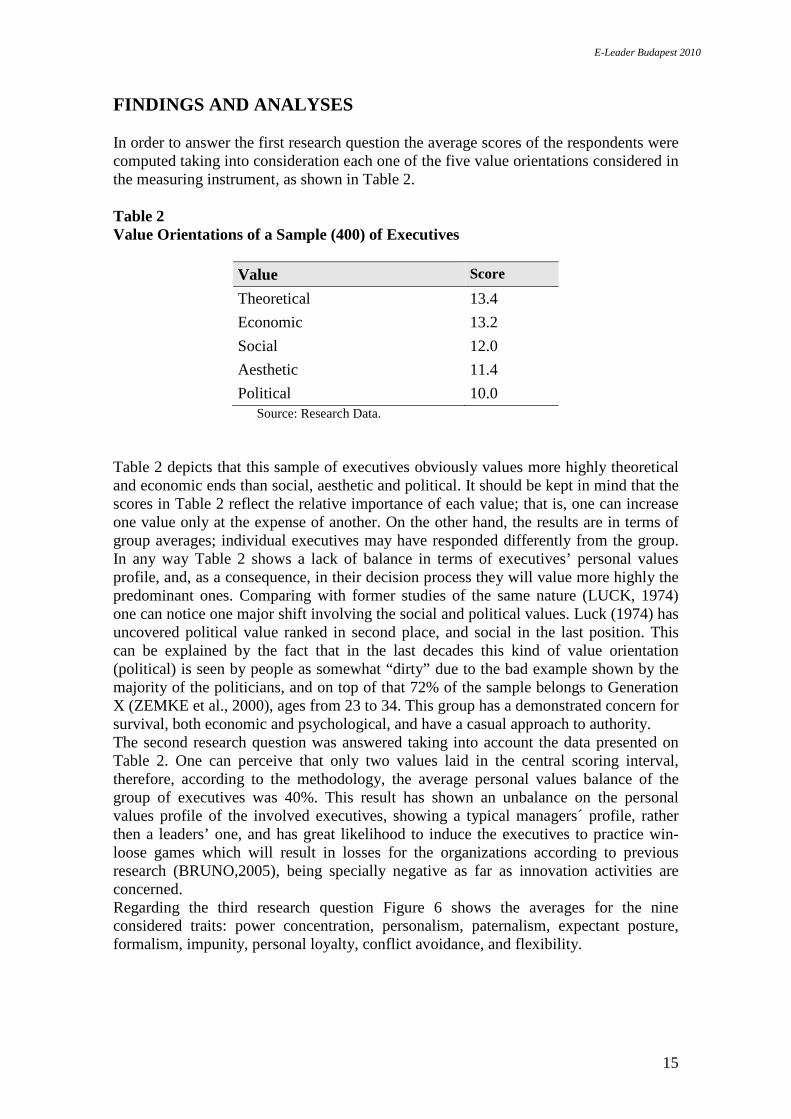
FINDINGS AND ANALYSES In order to answer the first research question the average scores of the respondents were computed taking into consideration each one of the five value orientations considered in the measuring instrument, as shown in Table 2. Table 2 Value Orientations of a Sample (400) of Executives
Value Score
Theoretical 13.4
Economic 13.2
Social 12.0
Aesthetic 11.4
Political 10.0 Source: Research Data.
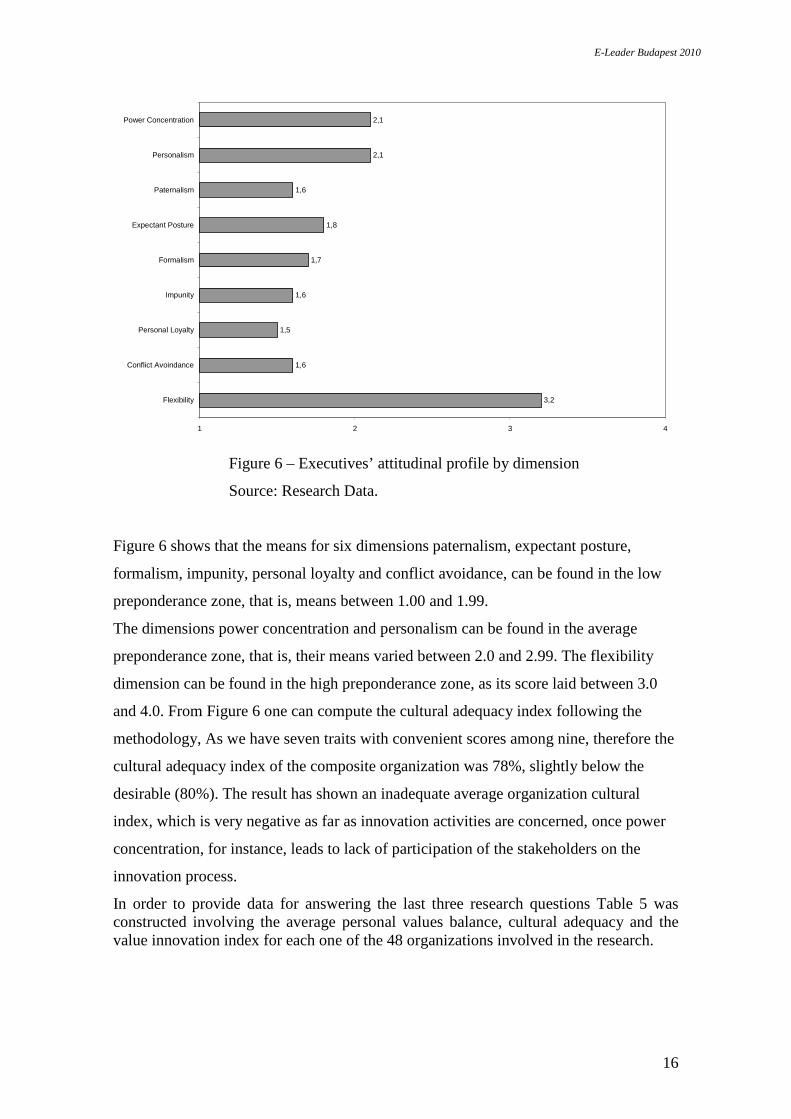
Table 2 depicts that this sample of executives obviously values more highly theoretical and economic ends than social, aesthetic and political. It should be kept in mind that the scores in Table 2 reflect the relative importance of each value; that is, one can increase one value only at the expense of another. On the other hand, the results are in terms of group averages; individual executives may have responded differently from the group. In any way Table 2 shows a lack of balance in terms of executives’ personal values profile, and, as a consequence, in their decision process they will value more highly the predominant ones. Comparing with former studies of the same nature (LUCK, 1974) one can notice one major shift involving the social and political values. Luck (1974) has uncovered political value ranked in second place, and social in the last position. This can be explained by the fact that in the last decades this kind of value orientation (political) is seen by people as somewhat “dirty” due to the bad example shown by the majority of the politicians, and on top of that 72% of the sample belongs to Generation X (ZEMKE et al., 2000), ages from 23 to 34. This group has a demonstrated concern for survival, both economic and psychological, and have a casual approach to authority. The second research question was answered taking into account the data presented on Table 2. One can perceive that only two values laid in the central scoring interval, therefore, according to the methodology, the average personal values balance of the group of executives was 40%. This result has shown an unbalance on the personal values profile of the involved executives, showing a typical managers´ profile, rather then a leaders’ one, and has great likelihood to induce the executives to practice win-loose games which will result in losses for the organizations according to previous research (BRUNO,2005), being specially negative as far as innovation activities are concerned. Regarding the third research question Figure 6 shows the averages for the nine considered traits: power concentration, personalism, paternalism, expectant posture, formalism, impunity, personal loyalty, conflict avoidance, and flexibility.
E-Leader Budapest 2010
16
3,2
1,6
1,5
1,6
1,7
1,8
1,6
2,1
2,1
1 2 3 4
Flexibility
Conflict Avoindance
Personal Loyalty
Impunity
Formalism
Expectant Posture
Paternalism
Personalism
Power Concentration
Figure 6 – Executives’ attitudinal profile by dimension
Source: Research Data.
Figure 6 shows that the means for six dimensions paternalism, expectant posture,
formalism, impunity, personal loyalty and conflict avoidance, can be found in the low
preponderance zone, that is, means between 1.00 and 1.99.
The dimensions power concentration and personalism can be found in the average
preponderance zone, that is, their means varied between 2.0 and 2.99. The flexibility
dimension can be found in the high preponderance zone, as its score laid between 3.0
and 4.0. From Figure 6 one can compute the cultural adequacy index following the
methodology, As we have seven traits with convenient scores among nine, therefore the
cultural adequacy index of the composite organization was 78%, slightly below the
desirable (80%). The result has shown an inadequate average organization cultural
index, which is very negative as far as innovation activities are concerned, once power
concentration, for instance, leads to lack of participation of the stakeholders on the
innovation process.
In order to provide data for answering the last three research questions Table 5 was constructed involving the average personal values balance, cultural adequacy and the value innovation index for each one of the 48 organizations involved in the research.

E-Leader Budapest 2010
17
Table 5 Value Innovation Index, Personal Values Balance and Cultural Adequacy Index
Nbr. SECTOR E P VII PVB (%)
CAI (%)
1 Health Care O 1 0.44 0.08 0.03 0 44
O 2 0.55 0.24 0.13 20 55
O 3 0.65 0.24 0.15 20 55
O 4 0.62 0.40 0.24 40 66
2 Paper & Packing O 5 0.63 0.45 0.29 80 77
3 Mechanical Parts O 6 0.30 0.05 0.02 0 44
4 Electrical Parts O 7 0.45 0.65 0.30 40 55
O 8 0.71 0.39 0.27 60 77
5 Transport/Logistic O 9 0.29 0.49 0.14 20 44
O 10 0.56 0.65 0.36 60 66
O 11 0.53 0.50 0.26 40 55
6 Consumer Electronics O 12 0.34 0.25 0.08 0 44
O 13 0.65 0.55 0.36 60 66
O 14 0.60 0.65 0.39 40 67
O 15 0.65 0.65 0.42 60 77
7 Vehicles O 16 0.48 0.70 0.34 40 55
8 Virgin Media O 17 0.49 0.22 0.11 40 44
9 Info Technology O 18 0.63 0.62 0.39 60 77
O 19 0.60 0.69 0.41 60 78
O 20 0.63 0.77 0.49 80 66
O 21 0.62 0.37 0.23 60 44
10 Service O 22 0.62 0.58 0.36 60 67
O 23 0.58 0.50 0.29 40 66
O 24 0.58 0.76 0.44 60 77
11 Physical Distribution O 25 0.54 0.62 0.33 40 67
12 Car dealer O 26 0.59 0.37 0.22 40 55
13 Language School O 27 0.63 0.40 0.25 40 55
14 Banking O 28 0.61 0.52 0.32 60 66

E-Leader Budapest 2010
18
O 29 0.64 0.71 0.45 60 77
11 Supermarket O 30 0.56 0.40 0.22 40 44
O 31 0.79 0.57 0.45 60 67
12 Telecom O 32 0.57 0.40 0.23 40 55
O 33 0.57 0.54 0.31 40 66
O 34 0.61 0.40 0.24 40 55
13 Clothes O 35 0.64 0.56 0.36 40 66
O 36 0.76 0.62 0.47 40 67
14 Shoes O 37 0.73 0.40 0.29 60 56
O 38 0.69 0.77 0.53 80 66
15 Graphics O 39 0.63 0.40 0.25 40 56
O 40 0.57 0.40 0.23 40 66
16 White Goods O 41 0.65 0.45 0.29 40 45
17 Software House O 42 0.58 0.59 0.34 40 67
18 Construction Material O 43 0.54 0.50 0.27 20 55
19 Hotel Chain O 44 0.58 0.75 0.43 60 77
20 Office Material O 45 0.71 0.79 0.56 80 78
21 Protection Equipment O 46 0.69 0.25 0.16 20 44
22 Fabrics O 47 0.56 0.40 0.22 20 45
23 Departmental Store O 48 0.65 0.35 0.23 40 55
O = Organization, E = Enablers, P = Market-Oriented Process, PVB = Personal Values Balance, CAI = Cultural Adequacy Index, and VII = Value Innovation Index Source: Research Data.
At first, to verify if there was a relation between executives’ Personal Values Balance (PVB) and organization Cultural Adequacy Índex (CAI), the average executives’ Personal Values Balance and the Cultural Adequacy Index per organization were computed and linear correlation coefficient involving the PVB and CAI was calculated taking into account the set of paired data involving all the 48 organizations, being personal values balance one variable, and cultural adequacy index the other. The result was a linear correlation coefficient of +0.71 which suggests, according to Schmidt (1975), a moderate to high degree of positive relation between the two considered variables. Finally, to verify if there was a relation between executives’ Personal Values Balance (PVB) and the Value Innovation Index (VII), as well as Cultural Adequacy Index (CAI) and the organization Value Innovation Index (VII), the average executives’ Personal Values Balance and the Cultural Adequacy Index per organization were computed and

E-Leader Budapest 2010
19
linear correlation coefficient involving the VII and PVB, as well as VII and CAI were computed. Considering the variables personal values balance and value innovation index of the 48 organizations, the result was a linear correlation coefficient of +0,81, showing a high degree of positive relation between the two variables. Finally, considering the set of paired data involving the 48 organizations, being cultural adequacy index one variable, and value innovation index the other, the result was a linear correlation coefficient of +0.77, which, again, suggests a moderate to high degree of positive relation between the two considered variables. In order to have an overall idea of the performance of a composite organization regarding Enablers (E) and Customer-Oriented Processes (P) the scores involving the five enablers and the four customer-oriented processes aspects, Figures 7 and 8 were constructed with the data collected from the 48 organizations.
ENABLERS AVERAGE PROFILE
2,22
2,2
2,8
2
0
0,5
1
1,5
2
2,5
3
STRATEGY
PROCESSES
ORGANIZATIO
N
LINKAGES
LEARNIN
G
SC
OR
E
Figure 7 – Enablers Average Profile of the Composite Organization (E = 0.46) Source: Research Data. As can be seen in Figure 7 there was plenty of space to improvements once the scale interval is zero to 5, and the best score was 2.8 (linkages). The worst cases involving the biggest gaps are internal processes to implement innovations and learning. The variable E was computed and the value found was 0.46. On the other hand Figure 8 shows a slightly better situation, presenting as worst case the ability to gain profitable clients or customers. The variable P was computed and the value found was 0.60. therefore the Value Innovation Index of the composite organization was VII = P x E = 0.27

E-Leader Budapest 2010
20
PROCESSES AVERAGE PROFILE
3,23
2,4
3,2
0
0,5
1
1,5
2
2,5
3
3,5
UNDERSTAND CREATE GAIN RETAIN
SC
OR
E
Figure 8 – Customer-Oriented Processes of the Composite Organization (P = 0.60) Source: Research Data. Figure 9 presents the positioning of the composite organization on the Value Innovation Model graph.
“Settlers” A
B
C
D E
F
G
HI
High Growth Path
“Migrators”
Value InnovationTrajectory
“Pioneers”
EN
AB
LER
S,
E
PROCESSES, P0,5
0,5
0 1
1
VII = P x E
AverageOrganization “F”:P = 0,60 e C = 0,46VII = 0,27
Figure 9 – Positioning of the Composite Organization (F) Source: Research Data. As can be seen in Figure 9 the Value Innovation Index of the composite organization was VII = P x E = 0.27. This means plenty of opportunities to improvements, once F is near the settlers area and defines on the graph an area that is only 27% of the total possible one. These improvements can be derived from the gaps presented on Figures 7 and 8.

E-Leader Budapest 2010
21
CONCLUSIONS AND RECOMMENDATIONS 1. Conclusions The following conclusions were reached based on the research: ● The study has shown that the executives involved in the research have an unbalance in their personal values profile; and, even worse, is the fact that the political orientation, which has partially to do with the process of influencing people, that is to say leadership, received the lowest average score (10.0). This finding can be partially explained, as said before, due to the fact that the great majority of the executives of the sample (72%) belongs to the Generation X (ZEMKE et al., 2000), the survival generation with a casual approach to authority, and, on the other hand, the political value is associated with politics, which is somewhat “dirty” for the majority of the citizens. In any way this is the moment to face this problem. If we really want to have leaders with traits such as: responsible influence, people centered, showing coherence between attitudes and actions, and fecundity, that is to say, leading the process of assuring progress, than we need to work hard in order to develop knowledge for better understand and influence leaders’ personal values. ● Regarding the cultural aspects the results of the analyses indicated the preponderant
traits, based on the model proposed in the study. The Flexibility dimension showed the
greatest preponderance, thus indicating that there is great flexibility within the
companies. This means that the organizations have great capacity to adapt themselves to
the circumstances of the environment, which can be a positive point when we consider
that, currently, society has been undergoing constant and fast changes that demand that
organizations be agile so they can meet the demands of the environment. Personal
Loyalty was the dimension that showed the least preponderance. It means that the
executives who took part in the research are more loyal to the organization than to their
leader. Thus, personal relations at the workplace remain in the background, which
makes for a healthy environment from the point of view of motivation and
collaboration. Power concentration is present, which means that some executives still
impose their will through traditional legal power and their hierarchical positions,
leading to expectant posture which will create difficulties to release new ideas and
innovation. Another undesirable trait is personalism, which appear with moderate
preponderance, once it may lead to personal loyalty.
Some actions are needed to reduce some of the negative cultural aspects that are present
within the environment of the researched organizations.
The following actions are deemed to be necessary to achieve the above-mentioned
objectives:

E-Leader Budapest 2010
22
a. Power Concentration: create a culture where power is not concentrated, where an
executives’ authority is not only based on rational legal power, on hierarchy-
subordination, on the threat of sanctions and punishment, but also include other
variables such as knowledge, performance and autonomy, enhancing participation.
b. Personalism: in their dealings with their subordinates, keep leaders from emphasizing
relationships focused on the figure of the leader, either through their discourse or their
power from being linked to other influential people in the company.
c. Paternalism: keep leaders from acquiring the hierarchical and absolute power culture
imposed from top to bottom with traditional acceptance by its members, as this will
create dependence, a lesser degree of freedom and less autonomy for the group.
d. Expectant Posture: keep leaders from displaying expectant posture, which is
generated by developing the bossing, protectionist and dependent practices represented
by paternalistic solutions. This must be done by practicing dialogue, power balance,
critical awareness, incentives to initiative, greater freedom and autonomy to act, and
responsible acts.
e. Formalism: resist formalism culture in the company by having everyone follow
internal norms and regulations. Practice what has actually been set down in company
regulations. Avoid nepotism, favoritism, and corruption. Avoid situations in which
established criteria are ignored in deference to greater business mobility.
Whenever there is a gap between fact and right, use common sense in a shared way.
f. Impunity: avoid the impunity culture - the company should make an example of all
those who break internal norms and guidelines.
g. Personal Loyalty: resist the personal loyalty culture by giving more value to the
company's needs than to those of the leader. That is, centralize needs into the
representation of the company. Strengthen the company by making compliance to
norms an impersonal issue.
h. Conflict avoidance: resist the conflict avoidance culture by creating an environment
that fosters empowerment, independence and autonomy in leaders. This will probably
create an environment that is less alienating and passive while, at the same time, it will
lead to improved motivation and initiative on the part of the employees. Conflict
situations should be dealt with through institutional relations.
i. Flexibility: maintain a position of flexibility. As the world is currently very dynamic,
the speed of changes demands that companies should almost routinely adapt themselves

E-Leader Budapest 2010
23
to the conditions of the environment (the market). Thus, they should remain agile to
adjust both their internal and external processes to produce all kind of innovations.
● The study also has shown a large space for improvements as far as innovation, of all
kinds – process, systems, products, services, management and ways of doing the
businesses, is concerned. These improvements are largely related with executives’
attitudes and behaviors, having an adequate balance in their personal values and
creating cultural environments that enhance the involvement and effective participation
of all the stakeholders of the organization.
2. Recommendations
The use of the conclusions and the instruments that have been presented by this research
in other business realities should be carried out with great caution due to the fact that
the study was limited to 48 organizations located in Brazil with their own
characteristics, technology and management systems.
The sample investigated by this study was a small one, which has led to unstable
correlation statistics. Future studies that would involve larger samples and other
categories of executives and sectors would be highly recommended.
REFERENCES
BARBOSA, L. O jeitinho brasileiro de administrar . Campus, 1992. BARROS, B. T. & PRATES, M.A.S. O estilo brasileiro de administrar. São Paulo: Atlas, 1996. BETHLEM, Agrícola de Souza. Gestão de negócios: uma abordagem brasileira. Rio de Janeiro: Campos, 1999. BOLINDER, D. HOFSTEDE G. Lês differences culturales management: Commente chaque pays gère-t-il homens? Paris: Edition de 1’ organization, 1987. BRUNO, L.F. C, Value innovation development model. Fundação Dom Cabral Internal Publication, 2005 ______________ , Personal Values and Leadership Effectiveness. Fundação Dom Cabral Internal Publication, 2005 COVEY, S.R., Principle Centered Leadership. New York: Simon & Schuster, 1990. DaMATA, R. A casa e a rua. Rio de Janeiro: Guanabara, 1987. FIEDLER, F. E., A Theory of Leadership Effectiveness. New York: McGraw-Hill Book Co., 1967. FREITAS, Maria E. Cultura organizacional: grandes temas em debate. Revista de administração de Empresas, São Paulo, v.31, n.3, p.73-82, jul./set. 1991. GUTH, W. T. and TAGIURI, R., Personal Values and Corporate Strategies. Harvard Business Review, September – October, p. 126, 1965.

E-Leader Budapest 2010
24
HOFSTEDE, G. Culture e management development. Genebra ILO, Management Development Branch, Training Department, 1983. LENHAR, Rudolf. Sociologia educacional. São Paulo: Pioneira, 1992. LIKERT, R. The method of constructing an attitude scale. New York: Wiley, 1932. LUCK, E. J. and OLIVER, Bruce L., American Managers’ Personal Value System – Revisited. Academy of Management Journal, September, pp. 549 – 554, 1974. MOTTA, Fernando C. Preste; CALDAS, Miguel P. Cultura organizacional e cultura brasileira. São Paulo: Atlas, 1997. NANUS, B., Visionary Leadership: Creating a Compelling Sense of Direction for Your Organization. San Francisco, CA: Jossey-Bass Publishers, 1995. RAMOS, A. Guerreiro. Administração e contexto brasileiro. Rio de Janeiro: Fundação Getúlio Vargas, 1983. REUTER, Edward B. “Cultura” em A. LENHARD. Princípios de sociologia,Cap. XVII, 1982. SAFTY, A., et al., Value Leadership. University of Bahçesehir/Istanbul, 2003. SCHMIDT, M., Understanding and Using Statistics Basic Concepts. Massachusetts, USA, D. C. Heath and Company, 1975. SIKULA, A. F., Values, Values Systems, and Their Relationship to Organizational Effectiveness. Proceedings of the Thirty-First Annual Meeting of the Academy of Management, pp. 271 – 272, 1971. SPRANGER, E., Types of Men. Halle: Germany: Max Niemeyer Verlag, 1928. TANNENBAUN, R. and SCHMIDT, Warren., How to Choose a Leadership Pattern. Harvard. Business Review, March – April, 1958, pp. 95 – 102. WILLEMS, Emílio. Antropologia social. Translation of Yolanda Leite. São Paulo: Difusão Européia do livro, 1962. ZAMKE, Raines and FILIPCZAK., Generations at Work: Managing the Clash of Veterans, Boomers, Xers, and Nexters in Your Workplace. American Management Association Publication, pp. 30 – 31, 2000. Recommended Supplementary Readings COOPER, R. G., Winning with new products – doing it right. Ivey Business Journal, Jul./Aug. 2000. p. 54-60. KIM, W. C and MAUBORGNE, R., Value Innovation: the strategic logic of high growth. Harvard Business Review, Jan./Feb., p.100-109. PINE, B. J., Mass customization: the new frontier in business competition. Harvard Business School Press, Boston, MA, 1999.
BIERLY III, Paul E. and CHAKRABARTI, Alok K., Technological learning, strategic flexibility, and new product development in the pharmaceuticae industry. IEEE Transactions on Engineering Management, V. 43, N. 4, Nov. 1996, p. 368-380.
BURGELMAN et al., Management of technology and innovation. MacGraw Hill Fourth Edition, Part 4, 2004.
CLAYTON, T. and TURNER G. Brands, innovation and growth. in: TIDD, J. (Ed.). From knowledge management to strategic competence: measuring technological, market and organizational innovation. Imperial College Press, 2000.
COOPER, Robert G. Winning at new products. Cambridge. Perseus Books, 2001.

E-Leader Budapest 2010
25
FREEMAN, C. The economics of industrial innovation. Harmondsworth: Penguin Books, 1974. p. 161-197.
LEONARD-BARTON, Dororothy., Wellsprings of knowledge building and sustanining the sources of innovation, Boston (MA): Havard Business School Press 1995. Chapter 7.
MOWERY, D. and Rosenberg, N., The influence of market demand upon innovation: a critical review of some recent empirical studies. Research Policy 8, p. 101-153, 1979.
TIDD, J.; BESSANT J., and PAVIT K., Managing innovation: integrating technological, market and organizational change. 2 Ed., John Wiley, 2001 Chapter 7.
Von Hippel. Users as innovator’s, Technology Review, 5, p. 212-239, 1976.
WANG Q., The exploitation of a multi-disciplinary approach in studying the R&D/Marketing interface with some empirical evidence. Internacional Journal of Technology Management, V. 11, p. 369-379, 1996.

E-Leader Budapest 2010
26
APPENDIX 1
A DESCRIPTION OF THE ELEMENTS OF THE CULTURAL ACTIO N
MODEL
1. THE LEADERS SUBSYSTEM
It is power concentration that is to be found in the institutional dimension. Beside it we
find personalism, which is present in our society's personal dimension. Paternalism is
the third element that articulates these two dimensions and shows the profile of the
leadership style.
Power concentration
This means traditional power. Alternatively, society has made use of traditional military
power and also of rational-legal power to establish and maintain authority, thus creating
a culture of power concentration that is based on hierarchy/subordination. "Those in
power give orders, those with common sense will obey" reflects an important facet of
this culture.
Personalism
Power is wielded with great charismatic authority and magnetism. These are present in
leaders through their discourse or their networking (relations with other people) and not
through their expertise; this trait is highlighted in our daily lives. A network of friends,
and even of relatives, is the natural way people take to solve their problems and, once
more, obtain privileges that those who do not belong to a family cannot aspire to.
Paternalism
The combination of the two traits mentioned above, power and personalism, can be
summarized into paternalism, to a greater or lesser extent. Paternalism has two facets,
patriarchalism and patrimonialism. Our society carries within itself the value that the
patriarch can do anything and that the members of the clan can only ask for and obey;
otherwise, rebellious behavior can lead to exclusion from the relationship.
Patriarchalism, that maintaining and affective face of the father who fulfills what the
members of the clan expect of him, and patrimonialism, that hierarchical and absolute
face that imposes its will upon accepting members, live side-by-side in our culture. It is
within this mix of purely economic aspects - within which an objective exchange of
work for pay, bearing essentially affective aspects within which dedication and non-
conflicting collaboration is emotionally exchanged for personally close bonds - that
each one of the leader and led actors will develop. To avoid rupture it is necessary that

E-Leader Budapest 2010
27
each one should seek to attain maximum benefit at minimum cost, which is paid both in
affective and fiduciary currency. Just like societies in which power is distributed
unequally, like in Brazil, and in which distribution tends to remain the same, there is a
psychosocial phenomenon involving the continuous dependence of those who are led on
the leaders, which is accepted by both parties under the conditions presented.
Along these lines we can say that societies and organizations will be led as
paternalistically as their members will allow. Paternalism exists both for leaders and for
those who are led, and the two groups’ system of values complement each other.
Paternalism creates a double dependence but, together with the control it exerts, it opens
the way for an efficient way to identify and belong to a group. The reward lies in a
greater degree of security made possible by the group. However, it is also true that a
cost is extracted, as its members will enjoy a lesser degree of freedom and autonomy
when compared to less paternalistic cultures.
2. INSTITUTIONAL SUBSYSTEM (FORMAL)
Freedom and a degree of autonomy are at the basis of the dynamics of the institutional
subsystem that makes up the system. Power concentration and paternalism induce a new
trait in Brazilian culture, expectant posture. Below we will present one of the main
elements that articulates, within the institutional system, the subsystem of leaders and
those who are led, and guarantees a relationship. It is the phenomenon known as
formalism, which is one of the most significant and relevant ways through which our
culture seeks to escape future uncertainty. Lastly, the impunity trait, which strongly
reflects the institutional subsystem and which is one of the elements that cannot only
reinforce but also undermine the maintenance and stability of the whole Brazilian
cultural action system.
Expectant posture
We have seen that Brazilians were born and developed freely at a time of bossing,
protectionism and dependence which is represented in our paternalistic solutions. We
reflexively work guided by the external authority that limits our critical awareness.
What can then be said of the lowly-qualified Brazilian population that lives within an
environment that offers great power unbalance, no freedom or autonomy and low
critical sense?
E-Leader Budapest 2010
28
This process cannot but lead to the trait called expectant posture, whose main
characteristics are mutism and low critical awareness and, consequently, low initiative,
little capacity to perform through self-determination, and the transfer of responsibility
for difficulties to the leaders. This childish process, which reinforces a low level of
critical awareness, will lead to the condition of not knowing what one wishes, to not
having one's own will, even when presented with greater freedom of action. Thus
involved by perplexity, the one who has been freed once again feels the need to conform
his/her behavior to the expectations of external authority.
Responsibility transfer is another of the characteristics of the expectant posture trait.
The logic is as follows: if power does not lie with me, then I am not included in it and I
am not the one who will make the decision; thus, I am not responsible, either. Thus I
will transfer it to the one who has the legal right to it, which, in our culture, means
further up the hierarchy. This is manifested in two other circumstances, that is, when
something wrong happens, then the blame or the main problem are both outside one’s
field of action and control.
And finally, our capacity to carry out tasks through self-determination is very small.
Between the "culture of doing", looking out to the world from the perspective of
cumulative change and the idea of progress, and the “culture of being”, which hides
from the world, resists change and is suspicious of progress, it would be more
appropriate to call Brazilian culture the “culture of be doing”, that is, "doing just
enough", enough to maintain the status quo or, at most, to guarantee small changes
without any significant advances.
Formalism
Brazilians have a socialization code for time that would place them closer to a society
that does not worry much about the future. They surely live much more in the present
than in the future. The quest for immediate results with low provisioning capabilities
demonstrates anxiety about what might come next. This more relaxed side can be
explained by their capability to hope for better times under God's protection. However,
it is also possible that the so much talked about natural resources can make them feel
safer due to having such reserves for the future.
In real life what actually happens is tacit acceptance of norms and regulations, although
their practice is distorted and supported by other cultural elements that are stronger and
more present in the Brazilian behavior:

E-Leader Budapest 2010
29
“Therefore formalism is the discrepancy between concrete conduct and the norms that
are supposed to regulate it. Formalism in not necessarily a social pathology as some
authors describe it. In changing societies such as the Brazilian one it can be seen as a
social change strategy imposed by the dual character of its historical transformation and,
particularly, by the way it articulates itself with the rest of the world” (RAMOS, 1983).
The law that regulates getting a job through a public entrance examination exists so that
everyone, through their own merit and knowledge, can be employed by the State
bureaucracy. However, in practice there are other social-cultural variables present.
Low educational qualification, the relative scarcity of jobs for abundant labor, and the
strong personal relations that direct Brazilians’ behavior will make the law inapplicable
under such circumstances. There are extra legal channels or processes, or even legal
ones, that are accepted as a great wave of norms and regulations by collective
awareness. Its ethics lies in the fact that they allow people to overcome a social
selection that is, oftentimes, imposed by idealistic or protectionist laws and regulations.
What really exists is a gap between right and fact, which characterizes formalism but
which also justifies it. This is the pathological side to formalism since, as it is actually
performed, then adjustment processes will rise to overcome it. As these processes are
allowed and can reach configurations of nepotism, favoritism and even bribing, this fact
then generates instability and insecurity. This will lead to the risk of applying remedy to
legislations, one that will be increasingly specific and encompassing, and which will
create a wave of norms that will lead to an apparent stability in social relations.
In Brazil, when the norms are quite specific, our adjustment is carried out through a
process of reinterpreting the law, whose results will essentially depend on who stands at
the other side of the issue. If it is someone who belongs to our group or someone with
authority, there is broad flexibility in reinterpreting; if it is someone outside our circle,
then there is absolute strictness. There can be no other meaning to what was said by
Getúlio Vargas, as cited by Barbosa (1992): “Our friends will receive all, our enemies
nothing, and those who are indifferent will have to abide by the law”.
Impunity
And finally, we will make some comments about impunity. This code becomes relevant
as it can be the link that will close a chain of cultural values and that increasingly feeds
it back. Here we refer to the fact that, as leaders are exempted from punishment, this
will strengthen their power position and increase the degree of consistency among the
traits we have seen along the institutional subsystem chain. Where the law only exists

E-Leader Budapest 2010
30
for those who are indifferent and where individual rights are monopolized by the few,
apathy can only grow and leave Brazilians as spectators.
The society that legitimized its leaders by means of the judicial-institutional system
does not recognize their credibility anymore, which will lead to dependent egocentrism
and base their relations on personal ones. Here we must invert our thinking and research
in the face of rewards since, from the perspective of punishment, impunity is the
reward.
3. PERSONAL SUBSYSTEM (INFORMAL)
At the basis of this subsystem we find security and harmony. Its make up encompasses
the category of personalism, which has already been presented, besides those of people
loyalty and the cultural trait of conflict avoidance.
Personal loyalty
Personal loyalty is the counterpart of the “personal” subsystem to the formalism of the
leaders and the led subsystem, on the side of “personal” space.
Social cohesion in Brazil is subject to personal ethics that manifests itself through
loyalty to people. Members of a group value the needs of the leader and of the other
members of the group more than the needs of a greater system they are inserted in.
Therefore, the mechanism of broad interconnection among the various groups in a
society is centered on the person, essentially on the person of the leaders. Decision
making at the level of a leaders’ committee is well tolerated. Trust is deposited on the
person of the leader and he becomes the link that connects the network and integrates
the segments.
This leader’s role will become a fundamentally responsible one if loyalty moves to the
level of identification or imitation. This is a predictable possibility in a society where
individualism is low and dependence exerted by behavior control is practiced. This
phenomenon of broad fusion and "belonging" among the people involved is a strong
cohesion mechanism. However, it is a fragile one because, depending on personal
relations, it can easily lead to compartmentalization and stratification, or personal areas
of influence.
The interaction between loyalty to people and the strongest cultural trait of uncertainty
avoidance, which is formalism, can be seen as opposing mechanisms. From a linear
logic, such as that found in German society, the stronger the institutions, the weaker the
power of leaders, as power is transferred to personal norms. In Brazil, each

E-Leader Budapest 2010
31
reinforcement received by formalism will lead to stronger loyalty to people, so that the
system can go on. The solution to institutional strictness is carried out through personal
relationship networks.
Conflict avoidance
The relationship among individuals in a high power inequality situation can lead to a
degree of alienation, low motivation and consequent passiveness and little initiative.
This same situation of power inequality and strong dependence can represent a latent
conflict situation which, in the Brazilian case, can be dealt with through personal
relations, more properly through loyalty to one person who will be able to intermediate
the relationship between the leaders and those who are led. Thus, the Brazilian way out
is to use indirect solutions (triangulations) among diverging poles while, however,
maintaining good personal relationships with them. This is the mechanism that is most
frequently used.
It is worth highlighting that the conflict avoidance trait is much more present from the
led to the leader. From the leader to the led, the former does not fear the existence of
conflict, as the structure of the relationship already indicates that the latter will find
indirect solutions.
4. THE FOLLOWERS SUBSYSTEM
It is the one that articulates between the institutional and personal systems within the
space of the led, just as paternalism did in the leaders’ space. It is the flexibility trait.
Flexibility
Flexibility is the modern version of the process that has become known as a second-
degree strategy, that is, it stems from formalism, whose characteristics are supposed to
be creativity and pragmatism. Flexibility represents a two-sided category: adaptability
and creativity.
Adaptability can be identified not only in terms of companies that show great agility in
adjusting themselves to various internal and external processes. The concept of
adaptability, when looked at from the processual side of it, is not a creation in a pure
sense, such as the production of something new. It is the creative capability that is
carried out within certain pre-ordained limits. This restrictive limitation is exactly the
process that stems from the institutional subsystem aspect, within which norms are
recognized and, due to them, will lead to an adjustment of operational elements and
create only the new habits that fit our way of being. Such flexibility happens due to the

E-Leader Budapest 2010
32
fact that formalism is placed before loyalty to people. If, on the one hand, there is an
idealized normative framework to be followed within the institutional domain, there
will also be a relationship network based on personal loyalty within a social reality that,
if it comes into play, will encourage the quest for a solution to personal objectives.

E-Leader Budapest 2010
33
APPENDIX 2
INSTRUMENT TO MEASURE ORGANIZATIONAL CULTURE
Objective
The objective of this research is to measure your perception of your company's
Organizational Culture.
Instructions
The research presents some statements that you should read very carefully. After that
please mark only one of the possible alternatives:
STRONGLY AGREE (SA): you strongly agree that the statement portrays the reality of
your workplace.
INCLINED TO AGREE (IA): you tend to agree that the statement portrays the reality
of your workplace.
INCLINED TO DISAGREE (ID): you tend to partially disagree that the statement
portrays the reality of your workplace.
STRONGLY DISAGREE (SD): you totally disagree that the alternative portrays the
reality of your workplace.
Observations:
1. No answer is right or wrong. What is important is to know what you think about each
statement that is presented.
2. Please mark only one answer to each statement.
3. Please make sure you have considered all 27 statements.
4. Should you have any doubts before or while you are filling out this instrument, please
consult the survey supervisor.

E-Leader Budapest 2010
34
MEASURING ORGANIZATIONAL CULTURE
STATEMENTS
Strongly
agree
Inclined
to agree
Inclined
disagree
Strongly
disagree
1. My authority as an executive is based on the power of
hierarchy-subordination
2. Under my leadership people are involved and motivated
more due to my discourse and charisma
3. I exert authority by imposing the organization's
hierarchy, and subordinates must obey
4. I carry out my work without freedom of action or
autonomy
5. I exert authority based on internal norms, without fully
following them
6. Sanctions and punishment are determined for those who
do not collaborate, but I let it be and look for an excuse
7. I exert my authority by giving greater importance to the
group than to the company as a larger system
8. In a meeting of executives, I have low motivation
because I have no power of decision
9. During company reorganization I have great capacity to
learn and adapt to what is new
10. I exert my authority by determining sanctions and
punishment for those who do not obey
11. I exert authority because I have links to important and
influential people in the company
12. If my authority is not respected, the one who has
rebelled can be excluded from the company
13. The environment in my area has a low critical sense
and great dependence on the leaders
14. There are situations when norms are not being
followed, sometimes by my superior and sometimes by me
15. I can determine sanctions and punishment but I try to
get away from regulations and try another solution
16. I recognize the person who is the leader of the work
group as being more important than the company
17. I exert leadership without much questioning because I
do not have the power to decide
18. My management style is flexible in relation to
cooperation among sectors
E-Leader Budapest 2010
35
19. My position in the company gives me the authority
needed to direct my work activities
20. I exert authority because I have access to information
that is important to others
21. I position myself to my subordinates as a father and
they must obey me
22. I have low initiative, little capacity to perform through
self-determination, and that is so because I receive orders
from my superiors
23. Sometimes there are situations when norms are only
partially followed
24. I can determine sanctions and punishment for those
who do not collaborate, but I let it be because they are
friends of mine
25. The trust shown to the figure of the group leader is
more important than that shown to the company
26. I exert my leadership passively and with little initiative
because I am not encouraged to be a leader
27. My management style is flexible in relation to
fulfilling the demands of the position
Should you wish to do so please use this space to write down additional remarks.
______________________________________________________________________
______________________________________________________________________
______________________________________________________________________
______________________________________________________________________
______________________________________________________________________
______________________________________________________________________
______________________________________________________________________
Thank you very much for your kind attention.
This survey is important so that the company's organizational culture can be better
understood.
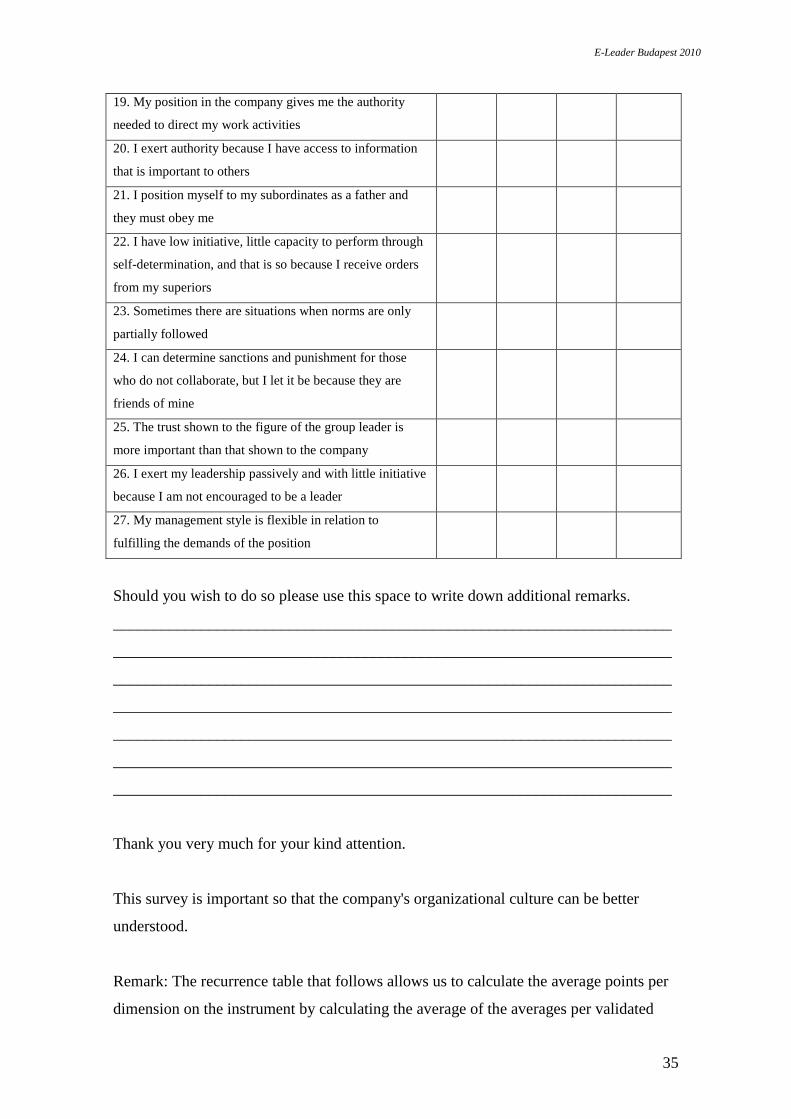
Remark: The recurrence table that follows allows us to calculate the average points per
dimension on the instrument by calculating the average of the averages per validated
E-Leader Budapest 2010
36
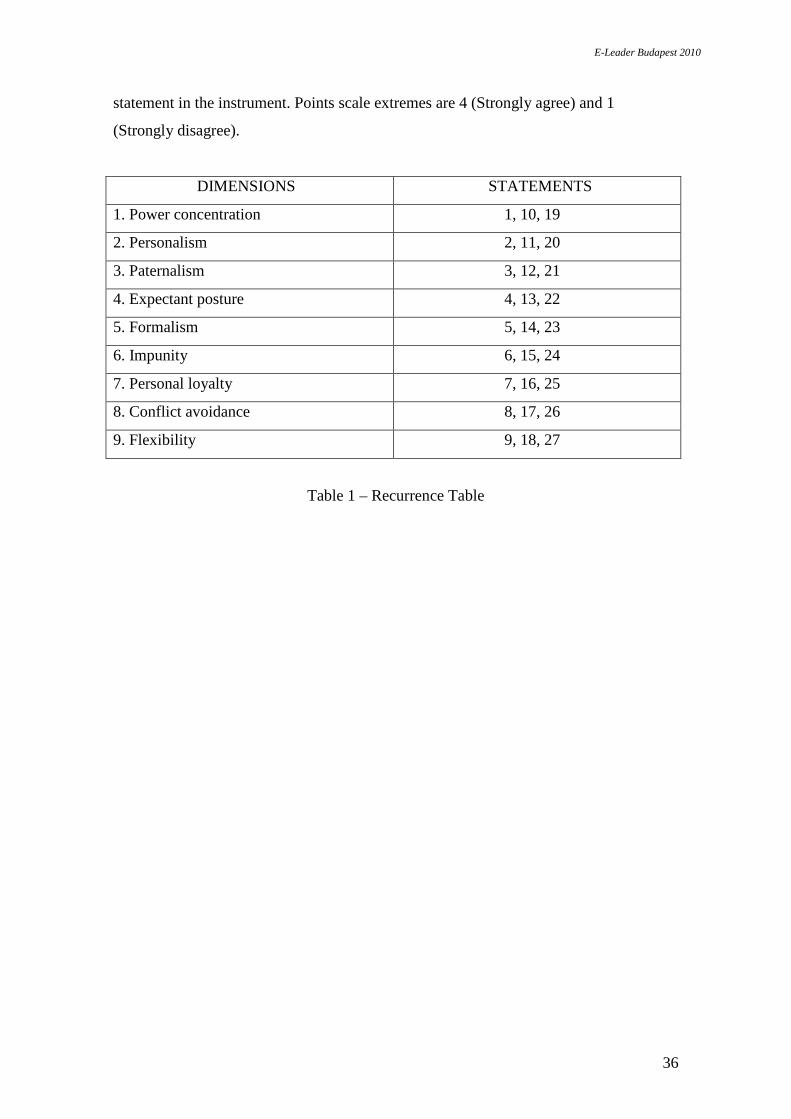
statement in the instrument. Points scale extremes are 4 (Strongly agree) and 1
(Strongly disagree).
DIMENSIONS STATEMENTS
1. Power concentration 1, 10, 19
2. Personalism 2, 11, 20
3. Paternalism 3, 12, 21
4. Expectant posture 4, 13, 22
5. Formalism 5, 14, 23
6. Impunity 6, 15, 24
7. Personal loyalty 7, 16, 25
8. Conflict avoidance 8, 17, 26
9. Flexibility 9, 18, 27
Table 1 – Recurrence Table

E-Leader Budapest 2010
37
APPENDIX 3 INSTRUMENTS TO MEASURE VALUE INNOVATION
VALUE INNOVATION DEVELOPMENT MODEL ENABLERS ASSESSMENT (E)
Instructions This self-assessment instrument focuses attention on some important areas of innovation management. Below you will find statements which describe “the way we do things around here” – the pattern of behaviour which describes how the organization handles the question of innovation. To the right of each statement circle the score between 0 (= not true at all) to 5 (= very true). Do it for all statements involving all dimensions.
Strategy
Scores
1.
Our innovation strategy is clearly communicated so everyone knows the targets for improvement
0 1 2 3 4 5
2.
People have a clear idea of how innovation can help us compete
0 1 2 3 4 5
3.
People know what our distinctive competence is – what gives us a competitive edge
0 1 2 3 4 5
4.
We look ahead in a structured way (using forecasting tolls and techniques) to try and imagine future threats and opportunities
0 1 2 3 4 5
5.
Our top team have a shared vision of how the company will develop through innovation
0 1 2 3 4 5
6.
There is top management commitment and support for innovation
0 1 2 3 4 5
7.
We have processes in place to review new technological or market developments and what they mean for our firm’s strategy
0 1 2 3 4 5
8.
There is a clear link between the innovation projects we carry out and the overall strategy of the business
0 1 2 3 4 5
Internal Processes
Scores
9.
We have processes in place to help us manage new product development effectively from idea to launch
0 1 2 3 4 5
10.
Our innovation projects are usually completed on time and within budget
0 1 2 3 4 5
11.
We have effective mechanisms to make sure everyone (not just marketing) understands customer needs
0 1 2 3 4 5
12.
We have effective mechanisms for managing process change from idea through to successful implementation
0 1 2 3 4 5
13.
We systematically search for new product ideas
0 1 2 3 4 5
14.
We have mechanisms in place to ensure early involvement of all departments in developing new products/processes
0 1 2 3 4 5
15.
We have a clear system for choosing innovation projects
0 1 2 3 4 5
16.
There is sufficient flexibility in our system for product development to allow small ‘fast-track’ projects to happen
0 1 2 3 4 5

E-Leader Budapest 2010
38
Organization
Scores
17.
Our organization structure does not stifle innovation but helps it to happen
0 1 2 3 4 5
18.
People work well together across departmental boundaries
0 1 2 3 4 5
19.
People are involved in suggesting ideas for improvements to products or processes
0 1 2 3 4 5
20.
Our structure helps us to take decisions rapidly
0 1 2 3 4 5
21.
Communication is effective and works top-down, bottom-up and across the organization
0 1 2 3 4 5
22.
Our reward and recognition system supports innovation
0 1 2 3 4 5
23.
We have a supportive climate for new ideas – people don’t have to leave the organization to make them happen
0 1 2 3 4 5
24.
We work well in teams
0 1 2 3 4 5
Linkages
Scores
25. We have good ‘win-win’ relationship with our suppliers 0 1 2 3 4 5
26.
We are good at understanding the needs of our customers/end-users
0 1 2 3 4 5
27.
We work well with universities and other research centres to help us develop our knowledge
0 1 2 3 4 5
28.
We work closely with our customers in exploring and developing new concepts
0 1 2 3 4 5
29.
We collaborate with other firms to develop new products or processes
0 1 2 3 4 5
30.
We try develop external networks of people who can help us – for example, with specialist knowledge
0 1 2 3 4 5
31.
We work closely with the local and national education system to communicate our needs for skills
0 1 2 3 4 5
32.
We work closely with ‘lead user’ to develop innovative new products and services
0 1 2 3 4 5
Learning
Scores
33. There is a strong commitment to training and development of people 0 1 2 3 4 5
34.
We take time to review our projects to improve our performance next time
0 1 2 3 4 5
35.
We learn from our mistakes
0 1 2 3 4 5
36.
We systematically compare our products and processes with other firms
0 1 2 3 4 5
37.
We meet and share experiences with other firms to help us learn
0 1 2 3 4 5
38.
We are good at capturing what we have learned so that others in the organization can make use of it
0 1 2 3 4 5
39.
We are good at learning from other organizations
0 1 2 3 4 5
40.
We use measurement to help identify where and when we can improve our innovation management
0 1 2 3 4 5

E-Leader Budapest 2010
39
Scoring Instructions (E)

E-Leader Budapest 2010
40
VALUE INNOVATION DEVELOPMENT MODEL CUSTOMER-ORIENTED PROCESSES ASSESSMENT (P)
Instructions
This self-assessment instrument focuses attention on some important phases of “the way we hear the voice of the consumers around here” – the pattern of behaviour which describes how the organization handles the question of market research. To the right of each statement circle the score between 0 (= not doing well at all) to 5 (= doing very well). Do it for all sub-dimensions involving all dimensions.
“Understand” Markets and Customers
Scores
1. Data collection and integration 0 1 2 3 4 5
2.
Customer data analysis
0 1 2 3 4 5
3.
Customer segmentation
0 1 2 3 4 5
“Create” Superior Customer Offerings
Scores
4.
Product/service offer and price
0 1 2 3 4 5
5.
Communication and branding
0 1 2 3 4 5
6.
Multi-client ownership/affinity partnership
0 1 2 3 4 5
“Gain” Profitable Customers
Scores
7.
Multi-channel management
0 1 2 3 4 5
8.
E-commerce
0 1 2 3 4 5
9.
Sales force automation
0 1 2 3 4 5
“Retain” Profitable Customers
Scores
10.
Customer service/customer care
0 1 2 3 4 5
11.
Loyalty programs
0 1 2 3 4 5
12.
Customer satisfaction
0 1 2 3 4 5

E-Leader Budapest 2010
41
Scoring Instructions (P)

E-Leader Budapest 2010
42
APPENDIX 4
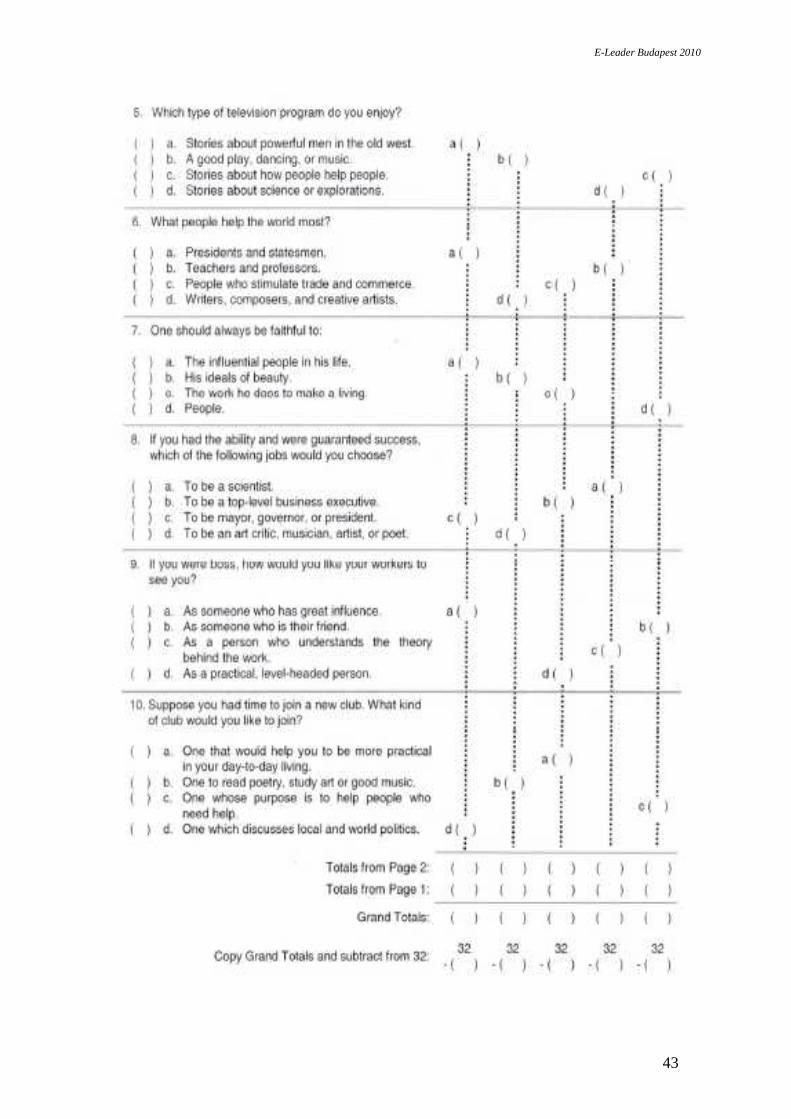
E-Leader Budapest 2010
43