Embed Size (px)
Citation preview

The Impact of New Teacher Induction on Teacher Practices and Student Learning
Marnie Thompson, Educational Testing Service
Pamela Paek, Pearson Educational Measurement
Laura Goe, Educational Testing Service
Eva Ponte, Berkeley Evaluation and Assessment Research Center
Paper presented at the
Annual Meeting of the American Educational Research Association
Montreal
April 13, 2005
Unpublished Work Copyright © 2005 by Educational Testing Service. All Rights Reserved. These materials are an unpublished, proprietary work of ETS. Any limited distribution shall not constitute publication. This work may not be reproduced or distributed to third parties without ETS's prior written consent. Submit all requests through www.ets.org/legal/copyright.html

Abstract
Induction programs for new teachers are gaining in popularity as a tool to slow new teacher turnover, strengthen teacher practice, and improve student learning. The California Formative Assessment and Support System for Teachers (CFASST) is a structured, two-year program for beginning teachers that is used as a key component in California’s Beginning Teacher Support and Assessment (BTSA) induction program. With the guidance of a trained, experienced teacher, beginning teachers learn best practices, plan lessons, reflect on their teaching, and apply what they have learned in their classrooms. This is facilitated by ongoing formative assessment in which beginning teachers and their support providers assess their teaching practice and set goals for professional growth. This study employed a quasi-experimental design to assess the impact of BTSA/CFASST on teacher practices and student achievement, by comparing teachers who had a high level of exposure to BTSA/CFASST to teachers who had little or no exposure. High exposure teachers were better at instructional planning and analyzing their practice, were more likely to ask students higher-order questions, and were more likely to provide substantive, specific feedback to students. The students of teachers who engaged with BTSA/CFAST at a high level outscored the students of low engagement teachers by an average of 0.25 standard deviations across six standardized tests. This held true even after controlling for school-to-school differences.
New Teacher Induction: The Answer to Teacher Quality Concerns?
Induction programs for new teachers have been identified as an important way to promote the intertwined goals of teacher quality, teacher retention, and student learning (Alliance for Excellent Education, 2004; American Federation of Teachers, 2001; Feiman-Nemser, Schwille, Carver, & Yusko, 1999; Feiman-Nemser, 2001; Joftus & Maddox-Dolan, 2002; Johnson, Birkeland, Kardos, Kauffman, Liu, & Peske, 2001; National Governor’s Association (NGA) Best Practices Center, 2002; Smith & Ingersoll, 2004; Villani, 2002; Wong, 2004;). Structured mentoring programs, whereby new teachers work closely with trained, experienced mentor teachers, are an important component of most induction programs (Feiman-Nemser, et al., 1999; Ingersoll, 2003; Wong, 2004). States, districts, and university-school partnerships are implementing such programs as a key element of preparing and sustaining quality professionals (Alliance for Excellent Education, 2004; American Federation of Teachers, 2001; NGA Best Practices Center, 2002; State Higher Education Executive Officers Eisenhower Coordinators Network (SHEEO), 1999; Wang, Mifsud, & Tregidgo, 2002; Youngs, 2003).
The “theory of action” for new teacher induction is that providing support to beginning teachers should increase the likelihood that they will stay in their jobs and do their jobs well. This, in turn, should lead to improved student learning (Darling-Hammond, 1997; Feiman-Nemser et al., 1999; National Commission on Teaching & America's Future, 2001). The intuitive appeal of this logic has led policymakers to explore and fund induction programs at greater levels than ever before. By 2001, thirty-three states had instituted some kind of policy statement about new teacher induction; twenty-two states mandated induction for at least some teachers (American Federation of Teachers, 2001). Fifteen states provided at least some funding for induction and required it for all new teachers (Skinner & Staresina, 2004). With accountability pressures mounting, especially the teacher quality provisions of No Child Left Behind, states and districts are increasingly turning to induction programs to slow teacher turnover and improve teacher practices, and hence, student outcomes.
The relationship among these three goals is well-illustrated in a recent study conducted by Eric Hanushek and colleagues (2005) that documents empirically what we know through common sense: new teachers simply aren’t as effective as their more experienced colleagues. A good way to improve student outcomes, then, is to reduce the proportion of teachers who are new in each year, by putting a brake on new teacher turnover. When teachers stay in the profession past the first few years, they solidify their teaching skills in ways that translate to better student outcomes (Claycomb & Hawley, 2000; Hanushek, 2005). Researchers and policymakers have likened the phenomenon of high turnover in the first years of teaching to a “revolving door” or a “leaky bucket” (Darling-Hammond, 1997; Ingersoll, 2003).
The issue of high turnover in teachers’ early years particularly plagues schools that serve poor children and children of color, with some districts reporting annual turnover rates that exceed 40% for their new teachers (National Center for Teaching and America’s Future, 2003). Much of the focus of concern about this issue has been on urban schools (e.g., National Partnership for Excellence and Accountability in Teaching, 2000; National Partnership for Teaching in At-Risk Schools, 2005), but rural schools that serve poor communities also suffer from high turnover of new teachers (Beeson & Strange, 2003).
The Impact of New Teacher Induction on Teacher Practices and Student Learning 1

There is a growing body of research surrounding the issue of how and why new teachers leave the profession. Henke, Chen, Geis & Knepper (2000) suggested that new teachers do not change jobs in any greater degree than other young adults, but others, notably Ingersoll (2003), have demonstrated that there is a degree of churn in the profession that not only outstrips other professions, but also has serious implications for the quality of children’s educational experiences. Ingersoll makes a distinction between “movers” (teachers who change schools) and “leavers” (those who leave the profession entirely), and then points out that much labor market research only counts leavers. In Ingersoll’s view, the phenomenon of teachers changing schools has the same bad effect on the students and staff left behind as teachers leaving the profession.
Researchers at the Southeast Center for Teaching Quality have studied working conditions to gain some insight into the specific issues that push teachers out the door (Hirsch, 2005). They found that weak school leadership and lack of adequate time to prepare lessons and work with students were teachers’ greatest concerns, and that these correlated strongly with teacher turnover. Research studies conducted by Susan Moore Johnson and the Project on the Next Generation of Teachers at Harvard University (2001, 2004) suggest that the current generation of new teachers is qualitatively different from previous generations. Unlike previous cohorts of new teachers, this generation has many other employment options. Young teachers enter teaching to tackle a professional challenge, and they expect support to help them succeed. If they don’t get that support, they leave. According to Johnson and colleagues,
School structures and practices forged in a bygone era are no longer adequate to support teachers’ development or students’ learning. They perpetuate private practice, fail to acknowledge the unique developmental needs of new teachers, and, in many cases, leave new teachers to sink or swim on their own. Yet some new teachers have the good fortune to work at schools that deliberately and thoughtfully attract and retain them. These schools are “finders and keepers.” (Johnson et al., 2004, page 8)
Within this understanding of the causes of teacher turnover, new teacher induction programs can be useful in overcoming the isolation and lack of professional support cited by Johnson et al.
Whatever its causes, the revolving door phenomenon in schools that serve poor children has a strong negative effect on educational outcomes, and thus it has to be viewed as a contributor to the achievement gap. Historical patterns of reduced resources and attention provided to schools that serve Black, Latino, and poor children have created difficult working conditions and damaged relationships between schools and students and their families. To offset these conditions, it would make sense to staff schools that serve poor populations with the most capable teachers, those who have been equipped with strategies for surviving and thriving in such settings.
Unfortunately, difficult working conditions and personal choices have combined to fuel the flight of experienced teachers from these schools. Poor schools are disproportionately staffed by inexperienced teachers (Mayer, Mullens, & Moore, 2000), many of whom have also entered the profession through alternative routes that have short-changed their understanding of the subjects they teach and/or how teach them (National Center for Education Statistics, 2001). This creates a vicious cycle in which new teachers are unlikely to succeed, which in turn fuels their departures
The Impact of New Teacher Induction on Teacher Practices and Student Learning 2
for schools with better working conditions or from the profession altogether. Each cohort of new teachers is replaced with the next cohort of inexperienced, under-prepared teachers, thus ensuring the perpetuation of the cycle. The imperative to move new teachers into effectiveness quickly in such schools is thus very strong. Research on the uneven distribution of teachers (in terms of teacher quality) suggests that indeed, a good portion of the so-called “achievement gap” is in fact attributable to what might be thought of as a “teaching gap” (Clotfelter, Ladd & Vigdor, 2002; Darling-Hammond, 1999; Darling-Hammond & Youngs, 2002; Goe, 2002). Thus, programs that slow down or stop the “revolving door” can be seen as essential elements in educational policy designed to promote equitable outcomes.
Measuring Induction’s Effectiveness
Despite all this attention to induction, empirical research demonstrating the actual effects of induction with regard to teacher retention, teaching practices, and student achievement is relatively thin (Lopez, Lash, Schaffner, Shields, & Wagner, 2004). Descriptive qualitative studies (e.g., Britton, Paine, Pimm & Raizen, 2003; Carver, 2004; Villani, 2002; Wong, 2004) have provided some information on the nature of mentoring and other induction activities and help us to understand the causal mechanisms by which induction may lead to improved teacher practices and better retention. Small sample pre-post studies and non-experimental correlational studies (e.g., Feiman-Nemser, et al., 1999; Serpell & Bozeman, 1999; Villar, Moir, Barrett, Strong, Baron, Fletcher, & Achinstein, 2003; Wong, 2002, 2003.) have demonstrated the potential of induction to positively influence retention and teacher practices. But the field is only now accumulating more rigorous quantitative studies that address the question of whether and to what degree high quality induction programs impact teacher retention, teacher practices, and student achievement.
Mounting rigorous studies of a complex intervention like induction is methodologically challenging and requires larger resources than have typically been available to induction researchers. First, there are practical difficulties in mounting comparison studies when programs are implemented system-wide, or with specific populations of new teachers who are different from other new teachers (e.g., only alternative certification teachers may be required to participate), as has often been the case with induction. Second, reliably assessing teacher practices through classroom observation, the gold standard for knowing what teachers actually do, is time-consuming and very expensive. Third, it is often difficult to obtain student achievement data traceable to specific teachers for large enough samples of teachers in “treated” and “untreated” groups (teachers being the proper unit of analysis when evaluating a program aimed at changing teacher practices). Nevertheless, with induction receiving so much attention these days, policymakers are recognizing of the need to establish its effectiveness using rigorous, scientifically based designs. For this reason, the Department of Education recently initiated a random assignment study of induction’s effects, to be conducted in twenty school districts from across the country that are dealing with high levels of teacher turnover (National Center for Education Evaluation and Regional Assistance, 2004). It is expected that this study will take five years to complete, and will cost upwards of $5 million.
While we wait for the results of this comprehensive study to come in, policymakers interested in induction can look to quasi-experimental or large-sample correlational studies. With regard to induction’s impact on teacher retention, Richard Ingersoll and Thomas Smith’s longitudinal
The Impact of New Teacher Induction on Teacher Practices and Student Learning 3
analyses of data from the NCES Schools and Staffing Survey (Ingersoll, 2003; Smith & Ingersoll, 2004) show that high quality induction can cut new teacher turnover by more than half, from 40% to 18%.
The present study, which evaluates the impact of the California Formative Assessment and Support System for Teachers (CFASST), an induction program in wide use in California, makes an empirical connection between induction, changes in teacher practices, and improved student learning, thus addressing another gap in the research base. In the remainder of this paper, we will briefly describe the CFASST program, give an overview of the study’s methodology, present the findings of the study, and finally discuss those results in the context of the issues discussed in the preceding section.
The California Formative Assessment and Support System for Teachers
The California Formative Assessment and Support System for Teachers (CFASST) is a prime example of a formal induction program that is delivered through a combination of state and district efforts. CFASST is a structured, two-year program for beginning teachers that is used as a part of the state’s Beginning Teacher Support and Assessment (BTSA) program. CFASST was co-developed by the California Commission on Teacher Credentialing, (CCTC) the California Department of Education (CDE), and Educational Testing Service (ETS) in 1998, to serve as a central component of BTSA’s induction “curriculum.” The program began as a one-year program that was piloted in a small number of school districts in its early years. By the 2002-2003 school year, CFASST had expanded to cover the first two years of teaching, and it was in use in 133 of the 142 BTSA programs in the state. (The remaining programs utilized other induction models that also met the state’s Standards of Quality and Effectiveness for Professional Teacher Induction Programs (CCTC, 2002)).
CFASST provides a series of twelve “events” (six in each year) based on the California Standards for the Teaching Profession (CSTP). The CSTP provide a definition of what constitutes good teaching; having a shared definition of good teaching has been described as essential to the success of induction programs (Alliance for Excellent Education, 2004; Johnson, et al., 2004). With the guidance of an experienced teacher who has been trained as a support provider, beginning teachers work through the CFASST events by gathering information about best practices, planning lessons, and receiving feedback on their teaching through observations by their support provider. Beginning teachers also reflect on their practice and develop ways of applying what they have learned to future lessons. This is facilitated by ongoing formative assessment in which the beginning teacher and his or her support provider assess the teaching practice of the novice and set goals for professional growth, using a formative assessment tool based on the CSTP, called the Descriptions of Practice (DOP). (For more information about the purpose and content of the BTSA/CFASST program, including the CSTP and the DOP, see California Commission on Teacher Credentialing and the California Department of Education, 1999a, 1999b.)
Background on this Study
By 2002, BTSA/CFASST was in wide use across the state in a relatively mature form, and policymakers in the state were eager to see if the program was having the impact on teacher
The Impact of New Teacher Induction on Teacher Practices and Student Learning 4
practices and student achievement that had been hoped for when it was first developed. CCTC issued a Request for Proposals to conduct a Study of the Impact of Approved Induction Programs on Student Learning (IAIPSL) in the spring of 2002, and ETS won the competition. The research described in this paper is the result of the IAIPSL effort. The study began in July, 2002 and continued through April, 2004, with data collection occurring in the 2002-2003 school year. The study was investigated the implementation and impact of BTSA/CFASST, by addressing three research questions:
What is the impact of BTSA/CFASST on the teaching effectiveness of beginning teachers who participate in the program?
What is the impact of BTSA/CFASST on the learning of the students of beginning teachers who participate in the program?
What are the features of successful BTSA/CFASST programs that make them more effective in impacting beginning teachers’ growth as teachers?
The IAIPSL Study resulted in a series of detailed technical reports that presented the methods and findings of distinct phases of data collection and analysis that comprised the larger study:
Thompson, Goe, Paek, & Ponte. (2004). Report 1: Beginning Teachers’ Engagement with BTSA/CFASST (Main Data Sources: Surveys and interviews of BTSA/CFASST graduates)
Thompson, Paek, Goe, & Ponte. (2004a). Report 2: Relationship of BTSA/CFASST and Teacher Practices (Main Data Source: Case studies of BTSA/CFASST teachers)
Thompson, Paek, Goe, & Ponte. (2004b). Report 3: Relationship of BTSA/CFASST and Student Achievement (Main Data Source: Student achievement scores)
Thompson, Ponte, Paek, & Goe. (2004). Report 4: Methodological Considerations and Recommendations for Future Research (Main Data Source: Internal reviews of the IAIPSL evaluation process)
Full copies of these reports, including instrumentation, are available at http://www.ets.org/research/CFASST.html. This paper draws primarily from the first three reports and focuses on the first two research questions, impact on teaching practices and student achievement.
Method
The IAIPSL study employed a quasi-experimental design to investigate the implementation of BTSA/CFASST and its impact on teacher practices and student outcomes. The study sample was drawn from the population of teachers who were in their third year of teaching in the 2002-2003 school year and who had participated in BTSA in their first two years of teaching.
Because BTSA is a statewide program for all new teachers with Multiple or Single Subject preliminary credentials, there was no natural control group by which to estimate program impacts. That is, the only beginning teachers who were not enrolled in BTSA were distinctly
The Impact of New Teacher Induction on Teacher Practices and Student Learning 5

different from those who were enrolled, in that they entered the profession with less pre-service preparation. Furthermore, in 2002-2003, almost every BTSA program in the state employed CFASST as a central component. Thus, identifying a large enough “untreated” comparison group was an early challenge.
To construct a suitable comparison group, we capitalized on a feature of BTSA/CFASST implementation that had been identified in previous studies (Thompson, 2001; WestEd, 2002), namely that implementation of BTSA and CFASST was highly variable in quality across and within programs, such that some BTSA enrollees engaged with the program in a deep and sustained way, while others received far less of the “treatment.” A considerable portion of engagement variability stems from program-level differences in such matters as ease and frequency of access to support providers; time to meet and work on the CFASST events; and training and monitoring of support providers. This allowed us to identify a sample of BTSA graduates who had a high level of engagement with BTSA/CFASST and compare them to a sample that had less engagement with the program. It is important to note that our use of this retrospective quasi-experimental design reframed the research questions slightly. The design we were able to implement allowed us to answer questions about whether BTSA/CFASST, when implemented so that teachers have a high degree of engagement with the program, has an impact on teacher practices and student learning.
Using a variety of program quality measures, 78 BTSA programs were identified for survey research. Within these programs, 1,125 third-year BTSA “graduates” who teach in grades 3 to 5 were asked to complete surveys concerning their BTSA and CFASST experiences. Responses were received from 287 teachers from 107 school districts affiliated with 78 BTSA programs (a response rate of 26%). The survey sample was found to be consistent with its statewide counterpart with respect to the characteristics of the schools the teachers work in. (See Tables A and B in the Appendix.)
Survey results were used to calculate a “CFASST engagement score” for each respondent, based on teachers’ responses to items pertaining to four dimensions of BTSA/CFASST implementation: 1) District and school support for BTSA/CFASST; 2) Support Provider Availability/Access; 3) Rapport Between Support Provider and Beginning Teacher; and 4) Substantive Focus on Teaching and Learning. Respondents were classified into high, middle, or low CFASST engagement levels based on their scores.
A number of perspectives informed our choice of where to place the cut-points that distinguished the low and high engagement groups. We initially considered drawing the cut points close to the extremes of the score scale, in order to magnify the contrast between the groups and maximize the chance of a statistically significant result. However, practical and methodological considerations led us to a simple trichotomization of the CFASST engagement score distribution in which the low and high engagement groups were separated from one another by one standard deviation on the CFASST engagement score scale. In practical terms, this approach provided us with a sufficient number of cases in the high and low engagement groups to accommodate some degree of attrition in later steps of the research. In methodological terms, keeping the high and low groups fairly close together makes the results of the study more meaningful, in that any differences we might find in outcomes are not likely to be the product of an extreme set of circumstances that would be difficult to replicate.
The Impact of New Teacher Induction on Teacher Practices and Student Learning 6
We contacted a sub-sample of 64 survey respondents for further study, drawing from the top and bottom of the scale of CFASST engagement. These 64 teachers were interviewed by phone to verify the reliability and validity of the survey data, to provide more nuanced information about their experiences in the program, and to recruit a sample of teachers for case studies. From the 64 teachers who were interviewed by phone, we recruited 34 teachers for blind case studies that involved classroom observations and face-to-face interviews, for the purpose of examining their teaching practices.
Prior to beginning the case studies, we identified ten teaching practices that have been empirically and/or theoretically linked with effective teaching:
Quality of Instructional Planning Quality of Reflection on Practice Proportion of Questions Asked that are at the Deep Level Proportion of Questions Asked that are at the Intermediate Level Proportion of Questions Asked that are Open-Ended Proportion of Feedback Instances that are Positive Proportion of Feedback Instances that are Instructional in Focus Proportion of Feedback Instances that are Substantive and Specific Depth of Student Understanding Scores on the California Standards for the Teaching Profession (CSTP)
By associating these measures of teaching practice with the CFASST engagement ratings derived from the survey, we were able to examine the relationship between engagement with the BTSA/CFASST program and teaching practice. We hypothesized that the higher a teacher’s CFASST engagement level, the stronger their teaching practices would be.
Data were collected during the period March to May, 2003 on the measures of teaching practice, using an observationally based case study methodology. Each teacher was visited in his or her classroom two times (except for one teacher who was visited only one time). During each visit, a trained researcher observed and videotaped an English language arts lesson, interviewed the teacher about the lesson, and talked with students about what they had learned. Following the classroom visit, the observer reviewed the observation and interview data, creating a set of codes and scores for each teacher. The observer than passed the videotapes and interview records to a second researcher (the “video reviewer”) who independently reviewed the record to reach his or her own conclusions about the lesson. Then the lead observer and the video reviewer conferred to develop a joint assessment of the evidence. For each measure of teaching practice, we created an average score for each teacher, using the final scores from the two classroom visits. (We used the single score for the teacher who was observed only one time.)
Though our original intention was to draw the case study sample from the high and low engagement groups only, recruitment difficulties led to a sample that exemplified less contrast. Of the 34 teachers who ultimately participated in the case studies, fifteen were in the high CFASST engagement group, seven were in the middle group, and twelve were in the low CFASST engagement group. Though the three groups were similar in most ways, teachers with high CFASST engagement taught at schools with higher Academic Performance Index (API) scores (110 points higher on average; API is a California school-level performance indicator that
The Impact of New Teacher Induction on Teacher Practices and Student Learning 7

reflects a school’s performance on statewide student assessments) and fewer low SES students than the schools of teachers with low CFASST engagement. Though these differences were not statistically significant, they bear consideration in interpreting the results of the study.
To estimate the impact of BTSA/CFASST on student learning, we sought data from California’s achievement testing program for the students of the 287 survey respondents. We received usable data for 144 teachers (45 teachers were in the high CFASST engagement group, 71 were in the middle engagement group, and 28 were in the low engagement group), a 50% return rate. The test score data represent the full battery of standardized tests administered to grade 3 to 5 students under the California Standardized Testing and Reporting program, known as STAR. Students take a battery of nationally normed tests (Reading, Language, Spelling, and Math) called the California Achievement Test, Edition 6 (or CAT-6). This battery includes extra items added to achieve better alignment with the content standards of the State. Because the CAT-6 is a norm-referenced test, scores are represented as percentile ranks, ranging from 0.1 to 99.9 for each grade. Students also take two criterion-referenced tests, the California Standards Tests in English Language Arts (CST-ELA) and Math (CST-Math). The CST scores are on a five-point ordinal scale, where 1 = far below basic, 2 = below basic, 3 = basic, 4 = proficient, and 5= advanced.
By linking these test scores with CFASST engagement ratings, we were able to examine the relationship between teachers’ engagement with BTSA/CFASST and student learning. We hypothesized that the higher a teacher’s CFASST engagement level, the better their students would do on the STAR tests. To address effects contributed at the school level, we relied on API score, a school-level performance indicator that is commonly used in California evaluation and policy analysis. School API is a numeric index between 200 and 1000 that reflects a school’s performance on the statewide student assessments used in the STAR program. Using API as a covariate, we can be reasonably assured that any differences in the performance of students of high and low CFASST teachers were not the result of differences between schools that have nothing to do with the program being investigated. Because school API score is, sadly, inversely related to the proportion of a school’s students who are poor, non-white, and English Language Learners, we also can effectively control for these variables through its use as a covariate.
We also looked at the influence of several student-level variables that are statistically associated with lower performance (low socio-economic status, being an English language learner, and having a disability designation), to weigh the relative contributions of these factors against the influence of BTSA/CFASST.
Beginning Teachers’ Engagement with BTSA/CFASST
Findings from the survey indicated that most teachers had some form of orientation (all but 5%) and a support provider (except for 7% of teachers the first year and 3% the second year; numbers that, though low, represent a challenge to the core of the BTSA/CFASST experience). Just over half of the teachers said that their principals were at least generally aware of and somewhat supportive of BTSA/CFASST. This means that almost half the teachers felt their principals were unaware or unsupportive. The majority of teachers (more than 70%) thought that their support providers were “warm and supportive,” and tended to trust them to the point of feeling comfortable enough to “share everything” with them. A majority of teachers felt they were well
The Impact of New Teacher Induction on Teacher Practices and Student Learning 8

matched to their support providers on multiple dimensions (personality and experience with teaching similar subject matter, grade levels, and students). Three-fifths of beginning teachers had support providers who were located in the same school, meaning that two-fifths had remote support providers. There was high variability in terms of the frequency of meetings between the beginning teachers and their support providers, ranging from less than once a month to more than once a week. For half the beginning teachers, meetings with their support providers lasted between 30 minutes and an hour, with another third saying that their meetings lasted for longer than an hour. For most teachers, the primary focus of the meetings was on emotional support, with instructional support and support for managing student behavior coming just behind. About half of the teachers reported completing all the CFASST events, with others completing several, a few, or none.
A large majority of teachers reported that they improved in specific aspects of teaching through their support provider’s help. For each aspect of teaching, most teachers reported agreement with the statement about improvement, except reflection, where the largest number reported strong agreement. The area of communication with parents seems to be one place in which some beginning teachers felt they had less help. (See Tables C and D in the Appendix for more detailed reporting of survey results.)
Interview data confirmed these findings and also revealed that having a support provider was often identified as one of the best, if not the best part of being in BTSA. Interview data also indicated a strong relationship between CFASST engagement and having an on-site support provider, although the reasons for that relationship were not clear. The interview data also gave voice to teacher complaints about the program, the primary one being the large amount of paperwork required. A related complaint concerned the repetitive and time-consuming nature of the program. A cross-analysis of the survey and interview data confirmed the CFASST engagement levels generated from the survey: 29% low engagement, 45% mid-level engagement, and 26% high engagement. There was a small but statistically significant correlation between CFASST engagement and school API score (r =.14, p<.05).
BTSA/CFASST Engagement and Teacher Practices
Comparing the high and low CFASST engagement groups with regard to teaching practices (Table 1), we found one measure that showed a statistically significant difference: Instructional Planning (p<.01).
For seven of the ten measures of teaching practice, the high engagement group had a greater mean score than the low engagement group: Instructional Planning, Reflection on Practice, Proportion of Questions that are Intermediate, Proportion of Questions that are Open, Proportion of Feedback that is Positive, Proportion of Feedback that is Substantive and Specific, and Depth of Student Understanding. On the three remaining measures (Proportion of Questions that are Deep, Proportion of Feedback that is Instructional, and CSTP Score) the score differences were close to zero.
The Impact of New Teacher Induction on Teacher Practices and Student Learning 9

Table 1. Mean Scores and Effect Sizes of Measures of Teaching Practice, by CFASST Engagement Level
Low CFASST Engagement (N=12) High CFASST Engagement (N=15)Measure of Teaching Practice
Mean SD Range Mean SD Range Effect Size*
Instructional Planning 17.3 1.4 16-20 19.5 1.6 17-22 1.46 Reflection on Practice 31.9 4.1 25-38 33.1 3.0 28-40 0.33 % Deep Questions 2.2 2.9 0-8 2.0 3.3 0-11 -0.06 % Intermediate Questions 29.1 17.4 6-59 34.7 20.0 5-68 0.30 % Open Questions 27.0 21.1 0-66 32.2 20.9 0-76 0.25 % Positive Feedback 82.2 16.4 36-98 85.4 11.0 62-100 0.23 % Instructional Feedback 85.5 14.9 7-98 84.9 12.7 56-100 -0.04 % Substantive/Specific Feedback 15.0 8.9 2-32 19.9 9.4 9-44 0.54 Depth of Student Understanding 1.6 0.4 1.1-2.5 1.7 0.4 1.2-2.4 0.25 CSTP Score 56.1 12.5 34-70 55.7 10.1 38-74 -0.04
Median Effect Size 0.25 * Cohen’s d
If BTSA/CFASST had no effect on teachers’ practices, we would expect the low CFASST group means to be larger than the high CFASST group means on roughly half the measures, since the correlations among the measures was not high (see Table E in the Appendix). These generally positive patterns were reflected in the effect sizes for the ten measures of teaching practice. These range from near zero to 1.46 standard deviations (SDs), with most in the range of 0.23 to 0.54. The median effect size is 0.25 SDs; the mean is 0.32 SDs. (Given the dispersion pattern of the distribution, we believe the median is the more appropriate indicator of central tendency.)
It is important to remember that we are talking about effect size with regard to teaching practices, which does not translate directly into equivalent effects on student outcomes. Some practices having a higher “gearing” than others, meaning that small improvements in these practices leverage large changes in student learning. By way of example, research on the effects of improved questioning techniques and the provision of specific, instructionally focused feedback suggests that such improvements in practice can lead to substantial gains in student learning (Black & Wiliam, 1998; Black, Harrison, Lee, Marshall & Wiliam, 2002). The impact on students of a change in any particular teaching practice depends on the nature, frequency, and centrality of that teaching practice.
BTSA/CFASST Engagement and Student Learning
Across all six STAR sub-tests, we found that the students of teachers who had a high level engagement with BTSA/CFASST outscored the students of teachers with a low level of engagement with the program, after controlling for API (see Table 2). Though none of these score differences were statistically significant, the consistency of the direction of results across all tests is suggestive that BTSA/CFASST has a positive impact on student test scores. The effect size results were consistent with these small and consistently positive findings. Effect sizes ranged from .03 to 0.40 standard deviations, with a median effect size of 0.25 standard deviations (here the median is equivalent to the mean). The greatest effect size was for the CAT-6 Math test (0.40 SDs), with most in the .20s and .30s.
The Impact of New Teacher Induction on Teacher Practices and Student Learning 10
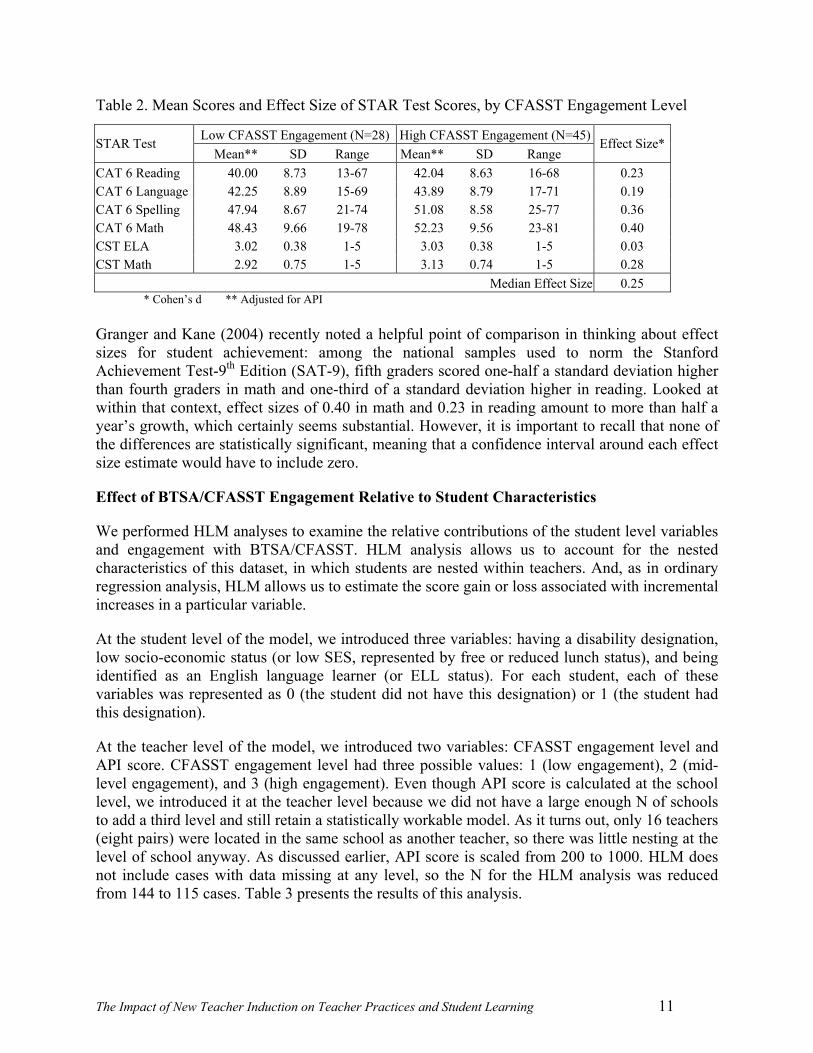
Table 2. Mean Scores and Effect Size of STAR Test Scores, by CFASST Engagement Level
Low CFASST Engagement (N=28) High CFASST Engagement (N=45) STAR Test Mean** SD Range Mean** SD Range
Effect Size*
CAT 6 Reading 40.00 8.73 13-67 42.04 8.63 16-68 0.23 CAT 6 Language 42.25 8.89 15-69 43.89 8.79 17-71 0.19 CAT 6 Spelling 47.94 8.67 21-74 51.08 8.58 25-77 0.36 CAT 6 Math 48.43 9.66 19-78 52.23 9.56 23-81 0.40 CST ELA 3.02 0.38 1-5 3.03 0.38 1-5 0.03 CST Math 2.92 0.75 1-5 3.13 0.74 1-5 0.28
Median Effect Size 0.25 * Cohen’s d ** Adjusted for API
Granger and Kane (2004) recently noted a helpful point of comparison in thinking about effect sizes for student achievement: among the national samples used to norm the Stanford Achievement Test-9th Edition (SAT-9), fifth graders scored one-half a standard deviation higher than fourth graders in math and one-third of a standard deviation higher in reading. Looked at within that context, effect sizes of 0.40 in math and 0.23 in reading amount to more than half a year’s growth, which certainly seems substantial. However, it is important to recall that none of the differences are statistically significant, meaning that a confidence interval around each effect size estimate would have to include zero.
Effect of BTSA/CFASST Engagement Relative to Student Characteristics
We performed HLM analyses to examine the relative contributions of the student level variables and engagement with BTSA/CFASST. HLM analysis allows us to account for the nested characteristics of this dataset, in which students are nested within teachers. And, as in ordinary regression analysis, HLM allows us to estimate the score gain or loss associated with incremental increases in a particular variable.
At the student level of the model, we introduced three variables: having a disability designation, low socio-economic status (or low SES, represented by free or reduced lunch status), and being identified as an English language learner (or ELL status). For each student, each of these variables was represented as 0 (the student did not have this designation) or 1 (the student had this designation).
At the teacher level of the model, we introduced two variables: CFASST engagement level and API score. CFASST engagement level had three possible values: 1 (low engagement), 2 (mid-level engagement), and 3 (high engagement). Even though API score is calculated at the school level, we introduced it at the teacher level because we did not have a large enough N of schools to add a third level and still retain a statistically workable model. As it turns out, only 16 teachers (eight pairs) were located in the same school as another teacher, so there was little nesting at the level of school anyway. As discussed earlier, API score is scaled from 200 to 1000. HLM does not include cases with data missing at any level, so the N for the HLM analysis was reduced from 144 to 115 cases. Table 3 presents the results of this analysis.
The Impact of New Teacher Induction on Teacher Practices and Student Learning 11
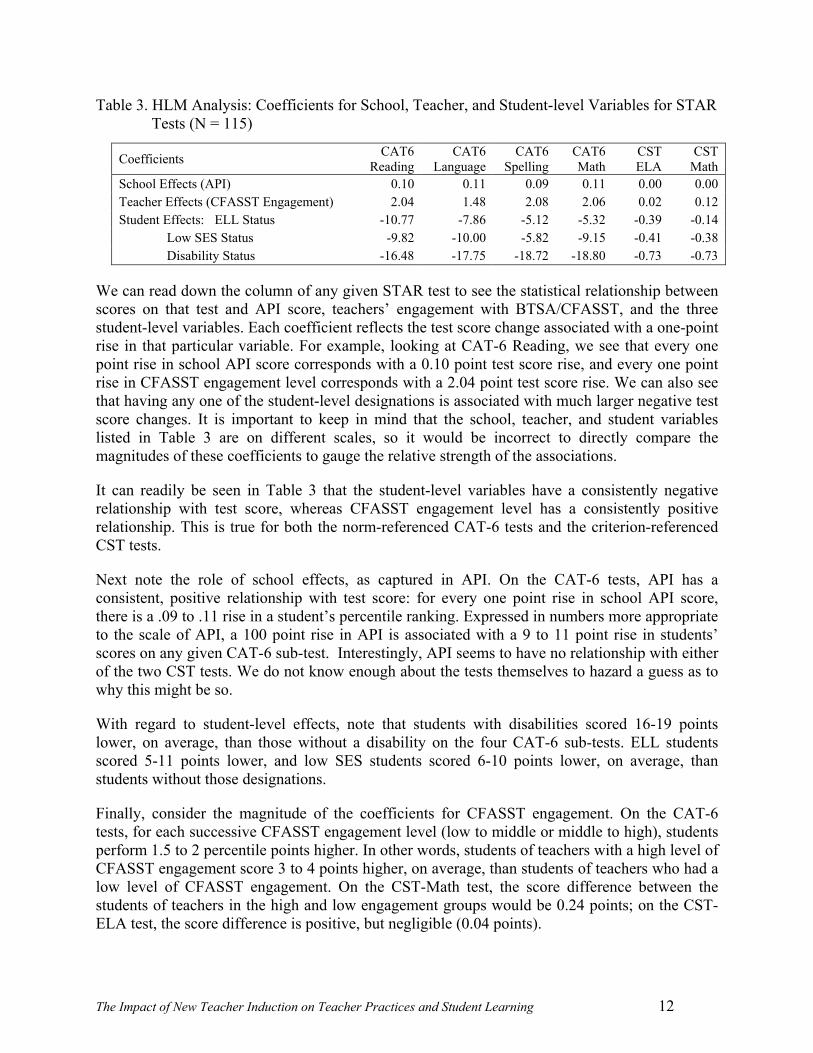
Table 3. HLM Analysis: Coefficients for School, Teacher, and Student-level Variables for STAR Tests (N = 115)
Coefficients CAT6 Reading
CAT6 Language
CAT6 Spelling
CAT6 Math
CST ELA
CST Math
School Effects (API) 0.10 0.11 0.09 0.11 0.00 0.00 Teacher Effects (CFASST Engagement) 2.04 1.48 2.08 2.06 0.02 0.12 Student Effects: ELL Status -10.77 -7.86 -5.12 -5.32 -0.39 -0.14 Low SES Status -9.82 -10.00 -5.82 -9.15 -0.41 -0.38 Disability Status -16.48 -17.75 -18.72 -18.80 -0.73 -0.73
We can read down the column of any given STAR test to see the statistical relationship between scores on that test and API score, teachers’ engagement with BTSA/CFASST, and the three student-level variables. Each coefficient reflects the test score change associated with a one-point rise in that particular variable. For example, looking at CAT-6 Reading, we see that every one point rise in school API score corresponds with a 0.10 point test score rise, and every one point rise in CFASST engagement level corresponds with a 2.04 point test score rise. We can also see that having any one of the student-level designations is associated with much larger negative test score changes. It is important to keep in mind that the school, teacher, and student variables listed in Table 3 are on different scales, so it would be incorrect to directly compare the magnitudes of these coefficients to gauge the relative strength of the associations.
It can readily be seen in Table 3 that the student-level variables have a consistently negative relationship with test score, whereas CFASST engagement level has a consistently positive relationship. This is true for both the norm-referenced CAT-6 tests and the criterion-referenced CST tests.
Next note the role of school effects, as captured in API. On the CAT-6 tests, API has a consistent, positive relationship with test score: for every one point rise in school API score, there is a .09 to .11 rise in a student’s percentile ranking. Expressed in numbers more appropriate to the scale of API, a 100 point rise in API is associated with a 9 to 11 point rise in students’ scores on any given CAT-6 sub-test. Interestingly, API seems to have no relationship with either of the two CST tests. We do not know enough about the tests themselves to hazard a guess as to why this might be so.
With regard to student-level effects, note that students with disabilities scored 16-19 points lower, on average, than those without a disability on the four CAT-6 sub-tests. ELL students scored 5-11 points lower, and low SES students scored 6-10 points lower, on average, than students without those designations.
Finally, consider the magnitude of the coefficients for CFASST engagement. On the CAT-6 tests, for each successive CFASST engagement level (low to middle or middle to high), students perform 1.5 to 2 percentile points higher. In other words, students of teachers with a high level of CFASST engagement score 3 to 4 points higher, on average, than students of teachers who had a low level of CFASST engagement. On the CST-Math test, the score difference between the students of teachers in the high and low engagement groups would be 0.24 points; on the CST-ELA test, the score difference is positive, but negligible (0.04 points).
The Impact of New Teacher Induction on Teacher Practices and Student Learning 12
Among all the tests, CFASST engagement showed the largest effect size with regard to the CAT-6 Math test, so it is illustrative to look more closely at the HLM results for this test. On this test, students of high CFASST engagement teachers score, on average, 4.12 percentile points higher than students of low CFASST engagement teachers. This almost offsets the negative effect of ELL status (–5.32 points) and partially offsets the negative influence of low SES (–9.15 points). With regard to disability (–18.80 points), the gain associated with BTSA/CFASST seems small, but it is still a step in a positive direction. In other words, while BTSA/CFASST, by itself, does not seem to wipe out the relationships with being poor, being an English language learner or having a disability, it certainly counteracts them.
Discussion
Overall, our findings show a positive relationship between level of engagement with BTSA/CFASST, teacher practices, and student achievement. The lack of statistical significance for most outcome measures means that we must be cautious in interpreting the results, but the fact that there were positive effects both for teachers and for students is especially encouraging, as it supports our model of how BTSA/CFASST works: the support of an experienced teacher, the curriculum of CFASST events, and the formative assessment aspects of BTSA/CFASST combine to improve beginning teachers’ practices. These improved practices, in turn, lead to improved student learning. The results of this study have relevance to other mentor-based induction programs, to the degree that they have similar components and are implemented so that teachers have a high level of sustained engagement.
Along with these generally positive findings, there are some results that beg further discussion. First, with regard to the findings of impact on teacher practices, we hypothesized that teachers who had high engagement with BTSA/CFASST would outscore low engagement teachers on every measure, yet this did not occur for all measures, or equally across measures, as can be seen in the wide range of effect sizes. In the discussion of these results in the technical report on this aspect of the study, we offer possible explanations for the varying results we obtained, based on our observations of the measurement properties of the instruments used and speculation about the specific ways that BTSA/CFASST impacts teachers—see Thompson, Paek, Goe, & Ponte, 2004a. Further research is needed to understand the source of these variations.
Similarly, we note that there is variability in the effect sizes among the six achievement tests. The essentially zero effect size for the CST-ELA test stands out as markedly different, and gives us pause to wonder what is different about this test, and the language arts learning that it assesses, since the three CAT-6 tests that assess aspects of language arts show considerably larger effects. There is nothing in our theory of how BTSA/CFASST works that would explain why the program would have a greater or lesser impact in different subjects or on different kinds of tests.
Another aspect of the study that bears particular mention is the low response rate for the initial survey (26% response rate) and our requests for STAR data (50% response rate), as these may reduce the generalizability of the study. With so many subjects “missing in action,” the likelihood of response bias increases. That is, there is a chance that the teachers who were included in the analyses are fundamentally different from those who did not respond to the survey or for whom we could not obtain test score data—in terms of BTSA/CFASST
The Impact of New Teacher Induction on Teacher Practices and Student Learning 13

engagement, the students they teach, the schools they teach in, or their teaching practices. To address this issue within the limits of our study, we compared the distributions of survey and test score respondents to California teachers overall. The teachers in our study appear representative, in terms of the communities and schools they teach in and the students they teach. However, we have no information about whether they differ in their experiences of BTSA/CFASST or their teaching practices.
While we wish that the response rates were higher (if only to have increased our sample size and thus, possibly, the statistical significance of our results), we should also point out that the main thrust of the study is on the relationship between level of BTSA/CFASST engagement and various outcome measures, so that the effects of response bias on our central conclusions are indirect at best. We were focusing on the difference between high and low engagement teachers, and how that difference might show up in teacher practices and student test scores. If response bias were operating, it most likely dampened responses from teachers who felt less engaged with BTSA/CFASST. The absence of such teachers from the survey response pool would have the effect of raising the floor of the low engagement group. This, in turn, would mean that our effect size estimates would be underestimates, since our comparison group probably got a greater “dose” of the program than those who didn’t respond because they were particularly disengaged from BTSA/CFASST.
Two other aspects of the study that merit additional discussion arise from the fact that we were unable to use a random assignment design. First, the use of the low CFASST engagement group in the place of a true “control” reduces the magnitude of the contrast between the groups being compared. Thus, our effect sizes and significance test statistics are likely to be underestimates, since the comparison group got at least some of the “treatment.”
This downward bias was exacerbated by two other factors: 1) Since the “distance” between the high and low CFASST groups was only one standard deviation on the CFASST engagement metric, there is some possibility of misclassification of teachers, which again biases estimates of effectiveness downward. 2) The inclusion of middle level teachers in the study sample boosted total sample size and allowed us to gain a better picture of teaching practices overall, but these teachers could not be included in the high-low comparisons, thus effectively reducing sample size to 27 teachers in the study of teacher practices (12 in low, 15 in high) and 73 in the study of student achievement (45 in high, 28 in the low). The net effect of these limitations of the design is to lower statistical power to detect any given effect size at any given level of statistical significance (Cohen, 1988). When you add in the reduction of true effect size that stems from using teachers with limited BTSA/CFASST exposure as the comparison group, it is clear that this study had a very low statistical power to detect significant effects on teacher practices. Thus, the small number of statistically significant findings in this area is not surprising. With such low power, our generally positive though largely non-significant results are promising—and suggest that a study with a larger sample is warranted.
Finally, because we were unable to randomly assign teachers to treatment and control groups prior to the start of treatment, we cannot definitively attribute all measured effects to the treatment. That is, there may be measured or unmeasured characteristics of the teachers that account for some or all of the differences in performance between the high and low CFASST groups. To account for the effect of measured variables in the teacher practices study, we
The Impact of New Teacher Induction on Teacher Practices and Student Learning 14
conducted multi-stage regression analyses that examined the relative predictive power among CFASST engagement score, measures of teaching practice, and various classroom and school-level characteristics. (See Thompson, Paek, Goe & Ponte, 2004a for an explanation of these analyses.) The results suggested that classroom and school-level characteristics are no more explanatory of any given teaching practice than CFASST engagement score or other measures of teaching practice. In the student achievement analyses, we built a more tightly controlled design by introducing API score and student level variables into our statistical models.
Even after accounting for the effects of measured variables, we still cannot definitively attribute differences to engagement in BTSA/CFASST, as there may be other unmeasured group differences that we are not aware of. A potentially large unmeasured factor is baseline “quality” of beginning teachers at the point they enter into their first positions, arising from differences in innate ability and extent and quality of teacher preparation. Without a baseline measure of teaching quality to use as a control variable, and absent a randomized design, we cannot rule this factor out.
Since teaching quality has been shown to be related to the formal qualifications of teachers (Darling-Hammond, 1999, 2002) it is useful to examine the literature that looks at the relationship between teacher qualifications and school quality. Goe (2002) documented the fact that high performing schools in California are likely to have better-qualified new teachers than are low-performing schools. She showed a similar pattern for high-SES schools (compared to low SES schools), reflecting the well-known correlation between school achievement and the SES of the population a school serves. Clotfelter, Ladd, & Vigdor (2002) found similar patterns in North Carolina middle schools, with regard to student race. This phenomenon has sometimes been referred to as the “teaching gap,” and as was argued at the start of this paper, it is likely a major contributor to the student achievement gap.
Our use of API score as a covariate in the student achievement analyses takes care of some of this concern, at least the part that stems from disparities in teacher qualifications associated with SES and higher and lower performing schools. API score is also correlated with a host of characteristics associated with the communities that schools serve, such as race and community poverty. In our own sample, API is highly correlated with poverty (r = –.82 for proportion of a teacher’s students receiving free or reduced lunch) and proportion of English language learners (r = –.53). Other studies (e.g., Goe, 2002) have documented the high negative correlation between API and proportion of students who are African-American or Hispanic. While one goal of education is to break the connections between poverty, race, and student achievement, the fact is that these relationships were still strongly in place as we conducted this research. What this means is that by using API score as a covariate, we were able to indirectly control for a wide range of student and school factors. This suggests that our findings are fairly robust across different types of schools and communities.
Nevertheless, there may be other unmeasured differences between the teachers and/or students in the high and low engagement groups that cannot be controlled for by a “gross” measure like API score. With regard to pre-existing teacher differences, it might be useful to conduct additional research using a measure of baseline teacher quality. Doing so would shed light on a number of interpretive problems associated with unmeasured differences between the high and low engagement groups. Recall that our study design required us to reframe the original research
The Impact of New Teacher Induction on Teacher Practices and Student Learning 15
questions to address questions of BTSA/CFASST’s impact, when implemented so that teachers have a high degree of engagement with the program. We know from this study and others (Thompson, 2001; WestEd, 2002) that a great deal of the variation in engagement with BTSA/CFASST stems from program-level implementation differences in such matters as whether the beginning teacher was assigned a support provider or not, ease and frequency of access to support providers, time to meet and work on the CFASST events, and training and monitoring of support providers. These types of variations exist across and within BTSA/CFASST programs, but stand independent of the characteristics of any individual beginning teacher. To the degree that variations in a teacher’s engagement with the program are attributable to these kinds of implementation issues, we can be fairly confident that using CFASST engagement level as the independent variable in our analyses did not introduce a confound between our independent and dependent variables. It is possible that there is an interaction between CFASST engagement level and the types of schools that teachers work in. High performing schools may function better overall, and thus may do a better job of supporting teachers in the program. In fact, as reported earlier, we found a small correlation between CFASST engagement score and school API score (r=.14). Though statistically different from zero (p<.05), this is still a low correlation that accounts for only 2% of the variation in CFASST engagement level. This is somewhat reassuring as to the question of whether BTSA/CFASST can “take” in low performing as well as in high performing schools.
However, it is also possible that some amount of the variation in CFASST engagement arises at the level of the individual teacher: those with better baseline teaching abilities may appreciate the program more, or have more time or mental “slack” to participate because they are not as overwhelmed by the day-to-day events of teaching. Because we did not have a baseline measure of teaching ability, we were unable to assess the strength of the relationship between CFASST engagement and teachers’ abilities as they entered the program. This leaves us with the unanswered question of whether BTSA/CFASST “takes” equally well with teachers of lesser and greater initial teaching ability.
While employing a baseline measure of teaching ability would solve several interpretive problems, it should be noted that selecting or developing such a measure—one that is reliable, valid, and feasible to use in large sample studies—is a non-trivial matter. Researchers have employed SAT and ACT scores, Praxis scores, and ratings of the selectivity of the pre-service institutions attended by teachers, but all of these are merely proxies for baseline teacher quality, which is a far more complex and difficult-to-measure construct. Given the practical and measurement difficulties inherent in reliably assessing teaching quality, a randomized design would be preferable to a quasi-experimental design, even one that employs a control for baseline teaching quality.
Thus, we would strengthen our call for additional research in which we would be able to randomly assign teachers into treatment (high engagement in BTSA/CFASST) and control status (no engagement in any induction program, or at least no sustained, mentor-based induction program). This would allow us to eliminate baseline differences in teacher quality and other differences as rival explanations for any performance differentials. See Thompson, Ponte, Paek, & Goe (2004) for details on how a randomized experiment might be designed and implemented.
The Impact of New Teacher Induction on Teacher Practices and Student Learning 16
A randomized experiment can be quite costly and take years to conduct. Short of such an effort, there is a relatively quick study that could be used to test the robustness of this study’s findings. To ensure that our results are not simply an artifact of year-to-year “bounce” in test scores (as noted in Kane & Staiger, 2002), it would be relatively simple to perform similar analyses using STAR test data collected at the end of the 2003-2004 school year for the same sample of teachers. This would also shed some light on the sustainability of the effects of BTSA/CFASST.
Conclusion
This study makes an empirical connection between induction, changes in teacher practices, and improved student learning, addressing a gap in the research literature on induction. Such studies have proven challenging due to difficulties in identifying comparison groups, in reliably knowing what teachers are doing in their classrooms, and in obtaining student achievement data traceable to specific teachers. Given these challenges and the paucity of research making these connections, this study represents an important result in the chain of evidence surrounding the effectiveness of new teacher induction.
In addition, this study makes a significant contribution toward our understanding of the specific characteristics of professional development and teaching that are related to student achievement, an area that has proven somewhat resistant to researchers’ efforts (Olson, 2003). Studies that link any form of teacher professional development directly to student achievement are rare. These findings are timely given the current emphasis placed by the No Child Left Behind Act on preparing a quality teaching force, with the expectation that improvements in the professional development of teachers will promote positive changes in teaching practices, which will in turn enhance student achievement. Studies like this one are key in creating a foundation for meeting NCLB’s goal of improving education.
Many states and districts are now establishing guidelines and funding streams for new teacher induction, and this study can increase their confidence in the efficacy of such programs. With high quality induction programs costing $2,500-$4,000 per teacher, it is important to be able to quantify the benefits attributable to induction. If Smith and Ingersoll’s (2004) estimates of the effects of induction on reducing teacher attrition are accurate, then the immediate cost savings stemming from reduced teacher turnover (Texas Center for Educational Research, 2000) can largely offset the cost of induction. And the benefits to teaching and learning, as documented in this study, can certainly be seen to justify the remainder of the expense. These benefits should logically continue over the course of a teacher’s career, resulting in sustained savings in teacher replacement costs, better student learning over time, and reduced costs associated with remediation for students who received better instruction in the first place. Thus, policymakers now have an empirical basis for supporting high quality teacher induction programs as cost-effective, teacher-effective, and student-effective.
However, the conditions that made this study possible—high variability in the strength of new teachers’ exposure to the program—are not conducive to the improvements that educators are seeking. We must be particularly careful to provide support for high quality induction in low-performing schools and schools that serve poor children and children of color. These are the schools that need induction the most because they are the most likely to suffer from high levels of teacher attrition. Otherwise, programs like BTSA/CFASST may feed the “rich get richer”
The Impact of New Teacher Induction on Teacher Practices and Student Learning 17
phenomenon that has plagued many educational reform efforts. If a strong BTSA/CFASST experience is afforded more often to teachers who work in high performing schools or schools that serve middle class white students, the teaching gap will be exacerbated, and this in turn will exacerbate the achievement gap. Induction programs will only have widespread positive effects when they are implemented so that all new teachers have a high level of sustained engagement in substantive professional learning.
The Impact of New Teacher Induction on Teacher Practices and Student Learning 18
References
Alliance for Excellent Education. (2004). Tapping the potential: Retaining and developing high-quality new teachers. Washington, DC: Alliance for Excellent Education.
American Federation of Teachers. (2001). Beginning teacher induction: The essential bridge.
Educational Issues Policy Brief, 14(4). Beeson, E., & Strange, M. (2003). Why rural matters 2003: The continuing need for every state
to take action on rural education. Washington, DC: Rural School and Community Trust. Black, P., & William, D. (1998). Inside the black box: Raising standards through classroom
assessment. Phi Delta Kappan, 80(2), 139-147. Black, P., Harrison, C., Lee, C., Marshall, B., & Dylan, W. (2002). Working inside the black
box: Assessment for learning in the classroom. London: King’s College, Department of Education and Professional Studies.
Britton, E., Paine, L., Primm, D., & Raizen, S. (Eds.). (2003). Comprehensive teacher induction:
Systems for early career learning. Dordecht: Kluwer Academic Publishers. California Commission on Teacher Credentialing and the California Department of Public
Instruction. (1999a). California Formative Assessment and Support System for Teachers. Sacramento: CCTC.
California Commission on Teaching Credentialing and the California Department of Public
Instruction. (1999b). California Standards for the Teaching Profession: Resources for professional practice. Sacramento: California Commission on Teaching Credentialing and the California Department of Public Instruction.
California Commission on Teacher Credentialing. (2002). Standards of quality and effectiveness
for professional teacher induction programs. Sacramento: California Commission on Teacher Credentialing.
Carver, C. L. (2004). A lifeline for new teachers. Educational Leadership, 58-61. Claycomb, C., & Hawley, W. (2000). Recruiting and retaining effective teachers for urban
schools: Developing a strategic plan for action. Washington, DC: National Partnership for Excellence and Accountability in Teaching.
Clotfelter, C. T., Ladd, H. F., & Vigdor, J. L. (2002). Who teaches whom? Race and distribution
of novice teachers. Paper presented at the American Economic Association Meetings, Atlanta, GA.
Cohen, J. (1988). Statistical power for the behavioral sciences. Hillsdale, NJ: Lawrence Erlbaum
Associates.
The Impact of New Teacher Induction on Teacher Practices and Student Learning 19
Darling-Hammond. (1997). Doing what matters most: Investing in quality teaching. Washington, DC: National Commission on Teaching and America's Future.
Darling-Hammond, Linda. (1999). The right to learn: A blueprint for creating schools that work.
San Francisco: Jossey-Bass. Darling-Hammond, L. & Youngs, P. (2002). Defining “Highly Qualified Teachers”: What does
scientifically-based research actually tell us? Educational Researcher, 31(9), 13-25. Also, Feiman-Nemser, S. (1996). Teacher mentoring: A critical review (ERIC Digest # 397060).
Washington, DC: ERIC Clearinghouse on Teaching and Teacher Education. Feiman-Nemser, S. (2001). From preparation to practice: Designing a continuum to strengthen
and sustain teaching. Teachers College Record, 103(no. 6), 1013-1055. Feiman-Nemser, S., Schwille, S., Carver, C., & Yusko, B. (1999). A conceptual review of
literature on new teacher induction. College Park, Maryland: National Partnership for Excellence and Accountability in Teaching.
Goe, Laura. (2002). Legislating equity: the distribution of emergency permit teachers in
California. Education policy Analysis Archives, 10 (42). Granger, R. C., & Kane, T. (2004). Improving the quality of after-school programs. Education
Week, 23(23), 76, 52. Hanushek, E., Kain, J. F., O'Brien, D. M., & Rivken, S. G. (2005). The market for teacher
quality, NBER working paper 11154. Washington, DC: National Bureau of Economic Research.
Henke, R., Chen, X., Geis, S. & Knepper, P. (2000). Progress through the teacher pipeline:
1992-93 college graduates and elementary/secondary school teaching as of 1997, NCES Report No. 2000-152. Washington, DC: U.S. Department of Education, NCES.
Hirsch, E. (2005). Teacher working conditions are student learning conditions: A report to
Governor Mike Easley on the 2004 North Carolina Teacher Working Conditions Survey. Chapel Hill, NC: Southeast Center for Teaching Quality.
Ingersoll, R. M. (2003). Is there really a teacher shortage? Center for the Study of Teaching and
Policy, University of Washington. Joftus, S., & Maddox-Dolan, B. (2002). New teacher excellence: Retaining our best.
Washington, DC: Alliance for Excellent Education. Johnson, S. M. (2004). Finders and keepers: Helping new teachers survive and thrive in our
schools. San Francisco: Jossey-Bass.
The Impact of New Teacher Induction on Teacher Practices and Student Learning 20

Johnson, S. M., Birkeland, S., Kardos, S. M., Kauffman, D., Liu, E., & Peske, H. G. (2001). Retaining the next generation of teachers: The importance of school-based support. Cambridge, MA: The Project on the Next Generation of Teachers at the Harvard Graduate School of Education.
Lopez, A., Lash, A., Schaffner, M., Shields, P., & Wagner, M. (2004). Review of research on the
impact of beginning teacher induction on teacher quality and retention, ED Contract ED-01-CO-0059/0004. Menlo Park, CA: SRI International.
Kane, T., & Staiger, D. (2002). Volatility in school test scores: Implications for test-based
accountability systems. Brookings Papers on Education Policy - 2002, 235-283. Mayer, D. P., Mullens, J. E., & Moore, M. T. (2000). Monitoring school quality: An indicators
report. Washington, DC: National Center for Education Statistics. National Center for Education Evaluation and Regional Assistance, Institute of Education
Sciences, U.S. Department of Education. (2004). Statement of Work: An evaluation of the impact of teacher induction programs. Washington, DC: Author.
National Center for Education Statistics. (2001). 1999-2000 school and staffing survey.
Washington, DC: National Center for Education Statistics. National Commission on Teaching & America's Future. (2001). What to look for in a teacher
induction program. NCTAF. Retrieved May 13, 2001, from the World Wide Web: www.tc.edu/nctaf/resourceeducator/whattolookfor.html
National Commission on Teaching & America's Future. (2003). No dream denied: A pledge to
America's children. Washington, DC: NCTAF. National Governor’s Association Center for Best Practices. (2002). Mentoring and supporting
new teachers (issue brief). Washington, DC: Education Policy Studies Division of NGA. Olson, L. (2003). The great divide. Education Week, 22, pp. 9-10,13-14,16,18. Serpell, Z., & Bozeman, L. (1999). Beginning teacher induction: A report on beginning teacher
effectiveness and retention. College Park, Maryland: National Partnership for Excellence and Accountability in Teaching.
Skinner, R. A., & N.Staresina, L. (2004). State of the States, in Quality counts 2004: Count me
in. Education Week, 23(17), 112. Smith, T., & Ingersoll, R. (2004). What are the effects of induction and mentoring on beginning
teacher turnover? American Educational Research Journal, 41(3), 681-714. State Higher Education Executive Officers Eisenhower Coordinators Network. (1999). Teacher
success: State higher education support for beginning teachers. Denver: Author.
The Impact of New Teacher Induction on Teacher Practices and Student Learning 21
Texas Center for Educational Research. (2000). The cost of teacher turnover. Austin Texas:
Texas Center for Educational Research. Thompson, M. (2001). Case studies of CFASST beginning teachers: A summary report.
Princeton, NJ: Educational Testing Service. Thompson, M., Goe, L., Paek, P., & Ponte, E. (2004). Study of the impact of the California
Formative Assessment and Support System for Teachers: Report 1, Beginning teachers' engagement with BTSA/CFASST. Princeton, NJ: ETS
Thompson, M., Paek, P., Goe, L., & Ponte, E. (2004a). Study of the impact of the California
Formative Assessment and Support System for Teachers: Report 2, Relationship of BTSA/CFASST engagement and teacher practices. Princeton, NJ: Educational Testing Service.
Thompson, M., Paek, P., Goe, L., & Ponte, E. (2004b). Study of the impact of the California
Formative Assessment and Support System for Teachers: Report 3, Relationship of BTSA/CFASST engagement and student achievement. Princeton, NJ: ETS.
Thompson, M., Ponte, E., Paek, P., & Goe, L. (2004). Study of the impact of the California
Formative Assessment and Support System for Teachers: Report 4, Methodological considerations and recommendations for future research. Princeton,NJ: ETS.
Villani, S. (2002). Mentoring programs for new teachers: Models of induction and support.
Thousand Oaks, CA: Corwin Press. Villar, A., Moir, E., Barrett, A., Strong, M., Baron, W., Fletcher, S., & Achinstein, B. (2003).
Reflections, a publication of the New Teacher Center - Univ. of Ca. Santa Cruz, VI (No 2).
Wang, A. H., Mifsud, V., & Tregidgo, A. (2002). Analyzing state policies and programs for
beginning teacher induction: A comprehensive framework. Princeton, NJ: ETS. WestEd. (2002). Independent evaluation of the Beginning Teacher Support and Assessment
Program. San Francisco: WestEd. Wong, H. (2004). Induction programs that keep new teachers teaching and improving. NASSP
Bulletin, 87(638), 5-27. Wong, H. (2003). Collaborating with colleagues to improve student learning. ENC Focus,
11(16), 9. Wong, H. (2002). Induction: the best form of professional development. Educational Leadership,
59(6), 52-55.
The Impact of New Teacher Induction on Teacher Practices and Student Learning 22

Youngs, P. (2003). State and district policies related to mentoring and new teacher induction in Connecticut. New York: NCTAF.
The Impact of New Teacher Induction on Teacher Practices and Student Learning 23
Appendix
Table A. Characteristics of the Survey Sample Schools and California Elementary Schools Table B. Characteristics of the Survey Sample Teachers and California Elementary Teachers Table C. Survey Sample Teachers’ BTSA/CFASST Experiences and Relationships with Support
Providers, Reported as Proportion of Survey Respondents Table D. Percentage Agreement with Support Providers’ Help with Improving Specific Aspects
of Teaching Table E. Pearson Product Correlations Among the Ten Measures of Teaching Practice
The Impact of New Teacher Induction on Teacher Practices and Student Learning 24
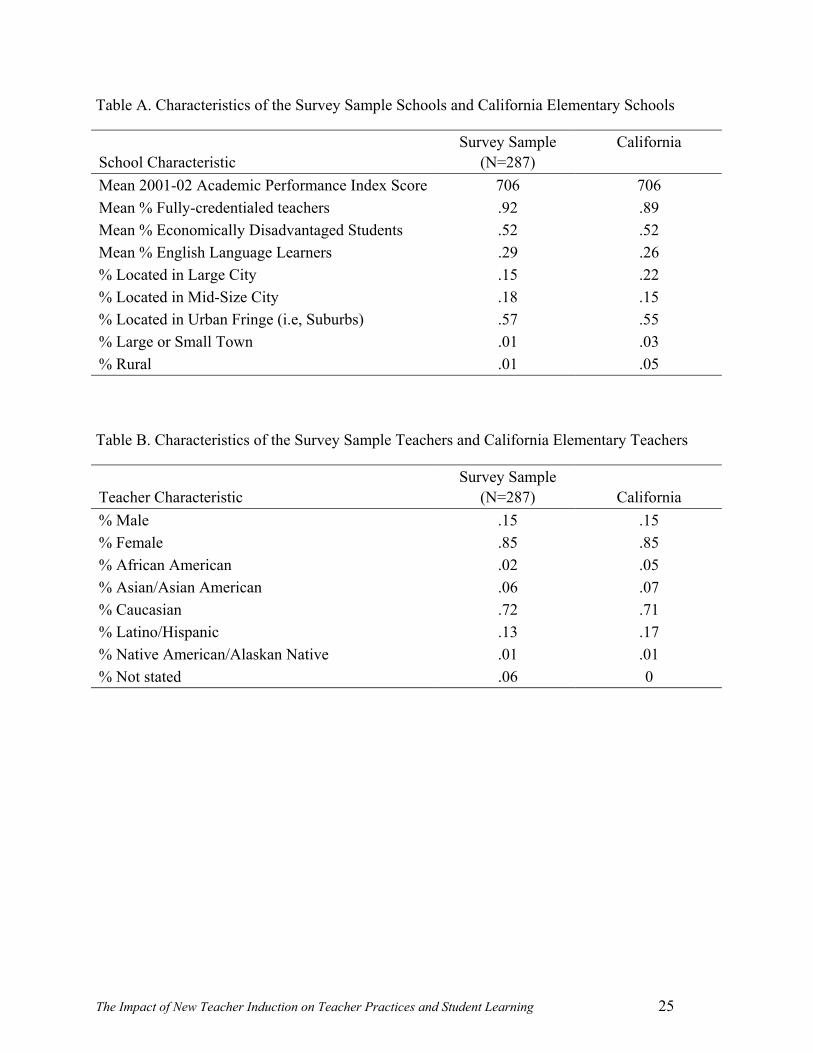
Table A. Characteristics of the Survey Sample Schools and California Elementary Schools
School Characteristic
Survey Sample (N=287)
California
Mean 2001-02 Academic Performance Index Score 706 706 Mean % Fully-credentialed teachers .92 .89 Mean % Economically Disadvantaged Students .52 .52 Mean % English Language Learners .29 .26 % Located in Large City .15 .22 % Located in Mid-Size City .18 .15 % Located in Urban Fringe (i.e, Suburbs) .57 .55 % Large or Small Town .01 .03 % Rural .01 .05
Table B. Characteristics of the Survey Sample Teachers and California Elementary Teachers
Teacher Characteristic
Survey Sample (N=287)
California
% Male .15 .15 % Female .85 .85 % African American .02 .05 % Asian/Asian American .06 .07 % Caucasian .72 .71 % Latino/Hispanic .13 .17 % Native American/Alaskan Native .01 .01 % Not stated .06 0
The Impact of New Teacher Induction on Teacher Practices and Student Learning 25
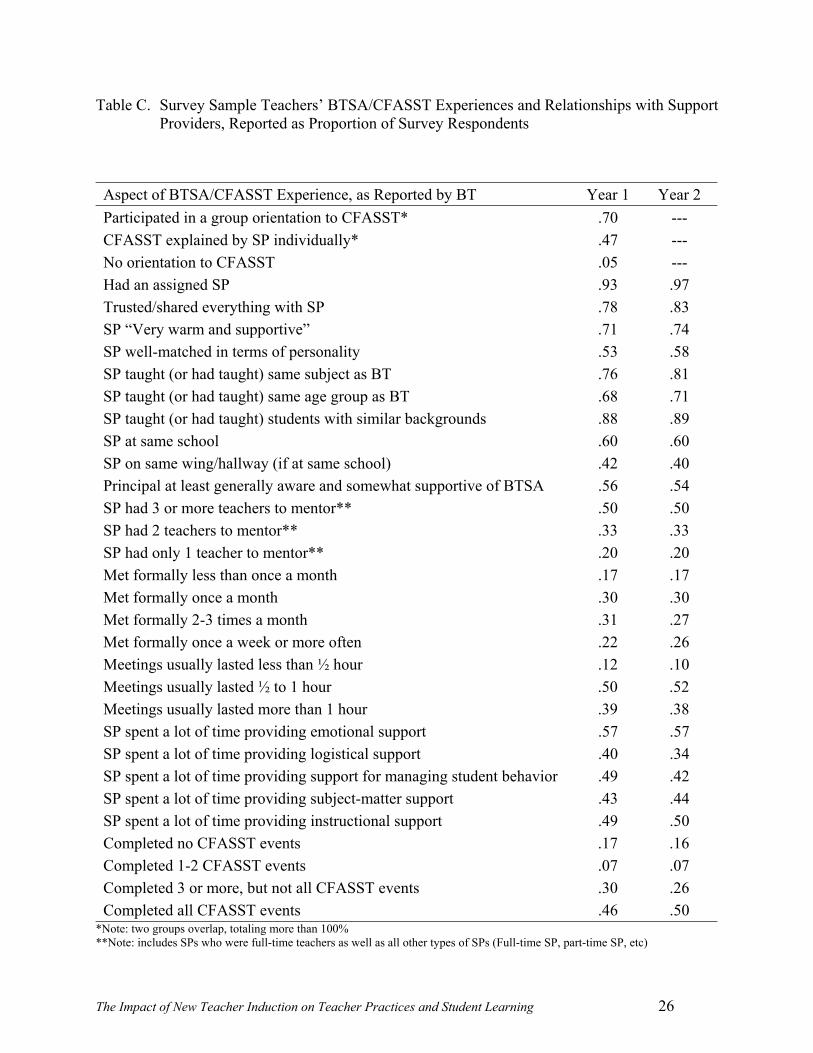
Table C. Survey Sample Teachers’ BTSA/CFASST Experiences and Relationships with Support Providers, Reported as Proportion of Survey Respondents
Aspect of BTSA/CFASST Experience, as Reported by BT Year 1 Year 2 Participated in a group orientation to CFASST* .70 --- CFASST explained by SP individually* .47 --- No orientation to CFASST .05 --- Had an assigned SP .93 .97 Trusted/shared everything with SP .78 .83 SP “Very warm and supportive” .71 .74 SP well-matched in terms of personality .53 .58 SP taught (or had taught) same subject as BT .76 .81 SP taught (or had taught) same age group as BT .68 .71 SP taught (or had taught) students with similar backgrounds .88 .89 SP at same school .60 .60 SP on same wing/hallway (if at same school) .42 .40 Principal at least generally aware and somewhat supportive of BTSA .56 .54 SP had 3 or more teachers to mentor** .50 .50 SP had 2 teachers to mentor** .33 .33 SP had only 1 teacher to mentor** .20 .20 Met formally less than once a month .17 .17 Met formally once a month .30 .30 Met formally 2-3 times a month .31 .27 Met formally once a week or more often .22 .26 Meetings usually lasted less than ½ hour .12 .10 Meetings usually lasted ½ to 1 hour .50 .52 Meetings usually lasted more than 1 hour .39 .38 SP spent a lot of time providing emotional support .57 .57 SP spent a lot of time providing logistical support .40 .34 SP spent a lot of time providing support for managing student behavior .49 .42 SP spent a lot of time providing subject-matter support .43 .44 SP spent a lot of time providing instructional support .49 .50 Completed no CFASST events .17 .16 Completed 1-2 CFASST events .07 .07 Completed 3 or more, but not all CFASST events .30 .26 Completed all CFASST events .46 .50
*Note: two groups overlap, totaling more than 100% **Note: includes SPs who were full-time teachers as well as all other types of SPs (Full-time SP, part-time SP, etc)
The Impact of New Teacher Induction on Teacher Practices and Student Learning 26

Table D. Percentage Agreement with Support Providers’ Help with Improving Specific Aspects of Teaching
Disagree/ Strongly Disagree
Agree
Strongly Agree My support provider helped me to…
Year 1 Year 2 Year 1 Year 2 Year 1 Year 2 Use a variety of instructional strategies and resources to respond to students’ diverse needs
.17 .11 .42 .44 .41 .44
Increase my ability to maintain an effective learning environment and manage student behavior
.16 .13 .44 .47 .39 .40
Increase my ability to plan, design, and deliver instruction .22 .18 .42 .44 .35 .38
Increase my ability to establish and articulate goals for student learning .18 .13 .48 .49 .34 .38
Increase my ability to assess my students accurately .25 .18 .44 .48 .31 .34
Increase my ability to communicate effectively with parents .29 .24 .42 .48 .29 .29
Reflect on my teaching practice .12 .09 .40 .39 .47 .52
The Impact of New Teacher Induction on Teacher Practices and Student Learning 27

Table E. Pearson Product Correlations Among the Ten Measures of Teaching Practice
Instr. Plan.
Refl.
Deep Qs
Interm. Qs
Open Qs
Pos. FB
Instr. FB
Subs. FB
Stud. Und.
CSTP Score
Instr. Plan
Refl. .371*
Deep Qs .219 .098
Interm. Qs -.101 .013 .048
Open Qs -.031 -.010 .122 .322
Pos. FB .189 .218 .173 .377* .082
Instr. FB .069 -.097 -.130 -.020 -.274 .576*
Subs. FB .117 -.282 .20 -.191 -.168 .201 .418*
Stud. Und. .172 .361* -.091 -.161 -.036 .047 .072 -.182
CSTP Sc. .350* .616 -.213 .073 .029 .376* .170 -.143 .388** Significant at the .05 level
The Impact of New Teacher Induction on Teacher Practices and Student Learning 28