Embed Size (px)
Citation preview

The impact of multinational corporations on the South
African economy
Student name: Loredana Renzi
Student number: 11364433
A research project submitted to the Gordon Institute of business Science, University of Pretoria, in partial fulfilment of the requirements for the degree of Master of Business Administration.
07 November 2012
Copyright © 2013, University of Pretoria. All rights reserved. The copyright in this work vests in the University of Pretoria. No part of this work may be reproduced or transmitted in any form or by any means, without the prior written permission of the University of Pretoria.
©© UUnniivveerrssiittyy ooff PPrreettoorriiaa

ii
Abstract
According to Saville (1993), the economic growth of less developed countries is
impeded due to the presence of four “gaps” in these economies. However, Saville
(1993), states that, by filling these gaps, developing economies are able to achieve
economic growth and development. The main objective of this research is to
update the study of Saville (1993) in order to determine the impact of the
multinational corporation on the host economy in reference to the drivers of
exogenous and endogenous growth in contribution to filling these gaps.
This is a quantitative study which makes use of secondary data obtained from JSE
listed firms operating in the mining sector in South Africa. Statistical regression
analysis was conducted and results are compared to the previous Saville (1993)
study.
In summary, the results of the study are mixed however in terms of informing
government policy, this study confirms the importance of FDI in emerging markets.
The caveat however, firstly, is to inform policy to attract the right kinds of FDI to
contribute to filling specific gaps in to achieve the required economic growth.
Secondly, policy should require collaboration between MNC’s, private firms as well
as public sector firms in order to share knowledge and profits in having a positive
effect on social welfare and economic growth in the domestic economy.

iii
Keywords
Multinational Corporation
Emerging Markets
Local Firms
Domerstic Economy

iv
Declaration
I declare that this research project is my own work. It is submitted in partial
fulfilment of the requirements for the degree of Master of Business Administration
at the Gordon Institute of Business Science, University of Pretoria. It has not been
submitted before for any degree or examination in any other University. I further
declare that I have obtained the necessary authorisation and consent to carry out
this research.
Signed Date
_____________________________ _______________________________

v
Acknowledgements
I would like to thank Dr Adrian Saville, my research supervisor, for allowing me the
privilege to update his study. I have really enjoyed this topic of research and
admire your passion and achievements it has been a great learning experience
working with you. To Patrick, for all of your love and support throughout this
challenging last year, you made this all so easy, thank you. To Petra, the most
brilliant statistician an MBA student could hope for, you made this process easy. To
Amy my editor for all your assistance, thank you.
A dedication to GIBS, It has been a profound privilege to be part of the of the GIBS
MBA programme. It has been an incredible journey; I have been starched to
beyond my limits and have grown immensely both academically and emotionally.
To all my MBA classmates, I have met some wonderful people who I hope
continue to be a part of my life, thank you for all the great times in class an outside,
it was an absolute blast.
And finally to my family for their continued support throughout this MBA journey,
specifically, to my mother for her constant belief in my abilities, strength and
everlasting love and support she has given me in my life, I would not be here
without you. I love you.

vi
List of figures and tables
Figure 1: Paradigm Shift of International Business (Cavusgil et al., 2002) .............. 6
Figure 2: Inward foreign investment into South Africa ........................................... 26
Table 1: The effects of the MNC on the host country (Saville, 1993) .................... 12
Table 2: Determinants of labour productivity ......................................................... 30
Table 3: Determinants of capital market distortion ................................................ 31
Table 4: Determinants of competitive structure ..................................................... 31
Table 5: Basic resources ....................................................................................... 36
Table 6: Owership per sector ................................................................................ 36
Table 7: Currency conversion ............................................................................... 38
Table 8: Employment creation............................................................................... 42
Table 9: Employment creation results ................................................................... 42
Table 10: Labour productivity ................................................................................ 44
Table 11: Labour productivity results .................................................................... 44
Table 12: Appropriate technology ......................................................................... 46
Table 13: Appropriate technology results .............................................................. 46
Table 14: Distribution of income ............................................................................ 47
Table 15: Distribution of income results ................................................................ 48
Table 16: Government revenue ............................................................................. 49
Table 17: Government revenue results ................................................................. 49
Table 18: Cost of finance ...................................................................................... 51

vii
Table 19: Cost of finance results ........................................................................... 51
Table 20: Profit and divident repatriation ............................................................... 52
Table 21: Profit and divident repatriation results ................................................... 53
Table 22: Profitability ............................................................................................. 54
Table 23: Profitability results ................................................................................. 55
Table 24: Efficiency ............................................................................................... 56
Table 25: Efficiency results ................................................................................... 56
Table 26: Research question 1 results .................................................................. 66
Table 27: Research question 2 results .................................................................. 67
Table 28: Research question 3 results .................................................................. 67

viii
Contents
ABSTRACT .............................................................................................................. II
KEYWORDS ............................................................................................................ III
DECLARATION ........................................................................................................ IV
ACKNOWLEDGEMENTS .............................................................................................V
LIST OF FIGURES AND TABLES .................................................................................. VI
1. INTRODUCTION TO THE RESEARCH PROBLEM ...................................................... 1
2. THEORY AND LITERATURE REVIEW ..................................................................... 8
3. RESEARCH QUESTIONS .................................................................................. 29
4. RESEARCH METHOD ....................................................................................... 32
5. RESEARCH RESULTS ...................................................................................... 40
6. DISCUSSION OF RESULTS ............................................................................... 57
7. CONCLUSION ................................................................................................. 69
REFERENCES ....................................................................................................... 72
APPENDIX 1 ........................................................................................................... 1

1
1. Introduction to the research problem
1.1. Research title
The impact of multinational corporations on South African Industry within the
mining industry.
1.2. Research problem and purpose
According to Saville (1993), the economic growth of less developed countries
(LDCs) is impeded due to the presence of four “gaps” in these economies.
However, Saville (1993), states that, by filling these gaps, LDCs are able to
achieve economic growth and development. The task of economic policy makers is
to bring about policy that attempts to fill these gaps, however, there are opposing
views on how these gaps can be filled. These opposing schools refer to exogenous
and endogenous growth models, however, both schools provide evidence as to
how these forms of growth contribute to filling the gaps.
The endogenous growth model differs from the exogenous model in its emphasis
that “economic growth is an endogenous outcome of an economic system, not the
result of forces that impinge from outside” (Romer, 1994, pg 3). Furthermore,
Romer (1994) explains endogenous growth based on the origins of the theory of
convergence. Romer (1994) cites a study conducted by Maddison (1982), which
concluded that poorer countries’ per capita income increases over time to meet
richer countries’ per capita income. That is, income per capita in poor and rich
countries was to be converging. Abramovitz (1986) agrees with this theory and

2
links this to his “catch-up hypothesis” where “the hypothesis asserts that being
backward in level of productivity carries a potential for rapid advance” (pg.2) that is,
the more backward a country is, the faster they can catch up. Researchers agree
(Abramovitz, 1986; Lall, 1992; Romer, 1994; Barro, Mankiw, & Sala-i-Martin, 1993)
this is due to the argument that poorer countries can replicate production methods
and adopt innovations and technologies from richer countries to facilitate the catch-
up or convergence. However, it was noted from a cross-country study that
convergence only occurred in countries that had industrialised (Romer, 1994).
Further analysis indicated that the failure of cross-country convergence refutes the
two main conventions of the exogenous model; firstly, that technological change is
external, and secondly, that the same technological opportunities exist in all
countries (Romer, 1994). Barro et al. (1993) agree with this finding and provide
empirical evidence that the level of technology is in fact dissimilar in different
countries. Furthermore, research (Barro et al., 1993; Romer, 1994) specifies that
the reduced level of convergence is due to the law of diminishing returns and in
order to reduce these effects, significant externalities or spillovers are required to
ensure that economic growth can develop at a continuous, undiminished rate
(Griliches, 1992). Thus, it can be stated that endogenous growth requires
externalities and spillovers to take effect.
The “Flying-Geese” (FG) theory of economic development is recognised as one of
the major principles of the catch-up or convergence theory. It was introduced by
Kaname Akamatsu in the 1930s, which entailed three patterns of “FG formation
related to the process of industrial development in the Asian countries” (Ozawa,
2010, p. 3). In alignment with the catch-up theory and in reference to the third
formation pattern ”countries at different stages of development”, Ozawa (2010)

3
explains how developing countries cannot develop further without interaction and
influence from developing countries. These influences take the form of
endogenous externalities and spillovers, however, an element of exogenous
growth is required to facilitate these internal spillovers through capital accumulation
and foreign aid. Li and Liu (2005) discuss the theory regarding the impact of FDI on
economic growth in developing countries; they claim that FDI can facilitate both
endogenous and exogenous growth through various means, that is, exogenously
through increasing host country investment and endogenously through externalities
and spillovers. Evidence of such economic growth and development is provided by
many economic researchers (Blomström, 1991; Borensztein, De Gregorio, & Lee,
1998; Dunning, 1988; Kokko, Zejan, & Tansini, 2001; Luiz R. De Mello, 1997;
Wang, 2010) and shows how these two types of growth contribute to filling the
economic gaps in developing countries.
The four gaps highlighted by Saville (1993) comprise of the foreign exchange gap,
the resource gap, the skills and technology gap, and the budgetary gap. These
gaps result in a shortage of investment capital, foreign exchange, skills and
technology, and government revenue within the LDC. In response to this problem,
it is argued that the multinational corporation (MNC) is one of the most effective
means in generating growth and development in a host LDC. The argument is
supported by the widely accepted notion that investment through multinational
firms has become the core of international economic activity (Markusen &
Venables, 1999; Narula & Dunning, 2010; Raj et al., 2010; Wang, 2010). Over the
past two decades, globalisation has profoundly affected the economies of both
developed and developing countries. By increasing the flow of trade and Foreign
Direct Investment (FDI), trade liberalisation policies have transformed and

4
modernised the economies of emerging markets (Raj et al., 2010), showing that
developing countries and emerging markets understand the benefits of FDI in
terms of growth and development.
Despite this, opposing perspectives regarding the effects of the MNC on host
country economies have been debated for many decades. Although 19 years have
passed since Saville’s study (1993), there is still uncertainty as to whether the
impact of the MNC has a positive or negative effect on the host country’s economy.
Saville (1993) based his research on views set out by Schatz (1981), who argues
that views on MNCs range across a wide spectrum. Opposite sides of the
spectrum are referred to as “critics” and “advocates” of the MNC. Within this
spectrum, and in accordance with opposite sides, evaluation of the MNC is divided
into the rejection approach and the acceptance approach, with each approach
tending towards their respective views. Schatz (1981) refers to this as the
“pragmatic approach” in that the views of MNC operations are mixed, resulting in
costs and benefits for the host.
Wang (2010) confirmed this approach when he studied the impact of inward FDI on
50 host countries. Briefly summarised, Wang (2010) collected and analysed data
from 50 countries between 1970 and 2004. The research concluded that inward
FDI in the short term has a negative effect on the host economy, while the
cumulative effect of FDI over time tends to be positive. Research from Fedderke
and Romm (2006) supports this by showing that there is a crowding out effect of
domestic investment from FDI in the short run and positive effects in the long run.
This cumulative positive effect aligns with the Schatz (1981) pragmatic approach
which, in the long run, provides positive results. However, there are still cases of

5
cumulative negative effects which contribute to the continued uncertainty on this
topic.
1.3 Research motivation
Due to the continued uncertainty and debate regarding the impact of the MNC on
the host country, this research seeks to update the study conducted by Saville
(1993). Based on the opposing arguments found in the theory, an empirical study
was undertaken by Adrian Saville in 1993 to determine the impact of the MNC on a
“case-by-case basis” (p. 18).This method aligns with the pragmatic approach
specified by Schatz (1981). Saville’s study is currently outdated and a case can be
made for the need to update the investigative study.
Saville’s research (1993) focused on the building, construction, and engineering
sectors in South Africa. South Africa was identified as a LDC at the time of writing
based on the identification of characteristics typically associated with an LDC
economy (Saville, 1993). For the purposes of this research proposal, South Africa
will continue to be the subject country of the research, however, it will be referred
to as an emerging economy due to economic development since 1993 (Arnold &
Quelch, 1998).
1.4 The South African Context
Since the time of Saville’s research (1993), FDI literature has moved towards the
emerging market replacing the LDC. Arnold and Quelch (1998) elaborate on this
development: “The phrase ’emerging markets‘ has been adopted in place of the

6
previous lexicon of ’less developing countries‘, ’newly industrialising countries‘ or
even ’Third World countries.”(p. 8).
The emerging market is seen as a major growth opportunity in international
business (Arnold & Quelch, 1998; Cavusgil, Ghauri, & Agarwal, 2002; Hoskisson,
Eden, Lau, & Wright, 2000; Luo & Tung, 2007), therefore attracting increased
levels of FDI.
The table below, from Cavusgil et al., (2002) shows changes that have occurred
since the early 1990’s with regards to emerging markets motivating MNCs to invest
in these markets. This shows that foreign investment through the MNC has
become common practice in international business.
Figure 1: Paradigm Shift of International Business (Cavusgil et al., 2002)
Hoskisson et al. (2000) define emerging markets as “low-income, rapid-growth
countries using economic liberalization as their primary engine of growth” (p. 245).
In accordance with the definition by Cavusgil et al. (2002) South Africa can be
defined as an emerging market as it is a developing country that is firstly, currently
undergoing a process of economic reform which is designed to address poverty

7
and improve the living standards of previously disadvantaged people. Secondly,
South Africa has recorded positive economic growth over a sustained period,
though the financial crisis of 2008 has impacted this growth (as it has in almost all
countries). These two points are in alignment with the argument posed by Cavusgil
et al. in terms of their definition of an emerging market. In additional there appears
to be widespread agreement among academics (Arnold & Quelch, 1998;
Hoskisson et al., 2000; Cavusgil et al., 2002; Luo & Tung, 2007) that emerging
markets include the economies of China, India, Russia, Poland, Ukraine, the
Middle East, Latin America, Southeast Asia and Africa. It is with this definition that
South Africa will be referred to as an emerging market economy. Further evidence
of this is the recent inclusion of South Africa in the BRICS (Brazil, Russia, India,
China, and South Africa) group in 2011 cementing their position in the world
economy.

8
2. Theory and literature review
2.1 Introduction
In an attempt to build on Saville’s (1993) research of the effects MNC’s have on the
South African economy, it is first necessary to make a number of introductory
remarks on the MNC in emerging markets. In this regard, this chapter has three
main objectives:
i. To investigate the opposing views regarding the MNC and its role in
facilitating economic growth and development in the host country.
ii. To identify the costs and benefits associated with FDI, more specifically the
impacts of the MNC on the host countries’ industries and in doing so,
provide a general framework for investigating these impacts.
iii. To update the literature on the African views and the problems facing
emerging markets as a result of increased foreign investment.
In line with the above, the rest of this chapter is made up of four main sections,
namely Section 2.2 which provides a synopsis of the positive and negative impacts
of the MNC on the host economy, Section 2.3 which suggests an overall
investigative framework and provides a review of the evidence, 2.4 which is
devoted to the South African context, and section 2.5 which is dedicated to final
remarks.
The next section will focus on the literature around the identified effects of the MNC
on the host country economy.
9
2.2 Impacts of the MNC on economic growth and development in host
countries
Saville (1993) explored the effects of the MNC on the host country, specifically on
less developed countries (LDC). His research attempted to empirically prove if the
MNC had a positive or negative effect on the host country and whether the MNC
was able to fill the four gaps which are prevalent in LDCs. These four gaps are said
to preclude, or at least hamper, growth and development in these countries. The
gaps have been identified as the “foreign exchange gap”, the “budgetary gap”, the
“resource gap”, and the “skills and technology gap”. Saville (1993) argued, “It is
often contended that foreign investment and more specifically the MNC, can
substantially assist in closing the four gaps, thereby serving as an engine for
growth and development in the LDC” (p. 24). However, in the 1970s, many host
country governments and some economists viewed multinational investment as
detrimental to host economies’ welfare and development, creating monopoly
situations that exploited those economies and stifled local competition (Markusen &
Venables, 1999). Despite these negative views, it can be noted that since the
1990’s, global FDI has increased substantially and the universal view on foreign
investment by way of MNC’s has become more permanent. This suggests that
multinationals provide important complementarities with local industry, resulting in
stimulated development in host economies (Markusen & Venables, 1999).
Furthermore, FDI-based development strategies were common among LDCs and
competition between developing countries was growing due to increased pressure
to attract the right kinds of FDI (Narula & Dunning; 2000, Blomström & Kokko,
2003). Narula and Dunning (2000, 2010), examined some of the changing realities

10
associated with globalisation and indicated that MNCs play a growing role as
catalysts, participants, and instigators in developing countries. Blomström and
Kokko (2003), however, identified complications as a result of the growing
competition, such as host governments trying to attract FDI resulting in a shift of
profits and social welfare.
Alfaro and Rodrigues-Clare (2004) conducted a first generation industry-level
(cross-section) study and generally found a positive correlation between foreign
presence and sectorial productivity. Their literature review revealed that this was a
common outcome, “For example, the pioneering work of Caves (1974) finds
positive FDI spillovers in Australia; Blomström (1986) and Blomström and Wolff
(1994) find positive effects for Mexico; and Sjöholm (1999) reports a positive
impact for Indonesia” (Alfaro & Rodrigues-Clare, 2004, p. 117). However, at the
macroeconomic level, cross-section empirical work by Borensztein et al. (1998)
and Alfaro and Rodrigues-Clare (2004) found little support that FDI has a positive
effect on economic growth.
Despite the polar view between advocates and critics, there is nevertheless
agreement that MNCs do provide some sort of benefit to the host country. This
argument was built by evaluating the sum of these effects, focusing on the
individual costs and benefits, but ultimately combining them to come to a holistic or
macroeconomic level. The short-term versus long-term effects on the host
economy as a whole are a result of costs and benefits of MNC investment. These
costs and benefits have an effect on industry, the local firm, and ultimately the host
economy.

11
In the next section, said costs and benefits have been identified in detail.
Furthermore, the arguments from both advocates and critics will be reviewed with
evidence to support their claims in order to build the case for the research.
2.3 The investigative framework
In an attempt to update Saville’s (1993) study in investigating the impacts of the
MNC, the same investigative framework as defined by Saville (1993) will be used
in this study. Saville (1993) defined a set of costs and benefits in order to
empirically evaluate the effects of these costs and benefits on the host economy.
Saville, (1993) broke down the set of costs and benefits into three subsets; (i)
external effects, (ii) resource effects, and (iii) competition effects. In addition to
Saville’s sources, recent literature (Blomström & Kokko, 2003; Borensztein et al.,
1998; Markusen & Venables, 1999) identified an additional effect, stating that FDI
creates technological externalities and knowledge spillovers for the local economy.
These technological externalities relate to the skills and technology gap to which
Saville (1993) refers to, however, the argument can be made for them to be
included as a separate effect due to a great deal of literature and research on the
topic (Borensztein et al., 1998; Lall, 1992).
The effects have been detailed in the table below, along with the identified costs
and benefits which will be discussed in detail in the following section.

12
Table 1: The effects of the MNC on the host country (Saville, 1993)
1. External effects
a) Size of initial capital inflow
b) Relative marginal propensity to import and export
c) Relative marginal propensity to replace imports
d) Extent of profit/dividend repatriation
e) Size of royalty payments
f) Use of transfer pricing
2. Resource effects
a) Employment creation
b) Relative labour productivity
c) Relative capital intensity
d) Impact on distribution of income
e) Local training of labour
f) Comparative use of skilled expatriate managers
g) Relative cost of finance
h) Undertaking of appropriate local R&D
i) Creation of forward and backward linkages
j) Relative contribution to government revenue
3. Competitive effects
a) Displacement of firms at entry and after entry
b) Relative efficiency and profitability
4. Spillover effect a) Technological and human resource externalities
2.3.1 External effects
The external effects are based on the impacts of the MNC from a macroeconomic
perspective. Literature on the effects of MNC entry and investment in the host
economy has been assessed.
The foreign exchange gap, which is prevalent in developing countries, is a result of
their current account deficit being greater than the value of their capital inflows. It
can be argued that increased capital by way of FDI through the MNC can assist in
filling this gap. Alfaro, Chanda, Kalemli-Ozcan, and Sayek (2004) showed that
during 1998, more than half of all private capital inflows to developing countries

13
was as a result of FDI. Wang (2010) provided evidence from the United Nations in
terms of the increase in world FDI by MNC over the past few decades. In the
1980s the annual average growth rate of world FDI inflows was over 20% and by
the late 1990s it was nearly 40%. There was a slowdown in the 2000’s but an
annual average growth rate of 15% was maintained between 2001 and 2007 (p.
104). Advocates argue that “international flows of capital perform a variety of
functions in the world economy…for example, they permit levels of domestic
investment in a country to exceed the country’s level of saving” (Lipsey, Feenstra,
Hahn, & Hatsopoulos, 1999, p. 307). Increased domestic saving is a determinant of
exogenous growth and therefore assists in filling the budgetary and foreign
exchange gap. It has also been argued that the MNC can assist in filling the foreign
exchange gap in a second way, that is, through replacing imports and encouraging
exports (Saville, 1993). Studies by Blomstrorm (1991), Lipsey et al. (1999), and
Markusen and Venables (1999) have found evidence that the presence of the MNC
has a positive effect on local firms’ propensity to export. In agreement with this,
Ray and Venaik (2008) stated that FDI is acknowledged for boosting exports, and
they also found evidence that the MNC has a greater ability than local firms to
export. Furthermore, in support of both Moss, Ramachandran, and Kedia Shah,
(2004) and Ramstetter (2012), Ray and Venaik (2008) found that the export to
output ratio for MNCs was three times higher than local firms. Chan and Chow
(1997) showed that MNCs in China charge higher prices on exports. In theory, this
should contribute to filling the gap, however, their research also showed that MNCs
shift their profits to lower tax rate countries to minimise their global tax, thus
repatriating profits out of the host country, not contributing to GDP and increasing
the foreign exchange gap. In addition, transfer pricing through the overpricing of

14
imports and under-pricing of exports can also serve to increase the gap. Chan and
Chow (1997) referenced studies where MNCs in Columbia, Brazil, Bangladesh,
and Asia Pacific all overprice their imports which can account for the low
profitability of the MNC. Chan and Chow (1997) and Kumar (1996) also claimed
that MNCs employ transfer pricing to move profits to tax havens or bypass foreign
exchange controls, however, the extent of transfer pricing depends on the relative
tax rates between the host country and other regions. The findings from an
empirical study conducted by Chan and Chow (1997) were inconsistent with the
allegation that MNCs shift profits out of the host country by transfer pricing
manipulations. Their research revealed that MNCs pay higher prices for imports,
however, they also charge relatively higher prices on exports when compared to
local firms therefore negating the effect.
In summary, there is inconclusive evidence as to what the external effects of the
MNC on the host country are and whether the MNC in fact assists in closing the
budgetary and foreign exchange in the host country. Thus Saville (1993) argued,
based on (Schatz, 1981), that “it is only possible to assess the impact of the MNC
on the external sector on a case by case basis” (p. 18). Kugler (2006) agreed with
this view and argued that due to data limitations, empirical studies on the effects of
the MNC on the host country can only be made up of case studies in alignment
with Schatz's (1981) “pragmatic approach”.
2.3.2 Resource effects
The resource effects are based on the effects of the MNC in the internal economy
from a microeconomic perspective and the diffusion of resources from the MNC to

15
local firms operating within or between industry sectors. The literature review is in
relation to the costs and benefits detailed under the resource effect in Table 1,
however, they have been arranged into four categories: (i) labour creation,
productivity, and income distribution; (ii) capital markets; (iii) government revenue;
and (iv) linkages.
2.3.2.1 Labour creation, productivity and income distribution
Advocates of the MNC contend that multinationals play an important role in
creating and growing employment in the host country (Bhaumik, Estrin, &
Grzegorz, 2007; Blomström & Kokko, 2003; Moss et al., 2004; Ramstetter, 2012).
However, a study completed on employment data by Ramstetter (2012) suggested
that employment growth in MNCs kept pace with that of local firms. Conversely,
Mthombeni (2006) stated that during the reintegration of South Africa into the world
economy, the policy that was employed “contributed to the loss of between
500 000 and 1 million jobs in the private sector” (Mthombeni, 2006, p. 167). That
aside, advocates have found evidence that MNCs tend to be more productive than
local firms (Markusen & Venables, 1999; Kokko, Zejan, & Tansini, 2001; Alfaro &
Rodrigues-Clare, 2004; Ramstetter, 2012) and have argued that increased labour
productivity would lead to higher profits and ultimately add to the gross domestic
product (GDP) of the host country. However, based on claims that multinationals
pay higher market wages than their local counterparts (Alfaro & Rodrigues-Clare,
2004; Chan & Chow, 1997; Lipsey et al., 1999; Ramstetter, 2012), Alfaro and
Rodrigues-Clare (2004) argued that the increased wages would completely capture
the increased GDP, hence not contributing to increased national welfare. However,
16
it is very likely that the higher wages and increased productivity will positively
influence local firms (Ramstetter, 2012). The higher wages could lead to increased
individual spending or saving within the host country which indirectly have positive
effects on the economy (Maki, 2000; Uhlig & Yanagawa, 1996).
In addition, a study by Glass and Saggi (2002) showed that wage differentials are
relative to industry. For instance, in the textiles and metal products industries,
MNCs pay roughly the same wages as local firms. However, Glass and Saggi
(2002) identified the differentiating factor as “technology”, and agreed with Saville
(1993) and Ramstetter (2012) that “MNCs tend to employ technology that is more
capital-intensive” (Saville, 1993, p. 19), thus MNCs tend to pay higher wages due
to the requirement for skilled workers which command a higher pay rate (Glass &
Saggi, 2002). Glass and Saggi (2002) also cited a second reason why MNCs pay
higher wages, that is, as a means of retaining skilled labour, reducing the risk of
their employees being poached by local firms.
In terms of job creation, Ramstetter (2012) disagreed with the advocates, however,
his research associated technology with job creation, and showed that MNC’s tend
to produce higher quality products based on these technology advantages over
local firms, which tended to negatively impact the amount of jobs created. The
argument, however, still favours the advocates in terms of the total benefits gained
by the host economy. Even if MNCs create fewer jobs than local firms, the cost is
offset by higher labour productivity, higher product quality, and thus higher
revenues (Ramstetter, 2012).

17
2.3.2.2 Capital markets
Saville (1993) argued that “the MNC adversely affects the LDC economy by
distorting capital markets in two ways; (i) gaining favourable access to (cheaper)
finance, and (ii) undertaking excessive repatriation of profits rather than reinvesting
earnings“(Pg. 20). Profit repatriation was discussed in section 2.3.1 where the
outcome resulted in contradictory evidence. In terms of the issue regarding the
cost of borrowing of MNCs compared to local firms, the literature focuses
specifically on the theory of internationalisation (Klein & Wöcke, 2009) where
MNCs are said to have access to more capital as well as cheaper finance based
on their access to international markets. However, in specific relation to the issue
at hand, contradictory arguments exist. Reeb, Mansi, and Allee (2001) provide
reasons for each case, MNCs can take advantage of market imperfections and
hence gain access to cheaper finance, and on the other hand, the argument of
“exchange rate risk and political risk… suggest that the international firm will have
a greater probability of financial distress and, therefore, a higher cost of debt”
(Reeb et al., 2001, p. 398). Furthermore, Saito and Hiramoto (2010) made
reference to Errunza and Senbet (1981) who stated that “MNCs have the ability to
arbitrage segmented capital markets, obtaining lower cost of debt” (Saito &
Hiramoto, 2010, p. 65). In agreement with this, Doukas and Pantzalis (2003) based
the MNCs’ lower cost of debt on the fact that MNCs tend to be industrially and
geographically diverse, resulting in lower business and financial risk when
compared to local firms.

18
2.3.2.3 Government revenue
Advocates of the MNC suggest that MNCs pay relatively higher tax rates than local
firms which contribute to government revenue and in turn contribute to filling the
budgetary gap (Saville, 1993). However, recent literature advocates that tax
incentives which reduce the corporate tax rates for MNCs have been implemented
to attract MNC investment. Evidence for this was provided by Fedderke and Romm
(2006) who stated that “the impact of corporate tax rates is straightforward. Since
higher tax rates applied to corporate profits lowers FDI returns, it will discourage
inward FDI. Devereux et al. (2002) show that OECD countries do indeed compete
with each other over corporate taxes in order to attract investment.”(p. 748).
2.3.2.4 Linkages
Saville (1993) identified the forward and backward linkages provided the by MNC
as a “significant stimulus to the economy” (p. 21). Depending on where the MNC
enters the market, backward linkages can be created which can lead to an
increased demand for local inputs, and forward linkages through encouraging
investment in successive phases of production. These linkages are seen to have a
positive impact on the host industries and sectors, however, empirical evidence to
determine whether these linkages are in fact created is inconclusive. Hobday
(1995), cited in Markusen and Venables (1999), is in support of this based on a
study conducted in East Asia which found a number of circumstances in which
initial MNC investments created backward linkage effects to local suppliers.
However, Narula and Dunning (2010) concluded that it is unclear as to whether
MNC activities increase linkages. A review of the evidence conducted by Meyer

19
(2012) concluded that both forward and backward linkages are evident, however,
they are more prevalent across industries than linkages within the same industry.
Meyer (2012) cited Gertler (2003) who found strong evidence of linkages in
vertically related industries, whereas linkages in the same industry had no
significant effect.
2.3.3 Competitive structure of the host economy
Saville (1993) identified and assessed two key influences on the competitive
structure of the economy as a result of MNC entry and operation in the host
country. Available literature on each of these influences is reviewed below.
2.3.3.1 Profitability
Saville (1993) assessed the competitive structure of the economy while
investigating the displacement of local firms once MNCs have entered the market.
Markusen and Venables (1999) stated that the competition effect is created when a
MNC enters the local market and increases competition, however, depending on
where in the production process they operate, there are both positive and negative
outcomes. They go on to say that the MNC reduces the profitability of the local
firms in the same industry resulting, in the displacement that Saville (1993) referred
to. Furthermore, their study showed that increased competition in the final product
industry, as a result of the MNC entry, reduced the profitability of domestic firms in
the same industry. Kugler (2006) showed that MNCs tend to target industries in
which domestic firms can easily be out-produced, resulting in the inability of the

20
local firm to challenge the MNC thus losing market share which may lead to them
closing down.
2.3.3.2 Efficiency
Critics argue that MNCs displace local firms through higher operational efficiencies,
resulting in higher productivity per asset (Markusen & Venables, 1999) therefore
creating oligopolistic market structures and displacing local firms (Saville, 1993).
However, MNC operational costs tend to be higher as a result of the technology
used which can result in reduced profits and thus the increased efficiency not
having any positive macroeconomic effect. Still, increased efficiencies can result in
better quality outputs which can be sold at a higher price or exported, therefore
having a positive effect on the host economy. Saville (1993) investigated the effect
of increased MNC efficiencies on creating oligopolistic markets and cited the work
of Hymer and Rowthorn (1970); Lall (1980) Mandel (1980) and Grosse (1989),
further research on this topic is lacking and therefore references to earlier work has
been cited. The conclusion regarding the creation of oligopolistic markets as a
result of MNC efficiencies is argued to be inconclusive (Saville, 1993).
2.3.4 Spillover effects
Spillovers from MNC to domestic firms can result in positive or negative effects;
however, it is difficult to empirically test these relationships. Research has been
completed in this area but the results are inconclusive as to whether they have
positive or negative effect on the local firm.
21
Blomström et al. (1994) examined the role of the host country’s overall
development level as a factor of spillovers. The results of their study of various
economies suggested that spillovers are focused on middle-income developing
countries. However, in terms of the impacts, Marin and Sasidharan (2010)
reviewed the positive and negative spillover effects in India and came to the
conclusion that evidence regarding spillover effects shows mixed results.
Furthermore, Alfaro and Rodrigues-Clare, (2004) conducted a study which was not
able to confirm the existence of positive spillovers from FDI to host countries.
Moreover, literature reviews and empirical studies conducted by Alfaro and
Rodrigues-Clare (2004); and Gorg and Greenway (2004) show mixed evidence.
Fedderke and Romm (2006) confirmed a positive spillover effect on capital labour
and technology as a result of FDI; however, in the short run there was evidence of
a crowd-out of domestic investment, while in the long run the effects on output
were positive.
Recent literature (Lyer, 2009; Kugler, 2006; Marin & Sasidharan, 2010) has shown
a vast increase in studies relating to the spillover effects as a result of MNC entry
into local industry. As a result, two main factors have been identified as the key
drivers of spillover effects; (i) technology appears to be the main driver in creating
spillovers, however, (ii) human resources play a vital role on facilitating the
diffusion. The next section discusses the theory of spillover effects and focuses on
these drivers.

22
2.3.4.1 Technology and human resource diffusion
Based on the effects identified in Table 1, literature (Borensztein et al., 1998; Glass
& Saggi, 2002; Kugler, 2006; Kumar, 1996; Lall, 1992; Marin & Sasidharan, 2010)
identifies technology and human resource diffusion as the two attributes that have
the most positive contribution to economic growth, however, there are some
limitations.
Borensztein, De Gregorio, and Lee, (1998) conducted research regarding
technology diffusion and the effects it has on economic development. They
determined that technology diffusion positively affects the growth rates in
developing countries. However, they found that the rate of economic growth of a
developing country in a typical model of technology diffusion depends on the
degree of adoption and implementation of new technologies. Furthermore, their
findings indicated that MNCs are considered to be a major channel for the access
to advanced technologies by developing countries. MNCs are found to be among
the most technologically advanced firms, accounting for a substantial part of the
world’s research and development (R&D) investment. Similarly, Blomstrom (1991)
stated that MNCs undertake a major part of the world's R&D efforts and produce,
own, and control most of the advanced production technology. To substantiate this
claim, Borensztein et al., (1998) cited Findlay (1978) where he proposed that “FDI
increases the rate of technical progress in the host country through a ‘contagion’
effect from the more advanced technology and management practices used by the
MNCs” (p. 116).
Similarly, De Mello (1997) states that “When technology transfers result from the
impact of foreign technologies, evidence for China, Zhao (1995) shows that the

23
local technological capability is positively affected by technology imports; so is
output growth, R&D at home and manufacturing exports.” (p. 24)
In addition to technology, human resources and knowledge were also identified as
factors to positively increase growth rates in the host country. Wang (1990)
confirmed that the increase in ‘knowledge’ applied to production is determined as a
function of FDI.
In order to take advantage of these advanced levels of technology, Nelson and
Phelps (1966) and Benhabib and Spiegel (1994) agreed that the presence of an
adequate level of human capital is required in the host economy. From that they
reasoned that the level of human capital in the host country can play a large role in
limiting the absorptive capability of the host country which can therefore be a
limitation to the growth rates.
Borensztein et al. (1998) tested the effect of FDI on economic growth in a
framework of cross-country regressions utilising the data of FDI flows from
industrial countries to 69 developing countries over the last two decades. Their
results confirmed that FDI is in fact an important vehicle for the transfer of
technology. In addition, their research findings showed a strong complementary
effect between FDI and human capital, again confirming that the contribution of FDI
to economic growth is enhanced by its interaction with the level of human capital in
the host country. However, the results also imply that FDI is more productive than
domestic investment only when the host country has a minimum threshold stock of
human capital.
De Mello (1997) looked at growth as a result of FDI and whether it can be
sustainable in the long run as well as the short run. The paper discusses growth

24
theory models and FDI, looking at endogenous and exogenous growth models.
The findings indicated that long run growth as far as FDI is concerned can only
result from technological progress and/or population/labour force growth, which are
both considered to be exogenous. They state that the “only vehicle for growth
enhancing FDI would be through permanent technological shocks” (p. 8). This is in
alignment with the findings of Borensztein et al. that technology and human capital
investment as a result of FDI through MNCs result in growth in the host country.
The caveat, however, is agreed upon by Borensztein et al. (1998), Nelson and
Phelps (1966), and Benhabib and Spiegel (1994), that is, that the host country
must have a minimum threshold stock of human capital in order for the host
country to absorb the capabilities. Alfaro and Rodrigues-Clare (2004) confirm this
finding by citing Xu (2000), “who uses data on U.S.-based multinational
corporations, finds that a country needs to reach a minimum human capital
threshold to benefit from the technology transfer from multinationals and that most
developing countries do not meet this threshold” (p. 117).
This investigative framework was based on some of the available evidence on the
impact of the MNC, however, the next section will provide information specific to
the South African context and therefore provide the logic for undertaking South
Africa as the subject of this study.
2.4 The South African context
The context in which Saville (1993) wrote his paper can be described as a time of
political unrest in South Africa. During the late 1980’s and early 1990’s in South
Africa, sanctions were in the process of being lifted, political turmoil was rife and

25
the future of the country was uncertain. It was evident from the FDI flows during
that time that the sanctions had a negative effect on the development of the
country and the government has focused on attracting international investment into
South Africa since then.
To date, polar opposite views on whether MNCs impact positively or negatively on
the South African economy exist, though they are based on beliefs and opinions
rather than empirical evidence. The political and economic landscape of South
Africa has changed dramatically over the last two decades, hence the requirement
to re-evaluate the effects of MNCs on the South African economy. Policy is
currently influenced by ideology rather than evidence, hence the need for this study
to inform policy based on empirical evidence.
There has been much debate around nationalisation within the South African
environment, spurred by some South African citizens and politicians who are of the
belief that nationalisation is a way to empower the country and to solve inequality
and socioeconomic issues. This is an indication of negative sentiment regarding
MNCs in South Africa. This has been evident in the recent Massmart/Wal-Mart
acquisition which received much attention in 2011 from the media and economists
alike. Many people protested against the acquisition and identified the negative
effects associated with MNCs as reasons for Wal-Mart not to acquire Massmart.
There was also strong support for the acquisition, citing the benefit of job creation
due to their expansion plans through the creation of forward and backward
linkages. The acquisition did go ahead despite protests from the South African
labour unions, however, it is still too soon to analyse the impacts. This example
highlights the polar views of the effects of the MNC in South Africa, and it can be

26
said that these views are not based on empirical evidence and are merely based
on opinions.
Despite the South African MNC critics, the table below shows how inward FDI in
South Africa since 1995 has increased. This indicates that the downward trajectory
noted in Saville (1993) has been reversed since the inception of democracy in
1994. However, the evidence as to whether increased FDI has had a positive effect
on South African industry must be empirically investigated.
Figure 2: Inward foreign investment into South Africa

27
2.4.1 African scepticism toward foreign investment
With the onset of globalisation and increasing global competition to attract FDI,
Africans still have a negative attitude towards foreign capital investment and
ownership. This is based on their past experiences of European capitalism entering
their countries and exploiting all their resources (Moss et al., 2004). This negative
sentiment can be applied to South Africa and provides reasons for the current
opposition to MNC’s owning and investing in South African companies.
Many of the supported benefits of FDI are repeatedly challenged directly, both on
ideological and empirical grounds. There is a common criticism that MNCs and
foreign investment have a crowding out effect on local firms and that these firms
cannot compete because of financing, size, marketing power, or some other unfair
advantage (Dunning, 1993; Sylwester, 2005; Fedderke & Romm, 2006; Wang,
2010).
Moss et al. (2004) highlighted this negative attitude against foreign investment by
quoting an article published in the government-owned Times of Zambia on March
4, 2004; “The uneven playing field has led to local industry and products failing to
compete effectively ... there are far too many cases of investors coming into the
country and divert into ventures that should be best left to the locals ... It is such
issues that investment legislation needs to address” (p. 8). In contrast, a study by
Fedderke and Romm (2006) conducted in South Africa, empirically showed
positive effects on growth as a result of foreign investment in South Africa.

28
2.5 Concluding Remarks
The literature regarding the effects of the MNC on the local firms, and ultimately
the host country’s economy, does not provide a clear position, either empirically or
theoretically. The literature looks at both macroeconomic and microeconomic
factors and in many cases comes to mixed conclusions. Therefore, it can be stated
that the impacts of MNCs on local firms sit on a continuum ranging from positive to
negative effects which are based on a number of other attributes. This results in
the need for further investigations into this subject. Based on updating the Saville
(1993) study, the case has been made to use South Africa as the country of
interest. Previous studies conducted on South Africa have resulted in mixed
conclusions based on empirical evidence; however, the ideological views tend to
sway toward the negative side of the continuum therefore making the argument for
continuous research.
29
3. Research questions
In recent times the political landscape of Africa has led to reduced interest in FDI.
African countries tend toward nationalising local firms and do not want the MNCs to
operate in their countries for fear of a loss of control (Moss et al., 2004). Moss et al,
(2004) expand on this statement, they argue; “Although there has been substantial
turnover of political leadership in Africa over the past decade, many of the current
decision-makers (including those frequently hailed as reformers) have held political
positions for decades and were trained on the socialist model steeped in anti-
foreign investment ideology. Indeed, nearly every African leader, no matter how
liberal he is considered today, began his career as a socialist or Marxist. Even as
most of Africa’s finance ministers have become increasingly convinced that
economic openness can be beneficial for their countries and fluent in the language
of international capitalism, many of their cabinet colleagues remain
unreconstructed economic nationalists. Some of the ideological opposition to
foreign investment is part of a general critique of capitalism and more recently of
globalization and foreign capital remains an easy target” (Moss et al., 2004, pg7).
In line with the argument made by Moss et al., this research will shed light on the
impacts of the MNC within the South African context. It attempts to provide
empirical evidence to ascertain whether the MNC has a positive or negative effect
on the South African economy. The results will be used to either validate or reject
the African claims regarding MNC investment from an empirical rather than an
ideological perspective.
The effects on the South African economy will be analysed at firm level and
specifically aims to answer the following three research questions.

30
3.1 Research Question 1: Does the MNC assist in creating increased
labour productivity within the host country?
In order to answer the above question, the following determinants of total
labour productivity have been identified. These determinants are in line with
those used by Saville (1993), given that this research will serve as an
update to his work.
Table 2: Determinants of labour productivity
Determinants of labour productivity
Job creation
Employee productivity
Productivity resultant of capital intensity
Income distribution
Government revenue
3.2 Research Question 2: Does the MNC adversely affect the host
economy by distorting capital markets?
In order to answer the above question, the following determinants of capital
market distortion have been identified which inform the research question.
These determinants are in line with those used by Saville (1993), given that
this research will serve as an update to his work.

31
Table 3: Determinants of capital market distortion
Determinants of capital market distortion
Cost of financing
Extent of profit repatriation
3.3 Research Question 3: Is the MNC responsible for creating a negative
effect on the competitive structure of the host economy?
In order to answer the above question, the following determinants of
competitive structure have been identified which inform the research
question. These determinants are in line with those used by Saville (1993),
given that this research will serve as an update to his work.
Table 4: Determinants of competitive structure
Determinants of competitive structure
Profitability
Efficiency

32
4. Research method
4.1 Research Background
Based on a review of available literature, it can be concluded that there are two
opposing schools of thought on the impact of MNCs on the host economy, the
advocates and the critics. The evidence provided confirms that there is no general
agreement. Both theoretical reviews and empirical studies have resulted in mixed
conclusions (Alfaro & Rodrigues-Clare, 2004; Wang, 2010) For that reason, it can
be argued that it is only possible to evaluate the impact of the MNC on a case-by-
case basis. On this premise, the method used to empirically test the validity of
claims made by advocates and critics, made use of a case-study approach. This
study specifically evaluated the case of South Africa. It was a comparative study
which aimed to establish whether MNC’s contribute to the South African economy
in a positive or negative way. Finally, it aimed to prove whether MNCs are more
efficient than local firms in filling the four gaps in the South African economy.
4.2 Research design and method
The research made use of a quantitative, descriptive case study method. The
study compared secondary information gathered from the financial statements of
Johannesburg Stock Exchange (JSE) listed companies.
This study aimed to build on the research of Saville (1993) and to determine if the
results from his study still hold true. The research design and method used is in
accordance with this goal. Saville’s research was conducted almost 20 years ago

33
and focused on empirically testing the comparative performance of multinational
and local firms operating in the construction and engineering sectors in South
Africa. Due to the time constraints of the research project and the nature of the
data available, only cross sectional data was used in Saville’s research. Saville
(1993) cites Jenkins (1990) in order to make the argument for the use of cross
sectional data, however Jenkins (1990) argues that a “suitable size of time series
data, for instance 20 years, poses a vast problem in that firm buyouts, mergers and
acquisitions and internal restructuring over that period make it difficult to compare
these firms based on internal homogeneity” (p. 25). Therefore Savilles’ (1993)
study made use of cross-sectional data for the year 1989 to 1990. However, data
from 2007 to 2011 was used in this study in order to increase the sample size
considerably. In terms of the issue highlighed with regards to buyouts, mergers and
acquisitions, it did not play a role in the dataset and therefore the larger sample
was used.
In summary, this study made use of pooled cross-sectional time series data over
five years, dating 2007 to 2011. In support of this method, Alfaro and Rodrigues-
Clare, (2004) and Wang (2010) also made use of cross-sectional time series
studies on the effects of foreign investment on the host country.
4.3 Population and unit of analysis
The unit of analysis for this research was the multinational firm and local firm
operating within South Africa. The sample included multinational and local firms
listed on the JSE. JSE data was chosen as it stems from audited company data
and is assured to be easily accessible, accurate and reliable. Saville’s study (1993)

34
was conducted within the South African industrial sector, specifically on the
construction and engineering industries.
Saville (1993) specifically investigated multinational and local firms within the same
sector in order to comply with the “fungibility” assumption. This assumption is
based on the interchange ability between multinational and local firms. Saville
(1993) argues that it is necessary to compare firms that are similar. In order to
make a quantitative comparison, the multinational and local firms must be
equivalent substitutes for each other. Saville (1993) also argues that firms
operating in the same sector display some degree of homogeneity and therefore
fulfil the fungibility assumption.
An analysis of the main board of the JSE in 2012 identified a reduction in the
amount of local and multinational firms operating within the industrial sector.
Further analysis indicated that there was a sufficient amount of multinational and
local firms operating in the basic material sector, thus this study was based on that
sector.
Creamer (2012) shows how important the mining sector is to the growth and
development of the South African economy; “The South African mining industry’s
contribution to the South African economy had shrunk from R103-billion in 1993 to
R93-billion in 2009, despite the global commodity boom and the talk of the so-
called super cycle. Trevor Manual conceded that the South Africa government had
failed to put in place the requisite water, rail and electricity infrastructure needed for
much higher mining output. With such infrastructure in place, there was no reason
why mining output could not double in the decade to support a 7% annual

35
economic growth rate” (Creamer, 2012, par. 5, 8, 9). This provides further rationale
for basing this study on firms operating in the mining sector.
Regression analysis was conducted to investigate the relationships between
specific variables in alignment with the identified determinants which inform the
research questions in Chapter 3. The following secondary data for companies
listed in the basic resources sector were collected from the McGregor’s database
for five years, 2007 to 2011; total assets, fixed assets, total liabilities, long term
interest bearing debt, turnover, earnings before interest and tax, interest paid, tax
paid, operating profit margin, dividend cover, number of employees, number of
directors, remuneration to directors, cost of borrowing, change in profit margin,
change in owners’ equity, owner, capital intensity, capital intensity of fixed assets.
In comparison with Saville (1993), the data collected was the same, with the
exception of the number of expatriate directors. This information was not easily
available and due to time constraints was left out of the sample. In addition, fixed
assets and capital intensity of fixed assets was included due to a recent study
which indicated that fixed assets may be a better means of comparison
(Ramstetter, 2012).
4.4 Sampling method and sample size
An analysis of the main board of the JSE identifies 74 companies listed in the basic
resources sector (as at 03 September 2012). This sector is made up of the
following industries;

36
Table 5: Basic resources
Basic Resources
Forestry and Paper
Industrial Metals and Mining
Mining
Firm ownership was determined based on shareholding percentage, firms that
showed foreign shareholder ownership were classified as foreign and the opposite
rule held for local ownership. The breakdown of the firm ownership is shown in the
table below.
Table 6: Owership per sector
SECTOR FOREIGN LOCAL TOTAL
Basic Resources 37 39 76
Forestry and Paper 1 3 4
Industrial Metals and Mining 7 5 12
Mining 28 30 58
Grand Total 37 39 74
Upon closer inspection, the forestry and paper industry was excluded from the final
sample set. This was based on dissimilarity of operations when compared to
industrial metals and mining, and mining industries which may have resulted in
skewed results, in line with the fungibility assumption. This reduced the initial
sample of 74 down to 71 companies. A further 35 firms were excluded from the
final sample for one of four reasons:

37
1. Nineteen of the 35 firms in the initial sample were not operating mines.
These firms were involved in mining exploration and therefore could not be
compared to firms with mining operations.
2. Based on the definition that only firms with operating mines within South
Africa are to be included in the dataset resulted in the exclusion of a further
nine firms from the dataset.
3. Two firms no longer had operating mines, due to various reasons, therefore
showing no accounting activities over the five year period and thus no
means of comparison.
4. The remaining five firms were still setting up operations and once again had
no accounting activates to report and thus compare on.
The final sample consisted of 36 companies, 15 foreign owned and 21 locally
owned, operating in the industrial metals and mining, and mining industries. Data
was collected for a five year period from 2007 to 2011 for each firm. Not all firms
had information for the full period. In the cases where information was not available
it was ignored when running the statistical analysis.
4.5 Data collection and analysis
All secondary data was collected from the McGregor BFA Research Domain with
exception of the number of directors and ownership. Financial statements retrieved
from company websites and SENS information downloaded from Sharedata was
used to complete the missing information. The “Who Owns Who” (McGregor, 2012)
publication was also used.

38
In an attempt to ensure data accuracy, information received from McGregor’s was
compared to data downloaded from the Osiris database via the Gibs database
portal and actual financial statements downloaded from individual company
websites.
Some firms’ financial statements were presented in currencies other than the
South African Rand (ZAR). Currencies such as US Dollar (USD), Australian Dollar
(AUD), British Pound (GBP) and Canadian Dollar (CAD) formed part of the initial
sample. These currencies were converted to ZAR using the following exchange
rates:
Table 7: Currency conversion
Currency ZAR Rate Source Date Accessed
USD R8.28 www.jse.co.za 23-Sep-12
GBP R13.43 www.jse.co.za 23-Sep-12
AUD R8.65 www.jse.co.za 23-Sep-12
CAD R8.50 http://fx-rate.net/ZAR/CAD/ 23-Sep-12
A copy of the final data set can found in the appendix. The data analysis was
carried out in STATISTICA version 10, a data analysis software system. It can be
noted that not all companies had data for all years. This was due to non-operation
of some companies in some of the years. Some companies moved from
exploration operations to operational mines and did not record adequate financial
activity during this period. This data was excluded from the analysis.
4.6 Research Limitations

39
This study was conducted in a South African context and may not be applicable to
other countries due to economic and political differences; it focusses exclusively on
the mining sector; tests only for directly observable and empirically quantifiable
effects; ignores unlisted firms and excludes some firms based on the unavailability
of data.

40
5. Research results
The final data set contained financial data from 36 companies in the SA mining
sector over a period of 5 years (2007 to 2011). The aim of the study was to
investigate the models used by Saville (1993) in order to inform three research
questions. Some changes have been made to the models that were used by
Saville (1993), reasons for which have been provided in the main text, along with
the regression results and summary statistics.
All data was analysed and tested for normality, outliers and so on. Due to the
highly skewed distributions of most of the variables, each variable was tested for
significant differences between ‘years’ and ‘owner’. This was done by a non-
parametric alternative to the ANOVA, namely, the Kruskal-Wallis test and a non-
parametric alternative to the t-test, namely, the Mann-Whitney U test. There were
no significant differences between years for any of the variables in the study,
however, significant differences were found between owner.
Saville (1993) made use of two sectors in his study and therefore used a control
variable in order to control for differences. The present study only evaluated one
sector, however, as discussed previously, the control variable, year, has been
included to control for differences in the five years of data.
5.1 Research question 1: Does the MNC assist in creating increased
labour productivity within the host country?

41
The first question aims to test whether there is a difference between labour
productivity in terms of a significant contribution by foreign or locally owned firms.
In order to test productivity as per Chapter 3, five separate models were run.
5.1.1 Employment Creation
Critics argue that MNC’s are no better at creating jobs than local firms. The model
employed to test the validity of this claim is adopted from Saville (1993), where it is
argued that the number of jobs created by a firm is a function of the size and the
relative profitability of the firm, in that more profitable firms tend to require and hire
more workers. Saville (1993) measured size of the firm and relative profitability by
total assets and operating margin. However, it can be argued that a firm’s total
assets are not an accurate measure of its size due to historical accounting
associated with assets that may lead to accounting convention distortions. As a
result, turnover has been identified as a more accurate way of measuring and
comparing firm size as it is not stated historically and is based on recent annual
performance. In comparing the performance of local firms and MNCs, it is
necessary to control for ownership differences. This is achieved by constructing the
dummy variable owner, with foreign as the reference category. Furthermore, the
model was run across five years, with year added as the covariate to control for
variation, and with 2011 as the reference category for year. The model is used to
explain the level of employment creation, and thus includes the following variables:

42
Table 8: Employment creation
Model Dependent Variable Independent Variables
Employment creation Number of employees
Operating margin Turnover Year Owner
The initial model was run and extreme values were identified, therefore, the
regression model was rerun excluding these values. The regression results and
summary statistics are presented below.
Table 9: Employment creation results
Level of Effect
Parameter SE t p
Intercept 3851.296 1530.480 2.516 0.013
Operating Margin -40.824 27.175 -1.502 0.136
Turnover/1000000 933.848 83.862 11.136 <0.0001
Owner Local -1597.702 1187.551 -1.345 0.181
year 2007 3225.710 2408.050 1.340 0.183
year 2008 -298.933 2223.250 -0.134 0.893
year 2009 1307.752 2155.669 0.607 0.545
year 2010 -1237.838 2123.203 -0.583 0.561
The results show that the overall model was significant (F=22.3; p<0.0001) .The
model explained 55% of the variance in employment levels, and indicates that the
effect of turnover (p<0.0001) on employment levels was significant. The results
also indicate that the average number of jobs created by firms in the sample is
3851, as given by the intercept. Moreover, holding all other factors constant, every
R1 billion increase in turnover leads to 933 additional jobs. These results are
interpreted and discussed in more detail in Chapter 6.

43
5.1.2 Labour productivity
It is argued by advocates of the MNC that even if MNCs create fewer jobs than
local firms, the cost is offset by the higher productivity of MNC labour. This model,
based on Saville (1993), measures labour productivity by value added per
employee, which is calculated by dividing earnings before interest and tax (EBIT)
by number of employees. The model includes the following independent variables;
capital intensity defined as assets per employee, scale of operations for which
turnover is used as a proxy, and the degree of supervision of labour, approximated
by turnover per director. In respect of keeping the model up to date, specific
changes were made. In accordance with Blomström and Kokko (2003), capital
intensity has been changed to include fixed assets in the calculation, rather than
total assets. Initial diagnostics indicated a high correlation between supervision of
labour and turnover (r=0.997, p<0.0001), this may be a result of the supervision of
labour calculation in which turnover is an input. To reduce the high correlation and
potential issues as a result of multicollinearity, the supervision of labour calculation
has been altered and is therefore determined by number of employees per director.
Arguably, a better measurement would be number of employees per manager
instead of number of employees per director, however, information on the number
of management employees was not available at the time of data collection.
Again, the model controls for annual differences and measures ownership
differences with the aid of dummy variables year and owner respectively. The
model includes a no-intercept model, since zero turnover and thus zero supervision
implies zero value added per employee. The model used is presented below.

44
Table 10: Labour productivity
Model Dependent Variable Independent Variable
Labour productivity Value added per employee
Owner Capital intensity Turnover Year Supervision of labour
The initial model was run and extreme values were identified, therefore, the model
was rerun excluding these values. The regression results and summary statistics
are presented below.
Table 11: Labour productivity results
No of Obs: 106 Level of effect Parameter SE t p
Capital intensity 0.213 0.081 2.646 0.009
Turnover/1000000 4.127 2.011 2.053 0.043
Supervision -0.012 0.039 -0.301 0.764
Owner Local 18.468 59.563 0.310 0.757
year 2007 62.114 118.604 0.524 0.602
year 2008 159.655 106.936 1.493 0.139
year 2009 -52.379 106.016 -0.494 0.622
year 2010 -111.944 105.023 -1.066 0.289
The overall model was significant (F=3.52; p=0.001) and it explained 16% of the
variance in the dependent variable. Furthermore, the effect of capital intensity and
turnover on value added per employee is both significant, indicating that higher
capital intensity and turnover leads to greater value added per employee.
Specifically, a 1,000-unit increase in capital intensity resulted in an increase in
value added per employee of 213 and R 1 billion increase in turnover resulted in an
increase in value added per employee of 4.1. These results are interpreted and
discussed in more detail in Chapter 6.

45
5.1.3 Appropriate Technology
Critics argue that the main factor contributing to the higher productivity of MNC
employees is the availability of more capital intensive technology, however, critics
and advocates agree that for local firms to take advantage of this technology
depends on the degree of adoption and implementation of new technologies within
the industry (Borensztein et al., 1998). The model employed at this point is once
again adopted from Saville (1993), however, changes have been made based on
new developments. Saville (1993) makes the argument based on Kirim (1986), that
capital intensity is positively correlated with size of the firm and scale of operations,
therefore, the independent variables used in the model are turnover and assets
respectively. However, new developments and improved access to resources since
1993 has resulted in fixed assets being used in place of assets. As noted in
previous models, the existence of multicollinearity between turnover and fixed
assets, and concerns based on fixed assets’ historical nature, would result in the
elimination of fixed assets as an independent variable. However, whist it is
acknowledged that this is a limitation of available resources, fixed assets is
arguably the best proxy for scale at this time.
Again, the model controls for annual differences and measures ownership
differences with the aid of dummy variables, year and owner. A no-intercept model
was used since, by definition, zero fixed assets correspond to zero capital intensity.
Also note that diagnostics indicated that the log of capital intensity is a better
measure for the purposes of meeting model assumptions.

46
Table 12: Appropriate technology
Model Dependent variable Independent variable
Appropriate technology Log (capital intensity)
Fixed assets Turnover Year Owner
The initial model was run and extreme values and outliers were identified,
therefore, the regression model was rerun excluding these values. The regression
results and summary statistics are presented below.
Table 13: Appropriate technology results
No of Obs: 104 Level of Effect
Parameter SE t P
Fixed assets/1000000 0.393 0.084 4.696 <0.0001
Turnover/1000000 0.078 0.026 3.016 0.003
Owner Local 1.544 0.366 4.219 <0.0001
year 2007 -0.869 0.739 -1.176 0.242
year 2008 -0.108 0.663 -0.163 0.871
year 2009 0.247 0.653 0.378 0.706
year 2010 0.030 0.639 0.047 0.963
The overall model was significant (F=23.6; p<0.0001). The model explained 60% of
the variance in the dependent variable. The effects of turnover (p<0.0001) and
owner (p=0.001) were significant. Specifically, a R1 billion increase in turnover
resulted in an increase in capital Intensity of 1.25 times. Of greatest significance,
though, is the significant coefficient on the variable, owner, which suggests that
local firms translate into higher capital intensity when compared to MNCs, all else
equal. These results are interpreted and discussed in more detail in Chapter 6.
5.1.4 Distribution of income

47
Research shows that MNCs tend to pay above market wages in comparison to
local firms. Critics argue that this phenomenon distorts income patterns in the host
economy and increases inequality in the South African population. Data concerning
labour remuneration was not accessible for enough of the firms in the sample.
Thus, the model used is based on Saville (1993). As in the case of Saville (1993),
data on directors’ remuneration is used as a proxy for management salaries. The
model tests for differences in remuneration by regressing remuneration per director
on the identified determinants of directors’ pay, namely, firm size based on assets,
relative operating margin, and absolute profitability or EBIT in this case.
Diagnostics indicated that EBIT and assets are highly correlated. Reasoning for
this may be that larger, more profitable, firms tend to pay higher wages, for
example, an individual working at a larger firm has greater responsibility and is
paid in accordance with this increased responsibility and profitability. Due to
historical accounting of assets and the accounting implications thereof, it has been
decided to remove assets from the model.
The model once again controls for annual differences and measures ownership
differences with the aid of dummy variables, year and owner. Also note that
diagnostics indicated that the log of management remuneration is a better measure
for the purposes of meeting model assumptions.
Table 14: Distribution of income
.Model Dependent variable Independent variable
Distribution of income Log(Management remuneration)
EBIT Operating margin Year Owner
The regression results and summary statistics are presented below.
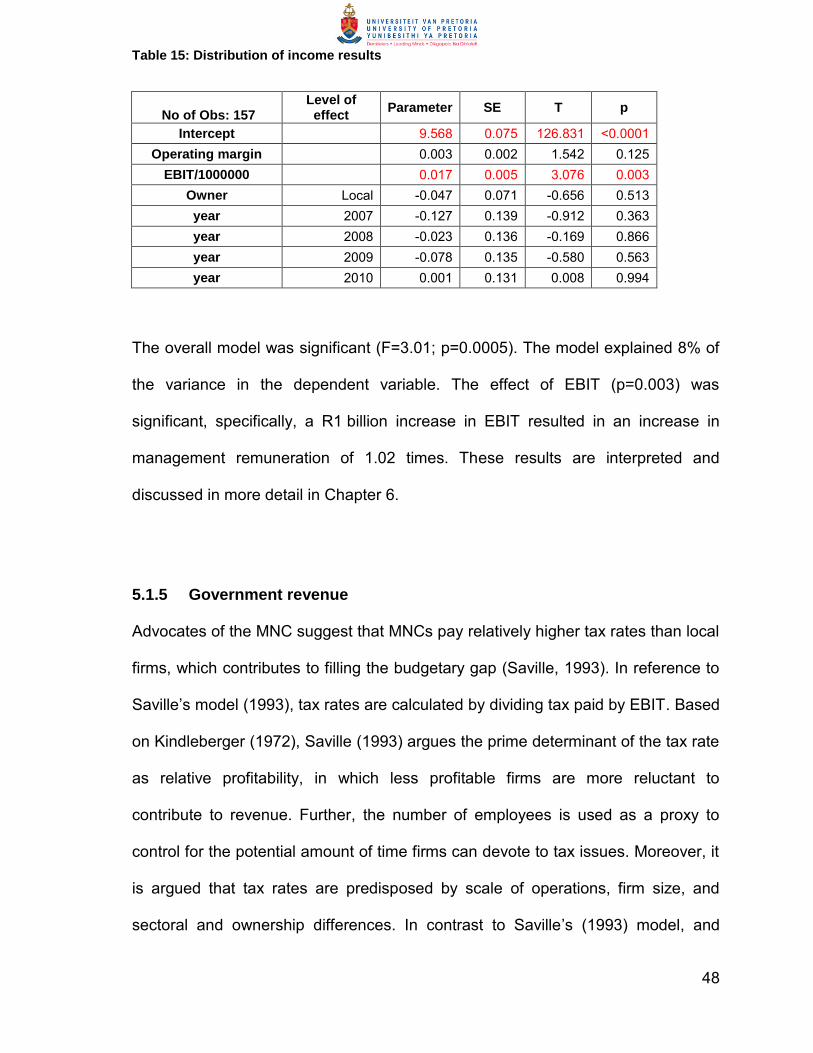
48
Table 15: Distribution of income results
No of Obs: 157 Level of effect
Parameter SE T p
Intercept 9.568 0.075 126.831 <0.0001
Operating margin 0.003 0.002 1.542 0.125
EBIT/1000000 0.017 0.005 3.076 0.003
Owner Local -0.047 0.071 -0.656 0.513
year 2007 -0.127 0.139 -0.912 0.363
year 2008 -0.023 0.136 -0.169 0.866
year 2009 -0.078 0.135 -0.580 0.563
year 2010 0.001 0.131 0.008 0.994
The overall model was significant (F=3.01; p=0.0005). The model explained 8% of
the variance in the dependent variable. The effect of EBIT (p=0.003) was
significant, specifically, a R1 billion increase in EBIT resulted in an increase in
management remuneration of 1.02 times. These results are interpreted and
discussed in more detail in Chapter 6.
5.1.5 Government revenue
Advocates of the MNC suggest that MNCs pay relatively higher tax rates than local
firms, which contributes to filling the budgetary gap (Saville, 1993). In reference to
Saville’s model (1993), tax rates are calculated by dividing tax paid by EBIT. Based
on Kindleberger (1972), Saville (1993) argues the prime determinant of the tax rate
as relative profitability, in which less profitable firms are more reluctant to
contribute to revenue. Further, the number of employees is used as a proxy to
control for the potential amount of time firms can devote to tax issues. Moreover, it
is argued that tax rates are predisposed by scale of operations, firm size, and
sectoral and ownership differences. In contrast to Saville’s (1993) model, and

49
based on previously discussed issues regarding the relationship between assets
and turnover, assets have been removed from the model due to accounting
convention distortions.
Dummy variables for year and owner have been included to control for differences.
Also note that a no-intercept model was used, since an operating margin of zero
implies a tax rate of zero.
Table 16: Government revenue
Model Dependent variable Independent variable
Relative contribution to government revenue
Tax rate
Operating margin Turnover Number of employees Year Owner
The initial model was run and outliers were identified, therefore, the outliers were
removed and the model was rerun. The regression results and summary statistics
are presented below.
Table 17: Government revenue results
No of obs: 126 Level of effect Parameter SE t p
Number of employees
0.000 0.000 1.450 0.150
Operating margin 0.217 0.112 1.935 0.055
Turnover/1000000 -0.015 0.197 -0.076 0.939
Owner Local 10.014 4.828 2.074 0.040
year 2007 -13.997 10.076 -1.389 0.167
year 2008 -0.965 9.556 -0.101 0.920
year 2009 0.438 9.153 0.048 0.962
year 2010 6.605 8.998 0.734 0.464

50
The overall model was significant (F=2.59; p=0.012). The model explained 9% of
the variance in the dependent variable. The effect of owner (p=0.040) was
significant and the results are discussed in more detail in Chapter 6.
5.2 Research question 2: Does the MNC adversely affect the host
economy by distorting capital markets?
Costs are said to be imposed on the host country through capital market distortions
as a result of MNC activity. Two determinants which are said to have an impact on
host country capital markets have been identified as a result of Saville’s research
(1993). The determinants and their relative models and regression results are
presented in this section.
5.2.1 Relative cost of long term finance
In order to determine if the MNC does in fact distort host country capital markets
through favourable access to finance compared to local firms, the regression
model is adopted from Saville (1993). He argues that favourable access to finance
is defined as a reduced cost of borrowing, which is defined as the ratio of interest
paid to total liabilities. However, Saville (1993) indicates that this method is “flawed
in that it ignores the maturity structure of debt” (p. 55). In respect of updating the
study, increased access to resources has enabled the data collection of long-term
interest-bearing liabilities for each firm in the sample. It has been decided to
exclude short-term interest-bearing liabilities on the basis that short-term debt has
tenure of less than one year and no specific information is given as to what the
debt is made up of. It can be assumed that these instruments are used as working

51
capital requirements of the business for operational purposes and do not
necessarily impact on the long-term capital structure of the firm. Thus, long-term
interest-bearing liabilities to interest paid is used as the proxy for cost of borrowing.
Some firms in the data set do not carry a great deal of long-term debt when
compared to short-term debt. These firms have been excluded from the regression
model as their reliance on short term financing imposes an unequal comparison
between firms.
Once again, the extreme observations in cost of borrowing must be taken into
account in model development. In this case, however, it was sufficient to take the
log of cost of borrowing in order to meet model assumptions.
Table 18: Cost of finance
Model Dependent variable Independent variable
Relative cost of long term finance
log (cost of borrowing)
Changes in relative profitability Changes in owners’ equity Year Owner
The initial model was run and extreme values and outliers were identified,
therefore, the regression model was rerun excluding these values. The regression
results and summary statistics are presented below.
Table 19: Cost of finance results
No of Obs: 113 Level of effect Parameter SE t p
Change in profitability 0.000 0.000 -0.362 0.718
Change in owners’ equity
0.000 0.001 -0.766 0.445
Owner Local 0.005 0.168 0.028 0.978
year 2008 -0.093 0.282 -0.329 0.743
year 2009 0.350 0.284 1.235 0.220
year 2010 -0.118 0.278 -0.425 0.671

52
The overall model was not significant (F=0.35; p=0.91) and the model explained
0% of the variance in the dependent variable. There were no significant model
terms. These results are interpreted and discussed in more detail in Chapter 6.
5.2.2 Extent of profit and dividend repatriation
Critics of the MNC argue that there is a second element to the distortion of host
country capital markets, “... that is, by undertaking excessive profit repatriation
rather than returning capital to the local economy in the form of reinvested
earnings” (Saville, 1993; pg. 56). The model adopted by Saville (1993) to test this
claim makes use of pay rate or dividend pay-out ratio determined by dividends paid
to EBIT. The model goes on to test for differences in the pay rate by regressing it
to relative operating margin and absolute profitability, in this case, EBIT. Assets
were initially included as a proxy for firm size. However, as seen in previous
models, diagnostics indicated that EBIT and assets are highly correlated (r=0.906,
p<0.0001), and due to the historical accounting of assets and the implications
thereof, it has been decided to remove assets from the model.
Once again, the model controls for annual and ownership differences by way of the
dummy variables, year and owner. Also note that a no-intercept model was used
since operating margin or EBIT of zero imply a dividend pay-out ratio of zero.
Table 20: Profit and divident repatriation
Model Dependent variable Independent variable
Extent of profit and dividend repatriation
Dividend pay-out ratio
Operating margin EBIT Year Owner

53
The initial model was run and outliers were identified, therefore, the outliers were
removed and the model was rerun. The regression results and summary statistics
are presented below.
Table 21: Profit and divident repatriation results
No of Obs: 170 Level of effect Parameter SE t p
Operating margin
0.172 0.115 1.493 0.137
EBIT/1000000
0.793 0.402 1.975 0.050
Owner Local 5.454 5.165 1.056 0.293
year 2007 2.291 10.284 0.223 0.824
year 2008 7.995 10.106 0.791 0.430
year 2009 -9.912 10.019 -0.989 0.324
year 2010 -4.352 9.810 -0.444 0.658
The overall model was not significant (F=1.68; p=0.12) and the model explained
3% of the variance in the dependent variable. The results are discussed in more
detail in Chapter 6.
5.3 Research question 3: Is the MNC responsible for creating a negative
effect on the competitive structure of the host economy?
In order to test the validity of the claim that MNCs create oligopolistic market
structures in the host economy, models determined by Saville (1993) test for the
displacement of local firms based on higher profitability or increased efficiencies by
the MNC. The relevant models and regression results are presented in this section.
5.3.1 Profitability

54
It is argued by critics, that MNCs create oligopolistic market structures through
higher profitability. This is a result of local firms being unable to compete, ultimately
closing down operations or being acquired by MNCs. In reference to Saville’s
model (1993), which is based on Connor and Mueller (1982), he argues that
relative profitability is principally determined by firm size; capital intensity, scale of
operations, and ownership differences. Again, capital intensity is defined as assets
per employee, however, in respect of once again keeping the model up to date, the
capital intensity calculation has been changed to include fixed assets rather than
total assets. Initial diagnostics indicated a high correlation between assets and
turnover, and in keeping with previous reasoning, assets were excluded from the
model and turnover is used to measure size and scale. As seen previously, a no-
intercept model was used, since an operating margin of zero implies a turnover of
zero.
Table 22: Profitability
Model Dependent variable Independent variable
Profitability Operating margin
Capital intensity Turnover Year Owner
The initial model was run and outliers were identified. The outliers were removed
and the model was rerun. The regression results and summary statistics are
presented below.

55
Table 23: Profitability results
No of Obs: 108 Level of effect Parameter SE t p
Intercept 3.056 4.909 0.623 0.535
Capital intensity 0.007 0.005 1.386 0.169
Turnover/1000000 0.195 0.083 2.333 0.022
Owner Local 4.499 3.961 1.136 0.259
year 2007 6.657 8.042 0.828 0.410
year 2008 1.677 7.207 0.233 0.816
year 2009 -7.959 7.234 -1.100 0.274
year 2010 5.395 6.965 0.775 0.440
The overall model was not significant (F=1.50; p=0.18). The model explained 3% of
the variance in the dependent variable and the effect of turnover was significant
(p=0.022. Specifically, a R1 billion increase in turnover resulted in an increase in
operating margin of 0.2%. These results are interpreted and discussed in more
detail in Chapter 6.
5.3.2 Efficiency
It is argued by critics, that MNCs create oligopolistic market structures by
displacing local firms through being more efficient. Based on Saville’s model
(1993), efficiency is measured by differences between the maximum output and
actual output generated, given the inputs. This is referred to as x-inefficiency,
which Saville (1993) adopted from Foote and Ashegian (1985). The model employs
the log transformed production function, which specifies the output of a firm for all
combinations of inputs and can therefore be used as a measure of efficiency.
Again, dummy variables are used to control for year and owner. The following
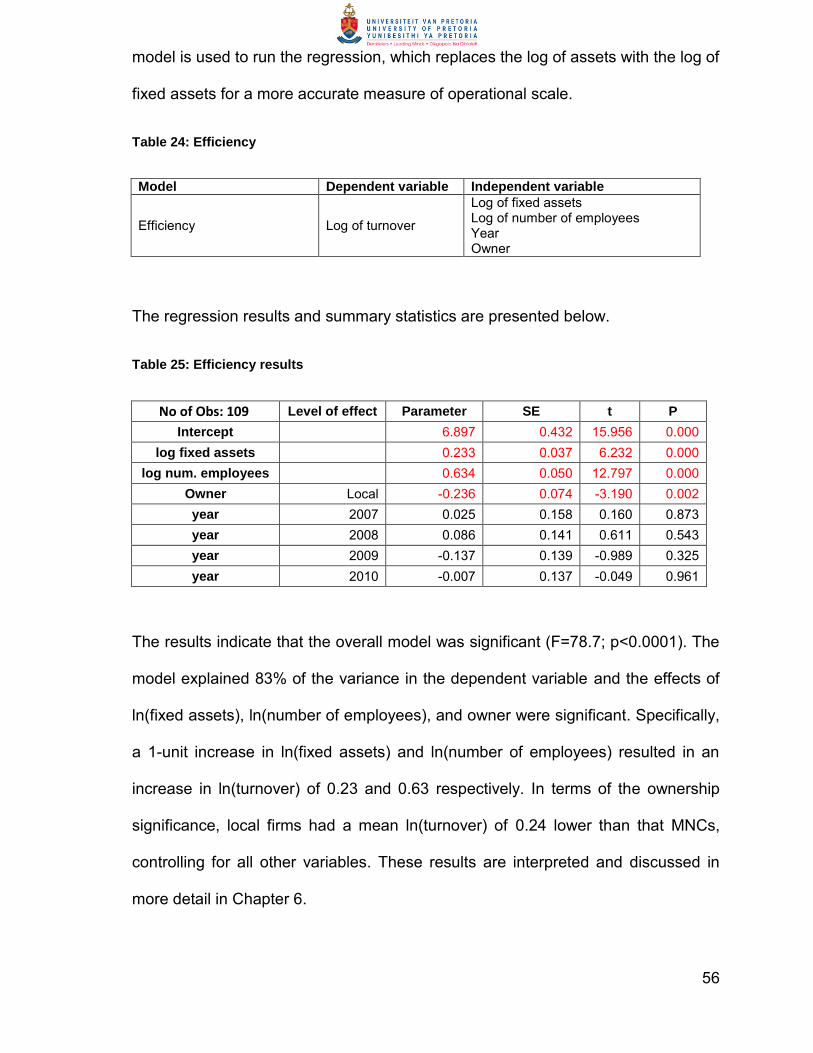
56
model is used to run the regression, which replaces the log of assets with the log of
fixed assets for a more accurate measure of operational scale.
Table 24: Efficiency
Model Dependent variable Independent variable
Efficiency Log of turnover
Log of fixed assets Log of number of employees Year Owner
The regression results and summary statistics are presented below.
Table 25: Efficiency results
No of Obs: 109 Level of effect Parameter SE t P
Intercept 6.897 0.432 15.956 0.000
log fixed assets 0.233 0.037 6.232 0.000
log num. employees 0.634 0.050 12.797 0.000
Owner Local -0.236 0.074 -3.190 0.002
year 2007 0.025 0.158 0.160 0.873
year 2008 0.086 0.141 0.611 0.543
year 2009 -0.137 0.139 -0.989 0.325
year 2010 -0.007 0.137 -0.049 0.961
The results indicate that the overall model was significant (F=78.7; p<0.0001). The
model explained 83% of the variance in the dependent variable and the effects of
ln(fixed assets), ln(number of employees), and owner were significant. Specifically,
a 1-unit increase in ln(fixed assets) and ln(number of employees) resulted in an
increase in ln(turnover) of 0.23 and 0.63 respectively. In terms of the ownership
significance, local firms had a mean ln(turnover) of 0.24 lower than that MNCs,
controlling for all other variables. These results are interpreted and discussed in
more detail in Chapter 6.

57
6. Discussion of results
This Chapter povides an analysis of the research results in which the expected
outcomes as well as the theory base are reviewed. The final section disucsses the
reasech questions and whether the research objectives have been met.
6.1 Research question 1: Does the MNC assist in creating increased
labour productivity within the host country?
6.1.1 Employment Creation
Savilles’ (1993) results showed that the number of jobs increased relative to the
firms’ size; however they also revealed that more profitable firms create fewer jobs.
The significant finding for Saville (1993) was that of ownership, results indicated
that MNCs tend to create fewer jobs than local firms.
The results of this study show that the number of jobs increases relative to
turnover, an increase of R1 billion in turnover shows that the number of jobs will
increase by 933 thus confirming that increased sales contribute to job creation.
Saville (1993) used a different measure for firm size, total assets, however due to
the accounting distortions identified turnover was used in place of total assets.
Based on turnover being the proxy for firm size, it can be said that the results are
as expected when compared to Saville (1993). However, in contrast with Saville’s
(1993) findings, the firm ownership was not significant therefore not supporting
either the advocates or the critics. The results refute both arguments, for example
Meller and Mizala (1982) show that MNCs create fewer jobs and advocates

58
Bhaumik et al., (2007); Blomström and Kokko (2003); and Moss et al. (2004) found
that MNCs have higher employment growth than local firms. The findings of this
study are however in agreement with Ramstetter (2012) who indicated that there
was no significance difference between MNC and local firm job creation.
The non-significance of ownership, results in the failure to reject the null
hypothesis, in short the results indicate no difference between MNCs and local
firms in terms of the propensity to create employment.
6.1.2 Labour productivity
Findings by Saville (1993) showed a significance of ownership and revealed “that
workers employed by MNCs are more productive than local firms” (p. 49) therefore
the expectation of this study was to show a similar result. However, in contrast with
Saville’s (1993) findings, ‘owner’ did not come up as significant and thus evidence
is not in support of the advocates (Alfaro & Rodrigues-Clare, 2004; Kokko et al.,
2001; Markusen & Venables, 1999; Ramstetter, 2012; Saville, 1993) or the critics
(Mthombeni, 2006).
The overall model was however significant indicating that higher capital-intensity
and turnover lead to greater value added per employee, providing evidence to
substantiate the claims of Blomström (1988) in that, capital-intensity and turnover
is a function of value added per employee. Saville’s (1993) findings were however
insignificant therefore results are once again in contrast.
In summary the results indicate that there is no difference in labour productivity
between foreign and locally owned firms. This results in failure to reject the null

59
hypothesis as there is not enough evidence to confirm claims made by advocates
or critics of the MNC.
6.1.3 Appropriate Technology
The argument posed by Saville (1993) in terms of this model, is related to his
findings based on labour productivity. Saville’s (1993) findings showed that
employees of MNCs are more productive than employees of local firms, thus he
argues that the employment of more capital-intensive technology by the MNC, is
the primary factor contributing to the higher labour productivity. His findings were
however in contrast with his argument, in that, no significant difference between
the capital-intensive technology employed by foreign and local firms was found.
In terms of this research, the results showed conclusive evidence that firm
ownership is significant, specifically, local firms are found to be seven times more
capital-intensive than MNC’s, thus opposing the arguments of Blomstrom (1991)
and Borensztein et al., (1998) and Saville (1993) that prove MNC’s are more
capital intensive than local firms.
In terms of an explanation as to why the results are not as expected, one such
theory can be attributable to the industry factor. This study is specific to the mining
industry, which can be argued in the context of South Africa. The results show
more fixed assets per employee for local firms, thus arguments can be made that
local firms are more technologically advanced, which can be attributable to factors
such as, industry complexity and maturity. It can be argued that South African
mining firms have been in operation in South Africa longer than their MNC
counterparts and thus have accumulated more fixed assets, skills and expertise,

60
allowing for them to extract more value out of their assets. In addition South African
firms are on the cutting edge of mining engineering technology, for example, the
Shaft Sinkers Group has been at the forefront of technical know-how in the mining
industry since 1961, indicating the technology is in fact more advanced as a result
of local expertise.
Furthermore, as cited in Saville (1993), Kirim (1986) argues that capital intensity
correlates positively with the size and scale of the firm, or in this case, assets and
turnover. The results of this study show a positive correlation and are thus in
accordance with this argument.
6.1.4 Distribution of income
Critics contend that MNCs tend to overpay managers thus distorting income
patterns in the local economy. Chang and Chow (1997) found that wages paid by
MNCs are 11% higher than those paid by domestic enterprises. However, Saville’s
(1993) results are in direct contradiction with the critics. His results show that
“MNCs pay their directors roughly R150 000 less than directors of local firms” (p.
52).
The overall results of this study agree with expectations, in that, directors’ pay
correlates with profitability (Saville, 1993). More specifically, findings indicate that
an increase in earnings results in an increase in directors’ remuneration, which is
as expected; the more profitable the firm is the more the employees benefit.
However, no significant relationship was found between directors’ pay and firm
ownership, which contradicts the empirical findings of both Chan and Chow (1997);
and Saville (1993) therefore, providing inconclusive evidence which refutes the

61
argument that MNCs distort income patterns in South Africa by overpaying
managers.
6.1.5 Government revenue
Results from this analysis, when all other variables are controlled, show that local
firms have a mean tax rate that is ten percent greater than that of MNCs. These
results disprove expectations that were created by Saville’s (1993) findings that
MNCs pay a higher tax rate than local firms and in doing so, fill the budgetary gap.
Furthermore in contrast to Saville (1993), none of the other variables used in this
model are significant determinants of tax rates, therefore disproving the theory put
forward by Kindleberger (1972). Consequently, this result does not support the
argument that MNCs contribute to reducing the budgetary gap by way of paying
increased tax rates. Conversely, the result does support the theory that
governments provide tax incentives to MNC’s to attract FDI into the host country
(Fedderke & Romm, 2006). However, increased MNC activity offers other benefits,
for example studies by Blomstrorm (1991), Lipsey et al. (1999), and Markusen and
Venables (1999) have found evidence that the presence of the MNC has a positive
effect on local firms’ propensity to export, thus having a positive effect on the host
country’s balance of payments and therefore contributing to filling the budgetary
gap.
In summary, the overall results show that local firms pay a higher tax rate than that
of MNC’s, which contradict the findings of Saville (1993) and other citics.

62
6.2 Research question 2: Does the MNC adversely affect the host
economy by distorting capital markets?
6.2.1 Relative cost of long term finance
Results indicate that there is no significant relationship when using long-term,
interest-bearing liabilities as the input for the cost of borrowing calculation.
Therefore, an additional test was run including total liabilities in place of long-term,
interest-bearing liabilities. Despite this adaptation, the overall model was still not
significant, however, the effect of the owner variable had significance. Specifically,
local firms showed a mean cost of borrowing that is 1.3 times that of foreign firms,
when controlling for the other variables in the model. This result indicates that
MNCs have a lower cost of financing, however, the difference between total
liabilities and long–term, interest-bearing liabilities indicate that short–term,
interest-bearing liabilities do have an effect on capital structure and MNCs tend to
bring better capital structuring skills into the host country. From a short-term
perspective, it is difficult to argue that the lower cost of MNC borrowing will distort
the capital markets. Further information as to what the short-term debt instruments
consist of is required in order to derive an appropriate conclusion. Therefore, it can
be said that, in this case, the evidence does not support the argument that MNCs
distort local capital markets. These findings are in alignment with Saville’s (1993)
finding.
6.2.2 Extent of profit and dividend repatriation

63
Saville (1993) shows results in favour of the critics in that MNCs pay out higher
dividends than local firms thus supporting the argument that “MNC’s distort capital
markets by reinvesting earnings at a lower rate than local firms” (Pg 57). In the
case of this research study, results indicate that the overall model is not significant
and that there are no significant effects on the dividend pay-out ratio. Thus, these
results are not in alignment with expectations. As per Saville (1993) it is noted that
the test does not evaluate indirect profit repatriation in the form of management
and licencing fees, royalty payments, interest payments, and transfer pricing to the
parent company. Therefore, it can be argued that this test underestimates the
impact.
6.3 Research question 3: Is the MNC responsible for creating a negative
effect on the competitive structure of the host economy?
6.3.1 Profitability
The results agree with expectations that were set by Saville (1993) in that an
increase in firm size leads to an increase in profitability. Specifically, the results
show that a R1-bill increase in turnover leads to 0.2 percent increase in operating
margin. However, in contrast to Saville (1993), capital intensity has not come up as
significant thus counteracting the evidence that capital intensity negatively affects
profitability. As per Saville (1993), in this case ownership is not significant
(p=0.259) and thus these findings are in support of Saville’s conclusion (1993) that
ownership is not an important determinant of differences in profitability (Pg. 60).
This is in contrast to Chan and Chow (1997) who show that transfer pricing

64
employed by MNC’s lead to reduced MNC profitability. The results do not show a
difference between the relative profitability of the MNC when compared to the local
firms.
6.3.2 Efficiency
The aim of this test is to determine whether MNCs displace local firms as a result
of creating oligopolistic market structures through increased efficiencies. Saville
(1993) ran a test to establish which firms are more efficient. His findings are in
contrast with the literature, in that local firms proved to be more efficient than
MNCs. However according to the results of this study with regard to the issue of
ownership and efficiency, the results exhibit conflicting findings in that, for a given
increase in inputs, the increase in production by local firms is 24 percent lower than
the increase in production by MNCs. In summary, based on the results that local
firms exhibit lower efficiency than MNCs, the argument posed by Saville (1993)
that MNCs create oligopolistic market structures by displacing local firms through
being more efficient can be used. However, in contrast, it is difficult to prove that
the local firms are in fact being displaced and this theory depends on a variety of
factors. Factors such as market size, consumer demand and market saturation
levels can have an effect. In the case of high demand, low supply and low market
saturation, MNC entry will contribute to increasing industry profits thus adding to
economic growth. In turn higher MNC operational efficiencies can lead to positive
spillovers of technology and human capital to the local firms as well as possible
forward and backward linkages within and between sectors. Examples include,

65
Fedderke and Romm (2006) who confirmed a positive spillover effect on capital
labour and technology as a result of FDI.
Conversely from a oligopolistic perspective, this could be the case should the MNC
enter a saturated industry where operational efficiencies result in increased profits
compared to local firms creating barriers to entry and ultimately push out local
firms. Increased MNC profits can also lead to local firm buyouts, once again
proving the theory.
Similarity between the two studies is however seen in the case of labour and
assets, results of this study indicate that increases in both labour and assets lead
to higher levels of output which is in alignment with Saville’s findings (1993).
In summary the results indicate that MNCs are more efficient than local firms,
however this does not make a watertight case for the theory that this leads to
oligopolistic market structures.

66
6.4 Summation
Wih regards to the research questions, the following section provides an overall
summary of the test results.
6.4.1 Research Question 1: Does the MNC assist in creating increased
labour productivity within the host country?
Table 26: Research question 1 results
Test Determinants Results
1 Employment creation No ownership significance
2 Labour productivity No ownership significance
3 Appropriate technlogy Ownership significant – local firms are
more capital-intensive than MNC’s,
4 Distribution of income No ownership significance
5 Government revenue Ownership significant – local firms pay
higher taxes than MNC’s
The table shows a summary of the test results and indicates that two of the five
tests (40%) showed the significance of ownership. However in relation to the
research question, none of the results show that the MNC is more significant in
contributing to increased labour productivity, in fact the significant results show that
the local firms contribute to more of the labour productivity. It can be argued that
these findings are a result of the nature of the industry and that the local mining
firms are more mature and complex than MNC firms in the same industry, therefore
an additional study in another sector would be helpful in proving this theory.

67
6.4.2 Research Question 2: Does the MNC adversely affect the host
economy by distorting capital markets?
Table 27: Research question 2 results
Test Determinants Results
1 Relative cost of long term
finanace No ownership significance
2 Extent of profit and dividend
repatriation No ownership significance
The table shows a summary of the test results and indicates that none of the tests
showed ownership significance. Thus rejecting the argument that MNCs distort
capital markets.
6.4.3 Research Question 3: Is the MNC responsible for creating a negative
effect on the competitive structure of the host economy?
Table 28: Research question 3 results
Test Determinants Results
1 Profitability No ownership significance
2 Efficiency Ownership significant - MNCs are more
efficient than of local firms

68
The table shows a summary of the test results and indicates that one of the two
tests (50%) indicated ownership significance. At face value, the significant result is
in alignment with the research question in that MNC’s are more efficient than local
firms thus, providing evidence that MNC’s are responsible for creating a negative
effect on the competitive structure of the host economy. However, as previously
argued, the mere fact that the MNC is more efficient is not adequate to prove that
there is a negative effect on the competitive structure of the economy.
Furthermore, only one of the two tests is significant providing another reason to
reject the research question.

69
7. Conclusion
Due to the theory regarding the insufficient development base offered in
developing countries, it is claimed that the right amount of economic growth cannot
be attained in order to compete with developed country economies. Thus, resulting
in a perpetual state of economic backwardness which is argued, to give rise to the
presence of four “gaps” in these developing economies. Research shows, by filling
these gaps, developing countries are able to achieve economic growth and thus
compete on an international scale. However, there exist opposing views as to how
economic growth and development can be achieved. The investigative framework
used in this study provides techniques to fill these gaps and show that a
combination of these opposing views is required to achieve the economic growth
necessary to fill the gaps. Therefore the theoretical and empirical evidence
presented in this study indicate that the combination of exogenous and
endogenous growth drivers contribute to filling the gaps.
The results of this study based on comparing the performance of MNC’s and local
firms within the context of a host country, are in accordance with most studies of
this nature, mixed. The investigative framework focused on effects on the host
economy and attempted to answer three questions in order to determine if the
MNC contributes to filling the gaps. In terms of the resource effects discussed in
the literature review, two of the posed research questions were aimed at testing
these effects. Specific tests on employment creation, labour productivity,
appropriate technology, income distribution, government revenue, cost of finance
and profit repatriation were run which are in alignment with the identified resource
effects. The results of the empirical tests show significant outcomes that are
explicitly in direct contrast with the results seen in Saville’s (1993) study.

70
Specifically, local firms adopt technology that is more capital-intensive that MNC’s
and they pay higher tax rates in comparison to their MNC counterparts. In terms of
employment creation, labour productivity, income distribution, cost of finance and
profit repatriation no significant differences were found between MNC’s and local
firms. It can be argued that the unexpected results are directly related to the
industry differences between the two studies, and that the local mining industry in
South Africa is mature and complex, hence, results that local firms contribute more
to economic growth and development.
It can be argued from this point that local firms are contributing to filling the gaps,
and not the MNC’s. However, a case can be made for the MNC’s impact in the
economic development of the host economy, thus, contributing to filling the gaps.
From an exogenous growth driver perspective, theory shows that foreign
investment is an important driver in contributing to economic growth. Evidence
from the literature review show that external effects are created as a result of FDI,
specifically, MNC’s bring in foreign capital, which contribute to filling the foreign
exchange gap, in that they permit levels of domestic investment in a country to
exceed the country’s level of saving. Increased domestic saving is a determinant of
exogenous growth and therefore assists in filling the budgetary and foreign
exchange gap. It has also been argued that the MNC can assist in filling the foreign
exchange gap in a second way that is, through increased exports. Previous studies
found evidence that the presence of the MNC has a positive effect on local firms’
propensity to export. Furthermore, they found evidence that the MNC has a greater
ability than local firms to export and that the export to output ratio for MNCs was
three times higher than local firms. This evidence shows how MNCs contribute to
filling the gaps through exogenous growth drivers. Moreover, evidence from this

71
study with regards to the competitive effects are in support of the MNC.
Specifically, the empirical evidence revealed that MNC’s are more efficient than
local firms, once again proving their growth contribution. However, critics argue
that MNCs create oligopolistic market structures by displacing local firms through
being more efficient, resulting in creating a negative effect on the competitive
structure of the host economy. In defence, this result does not provide enough
evidence to substantiate that they theory that oligopolistic market structures are
resultant from increased MNC efficiency. Finally, based on the theory of
convergence, it can be argued that the higher efficiencies can result in positive
technological and human resource spillover effects.
In summary, the results shown here are mixed however in terms of informing
government policy, this study confirms the importance of FDI in emerging markets.
The caveat however, firstly, is to inform policy to attract the right kinds of FDI to
contribute to filling specific gaps in to achieve the required economic growth.
Secondly, policy should require collaboration between MNC’s, private firms as well
as public sector firms in order to share knowledge and profits in having a positive
effect on social welfare and economic growth in the domestic economy.
This study is limited in a number of ways, specifically the study focusses
exclusively on the mining sector; tests only for directly observable and empirically
quantifiable effects; ignores unlisted firms; excludes some firms based on the
unavailability of data. Based on these limitations future research recommendations
are to undertake further studies from a cross-country perspective over a longer
time period.

72
References
Alfaro, L., Chanda, A., Kalemli-Ozcan, S., & Sayek, S. (2004). FDI and economic growth: the role of local financial markets. Journal of International Economics, 64(1), 89–112. doi:10.1016/S0022-1996(03)00081-3
Alfaro, L., & Rodrigues-Clare, A. (2004). Multinationals and Linkages : An Empirical Investigation. Economia, 4(2), 113–169.
Arnold, D. J., & Quelch, J. A. (1998). New Strategies in Emerging Markets. Sloan Management Review, 40(1), 7–20.
Barro, R. J., Mankiw, G. N., & Sala-i-Martin, X. (1993). Capital Mobility in Neoclassical Models of Growth.
Benhabib, J., & Spiegel, M. M. (1994). The role of human capital in economic development evidence from aggregate cross-country data. Journal of Monetary Economics, 34(2), 143–173.
Bhaumik, S. K., Estrin, S., & Grzegorz, W. K. (2007). Determinants of Employment Growth at MNEs: Evidence from Egypt, India, South Africa and Vietnam. Comparative Economic Studies, 49(1), 61–80. doi:10.1057/palgrave.ces.8100161
Blomström, M. (1988). Labor Productivity Differences Between Foreign and Domestic Firms in Mexico. World Development, 16(11), 1295–1298.
Blomström, M. (1991). Host Country Benefits of Foreign Investment. NBER Working Paper Series, 3615, 1–35.
Blomström, M., & Kokko, A. (2003). The economics of foreign direct investment incentives. NBER Working Paper Series, 9489, 1–26.
Borensztein, E., De Gregorio, J., & Lee, J.-W. (1998). How does foreign direct investment affect economic growth? Journal of International Economics, 45(1), 115 – 1135.
Cavusgil, S. T., Ghauri, P. N., & Agarwal, M. (2002). Doing business in emerging markets: Entry and negotiation strategies (pp. 1–90).
Chan, K. H., & Chow, L. (1997). International Transfer Pricing for Business Operations in China: Indcements, Regulations and Practice. Journal of business finance and accounting, 24(March), 1269–1289.
Doukas, J. a., & Pantzalis, C. (2003). Geographic diversification and agency costs of debt of multinational firms. Journal of Corporate Finance, 9(1), 59–92. doi:10.1016/S0929-1199(01)00056-6

73
Dunning, J. H. (1988). The Eclectic Paradigm of International Production: A restatement and some possible extentions. Journal of International Business Studies, (June), 1–31.
Fedderke, J. W., & Romm, a. T. (2006). Growth impact and determinants of foreign direct investment into South Africa, 1956–2003. Economic Modelling, 23(5), 738–760. doi:10.1016/j.econmod.2005.10.005
Glass, A. J., & Saggi, K. (2002). Multinational Firms and Technology Transfer. Scandanavian Journal of Economics, 104(4), 495–513.
Gorg, H., & Greenway, D. (2004). Much Ado about Nothing ? Do Domestic Benefit from Firms Really Foreign Direct Investment ? The World Bank Research Observer, 19(2), 171–197. doi:10.1093/wbro/lkhOI9
Griliches, Z. (1992). The Search for R&D Spillovers. Scandanavian Journal of Economics, 94(3768), 29–47.
Hoskisson, R. E., Eden, L., Lau, C. M., & Wright, M. (2000). Strategy in Emerging Economies. The Acadamy of Management Journal, 43(3), 249–267.
Iyer, G. C. (2009). Foreign Firms and Inter-industry Spillovers in Indian Manufacturing: Evidence from 1989 to 2004. Margin: The Journal of Applied Economic Research, 3(3), 297–317. doi:10.1177/097380100900300305
Klein, S., & Wöcke, A. (2009). Protective Incubators and South African MNEs By. International Business Review, 6420, 341–354. doi:10.1002/tie
Kokko, A., Zejan, M., & Tansini, R. (2001). Trade Regimes and Spillover Effects of FDI: Evidence from Uruguay. Review of World Economics, 137(1), 124–149.
Kugler, M. (2006). Spillovers from foreign direct investment: Within or between industries? Journal of Development Economics, 80(2), 444–477. doi:10.1016/j.jdeveco.2005.03.002
Kumar, N. (1996). Foreign Direct Invesment and Technology Transfers in Development: A Perspective on Recent Literature. The United Nations University.
Lall, S. (1992). Technological capabilities and industrialization. World Development, 20(2), 165–186. doi:10.1016/0305-750X(92)90097-F
Li, X., & Liu, X. (2005). Foreign Direct Investment and Economic Growth: An Increasingly Endogenous Relationship. World Development, 33(3), 393–407. doi:10.1016/j.worlddev.2004.11.001
Lipsey, R. E., Feenstra, R. C., Hahn, C. H., & Hatsopoulos, G. N. (1999). International Capital Flows. In M. Feldstein (Ed.), International Capital Flows (Vol. 0–226–2410, pp. 307–362). University of Chicago Press.
74
Luiz R. De Mello. (1997). FDI in developing countries and growth.pdf. Journal of Development Studies, 34(1), 1–34.
Luo, Y., & Tung, R. L. (2007). International Expansion of Emerging Market Enterprises: A Springboard Perspective. Journal of International Business Studies, 38(4), 481–498.
Maki, D. M. (2000). The Growth of Consumer Credit and the Household Debt Service Burden (pp. 1–27).
Marin, A., & Sasidharan, S. (2010). Heterogeneous MNC subsidiaries and technological spillovers: Explaining positive and negative effects in India. Research Policy, 39(9), 1227–1241. doi:10.1016/j.respol.2010.06.001
Markusen, J. R., & Venables, A. J. (1999). Foreign direct investment as a catalyst for industrial development. European Economic Review, 43, 335–356.
McGregor, R. (2012). Who Owns Whom.
Meyer, K. E. (2012). Perspectives on Multinational Enterprises in Emerging Economies. Journal of international business studies, 35(4), 259–276.
Moss, T. J., Ramachandran, V., & Kedia Shah, M. (2004). Is Africa’s Skepticism of Foreign Capital Justified ? Evidence from East African Firm Survey Data. Retrieved from http://ssrn.com/abstract=1112683
Mthombeni, M. S. (2006). The role of multinational corporations in South Africa : a political-economic perspective. University of the Free State.
Narula, R., & Dunning, J. H. (2010). Multinational Enterprises , Development and Globalization : Some Clarifications and a Research Agenda. Development, 38(3). doi:10.1080/13600818.2010.505684
Nelson, R. R., & Phelps, E. S. (1966). Investment in Humans, Technological Diffusion, and Economic Growth. The American Economic Review, 56(1), 69–75.
Ozawa, T. (2010). The ( Japan-Born ) “ Flying-Geese ” Theory of Economic Development Revisited and Reformulated from a Structuralist Perspective.
Raj, R., Javalgi, G., Deligonul, S., Ghosh, A. K., Lambert, D. M., & Cavusgil, S. T. (2010). Foreign market entry mode behavior as a gateway to further entries : The NAFTA experience. International Business Review, 19(3), 209–222. doi:10.1016/j.ibusrev.2009.12.001
Ramstetter, E. D. (2012). Foreign Multinationals in East Asia’ s Large Developing Economies.

75
Ray, P., & Venaik, S. (2008). Foreign Ownership and Subsidiary Performance : Impact on Research and Exports ? Economic and Political weekly, 43(39), 57–61.
Reeb, D. M., Mansi, S. A., & Allee, J. M. (2001). Firm Internationalization and the Cost of Debt Financing : Evidence from Non-Provisional Publicly Traded Debt. The Journal of Financial and Quantitative Analysis, 36(3), 395–414.
Romer, P. M. (1994). The Origins of Endogenous Growth. The Journal of Economic Perspectives, 8(1), 3–22.
Saito, R., & Hiramoto, E. (2010). Foreign activity effects and capital structure: Brazilian evidence. CONSEJO LATINOAMERICANO DE ESCUELAS DE ADMINISTRACIÓN, (45), 59–75.
Saville, A. D. (1993). Multinational Corporations the Building, Construction and Engineering Industries, 1–87.
Schatz, S. P. (1981). Assertive pragmatism and multinational enterprise.pdf. World Development, 9, 93–105.
Sylwester, K. (2005). Foreign direct investment, growth and income inequality in less developed countries. International Review of Applied Economics, 19(3), 289–300. doi:10.1080/02692170500119748
Uhlig, H., & Yanagawa, N. (1996). Increasing the capital income tax may lead to faster growth. European Economic Review, 40, 1521–1540.
Wang, M. (2010). Foreign direct investment and domestic investment in the host country: evidence from panel study. Applied Economics, 42(29), 3711–3721. doi:10.1080/00036840802314580

1
Appendix 1
Valid Obs
Mean 95% confidence limit (upper)
95% confidence limit (lower)
Median Minimum Maximum Quartile - Range Std.Dev. Skewness Kurtosis z(skew) z(kurt)
Capital Intensity 133 4 235 2 405 6 065 1 622 6 93 837 1 890 10 669 6.00 42.13 28.24 99.19
Change in Owners Equity 143 -45 -104 13 0 -2 518 1 349 29 354 -4.93 34.21 -24.05 83.51
Change in Profitability 143 20 -166 206 -11 -8 010 5 893 166 1 126 -0.54 27.86 -2.62 68.00
Cost of Financing 172 4 3 4 3 0 48 3 5 6.26 50.15 33.50 134.25
Dividend Payout Ratio 180 9 -8 25 0 -1 213 526 32 111 -7.21 85.88 -39.48 235.18
EBIT 171 4 172 248 2 251 184 6 093 312 289 578 -16 491 000 87 229 800 3 028 070 12 725 918 4.79 25.38 25.56 67.75
log Assets 172 16 15 16 16 8 20 3 2 -0.59 1.27 -3.18 3.40
log Num Employees 133 8 8 9 9 4 12 2 2 -0.54 -0.16 -2.52 -0.39
log Turnover 161 15 15 15 15 10 19 3 2 -0.07 -0.38 -0.36 -0.99
Number of Directors 171 10 10 11 10 4 18 4 3 0.24 -0.59 1.28 -1.57
Number of Employees 133 16373 12123 20623 5897 42 116000 13535 24779 2.18 4.63 10.28 10.89
Operating Margin 180 10 4 17 11 -183 223 30 44 -0.29 6.68 -1.61 18.30
Remun of Dirs 159 22 723 19 130 26 316 15 972 65 146 098 18 517 22 938 3.01 11.62 15.51 29.90
Supervision 159 1 354 046 884 931 1 823 162 344 572 1 881 19 477 108 1 156 855 2 994 961 4.51 21.65 23.21 55.72
Tax Rate 180 2 -24 29 23 -2 214 241 32 182 -10.45 124.96 -57.24 342.23
Total Assets 172 29 902 361 17 483 173 42 321 549 5 402 183 4 488 599 819 760 26 976 685 82 513 460 5.32 29.73 28.47 79.58
Total Liabilities 172 12 839 231 7 095 356 18 583 106 2 265 311 3 154 242 214 840 8 995 345 38 162 479 5.17 27.23 27.71 72.89
Turnover 161 16 315 937 10 288 841 22 343 032 3 571 048 18 810 253 202 400 14 012 100 38 723 584 4.65 22.89 24.09 59.27
Value add per employee 133 170 -65 405 107 -10 034 6 266 276 1 368 -2.08 28.29 -9.79 66.59

1