Embed Size (px)
Citation preview
NBP Working Paper No. 277
The impact of market structure of the banking sector on the growth of bank loans in the EU after the global financial crisisGeorgios P. Kouretas, Małgorzata Pawłowska
Economic Research DepartmentWarsaw, 2018
NBP Working Paper No. 277
The impact of market structure of the banking sector on the growth of bank loans in the EU after the global financial crisisGeorgios P. Kouretas, Małgorzata Pawłowska
Published by: Narodowy Bank Polski Education & Publishing Department ul. Świętokrzyska 11/21 00-919 Warszawa, Poland www.nbp.pl
ISSN 2084-624X
© Copyright Narodowy Bank Polski, 2018
Georgios P. Kouretas – Department of Business Administration, Athens University of Economics and Business
Małgorzata Pawłowska – Warsaw School of Economics, Narodowy Bank Polski; [email protected]
This paper presents the personal opinions of the authors and does not necessarily reflect the official position of Narodowy Bank Polski. The authors would like to thank the participants of the seminar of the Visiting Researcher Program (VRP) of NBP 2017 for helpful comments.
Abstract 4
Introduction 5
1. Motivation and Existing Literature 8
2. Data and Models Specification 11
3. Results of Panel Data Analysis 16
Conclusions 19
References 20
Appendix 1 24
Appendix 2 27
3NBP Working Paper No. 277
Contents
i
The impact of market structure of the banking sector on the growth of bank loans in the EU after the global financial crisis Georgios P. Kouretas, Department of Business Administration, Athens University of Economics and Business Małgorzata Pawłowska, Warsaw School of Economics, Narodowy Bank Polski7
February, 2018
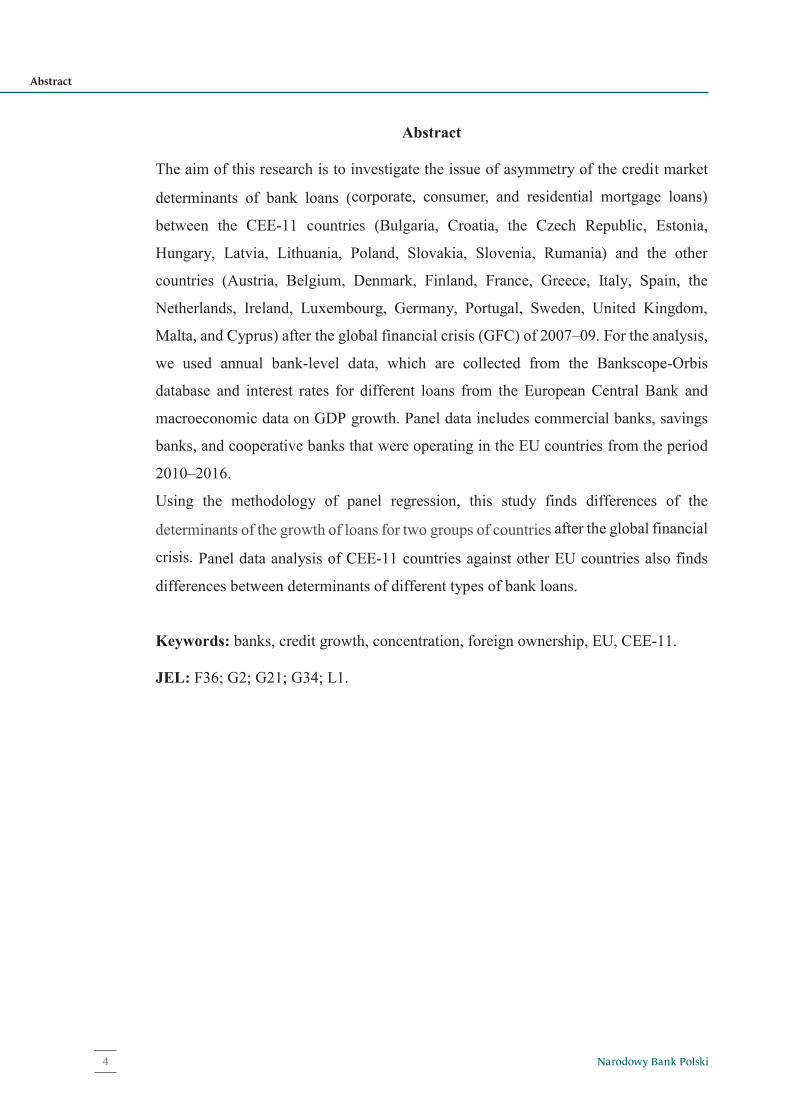
Abstract
The aim of this research is to investigate the issue of asymmetry of the credit market
determinants of bank loans (corporate, consumer, and residential mortgage loans)
between the CEE-11 countries (Bulgaria, Croatia, the Czech Republic, Estonia,
Hungary, Latvia, Lithuania, Poland, Slovakia, Slovenia, Rumania) and the other
countries (Austria, Belgium, Denmark, Finland, France, Greece, Italy, Spain, the
Netherlands, Ireland, Luxembourg, Germany, Portugal, Sweden, United Kingdom,
Malta, and Cyprus) after the global financial crisis (GFC) of 2007–09. For the analysis,
we used annual bank-level data, which are collected from the Bankscope-Orbis
database and interest rates for different loans from the European Central Bank and
macroeconomic data on GDP growth. Panel data includes commercial banks, savings
banks, and cooperative banks that were operating in the EU countries from the period
2010–2016.
Using the methodology of panel regression, this study finds differences of the
determinants of the growth of loans for two groups of countries after the global financial
crisis. Panel data analysis of CEE-11 countries against other EU countries also finds
differences between determinants of different types of bank loans.
Keywords: banks, credit growth, concentration, foreign ownership, EU, CEE-11. JEL: F36; G2; G21; G34; L1.
7 Warsaw School of Economics, [email protected], Narodowy Bank Polski. This paper presents the personal opinions of the author and does not necessarily reflect the official position of Narodowy Bank Polski. The authors would like to thank the participants of the seminar of the Visiting Researcher Program (VRP) of NBP 2017 for helpful comments.
Narodowy Bank Polski4
Abstract
2
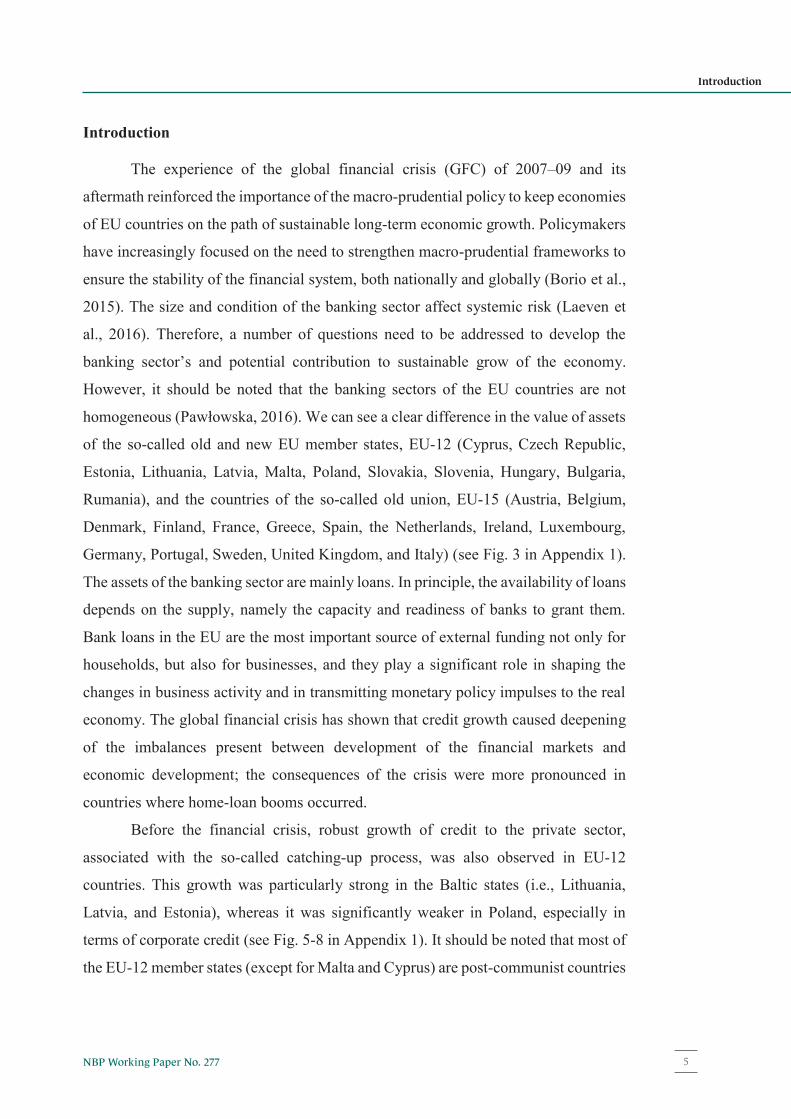
Introduction
The experience of the global financial crisis (GFC) of 2007–09 and its
aftermath reinforced the importance of the macro-prudential policy to keep economies
of EU countries on the path of sustainable long-term economic growth. Policymakers
have increasingly focused on the need to strengthen macro-prudential frameworks to
ensure the stability of the financial system, both nationally and globally (Borio et al.,
2015). The size and condition of the banking sector affect systemic risk (Laeven et
al., 2016). Therefore, a number of questions need to be addressed to develop the
banking sector’s and potential contribution to sustainable grow of the economy.
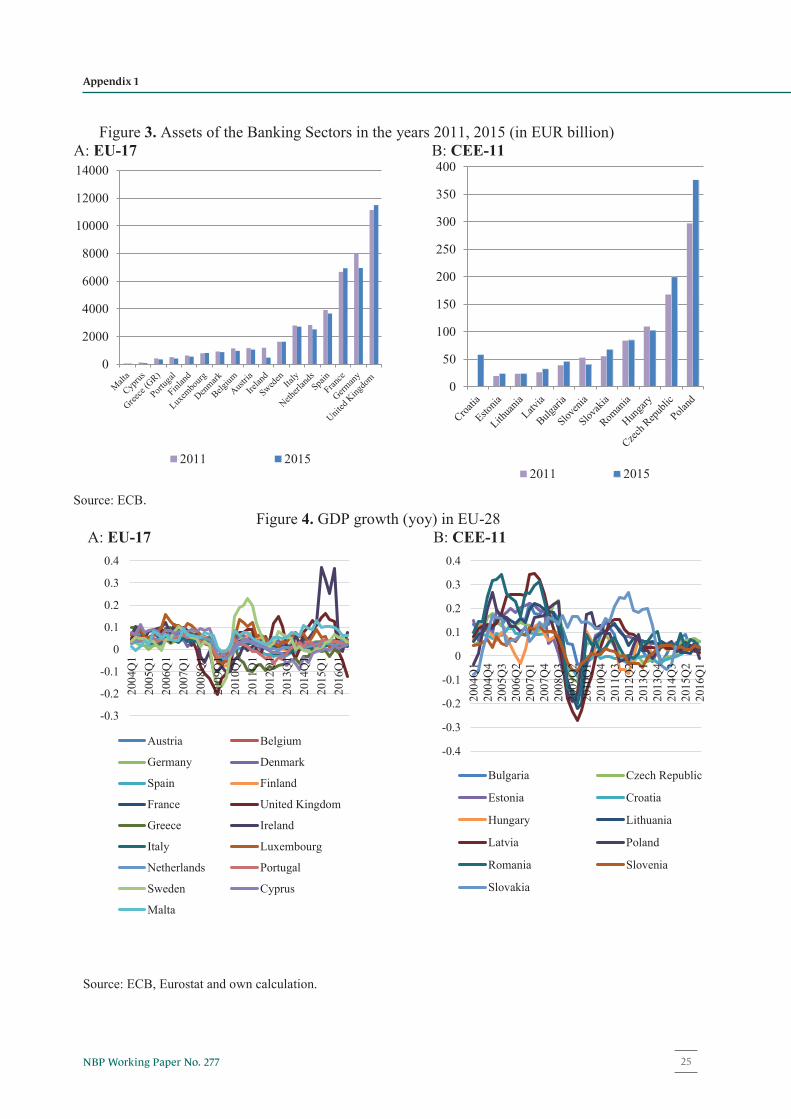
However, it should be noted that the banking sectors of the EU countries are not
homogeneous (Pawłowska, 2016). We can see a clear difference in the value of assets
of the so-called old and new EU member states, EU-12 (Cyprus, Czech Republic,
Estonia, Lithuania, Latvia, Malta, Poland, Slovakia, Slovenia, Hungary, Bulgaria,
Rumania), and the countries of the so-called old union, EU-15 (Austria, Belgium,
Denmark, Finland, France, Greece, Spain, the Netherlands, Ireland, Luxembourg,
Germany, Portugal, Sweden, United Kingdom, and Italy) (see Fig. 3 in Appendix 1).
The assets of the banking sector are mainly loans. In principle, the availability of loans
depends on the supply, namely the capacity and readiness of banks to grant them.
Bank loans in the EU are the most important source of external funding not only for
households, but also for businesses, and they play a significant role in shaping the
changes in business activity and in transmitting monetary policy impulses to the real
economy. The global financial crisis has shown that credit growth caused deepening
of the imbalances present between development of the financial markets and
economic development; the consequences of the crisis were more pronounced in
countries where home-loan booms occurred.
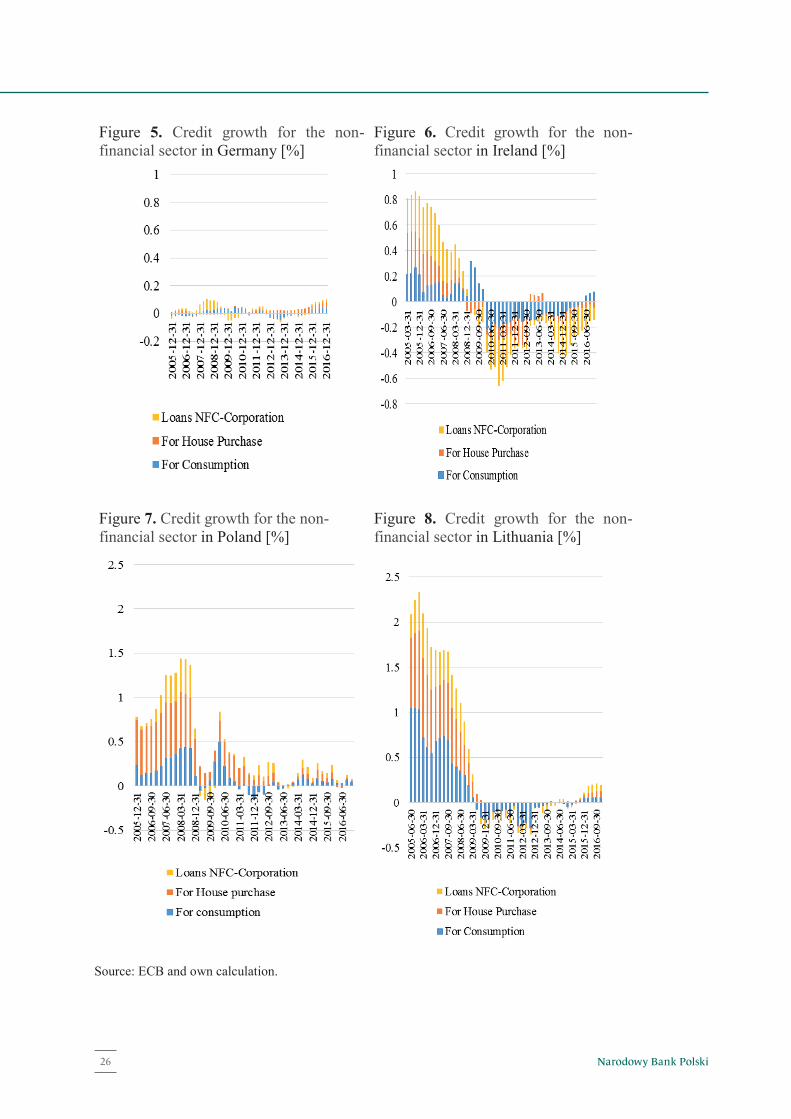
Before the financial crisis, robust growth of credit to the private sector,
associated with the so-called catching-up process, was also observed in EU-12
countries. This growth was particularly strong in the Baltic states (i.e., Lithuania,
Latvia, and Estonia), whereas it was significantly weaker in Poland, especially in
terms of corporate credit (see Fig. 5-8 in Appendix 1). It should be noted that most of
the EU-12 member states (except for Malta and Cyprus) are post-communist countries
5NBP Working Paper No. 277
Introduction
3
and have been playing the role of host country for banks from a number of countries
in Europe. Parent financial institutions of those banks were located mostly in Western
Europe (Austria, Belgium, Greece, Germany, France, Italy, Netherlands, Portugal,
and Spain) (Pawłowska, 2016).
Loans are the main banking product used to finance the real economy. They
are also the determinants of stability of the financial sector because problems with
servicing bank loans (by enterprises and households) often underlie a systemic crisis
(Cecchetti et al., 2011). Furthermore, financing by loans plays an important role in
economic development. Research concerning the determinants of credit demand and
supply has become a key topic in many economic publications, but the operational
goals of researchers can vary. Some authors aim at providing very general information
about the influence of demand-side and supply-side variables on credit growth. Others
investigate the monetary transmission channels, for example, in Poland (Hurlin &
Kierzenkowski, 2007).
The aim of this research is to investigate the issue of asymmetry of the credit
market determinants of various bank loans between the Central and Eastern European
countries (CEE-11) and the other EU countries after the GFC. Specifically, we
compare the credit market determinants of loans among the CEE-11 countries (the
Czech Republic, Estonia, Lithuania, Latvia, Poland, Slovakia, Slovenia, Hungary,
Bulgaria, Rumania, Croatia) and the determinants among the EU-17 countries
(Austria, Belgium, Denmark, Finland, France, Greece, Spain, the Netherlands,
Ireland, Luxembourg, Germany, Portugal, Sweden, United Kingdom, Italy, Malta,
and Cyprus). Besides the empirical analysis of determinants of various bank loans—
household loans (mortgage loans and consumer loans), corporate loans, and total
loans—the purpose of the paper is to carry out a comparative analysis of the credit
market of the CEE-11 countries against all EU-28 states, based on the experience of
the financial crisis and the ongoing European debt crisis. Given the feedback between
the real sector and the financial sector, this paper also analyzes the effect of the
determinants of the results of banks based on the micro data concerning banks’
performance. The determinants of banks’ performance include banking sector
Narodowy Bank Polski6
4
profitability, capitalization, concentration in the banking sector (indicators CR5 and
HHI)1, and share of foreign banks.
The major contribution of this study to the literature is to find the differences
of the credit market determinants for different types of loans (corporate, consumer,
and residential mortgage loans) between the CEE-11 countries and the other EU
countries after the GFC.
This study consists of three parts and a summary. The first part is a broad
literature review concerning the link between market structure, foreign banks and
lending. The second part presents data and empirical models. The third part presents
the results of the analysis based on the panel data. The summary provides the
conclusions that we made.
1 The share of the five largest banks’ total assets (CR5); the Herfindahl-Hirschman index for assets (the sum of the squares of the market share of individual banks (HHI).
7NBP Working Paper No. 277
Introduction
5
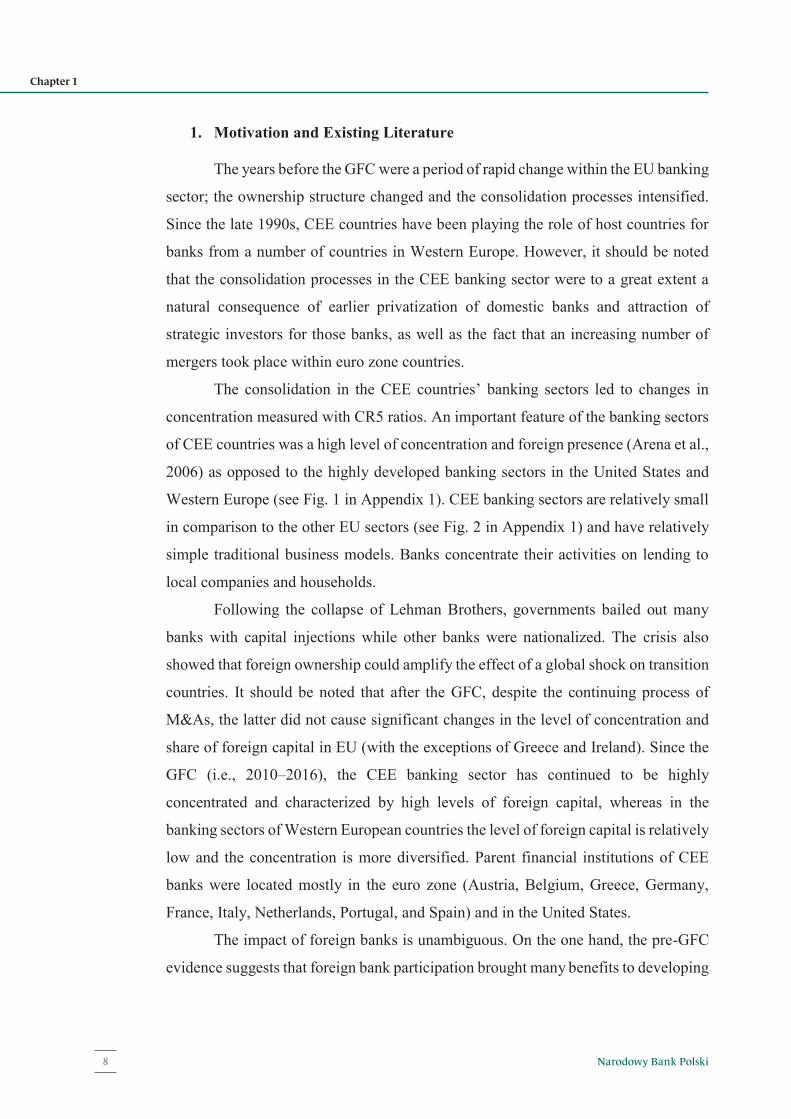
1. Motivation and Existing Literature
The years before the GFC were a period of rapid change within the EU banking
sector; the ownership structure changed and the consolidation processes intensified.
Since the late 1990s, CEE countries have been playing the role of host countries for
banks from a number of countries in Western Europe. However, it should be noted
that the consolidation processes in the CEE banking sector were to a great extent a
natural consequence of earlier privatization of domestic banks and attraction of
strategic investors for those banks, as well as the fact that an increasing number of
mergers took place within euro zone countries.
The consolidation in the CEE countries’ banking sectors led to changes in
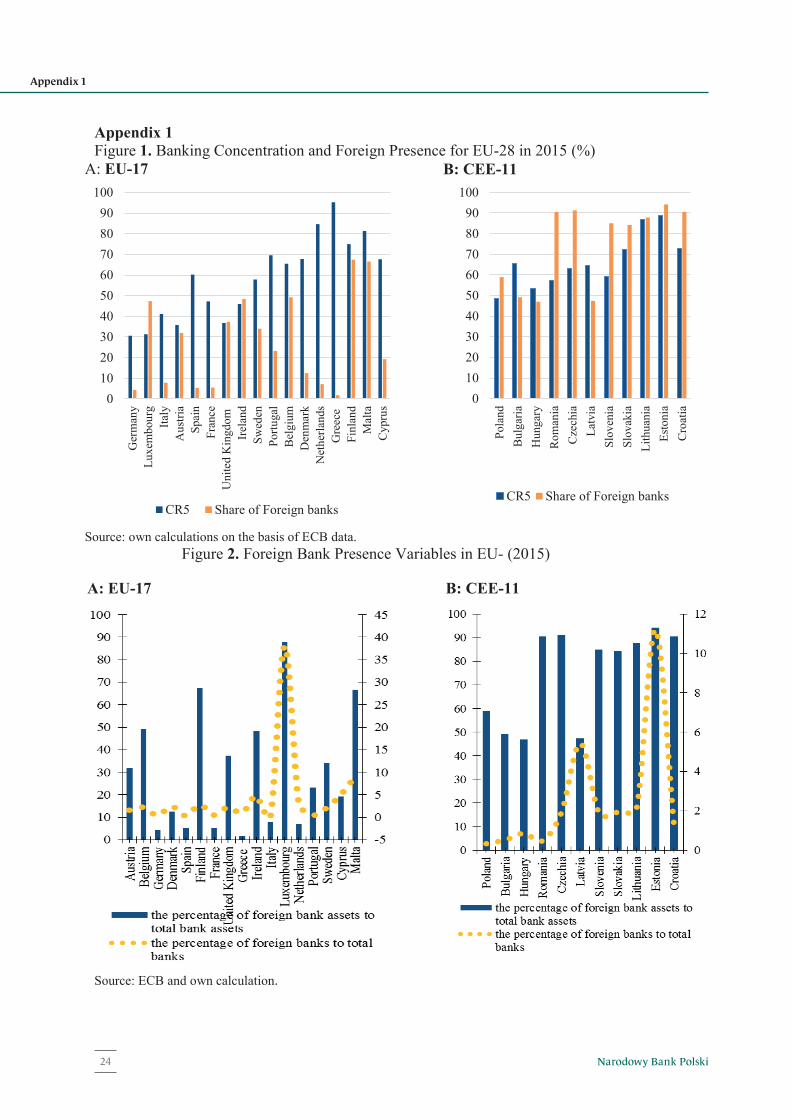
concentration measured with CR5 ratios. An important feature of the banking sectors
of CEE countries was a high level of concentration and foreign presence (Arena et al.,
2006) as opposed to the highly developed banking sectors in the United States and
Western Europe (see Fig. 1 in Appendix 1). CEE banking sectors are relatively small
in comparison to the other EU sectors (see Fig. 2 in Appendix 1) and have relatively
simple traditional business models. Banks concentrate their activities on lending to
local companies and households.
Following the collapse of Lehman Brothers, governments bailed out many
banks with capital injections while other banks were nationalized. The crisis also
showed that foreign ownership could amplify the effect of a global shock on transition
countries. It should be noted that after the GFC, despite the continuing process of
M&As, the latter did not cause significant changes in the level of concentration and
share of foreign capital in EU (with the exceptions of Greece and Ireland). Since the
GFC (i.e., 2010–2016), the CEE banking sector has continued to be highly
concentrated and characterized by high levels of foreign capital, whereas in the
banking sectors of Western European countries the level of foreign capital is relatively
low and the concentration is more diversified. Parent financial institutions of CEE
banks were located mostly in the euro zone (Austria, Belgium, Greece, Germany,
France, Italy, Netherlands, Portugal, and Spain) and in the United States.
The impact of foreign banks is unambiguous. On the one hand, the pre-GFC
evidence suggests that foreign bank participation brought many benefits to developing
Narodowy Bank Polski8
Chapter 1
6
countries including financial stability (Bonin et al., 2005). On the other hand, the GFC
highlights the role of multinational banks in the transmission of shocks across
countries. In addition, foreign banks can be a channel through which shocks in one
country are transmitted and affect the supply of credit in another country.
Furthermore, foreign banks’ legal structure (branch versus subsidiary) along with the
nature of the banking crisis (systemic versus non-systemic) could also determine their
stabilizing or destabilizing role (Adler & Cerutti, 2015).
Claessens and Van Horen (2013) found that during the GFC foreign banks
reduced credit more sharply as compared to domestic banks, except when the foreign
banks dominated the host banking systems. Popov and Udell (2012) found evidence
of the international transmission of the crisis shock to transition countries and showed
that transition country firms’ access to credit during the crisis was affected by the
balance sheet conditions of foreign parent banks.
Cull and Soledad Martinez Peria (2013) found that in CEE countries during
the GFC, foreign loan growth fell more than that of private domestic banks and also
that state-owned banks increased their loans during the crisis. Furthermore, Cull et al.
(2017) found that foreign-owned banks are more efficient than domestic banks,
promote competition in host banking sectors, and stabilize credit in the case of
idiosyncratic shocks. However, foreign-owned banks also transmit external shocks
and might not always expand credit. De Haas and van Lelyveld (2014), using
worldwide data, found that parent banks were not significant sources of strength for
their subsidiaries during the global crisis. Furthermore, they found evidence that
government-owned banks reduced credit growth in CEE emerging economies to a
lesser extent than did privately-owned banks in 2009.
Finally, Allen et al. (2017) examined the interactions of bank lending dynamics
with domestic, foreign, and global crises along with changes in ownership in the CEE
banking sector. They found the impact of ownership structure on banks’ lending
activities in the CEE was conditional upon the type of crisis. Furthermore, they argue
that deposit growth and profitability ratios are significant for credit growth during
both normal economic times and crisis periods, regardless of the crisis type.
Meriläinen (2016) examines lending growth in Western European banks over the
9NBP Working Paper No. 277
Motivation and Existing Literature
7
2004–2013. The results suggest that both the financial crisis and the sovereign debt
crisis caused a nega-tive shock in Western European lending growth. However,
different loan types (e.g., commercial or residential loans) were not included in this
study.
Pawłowska (2016) describes the important role of size and market structure in
EU banks. Empirical results based on panel data covering the period of 2004–2012
show that the banking sectors within the EU are not homogeneous and also, that there
is asymmetry between the performance of the EU-15 and EU-12 banking sectors. The
effect of size and competition on financial stability for EU-15 banks (i.e., large
banking sectors) differs from EU-12 banks (i.e., small banking sectors). Generally,
size had a negative impact on financial stability within the EU banking sectors.
However, those effects are only significant within the EU-12 banking sectors.
To sum up the above considerations, it can be concluded that the empirical
studies in this area have focused on the impact of increased participation of foreign
banks and concentration on bank loans in emerging markets. These studies have raised
questions about the foreign banks’ potentially stabilizing or destabilizing role during
times of financial distress. Therefore, in this study, we decided to split the research
sample of EU countries into two groups (CEE-11 countries and EU-17 countries): host
countries and home countries.
The major contribution of this study to the literature is to find an asymmetry
of the credit market determinants between the CEE-11 and the other EU countries
after the global financial crisis. Panel data analysis of the credit market of the CEE-
11 countries against other EU countries also finds differences between determinants
of different types of bank loans. This study is the first comprehensive study on
determinants of different loan types during the crisis and fills a gap in the literature of
the subject.
Narodowy Bank Polski10
8
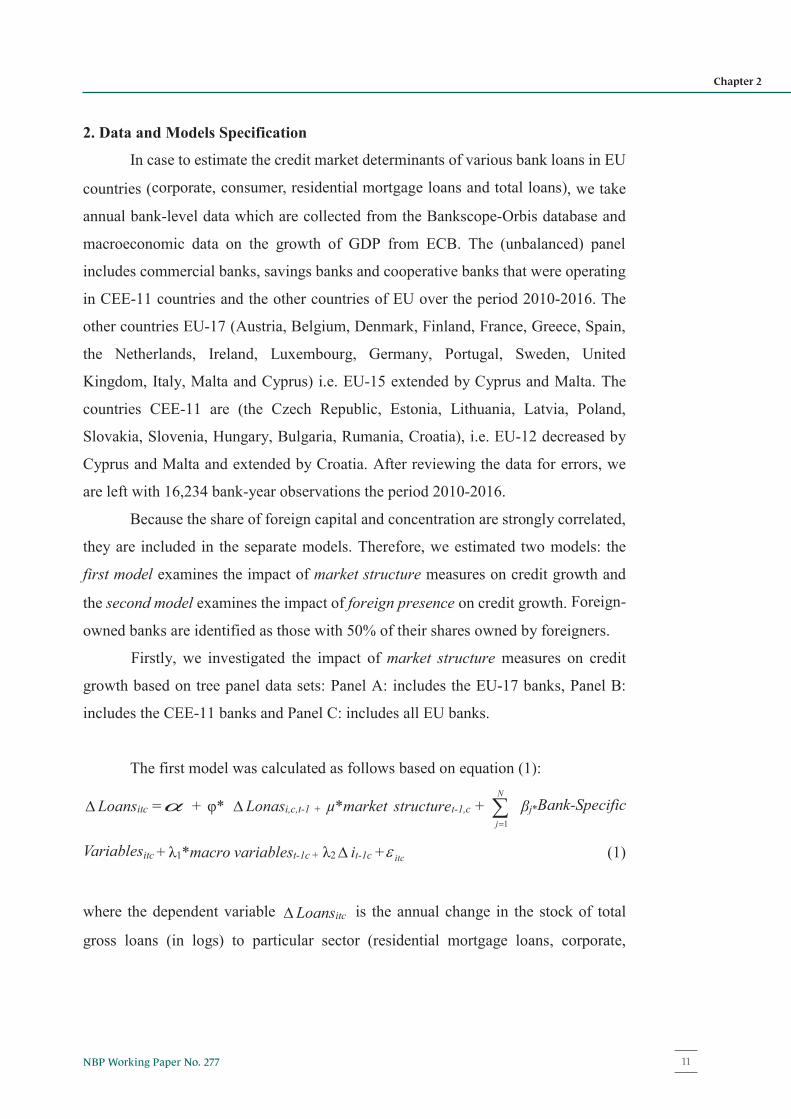
2. Data and Models Specification
In case to estimate the credit market determinants of various bank loans in EU
countries (corporate, consumer, residential mortgage loans and total loans), we take
annual bank-level data which are collected from the Bankscope-Orbis database and
macroeconomic data on the growth of GDP from ECB. The (unbalanced) panel
includes commercial banks, savings banks and cooperative banks that were operating
in CEE-11 countries and the other countries of EU over the period 2010-2016. The
other countries EU-17 (Austria, Belgium, Denmark, Finland, France, Greece, Spain,
the Netherlands, Ireland, Luxembourg, Germany, Portugal, Sweden, United
Kingdom, Italy, Malta and Cyprus) i.e. EU-15 extended by Cyprus and Malta. The
countries CEE-11 are (the Czech Republic, Estonia, Lithuania, Latvia, Poland,
Slovakia, Slovenia, Hungary, Bulgaria, Rumania, Croatia), i.e. EU-12 decreased by
Cyprus and Malta and extended by Croatia. After reviewing the data for errors, we
are left with 16,234 bank-year observations the period 2010-2016.
Because the share of foreign capital and concentration are strongly correlated,
they are included in the separate models. Therefore, we estimated two models: the
first model examines the impact of market structure measures on credit growth and
the second model examines the impact of foreign presence on credit growth. Foreign-
owned banks are identified as those with 50% of their shares owned by foreigners.
Firstly, we investigated the impact of market structure measures on credit
growth based on tree panel data sets: Panel A: includes the EU-17 banks, Panel B:
includes the CEE-11 banks and Panel C: includes all EU banks.
The first model was calculated as follows based on equation (1):
Loansitc = + φ* Lonasi,c,t-1 + μ*market structuret-1,c + N
j 1
βj*Bank-Specific
Variablesitc + λ1*macro variablest-1c + λ2 it-1c + itc (1)
where the dependent variable Loansitc is the annual change in the stock of total
gross loans (in logs) to particular sector (residential mortgage loans, corporate,
11NBP Working Paper No. 277
Chapter 2

9
consumer, and total loans) for each bank i and for each year t. Loans are express in
euro.
Market structure and the development of the banking sector have an impact on
the credit growth. There are two opposite hypothesis. According to the ESH,
concentrated markets are those where highly effective banks operate. According to
the ESH theory, more efficient banks have lower operating costs and therefore achieve
higher profits. In addition, the ESH theory assumes that if a bank is more efficient
than other competitors, it must choose between two mutually exclusive strategies. The
first strategy concerns the maximisation of profit for shareholders by maintaining
existing prices and the bank’s size. According to the other strategy, profit
maximisation consists in price reduction, thus in increasing the banks’ market share
by M&As leads to an increase in credit. Hicks (1935) developed a theory opposite to
the ESH, and it is known in literature as the quiet life hypothesis (QLH). According
to the QLH, firms with superior market strength and thus a privileged position suffer
a lower cost efficiency due to the quiet life of their managers. Consider the above
justification market structure is defined as follows:
As market structure measures we use:
the concentration of the banking sector which was defined as a share of the 5
largest credit institutions in total assets as the concentration ratio CR5tc and the
Herfindahl-Hirschman index for assets (the sum of the squares of the market
share of individual banks HHItc ) for each year t in country c2.
In regressions, we also used control variables denote the bank performance as Bank-
Specific Variablesitc:
the ratio of total net loans to total deposit (netloanstodepitc) for each bank i for
each year t in country c.
the tier1 ratio (core-capital to risk-weighted assets, tier1itc ) as an indicator of
a bank’s risk behavior (the higher the capital ratio, the greater the risk aversion)
for each bank i for each year t in country c.
2 For robustness check in the regressions, also the HHI index were estimated.
Narodowy Bank Polski12
10
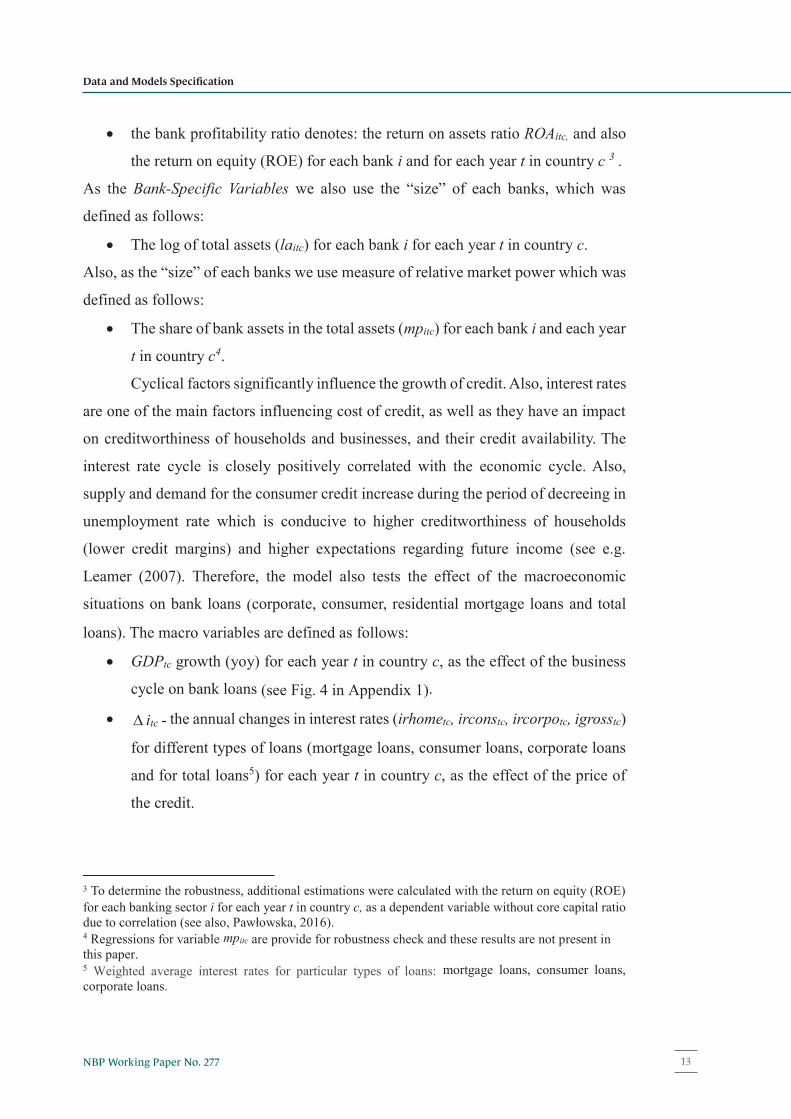
the bank profitability ratio denotes: the return on assets ratio ROAitc, and also
the return on equity (ROE) for each bank i and for each year t in country c 3 .
As the Bank-Specific Variables we also use the “size” of each banks, which was
defined as follows:
The log of total assets (laitc) for each bank i for each year t in country c.
Also, as the “size” of each banks we use measure of relative market power which was
defined as follows:
The share of bank assets in the total assets (mpitc) for each bank i and each year
t in country c4.
Cyclical factors significantly influence the growth of credit. Also, interest rates
are one of the main factors influencing cost of credit, as well as they have an impact
on creditworthiness of households and businesses, and their credit availability. The
interest rate cycle is closely positively correlated with the economic cycle. Also,
supply and demand for the consumer credit increase during the period of decreeing in
unemployment rate which is conducive to higher creditworthiness of households
(lower credit margins) and higher expectations regarding future income (see e.g.
Leamer (2007). Therefore, the model also tests the effect of the macroeconomic
situations on bank loans (corporate, consumer, residential mortgage loans and total
loans). The macro variables are defined as follows:
GDPtc growth (yoy) for each year t in country c, as the effect of the business
cycle on bank loans (see Fig. 4 in Appendix 1).
itc - the annual changes in interest rates (irhometc, irconstc, ircorpotc, igrosstc)
for different types of loans (mortgage loans, consumer loans, corporate loans
and for total loans5) for each year t in country c, as the effect of the price of
the credit.
3 To determine the robustness, additional estimations were calculated with the return on equity (ROE) for each banking sector i for each year t in country c, as a dependent variable without core capital ratio due to correlation (see also, Pawłowska, 2016). 4 Regressions for variable mpitc are provide for robustness check and these results are not present in this paper. 5 Weighted average interest rates for particular types of loans: mortgage loans, consumer loans, corporate loans.
13NBP Working Paper No. 277
Data and Models Specification
11
The variable is a constant term, itc denotes the error in the model, and φ, μ, λ, a3,
and bj are the regression coefficients.
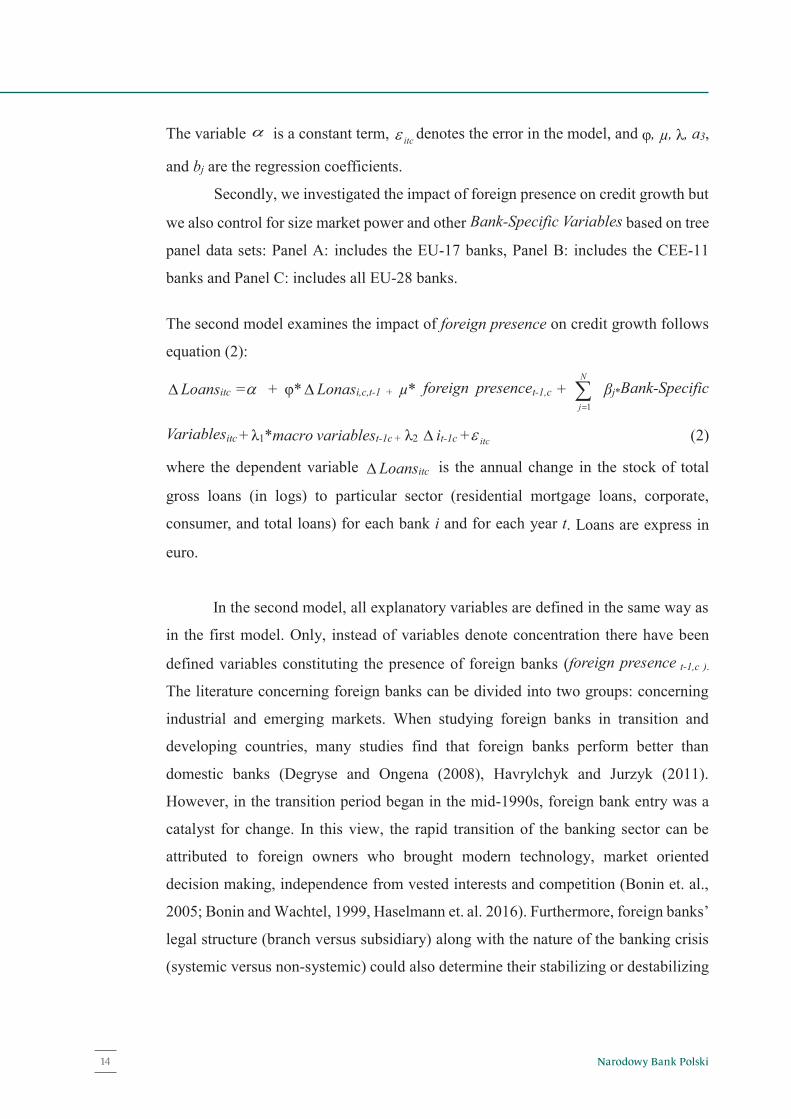
Secondly, we investigated the impact of foreign presence on credit growth but
we also control for size market power and other Bank-Specific Variables based on tree
panel data sets: Panel A: includes the EU-17 banks, Panel B: includes the CEE-11
banks and Panel C: includes all EU-28 banks.
The second model examines the impact of foreign presence on credit growth follows
equation (2):
Loansitc = + φ* Lonasi,c,t-1 + μ* foreign presencet-1,c + N
j 1
βj*Bank-Specific
Variablesitc + λ1*macro variablest-1c + λ2 it-1c + itc (2)
where the dependent variable Loansitc is the annual change in the stock of total
gross loans (in logs) to particular sector (residential mortgage loans, corporate,
consumer, and total loans) for each bank i and for each year t. Loans are express in
euro.
In the second model, all explanatory variables are defined in the same way as
in the first model. Only, instead of variables denote concentration there have been
defined variables constituting the presence of foreign banks (foreign presence t-1,c ).
The literature concerning foreign banks can be divided into two groups: concerning
industrial and emerging markets. When studying foreign banks in transition and
developing countries, many studies find that foreign banks perform better than
domestic banks (Degryse and Ongena (2008), Havrylchyk and Jurzyk (2011).
However, in the transition period began in the mid-1990s, foreign bank entry was a
catalyst for change. In this view, the rapid transition of the banking sector can be
attributed to foreign owners who brought modern technology, market oriented
decision making, independence from vested interests and competition (Bonin et. al.,
2005; Bonin and Wachtel, 1999, Haselmann et. al. 2016). Furthermore, foreign banks’
legal structure (branch versus subsidiary) along with the nature of the banking crisis
(systemic versus non-systemic) could also determine their stabilizing or destabilizing
Narodowy Bank Polski14

12
role. Claessens and Van Horen (2013), found that during the global financial crisis of
2008, foreign banks reduced credit more sharply when compared to domestic banks,
except when they dominated the host banking systems.
The presence of foreign banks is defined following Claessens and Van Horen
(2014) who constructs two indices. The first index is defined as the percentage of
foreign bank assets among total bank assets (as the percentage of foreign banks among
total banks) in a country (foreign presence 1) :
sfbtc - is defined as the percentage of foreign banks among total banks in each
year t in country c.
The second is defined as the percentage of foreign banks among total banks in
a country (foreign presence 2) :
numfbtc - is defined as the percentage of foreign banks among total banks in
each year t in country c.
These variables are strongly correlated in two groups of countries (see cf.,
Figure 2 in the Appendix 1). Therefore, the separate regressions for these two
variables were performed based on the second model.
15NBP Working Paper No. 277
Data and Models Specification
13
3. Results of Panel Data Analysis
In order to carry out the investigation of the issue of asymmetry of the credit
market determinants of various bank loans between the CEE-11 countries and the EU-
17 countries, after the global financial crisis we provided panel data estimations.
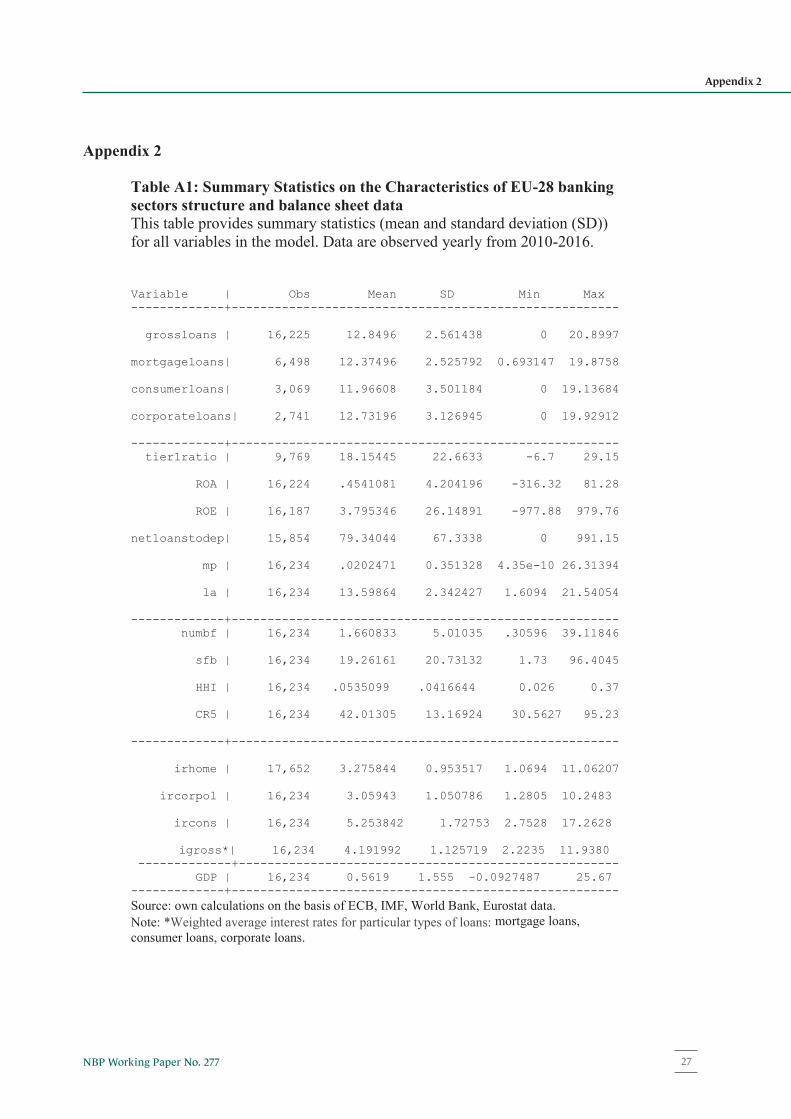
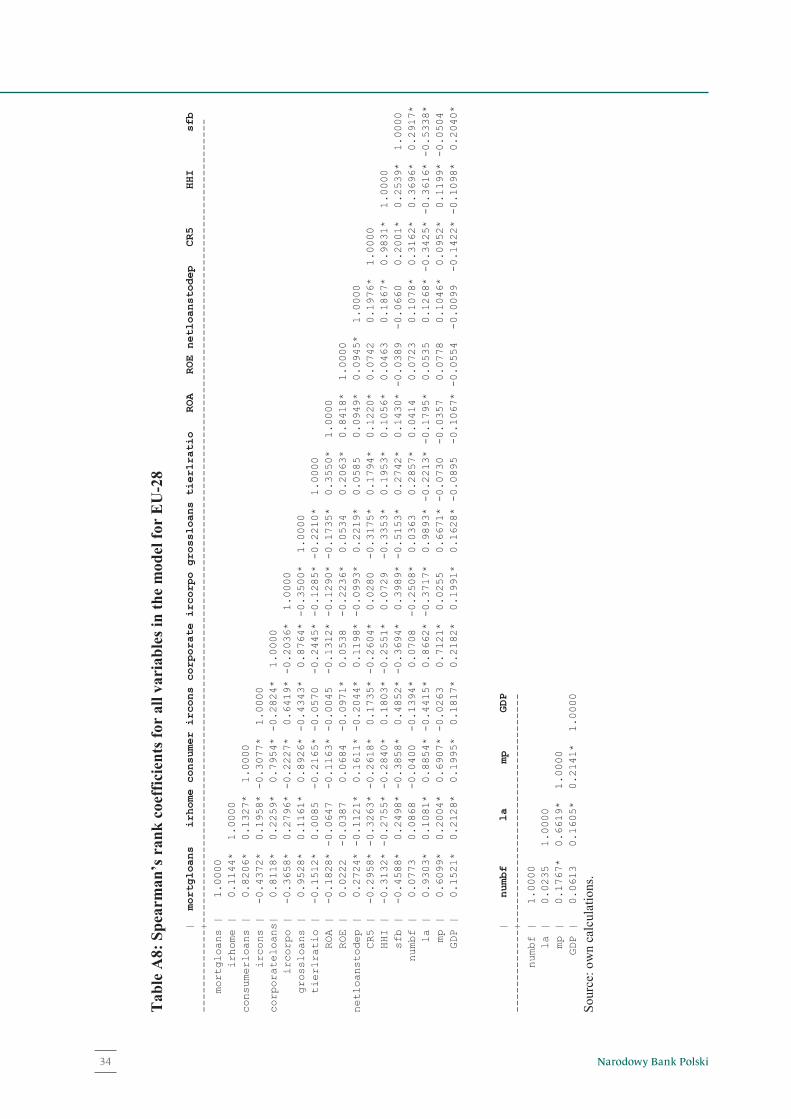
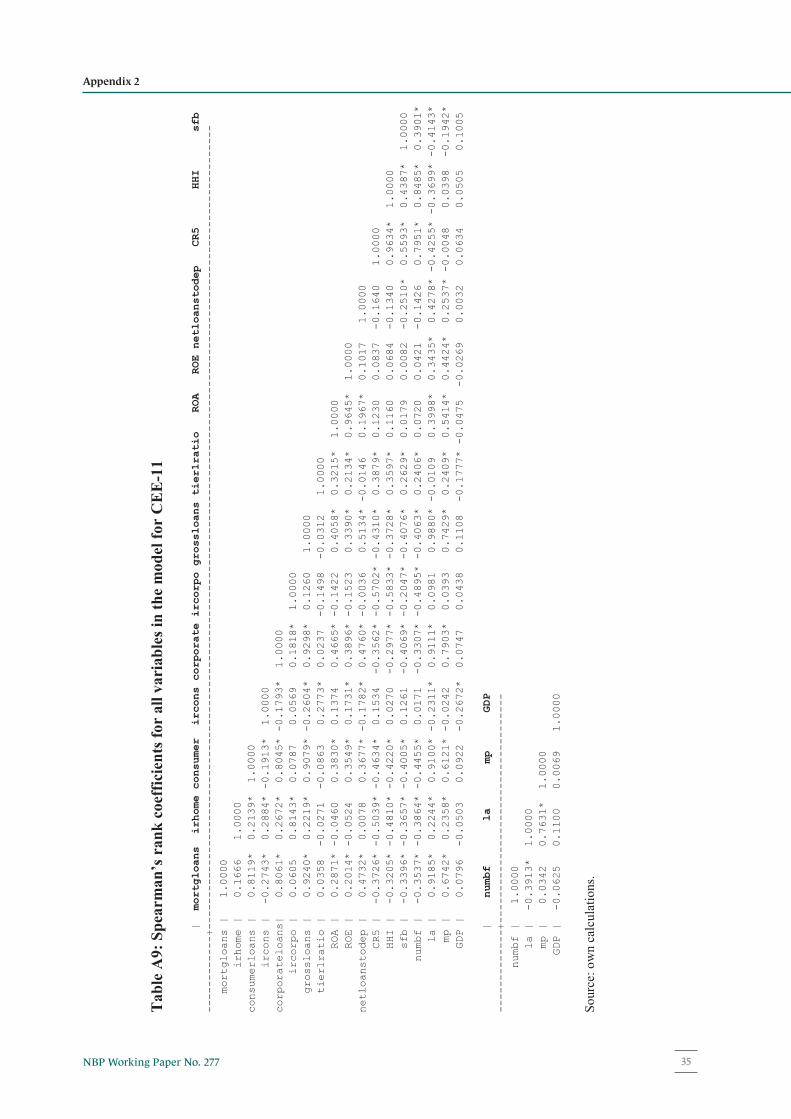
Tables A1, A2, A3 of the statistical Appendix present the summary statistics of key
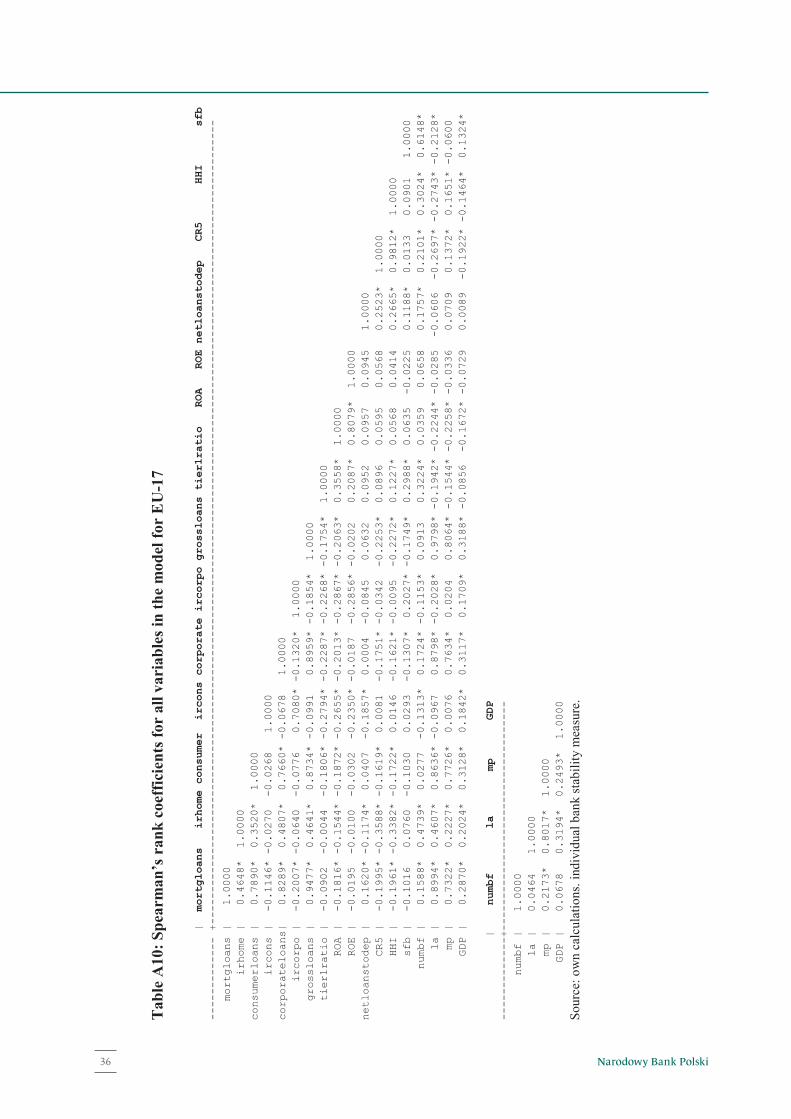
selected variables. Tables A8, A9, A10 present the correlation coefficients between
of key selected variables. The correlation coefficients are estimated for a sample of
the EU-17 countries and CEE-11 and for all EU-28 across the period 2010–2016.
For estimations of two models we used a system GMM, two-step robust
estimator (xtabond2) (Arellano and Bover (1995), Blundell and Bond (1998)
Windmeijer (2005). We used several tests proposed by Arellano and Bond (1991) and
Arellano and Bover (1995). We used also the Hansen of over-identifying restrictions,
which tests the overall strength of the instruments for a two-step estimator (Arellano
and Bond, 1991; Arellano and Bover, 1995; Blundell and Bond, 1998).
In case to investigate the asymmetry of the credit market determinants between
the CEE-11 countries and the EU-17, we performed two estimations for two models
separately to avoid any alignment of variables: market structure (CR5 and HHI) and
foreign presence (sfb, numfb6). A total of 25 regressions analyzes were performed for
each group of countries based on two models: based on equation (1) and based on
equation (2).
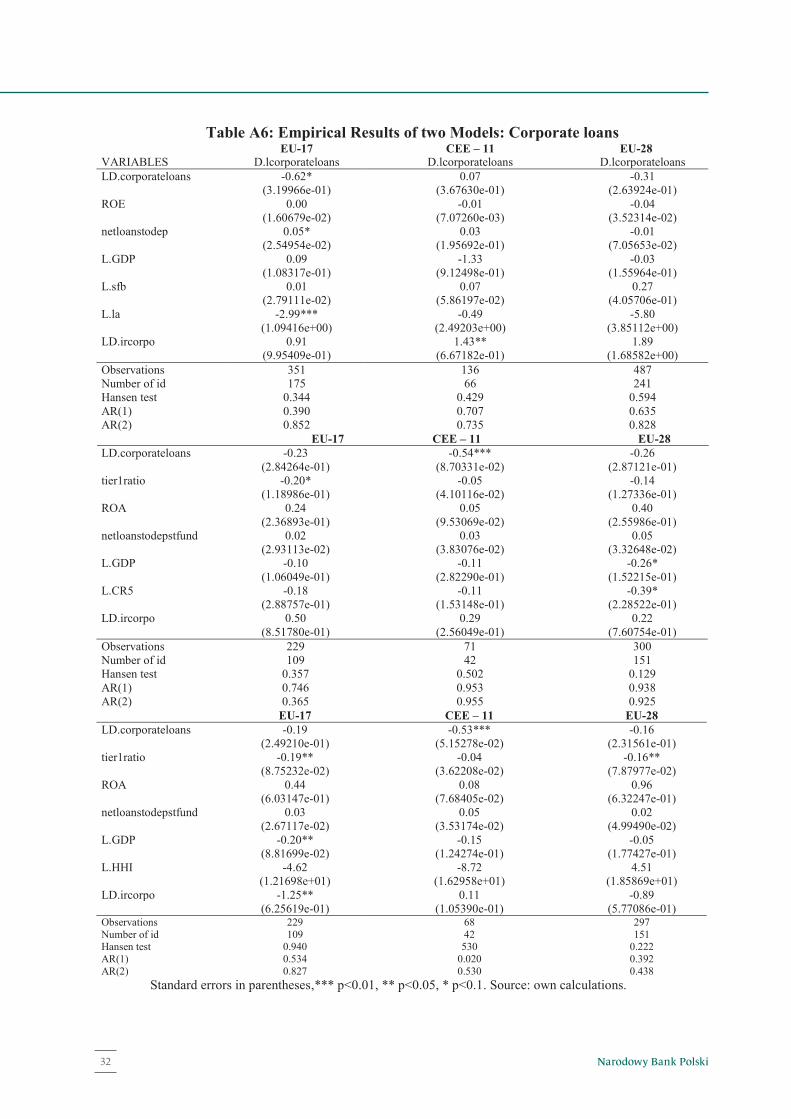
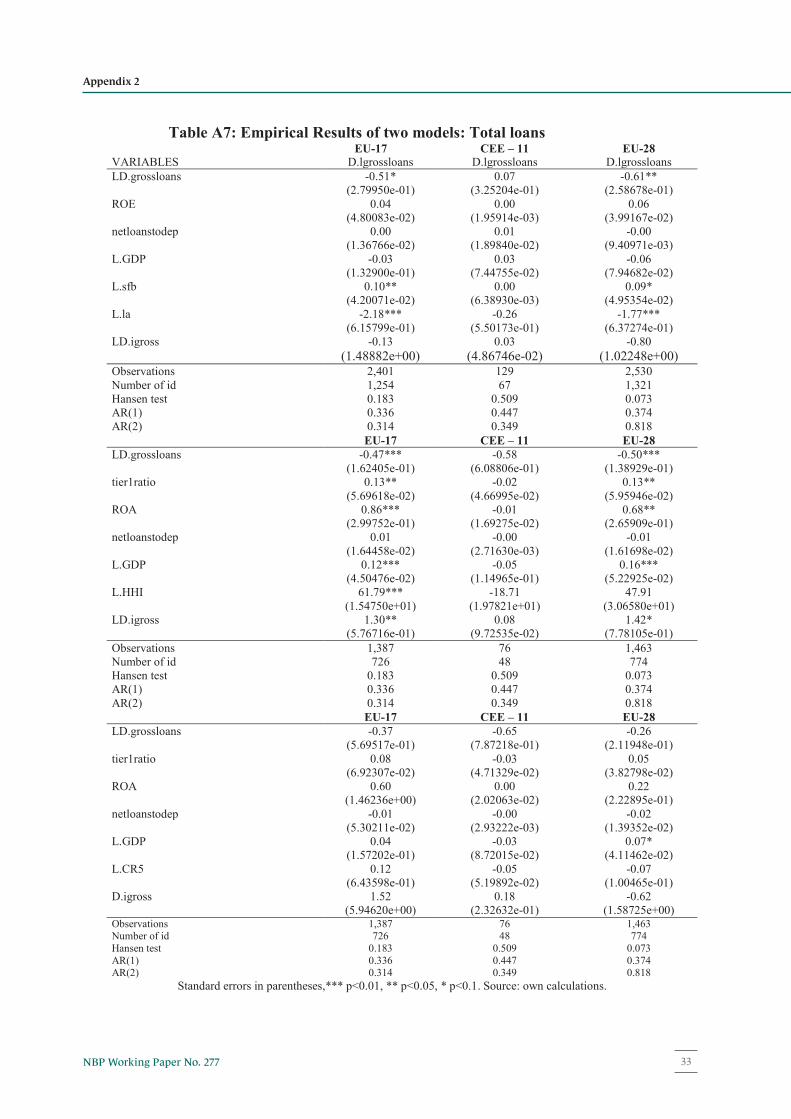
Tables A4-A7 of the statistical Appendix present the results of regressions
using a two-step robust GMM estimator for three groups of countries. For each of the
estimations, we also reported the Hansen test results at the bottom of the table as well
as the Arellano-Bond tests (AR(1) and AR(2)). The model seemed to fit the panel data
reasonably well, as the Hansen-test showed no evidence of over-identifying
restrictions. Tables A4-A7 present the results of regressions for three groups of
countries respectively for: mortgage loans, consumers loans, corporate loans and total
loans.
6Regressions for the second model for variable foreign presence 2 (numfb) are provide for robustness check and these results are not present in this paper.
Narodowy Bank Polski16
Chapter 3
14
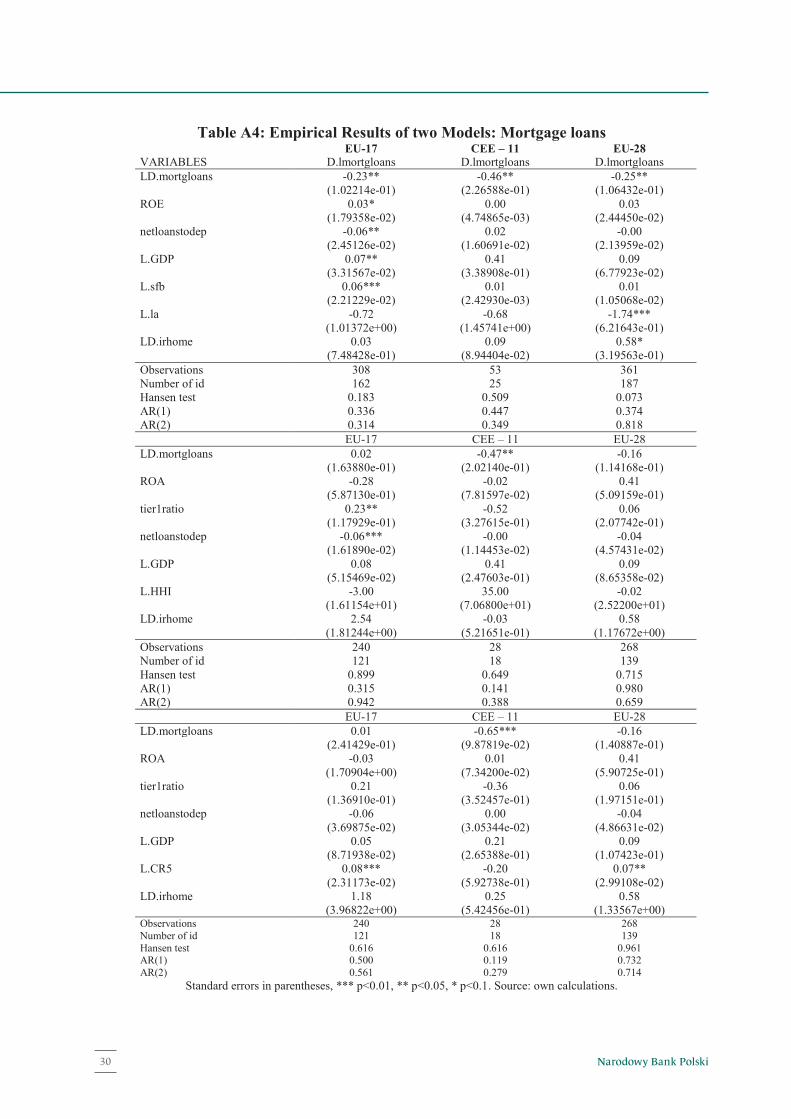
In Table A4 of the Appendix 2 a positive and significant coefficient ( ) was
found for the first model for EU – 17. It means that concertation measured in terms
of the share of the five largest banks’ total assets (CR5)—had a positive and significant
influence on the grow of mortgage loans in EU 17countries. Also, in Table A4 of the
Appendix a positive and significant coefficient ( ) was found for the second model
for CEE – 11. It means that foreign presence (1) measured in terms of the percentage
of foreign banks among total banks (sfb)—had a positive and significant influence on
the grow of mortgage loans in 11 CEE countries. In Table A7 of the Appendix a
positive and significant coefficient ( ) was found for the first model for EU – 17. It
means that concertation measured by Herfindahl index (HHI)—had a positive and
significant influence on the growth of total loans in EU – 17.
In the next step we measured, whether the economic growth has impact on the
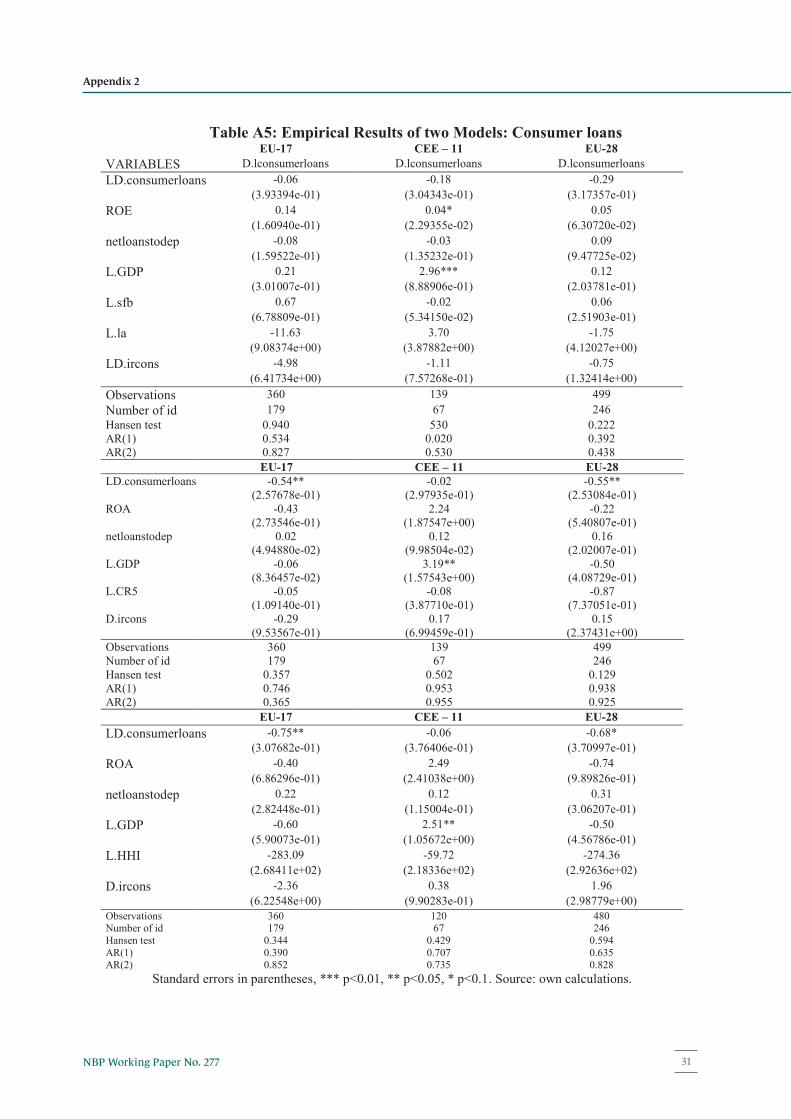
credit growth of different type of loans. In Table A5 of the Appendix a positive and
significant coefficient λ1 was found for the first and second model for EU – 17 for the
GDP growth (GDP). It means that consumer loans are strongly pro-cyclical. Also, in
Table A7 of the Appendix a positive and significant coefficient λ1 was found for the
first and second model for the growth of total gross loans for EU – 28. On the other
hand, in Table A6 of the Appendix a negative and significant coefficient λ1 was found
for the first and second model for EU – 17 for the GDP growth (GDP) for corporate
loans.
Finally, the bank “size” measured in terms of the individual institution’s the
log of total assets (la) — influenced negatively on the growth of corporate loans for
EU-17 countries. This results may confirm the size of individual banks is important
for growth of corporate loans. Also, capitalization had positive impact on the growth
of mortgage loans and total loans in EU-17 (see: table A4 and A7 of the Appendix 2).
The all above results obtained on the basis of two econometric models allowed
to formulate the following conclusions.
The relationship between bank concentration and growth of mortgage loans is
mainly positive for EU-17 countries, but only in case of using the measure CR5. Also,
the relationship between bank concentration and growth of total loans is mainly
positive for EU-17 countries.
17NBP Working Paper No. 277
Results of Panel Data Analysis
15
The presence of foreign banks has a positive effect on the growth of mortgage
loans for EU-17 countries. Bank size has a negative effect on the growth of corporate
loans in EU-17 countries.
The relationship between the growth of GDP and the growth of consumer
loans is positive mainly for CEE-11 transition countries. The relationship between the
growth of GDP and the growth of corporate loans is negative mainly for all EU-17
countries.
This study showed different determinants of the growth of various types of
loans for two groups of countries (CEE-11 countries and the EU-17 countries), after
the global financial crisis. However, the results of this research did not give any
definite conclusions as to the role of foreign capital participation, the results showed
rather the impact of the size of banks and bank’s concentration on growth of loans.
On the one hand, Cull et al. (2017) found that in Eastern Europe, there are no robust
significant differences in foreign banks consumer loan growth relative to domestic
banks, both before and during the crisis. On the other hand, many reports highlight
the problem of low growth in corporate loans in the euro area countries (Bank of
Finland Bulletin, (2016). Therefore, it seems that the obtained results, require further
more comprehensive analysis of these determinants for particular types of loans with
using other econometric models.
Narodowy Bank Polski18
16
Conclusions
This paper investigates the issue of asymmetry of the credit market determinants
of bank loans (corporate, consumer, and residential mortgage loans) between the
CEE-11 countries (the Czech Republic, Estonia, Lithuania, Latvia, Poland, Slovakia,
Slovenia, Hungary, Bulgaria, Rumania, Croatia) and the EU-17 countries (Austria,
Belgium, Denmark, Finland, France, Greece, Spain, the Netherlands, Ireland,
Luxembourg, Germany, Portugal, Sweden, United Kingdom, Italy, Malta and Cyprus)
after the Global Financial Crisis (GFC).
The determinates of banks loans included concentration indicators and foreign
ownership presence. Comparative analysis of the credit market of the CEE-11
countries against all EU-28 and EU-17 also find the differences between determinants
of different type of loans.
Using the methodology of panel regression, this study finds that the relationship
between bank concentration and growth of mortgage loans is mainly positive for EU-
17 countries, but only in case of using the measure CR5. The presence of foreign
banks has a positive effect on the growth of mortgage loans for EU-17 countries. Bank
size has a negative effect on the growth of corporate loans in EU-17 countries. Also,
capitalization had positive impact on the growth of mortgage loans and total loans in
EU-17.
The relationship between the growth of GDP and the growth of consumer
loans is positive mainly for CEE-11 transition countries. The relationship between the
growth of GDP and the growth of corporate loans is negative mainly for all EU-17
countries.
This paper provides valuable insights for banking supervisors about the impact
of market structure on the credit grow. A further direction of research it should be a
deeper interpretation of the obtained results. In particular, this issue concerns
corporate loans which growing so slowly, particularly in develop EU-17 countries.
19NBP Working Paper No. 277
Conclusions
17
References
Allen F., Jackowicz K., Kowalewski O., Kozłowski Ł., (2017), Bank lending,
crises, and changing ownership structure in Central and Eastern European
countries, Journal of Corporate Finance, 42 (2017), 494–515.
Arellano M., Bond S.R. (1991), Some tests of specification for panel data:
Monte Carlo evidence and an application to employment equations, Review of
Economic Studies, 58, 277–297.
Adler G., Cerutti E. (2015), Are Foreign Banks a ‘Safe Haven’? Evidence
from Past Banking Crises, IMF Working Paper, WP/15/43.
Anginer D., Cerutti E., Soledad Martinez Peria M. (2016), Foreign Bank
Subsidiaries’ Default Risk during the Global Crisis: What Factors Help
Insulate Affiliates from their Parents? IMF Working, WP/16/109.
Agnello L., Schuknecht L. (2011), Booms and busts in housing markets:
Determinants and implications, Journal of Housing Economics 20, issue 3,
171-190.
Aiyar S., Calomiris C. W., Wieladek T. (2014), Does Macro-Prudential
Regulation Leak? Evidence from a UK Policy Experiment, Journal of Money,
Credit and Banking 46 (s1), 181–214.
Akinci O., Olmstead-Rumsey J. (2015), How Effective are Macroprudential
Policies? An Empirical Investigation, Federal Reserve Board International
Finance Discussion Papers No. 1136.
Arellano M., Bover O. (1995), Another look at the instrumental variable
estimation of error-component models, Journal of Econometrics, 68(1), 29–
51.
Arena, M., Reinhart, C., Vázquez, F.F., (2007), The lending channel in
emerging economies: are foreign banks different? IMF Working Papers, 07.
Bank of Finland Bulletin 4/2016,
https://www.bofbulletin.fi/en/archive/?issue=2016-4.
Narodowy Bank Polski20
References
18
Bonin, J. P., Hasan, I., Wachtel, P. (2005), Privatization matters: Bank
efficiency in transition countries. Journal of Banking and Finance, 29(8-9),
2155–2178.
Borio C., Gambacorta L., Hofmann B. (2015), The influence of monetary
policy on bank profitability, BIS Working Papers No. 514.
Cecchetti S., Mohanty M., Zampolli F. (2011), The real effects of debt, BIS
Working Papers No. 352.
Cizel J., Frost J., Hauben A., Wierts P. (2016), Effective macroprudential
policy: cross-sector substitution from price and quantity measures, DNB
Working Paper NO. 498.
Claessens S., Van Horen N. (2013), Impact of Foreign Banks, DNB Working
Paper NO 370.
Cubillas E., González F., (2014), Financial liberalization and bank risk-taking:
international evidence, Journal of Financial Stability 11, 32–48.
Cull R., M. S. Martinez Pería (2013), Bank Ownership and Lending Patterns
during the 2008–2009. Financial Crisis Evidence from Latin America and
Eastern Europe, Journal of Banking and Finance, 2013, vol. 37 (12), 4861–
4878.
Cull R., M. S. Martinez Pería., Verrier J. (2017), Bank Ownership: Trends and
Implications, IMF Working Paper No. 17/60.
De Haas R., van Lelyveld I. (2012), Foreign banks and credit stability in
Central and Eastern Europe. A panel data analysis, Journal of Banking and
Finance, 2006, vol. 30 (7), 1927–1952.
De Haas R., Van Horen N. (2012), International shock transmission after the
Lehman Brothers collapse: evidence from syndicated lending, American
Economic Review: Papers & Proceedings 102(3), 231–237.
Demetriades P. O, Hussein K. A. (1996), Does Financial Development cause
economic growth, time series evidence from 16 countries, Journal of
Development Economics 51 (2), 387-411.
Demirgüç-Kunt A., Huizinga H. (2000), Financial structure and bank
profitability, World Bank Policy Research Working Paper 2430.
21NBP Working Paper No. 277
References
19
Degryse, H., Ongena, S., (2008), Competition and regulation in the banking
sector: A review of the empirical evidence on the sources of bank rents. In
Thakor, A. V., Boot, A. (Eds.), Handbook of Financial Intermediation and
Banking Elsevier Science, 483–554.
Goddard J., Molyneux P., Wilson J. O. S. (2004), The profitability of
European banks. A cross-sectional and dynamic panel analysis, The
Manchester School 72(3), 363–381.
Guo K., Stepanyan V. (2011), Determinants of Bank Credit in Emerging
Market Economies, IMF Working Paper European Department No.
WP/11/51.
Hurlin, Ch. Kierzenkowski, R. (2007), Credit market disequilibrium in
Poland: Can we find what we expect?: Non-stationarity and the short-side rule,
Economic Systems, Elsevier, vol. 31(2), 157-183.
Haselmann R., Wachtel P., Sabott J. (2016), Credit Institutions, Ownership
and Bank Lending in Transition Countries, The Palgrave Handbook of
European Banking.
Havrylchyk O., Jurzyk E. (2011), Profitability of foreign banks in Central and
Eastern Europe: Does the entry mode matter?, Economics of Transition Vol.
19, Issue 3, 443–472.
Hicks J. (1935), The theory of monopoly, Econometrica, 3(1), 1−20.
Kouretas G. P., Tsoumas Ch. (2016), Foreign bank ownership and business
regulations, Journal of Financial Stability 24, 104-116.
Kouretas G. P., Delis M.D., Ch. Tsoumas (2014), Anxious periods and bank
lending, Journal of Banking and Finance 38, 1-13.
Laeven L., Ratnovski L., Tong H. (2016), Bank size, capital, and systemic
risk: Some international evidence, Journal of Banking & Finance No. 69, 25-
34.
Leamer E. (2007), Housing is the Business Cycle, NBER Working Paper
Series No. 13428.
Levine R. (2004), Finance and Growth: Theory and Evidence, NBER Working
Papers No. 10766.
Narodowy Bank Polski22
20
Mendoza E., Terrones M. (2012), An anatomy of credit booms and their
demise, NBER Working Paper No. 18379.
Meriläinen J-M. (2016), Lending growth during the financial crisis and the
sovereign debt crisis: The role of bank ownership type, Journal of
International Financial Markets, Institutions & Money, 41, 168–182.
Pawłowska M. (2016), Does the Size and Market Structure of the Banking
Sector have an Effect on the Financial Stability of the European Union? The
Journal of Economic Asymmetries (4), 112-127.
Popov A., Udell G.F. (2012), Cross-border banking, credit access, and the
financial crisis, Journal of International Economics, 87,1, 147-161.
Reinhart C., Rogoff K. (2009), This Time is Different Eight Centuries of
Financial Folly, Princeton University Press Princeton and Oxford.
Reinhart C., Rogoff K. (2010), From Financial Crash to Debt Crisis, NBER
Working Paper No. 15795.
Schularick M., Taylor A. (2012), Credit booms gone bust: monetary policy,
leverage cycles, and financial crises, 1870−2008, American Economic Review
No. 102, 1029−1061.
Windmeijer, F. (2005), A finite sample correction for the variance of linear
efficient two-step GMM estimators. Journal of Econometrics, 126, 25–51.
23NBP Working Paper No. 277
References
21
Appendix 1 Figure 1. Banking Concentration and Foreign Presence for EU-28 in 2015 (%)
A: EU-17
Source: own calculations on the basis of ECB data.
B: CEE-11
Figure 2. Foreign Bank Presence Variables in EU- (2015)
A: EU-17
B: CEE-11
Source: ECB and own calculation.
0102030405060708090
100
Ger
man
yLu
xem
bour
gIta
lyA
ustri
aSp
ain
Fran
ceU
nite
d K
ingd
omIr
elan
dSw
eden
Portu
gal
Bel
gium
Den
mar
kN
ethe
rland
sG
reec
eFi
nlan
dM
alta
Cyp
rus
CR5 Share of Foreign banks
0102030405060708090
100
Pola
ndB
ulga
riaH
unga
ryR
oman
iaC
zech
iaLa
tvia
Slov
enia
Slov
akia
Lith
uani
aEs
toni
aC
roat
ia
CR5 Share of Foreign banks
Narodowy Bank Polski24
Appendix 1
22
Figure 3. Assets of the Banking Sectors in the years 2011, 2015 (in EUR billion) A: EU-17
Source: ECB.
B: CEE-11
Figure 4. GDP growth (yoy) in EU-28 A: EU-17
B: CEE-11
Source: ECB, Eurostat and own calculation.
0
2000
4000
6000
8000
10000
12000
14000
2011 2015
0
50
100
150
200
250
300
350
400
2011 2015
-0.3
-0.2
-0.1
0
0.1
0.2
0.3
0.4
2004
Q1
2005
Q1
2006
Q1
2007
Q1
2008
Q1
2009
Q1
2010
Q1
2011
Q1
2012
Q1
2013
Q1
2014
Q1
2015
Q1
2016
Q1
Austria Belgium
Germany Denmark
Spain Finland
France United Kingdom
Greece Ireland
Italy Luxembourg
Netherlands Portugal
Sweden Cyprus
Malta
-0.4
-0.3
-0.2
-0.1
0
0.1
0.2
0.3
0.4
2004
Q1
2004
Q4
2005
Q3
2006
Q2
2007
Q1
2007
Q4
2008
Q3
2009
Q2
2010
Q1
2010
Q4
2011
Q3
2012
Q2
2013
Q1
2013
Q4
2014
Q3
2015
Q2
2016
Q1
Bulgaria Czech Republic
Estonia Croatia
Hungary Lithuania
Latvia Poland
Romania Slovenia
Slovakia
25NBP Working Paper No. 277
Appendix 1
23
Figure 5. Credit growth for the non-financial sector in Germany [%]
Figure 6. Credit growth for the non-financial sector in Ireland [%]
Figure 7. Credit growth for the non-financial sector in Poland [%]
Figure 8. Credit growth for the non-financial sector in Lithuania [%]
Source: ECB and own calculation.
Narodowy Bank Polski26
24
Appendix 2
Table A1: Summary Statistics on the Characteristics of EU-28 banking sectors structure and balance sheet data This table provides summary statistics (mean and standard deviation (SD)) for all variables in the model. Data are observed yearly from 2010-2016. Variable | Obs Mean SD Min Max -------------+------------------------------------------------------ grossloans | 16,225 12.8496 2.561438 0 20.8997 mortgageloans| 6,498 12.37496 2.525792 0.693147 19.8758 consumerloans| 3,069 11.96608 3.501184 0 19.13684 corporateloans| 2,741 12.73196 3.126945 0 19.92912 -------------+------------------------------------------------------ tier1ratio | 9,769 18.15445 22.6633 -6.7 29.15 ROA | 16,224 .4541081 4.204196 -316.32 81.28 ROE | 16,187 3.795346 26.14891 -977.88 979.76 netloanstodep| 15,854 79.34044 67.3338 0 991.15 mp | 16,234 .0202471 0.351328 4.35e-10 26.31394 la | 16,234 13.59864 2.342427 1.6094 21.54054 -------------+------------------------------------------------------ numbf | 16,234 1.660833 5.01035 .30596 39.11846 sfb | 16,234 19.26161 20.73132 1.73 96.4045 HHI | 16,234 .0535099 .0416644 0.026 0.37 CR5 | 16,234 42.01305 13.16924 30.5627 95.23 -------------+------------------------------------------------------ irhome | 17,652 3.275844 0.953517 1.0694 11.06207 ircorpol | 16,234 3.05943 1.050786 1.2805 10.2483 ircons | 16,234 5.253842 1.72753 2.7528 17.2628
igross*| 16,234 4.191992 1.125719 2.2235 11.9380 -------------+----------------------------------------------------- GDP | 16,234 0.5619 1.555 -0.0927487 25.67 -------------+------------------------------------------------------ Source: own calculations on the basis of ECB, IMF, World Bank, Eurostat data. Note: *Weighted average interest rates for particular types of loans: mortgage loans, consumer loans, corporate loans.
27NBP Working Paper No. 277
Appendix 2
25
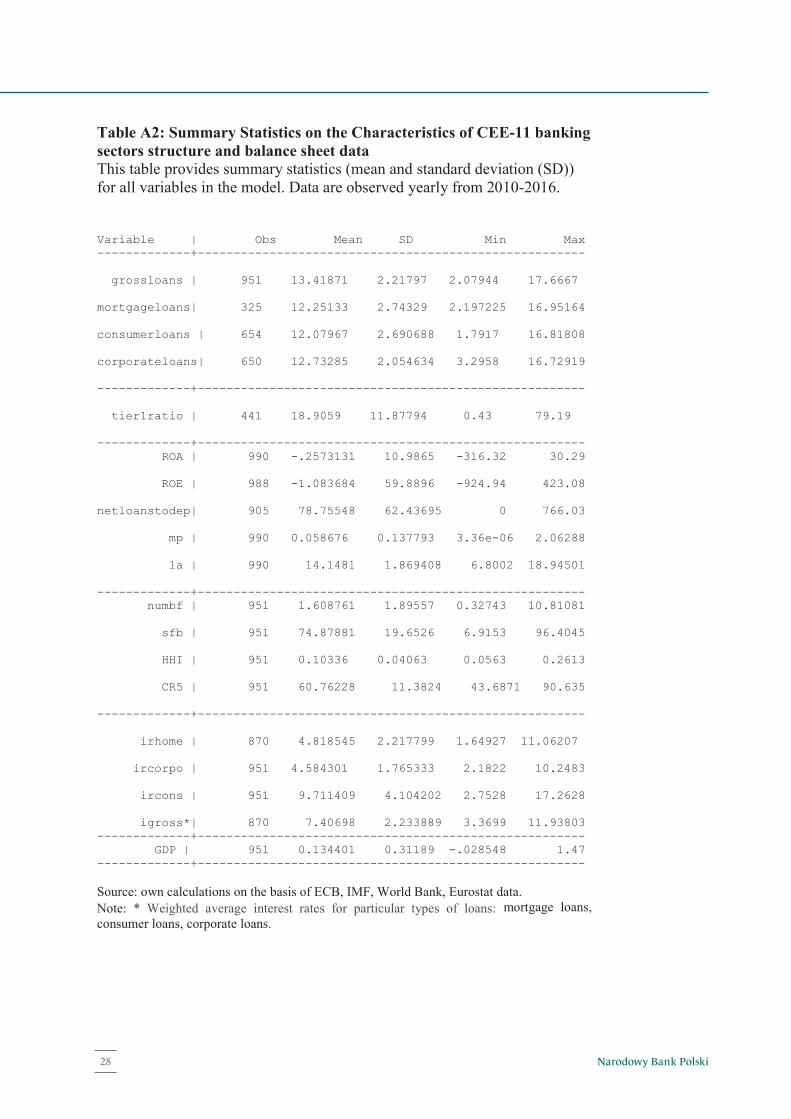
Table A2: Summary Statistics on the Characteristics of CEE-11 banking sectors structure and balance sheet data This table provides summary statistics (mean and standard deviation (SD)) for all variables in the model. Data are observed yearly from 2010-2016. Variable | Obs Mean SD Min Max -------------+------------------------------------------------------ grossloans | 951 13.41871 2.21797 2.07944 17.6667 mortgageloans| 325 12.25133 2.74329 2.197225 16.95164 consumerloans | 654 12.07967 2.690688 1.7917 16.81808 corporateloans| 650 12.73285 2.054634 3.2958 16.72919 -------------+------------------------------------------------------ tier1ratio | 441 18.9059 11.87794 0.43 79.19 -------------+------------------------------------------------------ ROA | 990 -.2573131 10.9865 -316.32 30.29 ROE | 988 -1.083684 59.8896 -924.94 423.08 netloanstodep| 905 78.75548 62.43695 0 766.03 mp | 990 0.058676 0.137793 3.36e-06 2.06288 la | 990 14.1481 1.869408 6.8002 18.94501 -------------+------------------------------------------------------ numbf | 951 1.608761 1.89557 0.32743 10.81081 sfb | 951 74.87881 19.6526 6.9153 96.4045 HHI | 951 0.10336 0.04063 0.0563 0.2613 CR5 | 951 60.76228 11.3824 43.6871 90.635 -------------+------------------------------------------------------ irhome | 870 4.818545 2.217799 1.64927 11.06207 ircorpo | 951 4.584301 1.765333 2.1822 10.2483 ircons | 951 9.711409 4.104202 2.7528 17.2628 igross*| 870 7.40698 2.233889 3.3699 11.93803 -------------+------------------------------------------------------ GDP | 951 0.134401 0.31189 -.028548 1.47 -------------+------------------------------------------------------ Source: own calculations on the basis of ECB, IMF, World Bank, Eurostat data. Note: * Weighted average interest rates for particular types of loans: mortgage loans, consumer loans, corporate loans.
26
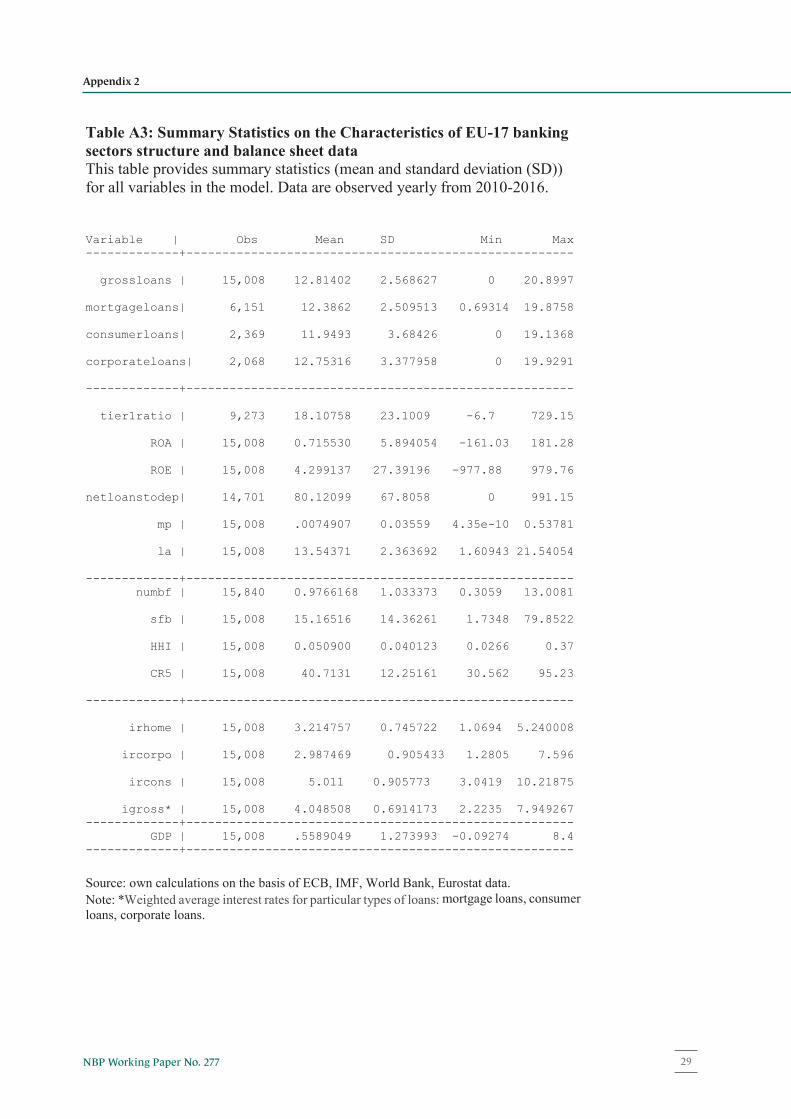
Table A3: Summary Statistics on the Characteristics of EU-17 banking sectors structure and balance sheet data This table provides summary statistics (mean and standard deviation (SD)) for all variables in the model. Data are observed yearly from 2010-2016. Variable | Obs Mean SD Min Max -------------+------------------------------------------------------ grossloans | 15,008 12.81402 2.568627 0 20.8997 mortgageloans| 6,151 12.3862 2.509513 0.69314 19.8758 consumerloans| 2,369 11.9493 3.68426 0 19.1368 corporateloans| 2,068 12.75316 3.377958 0 19.9291 -------------+------------------------------------------------------ tier1ratio | 9,273 18.10758 23.1009 -6.7 729.15 ROA | 15,008 0.715530 5.894054 -161.03 181.28 ROE | 15,008 4.299137 27.39196 -977.88 979.76 netloanstodep| 14,701 80.12099 67.8058 0 991.15 mp | 15,008 .0074907 0.03559 4.35e-10 0.53781 la | 15,008 13.54371 2.363692 1.60943 21.54054 -------------+------------------------------------------------------ numbf | 15,840 0.9766168 1.033373 0.3059 13.0081 sfb | 15,008 15.16516 14.36261 1.7348 79.8522 HHI | 15,008 0.050900 0.040123 0.0266 0.37 CR5 | 15,008 40.7131 12.25161 30.562 95.23 -------------+------------------------------------------------------ irhome | 15,008 3.214757 0.745722 1.0694 5.240008 ircorpo | 15,008 2.987469 0.905433 1.2805 7.596 ircons | 15,008 5.011 0.905773 3.0419 10.21875 igross* | 15,008 4.048508 0.6914173 2.2235 7.949267 -------------+------------------------------------------------------ GDP | 15,008 .5589049 1.273993 -0.09274 8.4 -------------+------------------------------------------------------ Source: own calculations on the basis of ECB, IMF, World Bank, Eurostat data. Note: *Weighted average interest rates for particular types of loans: mortgage loans, consumer loans, corporate loans.
Narodowy Bank Polski28
26
Table A3: Summary Statistics on the Characteristics of EU-17 banking sectors structure and balance sheet data This table provides summary statistics (mean and standard deviation (SD)) for all variables in the model. Data are observed yearly from 2010-2016. Variable | Obs Mean SD Min Max -------------+------------------------------------------------------ grossloans | 15,008 12.81402 2.568627 0 20.8997 mortgageloans| 6,151 12.3862 2.509513 0.69314 19.8758 consumerloans| 2,369 11.9493 3.68426 0 19.1368 corporateloans| 2,068 12.75316 3.377958 0 19.9291 -------------+------------------------------------------------------ tier1ratio | 9,273 18.10758 23.1009 -6.7 729.15 ROA | 15,008 0.715530 5.894054 -161.03 181.28 ROE | 15,008 4.299137 27.39196 -977.88 979.76 netloanstodep| 14,701 80.12099 67.8058 0 991.15 mp | 15,008 .0074907 0.03559 4.35e-10 0.53781 la | 15,008 13.54371 2.363692 1.60943 21.54054 -------------+------------------------------------------------------ numbf | 15,840 0.9766168 1.033373 0.3059 13.0081 sfb | 15,008 15.16516 14.36261 1.7348 79.8522 HHI | 15,008 0.050900 0.040123 0.0266 0.37 CR5 | 15,008 40.7131 12.25161 30.562 95.23 -------------+------------------------------------------------------ irhome | 15,008 3.214757 0.745722 1.0694 5.240008 ircorpo | 15,008 2.987469 0.905433 1.2805 7.596 ircons | 15,008 5.011 0.905773 3.0419 10.21875 igross* | 15,008 4.048508 0.6914173 2.2235 7.949267 -------------+------------------------------------------------------ GDP | 15,008 .5589049 1.273993 -0.09274 8.4 -------------+------------------------------------------------------ Source: own calculations on the basis of ECB, IMF, World Bank, Eurostat data. Note: *Weighted average interest rates for particular types of loans: mortgage loans, consumer loans, corporate loans.
29NBP Working Paper No. 277
Appendix 2
27
Table A4: Empirical Results of two Models: Mortgage loans EU-17 CEE – 11 EU-28
VARIABLES D.lmortgloans D.lmortgloans D.lmortgloans LD.mortgloans -0.23** -0.46** -0.25** (1.02214e-01) (2.26588e-01) (1.06432e-01) ROE 0.03* 0.00 0.03 (1.79358e-02) (4.74865e-03) (2.44450e-02) netloanstodep -0.06** 0.02 -0.00 (2.45126e-02) (1.60691e-02) (2.13959e-02) L.GDP 0.07** 0.41 0.09 (3.31567e-02) (3.38908e-01) (6.77923e-02) L.sfb 0.06*** 0.01 0.01 (2.21229e-02) (2.42930e-03) (1.05068e-02) L.la -0.72 -0.68 -1.74*** (1.01372e+00) (1.45741e+00) (6.21643e-01) LD.irhome 0.03 0.09 0.58* (7.48428e-01) (8.94404e-02) (3.19563e-01) Observations 308 53 361 Number of id 162 25 187 Hansen test 0.183 0.509 0.073 AR(1) 0.336 0.447 0.374 AR(2) 0.314 0.349 0.818 EU-17 CEE – 11 EU-28 LD.mortgloans 0.02 -0.47** -0.16 (1.63880e-01) (2.02140e-01) (1.14168e-01) ROA -0.28 -0.02 0.41 (5.87130e-01) (7.81597e-02) (5.09159e-01) tier1ratio 0.23** -0.52 0.06 (1.17929e-01) (3.27615e-01) (2.07742e-01) netloanstodep -0.06*** -0.00 -0.04 (1.61890e-02) (1.14453e-02) (4.57431e-02) L.GDP 0.08 0.41 0.09 (5.15469e-02) (2.47603e-01) (8.65358e-02) L.HHI -3.00 35.00 -0.02 (1.61154e+01) (7.06800e+01) (2.52200e+01) LD.irhome 2.54 -0.03 0.58 (1.81244e+00) (5.21651e-01) (1.17672e+00) Observations 240 28 268 Number of id 121 18 139 Hansen test 0.899 0.649 0.715 AR(1) 0.315 0.141 0.980 AR(2) 0.942 0.388 0.659 EU-17 CEE – 11 EU-28 LD.mortgloans 0.01 -0.65*** -0.16 (2.41429e-01) (9.87819e-02) (1.40887e-01) ROA -0.03 0.01 0.41 (1.70904e+00) (7.34200e-02) (5.90725e-01) tier1ratio 0.21 -0.36 0.06 (1.36910e-01) (3.52457e-01) (1.97151e-01) netloanstodep -0.06 0.00 -0.04 (3.69875e-02) (3.05344e-02) (4.86631e-02) L.GDP 0.05 0.21 0.09 (8.71938e-02) (2.65388e-01) (1.07423e-01) L.CR5 0.08*** -0.20 0.07** (2.31173e-02) (5.92738e-01) (2.99108e-02) LD.irhome 1.18 0.25 0.58 (3.96822e+00) (5.42456e-01) (1.33567e+00) Observations 240 28 268 Number of id 121 18 139 Hansen test 0.616 0.616 0.961 AR(1) 0.500 0.119 0.732 AR(2) 0.561 0.279 0.714
Standard errors in parentheses, *** p<0.01, ** p<0.05, * p<0.1. Source: own calculations.
Narodowy Bank Polski30
28
Table A5: Empirical Results of two Models: Consumer loans EU-17 CEE – 11 EU-28 VARIABLES D.lconsumerloans D.lconsumerloans D.lconsumerloans LD.consumerloans -0.06 -0.18 -0.29 (3.93394e-01) (3.04343e-01) (3.17357e-01) ROE 0.14 0.04* 0.05 (1.60940e-01) (2.29355e-02) (6.30720e-02) netloanstodep -0.08 -0.03 0.09 (1.59522e-01) (1.35232e-01) (9.47725e-02) L.GDP 0.21 2.96*** 0.12 (3.01007e-01) (8.88906e-01) (2.03781e-01) L.sfb 0.67 -0.02 0.06 (6.78809e-01) (5.34150e-02) (2.51903e-01) L.la -11.63 3.70 -1.75 (9.08374e+00) (3.87882e+00) (4.12027e+00) LD.ircons -4.98 -1.11 -0.75 (6.41734e+00) (7.57268e-01) (1.32414e+00) Observations 360 139 499 Number of id 179 67 246 Hansen test 0.940 530 0.222 AR(1) 0.534 0.020 0.392 AR(2) 0.827 0.530 0.438 EU-17 CEE – 11 EU-28 LD.consumerloans -0.54** -0.02 -0.55** (2.57678e-01) (2.97935e-01) (2.53084e-01) ROA -0.43 2.24 -0.22 (2.73546e-01) (1.87547e+00) (5.40807e-01) netloanstodep 0.02 0.12 0.16 (4.94880e-02) (9.98504e-02) (2.02007e-01) L.GDP -0.06 3.19** -0.50 (8.36457e-02) (1.57543e+00) (4.08729e-01) L.CR5 -0.05 -0.08 -0.87 (1.09140e-01) (3.87710e-01) (7.37051e-01) D.ircons -0.29 0.17 0.15 (9.53567e-01) (6.99459e-01) (2.37431e+00) Observations 360 139 499 Number of id 179 67 246 Hansen test 0.357 0.502 0.129 AR(1) 0.746 0.953 0.938 AR(2) 0.365 0.955 0.925 EU-17 CEE – 11 EU-28 LD.consumerloans -0.75** -0.06 -0.68* (3.07682e-01) (3.76406e-01) (3.70997e-01) ROA -0.40 2.49 -0.74 (6.86296e-01) (2.41038e+00) (9.89826e-01) netloanstodep 0.22 0.12 0.31 (2.82448e-01) (1.15004e-01) (3.06207e-01) L.GDP -0.60 2.51** -0.50 (5.90073e-01) (1.05672e+00) (4.56786e-01) L.HHI -283.09 -59.72 -274.36 (2.68411e+02) (2.18336e+02) (2.92636e+02) D.ircons -2.36 0.38 1.96 (6.22548e+00) (9.90283e-01) (2.98779e+00) Observations 360 120 480 Number of id 179 67 246 Hansen test 0.344 0.429 0.594 AR(1) 0.390 0.707 0.635 AR(2) 0.852 0.735 0.828
Standard errors in parentheses, *** p<0.01, ** p<0.05, * p<0.1. Source: own calculations.
31NBP Working Paper No. 277
Appendix 2
29
Table A6: Empirical Results of two Models: Corporate loans EU-17 CEE – 11 EU-28
VARIABLES D.lcorporateloans D.lcorporateloans D.lcorporateloans LD.corporateloans -0.62* 0.07 -0.31 (3.19966e-01) (3.67630e-01) (2.63924e-01) ROE 0.00 -0.01 -0.04 (1.60679e-02) (7.07260e-03) (3.52314e-02) netloanstodep 0.05* 0.03 -0.01 (2.54954e-02) (1.95692e-01) (7.05653e-02) L.GDP 0.09 -1.33 -0.03 (1.08317e-01) (9.12498e-01) (1.55964e-01) L.sfb 0.01 0.07 0.27 (2.79111e-02) (5.86197e-02) (4.05706e-01) L.la -2.99*** -0.49 -5.80 (1.09416e+00) (2.49203e+00) (3.85112e+00) LD.ircorpo 0.91 1.43** 1.89 (9.95409e-01) (6.67182e-01) (1.68582e+00) Observations 351 136 487 Number of id 175 66 241 Hansen test 0.344 0.429 0.594 AR(1) 0.390 0.707 0.635 AR(2) 0.852 0.735 0.828 EU-17 CEE – 11 EU-28 LD.corporateloans -0.23 -0.54*** -0.26 (2.84264e-01) (8.70331e-02) (2.87121e-01) tier1ratio -0.20* -0.05 -0.14 (1.18986e-01) (4.10116e-02) (1.27336e-01) ROA 0.24 0.05 0.40 (2.36893e-01) (9.53069e-02) (2.55986e-01) netloanstodepstfund 0.02 0.03 0.05 (2.93113e-02) (3.83076e-02) (3.32648e-02) L.GDP -0.10 -0.11 -0.26* (1.06049e-01) (2.82290e-01) (1.52215e-01) L.CR5 -0.18 -0.11 -0.39* (2.88757e-01) (1.53148e-01) (2.28522e-01) LD.ircorpo 0.50 0.29 0.22 (8.51780e-01) (2.56049e-01) (7.60754e-01) Observations 229 71 300 Number of id 109 42 151 Hansen test 0.357 0.502 0.129 AR(1) 0.746 0.953 0.938 AR(2) 0.365 0.955 0.925 EU-17 CEE – 11 EU-28 LD.corporateloans -0.19 -0.53*** -0.16 (2.49210e-01) (5.15278e-02) (2.31561e-01) tier1ratio -0.19** -0.04 -0.16** (8.75232e-02) (3.62208e-02) (7.87977e-02) ROA 0.44 0.08 0.96 (6.03147e-01) (7.68405e-02) (6.32247e-01) netloanstodepstfund 0.03 0.05 0.02 (2.67117e-02) (3.53174e-02) (4.99490e-02) L.GDP -0.20** -0.15 -0.05 (8.81699e-02) (1.24274e-01) (1.77427e-01) L.HHI -4.62 -8.72 4.51 (1.21698e+01) (1.62958e+01) (1.85869e+01) LD.ircorpo -1.25** 0.11 -0.89 (6.25619e-01) (1.05390e-01) (5.77086e-01) Observations 229 68 297 Number of id 109 42 151 Hansen test 0.940 530 0.222 AR(1) 0.534 0.020 0.392 AR(2) 0.827 0.530 0.438
Standard errors in parentheses,*** p<0.01, ** p<0.05, * p<0.1. Source: own calculations.
Narodowy Bank Polski32
30
Table A7: Empirical Results of two models: Total loans EU-17 CEE – 11 EU-28
VARIABLES D.lgrossloans D.lgrossloans D.lgrossloans LD.grossloans -0.51* 0.07 -0.61** (2.79950e-01) (3.25204e-01) (2.58678e-01) ROE 0.04 0.00 0.06 (4.80083e-02) (1.95914e-03) (3.99167e-02) netloanstodep 0.00 0.01 -0.00 (1.36766e-02) (1.89840e-02) (9.40971e-03) L.GDP -0.03 0.03 -0.06 (1.32900e-01) (7.44755e-02) (7.94682e-02) L.sfb 0.10** 0.00 0.09* (4.20071e-02) (6.38930e-03) (4.95354e-02) L.la -2.18*** -0.26 -1.77*** (6.15799e-01) (5.50173e-01) (6.37274e-01) LD.igross -0.13 0.03 -0.80 (1.48882e+00) (4.86746e-02) (1.02248e+00) Observations 2,401 129 2,530 Number of id 1,254 67 1,321 Hansen test 0.183 0.509 0.073 AR(1) 0.336 0.447 0.374 AR(2) 0.314 0.349 0.818 EU-17 CEE – 11 EU-28 LD.grossloans -0.47*** -0.58 -0.50*** (1.62405e-01) (6.08806e-01) (1.38929e-01) tier1ratio 0.13** -0.02 0.13** (5.69618e-02) (4.66995e-02) (5.95946e-02) ROA 0.86*** -0.01 0.68** (2.99752e-01) (1.69275e-02) (2.65909e-01) netloanstodep 0.01 -0.00 -0.01 (1.64458e-02) (2.71630e-03) (1.61698e-02) L.GDP 0.12*** -0.05 0.16*** (4.50476e-02) (1.14965e-01) (5.22925e-02) L.HHI 61.79*** -18.71 47.91 (1.54750e+01) (1.97821e+01) (3.06580e+01) LD.igross 1.30** 0.08 1.42* (5.76716e-01) (9.72535e-02) (7.78105e-01) Observations 1,387 76 1,463 Number of id 726 48 774 Hansen test 0.183 0.509 0.073 AR(1) 0.336 0.447 0.374 AR(2) 0.314 0.349 0.818 EU-17 CEE – 11 EU-28 LD.grossloans -0.37 -0.65 -0.26 (5.69517e-01) (7.87218e-01) (2.11948e-01) tier1ratio 0.08 -0.03 0.05 (6.92307e-02) (4.71329e-02) (3.82798e-02) ROA 0.60 0.00 0.22 (1.46236e+00) (2.02063e-02) (2.22895e-01) netloanstodep -0.01 -0.00 -0.02 (5.30211e-02) (2.93222e-03) (1.39352e-02) L.GDP 0.04 -0.03 0.07* (1.57202e-01) (8.72015e-02) (4.11462e-02) L.CR5 0.12 -0.05 -0.07 (6.43598e-01) (5.19892e-02) (1.00465e-01) D.igross 1.52 0.18 -0.62 (5.94620e+00) (2.32632e-01) (1.58725e+00) Observations 1,387 76 1,463 Number of id 726 48 774 Hansen test 0.183 0.509 0.073 AR(1) 0.336 0.447 0.374 AR(2) 0.314 0.349 0.818
Standard errors in parentheses,*** p<0.01, ** p<0.05, * p<0.1. Source: own calculations.
33NBP Working Paper No. 277
Appendix 2
31
Tab
le A
8: S
pear
man
’s r
ank
coef
ficie
nts f
or a
ll va
riab
les i
n th
e m
odel
for
EU
-28
| mortgloans irhome consumer ircons corporate ircorpo grossloans tier1ratio ROA ROE netloanstodep CR5 HHI sfb
-------------+------------------------------------------------------------------------------------------------------------------------------
mortgloans | 1.0000
irhome | 0.1144* 1.0000
consumerloans | 0.8206* 0.1327* 1.0000
ircons | -0.4372* 0.1958* -0.3077* 1.0000
corporateloans| 0.8118* 0.2259* 0.7954* -0.2824* 1.0000
ircorpo | -0.3658* 0.2796* -0.2227* 0.6419* -0.2036* 1.0000
grossloans | 0.9528* 0.1161* 0.8926* -0.4343* 0.8764* -0.3500* 1.0000
tier1ratio | -0.1512* 0.0085 -0.2165* -0.0570 -0.2445* -0.1285* -0.2210* 1.0000
ROA | -0.1828* -0.0647 -0.1163* -0.0045 -0.1312* -0.1290* -0.1735* 0.3550* 1.0000
ROE | 0.0222 -0.0387 0.0684 -0.0971* 0.0538 -0.2236* 0.0534 0.2063* 0.8418* 1.0000
netloanstodep | 0.2724* -0.1121* 0.1611* -0.2044* 0.1198* -0.0993* 0.2219* 0.0585 0.0949* 0.0945* 1.0000
CR5 | -0.2958* -0.3263* -0.2618* 0.1735* -0.2604* 0.0280 -0.3175* 0.1794* 0.1220* 0.0742 0.1976* 1.0000
HHI | -0.3132* -0.2755* -0.2840* 0.1803* -0.2551* 0.0729 -0.3353* 0.1953* 0.1056* 0.0463 0.1867* 0.9831* 1 .
0000
sfb | -0.4588* 0.2498* -0.3858* 0.4852* -0.3694* 0.3989* -0.5153* 0.2742* 0.1430* -0.0389 -0.0660 0.2001* 0.
2539* 1.0000
numbf | 0.0773 0.0868 -0.0400 -0.1394* 0.0708 -0.2508* 0.0363 0.2857* 0.0414 0.0723 0.1078* 0.3162* 0.
3696* 0.2917*
la | 0.9303* 0.1081* 0.8854* -0.4415* 0.8662* -0.3717* 0.9893* -0.2213* -0.1795* 0.0535 0.1268* -0.3425* -0.
3616* -0.5338*
mp | 0.6099* 0.2004* 0.6907* -0.0263 0.7121* 0.0255 0.6671* -0.0730 -0.0357 0.0778 0.1046* 0.0952* 0.
1199* -0.0504
GDP | 0.1521* 0.2128* 0.1995* 0.1817* 0.2182* 0.1991* 0.1628* -0.0895 -0.1067* -0.0554 -0.0099 -0.1422* -0.
1098* 0.2040*
| numbf la mp GDP
-------------+------------------------------------
numbf | 1.0000
la | 0.0235 1.0000
mp | 0.1767* 0.6619* 1.0000
GDP | 0.0613 0.1605* 0.2141* 1.0000
Sour
ce: o
wn
calc
ulat
ions
.
Narodowy Bank Polski34
32
Tab
le A
9: S
pear
man
’s r
ank
coef
ficie
nts f
or a
ll va
riab
les i
n th
e m
odel
for
CE
E-1
1 | mortgloans irhome consumer ircons corporate ircorpo grossloans tier1ratio ROA ROE netloanstodep CR5 HHI sfb
------------+------------------------------------------------------------------------------------------------------------------ -----------
- mortgloans | 1.0000
irhome | 0.1666 1.0000
consumerloans | 0.8119* 0.2139* 1.0000
ircons | -0.2743* 0.2884* -0.1913* 1.0000
corporateloans| 0.8061* 0.2672* 0.8045* -0.1793* 1.0000
ircorpo | 0.0605 0.8143* 0.0787 0.0569 0.1818* 1.0000
grossloans | 0.9240* 0.2219* 0.9079* -0.2604* 0.9298* 0.1260 1.0000
tier1ratio | 0.0358 -0.0271 -0.0863 0.2773* 0.0237 -0.1498 -0.0312 1.0000
ROA | 0.2871* -0.0460 0.3830* 0.1374 0.4665* -0.1422 0.4058* 0.3215* 1.0000
ROE | 0.2014* -0.0524 0.3549* 0.1731* 0.3896* -0.1523 0.3390* 0.2134* 0.9645* 1.0000
netloanstodep | 0.4732* 0.0078 0.3677* -0.1782* 0.4760* -0.0036 0.5134* -0.0146 0.1967* 0.1017 1.0000
CR5 | -0.3726* -0.5039* -0.4634* 0.1534 -0.3562* -0.5702* -0.4310* 0.3879* 0.1230 0.0837 -0.1640 1.0000
HHI | -0.3205* -0.4810* -0.4220* 0.0270 -0.2977* -0.5833* -0.3728* 0.3597* 0.1160 0.0684 -0.1340 0.9634* 1 .
0000
sfb | -0.3396* -0.3657* -0.4005* 0.1261 -0.4069* -0.2047* -0.4076* 0.2629* 0.0179 0.0082 -0.2510* 0.5593* 0.
4387* 1.0000
numbf | -0.3537* -0.3864* -0.4455* 0.0171 -0.3307* -0.4895* -0.4063* 0.2406* 0.0720 0.0421 -0.1426 0.7951* 0.
8485* 0.3901*
la | 0.9185* 0.2244* 0.9100* -0.2311* 0.9111* 0.0981 0.9880* -0.0109 0.3998* 0.3435* 0.4278* -0.4255* -0.
3699* -0.4143*
mp | 0.6742* 0.2358* 0.6121* -0.0242 0.7903* 0.0393 0.7429* 0.2409* 0.5414* 0.4424* 0.2537* -0.0048 0.
0398 -0.1942*
GDP | 0.0796 -0.0503 0.0922 -0.2672* 0.0747 0.0438 0.1108 -0.1777* -0.0475 -0.0269 0.0032 0.0634 0.
0505 0.1005
| numbf la mp GDP
-------------+------------------------------------
numbf | 1.0000
la | -0.3913* 1.0000
mp | 0.0342 0.7631* 1.0000
GDP | -0.0625 0.1100 0.0069 1.0000
Sour
ce: o
wn
calc
ulat
ions
.
35NBP Working Paper No. 277
Appendix 2
33
Tab
le A
10: S
pear
man
’s r
ank
coef
ficie
nts f
or a
ll va
riab
les i
n th
e m
odel
for
EU
-17
| mortgloans irhome consumer ircons corporate ircorpo grossloans tier1ratio ROA ROE netloanstodep CR5 HHI sfb
------------- +-----------------------------------------------------------------------------------------------------------------------------
- mortgloans | 1.0000
irhome | 0.4648* 1.0000
consumerloans | 0.7890* 0.3520* 1.0000
ircons | -0.1146* -0.0270 -0.0268 1.0000
corporateloans| 0.8289* 0.4807* 0.7660* -0.0678 1.0000
ircorpo | -0.2007* -0.0640 -0.0776 0.7080* -0.1320* 1.0000
grossloans | 0.9477* 0.4641* 0.8734* -0.0991 0.8959* -0.1854* 1.0000
tier1ratio | -0.0902 -0.0044 -0.1806* -0.2794* -0.2287* -0.2268* -0.1754* 1.0000
ROA | -0.1816* -0.1544* -0.1872* -0.2655* -0.2013* -0.2867* -0.2063* 0.3558* 1.0000
ROE | -0.0195 -0.0100 -0.0302 -0.2350* -0.0187 -0.2856* -0.0202 0.2087* 0.8079* 1.0000
netloanstodep | 0.1620* -0.1174* 0.0407 -0.1857* 0.0004 -0.0845 0.0632 0.0952 0.0957 0.0945 1.0000
CR5 | -0.1995* -0.3588* -0.1619* 0.0081 -0.1751* -0.0342 -0.2253* 0.0896 0.0595 0.0568 0.2523* 1.0000
HHI | -0.1961* -0.3382* -0.1722* 0.0146 -0.1621* -0.0095 -0.2272* 0.1227* 0.0568 0.0414 0.2665* 0.9812* 1 .
0000
sfb | -0.1016 0.0760 -0.1030 0.0293 -0.1307* 0.2027* -0.1749* 0.2988* 0.0635 -0.0225 0.1188* 0.0133 0.
0901 1.0000
numbf | 0.1588* 0.4739* 0.0277 -0.1313* 0.1724* -0.1153* 0.0913 0.3224* 0.0359 0.0658 0.1757* 0.2101* 0.
3024* 0.6148*
la | 0.8994* 0.4607* 0.8636* -0.0967 0.8798* -0.2028* 0.9798* -0.1942* -0.2244* -0.0285 -0.0606 -0.2697* -0.
2743* -0.2128*
mp | 0.7322* 0.2227* 0.7726* 0.0076 0.7634* 0.0204 0.8064* -0.1544* -0.2258* -0.0336 0.0709 0.1372* 0.1651* -0.0600
GDP | 0.2870* 0.2024* 0.3128* 0.1842* 0.3117* 0.1709* 0.3188* -0.0856 -0.1672* -0.0729 0.0089 -0.1922* -0.
1464* 0.1324*
| numbf la mp GDP
-------------+------------------------------------
numbf | 1.0000
la | 0.0464 1.0000
mp | 0.2173* 0.8017* 1.0000
GDP | 0.0678 0.3194* 0.2493* 1.0000
Sour
ce: o
wn
calc
ulat
ions
. ind
ivid
ual b
ank
stab
ility
mea
sure
.
Narodowy Bank Polski36

www.nbp.pl