Embed Size (px)
Citation preview

THE IMPACT OF LARGE CONSUMER UNIT SIZE ON
WATER AND SANITATION SERVICES
IN LOWER INCOME URBAN AREAS IN
SOUTH AFRICA
Report to the
Water Research Commission
by
Kim Lesley Walsh
on behalf of
Palmer Development Group
WRC Report No TT 371/1/08
December 2008

Obtainable from: Water Research Commission Private Bag X03 Gezina 0031
The publication of this report emanates from a project entitled The impact of large consumer unit size on access to water and sanitation services in lower income urban areas in South Africa (WRC Project No K5/1713).
DISCLAIMER
This report has been reviewed by the Water Research Commission (WRC) and
approved for publication. Approval does not signify that the contents necessarily reflect the views and policies of the WRC, nor does mention of trade names or commercial
products constitute endorsement or recommendation for use.
ISBN 978-1-77005-788-3 Set No 978-1-77005-789-0 Printed in the Republic of South Africa
The impact of large consumer unit size on access to water and sanitation services
i
Executive summary
Palmer Development Group (PDG) was appointed by the Water Research Commission (WRC) to conduct research into the impact of large consumer unit size on access to and affordability of water and sanitation services in lower income formal urban areas. The purpose of this research is to assess whether being a member of a large consumer unit, defined as more than eight people sharing a stand, results in inhibited access to water and sanitation services, and whether large consumer units find water and sanitation services to be unaffordable.
Methodology
The research was conducted in the City of Tshwane in Gauteng between June 2007 and March 2008. There were four components to the project: questionnaire-based interviews, focus group discussions, water diaries and analysis of actual consumption data.
Questionnaires
The bulk of the research was conducted using a semi-structured questionnaire. Questionnaires were administered face-to-face to 228 households in four low income areas in Tshwane, namely Mamelodi West, Atteridgeville, Mabopane and Ga-Rankuwa. Questionnaires were administered exclusively to large consumer units (more than eight people sharing a plot). As a result, the 228 households corresponded to 68 consumer units, because there was a high incidence of multiple households per plot on the consumer units targeted. Every household on the 68 plots was interviewed.
Focus groups
Focus group discussions were held to gain a qualitative understanding of the issues emerging from the household interviews. Two focus groups were held, with groups of about ten people each. The first focus group consisted of members of the main household in a large consumer unit. These are people who have tenants, and are responsible for managing the water and sanitation on the stand and paying the bill. The second focus group consisted of members of secondary households in large consumer units. These are people who occupy backyard rooms.
Water diaries
In order to provide a more nuanced understanding of the way in which water is used in Tshwane, learners in three schools in Atteridgeville were asked to fill in a water diary for a week. The diaries captured some information about the plot on which the learner lives, including the number and demographic profile of the people sharing the plot, the number of dwellings on the plot, and the water and sanitation facilities available to people living on that plot. But the main focus of the diaries was to capture information on the frequency of engagement in certain water use activities, and the volumes of water used. 156 learners filled in diaries, and 123 of these diaries were adequate for analysis.
Analysis of consumption data
Actual water consumption data from the billing records of the City of Tshwane (for Atteridgeville and Mamelodi West) and SWA (for Mabopane and Ga-Rankuwa) was obtained for the households surveyed. This allowed consumption data to be matched

The impact of large consumer unit size on access to water and sanitation services
ii
with information obtained from the questionnaires, such as consumer unit size and household income, in order to assess the affordability of water services. Consumption data was obtained for 58 of the 68 consumer units included in the study.
Description of the sample
Out of the 68 consumer units surveyed, 28 stands (or 41%) had nine people living on them. 12 stands had more than 12 people living on them.
Ten of the 68 consumer units (15%) shared a single dwelling on a plot. This suggests that while the phenomenon of large consumer units relates mostly to plots with multiple dwellings on them, large consumer units on plots with only a single dwelling should not be ignored.
On the multiple dwelling stands, it was most common to have three dwellings (a main dwelling and two backyard dwellings) or less. Only seven of the multiple dwelling stands surveyed (12%) had more than five dwellings on them.
166 out of the 228 dwellings surveyed were backyard dwellings. About a third of these were occupied by family members of the main dwelling, who pay no rent for this accommodation. The remaining two thirds were occupied by people who pay rent. 90% of those who pay rent are tenants, but 10% (11 households in total) are family members of the occupants of the main household.
The most common amount of rent paid for backyard accommodation was R200 per month, with the maximum amount being R350. There was no significant difference between the average amount of rent paid by family members and that paid by tenants. In 97% of cases, rent was considered to be for accommodation as well as for services such as water, sanitation and electricity.
The average number of people occupying backyard dwellings is lower than that in main dwellings. The average household size (defined in this study as number of people per dwelling) for main dwellings was 5 people, while for backyard dwellings it was between 2 and 3 people. A large proportion of the households made up of family members living in backyard rooms but paying no rent comprised only one person (21 out of the 50 such households surveyed, or 41%).
Access to water and sanitation
All of the households surveyed had access to water and sanitation in the yard where they live.
40% of those living in a single dwelling on a plot, and 32% of those in the main dwelling on a multiple dwelling plot, had an in-house tap. The remaining households used a tap in the yard. All of the multiple dwelling plots had a yard tap, so there were no cases where residents of secondary dwellings needed to use taps inside the main dwelling.
All of the households surveyed used a flush toilet. Most households (91%) used a toilet located outside their dwelling in the yard. Fifteen households said that they used a toilet inside their own dwelling, two of which were households living in backyard dwellings. There were five households who said that they used a toilet located inside another dwelling on the plot.
Facilities are shared with relatively large numbers of people (10 people per yard toilet, on average, and 9 people per yard tap).

The impact of large consumer unit size on access to water and sanitation services
iii
Although this was not picked up in the household questionnaires, some of the focus group responses indicate that there may be some circumstances in which landlords attempt to deny tenants access to services.
Although all the households surveyed had access to adequate sanitation, in the focus groups a view was expressed that sometimes residents do not like to use yard toilets at night, because there are rats, or they are scared of “thugs”. In this case, they stated that they use buckets during the night.
Affordability of water and sanitation
A widely accepted rule of thumb for assessing the affordability of water services to households is that the monthly bill for water and sanitation should be no more than 5% of total monthly income (Komives et al., 2005, p.41). In order to assess affordability, it is thus necessary to have an understanding of both levels of water consumption and of levels of income available to pay for that consumption.
Levels of water consumption by the consumer units surveyed
The average water consumption for the 58 stands for which data was obtained was 25.55 kl per month. This translates to 82 litres per person per day, on average. Almost half of the consumer units surveyed (28 out of 58) used 70 litres per person per day or less. This corresponds with the WHO’s estimates of consumption by households with a yard tap, if toilet flushing is factored in at two flushes of 10 litres per person per day. A further 19 consumer units (33% of those surveyed) use more than 70 but less than 100 litres per person per day, while 11 consumer units (19%) use more than 100 litres a day, which is more in line with households with in-house water than with water in the yard.
In sum, levels of water consumption per capita per day for the consumer units surveyed were fairly high, in line with consumption in middle income areas rather than those in low income areas.
Analysis of data from the water diaries showed that the relatively high levels of consumption observed in the sample group can be explained by a realistic set of water use activities that includes drinking, washing hands, bathing, flushing the toilet, preparing and cooking food, washing dishes, washing clothes, watering the garden, spraying the yard for dust and washing cars.
For large consumer units, the analysis suggests that personal water use activities, undertaken every day by each individual making up the consumer unit, are strong drivers of consumption. The water diaries indicated that between 15 and 24 litres of water was used by each person for bathing every day. This is relatively high, when compared to the minimum amount of 7 litres recommended by the literature. This appears to be a key factor driving the high levels of consumption.
Income generated by consumer unit as a whole
The average income per consumer unit was R5 360 for all of the consumer units surveyed.
Average income per consumer unit differed significantly depending on whether the consumer unit had one or more dwellings on it, and depending on whether the occupants of backyard dwellings paid rent or not. The presence of backyard dwellers that pay rent significantly increases the total income of the consumer unit.
The impact of large consumer unit size on access to water and sanitation services
iv
Income generated by the individual households making up the consumer unit
The average monthly household income differed significantly for households of different types. For households occupying a single dwelling on a plot, monthly income was R4 323 on average. Recall, however, that these households all comprised 9 or 10 people.
On multiple dwelling plots, households in main dwellings earned R2 401 on average. About 17% of this income is income from rent. Households in backyard dwellings paying rent (both family and tenants) earned about R2 000 on average, while households in backyard dwellings paying no rent earned only about R655 on average.
Who pays for water and sanitation?
On all of the multiple dwelling consumer units surveyed, the water and sanitation bill was paid by the residents of the main household on the plot.
For the majority of backyard residents who pay rent (92%), payment for water is assumed to be included in the rent. Only five households renting backyard rooms said that they paid separately for water, and they said that they paid a flat amount every month. Only two households in backyard rooms who paid no rent paid for water. They said that they paid a different amount every month.
So in the vast majority of cases, the burden of the water and sanitation bill falls on the main household (or on the single household in the case of plots with only one dwelling on them), and must be paid out of the income of that household, including rent.
Out of the 68 consumer units surveyed, 57 said that they paid the bill regularly, 10 paid sometimes and one consumer unit said that they never paid their bill1. Out of the 67 consumer units who did pay their bills, only 38% (26 consumer units) pay the amount that appears on the bill. The remaining 41 consumer units pay either the amount that they can afford (39 consumer units) or the same amount every month (2 consumer units). On average, those who say that they pay only what they can afford pay about half of the amount on the bill.
Affordability of water
On plots with only a single dwelling, affordability was assessed by dividing the water and sanitation bill (calculated based on the level of water consumption) by the combined income of all people sharing the dwelling. On plots with multiple dwellings, affordability was assessed by dividing the water and sanitation bill by the income of all people sharing the main dwelling, including rental income received from households in backyard rooms on the plot.
There were 51 consumer units for which both water consumption data and income data for the single or main household was available. Of these, 39 (or 76%) receive a water and sanitation bill that is in excess of 5% of their monthly income. This indicates that affordability is a problem for the majority of the households for which data was available.
Note that, as of 1 July 2007, the City of Tshwane no longer offers 6 kl of free basic water to every accountholder. Free basic water is now provided only to those who register as indigent. Indigent households receive 12 kl of water free every month, but must agree to a water restriction device being fitted onto their taps. In order to qualify as indigent, a household must have a combined income of no more than two state old age pensions, which equates to about R1 700 per month. Note that the Social Package
1 This consumer unit said that they were unemployed and had an arrangement with the council.
The impact of large consumer unit size on access to water and sanitation services
v
Policy does not clearly define the term “household”. It is assumed here that this is the combined income of the family occupying the main household on a multiple dwelling stand.
Although the household questionnaires did not ask whether households were registered as indigent, there are 26 main households that might qualify. If these households are excluded from the affordability analysis, then 22 of the remaining 32 single or main households receive a bill that is in excess of 5% of their income. In other words, 43% of the single or main households for whom data was available receive a water and sanitation bill that is in excess of 5% of their monthly income, even taking possible indigent registration into account.
Ability to control water consumption
The first step in controlling water consumption is to know how much water is being used. When asked about estimating water consumption by the whole stand, only two of the 68 single or main households on the stands surveyed said that they could estimate this consumption.
Comments from the focus group discussions indicated that landlords cannot control the consumption of services by tenants, who perceive the fact that they pay rent to mean that their access to services cannot be denied or limited (“when you advise him not to waste water he gets angry and says ‘I pay the rent’”. )
Other costs associated with paying the water and sanitation bill
Out of the 68 consumer units surveyed, only one said that they paid for water electronically, with the remainder making payments in cash. This means that they have to travel to Council offices (71% of respondents) or other locations to pay the bill. Most consumers use a taxi to go to pay their bill (67%), and the remainder walk. The average cost of the taxi journey for those who go by taxi was R10, with the maximum cost reported being R18. These costs are also a factor contributing to the affordability or otherwise of water and sanitation for lower income households.
Implications for policy
This research suggests that large consumer units cannot be viewed simply as a homogenous group. Different types of consumer units, and different households making up those consumer units, face different challenges with respect to water and sanitation. Nuanced policy approaches will be necessary to help to alleviate these differing challenges. Such policy approaches might include considering programmes to upgrade backyard accommodation, and meter such accommodation separately; increases in the amount of Free Basic Water allocated to large consumer units; revisions to the rising block tariff structures, or consideration of alternative tariff approaches; and education programmes around the wise use of water. Indigent policies should also be reviewed to take large consumer unit size into consideration.


Table of Contents
Executive summary ....................................................................................................... i
1 Introduction ....................................................................................................... 1
2 Methodology ...................................................................................................... 2 2.1 Selection of communities ........................................................................ 2 2.2 Quantitative study of large consumer units ............................................. 3 2.3 Qualitative focus group interviews .......................................................... 4 2.4 Water diaries ........................................................................................... 5 2.5 Analysis of water consumption data ........................................................ 7
3 Description of the sample ................................................................................ 7 3.1 Consumer unit size ................................................................................. 8 3.2 Household type ..................................................................................... 10 3.3 Household size ...................................................................................... 11 3.4 Concluding comments ........................................................................... 12
4 Access to water and sanitation ..................................................................... 12 4.1 Access to water ..................................................................................... 13 4.2 Access to sanitation .............................................................................. 13 4.3 Concluding comments ........................................................................... 14
5 Affordability of water and sanitation ............................................................. 14 5.1 Levels of water consumption ................................................................. 15
5.1.1 Water consumption and time of year ................................15 5.1.2 Water consumption and CU size …………………………………16 5.1.3 Water consumption and income …………………………………17 5.1.4 Theoretical discussion of water consumption …………………18 5.1.5 Water consumption activities ……………………………………19
5.2 Levels of income .............................................................................. .....27 5.2.1 Income generated by consumer units ……………………………28 5.2.2 Income generated by households ………………………………29
5.3 Who pays for water and sanitation? ...................................................... 30 5.4 Water and sanitation tariffs in the City of Tshwane ............................... 30 5.5 The cost of water and sanitation ........................................................... 32 5.6 The affordability of water and sanitation ............................................... 32 5.7 Other costs associated with the water and sanitation bill ...................... 33 5.8 Ability to control water consumption ...................................................... 34 5.9 Concluding comments ........................................................................... 35

6 Conclusions .................................................................................................... 36 6.1 Access to water and sanitation facilities ................................................ 36 6.2 Affordability of water and sanitation ...................................................... 36 6.3 Implications for policy ............................................................................ 37
References
Appendix 1: Description of different household types

The impact of large consumer unit size on access to water and sanitation services
1
1 Introduction
Most socio-economic research is conducted with the household as the primary unit. For example, figures on access to services published by Statistics South Africa (StatsSA) are presented in terms of households. However, the unit with which the municipality interacts is typically not a household. The unit to which the municipality provides services may comprise several households. In this study, this unit is termed a “consumer unit”.
A research study conducted in Johannesburg in 2006 indicated that consumer units are frequently large in poorer urban areas (CoJ, 2007). This is due in part to large households and in part to the fact that consumer units frequently comprise more than one household. The Strategic Framework for Water Services recognises this phenomenon, and specifically identifies “the equitable treatment of large households and multiple households sharing one connection” (DWAF, 2003, p.29) as a challenge for water services providers.
The phenomenon of large consumer units poses two possible problems with regard to the supply of water and sanitation.
The first relates to Free Basic Water. The recommended free allocation of water is either 6 kl per household per month or 25 litres per person per day. This is intended to provide an essential amount of water and sanitation to each person. For reasons of practicality, most municipalities choose to provide a standard amount of Free Basic Water (typically 6 kl) to each accountholder. If consumer units are large, this free allocation may translate into less than 25 litres per person per day, and thus be insufficient to provide an essential amount of water to each person.
The second possible problem relates to affordability of services. Block tariffs for water supply and often sanitation are premised on the assumption that poorer households can restrict their consumption of these services, and thus pay less. However, large consumer units are likely to be less able to restrict consumption, and this has implications for the affordability of water services.
This report presents the key findings of a research study conducted in lower income formal areas of the City of Tshwane during 2007 and 2008, as well as the results of analysis conducted on the findings. The intention of this research was to gain an understanding of access by large consumer units to water and sanitation services, and the affordability of these services. The key research questions were:
Does membership of a large consumer unit result in inhibited access to water and sanitation services?
Are water and sanitation services unaffordable for the members of large consumer units?
This research comprised four components: questionnaire-based interviews of households, focus group discussions, analysis of actual consumption data and water diaries. The report is structured largely around the findings from the household interviews, with the findings from the other research components used to provide additional insights where relevant.
Note that this report is one of several outputs from the research study. This is a research report, and is quite dense, containing a lot of the data from the various research components. In addition, a briefer research paper was produced, which
The impact of large consumer unit size on access to water and sanitation services
2
outlines key findings only. A toolkit, containing all of the methodological tools used in the study, is also available for municipalities wishing to conduct similar research.
The report is structured as follows:
The methodology followed is described in Section 2.
Section 3 provides an overview of the survey sample, focussing on the size and composition (in terms of numbers of households) of the consumer units interviewed.
Section 4 presents findings regarding access to water and sanitation by the consumer units, and their constituent households, interviewed.
Section 5 assesses the affordability of water to the consumer units surveyed. This section looks at the volumes of water consumed, and the income available to the consumer units. Affordability is assessed by calculating the cost of water as a percentage of monthly income.
Section 6 presents conclusions and recommendations emerging from the research.
Note that there is an appendix at the end of the report that presents additional tables containing demographic data gathered during the research, which is not directly relevant to the research questions examined in this study, but may be of interest to anyone studying large consumer units.
2 Methodology
The methodology used for conducting this study is described below.
2.1 Selection of communities In order to select communities for inclusion in the study, the Social Surveys community segmentation model was applied. This model enables the clustering of South African communities into groups of communities with similar profiles based on Census 2001 data complemented and updated with data from research projects carried out by Social Surveys.
The community segmentation model was used to identify a list of low income areas in the City of Tshwane, with low income defined as an average monthly household income of less than R 3 500 a month. 171 low income communities were identified.
Four communities were then selected from this list, with the intention of obtaining a geographical spread of communities. The communities were selected in consultation with the WRC and with the City of Tshwane.
The communities were selected were:
Mamelodi West
Ga-Rankuwa Zone 2
Atteridgeville
Mabopane Zone 6

The impact of large consumer unit size on access to water and sanitation services
3
2.2 Quantitative study of large consumer units The bulk of the data collected for the study was collected via face-to-face, questionnaire based interviews of households in the selected areas. The method for collecting this data is detailed below.
Selection of households
The intention of this survey was not to interview a representative sample of consumer units, but rather to interview only those consumer units with more than eight people living on them.
Fieldworker teams entered the selected communities from different entry points working towards the centre of the community. Consumer units in the sampled community were visited based on a sampling frame and a set of filter questions was asked to assess their eligibility for this study. Only those consumer units comprising more than eight people were interviewed.
For every large consumer unit identified, the following interviews were conducted:
Stand interview: this was conducted with the person on the stand regarded as the most informed about the water and sanitation (a resident of the main dwelling in the case of multiple dwelling stands).
Dwelling interview: this was conducted with a person in each of the dwellings on the stand (once again the respondent was the person most informed about the water and sanitation situation within the dwelling).
Note that several call-backs were sometimes necessary in order to obtain interviews with a member of each dwelling on the stand.
Across the four communities, 68 stand interviews and 228 dwelling interviews were conducted. These interviews were distributed between the communities surveyed as indicated in the table below.
Table 1: Number of stands and dwellings interviewed by community
Area Number of stands interviewed
Number of dwellings interviewed
Ga-Rankuwa zone 2 23 65
Mabopane zone 6 14 49
Mamelodi West 18 55
Atteridgeville 13 59
Total 68 228
Fieldwork process
PDG was responsible for designing the questionnaire instruments required for this study, with support from Social Surveys. In designing the questionnaire, a review of previous research undertaken in similar areas of study was conducted. This proved useful in ensuring that the appropriate range and level of questions were asked, but many of the questions were new and specific to this study.
Social Surveys were responsible for recruiting and training the interviewers for the purpose of the study. All interviewers had at least a Grade 12 certificate, appropriate language skills as well as experience in household surveys. Interviewers were all

The impact of large consumer unit size on access to water and sanitation services
4
otherwise unemployed, and received training from Social Surveys in interview techniques. A pilot stage was included in the study in order to test the questionnaire instruments, household definition as well as interview skills.
As interviews were being completed, quality control mechanisms were put in place to ensure that data was accurate. This included back-checking of a portion of the interviews to ensure consistency and accuracy of the data. Field Managers and Field Supervisors were in place to monitor fieldwork progress, institute quality control mechanisms, check questionnaires and ensure that the correct household filtering procedures were followed. These mechanisms ensured that fieldwork was quality controlled and that proper data collection procedures were followed.
Once the completed interviews were quality controlled, data was captured by experienced data capturers who were familiarized with the objectives of the surveys and the contents of the questionnaires prior to data capture. This enabled them to identify and query invalid responses on questionnaires during the capturing process. Once data collection commenced, data was entered on a rolling basis as questionnaires were being checked and submitted. Each questionnaire was given a record number that was used as a unique identifier in the database. Data was then cleaned by a statistician with a thorough understanding of the research objectives and the contents of the questionnaire, using SPSS.
2.3 Qualitative focus group interviews In order to gain a deeper understanding of some of the key issues observed through the quantitative study, two focus group interviews were held with people living in the communities interviewed in the survey.
One focus group was undertaken in Atteridgeville and the other in Mamelodi. The former consisted of people living in backyard shacks on plots with multiple dwellings. The latter consisted of people living in the main dwelling on a plot with multiple dwellings, or in a single dwelling on a plot with more than eight people.
The moderators
Two skilled and experienced discussion group moderators from Social Surveys moderated the focus group discussions. Both moderators were thoroughly briefed and trained with regard to the objectives of the focus group discussions as well as with regard to the objectives of the study as a whole.
Selection of focus group participants
Participants in the focus group discussions were randomly recruited from the relevant communities.
In accordance with standard practice for focus group discussions, participants were refunded for their transport costs to and from the venue and each received a cash amount of R100.
The focus group discussions
Moderators used discussion guides to guide them throughout the moderation process. The use of discussion guides ensures a systematic and uniform approach, minimizes variation between groups and improves comparability of findings. The focus throughout the moderation process was on probing rather than leading questions.

The impact of large consumer unit size on access to water and sanitation services
5
The subject matter addressed in the focus groups included access to water, costs and ability to pay for water services, water sharing between the main and secondary dwelling, where applicable and maintenance.
The focus group discussions were conducted within the communities and took approximately two and a half to three hours long.
Focus groups were conducted in the vernacular and were tape recorded. Recordings were transcribed verbatim by independent transcribers who are not part of the Social Surveys research team.
2.4 Water diaries The intention of the water diaries component of the research was to gain qualitative insight into how low income households use water. It was decided to ask school learners to complete the diaries, as the activity could then be extended to include an educational component.
The water diaries were designed by PDG and Quba, with the intention of making them colourful, interesting and enjoyable for the learners to complete. The diaries incorporated the use of stickers. Each learner was equipped with a diary and a set of stickers. The learners were asked to map the plot on which they live indicating the number and location of water-related facilities such as taps, baths, showers, toilets etc. For a period of one week, the learners then recorded how many times a day various water-consumption activities were undertaken by members of their household. Once a week, learners were also asked to measure how much water was used for each activity. Note that this water measurement activity was included in the methodology at the request of the teachers involved in the study, as measurement is part of the syllabus for Grade 6.
Selection of schools for involvement in the water diaries study
Data was obtained from the Gauteng Department of Education on the locations and contact details of thirty-seven primary schools located in the communities selected for inclusion in this study. Since data was received from the Gauteng Education Department, this list included schools in Atteridgeville and Mamelodi West only. These schools were contacted via fax, inviting their participation in the water diaries study.
Grade 6 was deemed the appropriate age group for targeting this assignment because these learners would be old enough to be able to complete the diaries and it was felt that working with stickers to complete the diaries would be fun and interesting for learners of this age. A total of 13 schools responded, of which three were selected to participate in the water diaries project. The selection of these three was based on:
Grade 6 classes which had no repeating students
Classes with a teacher to student ratio of less than 40
The schools selected were Isaac More Primary, Marematlou Primary and Seaparankwe Primary. All three schools are located in Atteridgeville.
Communication with the schools and involvement of the teachers
A workshop was held between Social Surveys, PDG and the Grade 6 teachers at the three schools. At this workshop the teachers were introduced to the aims of the study. They provided comments on a draft copy of the water dairy. The teachers suggested the inclusion of a measurement component in the water diary, as this is in the Grade 6 syllabus.

The impact of large consumer unit size on access to water and sanitation services
6
Introductory session in schools
An introductory session was held by Social Surveys fieldworkers at each of the selected schools. At this session the researchers introduced learners to the project, conducted a brief educational session on water in South Africa and the water treatment process, and trained the learners on how to collect and record the data needed. The latter involved:
Building a “picture” of the plot where they live, using the stickers provided.
Preparing the tables for each water use activity, again using stickers.
Instructing the learners on how to complete the tables on a daily basis.
Training the learners on how to measure the amount of water used for various activities.
It was anticipated that these sessions would require two researchers to spend half a day at each school. However, it was found that the learners needed quite a lot of assistance in setting their diaries up. This required four researchers to spend almost a full day at each school.
Completion of the dairies
The learners completed the diaries during the week of 25 February to 2 March 2008. The class teacher was asked to check the diaries briefly each day to ensure that the learners completed them correctly. In practice, some of the teachers checked the diaries more seriously than others; one of the teachers signed the diaries every day.
Diary collection and data cleaning
The diaries were collected at the end of the week, and the data was captured and cleaned by Social Surveys.
In total, 156 diaries were collected. Thirty-three of the diaries were rejected during editing as too much information was missing or information appeared incorrect (for instance the information on the stand page contained information dramatically different from the information in the remainder of the diary).
Note that capturing and cleaning the data from the diaries proved an onerous process and some interpretation was required by the data capturers in some instances.
Social Surveys were asked to score the diaries on a scale of 1 to 5, with 1 being “very poorly completed (lots of information missing or poorly filled in)” and 5 being “very well completed”. The frequency distribution of these scores is shown in the table below.
Table 2: Frequency distribution of scores given to diaries
Score Frequency Percentage 1 6 5%
2 20 16%
3 50 41%
4 29 23%
5 18 15%
In general, the diaries were completed relatively well, with 79% of them scored as average or better. The average score was 3.3.

The impact of large consumer unit size on access to water and sanitation services
7
Follow up session in schools
Once the data obtained from the water diaries was analysed, a follow up session was held with the schools. At this session, the main findings of the diary analysis were presented to the learners and a brief discussion on wise use of water and ways of saving water was held. This session was intended to consolidate the learning component of the water diary study.
A winning learner and runner-up was identified at each school, based on Social Surveys assessment of how well the diaries had been completed. These students were awarded CNA vouchers. In addition, each learner received a certificate indicating that they had been involved in the study, and a badge.
The learners were very responsive, and pleased to receive feedback on the work that they had done.
Follow up lunch with teachers
The success of the water diaries relied to a large extent on the participation and support of the teachers involved. In order to express appreciation and to obtain feedback from the teachers on the diary process, a lunch was held to which the teachers were invited.
The teachers stated that checking the diaries had been time consuming, but that they felt that they themselves had learned about careful use of water through the water diaries process. At one school, Isaac More, the learners involved in the water diaries taught other learners at the school about what they had learned about using water carefully. This was very positive feedback, and indicated that the learning component of the water diaries research had been successful.
2.5 Analysis of water consumption data Actual water consumption data was obtained for the households surveyed from the billing databases of the City of Tshwane (for Atteridgeville and Mamelodi West) and SWA (for Mabopane and Ga-Rankuwa). This allowed consumption data to be matched with information obtained from the questionnaires, such as consumer unit size and household income. A desktop analysis was conducted on this data.
3 Description of the sample
As discussed in Section 2, questionnaire-based interviews were conducted in four areas in Tshwane. A total of 68 stands and 228 households were interviewed. Note that in this study the term household is used to refer to a group of people sharing a dwelling.
Ten out of the 68 stands surveyed (15%) were single dwelling stands. This suggests that while the phenomenon of large consumer units relates mostly to plots with multiple dwellings on them, large consumer units on plots with only a single dwelling should not be ignored.

The impact of large consumer unit size on access to water and sanitation services
8
Table 3: Prevalence of single dwelling stands by area
Ga-Rankuwa Zone 2
Mabopane Zone 6
Mamelodi West Atteridgeville Total
Number of stands 23 14 18 13 68
Single dwelling stand 21.7% 0.0% 16.7% 15.4% 14.7%
Multiple dwelling stand 78.3% 100.0% 83.3% 84.6% 85.3%
The mix of single and multiple dwelling consumer units differs from settlement to settlement.
The figure below shows the number of dwellings on the stands surveyed.
0
2
4
6
8
10
12
14
16
18
20
1 2 3 4 5 6 7 8 9
Number of dwellings per stand
Nu
mb
er o
f st
and
s
Single dw elling stands
Multiple dw ellings stands
Figure 1: Frequency distribution of number of dwellings per stand (n = 68)
As already mentioned, 10 of the stands had only a single dwelling. On the multiple dwelling stands, it was most common to have three dwellings (a main dwelling and two backyard dwellings) or less. Only seven of the multiple dwelling stands surveyed (12%) had more than five dwellings on them.
The average number of dwellings per plot is larger for those consumer units where at least some (if not all) of the residents of backyard dwellings pay rent to the residents of the main dwelling. The average number of backyard dwellings per plot for those consumer units where some backyard tenants paid rent was 3, while the average number for those consumer units where backyard tenants paid no rent was 2. All of the seven stands with more than five dwellings on them were stands occupied by consumer units with some backyard residents paying rent. Recall however that there were no stands interviewed with more than eight backyard dwellings on them. So the landlords interviewed for this study are thus all operating on a relatively small scale.
3.1 Consumer unit size The figure below is a frequency distribution of the consumer unit sizes (number of people per stand) of the stands surveyed.

The impact of large consumer unit size on access to water and sanitation services
9
0
5
10
15
20
25
30
7 8 9 10 11 12 13 14 15 16 17 18 19 20 21 22 23 24 25 26 27 28 29 30
Number of people per stand
Nu
mb
er o
f st
and
s
Single dw elling stands
Multiple dw elling stands
Figure 2: Frequency distribution of number of people per stand (n = 68)
Note that although the study was intended to focus on consumer units larger than 8 people, there was one consumer unit interviewed that consisted of 7 people and two that consisted of 8 people. These consumer units were left in the study, as they were still considered relatively large.
Most of the stands surveyed (28 stands or 41%) had nine people living on them. Only 12 stands had more than 12 people living on them. So most large consumer units comprise between nine and twelve people.
The figure below shows the relationship between number of people per stand and number of dwellings per stand. The diamonds in the figure show the number of people on each stand surveyed. The bars in the figure show the average number of people on stands with different number of dwellings. The figure thus gives an indication of the spread of consumer unit sizes on stands with different numbers of dwellings. So, for example, stands with 9 dwellings on them had between 20 and 28 people per stand, with an average of 24 people per stand.
-
5
10
15
20
25
30
35
1 2 3 4 5 6 7 8 9
Number of dwellings on stand
Ave
rag
e n
um
ber
of
peo
ple
on
st
and
Figure 3: Number of people per stand on stands with different numbers of dwellings (n = 68)
As expected, the number of people on a stand increases as the number of dwellings on the stand increases. However, this increase is not linear. It must be borne in mind that

The impact of large consumer unit size on access to water and sanitation services
10
this survey focussed exclusively on large consumer units. So the numbers of people on stands with only a few dwellings are not likely to be representative of the community in general2.
3.2 Household type Recall that in this study the term household is used to refer to people sharing a dwelling. For the purposes of analysis, it is useful to distinguish between several household types:
Single household: a group of people occupying a single dwelling on a plot with no other dwellings on it
Main household: a group of people occupying the main dwelling on a plot with several dwellings on it.
Secondary or backyard household, family not paying rent: a group of people, at least one of whom is related to the occupants of the main dwelling, occupying a backyard dwelling on a plot with several dwellings on it, and paying no rent to the occupants of the main dwelling.
Secondary or backyard household, family paying rent: a group of people, at least one of whom is related to the occupants of the main dwelling, occupying a backyard dwelling on a plot with several dwellings on it, and paying rent to the occupants of the main dwelling.
Secondary or backyard household, tenants: a group of people who are not related to the occupants of the main dwelling, occupying a backyard dwelling on a plot with several dwellings on it, and paying rent to the occupants of the main dwelling.
The prevalence of these household types in the study sample is shown in the table below.
Table 4: Prevalence of household types in study sample
Single household
Main household
Secondary household: family not
paying rent
Secondary household:
family paying rent
Secondary household:
tenants Total
Number of households 10 57 50 11 100 228
% of secondary households
31% 7% 62%
Of the 50 backyard households that are family of the main dwelling but pay no rent, two said that they co-owned the property together with occupants of the main household. Most of the family members not paying rent (40 of the 50 households) said that they did not pay rent because they were family members of the main household. The only other reason given in some cases was that they were unemployed.
2 In other words, 9 is not the average number of people living on a stand in Tshwane with one dwelling on
it. This average for this sample is likely to be higher than the average for Tshwane in general, due to the fact that the sample for this study consisted exclusively of large consumer units.

The impact of large consumer unit size on access to water and sanitation services
11
The average amount of rent paid per month did not appear to differ significantly between family and tenants living in backyard rooms. The average for family was R197 per month, and the average for tenants was R195. The most common amount paid for both household types was R200 per month, and the maximum for both household types was R350 per month.
In 97% of the backyard households who pay rent, rent included both accommodation and services. Only two households stated that rent was for accommodation only.
3.3 Household size The figure below is a frequency distribution of the household sizes, or numbers of people per dwelling, for the dwellings surveyed.
0
10
20
30
40
50
60
1 2 3 4 5 6 7 8 9 10
Number of people per dwelling
Nu
mb
er o
f d
wel
ling
s
Multiple dw ellings
Single dw elling
Figure 4: Frequency distribution of number of people per dwelling (n = 228)
76% of the dwellings surveyed (173 out of 228 dwellings) had four or fewer people living in them. The average household size for all of the dwellings surveyed was thus 3.4 people. All of the dwellings on multiple dwelling plots had eight or fewer people living in them.
Household size differs for different household types. Most significantly, the average household size for secondary (backyard) dwellings is lower than that for main dwellings. On average, the size of the main dwellings surveyed is 4.7 people, while the size of all secondary dwellings is 2.6.
Table 5: Average number of people per dwelling in different dwelling types
Single dwelling
Main dwelling
Secondary dwelling
occupied by family not
paying rent
Secondary dwelling
occupied by family paying
rent
Secondary dwelling
occupied by tenants
Number of dwellings 10 57 50 11 100
Average number of people per dwelling
9.2 4.7 2.3 3.6 2.6
The impact of large consumer unit size on access to water and sanitation services
12
Note that the high number of people in single dwellings is a function of the research methodology3.
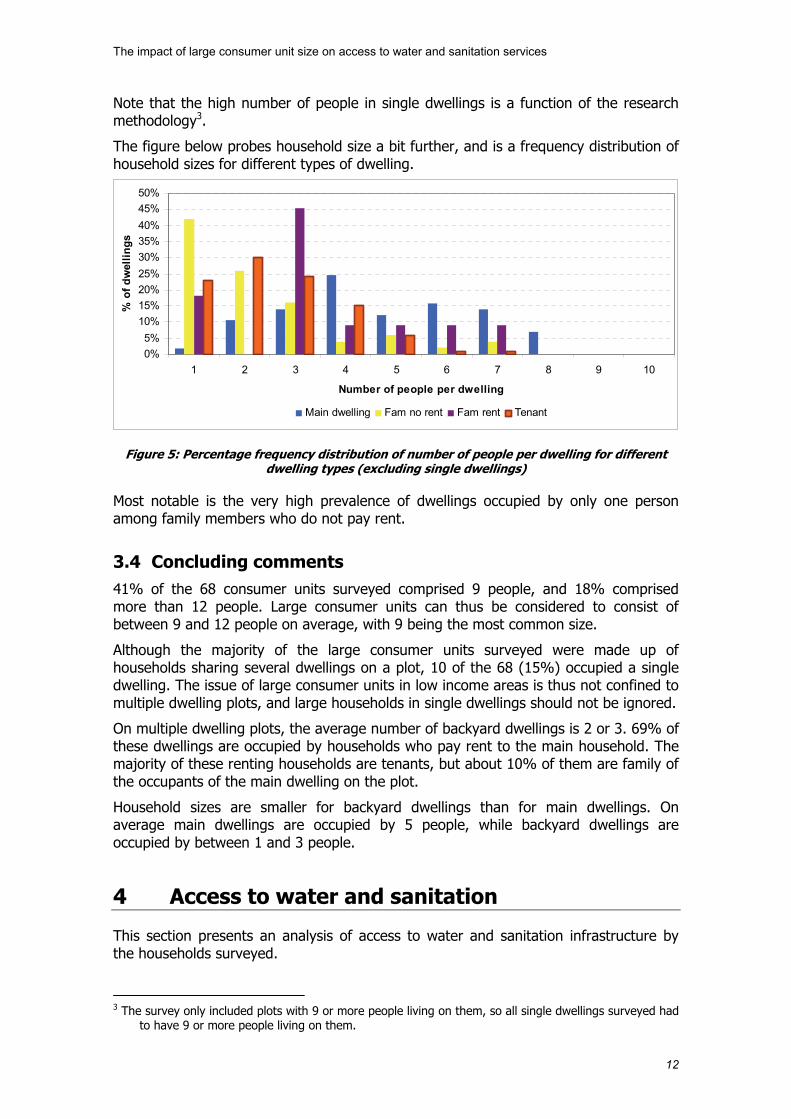
The figure below probes household size a bit further, and is a frequency distribution of household sizes for different types of dwelling.
0%
5%
10%
15%
20%
25%
30%
35%
40%
45%
50%
1 2 3 4 5 6 7 8 9 10
Number of people per dwelling
% o
f d
wel
lin
gs
Main dwelling Fam no rent Fam rent Tenant
Figure 5: Percentage frequency distribution of number of people per dwelling for different dwelling types (excluding single dwellings)
Most notable is the very high prevalence of dwellings occupied by only one person among family members who do not pay rent.
3.4 Concluding comments 41% of the 68 consumer units surveyed comprised 9 people, and 18% comprised more than 12 people. Large consumer units can thus be considered to consist of between 9 and 12 people on average, with 9 being the most common size.
Although the majority of the large consumer units surveyed were made up of households sharing several dwellings on a plot, 10 of the 68 (15%) occupied a single dwelling. The issue of large consumer units in low income areas is thus not confined to multiple dwelling plots, and large households in single dwellings should not be ignored.
On multiple dwelling plots, the average number of backyard dwellings is 2 or 3. 69% of these dwellings are occupied by households who pay rent to the main household. The majority of these renting households are tenants, but about 10% of them are family of the occupants of the main dwelling on the plot.
Household sizes are smaller for backyard dwellings than for main dwellings. On average main dwellings are occupied by 5 people, while backyard dwellings are occupied by between 1 and 3 people.
4 Access to water and sanitation
This section presents an analysis of access to water and sanitation infrastructure by the households surveyed.
3 The survey only included plots with 9 or more people living on them, so all single dwellings surveyed had
to have 9 or more people living on them.

The impact of large consumer unit size on access to water and sanitation services
13
4.1 Access to water All of the households surveyed had access to water on the plot on which they live.
The majority of households (90%) had access to a yard tap, while the remainder used an in-house tap. One tenant household had a tap inside their dwelling, but otherwise all in-house taps belonged to single or main dwelling households.
Table 6: Access to water by household type
Single dwelling
Main dwelling
Secondary dwelling occupied by family
not paying rent
Secondary dwelling occupied by family
paying rent
Secondary dwelling occupied
by tenants
Total
Number of dwellings 10 57 50 11 100 228
In-house tap 40% 32% 0% 0% 1% 10%
Yard tap 60% 68% 100% 100% 99% 90%
All of the multiple dwelling plots had a yard tap, so there were no cases where residents of secondary dwellings needed to use taps inside the main dwelling.
On average, there were three people sharing every in-house tap set. This low number is because houses with in-house tap sets typically had more than one set (up to three tap sets per house), and 83% of these households also had a tap set in the yard.
On average, there were 9 people sharing each yard tap.
4.2 Access to sanitation All of the households surveyed had access to sanitation on the plot on which they live.
All of the households surveyed used a flush toilet. Most households (91%) used a toilet located outside their dwelling in the yard. Fifteen households said that they used a toilet inside their own dwelling, two of which were households living in backyard dwellings.
Table 7: Access to sanitation by household type
Single dwelling
Main dwelling
Secondary dwelling occupied by family
not paying rent
Secondary dwelling occupied by family
paying rent
Secondary dwelling occupied
by tenants
Total
Number of dwellings 10 57 50 11 100 228
In own dwelling 30% 18% 4% 0% 0% 7%
In another dwelling on the plot
0% 0% 2% 0% 4% 2%
In the yard 70% 82% 94% 100% 96% 91%
The impact of large consumer unit size on access to water and sanitation services
14
There were five households who said that they used a toilet located inside another dwelling on the plot. One of these was a household comprising family members who do not pay rent. This household stated that they could not access the toilet whenever they wanted to. The other four households were all tenant households located on one plot. They said that they could access the toilet whenever they wanted to.
None of the respondents to the household surveys said that they were ever denied access to sanitation facilities. However, in the focus groups one landlord said that she sometimes locked the toilet if tenants refused to help her clean it: “Yes, I used to lock it after cleaning and give the keys to people who take part in its cleaning.”
On average there were six people sharing each in-house toilet. This relatively low number is because 63% of the 13 consumer units that had an in-house toilet also had a toilet in the yard. On average, toilets in the yard are shared by 10 people.
4.3 Concluding comments Physical access to water and sanitation facilities is not constrained for the households surveyed, although facilities are shared with relatively large numbers of people. As one respondent in the focus groups said: “It is very hard to have one toilet when you are so many because when you have a running stomach and you have to use the toilet, in most cases you find somebody in there already.”
Although this was not picked up in the household survey, some of the focus group responses indicate that there may be some circumstances in which landlords attempt to deny tenants access to services. However, it appears that these conditions do not persist for long, either because the tenant gives in to the landlord’s demands (after a landlord locked the tenant out of the toilet because she would not help with cleaning “She would see what she has to do, and help to clean”) or because the tenants re-negotiate access to the services.
Although all the households surveyed had access to adequate sanitation, in the focus groups a view was expressed that sometimes residents do not like to use the toilets at night, because there are rats, or they are scared of “thugs”. “Besides the rats we are scared of thugs at night, because some of them wait behind the house and attack you when you go to the toilet at night”. In this case, focus group respondents said that they used a bucket in the house at night instead of using the toilet outside.
5 Affordability of water and sanitation
A widely accepted rule of thumb for assessing the affordability of water services to households is that the monthly bill for water and sanitation should be no more than 5% of total monthly income (Komives et al., 2005, p.41).
In the City of Tshwane both water and sanitation are charged for on the basis of the amount of water consumed. So in order to assess the affordability of water and sanitation to the consumer units and households surveyed it is necessary to assess their levels of water consumption. It is also necessary to have an indication of income levels.
This section thus discusses water consumption, income levels and payment patterns by the households surveyed, and then assesses the affordability of the monthly water and sanitation bill to the household that pays the bill.

The impact of large consumer unit size on access to water and sanitation services
15
5.1 Levels of water consumption This section of the report focuses on analysis of actual water consumption data drawn from the records of the City of Tshwane (for Atteridgeville and Mamelodi West) and from SWA (who are responsible for meter reading in Ga-Rankuwa and Mabopane). This data was matched with information on consumer unit size and household income obtained via the household questionnaires.
Consumption data was obtained for 58 of the 68 stands included in the study. For 10 of the stands it was not possible to obtain consumption data because it was not possible to match the address or account data in the household questionnaires with certainty with an actual accountholder in the Tshwane or SWA databases.
Water consumption data was obtained for each of the 12 months between September 2006 and August 2007. The average water consumption for all 58 stands was 25.55 kl per month. This translates to 82 litres per person per day, on average, assuming a 30.5 day month.
Note that the average water consumption of stands with an in-house tap in one of the dwellings was not significantly higher than that for stands with yard taps only, even once consumer unit size was controlled for.
The table below shows the average water consumption per month for each of the settlements surveyed.
Table 8: Average monthly water consumption by settlement type
Ga-Rankuwa Zone 2
Mabopane Zone 6
Mamelodi West Atteridgeville Total
Number of stands 22 8 18 11 58
Average consumption (kl per month)
22.72 17.96 31.39 23.6 25.55
Although there is some variation between settlement types, all settlement types show fairly high levels of consumption. This is likely to have implications for the affordability of water and sanitation, since these services are billed for on the basis of volumes of water consumed.
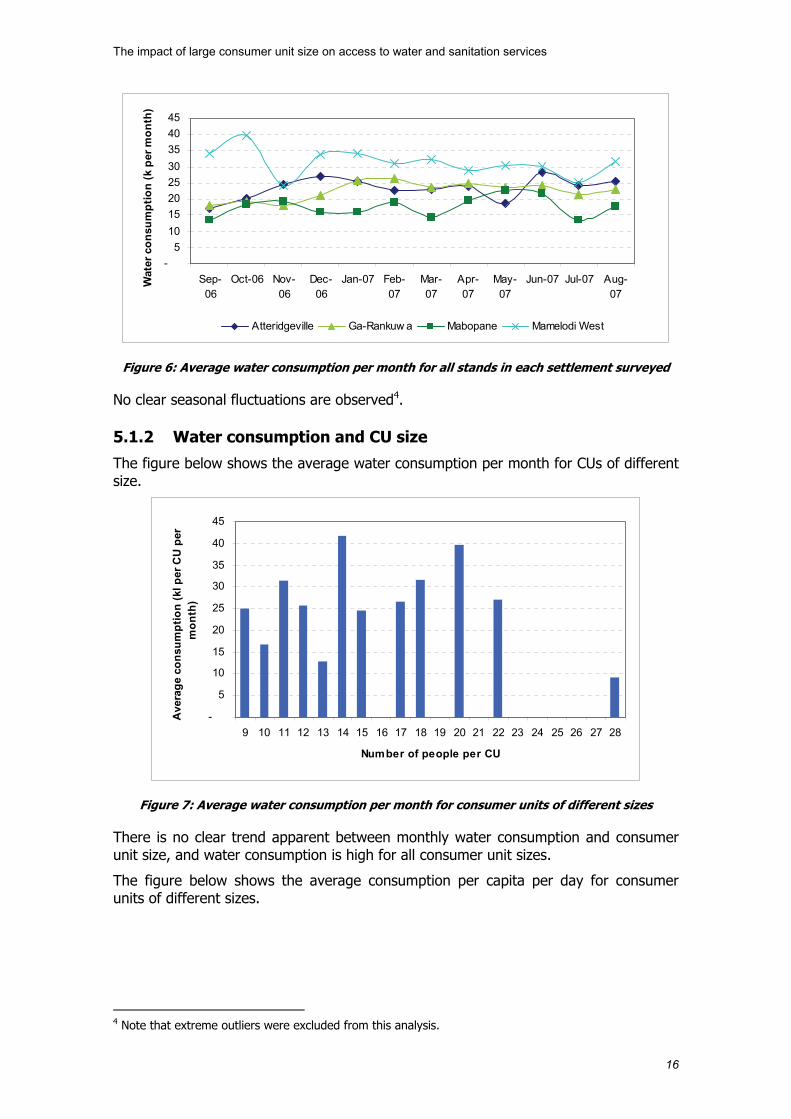
5.1.1 Water consumption and time of year
The average water consumption for all stands for which consumption data was received did not show a clear seasonal pattern, as may be seen from the figure below.
The impact of large consumer unit size on access to water and sanitation services
16
-
5
10
15
20
25
30
35
40
45
Sep-06
Oct-06 Nov-06
Dec-06
Jan-07 Feb-07
Mar-07
Apr-07
May-07
Jun-07 Jul-07 Aug-07
Wat
er c
on
sum
pti
on
(k
per
mo
nth
)
Atteridgeville Ga-Rankuw a Mabopane Mamelodi West
Figure 6: Average water consumption per month for all stands in each settlement surveyed
No clear seasonal fluctuations are observed4.
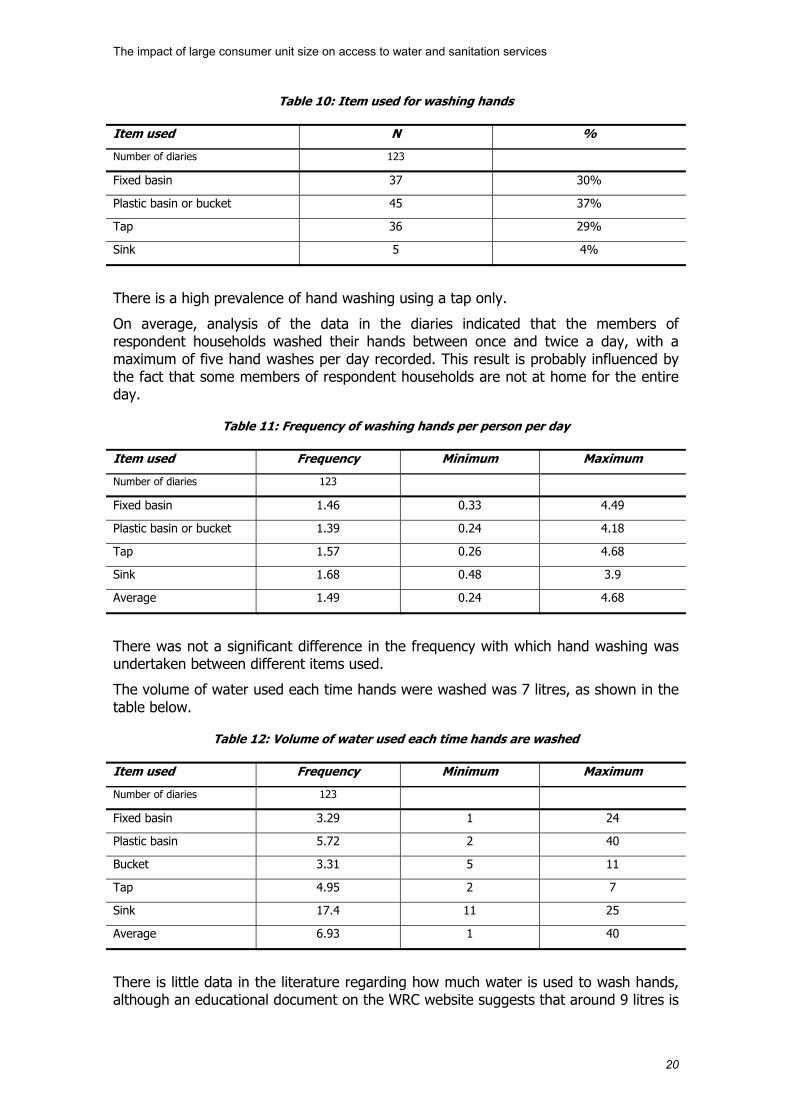
5.1.2 Water consumption and CU size
The figure below shows the average water consumption per month for CUs of different size.
-
5
10
15
20
25
30
35
40
45
9 10 11 12 13 14 15 16 17 18 19 20 21 22 23 24 25 26 27 28
Number of people per CU
Ave
rag
e co
nsu
mp
tio
n (
kl p
er C
U p
er
mo
nth
)
Figure 7: Average water consumption per month for consumer units of different sizes
There is no clear trend apparent between monthly water consumption and consumer unit size, and water consumption is high for all consumer unit sizes.
The figure below shows the average consumption per capita per day for consumer units of different sizes.
4 Note that extreme outliers were excluded from this analysis.

The impact of large consumer unit size on access to water and sanitation services
17
-
20
40
60
80
100
120
9 10 11 12 13 14 15 16 17 18 19 20 21 22 23 24 25 26 27 28
Number of people per CU
Ave
rag
e co
nsu
mp
tio
n p
er c
apit
a p
er
day
(l)
Figure 8: Average water consumption per capita per day for consumer units of different sizes
Average water consumption per capita was in excess of 40 litres per day for all consumer unit sizes, with the exception of one consumer unit of 13 people and one of 28 people.
5.1.3 Water consumption and income
The figure below shows the average water consumption per month for consumer units with incomes falling in different brackets.
-
5
10
15
20
25
30
35
40
45
Less
than
1
1.01
-2
2.01
-3
3.01
-4
4.01
-5
5.01
-6
6.01
-7
7.01
-8
8.01
-9
9.01
-10
10.0
1-11
11.0
1-12
12.0
1-13
13.0
1-14
Income (R'000 per CU per month)
Ave
rag
e w
ater
co
nsu
mp
tio
n (
kl p
er
CU
per
mo
nth
)
Figure 9: Average water consumption per month for consumer units with different monthly incomes
There is no clear relationship between consumption and income. It does not appear that higher income households necessarily use more water than lower income households. However, the range of incomes among the survey sample was fairly narrow, and it is likely that variations in water consumption with income will only be observed over a larger income range.

The impact of large consumer unit size on access to water and sanitation services
18
5.1.4 Theoretical discussion of water consumption
The White Paper on a National Water Policy for South Africa, published in 1997, set the RDP standard for water provision at 25 litres per person per day (DWAF, 1997). While this is an indication of basic water needs as estimated by the government, it is not necessarily indicative of expected average water consumption for low income households. In fact, there has been much debate in the literature regarding whether 25 litres per person per day is an adequate basic water allocation (see for example SAWC, 2003).
The World Health Organisation (WHO) estimates that the volume of water used for households with taps in the yard and on-site toilets is about 50 litres per person per day (WHO, 2003). This excludes toilet flushing, so if it is assumed that each person flushes the toilet twice a day, and that a toilet flush takes 10 litres of water per flush, then this translates to consumption of about 70 litres per person per day. Almost half (28 of 58) of the consumer units for which water consumption data was available used 70 litres or less per person per day. So this suggests that while half of the consumer units surveyed use approximately the amount estimated by WHO, half use more. Again according to WHO (2003), consumption of between 100 and 200 litres person per day is typical of households with water piped into their homes. Almost 20% (11 out of 58) of the consumer units surveyed used volumes in this range.
In their study of Water consumption levels in selected South Africa cities, Van Zyl et al. (2007) provide a useful review of previous research on water demand in South Africa. One study which they review was conducted in Pretoria by Van Vuuren and Van Beek (1997). This research found that in low income areas households located on stands less than 700m² in size had average water consumption levels ranging between 400 litres and 800 litres per stand per day. This corresponds to between about 12 and 24 kl per stand per month. Furthermore, the CSIR’s guidelines for water demand (2003) set an envelope for water demand in low income areas at 600 litres per stand per day for stands that are between 300 m² and 600 m² in size (about 18 kl per month). While not directly comparable to this research, the results from these two studies provide a useful indicative water demand picture for low income areas, and suggest that the average daily consumption as observed in this study is relatively high for low income areas.
Van Vuuren et al. (2004) conducted a study of water consumption in three metropolitan municipalities, including Tshwane, Cape Town and eThekwini. Using billing data for Tshwane, their research showed that actual average water usage was 20.6 kl per month in low income groups, where household income was between R0 and R3999.00 per month. The sample of households used for this particular study was of a similar size, 225 (although the study was undertaken across low, middle and high income groups) and included some households in Atteridgeville and Mamelodi. The table below (taken from Van Vuuren et al., 2004) provides actual and perceived water consumption levels for low, middle and high income groups, showing that for low income groups, water consumption is in the order of 19 to 20 kl per month. This suggests that the monthly water consumption of 25.5 kl per month observed in our study of large consumer units is higher than the expected level for low income groups, and is instead more closely aligned to middle income groups.

The impact of large consumer unit size on access to water and sanitation services
19
Table 9: Perceived water usage profile per household in Tshwane, according to Van Vuuren et al. (2004)
Income group Low Middle High Perceived average water usage (kl/month) 19.4 14.9 24
Actual average water usage (kl/month) 20.6 26.4 41.8 Source: Van Vuuren, Van Zyl, Veck and Bill (2004)
In summary, the water consumption levels of the survey group were high compared to consumption levels indicated for low income groups in the literature. Consumption levels were more aligned with middle income consumer provided with in-house water connections, than with lower income consumers with yard taps.
5.1.5 Water consumption activities
Water consumption activities include drinking, hand washing, bathing, preparing food and cooking, washing dishes, washing clothes, flushing the toilet, watering the garden, spraying the yard and washing the car. The water diaries provide an indication of how regularly some of these activities are undertaken, as well as estimates of the volumes of water used. It should be noted that the volumes of water measured by the learners in completing their water diaries are subject to large degree of error. For this reason, the volumes presented here should be treated with some caution. However, wherever possible, the measured volumes are compared to those found in literature in order to assess how ‘reasonable’ they are.
The data on frequency of water use activities and volumes of water used is applied to an average consumer unit of 11 people. This was the average size of those consumer units for which water consumption data was available from the City of Tshwane and SWA billing databases. This is used to calculate a theoretical water consumption per month for this average consumer unit. This analysis is intended to complement the theoretical discussion in Section 5.1.1 above, and attempt to provide insight into why the consumer units surveyed are using the volumes of water that they do.
Water for drinking
The water diaries did not ask about water use for drinking. Literature suggests that between 2 and 5 litres should be consumed per capita per day, depending on climate (WHO, 2003, WHO, 2005, Van Schalkwyk, 1996).
For this analysis, consumption per capita of 3 litres per day is assumed. However, it is assumed that some of this consumption takes place out of the home, so consumption on the stand of 1 litre per person per day is used.
A consumer unit of 11 people will use 0.34 kl of water per month for drinking, assuming a 30.5 day month.
Water for hand washing
The majority of water diary respondents washed their hands using a plastic bucket or basin. The next most common item used was a fixed hand wash basin, such as found in a bathroom. Note that both of these items were sometimes used in combination with other items. So, for example, although a household might have a fixed hand wash basin, in some circumstances they might wash their hands under the outside tap or in a bucket.
The impact of large consumer unit size on access to water and sanitation services
20
Table 10: Item used for washing hands
Item used N %
Number of diaries 123
Fixed basin 37 30%
Plastic basin or bucket 45 37%
Tap 36 29%
Sink 5 4%
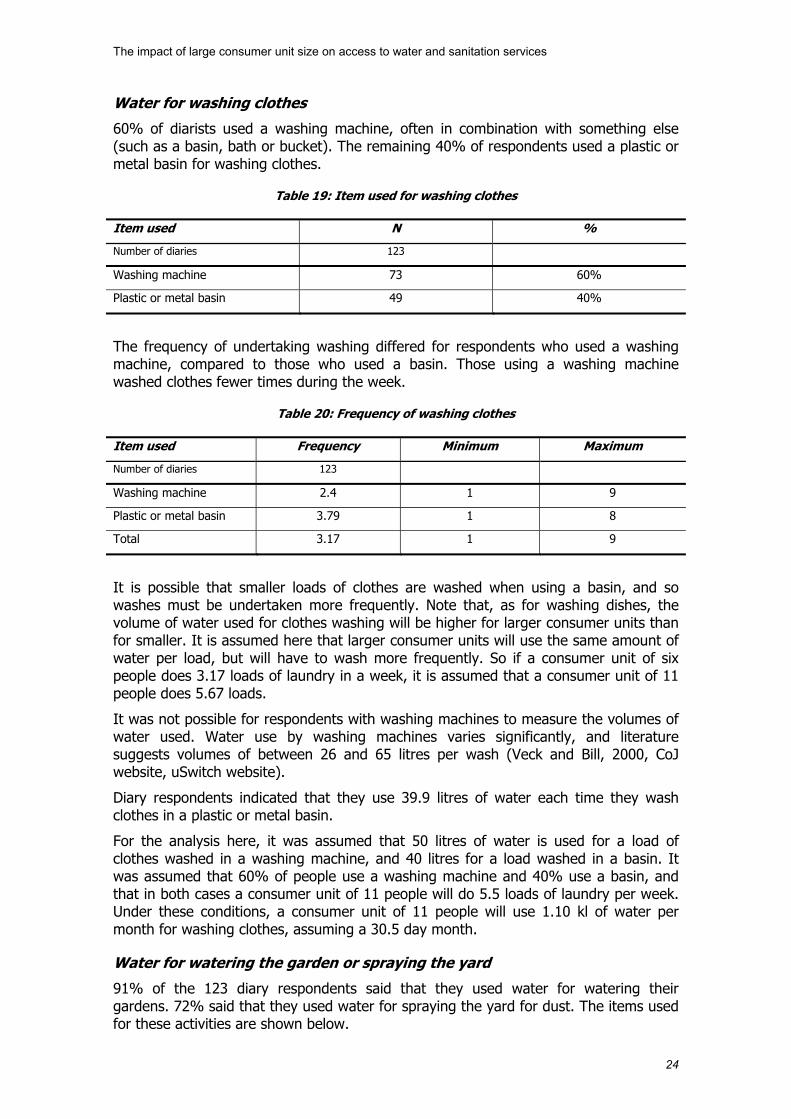
There is a high prevalence of hand washing using a tap only.
On average, analysis of the data in the diaries indicated that the members of respondent households washed their hands between once and twice a day, with a maximum of five hand washes per day recorded. This result is probably influenced by the fact that some members of respondent households are not at home for the entire day.
Table 11: Frequency of washing hands per person per day
Item used Frequency Minimum Maximum
Number of diaries 123
Fixed basin 1.46 0.33 4.49
Plastic basin or bucket 1.39 0.24 4.18
Tap 1.57 0.26 4.68
Sink 1.68 0.48 3.9
Average 1.49 0.24 4.68
There was not a significant difference in the frequency with which hand washing was undertaken between different items used.
The volume of water used each time hands were washed was 7 litres, as shown in the table below.
Table 12: Volume of water used each time hands are washed
Item used Frequency Minimum Maximum
Number of diaries 123
Fixed basin 3.29 1 24
Plastic basin 5.72 2 40
Bucket 3.31 5 11
Tap 4.95 2 7
Sink 17.4 11 25
Average 6.93 1 40
There is little data in the literature regarding how much water is used to wash hands, although an educational document on the WRC website suggests that around 9 litres is

The impact of large consumer unit size on access to water and sanitation services
21
used each time hands are washed. Veck and Bill (2000) suggest that a full hand wash basin has a capacity of 10 litres.
For the purposes of analysis here, a volume of 7 litres for hand washing was used, and a frequency of 1.5 times per day, as indicated by the water diaries. Under these conditions, a consumer unit of 11 people will use 3.52 kl of water per month for washing hands, assuming a 30.5 day month.
Water for bathing
Two thirds of the water diary respondents bathed using a plastic or metal basin, rather than a fixed bath or shower. The main difference between the basins is their size. In the stickers used in the diaries, the plastic basin was shown to be a round basin of approximately 10 litre capacity, while the metal basin was a ‘skottel’, such as those used to do laundry, with a capacity of closer to 25 litres. Of course, it is possible that basins in a range of sizes are in fact used.
Table 13: Item used for bathing
Item used N %
Number of diaries 123
Bath 34 28%
Plastic basin 68 55%
Metal basin 14 11%
Shower 7 6%
Use of a shower was low. Note that a third of those who reported using a bath did not use the bath all the time, but used it in combination with a plastic or metal basin or a shower.
On average, analysis showed that respondents bathed slightly more than once a day.
Table 14: Frequency of bathing per person per day
Item used Frequency Minimum Maximum
Number of diaries 123
Bath 1.23 1 3
Plastic basin 1.17 1 5
Metal basin 1.10 1 2
Shower 1.22 1 2
Total 1.18 1 5
There was not a significant difference in the frequency of bathing using different items.
The volume of water used for bathing differs depending on the item used, as indicated in the table below.

The impact of large consumer unit size on access to water and sanitation services
22
Table 15: Volume of water used each time bathing is undertaken
Item used Frequency Minimum Maximum
Number of diaries 123
Bath 24.8 2 157
Plastic basin 22.81 1 24
Metal basin 15.76 8 100
Note that the volume of water used when showering was not calculated, as only eight learners reported using a shower, and the volumes recorded differed significantly. This is probably due to the difficulty of measuring the volume of water used in a shower.
Literature suggests that a bath uses 80 litres of water (WRC website, uSwitch website). So the volumes used by the water diarists are low, and indicate that very shallow baths are used. The volumes used for washing in a metal basin are similar for those suggested by Van Schalkwyk (1996) for very low to moderate developmental levels, while those for washing in a plastic basin are slightly higher. Note that the minimum water required for bathing per day is considered to be approximately 7 litres per person (van Schalkwyk, 1996, WHO, 2005). So the volumes being recorded in the water diaries are significantly higher than the minimum volumes considered acceptable.
For the purposes of analysis here, it is assumed that 20 litres of water are used for bathing per person per wash. A frequency of washing of 1.2 times per person per day is assumed. Under these conditions, a consumer unit of 11 people will use 8.05 kl of water per month for bathing, assuming a 30.5 day month.
Water for flushing toilet
The water diaries did not ask about flushing the toilet. This is because the teachers felt that it would be awkward and disrespectful for learners to ask all of the people living in their house how many times they had used and flushed the toilet each day. Previous work conducted by PDG for the City of Johannesburg indicated that people flush the toilet at home on average twice a day (CoJ, 2007).
Literature suggests that a toilet flush uses between 9 and 12 litres of water (Veck and Bill, 2000, CoJ website, WRC website).
For the analysis here it is assumed that each person flushes the toilet at their home twice a day on average, and that 10 litres of water are used per flush. Under these conditions, a consumer unit of 11 people will use 6.71 kl of water per month for flushing the toilet, assuming a 30.5 day month.
Water for preparing and cooking food
The water diaries did not ask about the use of water for preparing food and cooking, as this is very difficult to measure. Gleick (2006) suggests that 10 litres per person per day are required for food preparation and cooking in order to ensure health. This volume is assumed here. Under these conditions, a consumer unit of 11 people will use 3.36 kl of water per month for preparing and cooking food, assuming a 30.5 day month.

The impact of large consumer unit size on access to water and sanitation services
23
Water for washing dishes
Most diary respondents use a fixed sink for washing dishes, although a large proportion use a plastic basin. Almost 20% of respondents use a combination of a sink and basin.
Table 16: Item used for washing dishes
Item used N %
Number of diaries 123
Sink 53 43%
Plastic basin 47 38%
Combination of sink and basin 23 19%
Dishes were washed between two or three times a day, and there was no significant difference between the frequency of washing dishes using a sink or a plastic basin.
Table 17: Frequency of washing dishes
Item used Frequency Minimum Maximum
Number of diaries 123
Sink 2.54 1 10
Plastic basin 2.36 1 11
Total 2.45 1 11
The volume of water used was approximately 11 litres. There was not a significant difference in the volumes used for the sink or the basin.
Table 18: Volume of water used each time dishes are washed
Item used Frequency Minimum Maximum
Number of diaries 123
Sink 10.49 2 80
Plastic basin 12.25 2 112
Total 11.37 2 112
Veck and Bill (2000) indicate that a full sink of water for dishwashing is about 15 litres.
Note that dishwashing is a water use activity that requires more water for larger groups of people. The average consumer unit size of the water diarists was six people. If it is assumed that the 11 litres recorded by the diarists is the volume of water required per dish wash when dishes are washed for six people, then a consumer unit of 11 people will require just over 20 litres each time they wash dishes.
For this analysis, it was assumed that the volume of water used for washing dishes was 20 litres, and dishes were washed 2.5 times a day, as suggested by the water dairies. Under these conditions, a consumer unit of 11 people will use 1.53 kl of water per month for washing dishes, assuming a 30.5 day month.
The impact of large consumer unit size on access to water and sanitation services
24
Water for washing clothes
60% of diarists used a washing machine, often in combination with something else (such as a basin, bath or bucket). The remaining 40% of respondents used a plastic or metal basin for washing clothes.
Table 19: Item used for washing clothes
Item used N %
Number of diaries 123
Washing machine 73 60%
Plastic or metal basin 49 40%
The frequency of undertaking washing differed for respondents who used a washing machine, compared to those who used a basin. Those using a washing machine washed clothes fewer times during the week.
Table 20: Frequency of washing clothes
Item used Frequency Minimum Maximum
Number of diaries 123
Washing machine 2.4 1 9
Plastic or metal basin 3.79 1 8
Total 3.17 1 9
It is possible that smaller loads of clothes are washed when using a basin, and so washes must be undertaken more frequently. Note that, as for washing dishes, the volume of water used for clothes washing will be higher for larger consumer units than for smaller. It is assumed here that larger consumer units will use the same amount of water per load, but will have to wash more frequently. So if a consumer unit of six people does 3.17 loads of laundry in a week, it is assumed that a consumer unit of 11 people does 5.67 loads.
It was not possible for respondents with washing machines to measure the volumes of water used. Water use by washing machines varies significantly, and literature suggests volumes of between 26 and 65 litres per wash (Veck and Bill, 2000, CoJ website, uSwitch website).
Diary respondents indicated that they use 39.9 litres of water each time they wash clothes in a plastic or metal basin.
For the analysis here, it was assumed that 50 litres of water is used for a load of clothes washed in a washing machine, and 40 litres for a load washed in a basin. It was assumed that 60% of people use a washing machine and 40% use a basin, and that in both cases a consumer unit of 11 people will do 5.5 loads of laundry per week. Under these conditions, a consumer unit of 11 people will use 1.10 kl of water per month for washing clothes, assuming a 30.5 day month.
Water for watering the garden or spraying the yard
91% of the 123 diary respondents said that they used water for watering their gardens. 72% said that they used water for spraying the yard for dust. The items used for these activities are shown below.

The impact of large consumer unit size on access to water and sanitation services
25
Table 21: Item used for watering garden or spraying yard for dust
Item used Watering garden Spraying yard for dust
N % N %
Number of diaries 112 89
Hose 63 56% 36 40%
Bucket 48 43% 51 57%
Plastic basin 1 1% 2 2%
Diarists reported that they watered their gardens more regularly than they sprayed for dust. But both activities take place with quite a high degree of frequency.
Table 22: Frequency of watering garden or spraying yard for dust
Item used Watering the garden Spraying the yard
Frequency Minimum Maximum Frequency Minimum Maximum
Number of diaries 112 89
Hose 4.21 1 14 4.96 1 14
Bucket 5.23 1 4 3.76 1 13
Plastic basin 7 7 7 5 5 5
Total 5.48 1 14 4.57 1 14
On average, the garden was watered 5.5 times a week, and the yard sprayed 4.5 times a week by those who undertook these activities.
The volume of water used for watering the garden was significantly higher than that used for spraying for dust.
Table 23: Volume of water used for watering the garden or spraying the yard
Item used Watering the garden Spraying the yard
Frequency Minimum Maximum Frequency Minimum Maximum
Number of diaries 112 89
Hose 26.49 4 175 12.3 3 90
Bucket 24.48 3 120 8.45 3 50
Plastic basin 17 17 17 11 8 26
Total 22.66 3 175 10.58 3 90
For the purposes of the analysis here, the volumes and frequencies of watering the garden and spraying the yard were assumed to be correct. There appears to be little literature in South Africa for the volumes used for these activities. The activities were weighted by the proportion of diarists who said that they undertook them. Under these circumstances, an average consumer unit will use 0.49 kl of water per month to water the garden, and 0.15 kl per month to spray the yard for dust.

The impact of large consumer unit size on access to water and sanitation services
26
Water for washing the car
48% of water diaries respondents said that they used water to wash their cars. The most commonly used item was a bucket.
Table 24: Item used to wash car
Item used N %
Number of diaries 59
Hose 25 42%
Bucket 33 56%
Plastic basin 1 2%
The frequency of car washing was surprisingly high, on average three times a week. It is possible that there was a misunderstanding with regard to how to fill in the diary for washing cars.
Table 25: Frequency of washing car
Item used Frequency Minimum Maximum
Number of diaries 59
Hose 3.13 1 12
Bucket 3.04 1 12
Total 3.08 1 12
The volumes of water are similar to those used to water the garden.
Table 26: Volume of water used to wash a car
Item used Frequency Minimum Maximum
Number of diaries 59
Hose 25.16 8 100
Bucket 25.18 4 85
Total 25.17 4 100
As for watering the garden and spraying the yard, there is little literature on water use for car washing in South Africa. So the frequencies and volumes recorded by the diaries were assumed to be correct. If the proportion of diarists who said that they washed a car is used as a weighting, then a consumer unit uses 0.16 kl of water per month to wash cars, assuming a 30.5 day month.
Water use for all activities
If the estimated volumes of water used per month by a consumer unit of 11 people for the activities outlined above are added together, total water consumption is shown to be 25.41 litres. This indicates that the actual average consumption of 25.55 kl per month is not unreasonable, and can be explained based on a realistic set of water use activities.

The impact of large consumer unit size on access to water and sanitation services
27
The composition of the theoretical water consumption calculated is shown in the table below.
Table 27: Total calculated theoretical water consumption per month for a consumer unit of 11 people
Activity Volume per month (kl)
% of total consumption per
month
Volume per capita per day (l)
Drinking 0.34 1% 1.00
Hand wash 3.52 14% 10.50
Bathing 8.05 32% 24.00
Toilet flush 6.71 26% 20.00
Food prep and cooking 3.36 13% 10.00
Washing dishes 1.53 6% 4.55
Wash clothes 1.10 4% 3.29
Water garden 0.49 2%
Spray yard 0.15 1%
Wash car 0.16 1%
Total 25.41
The focus group discussions indicated that people perceive laundry to be the activity for which they use the most water. In fact, for large consumer units laundry appears to use a relatively small amount of water. This perception is likely to be due to the fact that laundry uses a large volume of water for a single activity. In fact it is personal water use activities, undertaken by each individual in a consumer unit every day, that use the most water. These activities include drinking, washing hands, bathing and flushing the toilet, and together make up 73% of the total water use by the consumer unit.
Bathing is the activity that uses the most water. Recall that the diaries indicated that volumes of water used for bathing were about 20 litres, significantly higher than the minimum volume that the literature suggests could be used. This relatively high use appears to be a key driver of the relatively high water consumption by the survey sample. If a volume for bathing of 7 litres is assumed in the analysis presented in this section, then a consumer unit of 11 people would use 20.18 kl of water per month, instead of 25.41 kl. This is more in line with the volumes that literature suggests are used by low income households, as presented in Section 5.1.4 above.
In summary, the relatively high monthly consumption recorded for the sample group can be explained by a realistic set of water use activities. For large consumer units, consumption is driven largely by personal water use activities, undertaken every day by each individual making up the consumer unit. It appears that the high consumption is driven mainly by relatively high volumes of water used for bathing.
5.2 Levels of income This section looks at the income generated by the consumer unit as a whole, as well as the income generated by each household making up that consumer unit. The incomes referred to are self-reported incomes. As much discussed in literature (see for example
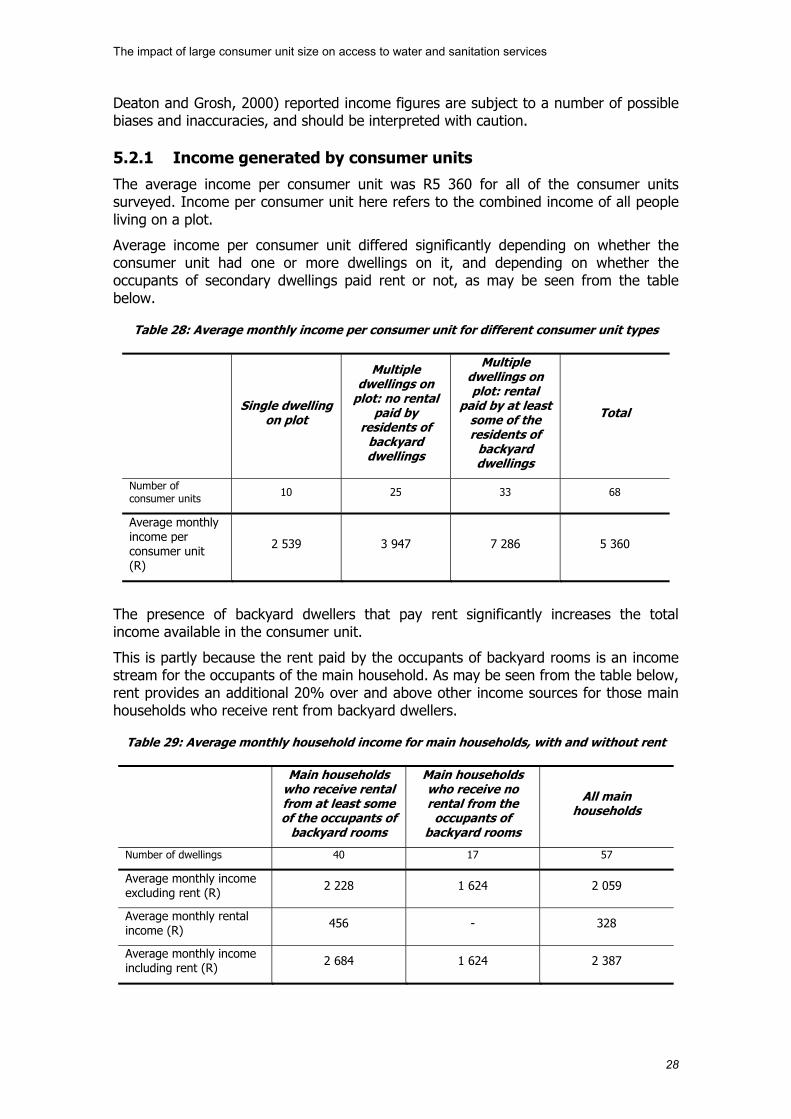
The impact of large consumer unit size on access to water and sanitation services
28
Deaton and Grosh, 2000) reported income figures are subject to a number of possible biases and inaccuracies, and should be interpreted with caution.
5.2.1 Income generated by consumer units
The average income per consumer unit was R5 360 for all of the consumer units surveyed. Income per consumer unit here refers to the combined income of all people living on a plot.
Average income per consumer unit differed significantly depending on whether the consumer unit had one or more dwellings on it, and depending on whether the occupants of secondary dwellings paid rent or not, as may be seen from the table below.
Table 28: Average monthly income per consumer unit for different consumer unit types
Single dwelling on plot
Multiple dwellings on
plot: no rental paid by
residents of backyard dwellings
Multiple dwellings on plot: rental
paid by at least some of the residents of
backyard dwellings
Total
Number of consumer units 10 25 33 68
Average monthly income per consumer unit (R)
2 539 3 947 7 286 5 360
The presence of backyard dwellers that pay rent significantly increases the total income available in the consumer unit.
This is partly because the rent paid by the occupants of backyard rooms is an income stream for the occupants of the main household. As may be seen from the table below, rent provides an additional 20% over and above other income sources for those main households who receive rent from backyard dwellers.
Table 29: Average monthly household income for main households, with and without rent
Main households who receive rental from at least some of the occupants of
backyard rooms
Main households who receive no rental from the
occupants of backyard rooms
All main households
Number of dwellings 40 17 57
Average monthly income excluding rent (R) 2 228 1 624 2 059
Average monthly rental income (R) 456 - 328
Average monthly income including rent (R) 2 684 1 624 2 387

The impact of large consumer unit size on access to water and sanitation services
29
It is also because income-earning backyard dwellers who pay rent typically earn well compared to those income-earning backyard dwellers that do not pay rent, and they support fewer non-income earners than the occupants of the main house on the stand.
Table 30: Average monthly income per income earner and dependency ratios by household type
Main dwelling Secondary dwelling occupied by family
not paying rent
Secondary dwelling occupied by
tenants or family paying rent
Number of dwellings 57 50 111
Average monthly income per income earner (R) 1 244 553 1 370
Dependency ratio* 1.64 0.77 0.83
* Dependency ratio is the number of non-income earners supported by each income earner in the dwelling.
The findings on income per consumer unit for different consumer unit types suggest that affordability to the consumer unit as a whole may be more of an issue for large consumer units that either occupy a single dwelling or that comprise family members sharing several dwellings with no rental payments between them.
5.2.2 Income generated by households
A study conducted in Soweto in 1997 indicated that landlords renting out backyard shacks were among the poorest residents of that township, and that their household income was only slightly greater than that of their tenants (Crankshaw et al., 1997).
The current study confirmed that the average household income of those occupying the main dwelling on a multiple dwelling stand was not much higher than the average incomes of those in backyard dwellings. But the study finds noticeable differences between the household incomes of the different types of backyard residents, as shown in the table below.
Table 31: Average monthly income per dwelling for different dwelling types
Single dwelling
Main dwelling
Secondary dwelling occupied by family
not paying rent
Secondary dwelling occupied by family
paying rent
Secondary dwelling occupied
by tenants
Total
Number of dwellings 10 57 50 11 100 228
Average monthly income per household (R)
4 232 2 401 655 2 098 1 942 1 882
Household income is much lower for those family members occupying backyard rooms and paying no rent to the occupants of the main house. The difference between the household income of those family members who do pay rent when compared to those who don’t suggests that access to income is a factor when determining if rent will be paid or not: those family members in backyard accommodation who can afford to pay

The impact of large consumer unit size on access to water and sanitation services
30
rent do so, while those who have limited access to income are not required to pay rent.
5.3 Who pays for water and sanitation? Out of the 68 consumer units surveyed, 57 said that they paid the bill regularly, 10 paid sometimes and one consumer unit said that they never paid their bill5.
Out of the 67 consumer units who did pay their bills, only 38% (26 consumer units) pay the amount that appears on the bill. The remaining 41 consumer units pay either the amount that they can afford (39 consumer units) or the same amount every month (2 consumer units). On average, those who say that they pay only what they can afford pay about half of the amount on the bill.
On all of the consumer units surveyed the water and sanitation bill was paid by the residents of the main household on the plot.
Whether or not a backyard household contributes towards payment for water is closely linked with whether they pay rent. Only two of the backyard households that do not pay rent said that they paid for water. They said that they paid a different amount of money to the main household every month for water. Of the backyard households that do pay rent (both family members of the main household and tenants), 79% said that they paid for water. Of these, 92% said that their water payment was included in their rent. Only two backyard households who pay for water said that they knew how much they paid6.
Only 10 of the 57 main households interviewed provided any information on the average amounts that backyard households contributed for water. This suggests that while rental payments are considered to include water, the main households themselves do not have a clear idea of how much of that rental payment is used to pay for water and sanitation. The amounts contributed, according to the 10 main households who provided such data, range between R20 and R200 a month, with R50 being the most common response (although this occurred only 3 times out of the 10 responses). The average rental payment is R200, so this average contribution for water and sanitation is a quarter of that total rental payment. Rental must also cover the cost of electricity used by tenants, so the indication is that rentals charged do not in fact provide very much profit to landlords, although this was not explored in detail in this study. This contrasts with the perceptions of landlords, as expressed in the focus groups, who see the rental income from tenants as an important financial lifeline (“If we all had jobs we wouldn’t be staying with tenants.”)
In sum, in the vast majority of cases, the full burden of the water and sanitation bill falls on the main household (or on the single household in the case of plots with only one dwelling on them), and must be paid out of the income of that household, including rent received from family or tenants in backyard dwellings.
5.4 Water and sanitation tariffs in the City of Tshwane As already mentioned, the City of Tshwane bills for both water and sanitation based on levels of water consumption. The water tariff prevailing at the time of writing this report (March 2008) is shown in the table below.
5 This consumer unit said that they were unemployed and had an arrangement with the council. 6 One of these two households said that they paid R30 a month, and the other R50.

The impact of large consumer unit size on access to water and sanitation services
31
Table 32: Water tariff schedule in the City of Tshwane between 1 July 2007 and 31 June 2008
Tariff block Tariff charged (R/kl) Less 6 kl 3.50
More than 6 kl but no more than 12 kl 5.00
More than 12 kl but no more than 18 kl 6.56
More than 18 kl but no more than 24 kl 7.58
More than 24 kl but no more than 30 kl 8.66
More than 30 kl but no more than 42 kl 9.37
More than 42 kl but no more than 72kl 10.03
More than 72 kl 10.73
Tariff scale B, for single dwelling houses
The City of Tshwane stopped providing free basic water to all households at the end of the 2006/7 financial year. From 1 July 2007, free basic water is available only to those households who are registered as indigent with the municipality. These households receive 12 kl free every month. According to the City of Tshwane’s Social Package policy, in order to register as an indigent, the total gross monthly income of a household cannot exceed two state old age pensions (about R1 700 per month). Note that the Social Package Policy does not explicitly state how a household is defined.
The average water consumption per stand for the consumer units for which water consumption data was available was 25.5 kl per month. This level of consumption falls in the fifth highest tariff block in the table above.
Sanitation charges are levied based on the amount of water assumed to be returned to the sewerage system. The tariff specifies what percentage of water consumed is assumed to have been discharged to sewerage, and the tariff (in R per kl) for every kl of water discharged.
Table 33: Sanitation tariff schedule in the City of Tshwane between 1 July 2007 and 31 June 2008
Tariff block Assumed % return flow
Tariff charged (R/kl)
Less 6 kl 98% 2.54
More than 6 kl but no more than 12 kl 90% 3.44
More than 12 kl but no more than 18 kl 75% 4.44
More than 18 kl but no more than 24 kl 60% 4.44
More than 24 kl but no more than 30 kl 52% 4.44
More than 30 kl but no more than 42 kl 10% 4.44
More than 42 kl but no more than 72 kl 1% 4.44
More than 72 kl 1% 4.44
Tariff scale B, for single dwelling houses

The impact of large consumer unit size on access to water and sanitation services
32
5.5 The cost of water and sanitation The cost of the water and sanitation bill was estimated for the 58 consumer units for which water consumption data was obtained was calculated using the current tariff schedules for the City of Tshwane. The average water bill was found to be to be R159.27, while that for sanitation was a further R64.18. This is a total bill of R223.45 per month, on average.
0%
2%
4%
6%
8%
10%
12%
14%
16%
18%
20%
Less
than
R50 R51
toR
100
R10
0 to
R15
0
R15
1 to
R20
0
R20
1 to
R25
0
R25
1 to
R30
0
R30
1 to
R35
0
R35
1 to
R40
0
mor
e th
anR
400
Monthly bill (R)
Per
cen
tag
e fr
equ
ency
Figure 10: Frequency distribution of water and sanitation bills (n=58)
5.6 The affordability of water and sanitation On plots with only a single dwelling, affordability was assessed by dividing the water and sanitation bill (calculated based on the level of water consumption) by the combined income of all people sharing the dwelling. On plots with multiple dwellings, affordability was assessed by dividing the water and sanitation bill by the income of all people sharing the main dwelling, including rental income received from households in backyard rooms on the plot.
There were 51 consumer units for which both water consumption data and income data for the single or main household was available. Of these, 39 (or 76%) receive a water and sanitation bill that is in excess of 5% of their monthly income. This indicates that affordability is a problem for the majority of the households for which data was available.
Although the household questionnaires did not ask whether households were registered as indigent, there are 26 main households that might qualify if it is assumed that the combined income of the family occupying the main household on a multiple dwelling stand is used as the measure of income. If these households are excluded from the affordability analysis, then 22 of the remaining 32 single or main households receive a bill that is in excess of 5% of their income. In other words, 43% of the single or main households for whom data was available receive a water and sanitation bill that is in excess of 5% of their monthly income, even taking possible indigent registration into account.
Affordability is thus indeed a problem for the household on the plot that must pay the water and sanitation bill.

The impact of large consumer unit size on access to water and sanitation services
33
Affordability differs between different consumer unit types, as shown in the table below.
Table 34: Affordability of water and sanitation bill to the single or main household that pays the bill, for different consumer unit types
Single dwelling CU
Multiple dwellings
with at least some
secondary dwellings
paying rent
Multiple dwellings with no
secondary dwellings
paying rent
Total
Number of CUs 9 24 15 58
Water and sanitation bill as % of monthly income of the main or single household
7.5% 10.5% 16.9% 11.1%
Having rent-paying residents in backyard rooms, whether they are family or tenants, improves the affordability of the water and sanitation account for the occupants of the main dwelling, due at least to some extent to the additional income received in the form of rent. However, the bill is unaffordable on average for all consumer unit types.
5.7 Other costs associated with the water and sanitation bill Out of the 68 consumer units surveyed, only one said that they paid for water electronically, with the remainder making payments in cash. Payments were most often made at the Council offices (71%) or at Rand Water offices (20%)7. Most consumers use a taxi to go to pay their bill (67%), and the remainder walk. For most of those who walk, the return journey takes 30 minutes or less, although 5 respondents said that they walked for between 30 minutes and an hour to go to pay their bills, and one respondent said that the walk was longer than an hour. Just over half of the respondents who went to pay their bill by taxi said that the return taxi trip was less than 30 minutes, with the remainder saying that it takes 30 minutes to an hour.
Table 35: Duration of return journey to pay water bill
Less than 30 minutes
30 minutes to an hour
More than an hour Total
Number of consumer units who walk
16 5 1 16
Number of consumer units who take a taxi
25 20 0 25
The average cost of the taxi journey for those who go by taxi was R10, with the maximum cost reported being R18. The cost of physically paying the bill should thus also be considered when assessing the affordability of water and sanitation.
7 Eleven out of the 13 respondents who said that they paid at Rand Water offices live in Garankuwa, with
the remaining two living in Mabopane.

The impact of large consumer unit size on access to water and sanitation services
34
5.8 Ability to control water consumption The first step in controlling water consumption is to know how much water is being used. When asked about estimating water consumption by the whole stand, only two of the 68 stands surveyed said that they could estimate this consumption.
When the same question was asked for the dwelling only, 35% of the 228 dwellings surveyed said that they could estimate the amount of water that the occupants of their dwelling used. As may be seen from the table below, a larger proportion of the occupants of secondary dwellings thought that they could estimate their water consumption when compared to occupants of single or main dwellings.
Table 36: Ability to estimate water consumption by occupants of dwelling by household type
Single dwelling
Main dwelling
Secondary dwelling occupied by family
not paying rent
Secondary dwelling occupied by family
paying rent
Secondary dwelling occupied
by tenants
Total
Number of dwellings 10 57 50 11 100 228
Can estimate water consumption
10% 14% 46% 36% 47% 36%
Cannot estimate water consumption
90% 86% 54% 64% 53% 64%
There were several questions included in the household questionnaire that were aimed at obtaining information on perceptions with regard to water consumption and affordability. Respondents were asked to respond to a number of statements on a scale of 1 to 5, with 1 being “strongly agree”, 3 being “neutral” and 5 being “strongly disagree”. One of the statements was “You know how much water those of you in this house use”. The average response to this statement by different household types is shown in the table below.
Table 37: Average response by household type to statement: “You know how much water those of you in this house use”
Single dwelling
Main dwelling
Secondary dwelling
occupied by family not
paying rent
Secondary dwelling
occupied by family
paying rent
Secondary dwelling
occupied by tenants
Number of dwellings 10 57 50 11 100
Average score 4.50 4.02 3.48 3.45 3.20
Occupants of single and main dwellings disagreed more strongly with the statement “You know how much water those of you in this house use” than occupants of secondary dwellings.

The impact of large consumer unit size on access to water and sanitation services
35
The tables above suggest that ability to estimate consumption is related to the number of people in the dwelling: recall that the average household size of single and main households is larger than that for secondary households. This suggestion does appear to be borne out by the numbers. There were 173 households surveyed that comprised four or fewer people. 42% of these households stated that they could estimate the water consumption by the occupants of their dwelling. There were 55 households comprising five or more people. Only 18% of these households said that they could estimate the water consumption by the occupants of their dwelling.
In sum, the data indicates that the occupants of the main dwelling on a multiple dwelling plot, who are responsible for paying the water and sanitation bill, do not have a good idea of how much water people on the plot are using.
There are also indications from the focus group discussions that landlords find it difficult to control the water consumption of their tenants, or to encourage them to use water sparingly. According to a landlord in one of the focus groups the tenant uses lots of water and “when you advise him not to waste water he gets angry and says ‘I pay the rent’”. Another respondent stated, “They use the electricity and water and they expect to pay R200 only.” The landlords consistently expressed the opinion that it was not possible to persuade the tenants to use water more sparingly. In exchange for the monthly rental payment, tenants thus effectively have access to unlimited volumes of water and sanitation, with no consequences for excessive consumption. In the focus groups, landlords list tenants leaving taps running while they brush their teeth, doing several rinses of laundry and washing pots under the tap instead of in a basin as ways in which tenants are wasteful of water. The full affordability burden of the resulting water and sanitation bill is effectively borne by the occupants of the main household.
5.9 Concluding comments Levels of water consumption for the stands for which actual consumption data were available were 25.5 kl per month on average. This translates to about 82 litres of water per person per day, on average. Almost half of the consumer units surveyed (28 out of 58) used 70 litres per person per day or less. This corresponds with the WHO’s estimates of consumption by households with a yard tap, if toilet flushing is factored in at two flushes of 10 litres per person per day. A further 19 consumer units (33% of those surveyed) use more than 70 but less than 100 litres per person per day, while 11 consumer units (19%) use more than 100 litres a day, which is more in line with households with in-house water than with water in the yard.
Analysis based on data obtained from the water diaries indicated that there is a realistic set of water use activities that can explain this high consumption. For large consumer units, consumption is driven by personal water use activities that are undertaken every day by each person making up the consumer unit. The water diaries indicated that the volume of water used each day for bathing was between 15 and 25 litres per person, significantly higher than the minimum volume of 7 litres per person per day recommended for bathing in the literature. This higher use of water for bathing appears to be the factor driving the relatively high total consumption by the stands surveyed.
In all of the multiple dwelling consumer units surveyed, the occupants of the main household pay the water and sanitation bill. For the majority of backyard residents who pay rent (92%), payment for water is assumed to be included in the rent. There is no perceived limitation on the amount of consumption of water and sanitation that this allows. So in the vast majority of cases, the burden of the water and sanitation bill falls on the main household (or on the single household in the case of plots with only one

The impact of large consumer unit size on access to water and sanitation services
36
dwelling on them), and must be paid out of the income of that household, including rent.
There were 51 consumer units for which both water consumption data and income data for the single or main household was available. Of these, 39 (or 76%) receive a water and sanitation bill that is in excess of 5% of their monthly income. This indicates that affordability is a problem for the majority of the households for which data was available.
Although the household questionnaires did not ask whether households were registered as indigent (free basic water is available only to registered indigents in Tshwane since 1 July 2007), there are 26 main households that might qualify. If these households are excluded from the affordability analysis, then 22 of the remaining 32 single or main households receive a bill that is in excess of 5% of their income. In other words, 43% of the single or main households for whom data was available receive a water and sanitation bill that is in excess of 5% of their monthly income, even taking indigent registration into account.
The main household on a multiple dwelling plot has limited ability to control the consumption of water and sanitation by households living in backrooms. Only two of the 68 single or main households on the stands surveyed said that they could estimate water consumption by all people on the stand, and comments from the focus group discussions indicated that landlords cannot control the consumption of services by tenants, who perceive the fact that they pay rent to mean that their access to services cannot be denied or limited (“when you advise him not to waste water he gets angry and says ‘I pay the rent’”.). So main households on multiple dwelling plots are likely to find it difficult to increase the affordability of their water and sanitation by limiting consumption by the stand as a whole.
6 Conclusions
This study did not assess prevalence of large consumer units in Tshwane overall. However, it did find that 15% of the large consumer units surveyed occupied a single dwelling. So the problem of large numbers of people sharing a single water connection should not be considered to be confined to plots with large numbers of dwellings on them.
6.1 Access to water and sanitation facilities All of the households comprising the large consumer units surveyed had on-site access to water and sanitation infrastructure.
Facilities in the yard are shared between relatively large numbers of people (10 people per yard toilet, on average, and 9 people per yard tap).
Occupants of backyard dwellings in large consumer units consisting of households sharing multiple dwellings may experience inhibited access to services in some cases, as landlords may attempt to deny access to services.
6.2 Affordability of water and sanitation The average volume of water consumed per month for those consumer units for which consumption data was available was 25.5 kl, which translates to about 82 litres per person per day. About half of the consumer units used 70 litres per person per day or

The impact of large consumer unit size on access to water and sanitation services
37
less, the WHO’s estimate of average consumption by households with on-site water (WHO, 2003). For the other half, water consumption was higher than expected. Analysis of data from the water diaries suggested that this may be due to relatively high volumes of water (about 20 litres per person per day) used for bathing.
The full burden of high water and sanitation bills resulting from this high water consumption is borne by the main household on plots with multiple households. If there are rent-paying tenants occupying backyard dwellings, then their rental payments are intended to cover the cost of water and sanitation services. However, these payments are not tied to water consumption levels, so backyard households effectively pay a flat rate for as much water as they want. In focus group discussions landlords indicated that they found it difficult to persuade tenants to limit their water consumption.
It thus appears that affordability of water and sanitation is not a problem for households living in backyard accommodation. Although they do not have access to the highest levels of service available (in-house water and sanitation), they effectively receive unlimited access to water in exchange for their rental payments every month. Backyard households who pay rent were also found to be relatively well-off financially (although a monthly household income of about R2 000 per month is not high by any means), compared to the residents of main or single households. Their rental payments are about R200 on average, about 10% of monthly income.
Affordability of water and sanitation is, however, a critical constraint for those large consumer units that comprise family members only, either in a single dwelling or multiple dwellings, with no rental payments made between them. The income of these consumer units is significantly lower than that of those with rent-paying members, but water consumption is not correspondingly lower. As a result, water and sanitation bills are less affordable for these consumer units.
6.3 Implications for policy This research suggests that large consumer units cannot be viewed simply as a homogenous group. Different types of consumer units, and the different households making up those consumer units, face different challenges with respect to water and sanitation. Nuanced policy approaches will be necessary to help to alleviate these differing challenges.
Challenges faced by rent-paying backyard occupants
The key challenge faced by rent-paying backyard occupants, whether family or tenants, is the level of water and sanitation infrastructure to which they have access. These households typically use a yard tap and yard toilet, which they share with large numbers of people.
Suggestions that the correct approach to backyard living is to upgrade services available to backyard tenants and meter them separately have been made for some time now (see for example Crankshaw et al., 2000). In fact, the Gauteng Department of Housing is currently piloting a programme upgrading backyard accommodation in
Orlando East in Soweto, Johannesburg. If this pilot is successful, the department plans to roll the programme out more widely. Such approaches will go a long way to

The impact of large consumer unit size on access to water and sanitation services
38
improving the access of tenant households to water and sanitation, although they might face opposition from landlords8.
Note that if backyard upgrade programmes include the separate metering of backyard households, then rent-paying occupants might start to face affordability issues. They are currently ‘buffered’ from such issues by the fact that water and sanitation payments are included in rent.
Challenges faced by landlords
The key challenge faced by landlords is with the affordability of water and sanitation services. Having rent-paying residents in backyard rooms does improve the affordability of the water and sanitation account for the occupants of the main dwelling, so landlords do not face as much of an affordability constraint as large families (discussed below). Affordability remains a challenge, however.
In particular, landlords are failed by rising block water tariffs. Such tariffs are premised on the assumption that lower income households can limit their water use in order to remain in the lower tariff blocks and thus pay less for water. This is difficult for large consumer units, and landlords find it particularly hard to limit the water consumption of those living in other dwellings. As a result, these consumer units pay relatively high rates per kl for water and sanitation.
Separate metering of backyard units would remove this issue entirely. In the interim, or if this does not occur, there are some things that can be done to assist landlords.
Providing more than 6 kl of water free to these larger consumer units would go some way to alleviating the affordability constraints that they currently experience. In addition, considering alternative tariff structures or restructuring tariff blocks to increase the size of the lower cost blocks would also help. Of course, any tariff restructuring should be accompanied by proper analysis, preferably based on a good understanding of the price elasticity of demand for water, in order to assess the likely impacts on total water revenue and water conservation. Such changes should also be supported by education around wise use of water.
Challenges faced by large families
Large families, either sharing a single dwelling or spread across several dwellings on a plot, face the most significant challenges with regard to affordability. Their incomes are the lowest of the groups assessed in this study, and they face the same issues with high volumes of water consumption that are faced by landlords. Separate metering of backyard units will not assist these families, although increasing Free Basic Water allocations and restructuring tariffs will.
In particular, these families are being failed by current indigent or other support policies that consider household income as a criterion for support. Most such policies are not clear about how a ‘household’ is defined. In addition, they do not consider the number of people that the household income supports. Income per person in the household would be a more useful criterion from the perspective of large families, with a carefully thought through definition of what a ‘household’ comprises.
8 Although the Orlando East pilot has apparently received a positive response, comments in the focus
group discussions indicate that landlords currently renting out backyard rooms may perceive this as the municipality wanting to profit from their properties, and are afraid that they will lose rental income.

The impact of large consumer unit size on access to water and sanitation services
39
References
Budlender, D (1998) Women and men in South Africa, Pretoria: Statistics SA
City of Tshwane (?) Social Package Policy. Available at http://www.tshwane.gov.za/documents/finance/SocialPackagePolicy.pdf
CoJ (City of Johannesburg) (2007) Water consumption patterns in the City of Joburg, unpublished report produced by PDG for the City of Joburg
CoJ www.joburg.org.za/services/water1.stm, Accessed in February 2008.
Crankshaw, O, Gilbert, A and Morris, A (2000) Backyard Soweto International Journal of Urban and Regional Research, 24(4): 841 to 857, Blackwell: Oxford.
Deaton, A and Grosh, M (2000) Consumption in Grosh, M and Glewwe, P (2000) Designing household survey questionnaires for developing countries: Lessons from 10 years of LSMS experience, Vol 1, Washington DC: World Bank
DWAF (Department of Water Affairs and Forestry) (1997) The White Paper on a National Policy for South Africa
DWAF (2003) Strategic Framework for Water Services: Water is life, sanitation is dignity
Gleick P.H. (2006) Affidavit to the WLD in Mazibuko and others vs The City of Johannesburg and others. High Court of South Africa: Witwatersrand Local Division (WLD), Case No: 06/13865.
Finmark (2006) Small scale landlords: Research findings and recommendations, Final report, Johannesburg: FinMark Trust
Komives, K, Foster, V, Halpern, J and Wodon, Q (2005) Water, Electricity and the Poor: Who Benefits from Utility Subsidies? World Bank: Washington DC
SAWC (South African Water Caucus) (2003) Accessing the utility of Free Basic Water, presentation to the Parliamentary Portfolio Committee of Water Affairs and Forestry, Viewed on: www.pmg.org.za
StatsSA (Statistics South Africa) (2004) Labour Force Survey, Pretoria: Statistics South Africa
uSwitch, http://www.uswitch.com/Water/How-Much-Water-Use.html, Accessed in June 2008
Van Schalkwyk, A (1996) Guidelines for the Estimation of Domestic Water Demand of Developing Communities in the Northern Transvaal Water Research Commission Report No. 480/1/96 Pretoria: Water Research Commission.
Van Vuuren, DS, Van Zyl, HJD, Veck, GA, Bill, MR (2004) Payment strategies and price elasticity of demand for water for different income groups in three selected urban areas, Water Research Commission Report No. 1296/1/04 Pretoria: Water Research Commission.
Van Zyl, HJ , Van Zyl, JE , Geustyn, L , Llemobade, A and Buckle, JS (2007) Water Consumption Levels in Selected South African Cities, Water Research Commission Report No. 1536/1/06 Pretoria: Water Research Commission.

The impact of large consumer unit size on access to water and sanitation services
40
Veck, G and Bill, M (2000) Estimation of the residential price elasticity of demand for water by means of a contingent valuation approach, Water Research Commission Report No. 790/1/00, Pretoria: Water Research Commission.
WHO (World Health Organisation) (2003) Domestic water quantity, service level and health WHO: Geneva
WHO (2005) Minimum water quantity needed for domestic use in emergencies, Technical Note No. 9, Geneva: WHO
WRC (Water Research Commission) (?) Have you saved some water today? http://www.wrc.org.za/downloads/education/Water%20in%20the%20home.pdf, Accessed on 19 June 2008

The impact of large consumer unit size on access to water and sanitation services
41
Appendix 1: Description of different household types
Demographic profile
The table below shows the age profile for the different dwelling types. Note that children are defined as 18 years and younger, youth as 19 to 25 years, adult as 26 to 64 years and pensioner as 65 years and older.
Although the legal working-age in South Africa is 15 years, labour force data indicate that participation rates are extremely low in the 15 to 24 year group (see for example StatsSA, 2004). For this reason, adult (and thus working-age) was defined as above 25 years in this study.
Table 38: Average percentage of occupants of a dwelling that fall into different age groups for each dwelling type
Single dwelling
Main dwelling
Secondary dwelling
occupied by family not
paying rent
Secondary dwelling
occupied by family paying
rent
Secondary dwelling
occupied by tenants
Number of dwellings 10 57 50 11 100
% children 39% 35% 28% 40% 20%
% youth 13% 13% 31% 12% 17%
% adults 42% 40% 41% 38% 62%
% pensioners 4% 11% 0% 9% 1%
TOTAL 100% 100% 100% 100% 100%
Family in secondary dwellings who pay rent seem to be similar to the occupants of the main dwelling in terms of age profile. Both of these groups have a high percentage of pensioners compared to the other groups.
The age profile of the occupants of single dwellings is similar to that of the occupants of main dwellings and family in secondary dwellings that pay rent, except for the lower percentage of pensioners.
The remaining two groups display quite distinctive age profiles, with a much higher percentage youth among family in secondary dwellings not paying rent compared to the other groups and a very strong dominance by working age adults in secondary dwellings occupied by tenants.
The age profiles described above and shown in the table are of particular interest with regard to what they may suggest in terms of access to income by the different household types:
Occupants of main dwellings and family members occupying secondary dwellings and paying rent may have better access to state pensions, an important source of income for many low income families in South Africa.
The average age of the occupants of secondary dwellings who do not pay rent appears to be younger than that of the other groups, indicating poorer access to income.

The impact of large consumer unit size on access to water and sanitation services
42
Tenants living in secondary dwellings would appear to have the best potential to access income, with a far larger proportion of working age when compared with other groups.
The table below shows the gender profile of the occupants of the different dwelling types.
Table 39: Average percentage of occupants of a dwelling that are male for each dwelling type
Single dwelling
Main dwelling
Secondary dwelling
occupied by family not
paying rent
Secondary dwelling
occupied by family paying
rent
Secondary dwelling
occupied by tenants
Number of dwellings 10 57 50 11 100
% men 41% 45% 67% 61% 63%
TOTAL 100% 100% 100% 100% 100%
The proportion of people living in secondary dwellings that are male is significantly higher than that living in single or main dwellings.
As with age profile, gender profile is significant in terms of what it suggests regarding access to income as male incomes in South Africa remain higher than female incomes (see Budlender, 1998, for example).
Education
The table below shows the education profile for the occupants of the different dwelling types.
Table 40: Average percentage of occupants of a dwelling that have various levels of education
Single dwelling
Main dwelling
Secondary dwelling
occupied by family not
paying rent
Secondary dwelling
occupied by family paying
rent
Secondary dwelling
occupied by tenants
Number of dwellings 10 57 50 11 100
None 1% 4% 1% 3% 3%
Some primary 12% 23% 3% 17% 17%
Some secondary 69% 59% 88% 67% 71%
Some tertiary 8% 2% 2% 0% 2%
Don’t know/no response 9% 11% 6% 13% 7%
TOTAL 100% 100% 100% 100% 100%
A fairly large proportion of the respondents did not respond to the question regarding education. The figure below shows the educational profile, excluding those who did not respond.

The impact of large consumer unit size on access to water and sanitation services
43
0%
10%
20%
30%
40%
50%
60%
70%
80%
90%
100%
Main dw elling Single dw elling Fam no rent Fam rent Tenant
% o
f o
ccu
pan
ts o
f d
wel
ling
% none % some primary % some secondary % some tertiary
Figure 11: Mix of education level by dwelling type
There are relatively low levels of education among residents of main dwellings, with 30% having no higher than primary education.
There are comparatively high levels of education among family paying no rent, with 94% have at least some secondary education.
There are relatively high levels of some tertiary education among residents of single dwellings, but note that only 10 of these dwellings were surveyed, a relatively small sample even compared to the other dwelling types.
Employment status
The table below shows the percentage of residents of dwellings of various types that fall into different employment categories. Note that “not employed” includes pensioners, the disabled, children or scholars, housewives not looking for work and others not looking for work.
Table 41: Percentage of residents of dwellings that fall into various employment categories
Single dwelling
Main dwelling
Secondary dwelling
occupied by family not
paying rent
Secondary dwelling
occupied by family paying
rent
Secondary dwelling
occupied by tenants
Number of dwellings 10 57 50 11 100
Employed 18% 20% 29% 37% 62%
Not employed 53% 62% 32% 49% 23%
Unemployed 29% 19% 37% 14% 15%
No response 0% 0% 2% 0% 0%
Of note is the higher levels of employment among those living in backyard dwellings, compared to those in main or single dwellings. In particular, there are high levels of employment among tenants. The highest level of unemployment is among family living in backyard dwellings and paying no rent.

The impact of large consumer unit size on access to water and sanitation services
44
The table below shows the percentage of dwellings of each dwelling type that have at least one occupant that is employed.
Table 42: Percentage of dwellings of each dwelling type that have at least one occupant who is employed
Single dwelling
Main dwelling
Secondary dwelling
occupied by family not
paying rent
Secondary dwelling
occupied by family paying
rent
Secondary dwelling
occupied by tenants
Number of dwellings 10 57 50 11 100
80% 58% 42% 73% 95%
Almost all tenant households have at least one member formally employed. In contrast, a relatively low proportion of secondary dwellings occupied by family not paying rent that have at a member formally employed.
0%
10%
20%
30%
40%
50%
60%
70%
80%
90%
100%
Main dw elling Single dw elling Fam no rent Fam rent Tenant
% o
f o
ccu
pan
ts o
f d
wel
ling
Self employed part time Self employed full time Formally employed part time
Formally employed full time Informally employed part time Informally employed full time
Figure 12: Nature of employment for those who are employed by dwelling type
For those who are employed, the predominant employment by main dwelling and family paying no rent is informal, while for single dwellings and households in backyard dwellings who pay rent it is formal.
Income
The table below thus shows the average income per capita in the different dwelling types.

The impact of large consumer unit size on access to water and sanitation services
45
Table 43: Average monthly income per capita for different dwelling types9
Single dwelling
Main dwelling
Secondary dwelling occupied by family
not paying rent
Secondary dwelling occupied by family
paying rent
Secondary dwelling occupied
by tenants
Total
Number of dwellings 10 57 50 11 100 228
Average monthly income per capita (R)
456 584 346 1 014 968 715
The data in this table suggests that backyard dwellers should not necessarily be regarded as poor, at least in comparison with those living in single or main dwellings. Those backyard dwellers that are paying rent (both family and tenants) are in fact better off than their landlords, if income per capita is used as a measure.
Income per capita is determined by the size of the incomes received by income earners in a dwelling, as well as the mix between income earners and non-income earners.
The table below shows that average income per income earner is highest for income earners living in single dwellings (although it should be recalled that only 10 households in single dwellings were surveyed) and significantly lower for income earners who are family members living in backyard dwellings and not paying rent, when compared with residents of other dwelling types.
Table 44: Average monthly income per income earner for different dwelling types
Single dwelling
Main dwelling
Secondary dwelling occupied by family
not paying rent
Secondary dwelling occupied by family
paying rent
Secondary dwelling occupied
by tenants
Total
Number of dwellings 10 57 50 11 100 228
Average monthly income per income earner (R)
2 257 1 252 553 1 653 1 337 1 199
So part of the reason for the relative affluence of the occupants of rent-paying backyard dwellings is that the income earners in these dwellings earn relatively well.
The other part of the story emerges when we look at the percentage of the occupants of a dwelling that receive an income.
9 Calculated by taking the total income earned by income earners in each dwelling and dividing by the
total number of people living in that dwelling.

The impact of large consumer unit size on access to water and sanitation services
46
Table 45: Percentage of occupants of different dwelling types who receive an income
Single dwelling
Main dwelling
Secondary dwelling
occupied by family not
paying rent
Secondary dwelling
occupied by family
paying rent
Secondary dwelling occupied
by tenants
Total
Number of dwellings 10 57 50 11 100 228
Percentage of occupants that receive an income
31% 48% 60% 49% 70% 59%
Together, Table 43, Table 44, Table 45 and and may be summarised as follows:
Income earners in single dwellings earn well, but must support large numbers of non-income earners. As a result, income per capita for this group is relatively low.
Income earners in main dwellings earn a moderate to low income, and must support moderate numbers of non-income earners. As a result, income per captain for this group is low, but not as low as that for occupants of single dwellings or family members living in backyard rooms and paying no rent.
Income earners who fall into the latter group earn low incomes, but support relatively few non-income earners. Income per capita in this group is low.
Income earners who fall into the group of family members living in backyard rooms and paying rent earn relatively high incomes, and support moderate numbers of non-income earners. As a result, income per capital in this group is relatively high.
Finally, income earners who are tenants living in backyard rooms earn moderately well and support relatively few dependents. This results in relatively high incomes per capita.
Note that the terms used above are relative: the maximum reported monthly income received by any income earner was R3 500 per month, which can hardly be regarded as high.
Income sources
The table below shows the access to income by different household types, measured by the percentage of different household types that contain at least one income earner receiving income from that source.

The impact of large consumer unit size on access to water and sanitation services
47
Table 46: Percentage of dwellings of each dwelling type that have an occupant who receives income from this income source
Single dwelling
Main dwelling
Secondary dwelling
occupied by family not
paying rent
Secondary dwelling
occupied by family paying
rent
Secondary dwelling
occupied by tenants
Number of dwellings 10 57 50 11 100
Formal employment 80% 35% 28% 64% 79%
Informal employment 10% 30% 20% 9% 25%
Child maintenance 0% 2% 2% 0% 0%
Pension 50% 51% 0% 27% 1%
Disability grant 20% 11% 2% 0% 0%
Child support grant 40% 28% 16% 36% 16%
Rent 0% 67% 0% 0% 0%
Family / friends 0% 9% 24% 0% 7%
Note in particular the low proportion of family members living in backyard dwellings and paying no rent that have a member formally employed, as well as the high proportion of single dwellings that contain a member who is receiving a state grant (pension, child support grant or disability grant).
The table below indicates how important access to these income sources is, by showing the average amount received from each source by those who receive some income from the source.

The impact of large consumer unit size on access to water and sanitation services
48
Table 47: Average income earned per dwelling by those dwellings that declared some income from this source
Single dwelling
Main dwelling
Secondary dwelling
occupied by family not
paying rent
Secondary dwelling
occupied by family paying
rent
Secondary dwelling
occupied by tenants
Number of dwellings 10 57 50 11 100
Formal employment 4,725 3,143 1,789 2,243 2,056
Informal employment 1,350 772 1,073
Child maintenance 350 400
Pension 1,044 1,011 1,160 400
Disability grant 870 788 870
Child support grant 200 360 325 350 250
Rent 530
Family / friends 390 129 400
For those who receive income from a source, formal employment is the best source of income. A relatively high amount of income is received from pensions.
The table below shows the average income earned per dwelling from each income source, including those who earn nothing from the source. So this table takes into account the fact that some households do not receive any income from some sources.

The impact of large consumer unit size on access to water and sanitation services
49
Table 48: Average income earned per dwelling from this source for all dwellings, including those who earn nothing from this source
Single dwelling
Main dwelling
Secondary dwelling
occupied by family not
paying rent
Secondary dwelling
occupied by family paying
rent
Secondary dwelling
occupied by tenants
Number of dwellings 10 57 50 11 100
Formal employment 3,150 880 398 1,570 1,566
Informal employment - 405 154 - 295
Child maintenance - 7 9 - -
Pension 725 518 - 348 5
Disability grant 290 95 19 - -
Child support grant 67 115 58 120 43
Rent - 328 - - -
Family / friends - 39 30 - 33
TOTAL 4,232 2,387 668 2,038 1,942
Once the fact that not all dwellings receive income from a source is factored in, it becomes apparent that single dwellings are relatively well off, and in particular receive good income from formal employment.
Finally, the table below shows the contribution of each income source to total income.

The impact of large consumer unit size on access to water and sanitation services
50
Table 49: Contribution of income source to total income for those dwellings that receive income from this source
Single dwelling
Main dwelling
Secondary dwelling
occupied by family not
paying rent
Secondary dwelling
occupied by family paying
rent
Secondary dwelling
occupied by tenants
Number of dwellings 10 57 50 11 100
Formal employment 74% 37% 60% 77% 81%
Informal employment 0% 17% 23% 0% 16%
Child maintenance 0% 0% 1% 0% 0%
Pension 21% 25% 0% 17% 0%
Disability grant 7% 4% 3% 0% 0%
Child support grant 3% 5% 9% 7% 2%
Rent 0% 17% 0% 0% 0%
Family / friends 0% 2% 5% 0% 2%
The table suggests that main dwellings have diversified their income sources. Rent makes up quite a large proportion of their income.
Pensions are a significant proportion of income for those dwellings that receive them.
Permanence of tenure and remittances
Previous studies into backyard living have shown that tenants in backyard rooms regard this accommodation as transitional (see for example Finmark, 2006). The findings of this study support this view.
Firstly, tenants (non-family members renting backyard rooms) have been living in their current accommodation for shorter periods of time (typically 1 to 3 years) than other household types (typically 4 to 5 years).

The impact of large consumer unit size on access to water and sanitation services
51
Table 50: Percentage of households of different types that have been living in current accommodation for time periods
Single dwelling
Main dwelling
Secondary dwelling
occupied by family not
paying rent
Secondary dwelling
occupied by family
paying rent
Secondary dwelling occupied
by tenants
Total
Number of dwellings 10 57 50 11 100 228
1 year 0% 0% 2% 0% 25% 11%
2 years 0% 4% 2% 0% 35% 17%
3 years 0% 0% 4% 0% 17% 8%
4 years 20% 23% 16% 9% 11% 15%
5 years 80% 74% 76% 91% 12% 48%
Secondly, tenants had moved within the community more than other household types. Only 16 of the 228 households surveyed had moved within the community in the last five years, and all 16 of these households were tenant households.
Thirdly, the proportion of tenants who state that they are definitely not going to move out of their current accommodation in the next year is smaller than that for other household types (54% of tenants compared to 78% of non-tenants).
Table 51 : Percentage of households of different types intending to move from current accommodation in the next year
Single dwelling
Main dwelling
Secondary dwelling
occupied by family not
paying rent
Secondary dwelling
occupied by family
paying rent
Secondary dwelling occupied
by tenants
Total
Number of dwellings 10 57 50 11 100 228
No 100% 86% 66% 73% 54% 68%
Yes 0% 12% 24% 27% 30% 23%
Don’t know 0% 2% 10% 0% 16% 10%
Finally, 83% of tenants said that they had another place that they called home, compared to only 14% of other household types.

The impact of large consumer unit size on access to water and sanitation services
52
Table 52: Percentage of households of different types that state that they have another place that they call home
Single dwelling
Main dwelling
Secondary dwelling
occupied by family not
paying rent
Secondary dwelling
occupied by family
paying rent
Secondary dwelling occupied
by tenants
Total
Number of dwellings 10 57 50 11 100 228
Have another place that I call home
0% 25% 6% 9% 83% 44%
This has implications for expenditure, as income earners with another home somewhere may send remittances back to that home. This is in fact found to be the case: of the 101 households who said that they had another home, 68 sent money to that home. Money was sent home monthly by 38 households and several times a year by 31 households. One household sent money home once a year.
Table 53 : Number of households who state that they have another home, and who send money to that home by dwelling type
Single dwelling
Main dwelling
Secondary dwelling occupied by family
not paying rent
Secondary dwelling occupied by family
paying rent
Secondary dwelling occupied
by tenants
Total
Number of dwellings 10 57 50 11 100 228
Have another place that I call home
0 14 3 1 83 101
Send money home
Every month 3 1 1 31 36
Several times a year 0 1 0 30 31
Once a year 0 0 0 1 1
Those who sent money home every month sent between R150 and R1 500 per month, with an average of R544. There did not seem to be a clear relationship between the monthly income reported by the household and the amount sent in remittances each month.
When considering the relative financial position of tenant households in backyard dwellings, compared to other household types, the draw that remittances have on income should be borne in mind. It was noted previously that the reason that tenant households have relatively high incomes per capita is that income earners in tenant households earn reasonably well, and share income with relatively few non-income earners in the dwelling. However, 62% of all tenant households are sending money to another home on a reasonably regular basis (31 of the 100 tenant households

The impact of large consumer unit size on access to water and sanitation services
53
surveyed send money home every month, and 30 do so several times a year). This means that income is effectively shared with people living outside the physical dwelling and this should be borne in mind when considering relative levels of income per capita.