Embed Size (px)
Citation preview
Inclusive and Sustainable Industrial Development Working Paper Series WP 2 | 2020
THE IMPACT OF INDUSTRIAL ENERGY EFFICIENCY ON ECONOMIC AND SOCIAL INDICATORS
DEPARTMENT OF POLICY, RESEARCH AND STATISTICS
WORKING PAPER 2/2020
The impact of industrial energy efficiency on economic
and social indicators
Alessandra Celani de Macedo UNIDO
Nicola Cantore UNIDO
Laura Barbier UNIDO
Marco Matteini UNIDO
Giorgia Pasqualetto UNIDO
UNITED NATIONS INDUSTRIAL DEVELOPMENT ORGANIZATION
Vienna, 2020

The designations employed, descriptions and classifications of countries, and the presentation of the
material in this report do not imply the expression of any opinion whatsoever on the part of the Secretariat
of the United Nations Industrial Development Organization (UNIDO) concerning the legal status of any
country, territory, city or area or of its authorities, or concerning the delimitation of its frontiers or
boundaries, or its economic system or degree of development. The views expressed in this paper do not
necessarily reflect the views of the Secretariat of the UNIDO. The responsibility for opinions expressed
rests solely with the authors, and publication does not constitute an endorsement by UNIDO. Although
great care has been taken to maintain the accuracy of information herein, neither UNIDO nor its member
States assume any responsibility for consequences which may arise from the use of the material. Terms
such as “developed”, “industrialized” and “developing” are intended for statistical convenience and do not
necessarily express a judgment. Any indication of, or reference to, a country, institution or other legal entity
does not constitute an endorsement. Information contained herein may be freely quoted or reprinted but
acknowledgement is requested. This report has been produced without formal United Nations editing.
iii
Table of Contents
1 Introduction ........................................................................................................................... 1
2 Literature review ................................................................................................................... 3
3 A case study of EnMS implementation in North Macedonia ................................................ 5
4 Methodology ......................................................................................................................... 7
4.1 Conceptual framework .................................................................................................. 7
4.2 Model formalization .................................................................................................... 13
4.3 Time dimension: a comparative static exercise ........................................................... 16
5 Data sources ........................................................................................................................ 17
5.1 North Macedonian input-output table ......................................................................... 17
5.2 Employment data ......................................................................................................... 17
6 Main findings ...................................................................................................................... 18
7 Final remarks and possible extensions ................................................................................ 20
Bibliography ................................................................................................................................ 21
Appendix A ................................................................................................................................. 23
Appendix B ................................................................................................................................. 24
Appendix B ................................................................................................................................. 26
Appendix C ................................................................................................................................. 28
List of Tables
Table 1: Energy cost savings obtained by participant North Macedonia firms in the first year of
implementation of the EnMS .......................................................................................... 7
Table 2: Reallocated resources resulting from energy savings under different scenarios ........... 13
Table 3: Assumed trajectory of energy savings from no- and low-cost measures ...................... 16
Table 4: Impact of EE measures on value added and employment ............................................. 19
Table 5: Average spending composition ..................................................................................... 23
Table 6: Macedonian 2010 Symmetric Input-Output Product Groups ....................................... 26
Table 7: Industry Classification of Employment in Macedonia, 2016 ........................................ 28

iv
List of Figures
Figure 1: Demand shocks created by the introduction of EE improvements ................................ 9
Figure 2: Domestic impact and leakages of the reduction in the demand for energy and the re-
spending of cost savings ............................................................................................. 11
Figure 3: Gross output of the North Macedonian economy, 2010 .............................................. 24
Figure 4: Value added of the North Macedonian economy, 2010 .............................................. 24
Figure 5: Employment by industry in North Macedonia, 2016................................................... 25
v
Abstract
Inclusive and sustainable industrial development implies environmental friendly industrial
growth with positive implications for social targets such as employment generation. One of the
most important options available to policymakers for reducing CO2 emissions is industrial energy
efficiency, which is particularly relevant for the discussion on green industrialization. Despite this
intuitive concept, the economics measurement toolkit still lacks a methodological framework to
analyse the extent to which energy efficiency interventions can generate simultaneous economic,
environmental and employment-related improvements to boost inclusive and sustainable
industrial development. This study fills this gap by introducing an original approach based on
input-output tables to estimate the impact of improvements in industrial energy efficiency on
value added, employment and energy savings among industries in the Republic of North
Macedonia. The results show that triple dividends are possible in terms of inclusive and
sustainable industrial development. Whereas a positive impact on employment is found in every
scenario, a positive outcome in terms of value added essentially depends on the country’s capacity
to produce goods that accommodate firms’ increasing demand from their use of energy cost
savings.
Keywords: Economics, input-output analysis, employment creation, energy efficiency
JEL code: Q40, Q49
1
1 Introduction
Industrial activities consume a substantial share of energy at the global level, accounting for 25
per cent of total energy consumption at the global level in 20171. Relying heavily on energy
produced from fossil fuels, industries’ energy consumption contributes to the emission of
greenhouse gases. While progress has been made by shifting towards renewable energy sources,
industrial development and growth have increased energy consumption and have further increased
emission levels. Improving the industrial sector’s energy efficiency (EE) is crucial for decoupling
economic growth from the negative environmental and climate impacts of industrial development.
Improvements in industrial EE have been found to be one of the most important and cost-effective
means of achieving industrial emissions mitigation (Rosen & Guenther, 2015; Worrell, Bernstein,
Roy, Price, & Harnisch, 2009). EE investments are typically highly cost-effective in the short-run
compared to other mitigation options as they result in a net economic benefit for the investor
through the almost immediate cost savings generated from the higher energy efficiency itself
(McKinsey, 2010)
The benefits of investment in EE go beyond its role in mitigating emission, as it is also associated
with economic growth and job creation. EE investments have a rebound effect on the economy as
a whole, as the effects of the higher efficiency spill over into the rest of the economy. From the
firm’s perspective, the improved efficiency in the use of energy reduces costs and increases their
production’s competitiveness. This increase in competitiveness leads to an expansion of
production and other indirect impacts of the initial investment.
The positive economic impacts also generate positive social effects, for example, promoting the
creation of jobs. In this study, we evaluate the socio-economic impacts of the implementation of
UNIDO’s EnMS Capacity-Building and Implementation (CBI) Programme in the Republic of
North Macedonia (hereinafter North Macedonia) during 2015 and 2016.
Using data collected by Matteini et al. (2017) in a comprehensive cost-benefit analysis (CBA),
we evaluate the direct and rebound effects of the programme’s implementation. This study
distinguishes between three main channels through which EE impacts employment: (a) through
the initial investment in EE of industrial firms, (b) through the consequent reduction in demand
for energy resulting from the EE increase, and (c) through the re-spending of saved resources
(rebound effects). As a robustness check, we create different scenarios of how participating firms
can choose to re-spend savings. Our results indicate that the implementation of the EnMS
1 International Energy Agency CO2 emissions from fuel combustion database. Data takes into account the
manufacturing sector, construction and industrial energy own use excluding electricity.
2
programme in North Macedonia has a positive impact on job creation and on value added,
depending on the country’s capacity to produce goods.
To the best of our knowledge, this is the first time input–-output models are used to analyse the
impact of projects aimed at improving firms’ EE on both value added and employment by
considering a comprehensive set of transmission channels. This can be very useful for
policymakers in their discussion on the impact of project interventions and for researchers who
can use the standard input-output methodology with an original approach. As is explained in the
following section, previous studies on E differ in terms of objectives (e.g. they identify barriers
to the adoption of EE or analyse the impact of EE on emissions) and methodology (e.g.
econometric studies using firm data or applying a simple top down or bottom up modelling
approach). Even if other studies use the input-output approach applied in the present study, they
do not consider a comprehensive set of transmission channels (EE investments, reduction of
energy demand and re-spending), and/or only evaluate EE improvements on the basis of
modelling assumptions, and/or do not consider the impact on both employment and value added.
The new approach is applied to the case of North Macedonia, in accordance with Fias et al.’s
(2016) claim: “this methodology could be easily transferred to other national settings”. Fias et al.
(2016) introduce a new methodological approach to better understand the industrial sector’s
contribution to long-term climate and energy policy targets, but they do not consider the impact
of firms’ EE on economic and social variables as the present study does.
Measuring the economic and employment benefits that result from EE improvements presents
some challenges. This study contributes to this field of research by developing a novel framework
for evaluating the socio-economic impact of industrial EE improvements obtained through the
implementation of the Energy Management Systems (EnMS) and related programmes. EnMS, in
line with the international standard ISO 50001, offers industrial enterprises a systematic approach
to identify and tackle opportunities for energy savings and drives continuous energy performance
improvements over time. It represents a proven technical management tool and policy instrument
to advance sustainable EE in industry as well as other economic sectors by integrating EE in daily
business operations and investment decisions.
EnMS is a unique type of energy efficiency measure (or best available technology) as it
systematically addresses the management of all those organizational processes, operations,
decisions and behaviours that affect a firm’s energy use and consumption, with the objective of
continually improving the firm’s energy performance. One key element and principle of EnMS
implementation is sustained optimal use and the performance of existing firms’ assets and
3
resources, largely related to efficient energy management processes and operations control.
During the initial phase of implementation of an EnMS, this key principle is always the source of
numerous no-cost and low-cost energy performance improvements and measures that result in
energy consumption reduction. As the EnMS matures and improves over time (years), no-cost
and low-cost opportunities to save energy progressively diminish in favour of more capital-
demanding measures. Taking that aspect into consideration, the implementation and economic
and social impacts of EnMS differ from what has been the focus of many other studies that
evaluate the rebound effects of typically high-cost industrial EE investments. Specifically,
understanding the impact of the implementation of EnMS on job creation is of considerable
importance due to its potential to be implemented in developing economies in light of the low up-
front costs of the measures and subsequent short payback time.
The remainder of this study is organized as follows. Section 2 presents a literature review of the
different methodologies that have been used to evaluate the socio-economic impacts that result
from EE investments. Section 3 elaborates the case study of UNIDO’s EnMS CBI Programme in
North Macedonia. Section 4 discusses the methodology used in this study, and Section 5 describes
the data sources used to apply the respective methodology. Finally, Section 6 presents the main
findings of the study and Section 7 concludes and proposes possible extensions of this analysis.
2 Literature review
The study of the adoption of and barriers to EE has been the subject of substantial research and
investigation (e.g. Palm and Thollander 2010, Trianni et al. 2016). The literature emphasizes the
relevance of micro aspects at firm level such as lack of information, procedural impediments and
commitment of management as key factors explaining the lack of implementation of EE
measures.
The impacts of EE improvements on the economy and employment have been estimated using a
number of different methodologies. These methodologies can be broadly distinguished between
bottom-up and top-down approaches. Bottom-up studies rely on surveys, questionnaires or other
sources of observed data to measure the directly observable economic and social impacts of an
EE measure/programme. Cost-benefit analysis is one of the bottom-up approaches commonly
used to evaluate the impact of EE. The advantage of bottom-up analysis is the absence of
underlying assumptions compared to top-down approaches at the tradeoff that the analysis is only
capable of capturing the directly observable effects. There are two approaches to estimate the
impact of EE on green jobs according to the ILO (2011): 1) the industry approach, which counts
the number of employees at firms that produce green products or services; and 2) the occupational
4
approach, which uses occupation classifications to count the number of employees at all types of
firms engaged in activities that contribute to the greening of the economy. UNIDO (2011)
estimates the payback period for different EE investments of firms in developing countries.
Sorrell et al. (2009) focus on the rebound effect from EE. Improvements in energy services make
them cheaper and this induces increased consumption of such services. By considering the
household sector, Sorrell et al. estimate that the rebound effect is less than 30 per cent. These
contributions are based on firms’ observed behaviour, but they do not take into account the
country’s macroeconomic aspects. A flourishing emerging literature analyses the economic
impact of EE through econometric studies using firm data. Montalbano and Nenci (2019) analyse
the impact of EE on the economic performance of firms in Latin American countries and find a
positive impact on productivity. Cantore et al. (2016) use the World Bank Enterprise Survey data
to study the impact of EE on industrial firms’ total factor productivity in developing countries.
They find a positive impact, albeit heterogeneous across industrial sectors.
Top-down methods are impact evaluation methods based on economic modelling using input-
output (IO) models or computable general equilibrium (CGE) models. Based on the model’s given
underlying assumptions, the method is able to capture the impact of the EE improvements beyond
the directly observable effects. For example, aside from only capturing the reductions in demands
for energy an EE measure/programme may generate, an IO model can estimate the indirect effects
of that reduction on all other sectors of the economy. By using a CGE model, Bataille and Melton
(2017) estimate the impact of EE improvements on Canadian GDP, employment, employment
structure and welfare from 2002 to 2012. They find that EE increased GDP, employment and
welfare over the period 2002 and 2012. The transmission channel according to Bataille and
Melton (2017) is: “Energy efficiency causes a drop in energy demand resulting in a small
transition of investment away from energy producing sectors which is offset by a larger increase
in overall investment and activity in the rest of the economy” (p. 124). EE improvements are
modelled on assumptions and not on observed EE improvements as in the present study. Garrett-
Peltier (2017) uses IO tables to evaluate public and private spending in clean energy and compares
it to the effects of spending on fossil fuels. The study focusses on commercial buildings, not on
the industrial sector, which is the subject of our study. Garrett-Peltier finds that, on average, 2.65
full-time-equivalent (FTE) jobs are created from USD 1 million spent on fossil fuels, while that
same amount of spending would create 7.49 or 7.72 FTE jobs in renewables or EE, respectively.
Brown et al. (2017) use a model for the United States to investigate EE as a strategy to reduce
carbon emissions. They analyse the impacts on mitigation costs and emission reduction, but do
not include employment and value added. Cantore et al. (2017) study the impact of different
scenarios of renewable energy penetration and EE on jobs creation in Africa, but do not
5
specifically consider the industrial sector. They find that greener scenarios and the gradual
phasing out of fossil fuel generate jobs. Montt et al. (2018) use an IO model (MRIO) to assess the
impact of global emissions cap scenarios. They focus on investments and on five categories of
change: 1) gross capital formation, 2) inputs coefficients for technology production, 3) inputs
coefficients for technology use, 4) emissions and employment intensity of production, and 5)
value added shares, but do not explicitly discuss the impact from manufacturing firms’ re-
spending from energy savings, as the present study does. Moreover, energy efficiency
improvements are not calculated “bottom-up” as is the case in the present paper.
Both approaches (top-down and bottom-up) are widely used. Bell et al. (2015) find that both top-
down and bottom-up methodologies are equally used in analyses of employment creation in
studies evaluating EE projects. The bottom-up and top-down methods can be combined in hybrid
methods of impact evaluation. This can be achieved by incorporating the information collected
from the bottom-up approach to define the type of “shock” and resulting impact the economic
model will simulate. Bell et al. (2015) also find that the combination of bottom-up data combined
with IO modelling is one of the most appropriate frameworks for capturing the employment
effects of EE improvements. Rivers and Jaccard (2005) build a hybrid model with the objective
of combining the strengths of the traditional top-down and bottom-up approaches by simulating
consumer and firm behaviour at the technological level. They estimate behavioural parameters of
technology adoption, which are then used to feed an energy-economy model. Blesl et al. (2007)
use the model TIMES to analyse the impacts of efficiency improvement measures on the German
energy system, measuring energy savings, technological development, emissions and costs. The
scope of EE measures is examined by the project ACROPOLIS and does not derive from
modelling assumptions. The results of six scenarios show that the transport sector’s CO2
reduction—using primarily bio-fuels and methanol to achieve the efficiency targets—is the most
expensive, and the residential sector indicates the highest benefits in terms of cost savings.
3 A case study of EnMS implementation in North Macedonia
Over the last two decades, EnMS and related standards (national first and more recently
international ones such as ISO 50001) have shown to be proven policy instruments to improve
EE in industry and to drive a transition towards best available practices and technologies. EnMS
provides a unique methodology to systematically bring together and manage people, information
and technology with the goal of continual improvement of an organization’s energy performance
and the integration of EE in its daily business practices. This organizational framework allows
enterprises to integrate EE in their management practices through fine-tuning production
processes and the improvement of EE of industrial systems (McKane et al., 2009). EnMS

6
establishes the structure and processes to identify, develop and implement management and
technical actions that reduce energy consumption and costs, to generate operation and
maintenance savings and to minimize production downtimes, enabling the firm to achieve and
sustain EE improvements over time. Through reduced energy consumption, EnMS/EE
implementation contributes to the reduction of greenhouse gas (GHG) emissions and to
improvements in competitiveness.
UNIDO’s Industrial Energy Efficiency (IEE) Programme interventions are designed to promote
and support the implementation of energy management systems (EnMS) in line with ISO 50001
and energy systems optimization (ESO) measures. UNIDO’s approach to the implementation of
EnMS and ESO has a strong focus on identifying and implementing first no-cost and then low-
cost measures that can generate immediate energy savings and maximize the energy performance
of existing technological and production assets.
Within the scope of a technical cooperation project funded by the Global Environmental Facility
(GEF), UNIDO implemented an EnMS CBI Programme in North Macedonia during 2015 and
2016, engaging with a number of collaborating enterprises that committed to attending in-depth
training and applying the EnMS methodology. Matteini, Pasqualetto, and Petrovska (2017)
conducted a cost-benefit analysis (CBA) based on the implementation of the EnMS CBI
programme using data collected through verification audits and questionnaires with participants.
Costs associated with the implementation of the programme include costs related to the
implementation of the programme itself (staff time for training, external expert assistance, etc.),
as well as investment costs incurred by the partner enterprises to implement initial energy saving
and efficiency improvement opportunities (e.g. energy meters, sensors, monitoring equipment,
electric motors, etc.). The benefits achieved were measured as energy cost savings obtained by
partner enterprises as a direct result of the implementation of EnMS and all associated
improvement measures.
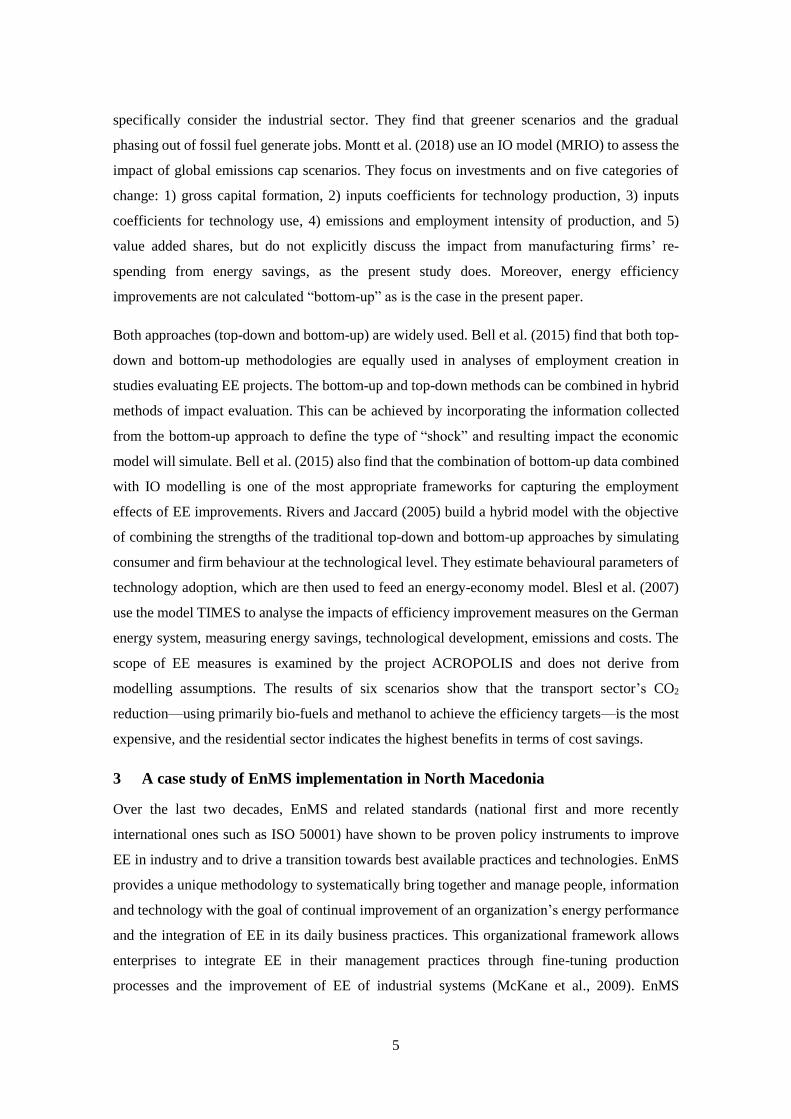
Matteini et al. (2017) find that significant energy savings were obtained by enterprises that
collaborated in the EnMS CBI Programme through the implemented energy management systems
(Table 1). Table 1 presents the value of energy savings of industrial firms in North Macedonia.
7
Table 1: Energy cost savings obtained by participant North Macedonia firms in the first year of
implementation of the EnMS
Value of energy savings in North Macedonian firms (EUR)
Company 1 1,614,474
Company 2 120,152
Company 3 7,656
Company 4 89,840
Company 5 1,601
Company 6 85,000
Company 7 59,095
Company 8 322,200
Source: Based on data collected in Matteini et al. (2017).
4 Methodology
4.1 Conceptual framework
The net impact of the introduction of EE improvements in an economy from an economic and
social point of view is not immediately clear because of the different channels through which it
affects the economy. Investments in new machinery and technologies to achieve higher EE have
the potential to generate jobs in the short run through the positive impact EE has on demand, and
jobs are generated in the short run to produce these goods. Once higher EE is achieved for the
same level of production, an economy will have lower demand for energy (for electricity, refined
petroleum fuel, etc.) as a result of the reduced energy intensity of production. Consequently,
demand for energy (e.g. electricity, natural gas, fuel oil, etc.) would decrease and potentially result
in job loss and value added loss in the energy supply sectors.
At the same time, the firm’s energy costs decrease when it becomes more energy efficient. The
reallocation or re-spending of these saving may also result in job and value added creation. As the
use of energy and energy-related costs fall, resources in the economy are redirected from spending
on energy to other sectors. The outcome of this shift has the potential of creating additional jobs
and value added within the economy. The reallocation or re-spending of savings from higher EE
generates demand for non-energy goods, which has a positive job and value added generating
effect on the economy.

8
These three impacts of EE improvements can be referred to as (i) the initial investment effect, (ii)
the energy effect, and (iii) the rebound effect. A full evaluation of the net impact of EE measures
on jobs must include all three effects. However, the number of studies that take all three effects
into account remains limited, with the majority of studies only considering the initial investment
effect when evaluating the impacts of EE. The impact of the implementation of EE
measures/programmes in industry on job creation has remained largely unexplored in the
literature.
In addition, as industries in developing countries typically use methods of production that are not
necessarily considered the best available practices and technologies, the potential for generating
EE improvements from EnMS-EE may be higher. These energy savings translate into cost savings
for the firm, which help boost firms’ price competitiveness and may play a role in industrial
development.
We evaluate the impacts of the implementation of EnMS using data collected from UNIDO’s
EnMS Capacity-Building and Implementation (CBI) Programme in North Macedonia in eight
participant firms from different industries. Specifically, we build on the data collected in a
comprehensive cost-benefit analysis (CBA) conducted by Matteini et al. (2017) to create the
foundation for our analysis. We apply a mixed approach that combines the findings of the CBA
with the North Macedonian IO tables to evaluate the programme’s impact on job creation. Our
findings indicate that the implementation of the EnMS programme in North Macedonia had a
positive net job creation impact on the economy. The framework of analysis presented in this
study can be easily applied to other countries and programme evaluations, as it is flexible and can
be adapted to country and programme specificities.
Using the available data sources and literature review, we construct a simulation strategy to
capture the direct, indirect and rebound effects of the implementation of UNDIO’s Energy
Management Systems in North Macedonia. To determine the project’s impact on job creation, we
combine survey data provided by the participant firms on the monetary energy savings generated
by the programme compiled in Matteini et al. (2017) to estimate the impact on demand. Once we
estimate the impact on demand, we apply the findings to an extended IO model to evaluate the
programme’s impact on employment in the country.
9
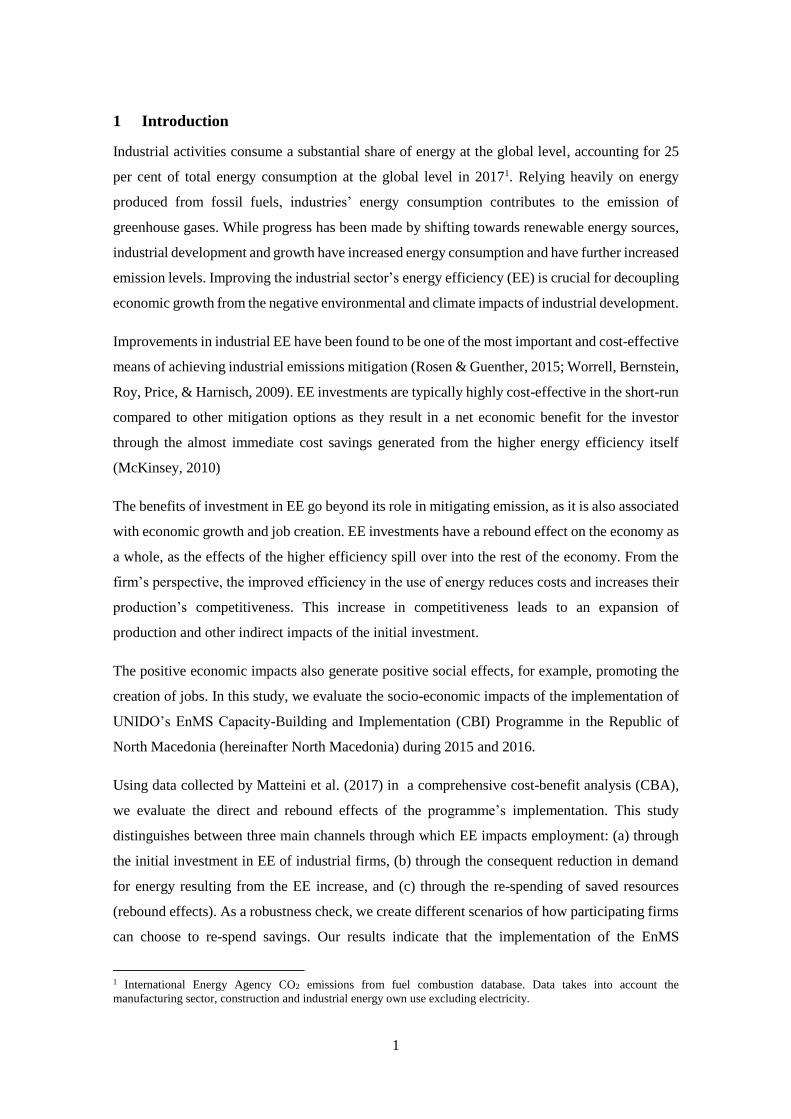
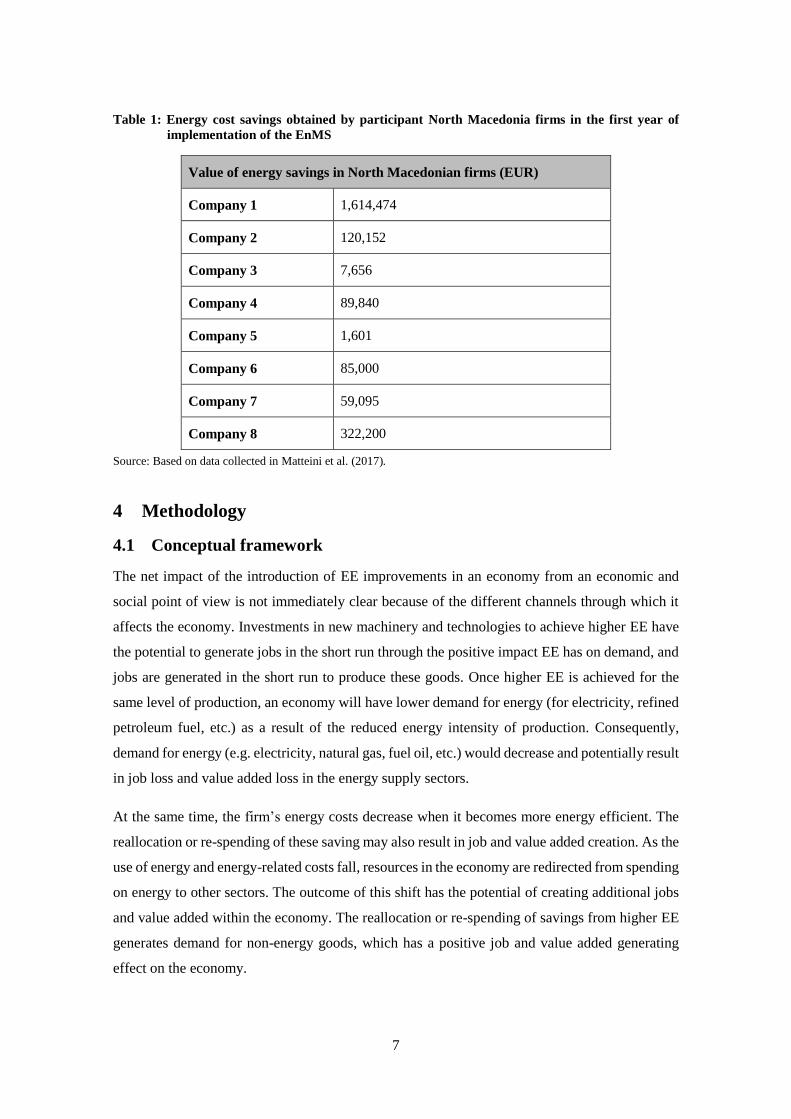
Figure 1 illustrates how the findings on the EnMS programme’s impact can be incorporated into
the IO framework. UNIDO’s EnMS CBI team provided the participant firm with a systematic
approach to identify and tackle opportunities to improve their energy performance. Opportunities
derive from optimizing the firm’s existing operations and changing the firm’s behaviour,
including increased investments in EE measures.
Once implemented, these measures allow the firm to achieve higher EE. Changing industrial EE
has two direct impacts. From an individual firm’s point of view, part of the resources previously
spent on energy inputs are no longer necessary. If we consider that energy prices and firms’
production remain the same, we can assume that an EE improvements will result in lower
spending on energy inputs. However, from the energy provider’s point of view, rising industrial
EE means a reduction in sales. Higher EE means that the cost of energy in the inputs mix
decreases. This is a negative demand shock for energy providers.
A third effect arises from the rebound generated from the firm’s cost savings. For a firm that has
achieved higher EE in production, some of the resources previously spent on energy inputs are
saved and can be reallocated to other purposes within the firm. The equivalent monetary value of
the “energy savings” obtained by the firm allows it to increase its production volume or to invest
in expanding its production capacity, etc.
Figure 1: Demand shocks created by the introduction of EE improvements
10
These three effects can be incorporated into an IO framework to evaluate their impact on total
employment by translating these three effects into shocks to the demand vector. Values to create
the shock to demand are based on energy savings (in kWh and their monetary equivalent) as
reported for the North Macedonia “treatment group”. In summary, this shock is determined by
focussing on three main channels through which EE improvements influence demand in the
economy:
i. The positive demand shock from the initial fixed capital investment made to achieve the
EE gain (if the measure is no cost, this effect does not occur);
ii. The negative demand shock on the reduction of demand for energy resulting from the
achieved gain in EE;
iii. The rebound effect from re-spending the equivalent monetary value of the cost savings
generated from the reduction in energy consumption (deriving from either fixed capital
investments or no cost measures).
The three channels through which EE and EnMS affect demand in an economy are summarized
in Figure 1. While the total monetary value of the initial fixed capital investment (if any) and the
monetary value of energy savings achieved are based on values reported by firms that
implemented EnMS, we make several assumptions on what type of goods and services firms
spend on. For the demand shock generated by the initial fixed capital investment, we refer to the
literature on the composition of fixed capital investment to achieve EE.
We assume a typical investment in EE equipment consists of a similar combination of goods as
proposed by Pollin et al. (2014). According to Pollin et al. (2014), investments in industrial EE
equipment is composed of 20 per cent spending on construction services, 50 per cent on
machinery and 30 per cent spending on professional, scientific and technical services. We use this
this same investment mix when incorporating this first demand shock into the model (see Table
3, Appendix A).
The second channel examines the reduction in demand for energy inputs generated by the
implementation of EnMS and the associated EE investments. Manufacturing firms typically rely
on different energy sources and energy inputs for their production. Matteini et al. (2017) present
the monetary savings from reduced use of energy inputs of four different fuel type: natural gas,
electricity, oil and liquefied petroleum gas (LPG)2. These four types of energy sources represent
distinct types of products that have their own distinct production process. As a result, the impacts
2 Based on data availability, we assume that natural gas and electricity are products from the ‘Electricity, gas, steam
and air conditioning’ (D) industry, while oil and LPG are grouped and produced by the ‘Coke and refined petroleum
products’ industry.
11
of a reduction in demand of each energy source on employment will also differ and the reduction
in demand for different energy inputs should be considered separately in the model. We sum up
the monetary energy savings reported by each firm for each fuel type and include them as a
negative demand shock.
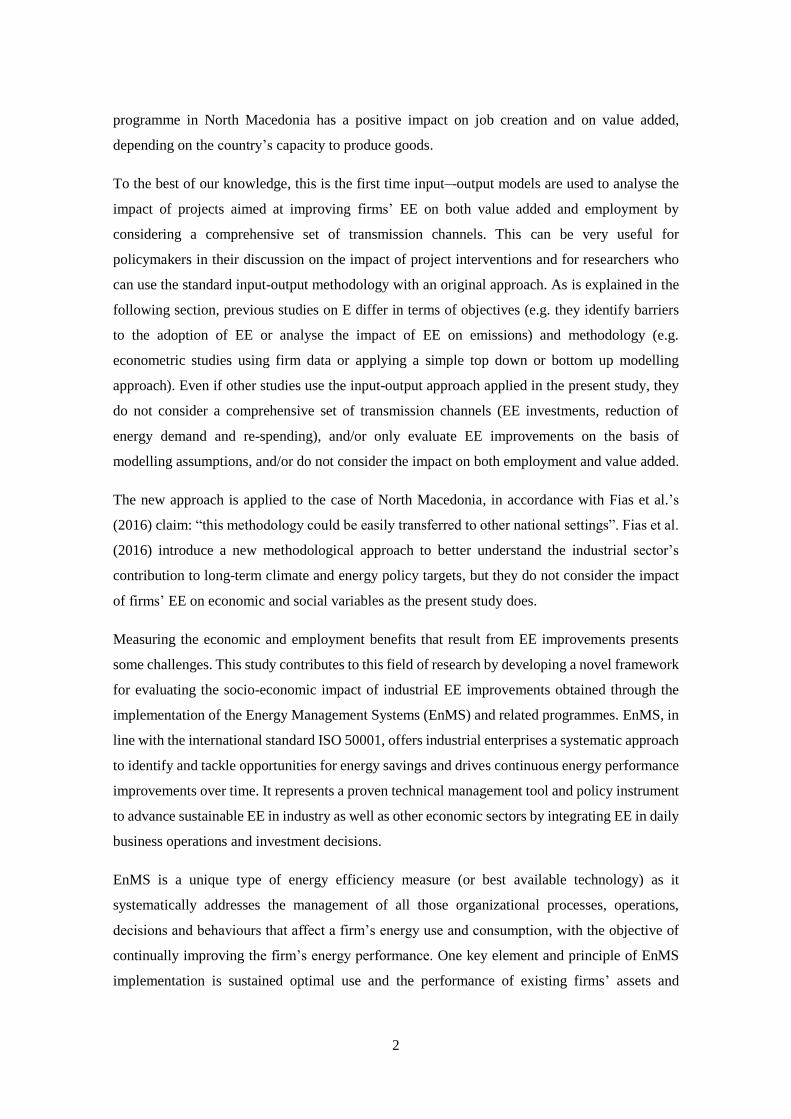
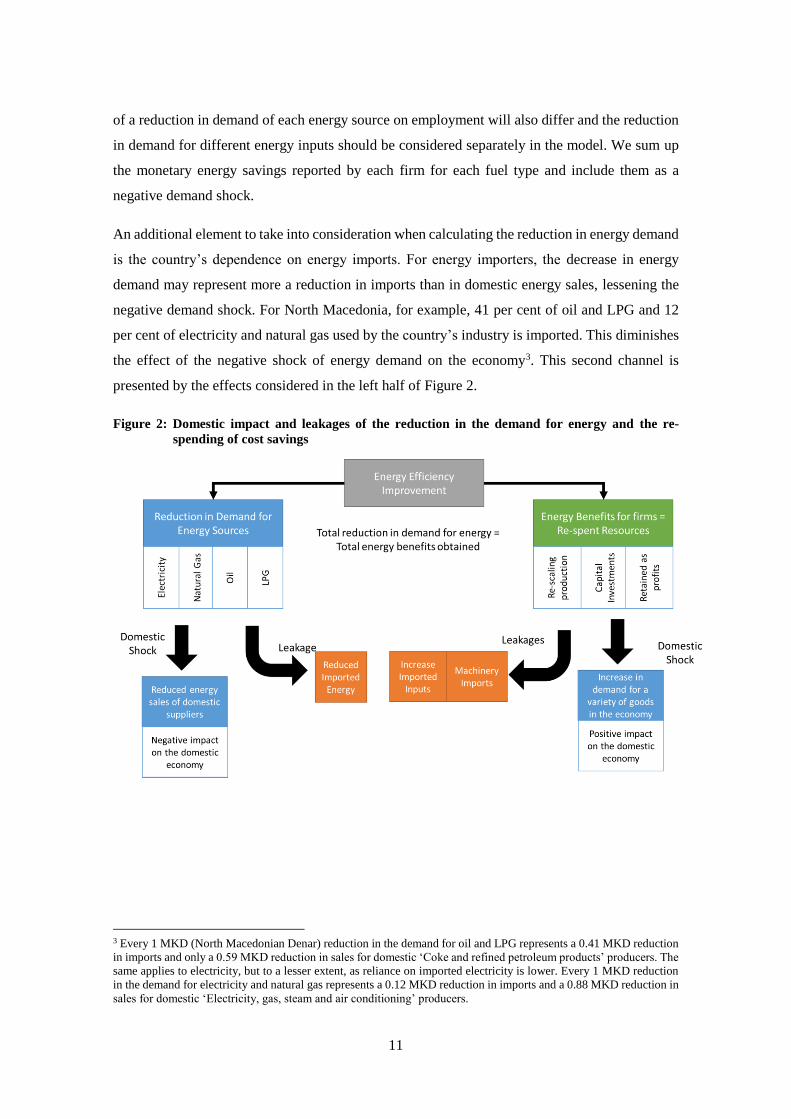
An additional element to take into consideration when calculating the reduction in energy demand
is the country’s dependence on energy imports. For energy importers, the decrease in energy
demand may represent more a reduction in imports than in domestic energy sales, lessening the
negative demand shock. For North Macedonia, for example, 41 per cent of oil and LPG and 12
per cent of electricity and natural gas used by the country’s industry is imported. This diminishes
the effect of the negative shock of energy demand on the economy3. This second channel is
presented by the effects considered in the left half of Figure 2.
Figure 2: Domestic impact and leakages of the reduction in the demand for energy and the re-
spending of cost savings
3 Every 1 MKD (North Macedonian Denar) reduction in the demand for oil and LPG represents a 0.41 MKD reduction
in imports and only a 0.59 MKD reduction in sales for domestic ‘Coke and refined petroleum products’ producers. The
same applies to electricity, but to a lesser extent, as reliance on imported electricity is lower. Every 1 MKD reduction
in the demand for electricity and natural gas represents a 0.12 MKD reduction in imports and a 0.88 MKD reduction in
sales for domestic ‘Electricity, gas, steam and air conditioning’ producers.
12
The third channel through which EE may affect demand is through the rebound effect. Firms that
become more energy efficient achieve monetary savings, as their energy expenses are lower. This,
in turn, frees up resources that can then be reallocated within the firms and invested in other uses.
Garrett-Peltier (2011) assumes that any saved resources are fully re-spent on the acquisition of
non-energy intermediate inputs to expand production, with the exception of labour4. We build on
this by creating two additional uses that can arise from monetary savings generated from EnMS-
EE:
i. Re-spending on inputs to re-scale production (increase production using existing
productive capacity), the same effect considered by Garrett-Peltier (2011);
ii. Re-spending to make further fixed capital investments (with the intention of expanding
or modernizing production)5;
iii. Retaining as profit and not re-spending, not resulting in any additional demand. We
assume the resources are retained for future use beyond the period being analysed in the
study.
Resources reallocated to intermediate inputs to expand production using existing productive
capacity (i) are sector-specific since the combination of intermediate inputs between industrial
sectors varies significantly6. The energy savings of each firm must be considered as having been
re-spent according to the average input mix of the industry they belong. Resources reallocated for
additional fixed capital investments (ii) assume the same capital investment mix as for the initial
EE capital investment (see Table 3, Appendix A). Resources retained as profit (iii) are assumed
to have no further effect on demand.
Studies exist that have investigated how saved resources from industrial EE are re-spent.
Accordingly, we create three scenarios assuming different combinations of how these resources
are re-spent (Table 2).
4 For most medium-sized and large enterprises, the first 1-2 years of EnMS implementation is dominated by re-defining
tasks and operations for existing staff and equipment; consequently, improvements in energy performance within a
context of increasing production volumes may not require additional labour inputs. This is supported by findings in
Matteini et al. (2017) for which firms did not report hiring additional workers during the first year of EnMS
implementation, but reported a production expansion. 5 This effect is also supported by findings in Matteini et al. (2017), with participant firms reporting interest in making
further investments to achieve energy efficiency gains once the cost effectiveness of the initial investment is verified. 6 We assume that each firm produces one specific type of product. Resources re-spent to re-scale the used inputs to
expand production will then follow the distribution described in the product input-mix of the technical coefficient
matrix. Each column of the technical coefficient matrix describes the input-mix used to produce product i (𝐴∗,𝑖). We
distribute the reallocated resources using the technical coefficient ratios to create the shock in the final demand vector.
13
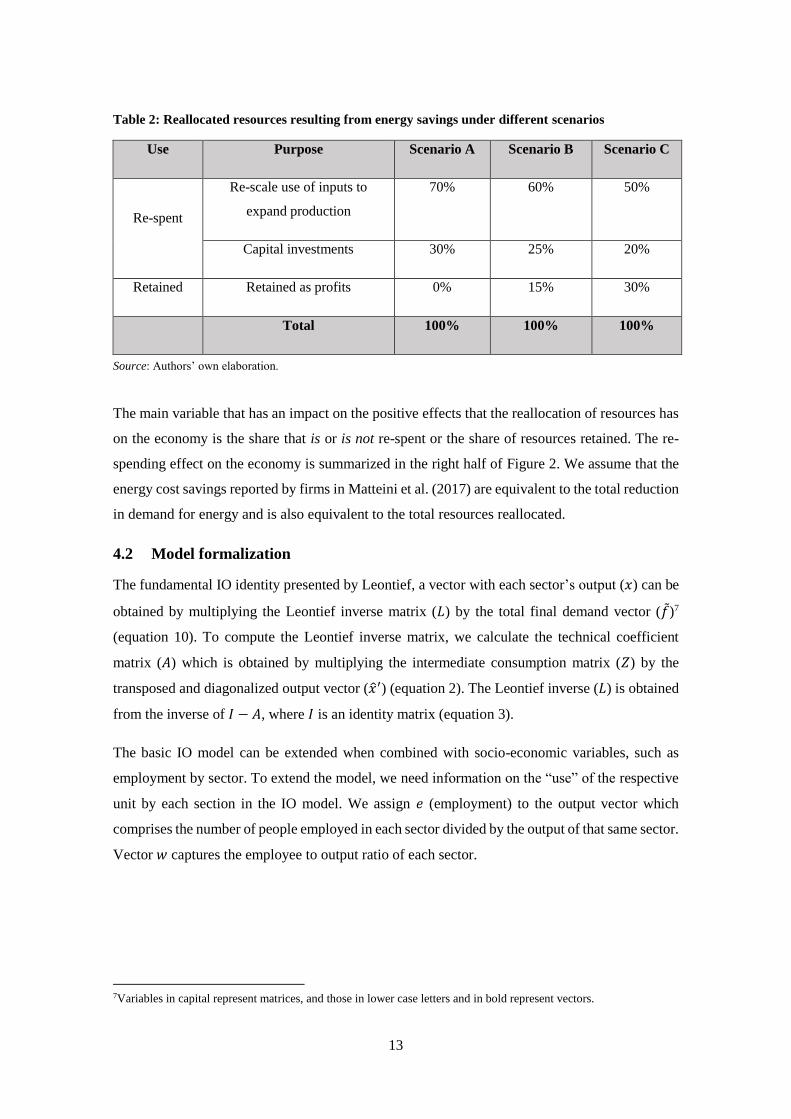
Table 2: Reallocated resources resulting from energy savings under different scenarios
Use Purpose Scenario A Scenario B Scenario C
Re-spent
Re-scale use of inputs to
expand production
70% 60% 50%
Capital investments 30% 25% 20%
Retained Retained as profits 0% 15% 30%
Total 100% 100% 100%
Source: Authors’ own elaboration.
The main variable that has an impact on the positive effects that the reallocation of resources has
on the economy is the share that is or is not re-spent or the share of resources retained. The re-
spending effect on the economy is summarized in the right half of Figure 2. We assume that the
energy cost savings reported by firms in Matteini et al. (2017) are equivalent to the total reduction
in demand for energy and is also equivalent to the total resources reallocated.
4.2 Model formalization
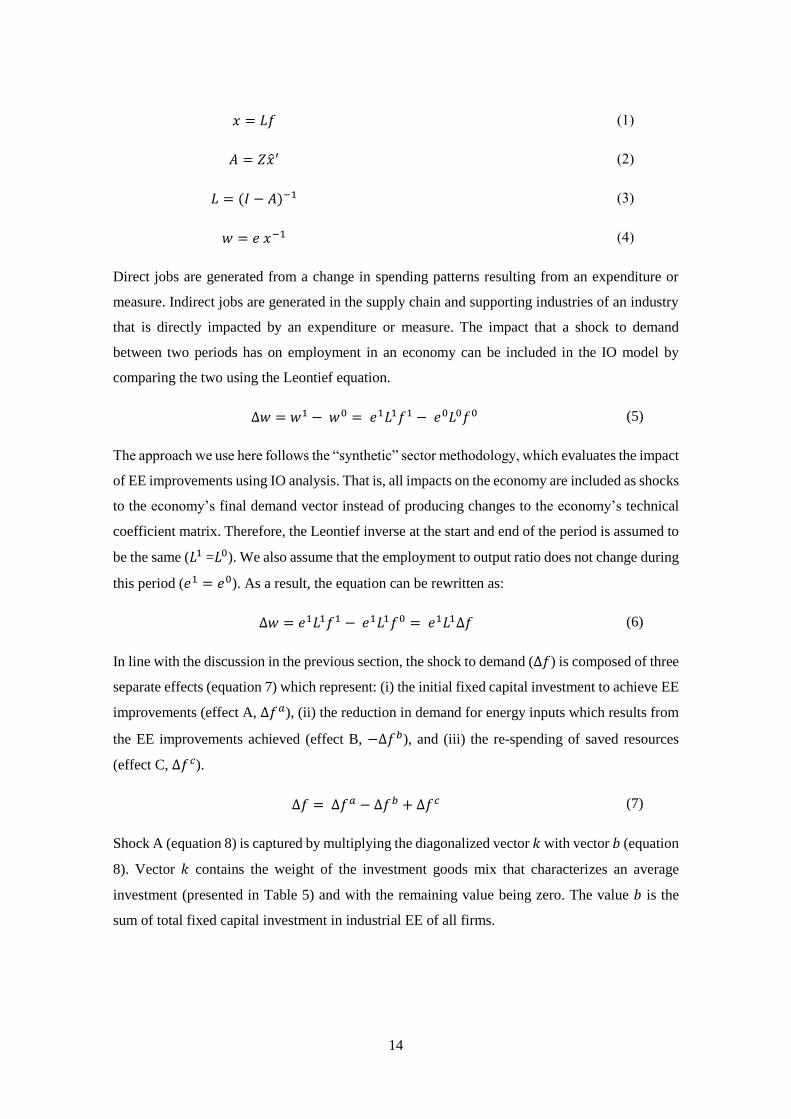
The fundamental IO identity presented by Leontief, a vector with each sector’s output (𝑥) can be
obtained by multiplying the Leontief inverse matrix (𝐿) by the total final demand vector (𝑓)7
(equation 10). To compute the Leontief inverse matrix, we calculate the technical coefficient
matrix (𝐴) which is obtained by multiplying the intermediate consumption matrix (𝑍) by the
transposed and diagonalized output vector (𝑥′) (equation 2). The Leontief inverse (𝐿) is obtained
from the inverse of 𝐼 − 𝐴, where 𝐼 is an identity matrix (equation 3).
The basic IO model can be extended when combined with socio-economic variables, such as
employment by sector. To extend the model, we need information on the “use” of the respective
unit by each section in the IO model. We assign 𝑒 (employment) to the output vector which
comprises the number of people employed in each sector divided by the output of that same sector.
Vector 𝑤 captures the employee to output ratio of each sector.
7Variables in capital represent matrices, and those in lower case letters and in bold represent vectors.
14
𝑥 = 𝐿𝑓 (1)
𝐴 = 𝑍𝑥′ (2)
𝐿 = (𝐼 − 𝐴)−1 (3)
𝑤 = 𝑒 𝑥−1 (4)
Direct jobs are generated from a change in spending patterns resulting from an expenditure or
measure. Indirect jobs are generated in the supply chain and supporting industries of an industry
that is directly impacted by an expenditure or measure. The impact that a shock to demand
between two periods has on employment in an economy can be included in the IO model by
comparing the two using the Leontief equation.
∆𝑤 = 𝑤1 − 𝑤0 = 𝑒1𝐿1𝑓1 − 𝑒0𝐿0𝑓0 (5)
The approach we use here follows the “synthetic” sector methodology, which evaluates the impact
of EE improvements using IO analysis. That is, all impacts on the economy are included as shocks
to the economy’s final demand vector instead of producing changes to the economy’s technical
coefficient matrix. Therefore, the Leontief inverse at the start and end of the period is assumed to
be the same (𝐿1 =𝐿0). We also assume that the employment to output ratio does not change during
this period (𝑒1 = 𝑒0). As a result, the equation can be rewritten as:
∆𝑤 = 𝑒1𝐿1𝑓1 − 𝑒1𝐿1𝑓0 = 𝑒1𝐿1∆𝑓 (6)
In line with the discussion in the previous section, the shock to demand (∆𝑓) is composed of three
separate effects (equation 7) which represent: (i) the initial fixed capital investment to achieve EE
improvements (effect A, ∆𝑓𝑎), (ii) the reduction in demand for energy inputs which results from
the EE improvements achieved (effect B, −∆𝑓𝑏), and (iii) the re-spending of saved resources
(effect C, ∆𝑓𝑐).
∆𝑓 = ∆𝑓𝑎 − ∆𝑓𝑏 + ∆𝑓𝑐 (7)
Shock A (equation 8) is captured by multiplying the diagonalized vector 𝑘 with vector 𝑏 (equation
8). Vector 𝑘 contains the weight of the investment goods mix that characterizes an average
investment (presented in Table 5) and with the remaining value being zero. The value 𝑏 is the
sum of total fixed capital investment in industrial EE of all firms.
15
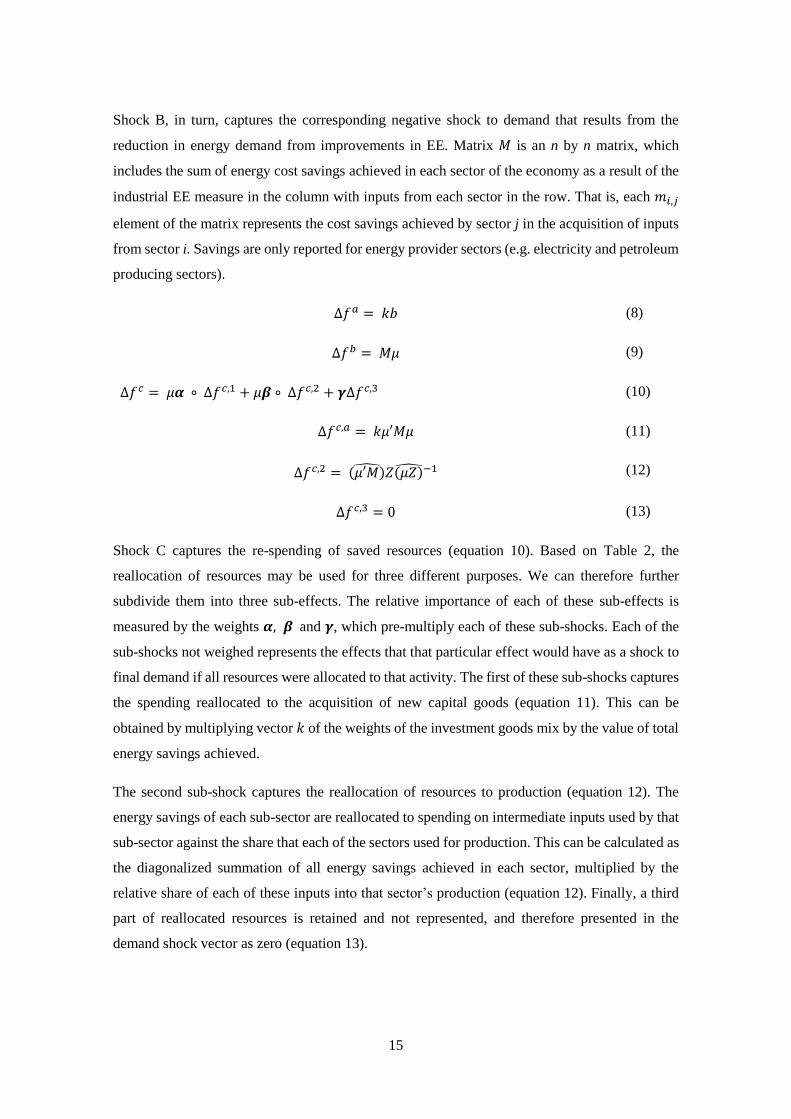
Shock B, in turn, captures the corresponding negative shock to demand that results from the
reduction in energy demand from improvements in EE. Matrix 𝑀 is an n by n matrix, which
includes the sum of energy cost savings achieved in each sector of the economy as a result of the
industrial EE measure in the column with inputs from each sector in the row. That is, each 𝑚𝑖,𝑗
element of the matrix represents the cost savings achieved by sector j in the acquisition of inputs
from sector i. Savings are only reported for energy provider sectors (e.g. electricity and petroleum
producing sectors).
∆𝑓𝑎 = 𝑘𝑏 (8)
∆𝑓𝑏 = 𝑀𝜇 (9)
∆𝑓𝑐 = 𝜇𝜶 ∘ ∆𝑓𝑐,1 + 𝜇𝜷 ∘ ∆𝑓𝑐,2 + 𝜸∆𝑓𝑐,3 (10)
∆𝑓𝑐,𝑎 = 𝑘𝜇′𝑀𝜇 (11)
∆𝑓𝑐,2 = (𝜇′𝑀)̂𝑍(𝜇𝑍)̂−1 (12)
∆𝑓𝑐,3 = 0 (13)
Shock C captures the re-spending of saved resources (equation 10). Based on Table 2, the
reallocation of resources may be used for three different purposes. We can therefore further
subdivide them into three sub-effects. The relative importance of each of these sub-effects is
measured by the weights 𝜶, 𝜷 and 𝜸, which pre-multiply each of these sub-shocks. Each of the
sub-shocks not weighed represents the effects that that particular effect would have as a shock to
final demand if all resources were allocated to that activity. The first of these sub-shocks captures
the spending reallocated to the acquisition of new capital goods (equation 11). This can be
obtained by multiplying vector 𝑘 of the weights of the investment goods mix by the value of total
energy savings achieved.
The second sub-shock captures the reallocation of resources to production (equation 12). The
energy savings of each sub-sector are reallocated to spending on intermediate inputs used by that
sub-sector against the share that each of the sectors used for production. This can be calculated as
the diagonalized summation of all energy savings achieved in each sector, multiplied by the
relative share of each of these inputs into that sector’s production (equation 12). Finally, a third
part of reallocated resources is retained and not represented, and therefore presented in the
demand shock vector as zero (equation 13).
16
4.3 Time dimension: a comparative static exercise
Energy savings achieved from the acquisition of more energy efficient machinery are obtained
immediately with the acquisition of the new equipment. Energy savings obtained from the
implementation of EnMS are gained over a longer period during the subsequent year. We base
the trajectory of energy savings included in the IO model based on Matteini et al. (2017). It should
be noted that Matteini et al.’s (2017) assumptions are conservative, as reviewed studies have
shown that energy savings in the subsequent year can actually be even higher.
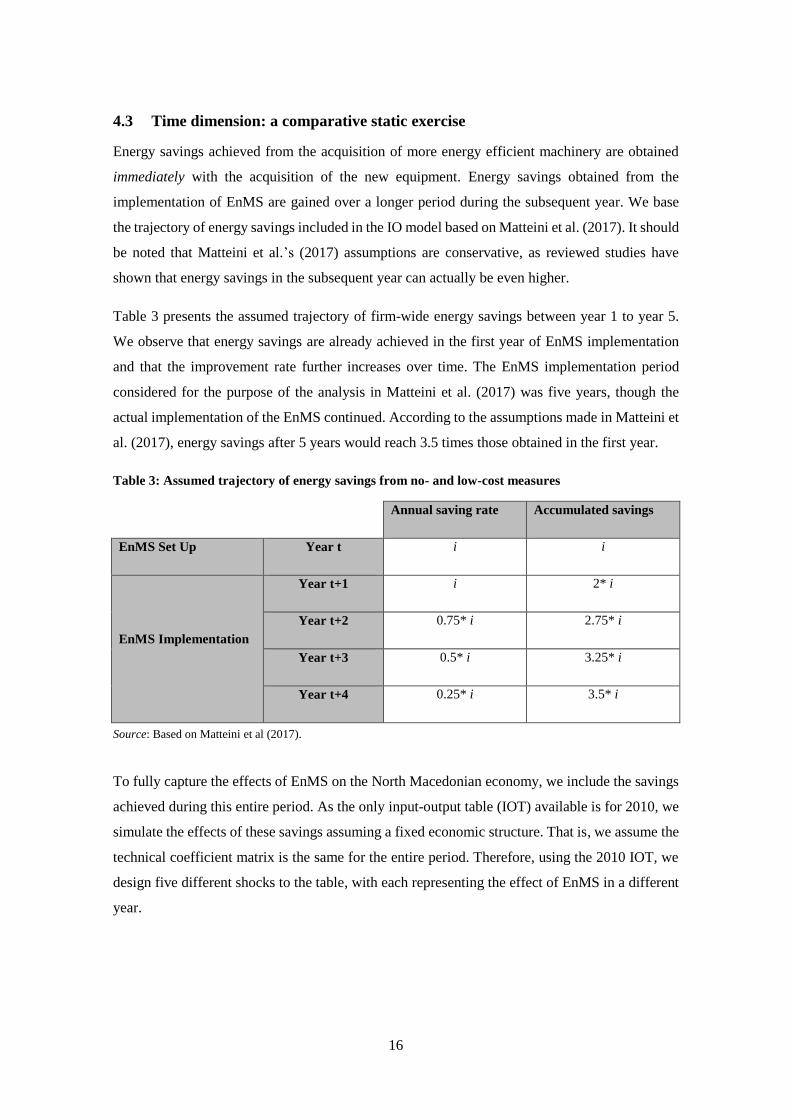
Table 3 presents the assumed trajectory of firm-wide energy savings between year 1 to year 5.
We observe that energy savings are already achieved in the first year of EnMS implementation
and that the improvement rate further increases over time. The EnMS implementation period
considered for the purpose of the analysis in Matteini et al. (2017) was five years, though the
actual implementation of the EnMS continued. According to the assumptions made in Matteini et
al. (2017), energy savings after 5 years would reach 3.5 times those obtained in the first year.
Table 3: Assumed trajectory of energy savings from no- and low-cost measures
Annual saving rate Accumulated savings
EnMS Set Up Year t i i
EnMS Implementation
Year t+1 i 2* i
Year t+2 0.75* i 2.75* i
Year t+3 0.5* i 3.25* i
Year t+4 0.25* i 3.5* i
Source: Based on Matteini et al (2017).
To fully capture the effects of EnMS on the North Macedonian economy, we include the savings
achieved during this entire period. As the only input-output table (IOT) available is for 2010, we
simulate the effects of these savings assuming a fixed economic structure. That is, we assume the
technical coefficient matrix is the same for the entire period. Therefore, using the 2010 IOT, we
design five different shocks to the table, with each representing the effect of EnMS in a different
year.
17
As linkages in an economy change slowly over time, this is a reasonable assumption for estimating
the effects of EnMS. According to D’Hernoncourt et al. (2011), IO technical coefficient ratios
and multipliers can be assumed to be stable for typically up to 6 years, unless the region’s
economy has changed significantly. Furthermore, according to Miller and Blair (2009),
attempting to update and correct technical coefficients when updated tables are not available
frequently generates less precise results than assuming that the economic structure does not
change.
5 Data sources
To apply the methodology outlined in Section 3, we combine data from different sources: the
North Macedonian IOTs, North Macedonian employment statistics and the findings from the cost-
benefit analysis conducted by Matteini et al. (2017) on the energy savings generated by the
implementation of UNIDO’s EnMS programme in North Macedonia. By combining these
different data sources, we arrive at an estimate of the impact of EE improvements implemented
on total employment. This section describes the different data sources used.
5.1 North Macedonian input-output table
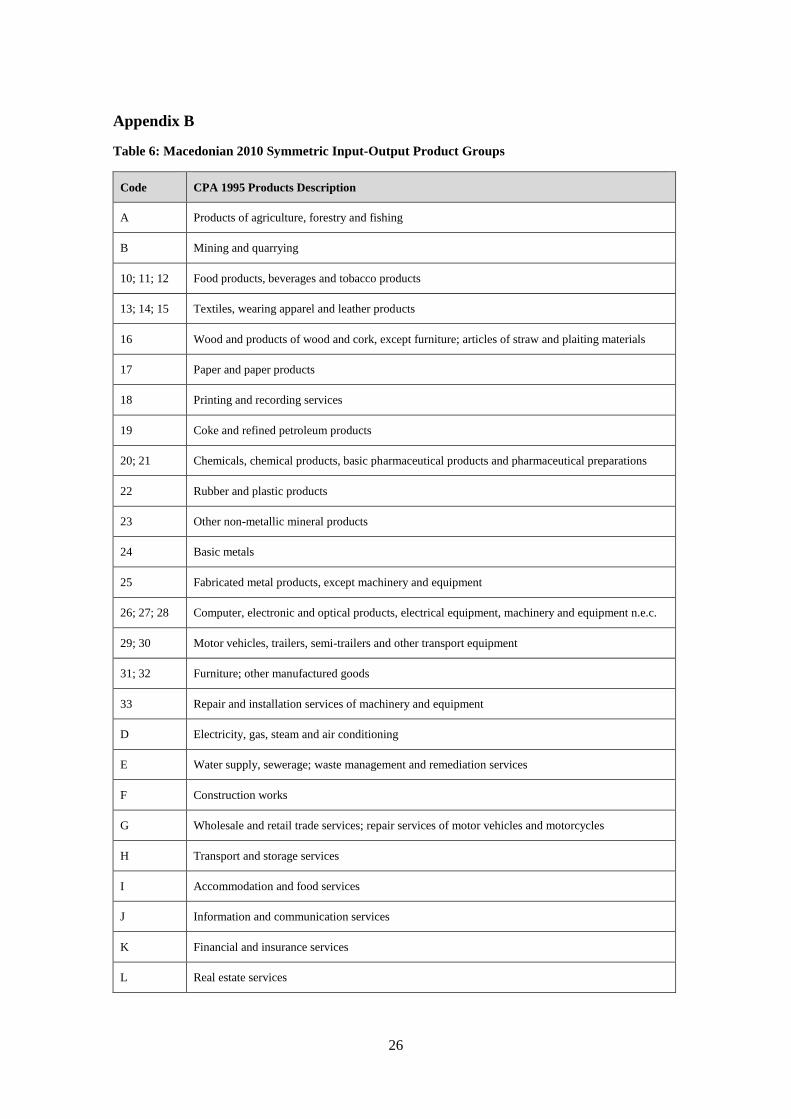
The North Macedonian Symmetrical Input-Output Tables are published by the country’s
Statistical Office. The most recent IOT is for the year of 2010, which was published in 2013. The
product-level classification used in the North Macedonian 2010 IOT consists of 34 products
following the CPA 1995 classification. The complete product classification of the table is
presented in Appendix B. In 2010, the country’s gross domestic product (GDP) was MKD 381
billion (EUR 6.2 billion), while the manufacturing sector represented 14.6 per cent of GDP (MKD
56 billion, in 2010 current prices). The import intensity of domestic manufacturing production is
significantly higher than in other sectors of the economy, with direct intermediate imports used
in domestic production representing 42 per cent of the sector’s output.
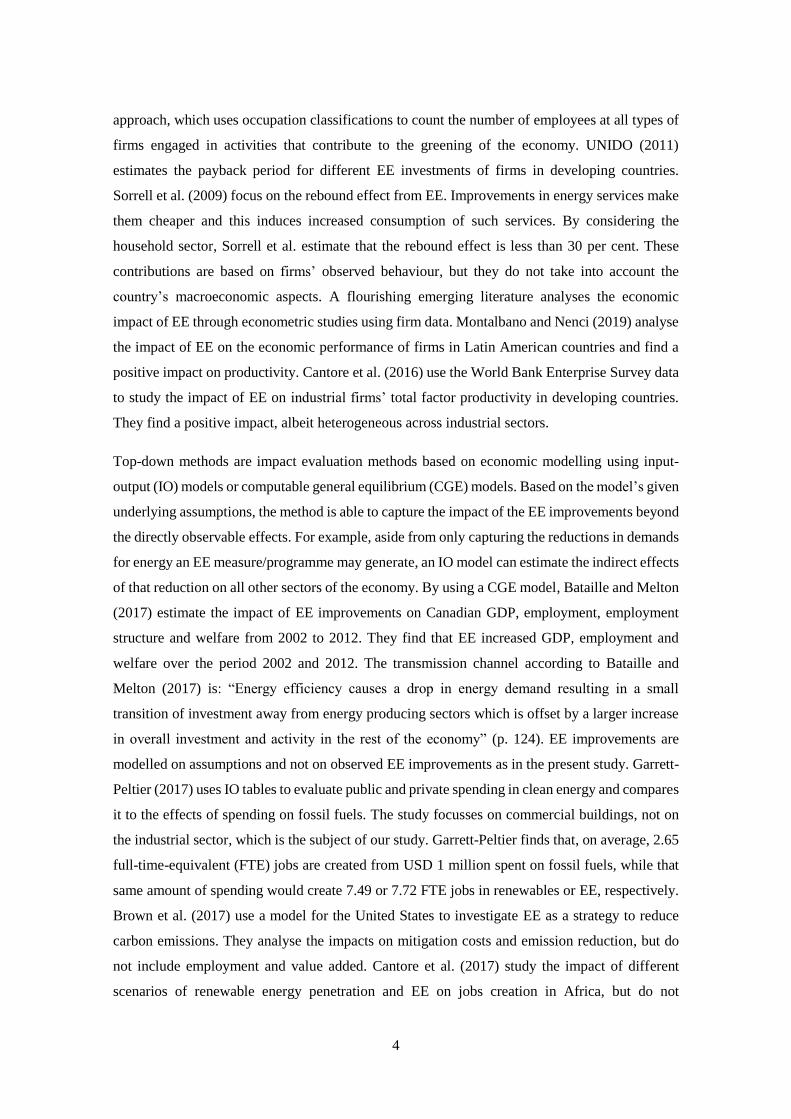
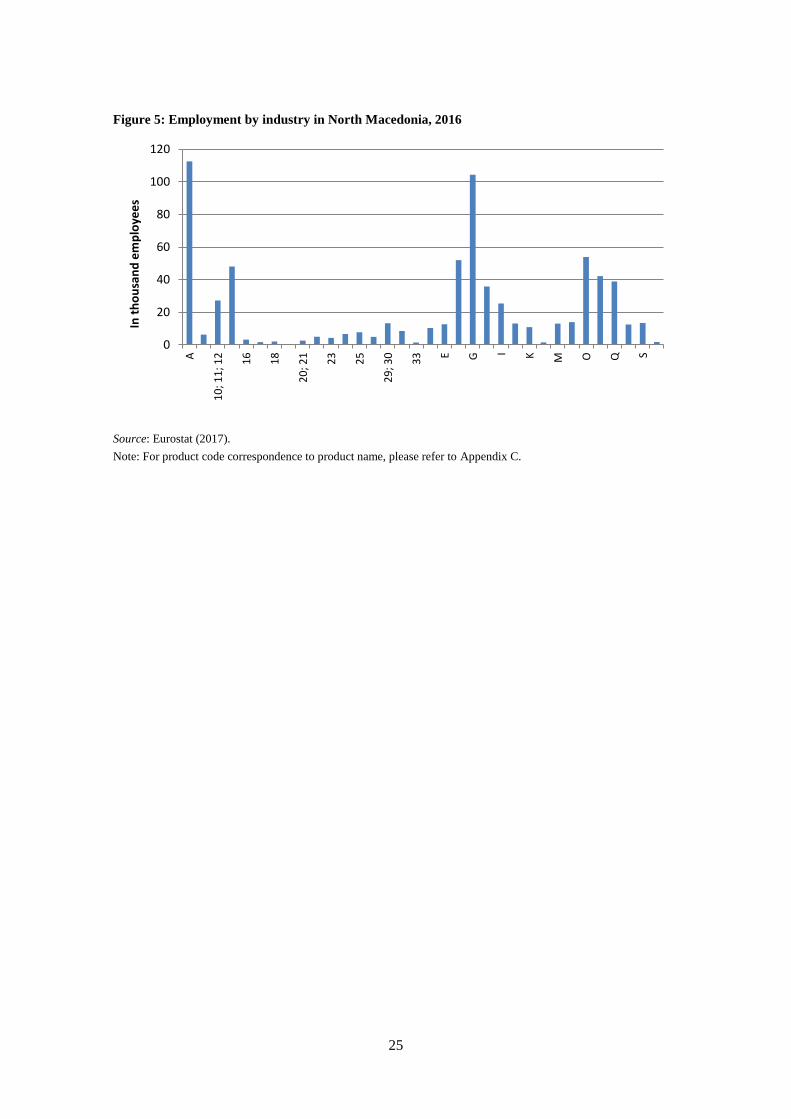
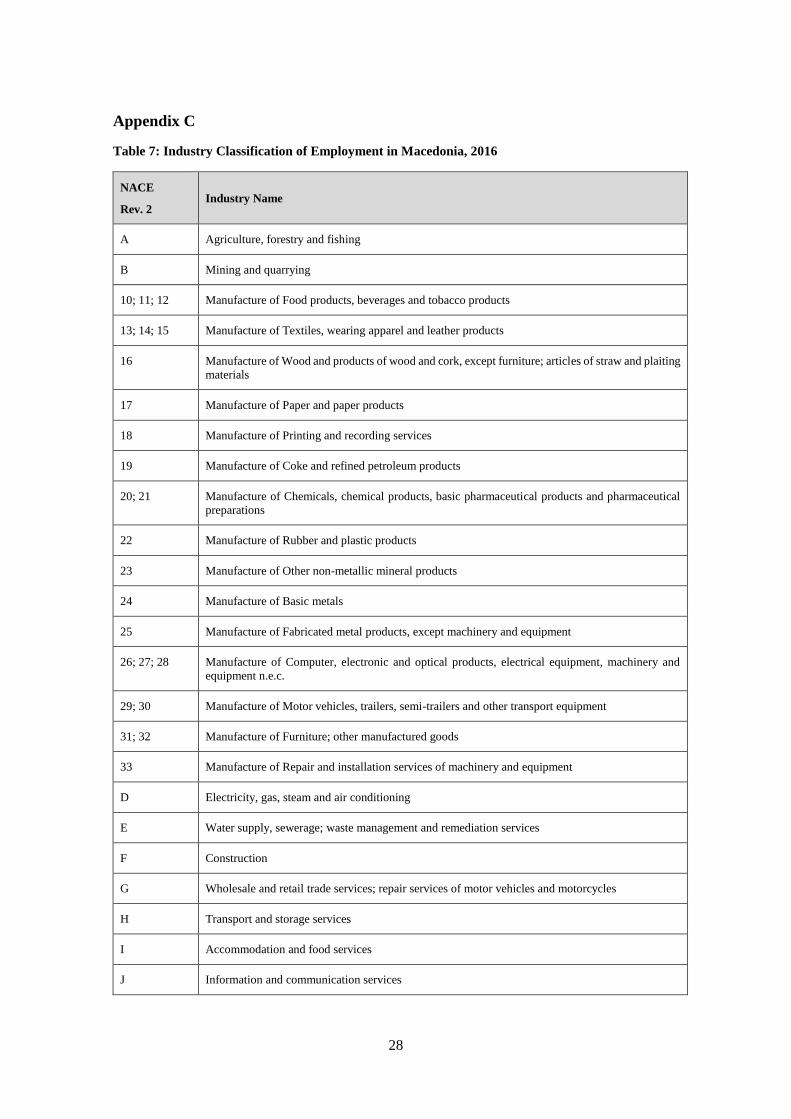
5.2 Employment data
For data on employment, we use Eurostat’s “Employment by detailed economic activity series”
of industry-level employment at the two-digit level for manufacturing for 2016, which reported
711,000 jobs in North Macedonia for that year. Data shows that jobs are concentrated in the
agriculture sector (112,000 jobs in 2016, 15.8 per cent of total employment) and trade services
(104,000 jobs, 14.6 per cent of total employment). Manufacturing industries employed 137,000
people in North Macedonia, mostly in the foods and beverages (27,000) and textile (48,000)
industries (see Figure 5).
18
6 Main findings
We apply the data on energy savings from the implementation of the Energy Management
Systems Programme in North Macedonia to the modelling framework outlined in Section 3. We
analyse the impact of reduced demand for energy on employment and value added, the rebound
effects of the cost savings generated by firms and the increasing investments of firms in EE
interventions over a 5-year period. The impacts for three different scenarios are presented,
demonstrating firms’ willingness to spend savings from lower energy costs derived from EE
improvements. Scenario A assumes that firms re-spend the entire value of their energy savings,
whereas scenarios B and C assume that firms retain 15 per cent and 30 per cent, respectively, of
their total energy savings. The three scenarios are evaluated on the basis of two alternatives:
leakage and no leakage. The no leakage scenario assumes that North Macedonian firms purchase
all goods from energy cost savings in the local economy whereas the leakage scenario assumes
that some of the goods purchased by firms from energy cost savings are purchased abroad based
on the country’s current import basket.
We quantify the impact on employment captured by the IO model in terms of (net)8 job-years
rather than jobs. This may also reflect the work of two employees for six months each, or of three
people for four months each. Without more detailed information on the number of full-time and
part-time workers in each sector, we can only estimate the job-years impact. Often, “jobs” and
“job-years” are used interchangeably; however, referring to “jobs” created without a duration can
be misleading.
A “job created” in the model is sufficient new labour demand to hire someone full time for a year,
even if the actual outcome is something like the creation of two half-jobs or the avoidance of a
year’s worth of hours reductions spread out among a large number of workers. Therefore, the job
(job-year) impact reported in the IO models is equivalent to an increase in labour demand
sufficient to employ one person full time for one year at an average wage.
This metric is often called “job-year” when reported year over year in an analysis of a multiyear
project or investment. When we examine different impacts in different years, we always consider
that the total effect of a shock occurred exclusively or almost entirely in that same year. That is,
if a shock to demand occurs in year 1 that results in an increase of 10 job-years, we assume that
those 10 FTE jobs are created in that same year 1.
8 The job numbers presented in the following section of the paper are net numbers because they refer to the combined
effect of the three demand shocks described in the methodological section.
19
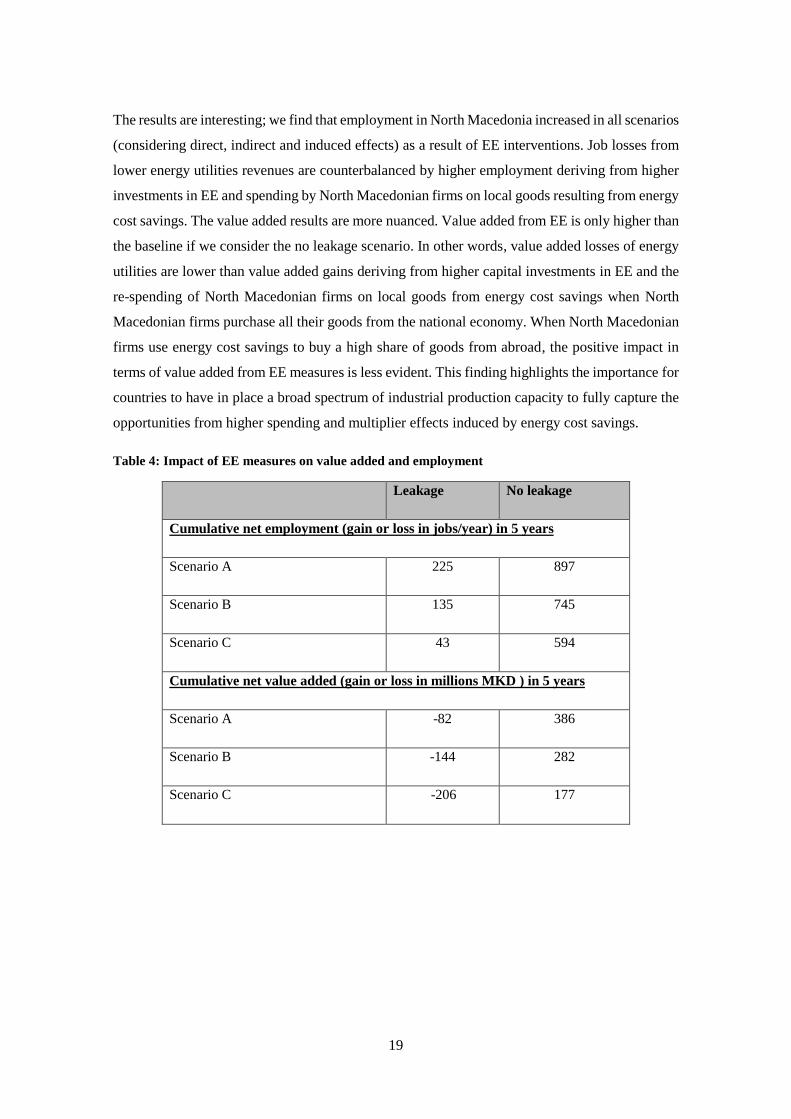
The results are interesting; we find that employment in North Macedonia increased in all scenarios
(considering direct, indirect and induced effects) as a result of EE interventions. Job losses from
lower energy utilities revenues are counterbalanced by higher employment deriving from higher
investments in EE and spending by North Macedonian firms on local goods resulting from energy
cost savings. The value added results are more nuanced. Value added from EE is only higher than
the baseline if we consider the no leakage scenario. In other words, value added losses of energy
utilities are lower than value added gains deriving from higher capital investments in EE and the
re-spending of North Macedonian firms on local goods from energy cost savings when North
Macedonian firms purchase all their goods from the national economy. When North Macedonian
firms use energy cost savings to buy a high share of goods from abroad, the positive impact in
terms of value added from EE measures is less evident. This finding highlights the importance for
countries to have in place a broad spectrum of industrial production capacity to fully capture the
opportunities from higher spending and multiplier effects induced by energy cost savings.
Table 4: Impact of EE measures on value added and employment
Leakage No leakage
Cumulative net employment (gain or loss in jobs/year) in 5 years
Scenario A 225 897
Scenario B 135 745
Scenario C 43 594
Cumulative net value added (gain or loss in millions MKD ) in 5 years
Scenario A -82 386
Scenario B -144 282
Scenario C -206 177
20
7 Final remarks and possible extensions
Highlighting the employment generation potential of EE and related programmes/policies is often
used to create an additional incentive for the creation of programmes with a focus on these types
of interventions and investments (Bell et al., 2015). Detailed studies on the net effects of the
implementation of EE programmes, which consider the total socio-economic outcome of these
measures, may also contribute to dispelling policymakers’ concerns about potential job losses in
the economy associated with a green industry transition.
By considering the rebound effects of EE improvements, a much more robust modelling exercise
of the impacts can be carried out. The case study of North Macedonia represents a first attempt at
creating a methodological framework to better capture the broad effects of EnMS-EE programmes
in industry using IO tables. The set of equations that describe the model’s effect can be easily
applied to study the economic and social effects of an implemented EE policy when combined
with data collected from similar cost-benefit analysis exercises.
Furthermore, the model presented here goes one step further than the existing literature on the
impact of EE investments on employment. Our approach moves away from modelling the impact
on employment and value added of the capital investment required to produce goods and achieve
EE, focussing on the impact of operating an industry that is more energy efficient. The effects of
reduced demand for energy and its indirect impacts are considered by fuel type, while the
reallocation of saved resources in the model is sector-specific. These additional levels of
complexity in the modelling of the impacts of energy savings combined with the effects of imports
add to the analysis and create a more complex modelling tool to evaluate the impacts of the EnMS-
EE programme and other similar EE interventions, while maintaining the IO model structure.
Possible extensions of this model include verifying some of the underlying weights used for
scenario construction. In the current version, the composition of spending on fixed capital
investments for EE is fixed and does not vary by sector of analysis within each industry.
Collecting further data on how investments in EE may vary by sector allows for tailoring the
investment’s sector-specific impacts. In a similar vein, collecting data on the reallocation of saved
resources would provide a more robust approach for selecting the weights used to construct
different re-spending scenarios.
21
Bibliography
Bataille C., Melton N. (2017), “Energy efficiency and economic growth: a retrospective
CGE analysis for Canada from 2002 to 2012”, Energy Economics, 64, 118 – 130.
Bell, C. J., Barrett, J., & McNerney, M. (2015). Verifying Energy Efficiency Job Creation:
Current Practices and Recommendations (Report No. F1501). Washington D.C.:
American Council for an Energy-Efficient Economy.
Bleisl M., Das A., Fahl U., Remme U. (2007), "Role of energy efficiency standards in
reducing CO2 emissions in Germany: an assessment with TIMES", Energy Policy, 35,
772 - 785.
Brown M., Kim G., Smith A., Southworth K. (2017), "Exploring the impact of energy
efficiency as a carbon mitigation strategy in the US", Energy Policy, 109, 249 - 259.
Cantore N., Cali M., te Velde (2016), "Does energy efficiency improve technological change
and economic growth in developing countries?", Energy Policy, 92, 279 - 285.
Cantore N., Nussbaumer P., Wei M., Kammen D. (2019), "Promoting renewable energy and
energy efficiency in Africa: a framework to evaluate employment generation and cost -
effectiveness", Environmental Research Letters, 12, 1 - 11.
D’Hernoncourt, J., Cordier, M., & Hadley, D. (2011). Input-Output Multipliers –
Specification sheet and supporting material (Spicosa Project Report). Brussels:
Université Libre de Bruxelles – CEESE.
Fias B., Sabio N., Strachan N. (2016), "The critical role of the industrial sector in reaching
long term emission reduction, energy efficiency and renewable targets", 162, 699 - 712,
Applied Energy.
Garrett-Peltier, H. (2011). Employment Estimates for Energy Efficiency Retrofits of
Commerical Buildings (Research Brief). Amherst: Political Econoomy Research
Institute.
Jarvis, Andrew; Varma, Adarsh; Ram, Justin (2011), "Assessing green jobs potential in
developing countries: A practitioner’s guide" Geneva, International Labour Office,
(2011).
Matteini, M., Pasqualetto, G., & Petrovska, A. (2017). Cost-Benefit Analysis of Energy
Management Systems Implementation at Enterprise and Programme Level (Internal
Document). Vienna: United Nations Industrial Development Organization.
Montalbano P., Nenci S. (2019), "Energy efficiency, productivity and exporting: firm level
evidence in Latin America", Energy Economics, 79, 97 - 110.
Montt G., Wiebe K., Harsdorff M., Simas M., Bonnet A., Wood R. (2018), "Does climate
action destroy jobs? An assessment of the employment implications of the 2 degrees
goal", International Labour Review, 157, 519-556.
22
McKane A., Desai D., Matteini M., Meffert W., Williams R., Risser R. (2009), "Thinking
globally: How ISO 5001 - energy management can make industrial energy efficiency
standard practice", https://www.osti.gov/servlets/purl/983191
Palm J., Thollander P. (2010), "An interdisciplinary perspective on industrial energy
efficiency", Applied Energy, 87, 3255 - 3261.
Pollin, R., Garrett-Peltier, H., Heintz, J., & Hendricks, B. (2014). Green Growth: A U.S.
Program for Controlling Climate Change and Expanding Job Opportunities. Center ofor
American Progress and the Political Economy Reserach Institute.
Rivers N., Jaccard M. (2005), "Combining top down and bottom up approaches to energy -
economy modeling using discrete choice methods", The Energy Journal, 26, 83 - 106.
Rosen, R. A., & Guenther, E. (2015). The economics of mitigating climate change: What
can we know? Technological Forecasting and Social Change, 91, 93–106.
https://doi.org/10.1016/j.techfore.2014.01.013
Sorrell S., Dimitropoulos J., Sommerville M. (2009), "Empirical estimates of the direct
rebound effect: a review", Energy Policy, 37, 1356 - 1371.
Trianni A., Cagno E., Farne` S. (2017), "Barriers, drivers and decision-making process for
industrial energy efficiency: A broad study among manufacturing small and medium-
sized enterprises", Applied Energy, 162.
UNIDO (2011), "industrial energy efficiency for sustainable wealth creation: capturing
environmental, economic and social dividends", UNIDO Vienna.
https://www.unido.org/sites/default/files/2012-
01/UNIDO_FULL_REPORT_EBOOK_0.pdf
Worrell, E., Bernstein, L., Roy, J., Price, L., & Harnisch, J. (2009). Industrial energy
efficiency and climate change mitigation. Energy Efficiency, 2(2), 109–123.
https://doi.org/10.1007/s12053-008-9032-8

23
Appendix A
Table 5: Average spending composition
Code Product Group Name Share
26; 27; 28 Computer, electronic and optical products, electrical
equipment, machinery and equipment n.e.c. 50%
33 Repair and installation services of machinery and equipment 30%
F Construction works 20%
Source: Authors’ own elaboration based on Pollin et al. (2014)
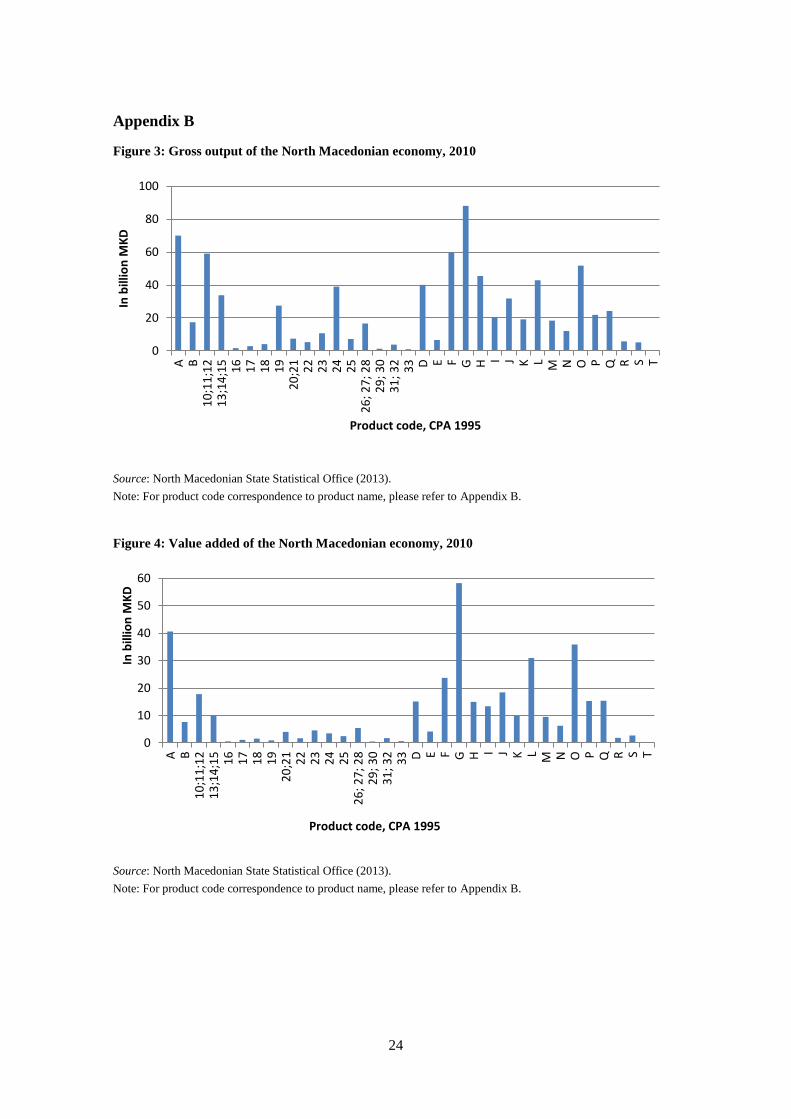
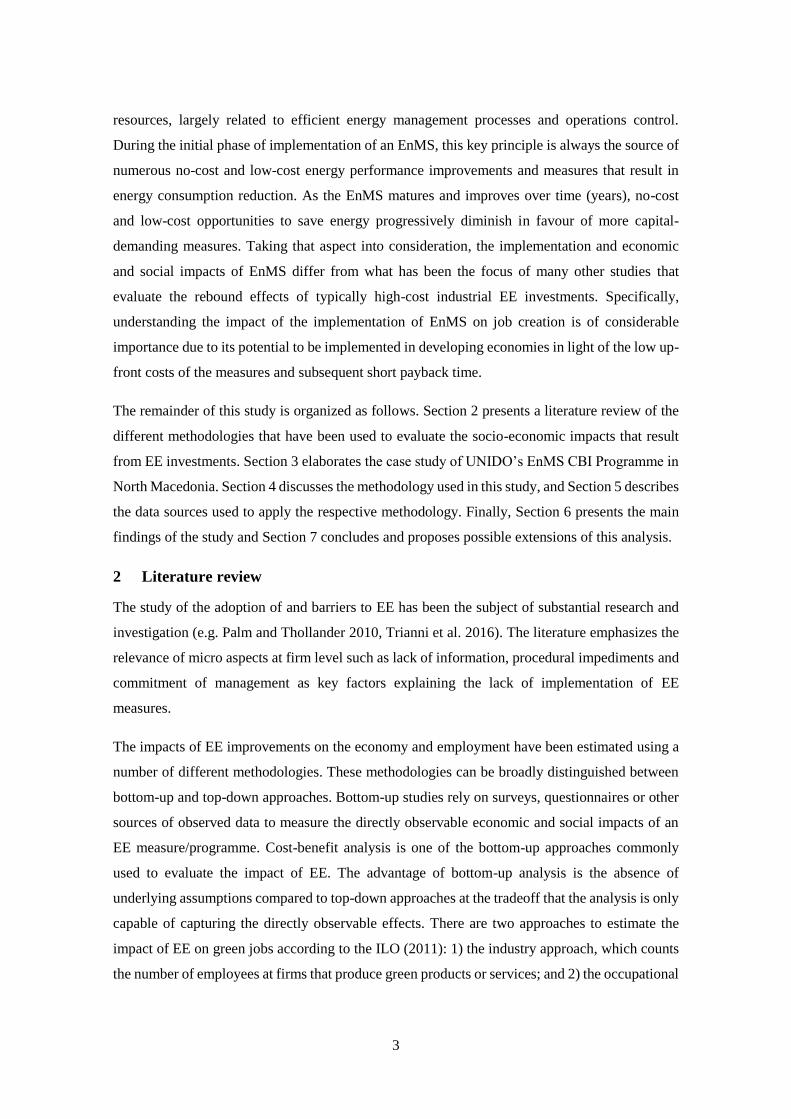
24
Appendix B
Figure 3: Gross output of the North Macedonian economy, 2010
Source: North Macedonian State Statistical Office (2013).
Note: For product code correspondence to product name, please refer to Appendix B.
Figure 4: Value added of the North Macedonian economy, 2010
Source: North Macedonian State Statistical Office (2013).
Note: For product code correspondence to product name, please refer to Appendix B.
0
20
40
60
80
100A B
10
;11
;12
13
;14
;15
16
17
18
19
20
;21
22
23
24
25
26
; 27
; 28
29
; 30
31
; 32
33 D E F G H I J K L M N O P Q R S T
In b
illio
n M
KD
Product code, CPA 1995
0
10
20
30
40
50
60
A B1
0;1
1;1
21
3;1
4;1
51
61
71
81
92
0;2
12
22
32
42
52
6; 2
7; 2
82
9; 3
03
1; 3
23
3 D E F G H I J K L M N O P Q R S T
In b
illio
n M
KD
Product code, CPA 1995
25
Figure 5: Employment by industry in North Macedonia, 2016
Source: Eurostat (2017).
Note: For product code correspondence to product name, please refer to Appendix C.
0
20
40
60
80
100
120
A
10
; 11
; 12
16
18
20
; 21
23
25
29
; 30
33 E G I K M O Q S
In t
ho
usa
nd
em
plo
yee
s
26
Appendix B
Table 6: Macedonian 2010 Symmetric Input-Output Product Groups
Code CPA 1995 Products Description
A Products of agriculture, forestry and fishing
B Mining and quarrying
10; 11; 12 Food products, beverages and tobacco products
13; 14; 15 Textiles, wearing apparel and leather products
16 Wood and products of wood and cork, except furniture; articles of straw and plaiting materials
17 Paper and paper products
18 Printing and recording services
19 Coke and refined petroleum products
20; 21 Chemicals, chemical products, basic pharmaceutical products and pharmaceutical preparations
22 Rubber and plastic products
23 Other non-metallic mineral products
24 Basic metals
25 Fabricated metal products, except machinery and equipment
26; 27; 28 Computer, electronic and optical products, electrical equipment, machinery and equipment n.e.c.
29; 30 Motor vehicles, trailers, semi-trailers and other transport equipment
31; 32 Furniture; other manufactured goods
33 Repair and installation services of machinery and equipment
D Electricity, gas, steam and air conditioning
E Water supply, sewerage; waste management and remediation services
F Construction works
G Wholesale and retail trade services; repair services of motor vehicles and motorcycles
H Transport and storage services
I Accommodation and food services
J Information and communication services
K Financial and insurance services
L Real estate services

27
M Professional, scientific and technical services
N Administrative and support services
O Public administration and defence services; compulsory social security services
P Education services
Q Human health and social work services
R Arts, entertainment and recreation services
S Other services
T Services of households as employer; undifferentiated goods and services produced by households
for own use
Source: State Statistical Office of Macedonia.
28
Appendix C
Table 7: Industry Classification of Employment in Macedonia, 2016
NACE
Rev. 2 Industry Name
A Agriculture, forestry and fishing
B Mining and quarrying
10; 11; 12 Manufacture of Food products, beverages and tobacco products
13; 14; 15 Manufacture of Textiles, wearing apparel and leather products
16 Manufacture of Wood and products of wood and cork, except furniture; articles of straw and plaiting
materials
17 Manufacture of Paper and paper products
18 Manufacture of Printing and recording services
19 Manufacture of Coke and refined petroleum products
20; 21 Manufacture of Chemicals, chemical products, basic pharmaceutical products and pharmaceutical
preparations
22 Manufacture of Rubber and plastic products
23 Manufacture of Other non-metallic mineral products
24 Manufacture of Basic metals
25 Manufacture of Fabricated metal products, except machinery and equipment
26; 27; 28 Manufacture of Computer, electronic and optical products, electrical equipment, machinery and
equipment n.e.c.
29; 30 Manufacture of Motor vehicles, trailers, semi-trailers and other transport equipment
31; 32 Manufacture of Furniture; other manufactured goods
33 Manufacture of Repair and installation services of machinery and equipment
D Electricity, gas, steam and air conditioning
E Water supply, sewerage; waste management and remediation services
F Construction
G Wholesale and retail trade services; repair services of motor vehicles and motorcycles
H Transport and storage services
I Accommodation and food services
J Information and communication services

29
K Financial and insurance services
L Real estate services
M Professional, scientific and technical services
N Administrative and support services
O Public administration and defence services; compulsory social security services
P Education services
Q Human health and social work services
R Arts, entertainment and recreation services
S Other services
T Services of households as employers; undifferentiated goods and services produced by households
for own use
Source: Eurostat

Vienna International Centre · P.O. Box 300 9 · 1400 Vienna · AustriaTel.: (+43-1) 26026-o · E-mail: [email protected]