Embed Size (px)
Citation preview

The impact of increasing vegetable consumption on health expenditure Prepared for Horticulture Innovation Australia Limited
July 2016

Liability limited by a scheme approved under Professional Standards Legislation. Deloitte refers to one or more of Deloitte Touche Tohmatsu Limited, a UK private company limited by guarantee, and its network of member firms, each of which is a legally separate and independent entity. Please see www.deloitte.com/au/about for a detailed description of the legal structure of Deloitte Touche Tohmatsu Limited and its member firms. © 2016 Horticulture Innovation Australia Ltd
Contents Glossary ..................................................................................................................................... i
Executive summary ................................................................................................................... ii
1 Background ..................................................................................................................... 1
1.1 Structure of report ............................................................................................................ 1
2 The impacts of higher vegetable consumption in Australia .............................................. 3
2.1 Australia’s vegetable consumption .................................................................................... 3
2.2 The impact of vegetable consumption on health outcomes ............................................... 9
2.3 The impact of higher vegetable consumption on government health expenditure ........... 12
2.4 The impact of higher vegetable consumption on producer returns .................................. 20
3 Options for intervention................................................................................................ 26
3.1 Barriers to increasing consumption ................................................................................. 26
3.2 Options for intervention.................................................................................................. 26
References .............................................................................................................................. 30
Appendix A : Australia’s vegetable consumption ..................................................................... 36
A.1 Quantity of vegetables consumed ................................................................................... 36
A.2 Type of vegetables consumed ......................................................................................... 38
A.3 Levied and non-levied vegetables .................................................................................... 41
A.4 Vegetable imports........................................................................................................... 43
Appendix B : The impact of higher vegetable consumption on health outcomes and government health expenditure.............................................................................................. 45
B.1 Set of conditions ............................................................................................................. 45
B.2 Attributable fractions for the burden of disease due to low vegetable consumption ........ 47
B.3 Marginal risk change associated with changing vegetable consumption........................... 55
B.4 Calculating the change in health expenditure .................................................................. 60
B.5 Caveats to the health expenditure modelling and results presented ................................ 73
Appendix C : The impact of higher vegetable consumption on producer returns ..................... 75
C.1 Australian production for domestic human consumption ................................................ 75
C.2 Measuring producer returns ........................................................................................... 77
C.3 Results ............................................................................................................................ 80
Limitation of our work ............................................................................................................ 84

Charts Chart 2.1 : Proportion of males and females who met recommended guidelines for vegetable intake, by age ........................................................................................................................... 4
Chart 2.2 : Proportion of population consuming serves of vegetables, by age ........................... 5
Chart 2.3 : Proportion of males and females who met recommended guidelines for fruit and vegetable intake ....................................................................................................................... 6
Chart 2.4 : Proportion of people meeting recommended guidelines for vegetable intake by state and territory ..................................................................................................................... 6
Chart 2.5 : Apparent vegetable consumption per capita for OECD countries, 2014 .................... 7
Chart 2.6 : Average vegetable consumption (% of total vegetable consumption by weight) ....... 8
Chart 2.7 : Vegetable consumption by location of production ................................................... 8
Chart 2.8 : Levied and non-levied vegetables ............................................................................ 9
Chart 2.9 : Proportion of health expenditure attributable to low vegetable consumption avoided by gender and age, all conditions – scenario 1 ........................................................... 14
Chart 2.10 : Change in government expenditure – scenario 1 .................................................. 15
Chart 2.11 : Proportion of health expenditure attributable to low vegetable consumption avoided by cause by age, male – scenario 2 ............................................................................ 16
Chart 2.12 : Change in government expenditure – scenario 2 .................................................. 18
Chart 2.13 : Change in government expenditure – scenario 3 .................................................. 20
Chart 2.14 : Gross value of production for human consumption by vegetable ......................... 21
Chart 2.15 : Change in vegetable industry profits .................................................................... 24
Chart 2.16 : Change in gross value of vegetables produced ..................................................... 24
Chart B.1 : Relative risk of cancer associated with varying vegetable consumption levels, relative to low consumption ................................................................................................... 56
Chart B.2 : Relative risk of CVD associated with varying vegetable consumption levels, relative to low consumption ................................................................................................................ 56
Chart B.3 : Relative risk of cancer associated with varying vegetable consumption levels, relative to minimum risk profile .............................................................................................. 57
Chart B.4 : Relative risk of CVD associated with varying vegetable consumption levels, relative to minimum risk profile ........................................................................................................... 58
Chart B.5 : Relative risk of cancer curve associated with varying vegetable consumption levels59
Chart B.6 : Relative risk of CVD curve associated with varying vegetable consumption levels .. 59
Chart B.7 : Change in cancer risk, persons – scenario 1 ............................................................ 63
Chart B.8 : Change in CVD risk, persons – scenario 1 ............................................................... 63
Chart B.9 : Proportion of health expenditure attributable to low vegetable consumption avoided by gender and age, males – scenario 1 ....................................................................... 64

Chart B.10 : Proportion of health expenditure attributable to low vegetable consumption avoided by cause by age, female – scenario 1 ......................................................................... 64
Chart B.11 : Change in cancer risk, persons – scenario 2 .......................................................... 68
Chart B.12 : Change in CVD risk, persons – scenario 2 ............................................................. 68
Tables
Table 2.1 : Government health expenditure attributable to low vegetable consumption, 2015-16 .................................................................................................................................. 13
Table 2.2 : Change in government expenditure – scenario 1 .................................................... 15
Table 2.3 : Change in government expenditure – scenario 2 .................................................... 17
Table 2.4 : Change in government expenditure – scenario 3 .................................................... 19
Table 2.5 : Value of domestic production for domestic human consumption, 2015-16 ............ 22
Table 2.6 : Key financial estimates for vegetable growing farms .............................................. 22
Table 2.7 : Estimated value of production and profit using ABARES (2015a) – vegetables for domestic consumption............................................................................................................ 23
Table A.1 : Average daily weight and serves of vegetables consumed per person .................... 37
Table A.2 : Proportion of population meeting recommended daily intake of vegetables (%) .... 37
Table A.3 : Average vegetable consumption per day (75g per serve) ....................................... 37
Table A.4 : Recommended serves per day of vegetables ......................................................... 38
Table A.5 : Mean daily food consumption of major vegetable food groups .............................. 39
Table A.6 : Description of constituent components of major vegetable food groups................ 39
Table A.7 : Consumption of NVL-exempt vegetables ............................................................... 42
Table A.8 : Average consumption of levied vegetables per day (75g per serve) ....................... 42
Table A.9 : Average daily consumption of imported and Australian produced vegetables ........ 44
Table B.1 : Significant associations between consumption of vegetables and risk of selected conditions for high and low consumption of vegetables .......................................................... 47
Table B.2 : DALYs attributable to low vegetable consumption, 2011 ........................................ 49
Table B.3 : Vegetable risk reduction relative to fruit and vegetables combined ....................... 51
Table B.4 : Overall expenditure on cancers and CVD, 2015-16 ................................................. 53
Table B.5 : Expenditure on cancers and CVD attributable to low consumption of vegetables, 2015-16 .................................................................................................................................. 54
Table B.6 : Relative risk of conditions associated with varying consumption of vegetables ...... 55
Table B.7 : Baseline consumption of vegetables and associated risk of cancer and CVD ........... 60
Table B.8 : Consumption of vegetables and associated risk of cancer and CVD – scenario 1..... 62
Table B.9 : Total change in expenditure – scenario 1 ............................................................... 65

Table B.10 : Change in government expenditure – scenario 1 .................................................. 66
Table B.11 : Consumption of vegetables and associated risk of cancer and CVD – scenario 2 ... 67
Table B.12 : Total change in expenditure – scenario 2 ............................................................. 69
Table B.13 : Change in government expenditure – scenario 2 .................................................. 70
Table B.14 : Consumption of vegetables and associated risk of cancer and CVD – scenario 3 ... 71
Table B.15 : Total change in expenditure – scenario 3 ............................................................. 72
Table B.16 : Change in government expenditure – scenario 3 .................................................. 73
Table C.1 : Value of vegetable production for human consumption ......................................... 76
Table C.2 : Estimated value of vegetable production for human consumption ......................... 76
Table C.3 : Estimated value of vegetable exports, by levy paying status................................... 77
Table C.4 : Estimated value of vegetable production for domestic human consumption, by levy paying status........................................................................................................................... 77
Table C.5 : Key financial estimates for vegetable growing farms .............................................. 78
Table C.6 : Estimated value of production for domestic consumption...................................... 79
Table C.7 : Scenario results – changes in vegetable consumption ............................................ 81
Table C.8 : Scenario results – changes in producer returns based on ABS (2016a) ................... 82
Table C.9 : Sensitivity test results- changes in producer returns based on ABARES (2015a) ...... 83
Acknowledgement This report is an output from a vegetable industry project (VG15031) and has been funded by Horticulture Innovation Australia using the vegetable levy and funds from the Australian Government.

i Deloitte Access Economics
Glossary
ABARES Australian Bureau of Agricultural and Resource Economics and Sciences
ABS Australian Bureau of Statistics
AIHW Australian Institute of Health and Welfare
CVD cardiovascular disease
DALY disability adjusted life year
EVAO estimated value of agricultural operations
FAOSTAT Statistical division of the Food and Agricultural Organization of the United Nations
FFQ food frequency questionnaire
Hort Innovation Horticulture Innovation Australia
NHMRC National Health and Medical Research Council
NHS National Health Survey
NNPAS National Nutrition and Physical Activity Survey
NVL National Vegetable Levy
OECD Organisation for Economic Co-operation and Development
WHO World Health Organization
USA United States of America

ii Deloitte Access Economics
Executive summary Deloitte Access Economics was commissioned by Horticulture Innovation Australia (“Hort Innovation”) to model the impact that increased vegetable consumption would have on reducing government health expenditure, and the returns to producers as a result of the increased consumption.
This report is intended to provide a ‘case for change’ for increasing the level of vegetable consumption in Australia. To this end, the report presents information on the level of vegetable consumption in Australia, quantifies the impact that increasing consumption of vegetables would have on health expenditure in 2015-16, and calculates the returns that would flow to vegetable producers if consumption (and hence production) increased.
Vegetable consumption in Australia
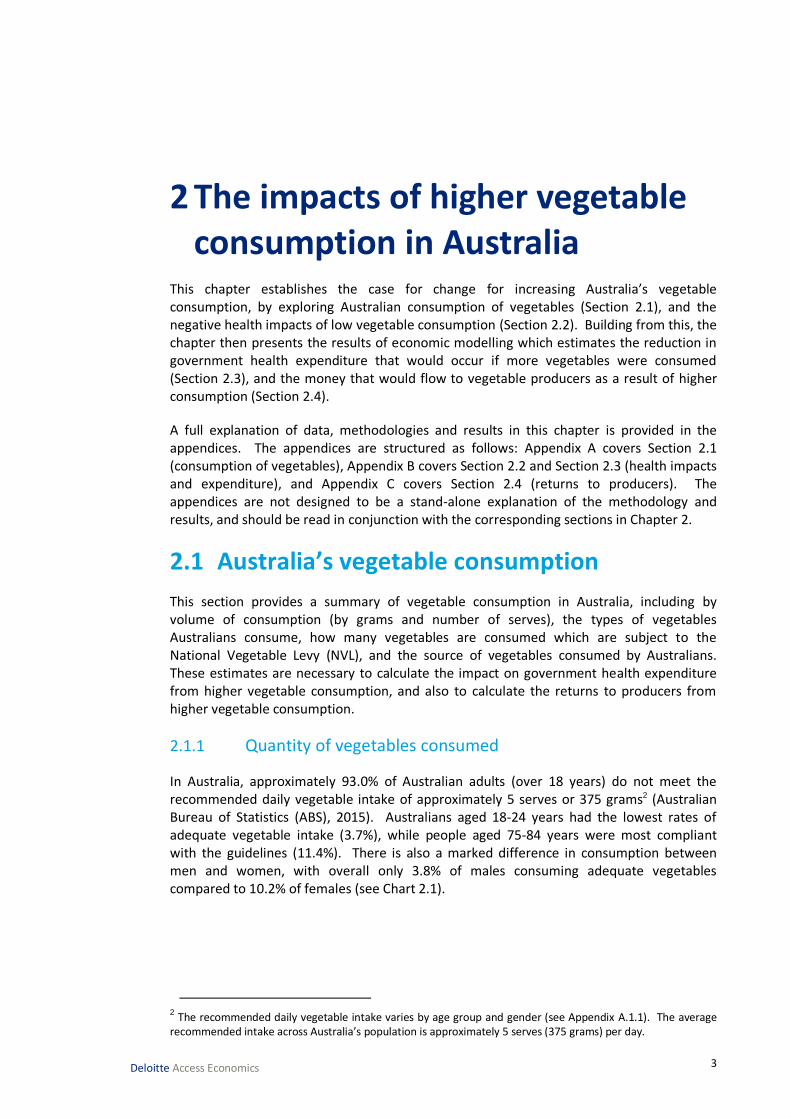
The Australian Bureau of Statistics (ABS, 2015a) has estimated that approximately 93.0% of Australian adults (over 18 years) do not meet the recommended daily vegetable intake of approximately 5 serves or 375 grams. There is a marked difference in consumption between men and women, with overall only 3.8% of males consuming adequate vegetables compared to 10.2% of females. Overall, the average Australian eats 2.3 serves of vegetables per day, which is less than half the recommended amount.
Chart i: Proportion of people who met recommended guidelines for vegetable intake, by age
Source: ABS (2015a).
Reduced health spending from higher vegetable consumption
There is a well-established link between increased intake of vegetables and improved health outcomes. To quantify the savings in government health expenditure that would occur if vegetable consumption were higher, Deloitte Access Economics:
identified the health conditions that may be reduced by higher consumption of vegetables – these were cardiovascular disease, and some cancers;
0
2
4
6
8
10
12
18–24 25–34 35–44 45–54 55–64 65–74 75–84 85 + Total18+
Pro
po
rtio
n o
f p
op
ula
tio
n (
%)
iii Deloitte Access Economics
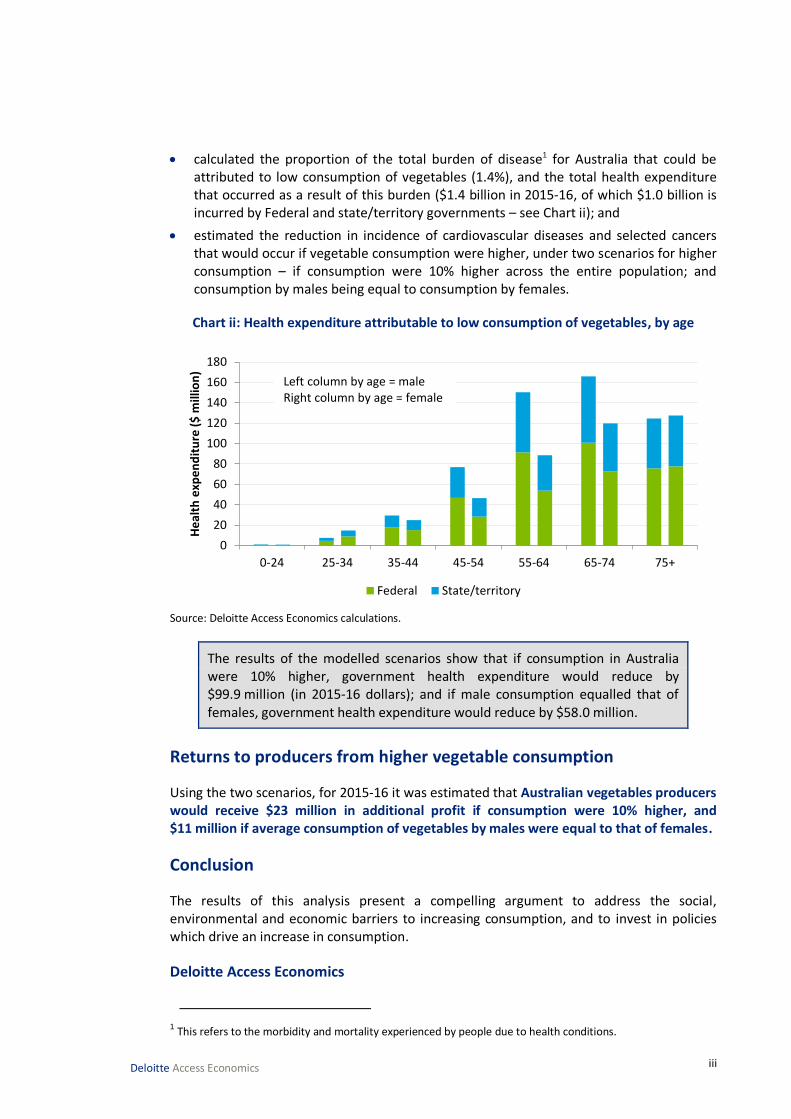
calculated the proportion of the total burden of disease1 for Australia that could be attributed to low consumption of vegetables (1.4%), and the total health expenditure that occurred as a result of this burden ($1.4 billion in 2015-16, of which $1.0 billion is incurred by Federal and state/territory governments – see Chart ii); and
estimated the reduction in incidence of cardiovascular diseases and selected cancers that would occur if vegetable consumption were higher, under two scenarios for higher consumption – if consumption were 10% higher across the entire population; and consumption by males being equal to consumption by females.
Chart ii: Health expenditure attributable to low consumption of vegetables, by age
Source: Deloitte Access Economics calculations.
The results of the modelled scenarios show that if consumption in Australia were 10% higher, government health expenditure would reduce by $99.9 million (in 2015-16 dollars); and if male consumption equalled that of females, government health expenditure would reduce by $58.0 million.
Returns to producers from higher vegetable consumption
Using the two scenarios, for 2015-16 it was estimated that Australian vegetables producers would receive $23 million in additional profit if consumption were 10% higher, and $11 million if average consumption of vegetables by males were equal to that of females.
Conclusion
The results of this analysis present a compelling argument to address the social, environmental and economic barriers to increasing consumption, and to invest in policies which drive an increase in consumption.
Deloitte Access Economics
1 This refers to the morbidity and mortality experienced by people due to health conditions.
0-24 25-34 35-44 45-54 55-64 65-74 75+
0
20
40
60
80
100
120
140
160
180
He
alth
exp
en
dit
ure
($
mill
ion
)
Federal State/territory
Left column by age = maleRight column by age = female

1 Deloitte Access Economics
1 Background Deloitte Access Economics was commissioned by Hort Innovation to model the impact that increased vegetable consumption would have on reducing government health expenditure, and the returns to producers as a result of the increased consumption. This report sets out the case for change and the results of the modelling, and identifies options for interventions that would increase vegetable consumption.
Hort Innovation is a not-for-profit, grower-owned research and development corporation for Australia’s $9.5 billion horticulture industry. Hort Innovation invests around $100 million in research, development and marketing programs and projects annually to provide benefits to industry and the wider community (Hort Innovation, 2016).
Hort Innovation’s key functions are to:
provide leadership to, and promote the development of, the Australian horticulture sector;
increase the productivity, farm gate profitability and global competitiveness of horticultural industries by investing grower levies and government funds in research, development, extension and marketing funds, program/project services and providing information, services and products related to program/project outcomes; and
promote the interests of horticultural industries overseas including the export of Australian horticultural products.
Hort Innovation was established following the acceptance of the recommendations of an independent review of Horticulture Australia Limited in 2014. Hort Innovation is now a grower-owned company with a new operating model that is designed to:
offer direct consultation with levy payers and other stakeholders;
understand and know what its members and levy payers want from it; and
practise commercial, evidence-based investments, while taking account of advice from a broad range of industry people.
1.1 Structure of report
This report is structured in the following manner:
Chapter 2 establishes the case for change, by presenting:
• analysis of the level of vegetable consumption in Australia by age and gender and how this compares to recommended consumption levels, and consumption in other countries;
• the impact that low consumption of vegetables has on health outcomes; and
• summarised results from the economic modelling regarding the impact of vegetable consumption on health expenditure and returns to farmers.
Chapter 3 identifies and discusses options for interventions that will increase vegetable consumption, and therefore reduce health expenditure and increase returns to

2 Deloitte Access Economics
farmers. This includes a discussion of the barriers to increased consumption, which may be improved through intervention.
Appendix A, Appendix B and Appendix C contain the detailed methodology, data and results which are presented in Chapter 2.
3 Deloitte Access Economics
2 The impacts of higher vegetable consumption in Australia
This chapter establishes the case for change for increasing Australia’s vegetable consumption, by exploring Australian consumption of vegetables (Section 2.1), and the negative health impacts of low vegetable consumption (Section 2.2). Building from this, the chapter then presents the results of economic modelling which estimates the reduction in government health expenditure that would occur if more vegetables were consumed (Section 2.3), and the money that would flow to vegetable producers as a result of higher consumption (Section 2.4).
A full explanation of data, methodologies and results in this chapter is provided in the appendices. The appendices are structured as follows: Appendix A covers Section 2.1 (consumption of vegetables), Appendix B covers Section 2.2 and Section 2.3 (health impacts and expenditure), and Appendix C covers Section 2.4 (returns to producers). The appendices are not designed to be a stand-alone explanation of the methodology and results, and should be read in conjunction with the corresponding sections in Chapter 2.
2.1 Australia’s vegetable consumption
This section provides a summary of vegetable consumption in Australia, including by volume of consumption (by grams and number of serves), the types of vegetables Australians consume, how many vegetables are consumed which are subject to the National Vegetable Levy (NVL), and the source of vegetables consumed by Australians. These estimates are necessary to calculate the impact on government health expenditure from higher vegetable consumption, and also to calculate the returns to producers from higher vegetable consumption.
2.1.1 Quantity of vegetables consumed
In Australia, approximately 93.0% of Australian adults (over 18 years) do not meet the recommended daily vegetable intake of approximately 5 serves or 375 grams2 (Australian Bureau of Statistics (ABS), 2015). Australians aged 18-24 years had the lowest rates of adequate vegetable intake (3.7%), while people aged 75-84 years were most compliant with the guidelines (11.4%). There is also a marked difference in consumption between men and women, with overall only 3.8% of males consuming adequate vegetables compared to 10.2% of females (see Chart 2.1).
2 The recommended daily vegetable intake varies by age group and gender (see Appendix A.1.1). The average
recommended intake across Australia’s population is approximately 5 serves (375 grams) per day.

4 Deloitte Access Economics
Chart 2.1: Proportion of males and females who met recommended guidelines for vegetable intake, by age
Source: ABS (2015a) Note: data for persons less than 18 years were not available at time of writing.
Chart 2.2 shows how the proportion of people consuming serves of vegetables varies by age. As the population ages, fewer people are eating 1-2 serves of vegetables, and more people eat 3-5 serves of vegetables. The number above each bar represents the average number of serves consumed by the corresponding age group. Vegetable consumption generally increases with age, reaching its peak in the 75-84 age group, before declining slightly among people aged 85 years and over. Children less than 12 years consume the least vegetables (on average 1.9 serves per day), however the recommended vegetable intake for children is also lower than for adults (see Table A.4 in Appendix A).
0
2
4
6
8
10
12
14
16
18–24 25–34 35–44 45–54 55–64 65–74 75–84 85 + Total18+
Pro
po
rtio
n o
f p
op
ula
tio
n (
%)
Males Females

5 Deloitte Access Economics
Chart 2.2: Proportion of population consuming serves of vegetables, by age
Source: ABS (2015a); ABS (2014) for persons under 18 years. Note: Number above each bar represents average serves per day.
Overall, it is estimated that the average Australian consumes 2.3 serves (173.6 grams) of vegetables per day.3 In total, Australians consume over 530,000 tonnes of vegetables per year. Females consume approximately 10.5% more vegetables than males.
Notably, there is a significant contrast between vegetable and fruit consumption in Australia. While only 7.0% of Australians have adequate vegetable intake, 49.8% meet recommended guidelines for fruit consumption (see Chart 2.3). Similar to vegetables, fewer males than females meet guidelines for fruit intake (ABS, 2015a).
3 The NHMRC define a standard serve of vegetables as approximately 75 grams.
0
20
40
60
80
100
0-12 13-17 18–24 25–34 35–44 45–54 55–64 65–74 75–84 85 years& over
Pro
po
rtio
n o
f p
op
ula
toin
(%
)
None Less than 1 serve 1 serve 2 serves
3 serves 4 serves 5 serves 6 or more serves
1.94 2.25 2.14 2.26 2.35 2.44 2.52 2.67 2.70 2.50

6 Deloitte Access Economics
Chart 2.3: Proportion of males and females who met recommended guidelines for fruit and vegetable intake
Source: ABS (2015a).
Vegetable consumption shows significant variance between Australian states and territories. In 2011-12, 12.7% of Tasmanians met the recommended guidelines for vegetable intake, compared to only 7.9% of people in the ACT.4 Chart 2.4 shows the proportion of people in each state and territory who met the recommended guidelines.
Chart 2.4: Proportion of people meeting recommended guidelines for vegetable intake by state and territory
Source: ABS (2012).
Internationally, Australia was ranked 63rd in the world by apparent consumption of vegetables per capita in 2011. Australia is behind other countries from the Organisation for Economic Co-operation and Development (OECD) such as the United States of America (USA), Canada, New Zealand, South Korea and Japan (Statistical division of the Food and
4 At the time of writing, state and territory statistics from the 2014-15 NHS were not published. Data from the
earlier 2011-12 NHS were used (ABS, 2012)
0
10
20
30
40
50
60
Pro
po
rtio
n o
f p
op
ula
toin
(%
)
Vegetables Fruit
Males Females
0
2
4
6
8
10
12
14
NSW VIC QLD SA WA TAS NT ACT
Pro
po
rtio
n o
f p
op
ula
tio
n (
%)

7 Deloitte Access Economics
Agricultural Organization of the United Nations (FAOSTAT), 2011).5 China was ranked first in the world, consuming over three times more vegetables than Australia on a per capita basis. Chart 2.5 shows per capita consumption of vegetables for OECD countries. Australia is ranked 20th out of 34 OECD countries, ahead of countries such as Ireland, Germany and the United Kingdom, and behind the USA, Canada and New Zealand.
Chart 2.5: Apparent vegetable consumption per capita for OECD countries, 2014
Source: FAOSTAT (2011).
2.1.2 Types of vegetables consumed
The 2011-12 Australian Health Survey (ABS, 2014) provides a breakdown of the type of vegetables consumed by Australians. Chart 2.6 shows the major vegetable food groups and their contribution to average vegetable consumption (by weight). Australians consume significantly more potatoes than any other vegetable group, followed by ‘Other fruiting vegetables’ (which includes pumpkin, squash and zucchini, mushrooms and sweetcorn).6
5 Data are sourced from the FAOSTAT Food Balance Sheets 2011. FAOSTAT data captures ‘per capita food supply’ of vegetables, defined as total vegetables available for human consumption (in kilograms) divided by the population during the reference period. Thus these statistics represent only the average supply available for the population as a whole (or ‘apparent consumption’) and are only an approximation of true per capita consumption. For example, actual consumption may be lower due to food losses in transportation, storage, preparation, cooking, etc.
6 See Appendix A.2 for a description of each vegetable category.
0
25
50
75
100
125
150
175
200
225
250
275
Turk
ey
Gre
ece
Sou
th K
ore
a
Isra
el
Po
rtu
gal
Ital
y
Po
lan
d
Bel
giu
m
Spai
n
Den
mar
k
Esto
nia
Can
ada
New
Zea
lan
d
USA
Luxe
mb
ou
rg
Au
stri
a
Swit
zerl
and
Fran
ce
Jap
an
Au
stra
lia
Irel
and
Slo
vaki
a
Ger
man
y
Un
ite
d K
ingd
om
Hu
nga
ry
Swed
en
Fin
lan
d
Net
her
lan
ds
Slo
ven
ia
No
rway
Cze
ch R
epu
blic
Icel
and
Ch
ile
Mex
icoA
pp
are
nt
con
sum
pti
on
(kg
pe
r ca
pit
a)

8 Deloitte Access Economics
Chart 2.6: Average vegetable consumption (% of total vegetable consumption by weight)
Source: Deloitte Access Economics analysis; ABS (2014).
2.1.3 Domestically produced and imported vegetables
A significant portion of vegetables consumed by Australians are imported from other countries. By weight, approximately 76.7% of vegetables consumed are produced in Australia, and the remaining 23.3% are imported (ABARES, 2015b; ABS, 2016a). This is shown in Chart 2.7.
Chart 2.7: Vegetable consumption by location of production
Source: Deloitte Access Economics estimates based on ABARES (2015b) and ABS (2016a).
Further detail on vegetable imports and exports is provided in Appendix A.4.
2.1.4 Levied and non-levied vegetables
The NVL7 applies to all vegetables produced in Australia with a number of exceptions (AUSVEG, 2016). Notable exemptions include potatoes and tomatoes. Vegetables that pay
7 The NVL is collected from growers at the first point of sale (e.g. wholesale market) and revenue is forwarded to Hort Innovation to coordinate, invest, and manage R&D and promotional programs on behalf of the vegetable industry.
Potatoes35.7%
Cabbage, cauliflower & similar brassica vegetables
6.9%
Carrot & similar root vegetables
11.2%
Leaf & stalk vegetables
4.9%
Peas & beans4.8%
Tomato & tomato products
10.0%
Other fruiting vegetables
14.6%
Other vegetables & vegetable
combinations11.8%
76.7% 23.3%
Domestically produced Imports

9 Deloitte Access Economics
the NVL (‘levied’ vegetables) are estimated to account for 51.0% of consumption by weight. The consumption shares for levied and non-levied vegetables are shown in Chart 2.8.
Chart 2.8: Levied and non-levied vegetables
Source: Deloitte Access Economics estimates based on ABS (2014). Note: ABS (2014) only includes major vegetable categories and does not individually identify all non-levied vegetables. Asparagus, herbs (other than fresh culinary shallots and parsley), melons (e.g. bitter and hairy melons), and seed sprouts cannot be separated in the data. These factors are not likely to have a significant impact on our estimates because these vegetables represent a relatively small share of total consumption.
2.2 The impact of vegetable consumption on health outcomes
There is a well-established link between increased intake of vegetables and improved health outcomes. More broadly, the academic literature often considers the association between fruit and vegetable intake and various conditions, while burden of disease studies indicate the total burden attributable to low consumption.
The term “burden of disease” refers to the loss of wellbeing experienced by people who suffer from ill health. The burden of disease is measured using disability adjusted life years (DALYs). DALYs are a measure of life and health on a scale of 0 to 1, where 0 represents a year of perfect health and 1 represents death. DALYs are a combined measure of years of life lost due to premature mortality and years of life lost due to disability.
The burden attributable to low vegetable consumption is defined in a number of burden of disease studies undertaken both locally and internationally. The burden of disease studies indicate that low vegetable consumption results in increased health burden across a number of cardiovascular conditions and cancers. It is important to note that burden of disease studies measure DALYs associated with conditions that are due to low consumption.
49.0%
Levied51.0%
Non-levied
Potatoes35.7%
Tomato & tomato products
10.0%
1.1%.%
Onion, leek and
garlic 2.2%
Levied51.0%
Mushrooms

10 Deloitte Access Economics
To determine the burden attributable to low consumption of vegetables and any associated health expenditure, it was first necessary to identify the pathways and conditions that may be the result of low consumption.
This section outlines the impact of vegetable consumption on health outcomes, including the pathways between low vegetable consumption and worse health outcomes and a summary of literature identifying the quantified risk of various conditions.
2.2.1 Conditions that are impacted by low vegetable consumption
The academic literature suggests that the risk of cardiovascular disease (CVD), and also cancer to a smaller extent, can be reduced by increased levels of vegetable consumption.
The World Health Organization (WHO) has published a comparative quantification of the burden that is attributable to a variety of risk factors for different regions. The WHO reviewed the literature and associations between fruit and vegetable intake, although their review did not specifically identify associations between health outcomes for vegetable consumption alone (Lock et al, 2004). In Australia, the Australian Institute of Health and Welfare (AIHW) has based its analyses on the health outcomes reported by the WHO and the global burden of disease studies (Begg et al, 2007; AIHW, 2016). These studies indicate that a number of cancers and CVD are attributable to low consumption of vegetables in Australia. Overall, approximately 1.4% of the overall burden of disease and injury in Australia was considered to be attributable to low vegetable consumption (AIHW, 2016).
The latest Global Burden of Disease study (Forouzanfar et al, 2015; Institute for Health Metrics and Evaluation, 2015) indicates that low consumption of vegetables is only associated with ischaemic heart disease and stroke. However, evidence from the American Institute for Cancer Research (2007) suggests that it is “probable”8 that consumption of vegetables is associated with a number of cancers such as oesophageal cancers and lung cancer. This finding from the American Institute for Cancer Research is reinforced in the literature review summarised in Appendix B. Consequently, this study still includes outcomes for cancers – following the methodology used by the AIHW (2016).
Broadly, vegetables act in a number of ways to protect against certain types of cancer and CVD. Lock et al (2004) suggests that nutrient and non-nutrient factors – in particular, agents which block the action of carcinogens, agents that suppress carcinogenesis, and antioxidants – which are present in vegetables provide some beneficial effect for certain types of cancers. For example, cruciferous vegetables such as spinach and broccoli, and types of yellow and orange vegetables contain protease inhibitors, isothiocyanates and carotenoids which suppress carcinogenesis (the initial formation of cancer). Further, these types of vegetables can also block carcinogens before carcinogenesis can occur. The other main mechanism that is thought to prevent cancer is that vegetables contain antioxidants which can prevent oxidative damage of deoxyribonucleic acid (commonly referred to as
8 The American Institute for Cancer Research (2007, p. 48) notes that ‘convincing’ and ‘probable’ “…denote the Panel’s judgements that the evidence of causality – that a factor either decreases or increases the risk of cancer – is strong enough to justify population goals and personal recommendations”. That is, probable evidence is still considered to imply causality between low consumption of vegetables and cancers as reported here.

11 Deloitte Access Economics
“DNA”), which is linked to certain cancers. These protective factors are thought to have a greater effect for cancers caused be specific external carcinogens such as lung cancer and gastrointestinal cancers (Lock et al, 2004).
As with cancers, vegetables act to protect against CVD through a variety of mechanisms. Lock et al (2004) identifies that research has typically focussed on atherosclerosis – or hardening of the arteries – and changes in blood pressure. The major mechanism which enables protection against the latter is the high potassium in vegetables. For atherosclerosis and atherogenesis – the process by which atherosclerosis occurs – folic acids and certain vitamins help prevent breakdown of proteins decreasing levels of homocysteine in the body. This decrease lowers the risk of oxidative damage and prevents atherogenesis (Lock et al, 2004). More broadly, Forouzanfar et al (2015) identify blood pressure, fasting plasma glucose and cholesterol as pathways between low consumption of vegetables and the increased risk of CVDs. An increase in vegetables can reduce these factors and therefore reduce risk of CVD (Lock et al, 2004).
To estimate the marginal impact of higher vegetable consumption on the burden of disease, a literature review was conducted. There were two purposes for the literature search. The first purpose was to confirm which conditions, and their burden, are associated with low vegetable consumption, and confirm the analysis undertaken by the AIHW (2016). The second purpose was to identify the marginal benefits of higher vegetable consumption.
A summary of the literature and the primary health outcomes identified are presented in Appendix B.1. The information presented in the appendix describes the study and the condition assessed. All of the studies considered were comprehensive meta-analyses of previously published research, where previous research is generally from prospective cohort studies.
The academic literature suggests that the risk of CVD, and also cancer to a smaller extent, can be reduced by increased levels of vegetable consumption. While the most recent global burden of disease study by Forouzanfar et al (2015) considers a smaller range of conditions than previous studies, the recent literature – including the analysis by the AIHW (2016) - supports that vegetables may still play an important role in reducing the risk of certain cancers. Consequently, the approach taken in this study is similar to that identified by AIHW (2016) and Begg et al (2007). The AIHW (2016) was considered to provide the best approximation of the total burden attributable to low vegetable consumption in Australia.9
9 We note that some studies (for example, Springmann et al (2016)) include a broader range of conditions, such as type 2 diabetes. The conditions included in Deloitte Access Economics’ modelling represent a conservative approach which is in line with methods used by the AIHW.
12 Deloitte Access Economics
2.3 The impact of higher vegetable consumption on government health expenditure
There were four primary steps taken in the modelling to determine the impact of higher vegetable consumption on government health expenditure:
Step 1: the conditions that may be reduced by higher vegetable consumption were identified (as in section 2.2). These data were obtained from the AIHW (2016).
Step 2: the ratio of the burden of disease that is attributable to low consumption of vegetables relative to the total burden of disease for the condition (the “attributable fraction”) was applied to the total health expenditure for the broad level groups - cardiovascular conditions and cancer – to determine the total health system expenditure attributable to low consumption. Health expenditure was obtained at the broad level of CVD in Australia and cancers in Australia for the year 2008-09, which is the most recent year available (AIHW, 2013; AIHW, 2014). This expenditure was inflated using population growth and health inflation to bring these to 2015-16 dollars (ABS, 2015b; AIHW, 2015).
Step 3: literature was then used to determine the relative risk curve for a marginal change in vegetable consumption. The relative risk curve represents the expected risk of incidence of a condition, or mortality due to a condition, given a certain level of vegetable consumption in terms of grams. The risk curve for CVDs is steeper than for cancer, reflecting that low vegetable consumption has a larger impact on CVDs. Throughout the rest of this report, the reduction in risk of a condition refers to a reduction in incidence of the condition or mortality due to the condition.
Step 4: the marginal reduction in risk of CVD or cancer relative to the difference between the baseline consumption risk and the minimum risk was considered to represent the proportion of attributable health expenditure that may be avoided by higher levels of consumption. The maximum expenditure that could be avoided is 100% of the expenditure attributable to low vegetable consumption.
In Australia in 2016, it was estimated that there would be $15.1 billion and $9.0 billion of health system expenditure for CVD and cancers, respectively. From the above methodology, it was estimated that 8.9% of CVD (CVD) DALYs are attributable to low consumption of vegetables and 0.5% of cancer DALYs are attributable to low consumption of vegetables.
Overall, it was estimated that there is approximately $978.5 million of government health expenditure attributable to low consumption of vegetables in 2015-1610 – federal government and state and territory governments pay for approximately $594.6 million and $383.9 million, respectively. The estimated government health expenditure attributable to low vegetable consumption by broad cause group and payer are outlined in Table 2.1.
10 Total government health expenditure for 2015-16 is estimated to be approximately $114.5 billion, after allowing for population growth and inflation. Thus, government health expenditure as a result of low vegetable consumption is approximately 0.9% of total government health expenditure.

13 Deloitte Access Economics
Table 2.1: Government health expenditure attributable to low vegetable consumption, 2015-16
Gender/ Age Federal ($m) State/ territory ($m) Total ($m)
Cancer CVD Cancer CVD
Male
0-24 0.1 0.6 0.0 0.4 1.2
25-34 0.1 4.5 0.1 2.9 7.5
35-44 0.8 17.1 0.5 11.0 29.4
45-54 1.6 45.2 1.0 29.2 77.0
55-64 3.7 87.6 2.4 56.6 150.3
65-74 4.7 96.1 3.0 62.0 165.8
75+ 3.2 72.5 2.1 46.8 124.6
Total 14.1 323.6 9.1 209.0 555.9
Female
0-24 0.0 0.5 0.0 0.3 0.8
25-34 0.1 8.8 0.1 5.7 14.7
35-44 0.3 14.7 0.2 9.5 24.8
45-54 0.6 27.6 0.4 17.8 46.5
55-64 1.0 52.8 0.6 34.1 88.6
65-74 1.4 71.3 0.9 46.0 119.7
75+ 1.0 76.5 0.7 49.4 127.6
Total 4.6 252.3 2.9 162.9 422.6
Overall 18.7 575.9 12.1 371.8 978.5
Source: Deloitte Access Economics calculations. Note: numbers may not add due to rounding.
The following sections report the results of various scenarios which examine the impact of higher vegetable consumption on government health expenditure. The scenarios include:
average consumption of vegetables across the population was 10% higher;
average consumption of vegetables by males was equal to that of females (or no less); and
all people in Australia ate the recommended servings of vegetables each day.
2.3.1 Scenario 1 – average consumption of vegetables was 10% higher
The first scenario considered 10% higher consumption of vegetables across all people in Australia. The baseline level of vegetable consumption was 10% higher for all age and gender groups.
The marginal change relative to the maximum change for each age and gender group was applied to the total expenditure for these groups to determine the reduction in government health expenditure associated 10% higher vegetable consumption. The modelling showed that if vegetable consumption were 10% higher, the risk of cancer would have been reduced by approximately 0.9 percentage points and the risk of CVD

14 Deloitte Access Economics
would have been reduced by approximately 1.6 percentage points across the population. The change in risk by age and gender group differs slightly resulting from changes in the underlying baseline consumption for each age and gender group. The change in the risk of cancer and CVD represents a reduction of approximately 23.4% and 9.8% of the total expenditure attributable to low consumption of vegetables for cancer and CVD, respectively. The proportion of expenditure that would have been avoided in each age and gender group for both cancer and CVD combined is shown in Chart 2.9.
Chart 2.9: Proportion of health expenditure attributable to low vegetable consumption avoided by gender and age, all conditions – scenario 1
Source: Deloitte Access Economics calculations.
The change in government expenditure was taken as the sum of the individual age and gender groups. It was estimated that government health expenditure would have been reduced by $99.9 million (in 2015-16 dollars) in scenario 1. The estimated reduction in overall government health expenditure is shown in Table 2.2 and Chart 2.10.
0%
2%
4%
6%
8%
10%
12%
14%
0-24 25-34 35-44 45-54 55-64 65-74 75+
Pro
po
rtio
n
Male Female

15 Deloitte Access Economics
Table 2.2: Change in government expenditure – scenario 1
Gender/ Age Federal ($m) State/ territory ($m) Total ($m)
Male
0-24 0.1 0.0 0.1
25-34 0.3 0.2 0.6
35-44 1.5 1.0 2.5
45-54 3.8 2.5 6.3
55-64 8.2 5.3 13.5
65-74 10.2 6.6 16.8
75+ 8.6 5.5 14.1
Total 32.7 21.1 53.8
Female
0-24 0.0 0.0 0.1
25-34 0.8 0.5 1.3
35-44 1.4 0.9 2.4
45-54 3.1 2.0 5.1
55-64 5.9 3.8 9.6
65-74 8.7 5.6 14.3
75+ 8.0 5.2 13.2
Total 28.0 18.1 46.1
Overall 60.7 39.2 99.9 Source: Deloitte Access Economics calculations. Note: numbers may not add due to rounding.
It was estimated that $60.7 million (61%) of the reduction in government expenditure accrues to federal government and $39.2 million (39%) accrues to the various state and territory governments as shown in Chart 2.10.
Chart 2.10: Change in government expenditure – scenario 1
Source: Deloitte Access Economics calculations.
0
5
10
15
20
25
30
35
0-24 25-34 35-44 45-54 55-64 65-74 75+
Exp
en
dit
ure
($
mill
ion
s)
Federal State/ territory
16 Deloitte Access Economics
2.3.2 Scenario 2 – consumption of vegetables by males was equal to that of females
The second scenario considered if average consumption of vegetables by males were equal to that of females, so that male consumption of vegetables was matched to females in the same age group. The only exception to this was for males aged 75 years or older, who consumed more vegetables than females – as such, there was no change applied to consumption levels for this group. It is noted that there is no change in consumption levels for females in this scenario, and consequently the marginal change in risk is 0 – implying that expenditure for this group is unchanged.
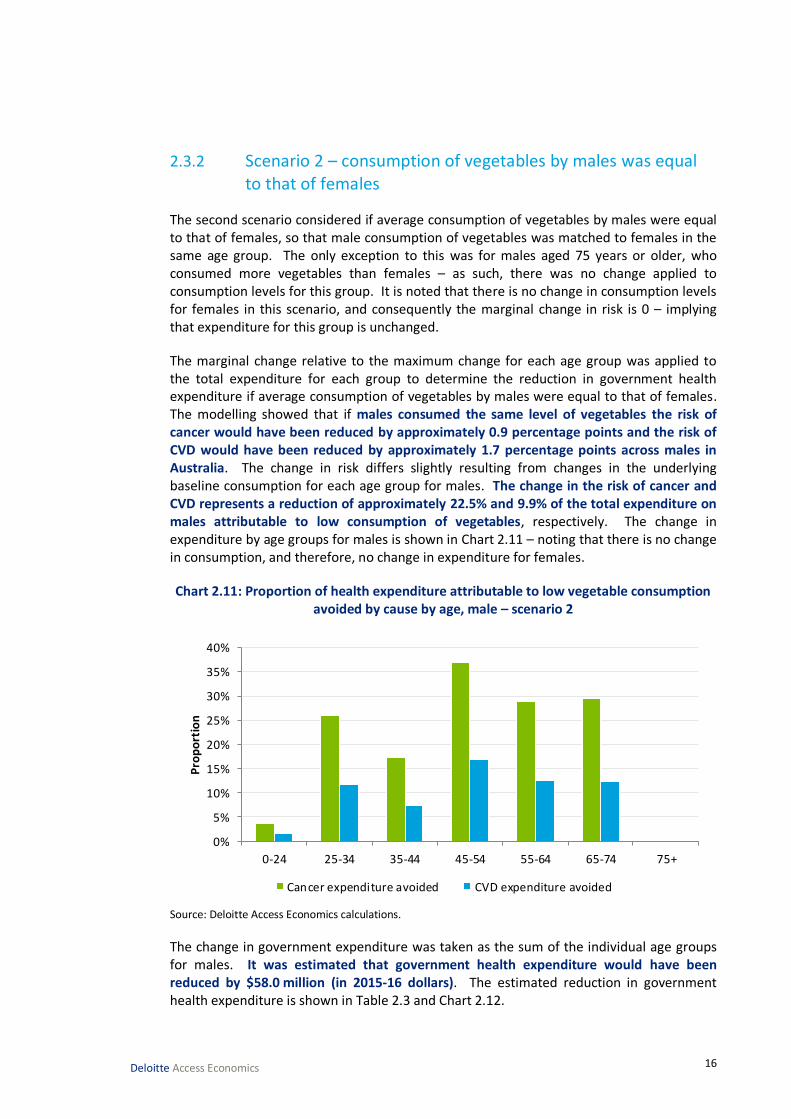
The marginal change relative to the maximum change for each age group was applied to the total expenditure for each group to determine the reduction in government health expenditure if average consumption of vegetables by males were equal to that of females. The modelling showed that if males consumed the same level of vegetables the risk of cancer would have been reduced by approximately 0.9 percentage points and the risk of CVD would have been reduced by approximately 1.7 percentage points across males in Australia. The change in risk differs slightly resulting from changes in the underlying baseline consumption for each age group for males. The change in the risk of cancer and CVD represents a reduction of approximately 22.5% and 9.9% of the total expenditure on males attributable to low consumption of vegetables, respectively. The change in expenditure by age groups for males is shown in Chart 2.11 – noting that there is no change in consumption, and therefore, no change in expenditure for females.
Chart 2.11: Proportion of health expenditure attributable to low vegetable consumption avoided by cause by age, male – scenario 2
Source: Deloitte Access Economics calculations.
The change in government expenditure was taken as the sum of the individual age groups for males. It was estimated that government health expenditure would have been reduced by $58.0 million (in 2015-16 dollars). The estimated reduction in government health expenditure is shown in Table 2.3 and Chart 2.12.
0%
5%
10%
15%
20%
25%
30%
35%
40%
0-24 25-34 35-44 45-54 55-64 65-74 75+
Pro
po
rtio
n
Cancer expenditure avoided CVD expenditure avoided

17 Deloitte Access Economics
Table 2.3: Change in government expenditure – scenario 2
Gender/ Age Federal ($m) State/ territory ($m) Total ($m)
Male
0-24 0.0 0.0 0.0
25-34 0.5 0.4 0.9
35-44 1.4 0.9 2.3
45-54 8.1 5.2 13.4
55-64 12.0 7.7 19.7
65-74 13.2 8.5 21.7
75+ - - -
Total 35.2 22.8 58.0
Female
0-24 - - -
25-34 - - -
35-44 - - -
45-54 - - -
55-64 - - -
65-74 - - -
75+ - - -
Total - - -
Overall 35.2 22.8 58.0 Source: Deloitte Access Economics calculations. Note: numbers may not add due to rounding.
It was estimated that $35.2 million (61%) of the reduction in government expenditure accrues to federal government and $22.8 million (39%) accrues to the various state and territory governments as shown in Chart 2.12. These benefits occur in the age groups between 0-74 year olds for males, noting that males over the age of 75 are consuming more vegetables than females in the same age group.

18 Deloitte Access Economics
Chart 2.12: Change in government expenditure – scenario 2
Source: Deloitte Access Economics calculations.
2.3.3 Scenario 3 – if all people in Australia ate the recommended daily intake of vegetables
The final scenario considers the change in expenditure if all people in Australia ate the recommended amount of vegetables for their age. This scenario is a hypothetical scenario and does not take into account that increasing consumption to this level would result in substantial changes to diet and other health risk factors. For example, this scenario assumes that vegetable consumption in Australia would have been approximately double – this would mean that there is “less room on the plate”, and consumption of other foods would be crowded out. This scenario also does not consider the change on the economy and how the additional food would have been sourced. It is considered unlikely that this scenario would occur even in the long term.
The marginal change relative to the maximum change in this scenario is equal to 100% for each age and gender group. This means that all expenditure attributable to low consumption would have been avoided as there was no low consumption.11
The modelling showed that across the whole population, consuming the recommended intake of vegetables would have reduced the risk of cancer by approximately 3.7 percentage points and it would have reduced the risk of CVD by approximately 16.6 percentage points. The change in risk differs slightly by age and gender group resulting from changes in the underlying baseline consumption for each group.
The change in government expenditure was taken as the sum of the individual age and gender groups. It was estimated that government health expenditure would have been
11 Note: for this scenario, the relative risk curves shown in Appendix B do not have a relative risk of 1 at exactly 375g of vegetable consumption. This is the implicit assumption in taking the change in risk relative to the minimum risk profile (relative risk of each condition is 1 at 375g of vegetable consumption). As a result, the total expenditure attributable to low vegetable consumption is avoided in this scenario.
0
5
10
15
20
25
0-24 25-34 35-44 45-54 55-64 65-74 75+
Exp
en
dit
ure
($
mill
ion
s)
Federal State/ territory

19 Deloitte Access Economics
reduced by $978.5 million. The estimated reduction in government health expenditure is shown in Table 2.4 and Chart 2.13.
Table 2.4: Change in government expenditure – scenario 3
Gender/ Age Federal ($m) State/ territory ($m) Total ($m)
Male
0-24 0.7 0.5 1.2
25-34 4.6 3.0 7.5
35-44 17.9 11.5 29.4
45-54 46.8 30.2 77.0
55-64 91.3 59.0 150.3
65-74 100.8 65.1 165.8
75+ 75.7 48.9 124.6
Total 337.8 218.1 555.9
Female
0-24 0.5 0.3 0.8
25-34 8.9 5.8 14.7
35-44 15.1 9.7 24.8
45-54 28.2 18.2 46.5
55-64 53.8 34.7 88.6
65-74 72.7 47.0 119.7
75+ 77.6 50.1 127.6
Total 256.8 165.8 422.6
Overall 594.6 383.9 978.5 Source: Deloitte Access Economics calculations. Note: numbers may not add due to rounding.
It was estimated that $594.6 million (61%) of the reduction in government expenditure accrues to federal government and $383.9 million (39%) accrues to the various state and territory governments as shown in Chart 2.13. These benefits would have primarily occurred in those over the age of 55, noting the reduction for males would have been greater due to their increased risk from low consumption of vegetables.

20 Deloitte Access Economics
Chart 2.13: Change in government expenditure – scenario 3
Source: Deloitte Access Economics calculations.
2.4 The impact of higher vegetable consumption on producer returns
This section estimates the returns that Australian vegetable producers would receive if vegetable consumption were higher. In order to develop this estimate, it was necessary to estimate the quantity of vegetables which are currently produced in Australia for domestic human consumption.
To do this, the modelling estimated the total value of vegetable production in Australia, subtracted vegetable exports, and split the vegetables into those which pay the NVL, and those which are not subject to the NVL.
The modelling assumed that a proportionally higher level of consumption, relative to baseline levels, would result in equal proportionally higher levels of vegetable production and industry revenues. For example, it is assumed that if consumption were 10% higher, then production would also be 10% higher. Hence we implicitly assumed that the ratios in which particular vegetables are consumed, wastage rates, as well as the relative shares of imports and exports, remained fixed. The modelling calculated returns to all vegetable producers, as well as just producers of levied vegetables.
All quantities and results in this section are expressed in 2015-16 dollars. Where applicable, we use the producer price index for ‘mushrooms and vegetable growing’ (ABS, 2016b) to convert data from earlier years.
2.4.1 Estimating the production of vegetables for domestic human consumption
For the purposes of modelling the impacts of higher vegetable consumption by Australians, we are interested in the production of vegetables for human consumption. However, not
0
50
100
150
200
250
300
0-24 25-34 35-44 45-54 55-64 65-74 75+
Exp
en
dit
ure
($
mill
ion
s)
Federal State/ territory
21 Deloitte Access Economics
all vegetables are produced for human consumption, with some production diverted to other purposes such as use in animal feed. In 2015-16, it is estimated that the gross value of vegetable production for human consumption will be $3.3 billion (ABS, 2016a).12
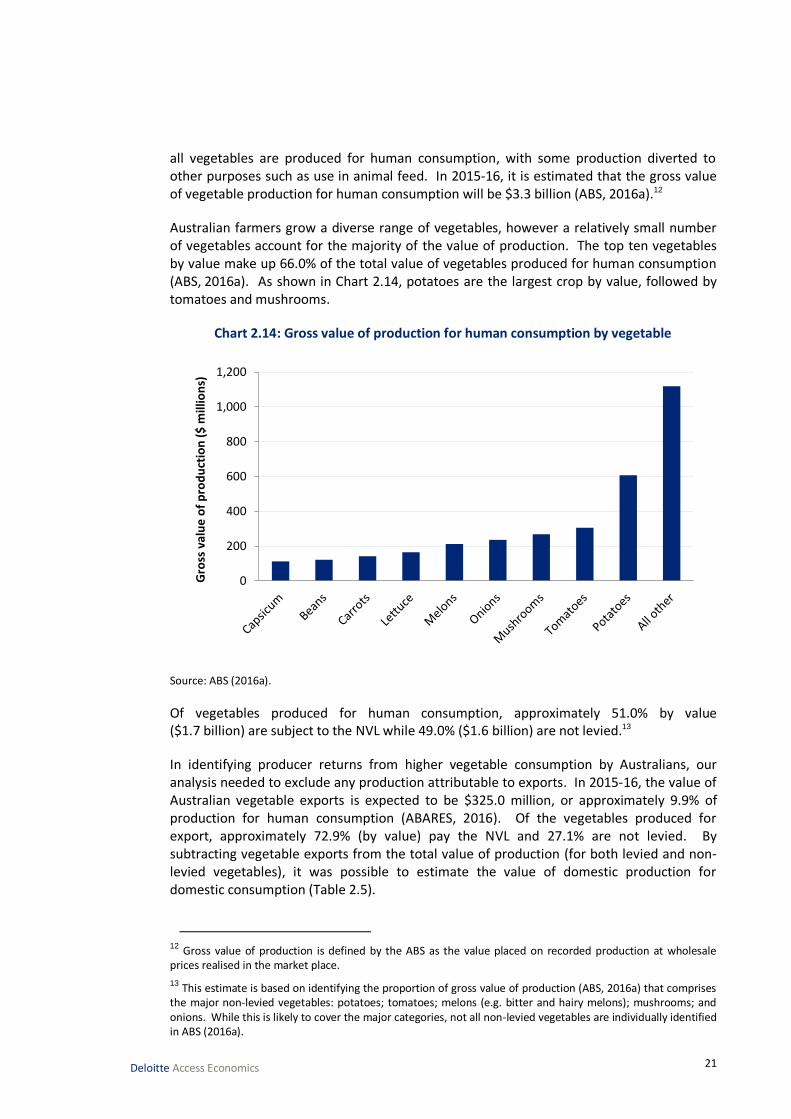
Australian farmers grow a diverse range of vegetables, however a relatively small number of vegetables account for the majority of the value of production. The top ten vegetables by value make up 66.0% of the total value of vegetables produced for human consumption (ABS, 2016a). As shown in Chart 2.14, potatoes are the largest crop by value, followed by tomatoes and mushrooms.
Chart 2.14: Gross value of production for human consumption by vegetable
Source: ABS (2016a).
Of vegetables produced for human consumption, approximately 51.0% by value ($1.7 billion) are subject to the NVL while 49.0% ($1.6 billion) are not levied.13
In identifying producer returns from higher vegetable consumption by Australians, our analysis needed to exclude any production attributable to exports. In 2015-16, the value of Australian vegetable exports is expected to be $325.0 million, or approximately 9.9% of production for human consumption (ABARES, 2016). Of the vegetables produced for export, approximately 72.9% (by value) pay the NVL and 27.1% are not levied. By subtracting vegetable exports from the total value of production (for both levied and non-levied vegetables), it was possible to estimate the value of domestic production for domestic consumption (Table 2.5).
12 Gross value of production is defined by the ABS as the value placed on recorded production at wholesale prices realised in the market place.
13 This estimate is based on identifying the proportion of gross value of production (ABS, 2016a) that comprises the major non-levied vegetables: potatoes; tomatoes; melons (e.g. bitter and hairy melons); mushrooms; and onions. While this is likely to cover the major categories, not all non-levied vegetables are individually identified in ABS (2016a).
0
200
400
600
800
1,000
1,200
Gro
ss v
alu
e o
f p
rod
uct
ion
($
mill
ion
s)

22 Deloitte Access Economics
Table 2.5: Value of domestic production for domestic human consumption, 2015-16
$ millions % of total
Levied vegetables 1,424.7 48.0%
Non-levied vegetables 1,541.9 52.0%
Total 2,966.5 100.0% Source: Deloitte Access Economics estimates.
The total value of domestic production for domestic human consumption (approximately $3.0 billion) represents the baseline industry revenue that can be affected by changes in the vegetable consumption patterns of Australians.
2.4.2 Vegetable grower profits and financial performance
This report defines producer returns as the profits received by Australian growers from the production of vegetables. It is estimated that the average Australian vegetable farm earns approximately $701,459 in revenue and $52,652 profit from vegetable production (Table 2.6). This implies a profit margin on vegetable production of approximately 7.5%. Farms that pay the NVL perform better than the average grower, with an average profit margin of approximately 9.1%.
There are approximately 2,595 vegetable growing farms in Australia with an estimated value of agricultural operations (EVAO) greater than $40,000 (ABARES, 2015a). Of these, 1,755 produced vegetables which were subject to the NVL, however many of these farms also produce vegetables not covered by the NVL.
Table 2.6: Key financial estimates for vegetable growing farms
All farms* NVL paying farms only*
Number of growers 2,595 1,755
Vegetable cash receipts $701,459 $845,877
Farm business profit from vegetables $52,652 $77,221
Profit margin on vegetable production 7.5% 9.1%
Source: ABARES (2015a); Deloitte Access Economics estimates Survey sample size: 298 growers, of which 197 were NVL paying farms *ABARES (2015a) only includes vegetable growing farm businesses (‘growers’) with an EVAO of $40,000 or
greater.
The data presented in Table 2.6 are based on an annual survey of vegetable growing farms undertaken by the Australian Bureau of Agricultural and Resource Economics and Sciences (ABARES). While the main modelling in this report defines value of production based on ABS statistics, it is also possible to estimate total value of production and industry profits using data from the ABARES survey. This was done by multiplying the number of growers by average cash receipts and business profits. Total cash receipts and profits were then reduced by the estimated share of production for export, using export parameters derived in Section 2.4.1. The results are summarised in Table 2.7.

23 Deloitte Access Economics
Table 2.7: Estimated value of production and profit using ABARES (2015a) – vegetables for domestic consumption
All farms* ($m) NVL paying farms only* ($m)
Value of production ($m) 1,640.6 1,273.0
Profit ($m) 123.1 116.2
Source: Deloitte Access Economics estimates based on ABARES (2015a).
Note: *ABARES 2015 includes vegetable growing farm businesses (‘growers’) with an EVAO of $40,000 or greater.
These estimates for value of production have been used as a sensitivity test to produce an alternative set of estimates for producer returns, as described in Appendix C.
2.4.3 Results - the impact of higher consumption on producer returns
The impact of vegetable consumption on producer returns was modelled using two scenarios representing moderately higher levels of vegetable consumption, as discussed in Section 2.3. Scenario 1 assumes 10% higher vegetable consumption across the population. Scenario 2 assumes that average consumption by males equals that of females.
The third scenario (vegetable intake meeting the recommended consumption level) was not modelled in relation to producer returns. This scenario would represent a more than doubling of current average consumption, from 2.3 to approximately 5.0 serves of vegetables per day. This would have significant impacts on Australian vegetable producers, which would need significantly higher production to meet new levels of demand. However, some vegetable growers may be constrained in their ability to ramp-up production in the short run. Possible constraints include availability of land, labour, machinery and financial capital.
Thus the third scenario would likely alter vegetable prices, as well as prices of inputs into production (for example, worker wages). Furthermore, vegetable imports and export volumes are likely to be affected by changes in domestic demand and the flow-on effects on market prices. These dynamics are beyond the scope of the current report and a comprehensive general equilibrium analysis would be required to assess these effects.
For the modelled scenarios, we assumed that vegetable prices are unchanged, and that the Australian vegetable industry can absorb higher vegetable demand without altering its cost drivers. As such, the modelled results represent long-run producer returns.
Total benefits to the vegetable industry (measured by higher profits) would be $22.3 million per year in Scenario 1 and $11.0 million per year in Scenario 2 (in 2015-16 dollars). The vegetable industry as a whole would be $296.7 million larger in Scenario 1 and $146.8 million larger in Scenario 2 (measured by annual gross value of production). The results are shown in Chart 2.15 and Chart 2.16, for all vegetables and levied vegetables only.

24 Deloitte Access Economics
Chart 2.15: Change in vegetable industry profits
Source: Deloitte Access Economics estimates.
Chart 2.16: Change in gross value of vegetables produced
Source: Deloitte Access Economics estimates.
Under Scenario 1, 10% higher consumption corresponds to an additional 17 grams of vegetables consumed per person per day (or about a 1/4 cup of salad vegetables per day). This would translate into an additional 150,812 tonnes of vegetables consumed in 2015-16. Scenario 2 assumes that male consumption matches current consumption by females. This would increase total consumption of vegetables by 74,638 tonnes.
Considering levied vegetables alone, Scenario 1 and 2 are expected to result in industry revenue being higher by $142.5 million and $70.5 million respectively. To meet these new levels of demand, NVL paying farms would produce an additional 53,000 tonnes of levied vegetables per year under Scenario 1, and over 26,000 tonnes under Scenario 2.14 Note, these results only consider production of levied vegetables. The benefits to NVL paying
14 These values represent the expected annual increase in the weight of levied vegetables consumed under the scenarios. The required increase in production would likely be even higher to account for food losses (for example, due to spoilage).
22.3
11.013.0
6.4
0
5
10
15
20
25
30
Scenario 1(10% increase)
Scenario 2(male = female)
Incr
eas
e in
pro
fit
($ m
illio
ns)
All vegetables Levied vegetables only
296.7
146.8142.5
70.5
0
50
100
150
200
250
300
350
400
Scenario 1(10% increase)
Scenario 2(male = female)
Incr
eas
e in
gro
ss v
alu
e (
$ m
illio
ns)
All vegetables Levied vegetables only

25 Deloitte Access Economics
farms are likely to be even higher since many of these farms also produce levy-exempt vegetables.
The scenario results represent long-run benefits. They implicitly assume that the Australian vegetable industry is able to absorb higher vegetable demand without altering grower cost drivers and wholesale vegetable prices. In the short-run, growers are likely to be constrained in their ability to scale-up production, including the availability of resources such as land, labour and financial capital.

26 Deloitte Access Economics
3 Options for intervention This chapter provides a discussion of the potential barriers to vegetable consumption, and possible interventions for increasing intake. The discussion is based on case studies and lessons learned from existing programs for promoting vegetable consumption in Australia and overseas. A comprehensive analysis of the options and their cost-effectiveness is outside the scope of this report. Further research and analysis is required to select the preferred option (or options) in Australia and identify strategies for effective implementation.
3.1 Barriers to increasing consumption
There are numerous potential barriers to increasing vegetable consumption, and these have been the subject of extensive research literature. A 2005 research report by the WHO provides a detailed literature review of the effectiveness of fruit and vegetable interventions around the world (Pomerleau et al, 2005). It finds that the factors influencing food choice and dietary intake can vary greatly across individuals, countries and cultures. Broadly, barriers can be grouped into three categories:
Social – factors include a lack of knowledge of the recommended intake of vegetables and/or individuals misperceiving the quantities of food they actually eat (Anderson, 1993). Personal and family eating habits can also be a barrier to changing consumption behaviours.
Environmental – consumption may be affected by factors such as limited availability, variety or quality of vegetables (for example in local shops), transportation and storage limitations, lack of skills in food preparation, and misperceptions of the effort required for cooking (Anderson et al, 1998).
Economic – this includes monetary and other costs associated with increasing vegetable consumption. For example, some individuals may find the price of vegetables, or the time associated with food preparation, to be a barrier. Furthermore, many programs for promoting healthy eating (for example, in schools or workplaces) are seen as too costly or time-consuming to sustain (Pomerleau et al, 2005).
Some of these barriers may be particularly relevant in the Australian context. For example, a nutrition survey of adults in Perth found that the main barriers to increasing vegetable consumption were the perceived adequacy of current intake and insufficient time available for vegetable preparation (Pollard, 2008). Another study found that Australians with lower income consumed a smaller volume and variety of fruits and vegetables and reported price and storage as barriers to increasing consumption (Giskes et al, 2002).
3.2 Options for intervention
A wide range of interventions have been trialled to increase vegetable consumption and overcome some of the barriers described above. This section provides a high level overview of some interventions that have proven successful in Australia or internationally.

27 Deloitte Access Economics
The purpose of this section is to highlight the potential policy levers that can be used to affect vegetable intake. However, further analysis is required of the available options and their potential effectiveness within the current Australian context. In particular, the success of any option will be dependent on social, economic and environmental factors specific to the regions in which it is implemented. Hence, further research is needed to evaluate options against Australia’s current demographic profile, in the context of any existing interventions, and having regard to the expected costs of implementation.
3.2.1 Australian case study – ‘Go for 2&5’ promotional campaign
One of the most notable, recent interventions in Australia is the ‘Go for 2&5’ social marketing campaign.15 The campaign is an initiative of the Commonwealth Government, which follows from a successful program conducted by the Western Australian Department of Health in 2002. ‘Go for 2&5’ aims to increase awareness about the benefits of eating fruit and vegetables and includes a wide range of promotional activities and nutritional information. The campaign is primarily delivered through specific initiatives run by State and Territory Governments.
The Western Australian ‘Go for 2&5’ campaign ran for three years between 2002 and 2005, and was the subject of extensive evaluation (Pollard, 2008). The campaign included mass media advertising (television, radio, press and point-of-sale), public relations events, publications, a website, and school and community activities. These initiatives came at a cost of approximately $3 million (Miller et al, 2007). The program evaluation comprised independent surveys monitoring fruit and vegetable intake before, during and 12 months after the campaign.
The campaign was widely successful, with the average serves of vegetables consumed by Western Australians increasing by 23% during the campaign period, from 2.6 serves per day in 2002 to 3.2 serves in 2005 (Pollard et al, 2007). It was found that knowledge of the correct number of serves was a critical factor in driving change. The number of people correctly identifying the recommended daily intake more than doubled from 20.4% in 2002 to 43.9% in 2005. However, surveys also revealed a significant decline in vegetable consumption in the 12 months post intervention. This showed that marketing efforts need to be sustained for improvements to continue into the future.
Nonetheless, the campaign is a successful demonstration of the effectiveness of promotional activities aimed at improving nutrition knowledge, attitudes and consumption in Australia.
3.2.2 International case studies
A variety of initiatives have been shown to be effective internationally for increasing vegetable consumption. A 2005 report from the World Health Organisation provides a literature review of 60 independent studies targeting fruit and vegetable consumption behaviours across various demographic groups (Pomerleau et al, 2005). The studies cover a number of intervention types including interventions in the general community, worksites, primary healthcare settings, and supermarkets. Some examples are summarised below.
15
See http://www.gofor2and5.com.au/
28 Deloitte Access Economics
Overall, Pomerleau et al (2005) found that the most successful interventions tended to be those involving focused approaches, personalised programs (such as one-on-one counselling), and those targeting individuals who were already at high risk of disease.
3.2.2.1 General population, school and community interventions
General community setting-based interventions can be grouped into two types – those involving individual counselling or education, and multi-component interventions.
Individual counselling is generally highly effective, and can involve activities such as telephone education, diet counselling and lectures to small groups (Marcus et al, 1998; Takashashi, 2003). These activities are often reinforced with information in printed materials such as mail-outs and newsletters. For example, a study in the USA involving phone-based education of callers to the Cancer Information Service found that fruit and vegetable consumption increased by 0.63 servings per day during the intervention, and 0.44 servings at a 12 month follow-up (Marcus et al, 1998).
Large-scale multi-component interventions can involve a diverse range of promotional activities targeted at the community in general, or particular demographic subgroups. Generally, more focused and coordinated campaigns show higher levels of effectiveness (Pomerleau et al, 2005). For example, the ‘5 a day’ project in England involved diverse promotional activities at food retailers, markets, schools, workplaces, and community events in five locations in England. However, an evaluation study found no increase in intake in the intervention group (United Kingdom Department of Health, 2002). However, a similar project in the USA targeting specifically Spanish speaking Latinos through community based activities resulted in an increase of 0.63 serves per day (Backman, 2003).
3.2.2.2 Worksite interventions
Worksite interventions can include individualised training such as nutrition classes, self-help materials, newsletters, and nutrition displays at workplaces. However, such programs do not generally result in large and sustained increases in consumption (Pomerleau et al, 2005). For example, one study testing the effect of integrating health interventions into standard health and safety training showed no significant change in fruit and vegetable intake (Sorensen et al, 2002). However, larger effects are seen in focused studies involving smaller employee populations, individualised nutrition education and social activities (Campbell et al, 2002). The low effectiveness of worksite interventions overall is often attributed to the significant time and resources required from staff and management (Pomerleau et al, 2005).
3.2.2.3 Interventions in healthcare and on-line settings
These interventions typically involve individual or group dietary counselling, the provision of computer-tailored nutrition advice, and/or printed educational materials provided in hospitals and clinics.
Individual and group counselling show the highest net effects, resulting in increases from 0.6 to 1.4 serves of fruit and vegetables consumed per day (John et al, 2002; Stevens, 2002). One of the most effective individualised approaches involved a multi-faceted

29 Deloitte Access Economics
strategy combining a 25-minute interview with two follow-up phone calls and provision of printed educational material (John et al, 2002).
Computer-based education has also been effective, with increases in fruit and vegetable consumption ranging between 0.7 to 1.1 serves per day at 6 months following intervention (Pomerleau et al, 2005). Examples of effective interventions include computer-based nutrition advice using algorithms to tailor messages based on personal information (Lutz et al, 1999), and regular communication and goal-setting with interactive computer-based systems (Delichatsios et al, 2001). These digital tools provide highly personalised advice and motivation, mimicking human-to-human interaction, but often with the benefit of a private and anonymous setting.
People with pre-existing health conditions (such as CVD or cancer) generally show larger improvements in fruit and vegetable consumption following intervention, with increases of up to 4.9 serving per day seen in some studies (Pomerleau et al, 2005). This likely reflects an elevated motivation to improve dietary intake among individuals with existing health risks.
3.2.2.4 Supermarket and retail interventions
Supermarket interventions aim to improve consumption by motivating healthy behaviours at the point of sale. Examples include education through computer kiosks (Anderson et al, 2001), as well as broad promotional programs involving flyers, discounts, and in-store cooking activities (Kristal et al, 1997). Anderson et al (2001) found that education, goal-setting and individual feedback provided through computer kiosks resulted in an increase of 0.52 servings of fruit and vegetables consumed per day. However, a study involving storewide promotion activities showed no statistically significant increase in consumption (Kristal et al, 1997). Similar to findings for other intervention types, focused and targeted supermarket interventions are typically more effective than general promotion activities.
A range of interventions are available to target the social, environmental and economic barriers to increasing vegetable consumption. These include interventions in community-based settings, workplaces, schools, healthcare settings and retail environments. Successful interventions generally involve focused approaches and personalised programs. However, the success of interventions can vary across regions and targeted population groups.
Further research is needed to identify and assess specific interventions for increasing vegetable consumption in Australia, and achieving the economic benefits identified in this report. In particular, future research activities could include an assessment of the expected costs and benefits of identified options.

30 Deloitte Access Economics
References Agudo A 2004, Measuring intake of fruit and vegetables, Background paper for the Joint
FAO/WHO Workshop on Fruit and Vegetables for Health, September, Kobe.
American Institute for Cancer Research 2007, Food, nutrition, physical activity, and the prevention of cancer: a global perspective, AICR, Washington DC.
Anderson AS 1993, ‘Who are the healthy eaters? Eating patterns and health promotion in the West of Scotland’, Health Education Journal, 51:3-10.
Anderson AS, Cox DN, McKellar S, Reynolds J, Lean ME, Mela DJ 1998, ‘Take Five, a nutrition education intervention to increase fruit and vegetable intakes: impacts on attitudes towards dietary change’, British Journal of Nutrition, 80(2):133-140.
Anderson ES, Winett RA, Wojcik JR et al 2001, ‘A computerized social cognitive intervention for nutrition behaviour: direct and mediated effects on fat, fiber, fruits, and vegetables, self-efficacy, and outcome expectations among food shoppers’, Annals of Behavioural Medicine, 23(2):88-100.
Aune D, Lau R, Chan DSM, Vieira R, Greenwood DC, Kampman E, Norat T 2011, ‘Nonlinear reduction in risk for colorectal cancer by fruit and vegetable intake based on meta-analysis of prospective studies’, Gastroenterology, 141: 106-118.
Australian Bureau of Agricultural and Resource Economics and Sciences 2016, Agricultural commodities March Quarter 2016, Australian Government, Canberra.
- 2015a, Australian vegetable growing farm businesses: an economic survey, 2013-14 and 2014-15, Australian Government, Canberra.
- 2015b, Agricultural commodity statistics 2015, Australian Government, Canberra.
Australian Bureau of Statistics 2016a, 7503.0 Value of Agricultural Commodities Produced 2014-15, Australia, Australian Government, Canberra.
- 2016b, 6427.0 Producer Price Indexes March 2016, Australia, Australian Government, Canberra.
- 2015a, 4364.0.55.001 National Health Survey: First Results 2014-15, Australia, Australian Government, Canberra.
- 2015b, 3101.0 Australian Demographic Statistics June 2015, Australia, Australian Government, Canberra.
- 2014, 4364.0.55.007 Australian Health Survey: Nutrition First Results – Food and Nutrients 2011-12, Australia, Australian Government, Canberra.
- 2012, 4364.0 National Health Survey 2011-12, Australia, Australian Government, Canberra.

31 Deloitte Access Economics
Australian Institute of Health and Welfare 2016, Australian Burden of Disease Study: Impact and causes of illness and death in Australia 2011, Australian Burden of Disease Study series no. 3, BOD 4, Australian Government, Canberra.
- 2015, Health expenditure Australia 2013-14, Health and welfare expenditure series no. 54, cat. no. HWE 63, Australian Government, Canberra.
- 2014, Health-care expenditure on CVDs 2008-09, cat. no. CVD 65, Australian Government, Canberra.
- 2013, Health system expenditure on cancer and other neoplasms in Australia, 2008-09, Cancer series no. 81, cat. no. 78, Australian Government, Canberra.
AUSVEG 2016, Vegetable Levy Frequently Asked Questions, http://www.ausveg.com.au/rnd/thelevysystem/vegetablelevy.htm#pays>, accessed March 2016.
Backman DR 2003, Media, festival, farmers/flea markets and grocery store interventions lead to improved fruit and vegetable consumption for Californian Latinos, California Department of Health Services, Public Health Institute.
Begg S, Vos T, Barker B, Stevenson C, Stanley L, Lopez AD 2007, The burden of disease and injury in Australia 2003, PHE 82, Australian Government, Canberra.
Bokhof B, Buyken AE, Dogan C, Karaboga Kaiser J, Sonntag A, et al 2012, ‘Validation of protein and potassium intakes assessed from 24 h recalls against levels estimated from 24 h urine samples in children and adolescents of Turkish descent living in Germany: results from the EVET! Study’, Public Health Nutrition, 15:640-647.
Campbell MK, Tessaro I, Devellis B, Benedict S 2002, ‘Effects of a tailored health promotion program for female blue-collar workers: Health Works for Women’, Preventative Medicine: An International Journal Devoted to Practice and Theory, 34(3):313-323.
Cecchini M, Sassi F, Lauer JA, Lee YY, Guajardo-Barron V, Chisholm D 2010, ‘Tackling of unhealthy diets, physical inactivity and obesity: health effects and cost-effectiveness’, The Lancet, 376: 1775-1784.
Cobiac LJ, Vos T, Veerman JL 2010, ‘Cost-effectiveness of interventions to promote fruit and vegetable consumption’, PLoS ONE, 5(11): e14148.
Cooper AJ, Khaw KT, Sharp SJ, Wareham NJ, Lentjes MAH, Forouhi NG, Luben RN 2012, ‘A prospective study of the association between quantity and variety of fruit and vegetable intake and incident type 2 diabetes’, Diabetes Care, 35:1293-1300.
Coulston AN, Boushey CJ, Ferruzzi MG 2008, Nutrition in the Prevention and Treatment of Disease, 3rd Edition, Academic Press, London.
Daviglus ML, Liu K, Pirzada A, Yan LL, Garside DB, et al 2005, ‘Relationship of fruit and vegetable consumption in middle-aged men to Medicare expenditures in older age: The Chicago Western Electric Study’, Journal of the American Dietetic Association, 105(11):1735-1744.

32 Deloitte Access Economics
Delichatsios HK, Friedman RH, Glanz K et al 2001, ‘Randomized trial of a “talking computer” to improve adult’s eating habits’, American Journal of Health Promotion, 33(2):91-98.
Di Noia J, Contento IR 2009, ‘Use of a Brief Food Frequency Questionnaire for Estimating Daily Number of Servings of Fruits and Vegetables in a Minority Adolescent Population’, Journal of the American Dietary Association, 109(10):1785-1789.
Food and Agriculture Organization of the United Nations Statistics Division 2011, Food Balance Sheets 2011, http://faostat.fao.org, accessed March 2016.
Forouzanfar MH, Alexander L, Anderson HR, Bachman CF, Biryukov S et al 2015, ‘Global, regional, and national comparative risk assessment of 79 behavioural, environmental and occupational, and metabolic risks or clusters of risks in 188 countries, 1990-2013: a systematic analysis for the Global Burden of Disease Study 2013’, The Lancet, 386(10010):2287-2323.
Giskes K, Turrell G, Patterson C, Newman B 2002, ‘Socio-economic differences in fruit and vegetable consumption among Australian adolescents and adults’, Public Health Nutrition, 5(5):663-669.
Haftenberger M, Heuer T, Heidemann C, Kube F, Krems C, Mensink GBM 2010, ‘Relative validation of a food frequency questionnaire for national health and nutrition monitoring’, Nutrition Journal, 9:36.
Hartley L, Igbinedion E, Holmes J, Flowers N, Thorogood M, Clarke A, Stranges S, Hooper L, Rees K 2013, ‘Increased consumption of fruit and vegetables for the primary prevention of CVD’, Cochrane Database of Systematic Reviews, 6:CD009874.
He FJ, Nowson CA, Lucas M, MacGregor GA 2007, ‘Increased consumption of fruit and vegetables is related to a reduced risk of coronary heart disease: meta-analysis of cohort studies’, Journal of Human Hypertension, 21:717-728.
Horticulture Innovation Australia 2016, About us, http://horticulture.com.au/about/, accessed March 2016.
Hu D, Huang J, Wang Y, Zhang D, Qu Y 2014, ‘Fruits and vegetables consumption and risk of stroke: a meta-analysis of prospective cohort studies’, Stroke, 45:1613-1619.
Institute for Health Metrics and Evaluation 2015, GBD Compare, http://vizhub.healthdata.org/gbd-compare, accessed March 2016.
John JH, Ziebland S, Yudkin P et al 2002, ‘Effects of fruit and vegetable consumption on plasma antioxidant concentrations and blood pressure: a randomised controlled trial’, Lancet, 359(9322):1969-1974.
Kristal AR, Goldenhar L, Muldoon J et al 1997, ‘Evaluation of a supermarket intervention to increase consumption of fruits and vegetables’, American Journal of Health Promotion, 11(6):422-425.

33 Deloitte Access Economics
Leenders M, Boshuizen HC, Ferrari P, Siersema PD, Overvad K, et al 2014, ‘Fruit and vegetable intake and cause-specific mortality in the EPIC study’, European Journal of Epidemiology, 29:639-652.
Lim SS, Vos T, Flaxman AD, Danaei G, et al 2012, ‘A comparative risk assessment of burden of disease and injury attributable to 67 risk factors and risk factor clusters in 21 regions, 1990-2010: a systematic analysis for the Global Burden of Disease Study 2010’, The Lancet, 380:2224-2260.
Lock K, Pomerleau J, Causer L, McKee M 2004, ‘Low fruit and vegetable consumption’ in M Ezzati, AD Lopez, A Rodgers, CJL Murray (Eds.), Comparative quantification of health risks, Global and regional burden of disease attributable to selected major risk factors, Volume 1, pp. 597-728, World Health Organization, Geneva.
United Kingdom Department of Health 2002, Five-a-day community pilot initiatives: Key findings, http://webarchive.nationalarchives.gov.uk/20080814090217/dh.gov.uk/en/Policyandguidance/Healthandsocialcaretopics/FiveADay/FiveADaygeneralinformation/DH_4001893, accessed May 2016.
Lutz SF, Ammerman AS, Atwood JR et al 1999, ‘Innovative newsletter interventions improve fruit and vegetable consumption in healthy adults’, Journal of the American Dietetic Association, 99(6):705-709.
Marcus A, Heimendinger J, Wolf P, Rimer BK, Morra M et al 1998, ‘Increasing fruit and vegetable consumption among callers to the CIS: results from a randomised trial’, Preventative Medicine, 27(5):16-28.
Miller M, Pollard C, Hendrie D, Rowley C 2007, The case for enhanced investment in Go for 2&5 in South Australia, Department of Health and Primary Industries and Resources, South Australia.
Montgomery C, Reilly JJ, Jackson DM, Kelly LA, Slater C, Paton JY, et al 2005, ‘Validation of energy intake by 24-hour multiple pass recall: comparison with total energy expenditure in children aged 5-7 years’, British Journal of Nutrition, 93:671-676.
Moshfegh AJ, Rhodes DG, Baer DJ, Murayi T, Clemens JC, Rumpler WV, et al 2008, ‘The US Department of Agriculture Automated Multiple-Pass Method reduces bias in the collection of energy intakes’, American Journal of Clinical Nutrition, 88:324-332.
National Health and Medical Research Council 2013, Australian Dietary Guidelines 2013, Australian Government, Canberra.
Pollard CM 2008, Determinants of fruit and vegetable consumption among adults in Perth, Western Australia, School of Public Health, Curtin University of Technology.
Pomerleau J, Lock K, Knai C, McKee M 2005, Effectiveness of interventions and programmes promoting fruit and vegetable intake, World Health Organization, Geneva.

34 Deloitte Access Economics
Roy Morgan 2015, Fresh trumps frozen for Australia’s veggie-eaters, http://www.roymorgan.com/findings/6566-fresh-trumps-frozen-for-australias-veggie-eaters-201511262308, accessed March 2016.
Schneider M, Norman R, Steyn N, Bradshaw D 2007, ‘Estimating the burden of disease attributable to low fruit and vegetable intake in South Africa in 2000’, South African Medical Journal, 97(8):717-723.
Shu XO, Yang G, Jin F, Liu D, Kushi L, Wen W, Gao YT, Zheng W 2004, ‘Validity and reproducibility of the food frequency questionnaire used in the Shanghai Women’s Health Study’, European Journal of Clinical Nutrition, 58:17-23.
Sorensen G, Stoddard AM, LaMontagne AD et al 2002, ‘A comprehensive worksite cancer prevention intervention: behaviour change results from a randomized controlled trial (United States)’, Cancer Causes Control, 13(6): 493-502
Springmann M, Godfray HCJ, Rayner M, Scarborough P 2016, ‘Analysis and valuation of the health and climate change co-benefits of dietary change’, Proceedings of the National Academy of Sciences of the United States of America, 113(15): 4146-4151.
Stevens VJ 2002, ‘Randomized trial of a brief dietary intervention to decrease consumption of fat and increase consumption of fruit and vegetables’, American Journal of Health Promotion, 16(3):129-134.
Subar AF, Kipnis V, Troiano RP, Midthune D, Schoeller DA, Bingham S, et al 2003, ‘Using intake biomarkers to evaluate the extent of dietary misreporting in a large sample of adults: the OPEN study’, American Journal of Epidemiology, 158: 1-13.
Takashashi Y 2003, ‘A population-based dietary intervention trial in a high-risk area for stomach cancer and stroke: changes in intakes and related biomarkers’, Preventative Medicine, 37(5):432-441.
Traynor MM, Holowaty PH, Reid DJ, Gray-Donald K 2006, ‘Vegetable and fruit food frequency questionnaire serves as a proxy for quantified intake’, Canadian Journal of Public Health, 97(4): 286-290.
Wang X, Ouyang Y, Liu J, Zhu M, Zhao G, Bao W, Hu FB 2014, ‘Fruit and vegetable consumption and mortality from all causes, CVD, and cancer: systematic review and dose-response meta-analysis of prospective cohort studies’, British Medical Journal, 349:g4490.
Wang Y, Li F, Wang Z, Qui T, Shen Y, Wang M 2015, ‘Fruit and vegetable consumption and risk of lung cancer: a dose-response meta-analysis of prospective cohort studies’, Lung Cancer, 88: 124-130.
Zhan J, Liu YJ, Cai LB, Xu FR, Xie T, He QQ 2015, ‘Fruit and vegetable consumption and risk of CVD: a meta-analysis of prospective cohort studies’, Critical Reviews in Food Science and Nutrition, DOI:10.1080/10408398.2015.1008980.

35 Deloitte Access Economics
Zhang X, Shu XO, Xiang YB, Yang G, Li H, Gao J, Cai H, Gao YT, Zheng W 2011, ‘Cruciferous vegetable consumption is associated with a reduced risk of total and CVD mortality’, American Society for Nutrition, DOI: 10.3945/ajcn.110.009340.
36 Deloitte Access Economics
Appendix A: Australia’s vegetable consumption This appendix sets out the detailed approach used to estimate Australian consumption of vegetables, disaggregated by age, gender, type of vegetable, levied and non-levied vegetables, and whether the vegetables are domestically produced or imported. These levels of disaggregation are needed to calculate the impact of higher vegetable consumption on government health expenditure (Appendix B) and producer returns (Appendix C).
A.1 Quantity of vegetables consumed
Results from the National Health Survey (NHS, previously the Australian Health Survey) were used to estimate the quantity of vegetables consumed, disaggregated by age and gender. The ABS conducts the NHS to collect a range of information from Australians about health related issues, including vegetable consumption. As part of the survey, participants are asked to report the number of serves of vegetables usually consumed on a daily basis. The latest NHS was undertaken in 2014-15 (ABS, 2015a).
For each age group, the survey reports the proportion of persons, males and females in each consumption category. The survey used the following ordinal categories to classify the number of serves consumed: does not eat vegetables; less than one serve; one serve; two serves; three serves; four serves; five serves; and six or more serves. At the time of writing, only the ‘first results’ of the 2014-15 NHS were published by the ABS. These first results do not include statistics for Australians under 18 years, or statistics by state and territory. As such, these granular breakdowns were based on the earlier 2011-12 Australian Health Survey (ABS, 2012).
For each age group, the average number of serves per day was calculated by weighting the reported number of serves by the proportion of people consuming that many serves.16 Since 1 serve is defined as 75 grams of vegetables (see Section A.1.1), the average number of serves can be converted into a weight (gram) equivalent. The estimated weight and serves of vegetables consumed, by age group, is presented in Table A.1.
16
For the purposes of weighting, the categories “less than one serve” and “six or more serves” were assigned serve values of 0.5 and 6 respectively.

37 Deloitte Access Economics
Table A.1: Average daily weight and serves of vegetables consumed per person
0-12 13-17 18-24 25-34 35-44 45-54 55-64 65-74 75-84 85+
Weight (grams)
Persons 145.2 168.9 158.9 169.4 176.0 182.8 188.5 200.3 202.3 183.7
Males 144.5 163.2 152.8 156.0 168.3 164.6 174.9 187.4 201.6 198.1
Females 143.9 174.5 158.1 181.4 183.7 200.5 200.6 211.8 199.0 188.1
Number of serves
Persons 1.9 2.3 2.1 2.3 2.3 2.4 2.5 2.7 2.7 2.4
Males 1.9 2.2 2.0 2.1 2.2 2.2 2.3 2.5 2.7 2.6
Females 1.9 2.3 2.1 2.4 2.4 2.7 2.7 2.8 2.7 2.5
Source: Deloitte Access Economics calculations based on ABS (2015a) and ABS (2012). Note: all data used in these calculations had a relative standard error of less than 50%. The majority were less than 25%.
The 2014-15 NHS also reports the proportion of Australians meeting the recommended daily intake of vegetables, as shown in Table A.2. The proportion of persons meeting the recommended intake increases with age, with the exception of the 85+ age group. The 75-84 age group has the highest proportion of people meeting the guidelines. Females ‘outperform’ males in almost every age group, however in the 75-84 age group more males than females have adequate consumption of vegetables.
Table A.2: Proportion of population meeting recommended daily intake of vegetables (%)
18-24 25-34 35-44 45-54 55-64 65-74 75-84 85+
Persons (%) 3.7 6.8 5.9 6.5 7.5 10.9 11.4 6.9
Males (%) 0.9 3.2 2.7 1.7 4.2 6.9 13.6 8.2
Females (%) 6.7 10.5 8.9 11.1 10.4 14.8 9.9 7.7
Source: ABS (2015a). Note: all data used in these calculations had a relative standard error of less than 50%. The majority were less than 25%.
Average vegetable consumption across Australia can be estimated by weighting the data in Table A.1 with Australian population statistics by age group (ABS, 2015b). The results are summarised in Table A.3.
Table A.3: Average vegetable consumption per day (75g per serve)
Serves Grams
Persons 2.3 173.6
Males 2.2 164.3
Females 2.4 181.6
Source: Deloitte Access Economics calculations.

38 Deloitte Access Economics
A.1.1 Australian Dietary Guidelines
This section summarises the Australian Dietary Guidelines for consumption of vegetables.
Table A.4: Recommended serves per day of vegetables
Age group (years)
2-8 9-11 12-18 19-50 51-70 70 years +
Males 2.5 5.0 5.5 6.0 5.5 5.0
Females 2.5 5.0 5.0 5.0 5.0 5.0 Source: NHMRC (2013).
The National Health and Medical Research Council (NHMRC) defines a standard serve of vegetables as approximately 75 grams, or 100-350 kilojoules (NHMRC, 2013). The NHS also follows this definition. Tomatoes and legumes are included as vegetables, while juices are excluded. Examples of a standard serve include:
½ cup cooked green or orange vegetables (for example, broccoli, spinach, carrots or pumpkin;
½ cup cooked dried or canned beans, peas or lentils;
1 cup green leafy or raw salad vegetables;
½ cup sweet corn;
½ medium potato or other starchy vegetables (sweet potato, taro or cassava);or
1 medium tomato.
A.2 Type of vegetables consumed
The NHS does not include data on the types of vegetables consumed by Australians. However, this information is collected in the 2011-12 National Nutrition and Physical Activity Survey (NNPAS) (ABS, 2014), which involves a 24-hour dietary recall of over 12,000 participants at the national level. The results report the average daily intake (by weight) for select food items, including vegetables. Table A.5 below summarises the mean daily food intake (in grams) for the major vegetable food groups. Table A.6 describes the constituent food items making up each major vegetable group.

39 Deloitte Access Economics
Table A.5: Mean daily food consumption of major vegetable food groups
Males
(grams) Females (grams)
Persons (grams)
Persons (% of total)
Potatoes 51.3 38.8 45.0 35.7%
Cabbage, cauliflower & similar brassica vegetables
8.4 9.2 8.8 6.9%
Carrot & similar root vegetables 13.9 14.2 14.1 11.2%
Leaf & stalk vegetables 5.9 6.5 6.2 4.9%
Peas & beans 6.5 5.9 6.2 4.8%
Tomato & tomato products 12.8 12.3 12.6 10.0%
Other fruiting vegetables 16.7 20.0 18.4 14.6%
Other vegetables and vegetable combinations
15.6 14.2 14.9 11.8%
All vegetable products and dishes
131.3 121.1 126.0 100%
Source: Deloitte Access Economics analysis; ABS (2014).
Potatoes account for 35.7% of Australian’s vegetable consumption, with the average person consuming 45.0 grams of potatoes per day. Potatoes are followed by ‘other fruiting vegetables’ (14.6% of vegetables consumed), ‘other vegetables and vegetable combinations’ (11.8%), and carrots and similar root vegetables (11.2%).
Table A.6: Description of constituent components of major vegetable food groups
Major food group Components
Potatoes Potatoes; potato products; potato mixed dishes
Cabbage, cauliflower & similar brassica vegetables
Cabbage and similar brassica vegetables; broccoli, broccolini and cauliflower
Carrot & similar root vegetables Carrots; other root vegetables
Leaf & stalk vegetables Leaf vegetables; stalk vegetables; fresh herbs; seaweeds
Peas & beans Peas and edible-podded peas; beans; sprouts
Tomato & tomato products Tomato; tomato products
Other fruiting vegetables Pumpkin; squash and zucchini; mushrooms; sweetcorn
Other vegetables and vegetable combinations
Other vegetables; onion, leek and garlic; mixtures of two or more vegetables
Source: ABS (2014).
In addition to the vegetables listed in the tables above, the NNPAS also includes a vegetable category titled ‘Dishes where vegetable is the major component’. This category covers sauces, salads, stuffed vegetables and fried vegetable dishes. Since it is not possible to identify individual vegetables within this category, it was excluded from the analysis for the purposes of determining the proportions in which specific vegetable groups contribute to consumption, and the relative proportions of levied and non-levied vegetables.

40 Deloitte Access Economics
It is important to note that the total daily consumption of vegetables reported by the NNPAS in Table A.5 differs from estimates based on the NHS in Table A.3. This is partly due to our exclusion of the ‘Dishes where vegetable is the major component’ category from analysis of the NNPAS. However, the NNPAS and NHS also use different research methodologies.
The NNPAS was based on a 24-hour dietary recall involving approximately 12,000 participants in 2011-12, while the latest NHS was undertaken in 2014-15 and asked around 20,000 respondents to report the number of vegetable serves usually consumed. A brief discussion of methodologies for measuring dietary intake is provided in the following section. For this report, NHS data (which was more recent and had a larger sample) was used to determine overall consumption while the NNPAS was used for determining the relative proportions in which vegetable items are consumed.
A.2.1 Methodological considerations for measuring dietary intake
Of relevance to this report is the availability of two data sets for measuring vegetable consumption among Australians: the NHS 2014-15 (ABS, 2015a) and the NNPAS 2011-12 (ABS, 2014).
The NHS methodology is based on a food frequency questionnaire (FFQ) asking respondents how many serves of vegetables they usually consume in a day. Participants are shown prompt cards explaining definitions of vegetable servings, supported by photographs and examples. In contrast, the NNPAS involves a 24-hour dietary recall collecting detailed information on all foods and beverages consumed on the day prior to the survey, from midnight to midnight. The NNPAS follows the Automated Multiple-Pass Method developed by the Agricultural Research Service of the United States Department of Agriculture. The 2014-15 NHS had a sample of around 20,000 respondents, and the 2011-12 NNPAS collected data from approximately 12,000 respondents.
Notably, the NHS and NNPAS provide different estimates for per-capita vegetable consumption, as discussed in the section above. It is likely that these differences are, to a large extent, influenced by variances in methodologies used to collect data. The accuracy of FFQs and 24-hour recalls has been the subject of many studies around the world, with often mixed results.
A major advantage of 24-hour recalls is that they collect detailed food descriptions through structured, probing questions relating to actual recent consumption (Coulsten et al, 2008). However, a potential limitation is that a single 24-hour recall day may not be sufficient to establish a population’s usual intake. Furthermore, there is often some measurement error in data reported through 24-hour recalls. Two large studies in adults found that 24-hour recalls exhibit underreporting of consumption in the range of 12-23% compared to data from biological markers such as doubly labelled water17 (Moshfegh et al, 2008; Subar et al, 2003). However, other studies have found over-reporting from 24-hour recalls among
17 Doubly labelled water is water in which hydrogen and/or oxygen elements have been partly or completely replaced with uncommon isotopes for tracing purposes. Monitoring these isotopes in the body (for example, by taking regular urine samples) allows researchers to calculate a participant’s metabolic rate and energy expenditure. The participant’s energy expenditure can be compared to reported dietary intake to assess the accuracy of self-reporting.

41 Deloitte Access Economics
certain groups including children and adolescents (Montgomery et al, 2005; Bokhof et al, 2012). It is likely that the degree of over/under reporting is related to a broad range of factors such as gender, cultural background, education, health, literacy, and perceived health status (Coulsten et al, 2008)
In contrast to 24-hour recalls, FFQs have the advantage of obtaining information about individuals’ diets as recalled about an extended period of time, and hence they circumvent recent changes in diet (Coulsten et al, 2008). However, the major weakness of FFQs is the substantial measurement error involved. Many details of dietary intake are not measured by FFQs, and serving sizes of foods are difficult for respondents to evaluate, particularly in relation to highly variable portion sizes across eating occasions.
Overall, studies have found that FFQs usually exhibit underreporting (Coulsten et al, 2008). In one study of 484 German men and women aged 40-69 years, it was found that consumption was underreported by as much as 38% (Subar et al. 2003). However, in relation to perceived ‘healthy’ foods (such as vegetables) some studies have found over-estimation of consumption in FFQs of up to 44% compared to reference methods (Agudo, 2005; Shu et al, 2004; Di Noia et al, 2009). Over-reporting has been associated with peoples’ desire to be perceived as eating healthily.
Comparing FFQs and 24-hour recalls, a Canadian study of 174 participants found that average reported intake of vegetables and fruit was very similar for FFQs and 24-hour recalls, and concluded that FFQs can be used as a proxy for vegetable and fruit consumption (Traynor et al, 2006). Similarly, a study of 161 German adults (aged 18 to 80 years) who participated in the German National Nutrition Monitoring Survey found that FFQs are reasonably valid in the assessment of food consumption, producing results similar to two 24-hour recalls (Haftenberger et al. 2010).
Overall, the studies show sizeable variation in the effectiveness of FFQs and 24-hour recalls, depending on the design of the survey and the targeted population. For the purposes of this report, data from the 2014-15 NHS was used to establish baseline vegetable consumption because it is more recent and had a significantly larger sample size than the NNPAS. However, the NNPAS provides detailed, itemised consumption data across specific types of vegetables, and was used in this report for the purposes of establishing the relative proportions in which different types of vegetables are consumed.
A.3 Levied and non-levied vegetables
The NVL applies to all vegetables produced in Australia with a number of exceptions (AUSVEG, 2016). Table A.7 summarises levy-exempt vegetables, and their contribution to overall consumption as identified in the NNPAS (ABS, 2014). While the major exempt vegetables can be identified in the NNPAS, some vegetable items cannot be individually identified. As summarised in Table A.7, these items are likely to be a relatively insignificant proportion of total consumption.

42 Deloitte Access Economics
Table A.7: Consumption of NVL-exempt vegetables
Average daily intake (grams)18
Share of total (%)
Comment
Asparagus * * Likely insignificant. Mean consumption of all stalk vegetables (including asparagus) is only 0.8g.
Garlic and onion 2.8g 2.2% This includes leek, which is subject to the levy but cannot be excluded.
Herbs (excluding parsley & shallots)
* * Likely insignificant. Mean consumption of all herbs (including parsley) is only 0.1g.
Melons (e.g. bitter and hairy melons)
* *
Likely insignificant. Mean consumption of all “other fruiting vegetables” (including melons, avocado and capsicum) is 7.2g
Mushrooms 1.4g 1.1% -
Potatoes 45.0g 35.7% -
Seed sprouts * * Likely insignificant. Mean consumption of all sprouts (including seed sprouts) is only 0.2g.
Tomatoes 12.6g 10.0% -
Total NVL-exempt 61.8g 49.0% - Source: Deloitte Access Economics estimates; ABS 2014; AUSVEG 2016 * indicates that the vegetable item is not individually identified in NNPAS Note: the 49.0% of vegetables which are subject to the NVL is a measure of consumption. This is different to the 48.0% of NVL vegetables which is measured using the value of production (see Appendix C.1).
Consumption of levied vegetables can be estimated by subtracting the share of consumption attributable to levy-exempt vegetables. Overall, it was estimated that 49.0% of vegetable consumption comprises non-levied vegetables. The remaining 51.0% can be attributed to NVL paying vegetables. Potatoes and tomatoes account for the majority of non-levied vegetables consumed, and approximately 45.7% of total consumption by weight. Applying these proportions to consumption data from the NHS gives an estimate for daily consumption of levied vegetables (Table A.8).
Table A.8: Average consumption of levied vegetables per day (75g per serve)
Serves Grams
Persons 1.2 88.6
Males 1.1 83.8
Females 1.2 92.6
Source: Deloitte Access Economics calculations.
18 Note, this table is based on NNPAS data which were only used to determine the proportions in which particular vegetables are consumed. The overall vegetable consumption statistics used in this report were derived from the more recent NHS (see discussion in Section A.2.1). Accordingly, the weight (in grams) of levied / non-levied vegetables reported by NNPAS will be different from results based on applying the NNPAS proportions to NHS consumption data (as shown in Table A.8).

43 Deloitte Access Economics
A.4 Vegetable imports
Consumption was also apportioned between imported and domestically produced sources, for both levied and non-levied vegetable types. This was done using vegetable import data since consumption statistics by vegetable origin are not available.
Vegetable imports are estimated to be $925.5 million in 2015-16, nearly three times the value of vegetable exports (ABARES, 2015b). The two main vegetable imports identified in ABARES (2015b) are potatoes ($156.9 million) and tomatoes ($144.9 million) which together represent 32.6% of vegetable imports by value.
The share of consumption attributable to imports was estimated as the ratio of the value of vegetable imports to the value of all vegetables available for domestic consumption (gross value of production, plus imports, less exports). Overall, it is estimated that 76.7% of vegetables consumed are produced in Australia, and the remaining 23.3% are imported. These results can be used to estimate the volume of vegetable consumption (by weight and number of serves) attributable to imported sources, including for levied and non-levied types.
While vegetable production outside Australia does not attract the NVL, it was possible to identify imports of vegetable types that would pay the levy were they produced in Australia (‘levied types’). ABARES (2015b) provides import statistics at the individual vegetable level for potatoes and tomatoes, but not for other vegetables. However, potatoes and tomatoes are the two largest non-levied vegetables consumed in Australia. Together, they account for 93.3% of non-levied vegetables consumed, and 45.7% of vegetable consumption overall (see previous section, Appendix A.3).
We hence assumed that potatoes and tomatoes also represent the majority of imported non-levied vegetable types. Using the import values for potatoes and tomatoes, it was estimated that approximately 65.7% of imports (by value) are vegetable types that would pay the levy, and 34.3% are non-levied types. Since imports represent 23.3% of consumption overall, it is estimated that 15.3% (= 65.7% × 23.3%) of total vegetable consumption is attributable to imported levied-types and 8.0% (= 34.3% × 23.3%) to imported non-levied types.
Using these results, it was also possible to calculate consumption of domestically produced levied and non-levied vegetables. This was done by taking the difference between total consumption of levied (non-levied) vegetables and consumption of imported levied (non-levied) vegetable types.
The results are summarised in Table A.9 and, for clarity, illustrated in Figure A.1.

44 Deloitte Access Economics
Table A.9: Average daily consumption of imported and Australian produced vegetables
Australian Produced Imported
Total Levied Non-levied Total Levied types
Non-levied types
Serves per person 1.8 0.8 1.0 0.5 0.4 0.2
Grams per person 133.2 61.9 71.3 40.5 26.6 13.9
% of total 76.7% 35.6% 41.1% 23.3% 15.3% 8.0% Source: Deloitte Access Economics calculations.
Figure A.1: Vegetable consumption by levy paying status and origin
Source: Deloitte Access Economics estimates.
15.3% 8.0% 35.6% 41.1%
Domestically produced(76.7%)
Imports(23.3%)
Non-leviedtypes
Leviedtypes Non-leviedLevied

45 Deloitte Access Economics
Appendix B: The impact of higher vegetable consumption on health outcomes and government health expenditure There is a well-established link between increased intake of vegetables, and reduced health expenditure as a result of improved health outcomes (Daviglus et al, 2005; Cecchini et al, 2010; Cobiac et al, 2010; Schneider et al, 2007). The modelling undertaken for this project adopted the concepts of burden of disease, DALYs, and attributable fractions that have been used in similar studies. This was combined with health expenditure data from the AIHW (2013, 2014), and used a variety of data from the ABS, and the academic literature.
The following sections outline the approach taken to model the impact of higher vegetable consumption on government health expenditure in Australia. Briefly, there were four primary steps taken to model the impact of higher vegetable consumption on health expenditure:
Step 1: determine the set of conditions that may be affected by higher vegetable consumption and obtain health system expenditure for these conditions.
Step 2: for each condition, the ratio of the disease burden that is attributable to low consumption of vegetables relative to the total disease burden for the condition (the “attributable fraction”) is applied to the total health expenditure for that condition to determine the health expenditure that was attributable to low vegetable consumption.
Step 3: results from the academic literature were then used to determine the marginal benefits of higher vegetable consumption. This was calculated as a reduction in the risk of a condition.
Step 4: the marginal reduction in risk of a condition following from higher consumption was considered to represent the reduction in attributable health expenditure that may be avoided by the higher consumption. The final step applies the marginal reduction in risk against attributable health expenditure to calculate the reduction in health expenditure that would have occurred as a result of increased consumption of vegetables.
These steps are outlined in more detail in the following sections.
B.1 Set of conditions
To determine the burden attributable to low consumption of vegetables and any associated health expenditure, it was first necessary to identify the pathways and conditions that may be the result of low consumption. This section presents a summary of literature identifying the quantified risk of various conditions. The information presented below describes the study and the condition assessed. All of the studies considered were comprehensive meta-analyses of previously published research, where previous research is generally from

46 Deloitte Access Economics
prospective cohort studies. Summarised results from the studies are presented in Table B.1.
Hu et al (2014) assessed the association between the consumption of fruit and vegetable and the risk of stroke. The study included 20 prospective cohort studies, covering more than 760,000 participants. When comparing the highest and lowest levels of vegetable consumption, the relative risk19 of stroke was 0.86 when adjusting for confounding factors. The study observed an inverse association with increasing consumption of fruit and vegetables. Hu et al (2014) also attempted to observe any relationships between the consumption of fruit and vegetables and fruit alone or vegetables alone. Hu et al (2014) notes that some results are inconsistent and still need to be confirmed, including whether it is combined fruit and vegetable consumption that reduces the risk of stroke or whether it is fruit consumption alone or vegetable consumption alone.
He et al (2007) analysed the consumption of fruit and vegetables and the risk of coronary heart disease. The study included 12 previously conducted studies with 13 cohorts, covering more than 278,000 individuals with a median follow-up of 11 years. The relative risk of coronary heart disease was 0.84 when comparing less than 3 serves of vegetables each day and more than 5 serves of vegetables each day. This study was used in the 2010 Global Burden of Disease Study (Lim et al, 2012).
Wang et al (2014) examined any potential dose-response relationships between consumption of fruit and vegetables and mortality from all causes, CVD, and cancer. The study included prospective cohort studies that reported risk estimates for these outcomes by level of fruit and vegetable consumption, including 16 previously published studies. Wang et al (2014) found that higher consumption of fruit and vegetables was significantly associated with a lower risk of all-cause mortality. For one additional serving of vegetables each day, the relative risk of all-cause mortality was 0.95 – a significant reduction. Wang et al (2014) further identified that there was a significant inverse association for cardiovascular mortality, but there was not a significant inverse association for cancer mortality.
Wang et al (2015) conducted a similar meta-analysis to Wang et al (2014), and looked at any potential dose-response relationships between the consumption of fruit and vegetables and the risk of lung cancer. When comparing high and low consumption of vegetables, the relative risk was 0.87 for the high consumption group for incidence outcomes and 0.94 for mortality outcomes. The results for vegetable relative risk were significant and were derived using more than 16,000 incident cases of lung cancer with more than 1.8 million participants. Wang et al (2015) identified a threshold effect of consumption, with consumption above 2 servings each day for vegetables having relatively smaller benefits than increasing to 2 servings each day. The results did not differ substantially when changing the number of confounding factors that were adjusted for.
Zhan et al (2015) conducted a meta-analysis of prospective cohort studies to examine the relationship between the consumption of fruit and vegetables and the risk of CVD. When
19 The relative risk is a measure of how much more likely certain outcomes are to occur in the given population relative to a reference group. In this study, the relative risk indicates how much more likely it is that incidence or mortality outcomes will occur in those with consumption relative to those with recommended, or high, consumption of vegetables.

47 Deloitte Access Economics
comparing high and low vegetable consumption groups, Zhan et al (2015) identified that there was a significant inverse association between increasing consumption of vegetables and the risk of all types of CVD considered including stroke, ischaemic heart disease, CVD and coronary heart disease. The results were stratified by type of CVD, which are reported in Table B.1.
Aune et al (2011) conducted a meta-analysis of previous literature assessing the association between the consumption of fruit and vegetables and the risk of colorectal cancer. The study included 19 prospective studies that reported relative risk estimates for varying levels of fruit and vegetable consumption and the associated risk with colorectal cancer. The relative risk for colorectal cancer was 0.91 when comparing the highest and lowest vegetable consumption levels. Aune et al (2011) conclude that there is a weak but statistically significant non-linear inverse association between vegetable intake and the risk of colorectal cancer.
Table B.1: Significant associations between consumption of vegetables and risk of selected conditions for high and low consumption of vegetables
Condition Relative risk Risk reduction Source
Stroke incidence/ mortality 0.86 0.14 Hu et al (2014)
Lung cancer incidence 0.87 0.13 Wang et al (2015)
All-cause mortality 0.95 0.05 Wang et al (2014)
CVD mortality 0.96 0.04 Wang et al (2014)
Colorectal cancer incidence 0.91 0.09 Aune et al (2011)
All cardiovascular incidence/ mortality
0.87 0.13 Zhan et al (2015)
CVD incidence/ mortality 0.82 0.18 Zhan et al (2015)
CHD incidence/ mortality 0.91 0.09 Zhan et al (2015)
IHD incidence/ mortality 0.85 0.15 Zhan et al (2015)
Stroke incidence/ mortality 0.87 0.13 Zhan et al (2015) Source: As noted in table. Note: CHD = coronary heart disease; IHD = ischaemic heart disease.
Overall, the academic literature as summarised in Table B.1 suggests that the risk of CVD, and also cancer to a smaller extent, are reduced by higher levels of vegetable consumption.
B.2 Attributable fractions for the burden of disease due to low vegetable consumption
A number of studies have attempted to quantify the burden of disease attributable to a variety of risk factors. The term “burden of disease” refers to the loss of wellbeing experienced by people who suffer from ill health. The burden of disease is measured using disability adjusted life years (DALYs). DALYs are a measure of life and health on a scale of 0 to 1, where 0 represents a year of perfect health and 1 represents death. DALYs are a

48 Deloitte Access Economics
combined measure of years of life lost due to premature mortality and years of life lost due to disability.
In Australia, two of the highest profile studies are from the AIHW. The most recent study assessed the burden of disease attributable to low vegetable consumption for the year 2011 (AIHW, 2016), while the previous study assessed the burden of disease attributable to low fruit and vegetable consumption for the year 2003 (Begg et al, 2007). The 2007 study did not separately identify the burden of disease attributable to low vegetable consumption, while the 2016 study did. As the results from the 2016 study are more up to date and relate to vegetable consumption alone, these were adopted to measure the burden of disease attributable to low vegetable consumption, while the analysis from the 2007 study was used to triangulate these results.
B.2.1 Burden of disease attributable to low vegetable consumption
In 2016, the AIHW published an assessment of the total burden of disease in Australia for the year 2011 (AIHW, 2016). The AIHW’s 2016 publication included an estimation of the “attributable fraction” of low vegetable consumption on the number of DALYs experienced by Australians. The attributable fraction refers to the proportion of the burden of disease in Australia that can be attributed to low vegetable consumption.
By taking the DALYs attributable to low vegetable consumption, and dividing it by the total DALYs for each cause – cancer and CVD – it was possible to derive attributable fractions by age and gender for each cause.20 The AIHW publication identifies low vegetable consumption as a risk factor for mouth and pharyngeal cancer, laryngeal cancer, ischaemic heart disease and stroke. A similar set of conditions are included in both the World Health Organization’s (Lock et al, 2004) and the Global Burden of Disease (Forouzanfar et al, 2015) analysis of the burden due to low vegetable consumption, although there is variation between studies.21
Table B.2 shows the DALYs by age and gender attributable to low consumption of vegetables for the broad causes cancer (the two groups of cancers identified in the AIHW analysis) and CVD (ischaemic heart disease and stroke). These DALYs are the total DALYs attributable to low consumption of vegetables. The table also shows the total DALYs for these broad groups (all conditions in group). This allows for calculation of an attributable fraction by age and gender for cancer and CVDs – which was applied to health expenditure in 2015-16 for these groups. The DALYs attributable to low consumption of vegetables, overall DALYs for the cause groups and the attributable fractions are shown in Table B.2.
20 At the time of writing this report, insufficient detail was provided in the AIHW’s publication to calculate attributable fractions for individual age groups. Consequently, the total DALYs attributable to low vegetable consumption were taken from AIHW (2016) for males and females, and Begg et al (2007) – the previous burden of disease study in Australia – was used to apply an age distribution to the overall gender totals.
21 At the time of writing this report, there was insufficient detail provided by AIHW (2016) to assess the pathways between low vegetable consumption and reduced health outcomes for each condition. Earlier work by Begg et al (2007) suggested that low vegetable consumption may lead to increased risk of lung cancer and oesophageal cancer. This was also supported by the literature (see appendix B.1). To match official estimates, and since the results still triangulate well with the results from Begg et al (2007) – see appendix B.2.2 –colorectal cancer and lung cancer were not added to the analysis of the overall burden.

49 Deloitte Access Economics
Table B.2: DALYs attributable to low vegetable consumption, 2011
Gender/ Age
Attributable DALYs
Total DALYs Attributable fraction (%)
Cancer CVD Cancer CVD Cancer CVD
Male
0-24 7 107 9,498 6,963 0.1 1.5
25-34 23 648 8,384 7,844 0.3 8.3
35-44 192 2,791 22,379 20,940 0.9 13.3
45-54 524 5,993 57,911 46,464 0.9 12.9
55-64 1,100 8,731 116,103 69,698 0.9 12.5
65-74 1,077 8,368 137,184 92,058 0.8 9.1
75+ 575 8,700 118,650 144,339 0.5 6.0
Total 3,498 35,338 470,110 388,306 0.7 9.1
Female
0-24 3 43 5,694 3,591 0.1 1.2
25-34 15 508 9,317 4,896 0.2 10.4
35-44 77 880 28,646 8,045 0.3 10.9
45-54 166 2,248 59,913 17,312 0.3 13.0
55-64 272 3,168 83,538 25,251 0.3 12.5
65-74 277 4,827 82,591 47,037 0.3 10.3
75+ 223 11,207 93,441 162,766 0.2 6.9
Total 1,033 22,882 363,140 268,898 0.3 8.5
Overall 4,531 58,220 833,250 657,204 0.5 8.9 Source: Deloitte Access Economics calculations based on AIHW (2016) and Begg et al (2007). Note: numbers may not add due to rounding.
The estimates presented in Table B.2 show the amount of DALYs experienced for each condition due to low consumption of vegetables, which is then presented as a proportion of all DALYs experienced for those conditions. The burden of disease experienced due to low consumption of vegetables was used as an estimate of the health expenditure incurred as a result of low consumption of vegetables. This is discussed further in appendix B.2.3.
B.2.2 Triangulation of the burden of disease attributable to low vegetable consumption
The estimated attributable fractions (0.5% for cancer, and 8.9% for CVD) from Appendix B.2.1 are a critical component of the economic modelling that was undertaken. As such, findings from the academic literature and the AIHW’s previous burden of disease publication were used to triangulate these estimates.
In 2007, the AIHW published an assessment of the total burden of disease in Australia for the year 2003 (Begg et al, 2007). As with the more recent study (AIHW, 2016), this publication included an estimation of the attributable fraction of low fruit and vegetable consumption on the number of DALYs experience by Australians. However, the 2007 publication combined fruit and vegetables into a single category, rather than reporting them separately. The 2007 publication also included a broader range of cancers – including

50 Deloitte Access Economics
oesophageal cancer, stomach cancer, colorectal cancer and lung cancer – but the same set of CVD conditions including ischaemic heart disease and stroke.
For the 2007 publication, it was not clear if all of these conditions related to vegetable consumption alone, or if only a subset would occur when consideration of fruit consumption was removed. As such, before the attributable fractions were calculated, an adjustment was made to the DALYs attributable to low fruit and vegetable consumption to ensure that these were due to vegetable consumption alone. This adjustment implies that the analysis held fruit consumption constant, and adjusts vegetable consumption alone. To adjust the attributable fraction from fruit and vegetable consumption, the relative risks of vegetables, and fruit and vegetables combined were taken from the academic literature. The absolute risk reduction was then calculated for both separately, and the adjustment was calculated as the vegetable risk reduction relative to the combined fruit and vegetable risk reduction.
The sources and final adjustment are shown in Table B.3. The adjustment rate was 86% - meaning that if fruit consumption was held constant, approximately 86% of the burden attributable to low fruit and vegetable consumption may have been avoided if all people in Australia ate the recommended amount of vegetables. It is worth noting that fruit and vegetables crowd each other out (Lock et al, 2004) – meaning that if people in Australia had of increased their fruit consumption but not their vegetable consumption they could still expect a similar reduction in their relative risk, and vice versa.

51 Deloitte Access Economics
Table B.3: Vegetable risk reduction relative to fruit and vegetables combined
Condition and outcome
Relative risk Risk reduction Relative to F+V
Source
F+V V F+V V
Stroke – incidence/ mortality
0.79 0.86 0.21 0.14 67% Hu et al (2014)
Lung cancer – incidence 0.87 0.87 0.13 0.13 100% Wang et al (2015)
CVD – mortality 0.95 0.95 0.05 0.05 100% Wang et al (2014)
Colorectal cancer - incidence
0.92 0.91 0.08 0.09 113% Aune et al (2011)
All cardiovascular – mortality/ incidence
0.83 0.87 0.17 0.13 76% Zhan et al (2015)
CVD – mortality/ incidence
0.83 0.82 0.17 0.18 106% Zhan et al (2015)
CHD – mortality/ incidence
0.81 0.91 0.19 0.09 47% Zhan et al (2015)
IHD – mortality/ incidence
0.88 0.85 0.12 0.15 125% Zhan et al (2015)
Stroke – mortality/ incidence
0.82 0.87 0.18 0.13 72% Zhan et al (2015)
Average - - - - 86% Source: As noted in table. Note: while it is possible for vegetables to have a risk reduction greater than fruit and vegetables combined, this implies that incorporating fruit has a negative overall effect. This is unlikely to be the case, so the average across all conditions is applied, as academic literature typically shows that fruit can have a greater risk reduction then vegetables. CHD = coronary heart disease; IHD = ischaemic heart disease; F = fruit; V = vegetable.
It would also be possible to use a multiplicative approach rather than a relative approach to separate out the overall burden due to vegetable consumption alone, however this was considered inappropriate in this instance as it was unlikely Begg et al (2007) took this approach.22
22 A multiplicative approach was considered to be inappropriate in this instance. The reason for not undertaking a multiplicative approach is that Lock et al (2004) – and subsequently, Begg et al (2007) – do not consider fruit and vegetable consumption separately when analysing the burden due to these factors. Rather, it is recognised that consumption of either fruit or vegetables alone has a similar effect and there is uncertainty surrounding the definition of each based on culture in various countries (Lock et al, 2004). Further, Lock et al (2004) define them together for reasons of complexity in determining which fruit and vegetable confers a protective effect and suggests that it would be likely that fruit and vegetable consumption would confound each other, so that relative risk for vegetable consumption alone would reflect that of someone eating vegetables and fruit together. As such, the 86% adjustment reported above is considered representative of the effect that vegetables would confer in the presence of both fruit and vegetables.
Both the AIHW and WHO use a multiplicative approach for the combined effect of multiple risk factors. If fruit and vegetable consumption were considered separately in their analyses, this means that the combined attributable fraction for fruit and vegetables can be defined as follows:
𝐴𝐹𝑉,𝐹 = 1− (1 − 𝐴𝐹𝑉). (1 − 𝐴𝐹𝐹)
Where, AF = attributable fractions, V = vegetables, F = fruit, V,F = vegetables and fruits combined.

52 Deloitte Access Economics
Adjusting the burden attributable to low consumption of fruit and vegetables by the 86% reported above in every age and gender group, it was estimated that 1.7% of cancer DALYs and 8.3% of CVD DALYs were attributable to low vegetable consumption. This compares reasonably well with the results from the 2016 study, which found that 0.5% of all cancer DALYs and 8.9% of CVD DALYs were attributable to low vegetable consumption. It is possible that the slight discrepancies result from adjusting both results by 86%, rather than applying an average relative risk for vegetable consumption that is representative of CVD and cancer separately.
As the results are comparable across years, despite small differences in methodology, the 2016 study was considered to be representative of the burden of disease attributable to low vegetable consumption. As such, AIHW (2016) was used to estimate the health expenditure attributable to low vegetable consumption.
B.2.3 Health expenditure attributable to low vegetable consumption
Health expenditure was obtained for CVDs and cancer from the AIHW (2013; 2014). The latest available data for these conditions were for the year 2008-09. These data were inflated to 2015-16 using population growth by age and gender and health inflation over this period and includes an adjustment for the unallocated component of expenditure.23 For health inflation, the latest year available was for 2013-14 (AIHW, 2015), so average historical growth from the preceding 10 years was applied thereafter. Population growth forecasts were obtained from the ABS using historical information to 2014-15 (ABS, 2015b). The estimated expenditure on CVD and cancer is reported in Table B.4.
And similarly, the attributable fraction relating to vegetables can be described as
𝐴𝐹𝑉 = 1−1 − 𝐴𝐹𝑉,𝐹(1 − 𝐴𝐹𝐹)
23 For the 2008-09 expenditure series, the AIHW was only able to allocate approximately 70% of all health system expenditure to specific conditions. The adjustment factors up for the other 30%, which would not occur in the absence of all conditions. Thus, health conditions are assumed to share this remaining 30%.
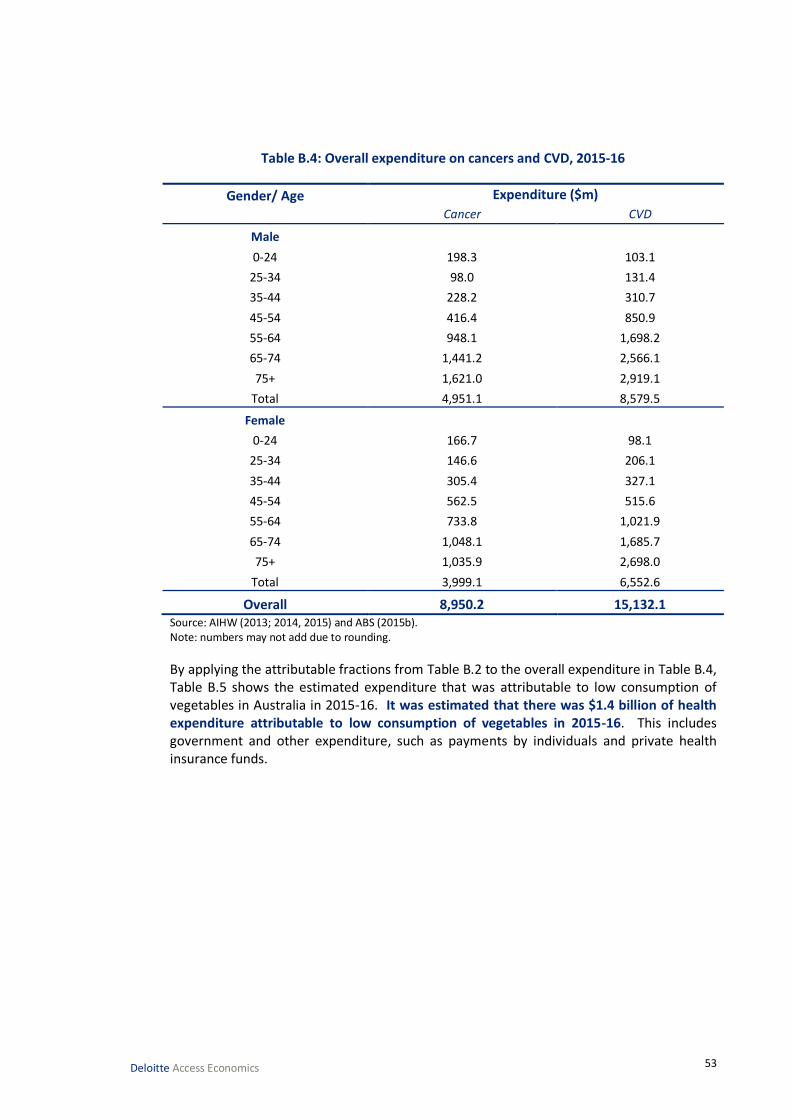
53 Deloitte Access Economics
Table B.4: Overall expenditure on cancers and CVD, 2015-16
Gender/ Age Expenditure ($m)
Cancer CVD
Male
0-24 198.3 103.1
25-34 98.0 131.4
35-44 228.2 310.7
45-54 416.4 850.9
55-64 948.1 1,698.2
65-74 1,441.2 2,566.1
75+ 1,621.0 2,919.1
Total 4,951.1 8,579.5
Female
0-24 166.7 98.1
25-34 146.6 206.1
35-44 305.4 327.1
45-54 562.5 515.6
55-64 733.8 1,021.9
65-74 1,048.1 1,685.7
75+ 1,035.9 2,698.0
Total 3,999.1 6,552.6
Overall 8,950.2 15,132.1 Source: AIHW (2013; 2014, 2015) and ABS (2015b). Note: numbers may not add due to rounding.
By applying the attributable fractions from Table B.2 to the overall expenditure in Table B.4, Table B.5 shows the estimated expenditure that was attributable to low consumption of vegetables in Australia in 2015-16. It was estimated that there was $1.4 billion of health expenditure attributable to low consumption of vegetables in 2015-16. This includes government and other expenditure, such as payments by individuals and private health insurance funds.

54 Deloitte Access Economics
Table B.5: Expenditure on cancers and CVD attributable to low consumption of vegetables, 2015-16
Gender/ Age Cancer ($m) CVD ($m) Total ($m)
Male
0-24 0.1 1.6 1.7
25-34 0.3 10.9 11.1
35-44 2.0 41.4 43.4
45-54 3.8 109.8 113.5
55-64 9.0 212.7 221.7
65-74 11.3 233.2 244.6
75+ 7.9 175.9 183.8
Total 34.3 785.5 819.8
Female
0-24 0.1 1.2 1.2
25-34 0.2 21.4 21.6
35-44 0.8 35.8 36.6
45-54 1.6 67.0 68.5
55-64 2.4 128.2 130.6
65-74 3.5 173.0 176.5
75+ 2.5 185.8 188.2
Total 11.1 612.3 623.4
Overall 45.4 1,397.8 1,443.2 Source: Deloitte Access Economics calculations. Note: numbers may not add due to rounding.
This presents the baseline estimate – if all people in Australia consumed enough vegetables in 2015-16, it was estimated all $1.4 billion of health expenditure could have been avoided.24
However, it is unlikely that a change of this magnitude would ever occur, and instead it is likely that there would be a small change in consumption, which would cause a small change down the relative risk curve. The discussion of the relative risk curve is presented in Appendix B.3.
To estimate the proportion of health expenditure that was incurred by the Federal and state/territory governments, the ratios of total health expenditure that apply for Federal (41.2%) and state/territory (26.6%) levels of government were applied (AIHW, 2015). Thus, the total government expenditure attributable to low consumption was estimated to be $978.5 million. The reason for this adjustment is that the scope of the modelling was to consider the reduction in government health expenditure only – identifying the share for both state/territory government and federal government.
24 Total health expenditure for 2015-16 is estimated to be approximately $168.9 billion, after allowing for population growth and inflation. Thus, health expenditure as a result of low vegetable consumption is approximately 0.9% of total health expenditure.

55 Deloitte Access Economics
B.3 Marginal risk change associated with changing vegetable consumption
The third major step in the modelling was to determine how risk changes for a marginal increase in vegetable consumption. Academic literature was used to derive the marginal benefits of increased consumption, and to specifically identify how the risk of cancers or CVD would change with an increase in grams of vegetables consumed.
A number of large meta-analyses have been conducted, which generally show decreasing returns approaching the minimum risk profile (Wang et al, 2014; Zhang et al, 2011; Zhan et al, 2015; Aune et al, 2011). The results of the identified literature are summarised in Table B.6. Where the literature identified consumption for a particular type of cancer or CVD, this was grouped into the broad causes to match the level of detail for expenditure as in Appendix B.2. The original cause and broad cause group are both shown.
Table B.6: Relative risk of conditions associated with varying consumption of vegetables
Condition Unit Consumption level and risk Source
All cause
CVD, cancer Grams 77 154 231 308 385 462 Wang et al (2014)
Risk 1.00 0.90 0.85 0.83 0.83 0.82 Wang et al (2014)
CVD, cancer Grams
134 214 284 372 545 Zhang et al (2011)
Risk
1.00 0.88 0.88 0.76 0.84 Zhang et al (2011)
Cancer
Lung Grams 80 160 240 320 400 480 Wang et al (2015)
Risk 1.00 0.98 0.98 0.97 0.97 0.97 Wang et al (2015)
All cause Grams
134 214 284 372 545 Zhang et al (2011)
Risk
1.00 0.94 1.03 0.92 1.05 Zhang et al (2011)
Colorectal Grams 100 200 300 400 500
Aune et al (2011)
Risk 1.00 0.99 0.99 0.99 1.00
Aune et al (2011)
All cause Grams 91 152 216 339
Leenders et al (2014)
Risk 1.00 0.96 0.95 0.94
Leenders et al (2014)
CVD
All cause Grams 100 200 300 400 500 600 Zhan et al (2015)
Risk 1.00 0.99 0.96 0.91 0.84 0.78 Zhan et al (2015)
All cause Grams
134 214 284 372 545 Zhang et al (2011)
Risk
1.00 0.89 0.78 0.63 0.74 Zhang et al (2011)
CHD Grams 65 181 308
He et al (2007)
Risk 1.00 0.92 0.84
He et al (2007)
All cause Grams 91 152 216 339
Leenders et al (2014)
Risk 1.00 0.90 0.82 0.78
Leenders et al (2014)
Source: As noted in table. Note: CHD = coronary heart disease.

56 Deloitte Access Economics
The results of the literature are summarised in Chart B.1 and Chart B.2 for cancer and CVD, respectively. Where studies only provided enough information to identify the marginal changes associated with all-cause mortality, this was applied to both cancers and CVD. That is, the study by Wang et al (2014) was included in the analysis for both cancer and CVD.
Chart B.1: Relative risk of cancer associated with varying vegetable consumption levels, relative to low consumption
Source: As noted in chart.
Chart B.2: Relative risk of CVD associated with varying vegetable consumption levels, relative to low consumption
Source: As noted in chart.
0.0
0.2
0.4
0.6
0.8
1.0
1.2
0 100 200 300 400 500 600
Re
lati
ve r
isk
Consumption of vegetables (grams)
Zhang et al (2011) Wang et al (2015) Aune et al (2011)
Leenders et al (2014) Wang et al (2014)
0.0
0.2
0.4
0.6
0.8
1.0
1.2
0 100 200 300 400 500 600 700
Re
lati
ve r
isk
Consumption of vegetables (grams)
Zhang et al (2011) Zhan et al (2015) Leenders et al (2014)
He et al (2007) Wang et al (2014)

57 Deloitte Access Economics
As the work by the AIHW (2016) considers the attributable fractions relative to a minimum risk profile the literature was rebased to be relative to the approximate vegetable minimum risk profile. The minimum risk profile in this study is defined as five serves to align with current recommendations (NHMRC, 2013).25 The minimum risk profile does not imply that there is no risk that people will develop cancer or CVD – what it implies is that none of these incident cases will be as a result of low vegetable consumption. Thus, at the minimum risk profile the risk of developing cancer or CVD due to low consumption of vegetables is 1. This is shown in Chart B.3 and Chart B.4.
To determine the marginal benefits of increased vegetable consumption for each condition, a curve was then fitted to the data points. It was hypothesised that either a linear or second order polynomial would provide the best fit across these data for both cancer and CVD outcomes.
Chart B.3: Relative risk of cancer associated with varying vegetable consumption levels, relative to minimum risk profile
Source: Zhang et al (2011), Wang et al (2015), Aune et al (2011), Leenders et al (2014), and Wang et al (2014). Note: since there is an outlier as an endpoint, analysis was also undertaken using a linear trend line after removing this outlier. The linear trend line indicated that there would be a minor change in the risk of cancer; however, this was not considered to result in a material difference to the overall results.
25 It is noted that the recommendations differ by age and gender groups; however, the weighted recommendation is for 5 serves across the population. Consequently, applying the assumption that the risk of a condition is 1 at the recommended servings would largely be independent of the age and gender group.
Second order polynomialy = 1E-06x2 - 0.001x + 1.1598
R² = 0.3077
Lineary = -0.0002x + 1.0826
R² = 0.2712
0
0.2
0.4
0.6
0.8
1
1.2
1.4
0 100 200 300 400 500 600
Cancer risk Second order polynomial Linear

58 Deloitte Access Economics
Chart B.4: Relative risk of CVD associated with varying vegetable consumption levels, relative to minimum risk profile
Source: Zhang et al (2011), Zhan et al (2015), Leenders et al (2014), He et al (2007), and Wang et al (2014).
The fitted curves serve to define the relative risk curve, which was applied to changes in consumption to determine the relative risk reduction from higher vegetable consumption for each set of conditions. The best fitting curve, which also followed observed trends in the academic literature – i.e. a decreasing risk reduction approaching the minimum risk profile (Wang et al, 2014; Wang et al, 2015) – was the second order polynomial. This curve had the highest R2 and the smallest root mean square error.26 This was the same across both cancer and CVD, and as such the second order polynomial was used to model the relative risk of a condition at any given level of consumption.
Chart B.5 and Chart B.6 show the same relative risk curves, but with the original sources removed, and the scale adjusted so that consumption does not exceed 375 grams, as the relative risk of these conditions at 375 grams is 1 by definition. This is based on the minimum risk assumptions made by the AIHW (2016), Begg et al (2007) and Lock et al (2004).
26 R2 is a measure of the variation explained by the curve. A curve fits the data better when this is closer to the maximum of 1. Root mean square error is a measure used to determine the accuracy of predicted values against observed values – a smaller number means that the predicted values are closer to the observed values, and thus performs better.
Second order polynomialy = 8E-07x2 - 0.0011x + 1.3317
R² = 0.3526
0
0.2
0.4
0.6
0.8
1
1.2
1.4
1.6
1.8
0 100 200 300 400 500 600 700
CVD risk Second order polynomial

59 Deloitte Access Economics
Chart B.5: Relative risk of cancer curve associated with varying vegetable consumption levels
Source: Deloitte Access Economics calculations.
Chart B.6: Relative risk of CVD curve associated with varying vegetable consumption levels
Source: Deloitte Access Economics calculations.
These curves were used to determine the marginal change in risk relative to the total change in risk possible, which provides an estimate of the burden that is avoided through higher consumption. These curves were applied across all age and gender groups as there was insufficient detail in the literature to determine relative risk curves for each age and gender group. It is noted that this may overestimate the risk reduction in older age groups (for example, see Cobiac et al, 2012 or Lock et al, 2004); however, there are a number of caveats that mean any risk reduction is likely to be conservative. This is discussed further in Appendix B.5.
0.0
0.2
0.4
0.6
0.8
1.0
1.2
0 50 100 150 200 250 300 350
Re
lati
ve r
isk
Consumption of vegetables (grams)
Cancer relative risk curve
0.0
0.2
0.4
0.6
0.8
1.0
1.2
1.4
0 50 100 150 200 250 300 350
Re
lati
ve r
isk
Consumption of vegetables (grams)
CVD relative risk curve

60 Deloitte Access Economics
B.4 Calculating the change in health expenditure
The last step in the modelling was to determine the baseline vegetable consumption and associated relative risks of each condition by age and gender groups.
The vegetable consumption profiles were taken from the latest NHS (ABS, 2015a). The baseline levels of consumption for each age and gender group, which were used in the health expenditure analysis, are shown in Table B.7, along with the associated risks of cancer and CVD.
As an example of how the risk curves were applied, consider that the relative risk of baseline consumption is 1.5 and the relative risk at the recommended daily intake of vegetables is 1. Taking an arbitrary increase in consumption of 10% may result in a relative risk reduction of 0.01 percentage points. For this increase in consumption, the total burden
of disease attributable to low vegetable consumption would be reduced by 0.01
1.5−1, or 2%
overall. As the overall burden is reduced by 2%, it is also assumed that health expenditure is reduced by 2%. Table B.7 presents the baseline risk level which was used to determine the risk reduction based on the relative risk curves discussed in Appendix B.3.
Table B.7: Baseline consumption of vegetables and associated risk of cancer and CVD
Gender/ Age Consumption (g) Risk of cancer Risk of CVD
Male
0-24 151 1.049 1.186
25-34 156 1.046 1.181
35-44 168 1.040 1.171
45-54 165 1.042 1.174
55-64 175 1.037 1.165
65-74 187 1.031 1.155
75+ 201 1.026 1.145
Total 164 1.042 1.174
Female
0-24 154 1.047 1.183
25-34 181 1.034 1.160
35-44 184 1.033 1.158
45-54 201 1.026 1.145
55-64 201 1.026 1.145
65-74 212 1.022 1.136
75+ 195 1.028 1.149
Total 182 1.034 1.160
Source: ABS (2015a) and Deloitte Access Economics calculations.
The following sections present the detailed results and assumptions for the three modelled scenarios, including:
average vegetable consumption across the population was 10% higher;

61 Deloitte Access Economics
average consumption of vegetables by males was equal to that of females (or no less); and
if all people in Australia ate the recommended 5 servings of vegetables each day.
B.4.1 Scenario 1 – consumption of vegetables was 10% higher
In this scenario, the baseline level of vegetable consumption was increased by 10% for all age and gender groups. The level of consumption in this scenario is presented in Table B.8, along with the relative risk of cancer and CVD, and the change in risk. This is shown graphically in Chart B.7 and Chart B.8 for the overall person values – noting that the final results are taken as the sum of the individual age and gender groups.
Base consumption of 174 grams increased 10% to 190 grams would result in a reduction in cancer risk from 1.037 to 1.030 (Chart B.7), and a reduction in CVD risk from 1.166 to 1.153 (Chart B.8).

62 Deloitte Access Economics
Table B.8: Consumption of vegetables and associated risk of cancer and CVD – scenario 1
Gender/ Age Scenario consumption (g)
Risk of cancer Risk of CVD Change in cancer risk
Change in CVD risk
Cancer change relative to max.
change (%)
CVD change relative to max.
change (%)
Male
0-24 166 1.041 1.173 0.008 0.013 15.4 6.8
25-34 172 1.038 1.168 0.008 0.013 16.4 7.2
35-44 185 1.032 1.157 0.007 0.014 18.8 8.1
45-54 181 1.034 1.160 0.008 0.014 18.1 7.8
55-64 192 1.029 1.151 0.007 0.014 20.2 8.5
65-74 206 1.024 1.140 0.007 0.015 23.1 9.5
75+ 221 1.019 1.129 0.007 0.015 26.6 10.6
Total 181 1.034 1.160 0.008 0.014 18.0 7.8
Female
0-24 169 1.039 1.170 0.008 0.013 16.0 7.1
25-34 199 1.027 1.145 0.007 0.014 21.6 9.0
35-44 202 1.026 1.143 0.007 0.015 22.2 9.2
45-54 221 1.019 1.129 0.007 0.015 26.5 10.6
55-64 221 1.019 1.129 0.007 0.015 26.6 10.6
65-74 233 1.016 1.120 0.007 0.016 29.9 11.6
75+ 215 1.021 1.134 0.007 0.015 25.1 10.2
Total 200 1.027 1.145 0.007 0.014 21.7 9.0 Source: Deloitte Access Economics calculations.

63 Deloitte Access Economics
Chart B.7: Change in cancer risk, persons – scenario 1
Source: Deloitte Access Economics calculations.
Chart B.8: Change in CVD risk, persons – scenario 1
Source: Deloitte Access Economics calculations.
Chart B.9 and Chart B.10 show the proportion of health expenditure attributable to low vegetable consumption that was avoided for each age group and condition. Chart B.9 shows the reduction for males, while Chart B.10 shows the reduction for females.
0.0
0.2
0.4
0.6
0.8
1.0
1.2
0 50 100 150 200 250 300 350
Re
lati
ve r
isk
Consumption of vegetables (grams)
Base consumption Scenario consumption Cancer relative risk curve
0.0
0.2
0.4
0.6
0.8
1.0
1.2
1.4
0 50 100 150 200 250 300 350
Re
lati
ve r
isk
Consumption of vegetables (grams)
Base consumption Scenario consumption CVD relative risk curve

64 Deloitte Access Economics
Chart B.9: Proportion of health expenditure attributable to low vegetable consumption avoided by gender and age, males – scenario 1
Source: Deloitte Access Economics calculations.
Chart B.10: Proportion of health expenditure attributable to low vegetable consumption avoided by cause by age, female – scenario 1
Source: Deloitte Access Economics calculations.
The marginal change relative to the maximum change for each age and gender group – as shown in Chart B.9 and Chart B.10 – was applied to the total expenditure for these groups to determine the reduction in health expenditure if average consumption were 10% higher. It was estimated that total expenditure would have been reduced by $147.3 million as shown in Table B.9.
0%
5%
10%
15%
20%
25%
30%
0-24 25-34 35-44 45-54 55-64 65-74 75+
Pro
po
rtio
n
Cancer expenditure avoided CVD expenditure avoided
0%
5%
10%
15%
20%
25%
30%
35%
0-24 25-34 35-44 45-54 55-64 65-74 75+
Pro
po
rtio
n
Cancer expenditure avoided CVD expenditure avoided

65 Deloitte Access Economics
Table B.9: Total change in expenditure – scenario 1
Gender/ Age Cancer ($m) CVD ($m) Total ($m)
Male
0-24 0.0 0.1 0.1
25-34 0.0 0.8 0.8
35-44 0.4 3.3 3.7
45-54 0.7 8.6 9.2
55-64 1.8 18.2 20.0
65-74 2.6 22.1 24.8
75+ 2.1 18.7 20.8
Total 7.6 71.8 79.4
Female
0-24 0.0 0.1 0.1
25-34 0.1 1.9 2.0
35-44 0.2 3.3 3.5
45-54 0.4 7.1 7.5
55-64 0.6 13.6 14.2
65-74 1.0 20.1 21.2
75+ 0.6 18.9 19.5
Total 3.0 65.0 67.9
Overall 10.6 136.7 147.3 Source: Deloitte Access Economics calculations. Note: numbers may not add due to rounding.
As discussed, the scope of the modelling was to determine the change in health expenditure for government. The ratios for Federal and state/territory government expenditure were applied to the total expenditure in Table B.9. Overall, if consumption were 10% higher in 2015-16, it was estimated that health expenditure for government could have been reduced by $99.9 million (in 2015-16 dollars). The results are presented in Table B.10.

66 Deloitte Access Economics
Table B.10: Change in government expenditure – scenario 1
Gender/ Age Federal ($m) State/territory ($m) Total ($m)
Male
0-24 0.1 0.0 0.1
25-34 0.3 0.2 0.6
35-44 1.5 1.0 2.5
45-54 3.8 2.5 6.3
55-64 8.2 5.3 13.5
65-74 10.2 6.6 16.8
75+ 8.6 5.5 14.1
Total 32.7 21.1 53.8
Female
0-24 0.0 0.0 0.1
25-34 0.8 0.5 1.3
35-44 1.4 0.9 2.4
45-54 3.1 2.0 5.1
55-64 5.9 3.8 9.6
65-74 8.7 5.6 14.3
75+ 8.0 5.2 13.2
Total 28.0 18.1 46.1
Overall 60.7 39.2 99.9 Source: Deloitte Access Economics calculations. Note: numbers may not add due to rounding.
B.4.2 Scenario 2 – males consume the same as females (or no less)
In this scenario, the baseline level of vegetable consumption for males was increased to match the same vegetable consumption as females by age group, with the exception of males aged 75 years old or older.27 The level of consumption in this scenario is presented in Table B.11, along with the relative risk of cancer and CVD, and the change in risk. This is shown graphically in Chart B.11 and Chart B.12 for the overall male values – noting that the final results are taken as the sum of the individual age and gender groups, and that there is no change in consumption for females.
Base consumption of 174 grams increased to 181 grams would result in a reduction in cancer risk from 1.037 to 1.034 (Chart B.11), and a reduction in CVD risk from 1.166 to 1.160 (Chart B.12).
27
Males in this age group consume more vegetables than females, and so no adjustment was made to male consumption for this age group.
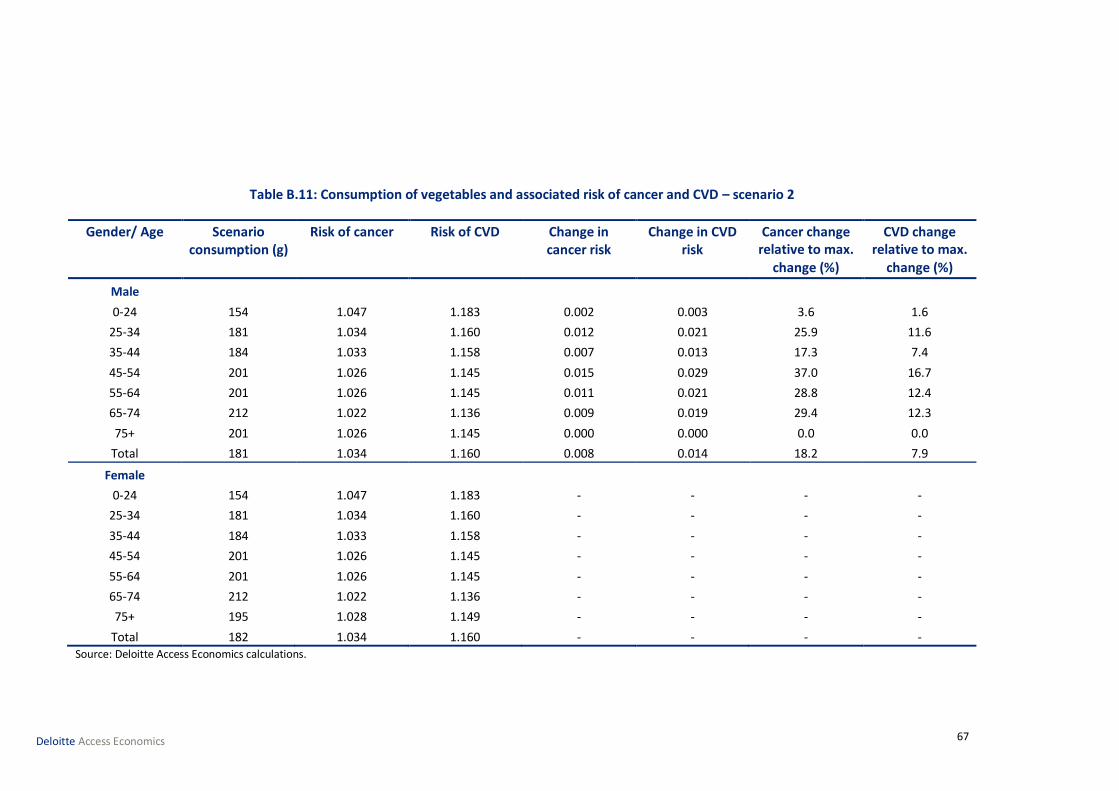
67 Deloitte Access Economics
Table B.11: Consumption of vegetables and associated risk of cancer and CVD – scenario 2
Gender/ Age Scenario consumption (g)
Risk of cancer Risk of CVD Change in cancer risk
Change in CVD risk
Cancer change relative to max.
change (%)
CVD change relative to max.
change (%)
Male
0-24 154 1.047 1.183 0.002 0.003 3.6 1.6
25-34 181 1.034 1.160 0.012 0.021 25.9 11.6
35-44 184 1.033 1.158 0.007 0.013 17.3 7.4
45-54 201 1.026 1.145 0.015 0.029 37.0 16.7
55-64 201 1.026 1.145 0.011 0.021 28.8 12.4
65-74 212 1.022 1.136 0.009 0.019 29.4 12.3
75+ 201 1.026 1.145 0.000 0.000 0.0 0.0
Total 181 1.034 1.160 0.008 0.014 18.2 7.9
Female
0-24 154 1.047 1.183 - - - -
25-34 181 1.034 1.160 - - - -
35-44 184 1.033 1.158 - - - -
45-54 201 1.026 1.145 - - - -
55-64 201 1.026 1.145 - - - -
65-74 212 1.022 1.136 - - - -
75+ 195 1.028 1.149 - - - -
Total 182 1.034 1.160 - - - - Source: Deloitte Access Economics calculations.

68 Deloitte Access Economics
Chart B.11: Change in cancer risk, persons – scenario 2
Source: Deloitte Access Economics calculations.
Chart B.12: Change in CVD risk, persons – scenario 2
Source: Deloitte Access Economics calculations.
The marginal change relative to the maximum change for each age and gender group was applied to the total expenditure for these groups to determine the reduction in health expenditure if consumption of vegetables by males were equal to that of females by age group. It was estimated that total expenditure would have been reduced by $85.5 million as shown in Table B.12.
0.0
0.2
0.4
0.6
0.8
1.0
1.2
0 50 100 150 200 250 300 350
Re
lati
ve r
isk
Consumption of vegetables (grams)
Base consumption Scenario consumption Cancer relative risk curve
0.0
0.2
0.4
0.6
0.8
1.0
1.2
1.4
0 50 100 150 200 250 300 350
Re
lati
ve r
isk
Consumption of vegetables (grams)
Base consumption Scenario consumption CVD relative risk curve

69 Deloitte Access Economics
Table B.12: Total change in expenditure – scenario 2
Gender/ Age Cancer ($m) CVD ($m) Total ($m)
Male
0-24 0.0 0.0 0.0
25-34 0.1 1.3 1.3
35-44 0.3 3.1 3.4
45-54 1.4 18.3 19.7
55-64 2.6 26.5 29.0
65-74 3.3 28.7 32.0
75+ - - -
Total 7.7 77.8 85.5
Female
0-24 - - -
25-34 - - -
35-44 - - -
45-54 - - -
55-64 - - -
65-74 - - -
75+ - - -
Total - - -
Overall 7.7 77.8 85.5 Source: Deloitte Access Economics calculations. Note: numbers may not add due to rounding.
As discussed previously, the scope of the modelling was to determine the change in health expenditure for government. The ratios for Federal and state/territory health system expenditure were applied to the total expenditure in Table B.12. Overall, it was estimated that if consumption of vegetables by males were equal to that of females, then government health expenditure could have been reduced by $58.0 million (in 2015-16 dollars). The results are presented in Table B.13.

70 Deloitte Access Economics
Table B.13: Change in government expenditure – scenario 2
Gender/ Age Federal ($m) State/territory ($m) Total ($m)
Male
0-24 0.0 0.0 0.0
25-34 0.5 0.4 0.9
35-44 1.4 0.9 2.3
45-54 8.1 5.2 13.4
55-64 12.0 7.7 19.7
65-74 13.2 8.5 21.7
75+ - - -
Total 35.2 22.8 58.0
Female
0-24 - - -
25-34 - - -
35-44 - - -
45-54 - - -
55-64 - - -
65-74 - - -
75+ - - -
Total - - -
Overall 35.2 22.8 58.0 Source: Deloitte Access Economics calculations. Note: numbers may not add due to rounding.
B.4.3 Scenario 3 – if all people in Australia ate the recommended daily intake of vegetables
The final scenario considers what would have happened to expenditure if all people in Australia ate the recommended amount of vegetables – 5 serves each day. This scenario is a hypothetical scenario and does not take into account that increasing consumption to this level would result in substantial changes to diet and other health risk factors. This scenario also does not consider the results on the economy and how the additional food would be sourced. That is, it is unlikely that this scenario would occur even in the very long term.
The level of consumption for this scenario is presented in Table B.14 along with the relative risk of cancer and CVD, and the change in risk for each condition.
Base consumption of 174 grams increased to 375 grams would result in a reduction in cancer risk from 1.037 to 1.000, and a reduction in CVD risk from 1.166 to 1.000.

71 Deloitte Access Economics
Table B.14: Consumption of vegetables and associated risk of cancer and CVD – scenario 3
Gender/ Age Scenario consumption (g)
Risk of cancer Risk of CVD Change in cancer risk
Change in CVD risk
Cancer change relative to
max. change (%)
CVD change relative to
max. change (%)
Male
0-24 375 1.000 1.000 0.049 0.186 100 100
25-34 375 1.000 1.000 0.046 0.181 100 100
35-44 375 1.000 1.000 0.040 0.171 100 100
45-54 375 1.000 1.000 0.042 0.174 100 100
55-64 375 1.000 1.000 0.037 0.165 100 100
65-74 375 1.000 1.000 0.031 0.155 100 100
75+ 375 1.000 1.000 0.026 0.145 100 100
Total 375 1.000 1.000 0.042 0.174 100 100
Female
0-24 375 1.000 1.000 0.047 0.183 100 100
25-34 375 1.000 1.000 0.034 0.160 100 100
35-44 375 1.000 1.000 0.033 0.158 100 100
45-54 375 1.000 1.000 0.026 0.145 100 100
55-64 375 1.000 1.000 0.026 0.145 100 100
65-74 375 1.000 1.000 0.022 0.136 100 100
75+ 375 1.000 1.000 0.028 0.149 100 100
Total 375 1.000 1.000 0.034 0.160 100 100 Source: Deloitte Access Economics calculations. Note: for this scenario, the relative risk curves shown in appendix B.3 do not have a relative risk of 1 at exactly 375g of vegetable consumption. This is the implicit assumption in taking the change in risk relative to the minimum risk profile (relative risk of each condition is 1 at 375g of vegetable consumption).
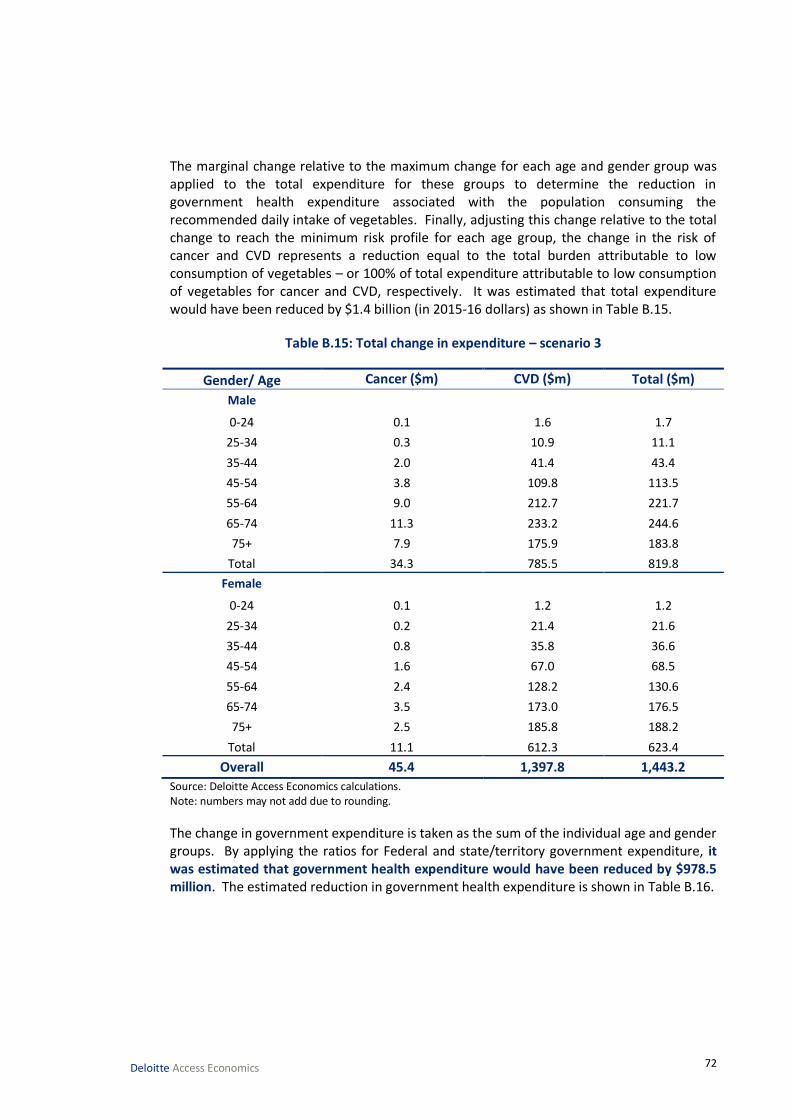
72 Deloitte Access Economics
The marginal change relative to the maximum change for each age and gender group was applied to the total expenditure for these groups to determine the reduction in government health expenditure associated with the population consuming the recommended daily intake of vegetables. Finally, adjusting this change relative to the total change to reach the minimum risk profile for each age group, the change in the risk of cancer and CVD represents a reduction equal to the total burden attributable to low consumption of vegetables – or 100% of total expenditure attributable to low consumption of vegetables for cancer and CVD, respectively. It was estimated that total expenditure would have been reduced by $1.4 billion (in 2015-16 dollars) as shown in Table B.15.
Table B.15: Total change in expenditure – scenario 3
Gender/ Age Cancer ($m) CVD ($m) Total ($m)
Male
0-24 0.1 1.6 1.7
25-34 0.3 10.9 11.1
35-44 2.0 41.4 43.4
45-54 3.8 109.8 113.5
55-64 9.0 212.7 221.7
65-74 11.3 233.2 244.6
75+ 7.9 175.9 183.8
Total 34.3 785.5 819.8
Female
0-24 0.1 1.2 1.2
25-34 0.2 21.4 21.6
35-44 0.8 35.8 36.6
45-54 1.6 67.0 68.5
55-64 2.4 128.2 130.6
65-74 3.5 173.0 176.5
75+ 2.5 185.8 188.2
Total 11.1 612.3 623.4
Overall 45.4 1,397.8 1,443.2
Source: Deloitte Access Economics calculations. Note: numbers may not add due to rounding.
The change in government expenditure is taken as the sum of the individual age and gender groups. By applying the ratios for Federal and state/territory government expenditure, it was estimated that government health expenditure would have been reduced by $978.5 million. The estimated reduction in government health expenditure is shown in Table B.16.

73 Deloitte Access Economics
Table B.16: Change in government expenditure – scenario 3
Gender/ Age Federal ($m) State/ territory ($m) Total ($m)
Male
0-24 0.7 0.5 1.2
25-34 4.6 3.0 7.5
35-44 17.9 11.5 29.4
45-54 46.8 30.2 77.0
55-64 91.3 59.0 150.3
65-74 100.8 65.1 165.8
75+ 75.7 48.9 124.6
Total 337.8 218.1 555.9
Female
0-24 0.5 0.3 0.8
25-34 8.9 5.8 14.7
35-44 15.1 9.7 24.8
45-54 28.2 18.2 46.5
55-64 53.8 34.7 88.6
65-74 72.7 47.0 119.7
75+ 77.6 50.1 127.6
Total 256.8 165.8 422.6
Overall 594.6 383.9 978.5 Source: Deloitte Access Economics calculations. Note: numbers may not add due to rounding.
B.5 Caveats to the health expenditure modelling and results presented
A number of key assumptions were assumed to hold in order to model the health system expenditure attributable to low vegetable consumption, and subsequent changes in the expenditure for given changes in consumption. The primary caveats are discussed in the following paragraphs.
The analysis undertaken only applied to selected conditions (cancer and CVD). This approach was derived from the AIHW burden of disease studies (AIHW, 2016; Begg et al, 2007). While there is some limited evidence to suggest other conditions may also benefit from vegetable consumption, the latest Global burden of disease study and the analysis by the AIHW considered that evidence was not strong enough to include additional conditions (Forouzanfar et al, 2015; AIHW, 2016). Some further areas for consideration may include conditions such as type 2 diabetes, chronic obstructive pulmonary disease and cataracts (Cooper et al, 2012; Lock et al, 2004).
The analysis was undertaken ceteris paribus – i.e. it was assumed that external factors such as fruit consumption, which mediates some of the protective effects of vegetables, and other diet related risks are held constant. This may mean that the analysis undertaken was conservative as an increase in vegetable consumption may lower other diet related risks

74 Deloitte Access Economics
such as high blood pressure, cholesterol, or blood glucose levels (since increased vegetable consumption likely displaces consumption of some higher risk food groups such as sugary carbonated drinks or deep fried junk foods).
The analysis undertaken assumed the total expenditure attributable to low consumption of vegetables would have been eradicated if all people in Australia ate the recommended intake (375g) – this is based on the assumption that a minimum risk profile exists as in the studies undertaken by AIHW (2016), Begg et al (2007), Lock et al (2004) and Forouzanfar et al (2015).
The analysis undertaken assumed that there are no differences in age and gender profiles when considering the relative risk of various conditions. The reason for this is that studies that report marginal consumption changes with relative risk generally do not provide enough information to capture any age and gender effects. The academic literature generally controls for these effects, but the implicit assumption was that our underlying demographic profile is similar to the meta-analyses undertaken. Some studies have observed a smaller risk reduction in older age groups (Lock et al, 2004), which may mean that this analysis overestimates the effect in these age groups. This is further complicated by different consumption recommendations for each age and gender group (NHMRC, 2013), although on average, the consumption recommendations align with the 5 servings assumed in this study.
Finally, there may be a lag between changes in consumption and the reduction in risk of each condition. Lock et al (2004) conclude that studies would need stronger designs to identify these changes, although they propose using a 4 year lag for ischaemic heart disease and stroke, and an 8 year lag for cancer outcomes. For this analysis, it was assumed that there is no lag. It is plausible that this represents a scenario where consumption of vegetables was higher historically, and the benefits were realised during 2015-16.
75 Deloitte Access Economics
Appendix C: The impact of higher vegetable consumption on producer returns This section follows from Appendix B, by estimating the returns to Australian vegetable producers if vegetable consumption were higher. In order to develop this estimate, it is necessary to first estimate the quantity of vegetables which are produced in Australia for domestic human consumption.
Using the estimate of Australian production for domestic human consumption, the modelling assumed that a proportionally higher level of consumption, relative to baseline levels, would lead to equal proportionally higher levels of vegetable production and industry revenues. Hence we implicitly assumed that the ratios in which particular vegetables are consumed, as well as wastage rates and the relative shares of imports and exports, remain fixed. The modelling calculated returns to all vegetable producers, as well as producers of levied vegetables.
All quantities and results are expressed in 2015-16 dollars. Where applicable, the producer price index for ‘mushrooms and vegetable growing’ (ABS, 2016b) was used to convert data from earlier years.
C.1 Australian production for domestic human consumption
The modelling in this report examined increased consumption by people in Australia and, accordingly, any production that is for export must be excluded from the baseline. Similarly, vegetable production for purposes other than human consumption (e.g. for use in animal feed) must also be excluded.
The ABS (2016a) reports the gross value of production for vegetables for human consumption.28 Value of production is reported for the entire vegetable industry as well as ten major vegetable items. These data are summarised in Table C.1. The overall value of vegetable production for human consumption is estimated to be $3.3 billion in 2015-16.
28 The ABS defines gross value as the value placed on recorded production at wholesale prices realised in the market place. The market place is defined as the points of valuation of a commodity where ownership of the commodity is relinquished by the agricultural sector. For example, vegetables can be sold into the fresh vegetable market, to factories for processing and/or export.

76 Deloitte Access Economics
Table C.1: Value of vegetable production for human consumption
Food item Value ($m)
Share of total (%)
Pays the NVL
Beans (including French and runner) 122.2 3.71 Yes
Capsicum (excluding chillies) 112.8 3.43 Yes
Carrots 142.2 4.32 Yes
Lettuces 165.0 5.01 Yes
Melons (e.g. bitter and hairy melons) 212.3 6.45 No
Onions 236.0 7.17 No
Mushrooms 268.8 8.17 No
Tomatoes – Fresh market 280.4 8.52 No
Tomatoes – Processing 25.4 0.77 No
Potatoes – Fresh market and processing 607.1 18.44 No
All other 1,119.3 34.01 -
Total 3,291.5 100.0 -
Source: ABS (2016a).
Table C.1 also identifies those vegetables that do not pay the NVL. Note that the ABS (2016a) only lists the major vegetable categories and does not individually identify the value of production for all non-levied vegetables. However, the remaining non-levied vegetables likely represent a relatively small share of total production by value.29 Hence, using these data we can estimate the gross value of production for human consumption, by levied and non-levied status. This is summarised in Table C.2.
Table C.2: Estimated value of vegetable production for human consumption
Value
($m)
Share of total (%)
Levied vegetables 1,661.4 49.5
Non-levied vegetables 1,630.1 50.5
Total 3,291.5 100.0
Source: Deloitte Access Economics estimates.
The total value of Australian vegetable exports is estimated to be $325.0 million in 2015-16 (ABARES 2016), or approximately 9.9% of production for human consumption. In addition, ABARES (2015b) provides export values for three major non-levied vegetables: potatoes; tomatoes; and onions. This allowed estimation of the export value for levied and non-levied vegetables, as shown in Table C.3.
29 In Appendix A.2 it was identified that asparagus, garlic, onion, herbs and seed sprouts likely represent a small proportion of total consumption by weight. From this we can infer that production of these non-levied vegetables is also likely to be a small proportion of total production.

77 Deloitte Access Economics
Table C.3: Estimated value of vegetable exports, by levy paying status
Value
($m)
Share of total (%)
Potatoes 39.3 12.1
Tomatoes 24.1 7.4
Onions 24.9 7.7
Total non-levied vegetables 88.2 27.1
Levied vegetables 236.8 72.9
Total 325.0 100.0
Source: Deloitte Access Economics estimates
The value of domestic production for domestic human consumption was then calculated as the difference between total value of production and exports, for levied and non-levied vegetables.30 This is summarised in Table C.4.
Table C.4: Estimated value of vegetable production for domestic human consumption, by levy paying status
Value ($m)
Share of total (%)
Levied vegetables 1,424.7 48.0
Non-Levied Vegetables 1,541.9 52.0
Total 2,966.5 100.0 Source: Deloitte Access Economics estimates
These figures represent the baseline value of production that can be affected by changes in vegetable consumption by people in Australia.
C.2 Measuring producer returns
Producer returns were modelled as the profits received by vegetable growers in Australia from sales of vegetables. The estimated value of domestic production for domestic human consumption (discussed in the sections above) is taken as the baseline revenue of Australian vegetable growers from Australian consumers.
To calculate profits we applied profit margin estimates based on ABARES’ survey of vegetable growing farms in Australia. Among other things, the survey collects key financial performance data for vegetable farms, including farms that pay the NVL. The most recent survey year was 2014-15 (ABARES, 2015a).
The key financial estimates from the survey are presented in Table C.5, including results for all vegetable growing farms as well as just those farms paying the NVL.
30
We implicitly assume that all vegetable exports are for human consumption.

78 Deloitte Access Economics
Table C.5: Key financial estimates for vegetable growing farms
All farms* NVL paying farms only*
Number of growers 2,595 1,755
Vegetable cash receipts $701,460 $845,880
Other cash receipts $110,030 $90,380
Total cash receipts $811,490 $936,260
% of cash receipts from vegetables 86.4% 90.3%
Farm business profit $60,910 $85,470
Farm business profit from vegetables
$52,650 $77,220
Profit margin on vegetable production
7.5% 9.1%
Source: ABARES 2015; Deloitte Access Economics estimates Sample size of survey: 298 growers, of which 197 were NVL paying farms. Note: *ABARES surveys vegetable growing farm businesses (‘growers’) with an EVAO of $40,000 or greater. Many NVL paying farms also produce levied vegetables.
The survey reported total farm business profit,31 however it did not report profits from vegetable growing activities specifically. It was assumed that the share of business profit attributable to vegetables is the same as the share of vegetable cash receipts from total cash receipts. Profit margins were estimated as the ratio of farm business profit from vegetables to total vegetable cash receipts. A margin of 7.5% was calculated for the vegetable industry as a whole, while a 9.1% margin was calculated for NVL paying farms.
C.2.1 Modelled scenarios
The impact of higher vegetable consumption on producer returns was modelled using two scenarios as per Appendix B. These scenarios represent moderately higher levels of vegetable consumption that are considered realistic targets over the short to medium term.
To model these scenarios, we assumed that a proportionally higher level of vegetable consumption, relative to baseline levels, would result in equal proportionally higher value of vegetable production. Thus, if consumption were 10% higher, we assumed that production would also be 10% higher. We implicitly assumed that vegetable prices, wastage rates, and the ratios in which particular vegetables are consumed remain unchanged. This includes holding fixed the ratio in which levied and non-levied vegetables are consumed. Since higher demand for vegetables is likely to be absorbed by both Australian producers and overseas sources, we further assume that imported produce remains a fixed proportion of total consumption – approximately 23.3%. These assumptions are considered reasonable for moderately higher levels of consumption.
Note that scenario modelling represents long-run benefits. It was implicitly assumed that the Australian vegetable industry is able to absorb higher demand without altering grower cost drivers and wholesale vegetable prices. However, in the short-run, growers are likely
31
Farm business profit is defined as farm cash income plus build-up in trading stocks, less depreciation and the imputed value of the owner-manager, partner(s) and family labour.

79 Deloitte Access Economics
to be constrained in their ability to scale-up production, including the availability of resources such as land, labour and financial capital.
C.2.2 Sensitivity Testing
The main results in this report are based on baseline gross value of production derived from ABS (2016a). Alternatively, gross value of production can be estimated using financial results from ABARES’ survey of vegetable farm growing businesses (ABARES, 2015a). As such, the approach of this report is to use the ABARES survey data as a sensitivity test to the central estimates.
The gross value of production estimated on the basis of the ABARES survey is summarised in Table C.6 below, both for ‘all farms’ as well as NVL-paying farms only. These values are derived by multiplying the number of growers by average vegetable cash receipts. Similar to the central results, exports were excluded using the export data discussed above (see Table C.3). As a comparison, Table C.6 also includes the estimated value of production based on ABS data (ABS, 2016a).
Table C.6: Estimated value of production for domestic consumption
All farms ($m) NVL paying farms only ($m)
ABARES (2015a) 1,640.6 1,273.0
ABS (2016a) 2,966.5 1,424.7 Source: Deloitte Access Economics estimates based on ABARES (2015a) and ABS (2016a).
Based on the ABARES survey, the estimated baseline value of production for NVL paying farms is $1.3 billion. This is approximately similar to the $1.4 billion estimate derived from ABS data (ABS, 2016a).
However, the baseline value of production for all farms derived from the ABARES survey ($1.6 billion) is significantly below the $3.0 billion value estimated using ABS data. The variation may be caused by a number of factors including, potentially, non-representative sampling in the ABARES survey. The variation may also be attributed to differences in the methodologies used in the ABARES survey and the ABS’ Value of Agricultural Commodities Produced (ABS, 2016a) publication.
The ABARES survey captured a sample of 298 vegetable growing farms, of which 197 paid the NVL. Overall, this sample represents approximately 11.2% of NVL paying farms and 11.5% of all vegetable farms. The relatively small sample size may mean that the survey did not capture representative financial statistics. Furthermore, the survey data were weighted according to the size of farms, which may have affected the accuracy of the results. The ABARES survey gave a lower weighting to larger farms and higher weighting to small farms to correct for the fact that more large farms were surveyed. It is possible that the large weights applied to results from small farms led to underestimation of industry cash receipts.
The ABS methodology for estimating gross value involves multiplying price and quantity estimates for specific agricultural commodities. Quantity data were obtained from the ABS Rural Environment and Agricultural Commodity Survey, and price information is collected from various ABS sources, as well as marketing authorities and industry sources (ABS,

80 Deloitte Access Economics
2016a). Hence the ABS estimates may not correspond to primary survey data collected directly from growers.
Conversely, the ABARES survey of vegetable growing farms may have been affected by a variety of factors including the survey sample and differences in reporting practices among growers. Note that the realised survey sample comprised approximately 11.3% of the population, and only included growers with EVAO of greater than $40,000.
The central results in this report are calculated using ABS data because it gives a direct estimate for gross value of production for the vegetable industry. In addition, the ABS data provides specific statistics for ‘vegetables for human consumption’. Detailed results from the sensitivity test using ABARES data are presented in the next section.
C.3 Results
Detailed results for each scenario are presented in the tables below. Table C.7 shows changes in vegetable consumption, and Table C.8 shows estimated producer returns using baseline production values derived from ABS data (ABS, 2016a). Results in Table C.9 are based on a sensitivity test using value of production estimates derived from ABARES’ survey of vegetable growers (ABARES, 2015a). Results are given for the entire Australian vegetable industry, as well as for just NVL paying vegetable growers.
Overall, Scenario 1 results in $22.3 million in benefits to vegetable producers per year (measured as higher profits, in 2015-16 dollars). This means the average grower would see profits that are $8,580.7 per year higher than current levels. As a whole, the vegetable industry is expected to be $296.7 million larger (measured by value of production).
Scenario 2 produces comparatively smaller benefits, as it represents a lower level of consumption than Scenario 1. Vegetable producers would receive profits that are $11.0 million per year higher than current levels, corresponding to $4,246.7 per grower. Gross value of production would be $146.8 million higher for the industry.
Notably, benefits under Scenario 2 are roughly half the benefits delivered by Scenario 1. This is because males currently consume roughly 9.5% less vegetables than females. Thus, Scenario 2 considers 9.5% higher consumption by males, or 4.8% higher consumption across the entire population (since the number of males and females is roughly equal). This is approximately half of Scenario 1, which assessed 10% higher levels of consumption.
The results provided by the sensitivity test are markedly lower, for both scenarios (Table C.9). Industry profits are expected to be higher by $12.3 million per year in Scenario 1 and $6.1 million in Scenario 2. The result is caused by the substantially lower baseline value of production estimate derived from the ABARES survey, which is over $1.3 billion (44.7%) less than the estimate based on ABS data. However, the difference is much less pronounced when considering NVL paying growers alone. For these growers, baseline value of production using ABARES data is only $151.7 million (10.6%) less than ABS data. Some potential reasons for differences between ABARES and ABS data are discussed in Section C.2.2.

81 Deloitte Access Economics
Note, all results represent long-run benefits. That is, it is assumed that the Australian vegetable industry is able to absorb higher vegetable demand without affecting vegetable prices or cost drivers.
Table C.7: Scenario results – changes in vegetable consumption
Baseline (status quo)
Scenario 1 (10% increase)
Scenario 2 (male = female)
Consumption – all vegetables
Grams consumed per day
Persons 173.6 191.0 181.6
Males 164.3 164.3 181.6
Females 181.6 181.6 181.6
Serves consumed per day
Persons 2.3 2.6 2.4
Males 2.2 2.2 2.4
Females 2.4 2.4 2.4
Consumption – only domestically produced NVL paying vegetables
Grams consumed per day
Persons 61.9 68.1 64.7
Males 58.6 58.6 64.7
Females 64.7 64.7 64.7
Serves consumed per day
Persons 0.8 0.9 2.4
Males 0.8 0.8 2.4
Females 0.9 0.9 2.4
Source: Deloitte Access Economics estimates.

82 Deloitte Access Economics
Table C.8: Scenario results – changes in producer returns based on ABS (2016a)
Baseline (status quo)
Scenario 1 (10% increase)
Scenario 2 (male = female)
Production – all vegetables for domestic consumption
Gross value ($m) 2,966.5 3,263.2 3,113.4
Total profit ($m) 222.7 244.9 233.7
Average profit per grower ($) 85,807.2 94,387.9 90,053.9
Change relative to baseline
Change in gross value ($m, %) - 296.7 (10.0%)
146.8 (4.9%)
Change in profit ($m, %) - 22.3 (10.0%)
11.0 (4.9%)
Change in profit per grower ($, %) - 8,580.8 (10.0%)
4,246.7 (4.9%)
Production – NVL paying vegetables for domestic consumption
Gross value ($m) 1,424.7 1,567.2 1,495.2
Total profit ($m) 130.1 143.1 136.5
Average profit per grower ($) 76,108.2 81,519.0 77,775.9
Change relative to baseline
Change in gross value ($m, %) - 142.5 (10.0%)
70.5 (4.9%)
Change in profit ($m, %) - 13.0 (10.0%)
6.4 (4.9%)
Change in profit per grower ($, %) - 7,410.1 (10.0%)
3,557.7 (4.9%)
Source: Deloitte Access Economics estimates. Baseline Gross Value of Production data are based on ABS’ Value of Agricultural Commodities Produced 2014-15 (ABS, 2016a)

83 Deloitte Access Economics
Table C.9: Sensitivity test results- changes in producer returns based on ABARES (2015a)
Baseline (status quo)
Scenario 1 (10% increase)
Scenario 2 (male = female)
Production – all vegetables for domestic consumption
Gross value ($m) 1,640.6 1,804.6 1,721.8
Total profit ($m) 123.1 135.5 129.2
Average profit per grower ($) 47,453.7 52,199.1 49,802.2
Change relative to baseline
Change in gross value ($m, %) - 164.1 (10.0%)
81.2 (4.9%)
Change in profit ($m, %) - 12.3 (10.0%)
6.1 (4.9%)
Change in profit per grower ($, %) - 4,745.4 (10.0%)
2,348.5 (4.9%)
Production – NVL paying vegetables for domestic consumption
Gross value ($m) 1,273.0 1,400.3 1,336.0
Total profit ($m) 116.2 127.8 122.0
Average profit per grower ($) 66,216.3 72,838.0 69,493.4
Change relative to baseline
Change in gross value ($m, %) - 127.3 (10.0%)
63.0 (4.9%)
Change in profit ($m, %) - 11.6 (10.0%)
5.75 (4.9%)
Change in profit per grower ($, %) - 6,621.6 (10.0%)
3,277.1 (4.9%)
Source: Deloitte Access Economics estimates. Baseline Gross Value of Production estimates based on ABARES’ Australian Vegetable Growing Farm Survey 2014-15.

84 Deloitte Access Economics
Limitation of our work General use restriction
This report is prepared solely for the use of Horticulture Innovation Australia Limited. This report is not intended to and should not be used or relied upon by anyone else and we accept no duty of care to any other person or entity. The report has been prepared for the purpose of modelling the impact of increased consumption of vegetables on government health expenditure and producer returns. You should not refer to or use our name or the advice for any other purpose.

Contact us
Deloitte Access Economics ACN: 149 633 116 8 Brindabella Circuit Brindabella Business Park Canberra Airport ACT 2609 Tel: +61 2 6263 7000 Fax: +61 2 6263 7004 www.deloitteaccesseconomics.com.au
Horticulture Innovation Australia Level 8, 1 Chifley Square Sydney NSW 2000 Tel: +61 2 8295 2300 Fax: +61 2 8295 2399 horticulture.com.au
Deloitte Access Economics is Australia’s pre-eminent economics advisory practice and a member of Deloitte's global economics group. For more information, please visit our website www.deloitteaccesseconomics.com.au
About Deloitte
Deloitte refers to one or more of Deloitte Touche Tohmatsu Limited, a UK private company limited by guarantee, and its network of member firms, each of which is a legally separate and independent entity. Please see www.deloitte.com/au/about for a detailed description of the legal structure of Deloitte Touche Tohmatsu Limited and its member firms.
Deloitte provides audit, tax, consulting, and financial advisory services to public and private clients spanning multiple industries. With a globally connected network of member firms in more than 150 countries, Deloitte brings world-class capabilities and deep local expertise to help clients succeed wherever they operate. Deloitte's approximately 200,000 professionals are committed to becoming the standard of excellence.
About Deloitte Australia
In Australia, the member firm is the Australian partnership of Deloitte Touche Tohmatsu. As one of Australia’s leading professional services firms. Deloitte Touche Tohmatsu and its affiliates provide audit, tax, consulting, and financial advisory services through approximately 6,000 people across the country. Focused on the creation of value and growth, and known as an employer of choice for innovative human resources programs, we are dedicated to helping our clients and our people excel. For more information, please visit our web site at www.deloitte.com.au.
Liability limited by a scheme approved under Professional Standards Legislation.
Member of Deloitte Touche Tohmatsu Limited
© 2016 Horticulture Innovation Australia Ltd