Embed Size (px)
Citation preview

Page 1 of 13
The Impact of Health Intervention and Programs on Mortality - A Case of Early Age Mortality
in Nepal Karki Yagya B.a , Hendrikus Raaijmakersb and Asha Punc c Community-Based Newborn Care Program; Population, Health and Development (PHD) Group, bProgram
Chief, Child Health and Survival, and c Maternal & Neonatal Health Specialist, UNICEF, Kathmandu, Nepal
Abstract Neonatal mortality rate (NNR) has declined slowly in Nepal. Between 2001 and 2011, post-neonatal
(PNN) mortality fell by 50% (26 to 13), whereas the neonatal mortality was reduced by only 15% (39
to 33). During the last 5-year period (2006-2010) NNR didn't decline while PNN declined by 13%. Hence, an increasing proportion of child deaths are in the neonatal period; 61% of all deaths in
children under 5 took place in the neonatal period. Nepal Government with technical and financial
support from the private sector, NGOs and External Development Partners has attempted to reduce NNR by piloting CB-NCP in 10 districts in 2009 and 2010. Analysis of Nepal Demographic and
Health Survey (NDHS) 2011 data shows that Community-Based Newborn Care Program (CB-NCP) has
worked as the newborn care practices have improved and NNR in intervention areas is about half (20
per 1000 live births) the level than that of the remaining areas (39) of Nepal although nationally no decline was observed in 2011 compared to 2006 (33).
Background: Until the mid 1990s, exact data of the number of child deaths occurring during the neonatal period were not available. The availability of vast and accurate data on neonatal mortality in
1995 and 2000 has made it possible to analyze the scale of the neonatal problem around the world.
The latest evidence is that 4 million babies die each year in their first month of life, and up to half of
these die in the first 24 hours – a child is about 500 times more likely to die the first day s/he is alive than at one month of age. Moreover, nearly all (99 percent) deaths occur in low and middle-income
countries (WHO 2005).
The fourth Millennium Development Goal (MDG-4) calls for the international community to reduce
mortality in children younger than five years old by two-thirds between 1990 and 2015. Between
1960 and 1990, the risk of dying in the first five years of life was halved – a major achievement in child survival (Ahmad, Lopez, Inoue 2000). However, achieving MDG-4 will depend on a decrease in
mortality even greater in percentage than those already achieved (Lawn et al. 2005). A decade before
the target date of 2015, many have already predicted that the goal will not be met (Travis, Bennett,
Haines et al. 2004). One of the main challenges identified by various research studies is that the pace of decline of neonatal mortality is slow. Between 1980 and 2000, child mortality after the first month
of life – i.e., from two months to five years – fell by a third, whereas the neonatal mortality rate
(NNR) was reduced by only about a quarter. Hence, an increasing proportion of child deaths now occurs during the neonatal period; data from 2000 showed that 38 percent of all deaths in children
younger than age five happened in the first month of life (Zupan and Aahman 2005). To meet MDG-
4, a substantial reduction in NNR is needed and reducing deaths in the first week of life is imperative.
The most recent survey of Nepal in 2011, estimated the neonatal mortality to be 33 deaths per 1,000
live births (MOHP, New ERA and ICF International 2012) declining from 50 deaths per 1,000 live
births during the period 1991-1995 (Pradhan et al. 1997). However, during the most recent period (2006-2010) NNR did not decline at all from the 33 found for the previous period of 2001-2005
(MOHP, New ERA and Macro International 2007). Other childhood mortality indicators did,
however, decline during the same period. For instance, during the 15-year period (1996-2010) the under-five mortality rate declined by 41 percent from 91 deaths per 1,000 live births to 54 deaths. The
stagnant neonatal mortality rate during the 2001-2010 period calls for special attention to address the
situation in Nepal.
Neonatal mortality is associated with the socioeconomic and demographic characteristics of mothers.
Neonatal mortality is consistently lower in urban areas than in rural areas. For instance, for the period 2006-2010, NNR in urban areas was 25 deaths per 1,000 live births compared with 36 deaths per 1000

Page 2 of 13
live births in rural areas. Wide differentials in NNR are observed for ecological zones with NNR
ranging from a low of 33 deaths per 1000 live births in the hills to 35 neonatal deaths in the Terai to a high of 46 deaths per 1000 live births in the mountains. As expected, a mother’s education is inversely
related to a child’s risk of dying. The NNR among children born to mothers with no education (46 per
1000 live births) is nearly two times higher than that of children born to mothers with SLC1 and
higher level of education (20 per 1000 live births). Babies weighing small or very small at birth were found nearly twice more likely to die than their counterparts weighing the average or greater birth
weight2.
Due to the high mortality rate of infants and young children - particularly the high neonatal mortality
rate and the fact that 81 percent of home deliveries occurring without the assistance of skilled birth
attendant (SBA) and only 23 percent of newborns delivered at home receive post-natal care (MOHP, New ERA and Macro International 2007), the Ministry of Health and Population envisioned a
Community-Based Newborn Care Program specifically for low and medium socioeconomic
populations. The strategic objectives of the program are to spread awareness and bring about household behavioural changes to achieve healthy newborn practices, to promote the utilization of
available newborn services, and to strengthen the quality of the preventative, diagnostic, and medical
care services within the community and health facilities.
The Child Health Division (CHD) has prepared a set of manuals and guidelines to train district-level
health facility and community-level health care providers and volunteers. Program preparation,
training planning, and training at various levels - from the district to the community level – takes about a year. District-level health care providers and community-level volunteers, especially Female
Community Health Volunteers (FCHVs), are engaged in several training programs. Training/
orientation is given and responsibilities are delegated to health care providers, volunteers, and community leaders in a district at five levels, namely 1) District Public Health Officer (DPHO) and
the leader at the district level, 2) Health Management Committee at the community level, 3) Health
care providers at different health facilities, 4) Community Health Workers/Auxiliary Nurse Midwives (ANMs) and 5) FCHVs (MOHP 2009).
A pilot program was launched in 10 districts
3 in 2009. As of mid June 2011 when data collection for
the Nepal Demographic and Health Survey (NDHS) was complete, the Ministry of Health and
Population (MOHP) had already implemented the Community-Based Newborn Care Program (CB-
NCP) in the pilot districts. In the Doti district, CARE/Nepal had implemented CB-NCP; in Bardiya,
Save the Children had implemented it. With financial support from UNICEF, Population, Health and Development (PHD) Group had implemented it in Chitwan district while Integrated Rural Health
Development Training Centre (IRHDTC) had implemented it in Dang and Kavre districts. Plan Nepal
implemented it in Sunsari and Parsa districts and the Ministry of Health and Population implemented it in Morang, Dhankuta and Palpa districts.
The assumptions of the program are that this effort will bring positive change in the lives of the newborn, mother, family and community. Following the pilot implementation of the program, the
government intends to scale it up to the national level covering all 75 districts. Hopefully, the CB-
NCP can contribute substantially to reducing NNR to achieve the MDG of 17 per 1,000 live births by
2015. The CB-NCP program trains health service providers of a variety of skill and professional levels and Female Community Health Volunteers (FCHVs) in program districts to enhance their skills
relating to integrated case management of newborn health problems in both the community level and
in the more formalized health facility environment. The case management process includes the assessment of the newborns, the classification of illness, treatment identification, counselling of the
mother, and the provision of follow-up care. FCHVs conduct orientation programs on neonatal health
1 SLC stands for School Leaving Certificate
2 Birth weights relate to the five-year period before the survey (MOHP, New ERA and ICF International, 2012)
3 Doti, Bardiya, Dang, Palpa, Chitwan, Kavre, Parsa, Sunsari, Morang and Dhankuta

Page 3 of 13
FCHVs in CB-NCP Chitwan district supported by UNICEF and implemented by CHD, MOHP and PHD Group
and care for Mothers' Groups in villages, and they are given financial incentives based on the number
of newborns registered in their community.
FCHV conducting Mothers' Group meeting in a remote Chepang village in Chitwan district, Nepal
Data: This study draws from the 2011 Nepal Demographic and Health Survey (NDHS), which collected information from a representative sample of 12,674 women aged 15-49 and 4,121 men aged
15-59 (MOHP, New ERA and ICF International 2012). The NDHS contains information about a wide
range of topics, including mass media exposure, fertility, family planning, infant and child health and mortality, maternal health, and HIV/AIDS related knowledge and behaviour.

Page 4 of 13
The survey was conducted using a two-stage sample design. In the first stage, 289 primary sampling
units (95 in urban areas and 194 in rural areas) were selected using systematic sampling with probability proportional to size. A complete household listing was conducted in all the selected
primary sampling units (PSUs), which provided the sampling frame for the second stage. At the
second stage, samples of an average of 35 households per PSU in urban areas and an average of about
40 households in rural areas were selected in all the regions. However, because the percentage of the urban population was too small, it was necessary to over sample the urban areas. Therefore the final
sample was weighted to provide estimates for different domains.
Methods: For this analysis, the study population is defined as non-institutional most recent live births
in the two years preceding the survey, as this was the period during which CB-NCP was already being
implemented in ten pilot districts. The outcome measures included in the analysis are: (a) first post-natal check up of the newborn on the day of birth (b) breastfeeding within the first hour of birth (c)
placing the newborn on belly/breast before placenta was delivered (d) instrument from a clean home
delivery kit used to cut the umbilical cord (e) use of new boiled blade (f) wiping the newborn before
the placenta was delivered (g) wrapping the baby in cloth before placenta was delivered and (h) bathing the baby only after 24 hours of birth. The “uncertain or don’t know” responses, if any, were
included in the “no” category of the corresponding variables. Each outcome measure, thus, had a
binary outcome (yes or no).
Five independent variables used in the analysis are: caste/ethnicity, mother's education, CB-NCP
intervention districts or not, household wealth quintile, and urban–rural residence. Ecologically, the country is divided into 3 belts—Mountain, Hill, and the Terai (southern, subtropical belt adjoining
India). Half of the total population of 26.5 million lives in the Terai belt, seven percent of the total
population lives in the Mountain belt, and the rest (43%) lives in the Hill belt. The three belts are
further divided into five vertical development regions, and each region consists of several districts. About 17 percent of the total population lives in the urban areas of the country (CBS 2012).
Not only is education a mechanism for transmitting and acquiring knowledge, but it is also responsible for turning knowledge into practice (Martin and Juarez 1995). The variable CB-NCP
intervention districts are particularly important in this analysis in order to look at the effects of the
health intervention on neonatal health. The household wealth quintile or index is a composite measure
of the cumulative living standard of a household (including assets such as the type of material used for flooring, water, and sanitation facilities and the possession of televisions). The construction of the
index, based on principal component analysis, is described in detail elsewhere (Rutstein and Johnson
2004). In this paper, bivariate analysis was first carried out followed by a multivariate analysis. For the latter, logistic regression was used since each outcome is binary (Retherford and Choe 1993).
Sample weights were applied for all estimates (means, percentages, and regression coefficients).
Results: In order to save the lives of newborns and keep them healthy, it is important to promote
newborn care practices. The focus of CB-NCP has been on the use of safe delivery kits (in case of a
home delivery), cord care, prevention and management of hypothermia, drying and bathing the
newborn, and other health care services. The CB-NCP recommends the following practices to promote newborn care: (1) wiping the newborn with a soft, dry cloth immediately after birth; (2)
putting the newborn on the mother’s chest and initiating skin-to-skin contact; (3) providing advice on
early (within the first hour) initiation of breastfeeding and exclusive breastfeeding for up to six months; (4) not applying anything on the cord stump; and (5) bathing the newborn only after 24 hours
(Karki et al. 2010).
The CB-NCP program also promotes the health of the mothers, particularly for pregnant women.
After a local Female Community Health Volunteer identifies a woman as being pregnant, she
counsels the woman on birth preparedness and keeps track of her until she gives birth. Regular
antenatal care is helpful in identifying and preventing adverse pregnancy outcomes. WHO recommends that a woman should have at least four ANC visits because, during these visits, health
problems associated with pregnancy can be detected. In the event of any complications, more frequent
Page 5 of 13
visits are advised and admission to a health facility may be necessary.
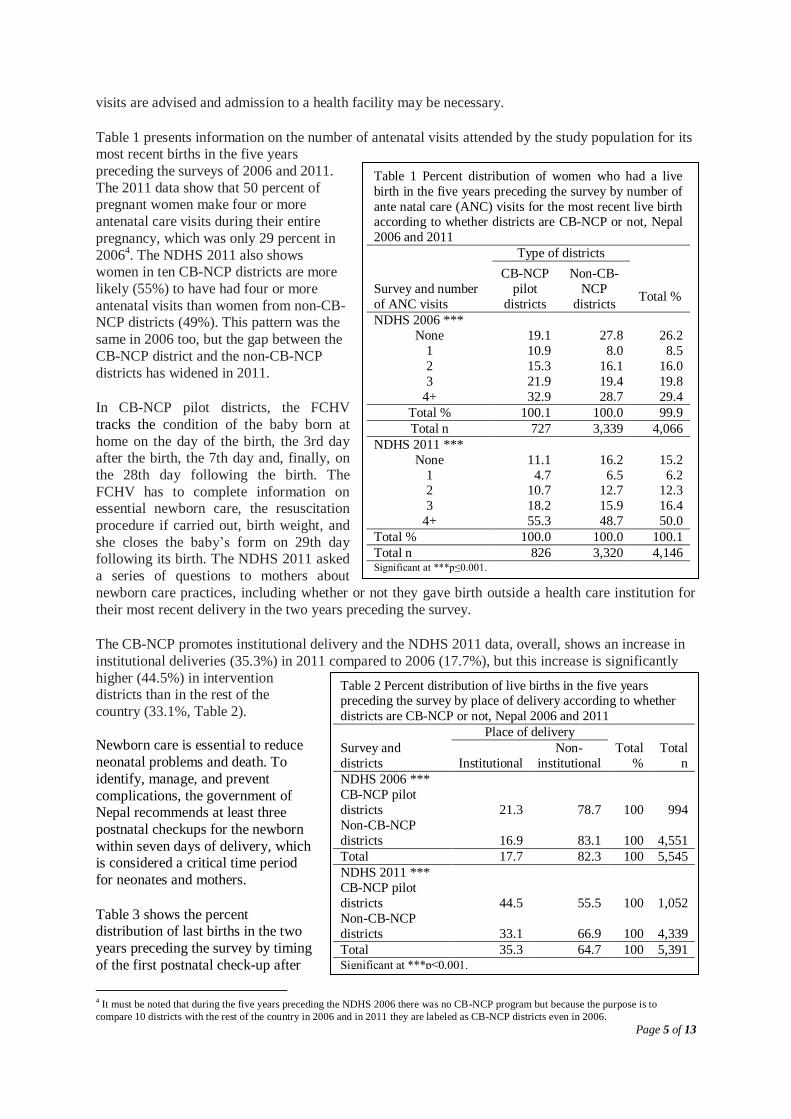
Table 1 presents information on the number of antenatal visits attended by the study population for its most recent births in the five years
preceding the surveys of 2006 and 2011.
The 2011 data show that 50 percent of pregnant women make four or more
antenatal care visits during their entire
pregnancy, which was only 29 percent in
20064. The NDHS 2011 also shows
women in ten CB-NCP districts are more
likely (55%) to have had four or more
antenatal visits than women from non-CB-NCP districts (49%). This pattern was the
same in 2006 too, but the gap between the
CB-NCP district and the non-CB-NCP
districts has widened in 2011. In CB-NCP pilot districts, the FCHV
tracks the condition of the baby born at
home on the day of the birth, the 3rd day after the birth, the 7th day and, finally, on
the 28th day following the birth. The
FCHV has to complete information on essential newborn care, the resuscitation
procedure if carried out, birth weight, and
she closes the baby’s form on 29th day following its birth. The NDHS 2011 asked
a series of questions to mothers about
newborn care practices, including whether or not they gave birth outside a health care institution for
their most recent delivery in the two years preceding the survey.
The CB-NCP promotes institutional delivery and the NDHS 2011 data, overall, shows an increase in
institutional deliveries (35.3%) in 2011 compared to 2006 (17.7%), but this increase is significantly
higher (44.5%) in intervention districts than in the rest of the
country (33.1%, Table 2).
Newborn care is essential to reduce
neonatal problems and death. To
identify, manage, and prevent
complications, the government of Nepal recommends at least three
postnatal checkups for the newborn
within seven days of delivery, which is considered a critical time period
for neonates and mothers.
Table 3 shows the percent distribution of last births in the two
years preceding the survey by timing
of the first postnatal check-up after
4 It must be noted that during the five years preceding the NDHS 2006 there was no CB-NCP program but because the purpose is to
compare 10 districts with the rest of the country in 2006 and in 2011 they are labeled as CB-NCP districts even in 2006.
Table 1 Percent distribution of women who had a live
birth in the five years preceding the survey by number of
ante natal care (ANC) visits for the most recent live birth according to whether districts are CB-NCP or not, Nepal
2006 and 2011
Survey and number
of ANC visits
Type of districts
Total %
CB-NCP
pilot
districts
Non-CB-
NCP
districts
NDHS 2006 ***
None 19.1 27.8 26.2
1 10.9 8.0 8.5
2 15.3 16.1 16.0
3 21.9 19.4 19.8
4+ 32.9 28.7 29.4
Total % 100.1 100.0 99.9
Total n 727 3,339 4,066
NDHS 2011 ***
None 11.1 16.2 15.2
1 4.7 6.5 6.2 2 10.7 12.7 12.3
3 18.2 15.9 16.4
4+ 55.3 48.7 50.0
Total % 100.0 100.0 100.1
Total n 826 3,320 4,146 Significant at ***p≤0.001.
Table 2 Percent distribution of live births in the five years preceding the survey by place of delivery according to whether
districts are CB-NCP or not, Nepal 2006 and 2011
Place of delivery
Survey and
districts Institutional
Non-
institutional
Total
%
Total
n
NDHS 2006 ***
CB-NCP pilot
districts 21.3 78.7 100 994
Non-CB-NCP
districts 16.9 83.1 100 4,551
Total 17.7 82.3 100 5,545
NDHS 2011 ***
CB-NCP pilot
districts 44.5 55.5 100 1,052
Non-CB-NCP
districts 33.1 66.9 100 4,339
Total 35.3 64.7 100 5,391 Significant at ***p≤0.001.

Page 6 of 13
birth, along with the percentage of births with a postnatal check-up in the first week after birth
according to background characteristics.
Twenty-eight percent of newborns were taken for their first postnatal check-up within 24 hours after
birth. Four percent of babies had a postnatal check-up within one to six days after being born (Table
3). The proportion of postnatal checkups within 24 hours after birth is highest among mothers with higher education (48%). Similarly, the proportion is higher among women from urban areas (46.0%),
CB-NCP pilot districts (34.6%), middle income or higher level quintiles, and the Bahun caste - known
as the highest caste group.
The majority of newborns (68%) did not receive a postnatal check-up, and four percent received post
natal checkups between one to six days after birth. Newborns delivered in non-CB-NCP pilot districts were less likely to receive a postnatal check-up within the first week after being born (30%) than
newborns delivered in CB-NCP pilot districts (41%, Table 3).
Table 3 Percent distribution of last births in the two years preceding the survey by time after birth of first
postnatal check up, and the percentage of births with a post natal check up in the first week after birth, according
to background characteristics, Nepal 2011 Background
Characteristics
Residence***
Time after birth of newborn's first post natal check up
On the day
of birth
1 to 6
days No PNC1 Total
Number of
births
Urban 46.0 6.3 47.6 100.0 189
Rural 25.9 3.9 70.2 100.0 1,841
Mother's education***
No education 17.1 3.5 79.5 100.0 862
Primary 27.5 2.3 70.2 100.0 393
Some secondary 33.4 5.8 60.7 100.0 428
SLC and above 47.6 5.8 46.7 100.0 347
Wealth quintile***
Poorest 10.6 2.5 86.9 100.0 489
Poorer 21.0 5.1 73.8 100.0 428
Middle 29.4 2.8 67.8 100.0 469
Richer 38.0 6.2 55.8 100.0 371
Richest 52.0 5.1 42.9 100.0 273
Type of programme area***
CB-NCP pilot districts 34.6 6.0 59.3 100.0 381
Non-CB-NCP districts 26.1 3.7 70.2 100.0 1,649
Caste/ethnicity ***
Chhetri/Thakuri 29.0 4.9 66.1 100.0 369
Bahun 42.7 5.8 51.5 100.0 206
Janjati 25.2 4.4 70.3 100.0 698
Terai Middle Castes 24.7 2.9 72.4 100.0 239
Dalit 22.5 4.1 73.4 100.0 364
Muslim 33.1 0.6 66.2 100.0 154
Total 27.7 4.1 68.1 100.0 2,030 Significant at ** p≤0.01; ***p≤0.001 1 Includes "don't know" cases
Table 4 presents the percent distribution of last births in the two years preceding the survey by types
of provider of newborn care during the first two days after delivery, according to background characteristics. The table shows that 25 percent of newborns received postnatal care in the two days
following birth from a doctor, nurse, or midwife. An additional four percent of newborns received
care from a health assistant, AHW, MCHW, or VHW. About two percent received care from an
FCHV, but significantly more (3.1%) newborns received care from an FCHV in CB-NCP pilot districts than in the non-CB-NCP districts (1.2%). In CB-NCP pilot districts, FCHVs are likely to play
a more active role in taking care of newborns than in other districts.

Page 7 of 13
In CB-NCP pilot districts significantly higher proportions of newborns were checked by Doctor,
Nurse/ Midwife, Health Assistant/AHW and MCHW/VHW than in non-CB-NCP districts (Table 4). Under the CB-NCP program all health facility-level health care providers are trained in providing
neonatal services. At the grass roots level FCHVs are given basic training and orientation on
pregnancy care and neonatal care immediately after delivery. In addition, community leaders are also
given orientations on the importance of neonatal and pregnancy care so that they refer or inform nearby health care providers about pregnant women and deliveries.
Table 4 Percent distribution of last births in the two years preceding the survey by type of provider of the
newborn's first postnatal health check, during the two days after the last live birth, according to background
characteristics, Nepal 2011 Background Type of health provider of newborn's first postnatal check up
Number of
births
Characteristics
Residence*** Doctor
Nurse,
midwife
Health assistant
/ AHW
MCHW
/VHW
FCH
V
No PNC in 1st 2 days
after birth Total
Urban 28.2 20.2 1.1 0.5 0.0 50.0 100.0 188
Rural 8.1 14.2 2.4 1.6 1.7 71.9 100.0 1,842
Mother's education***
No education 4.3 8.7 2.6 1.4 1.5 81.5 100.0 861
Primary 5.6 15.3 2.8 2.0 3.1 71.1 100.0 391
Some secondary 12.6 20.0 1.6 1.6 1.4 62.8 100.0 430
SLC and above 25.9 22.4 1.7 0.9 0.3 48.9 100.0 348
Wealth quintile***
Poorest 0.8 6.3 2.2 0.8 1.4 88.4 100.0 490
Poorer 3.7 13.3 1.9 1.2 4.0 75.9 100.0 427
Middle 8.1 14.5 3.6 3.4 1.3 69.0 100.0 468
Richer 15.9 21.4 1.9 0.8 0.8 59.2 100.0 370
Richest 30.5 23.3 1.1 1.1 0.0 44.0 100.0 275
Type of programme area***
CB-NCP pilot districts 11.5 19.9 2.4 1.6 3.1 61.4 100.0 381
Non-CB-NCP districts 9.6 13.5 2.3 1.5 1.2 71.9 100.0 1,649
Caste/ethnicity ***
Chhetri/Thakuri 10.6 16.1 0.8 1.4 2.2 68.9 100.0 367
Bahun 21.8 19.9 1.5 2.9 1.9 51.9 100.0 206
Janjati 8.2 12.8 2.1 2.4 2.1 72.5 100.1 698
Terai Middle Castes 12.9 10.0 3.3 0.0 0.4 73.3 100.0 240
Dalit 3.8 15.4 2.7 0.8 1.1 76.1 100.0 364
Muslim 10.3 19.4 4.5 0.0 0.0 65.8 100.0 155
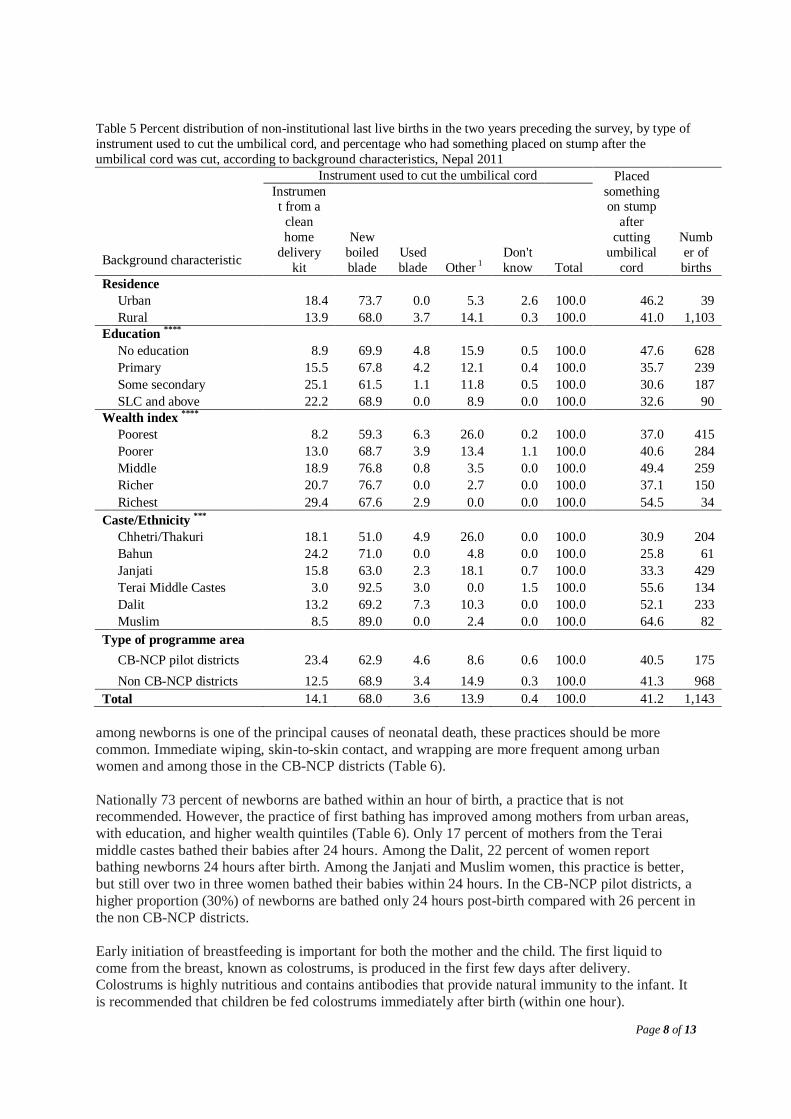
Total 10.0 14.7 2.3 1.5 1.6 70.0 100.0 2,030 Significant at ** p≤0.01; ***p≤0.001 Newborn care practices: One important newborn care practice is care of the umbilical cord. The
NDHS 2011 data shows that a new/boiled blade was used to cut the umbilical cord in 68 percent of
non-institutional births in the two years preceding the survey, while instruments from a clean home delivery kit were used in 14 percent of births. In the CB-NCP intervention areas, a clean home
delivery kit (CDK) was used in 23 percent of births compared to only 13 percent of births in non-CB-
NCP areas (Table 5). Similarly women with higher education and belonging to richer wealth quintiles used instruments from a clean home delivery kit. Women from higher castes, such as Bahun and
Chhetri/Thakuri, used instruments from a clean home delivery kit, while fewer women from the
traditionally disadvantaged groups, namely Janjati and Dalit, used CDKs.
The 2011 NDHS data indicates that 59 percent of newborns were wiped and about 60 percent were
wrapped in cloth regardless of whether they were born in CB-NCP districts or not, while a higher
proportion (13%) of newborns were placed on the belly or breast of the mother in the CB-NCP districts than in the non CB-NCP districts (10%) before the placenta was delivered. As hypothermia
Page 8 of 13
Table 5 Percent distribution of non-institutional last live births in the two years preceding the survey, by type of
instrument used to cut the umbilical cord, and percentage who had something placed on stump after the
umbilical cord was cut, according to background characteristics, Nepal 2011
Background characteristic
Instrument used to cut the umbilical cord Placed
something on stump
after
cutting
umbilical
cord
Numb
er of
births
Instrument from a
clean
home
delivery
kit
New
boiled
blade
Used
blade Other 1
Don't
know Total
Residence
Urban 18.4 73.7 0.0 5.3 2.6 100.0 46.2 39
Rural 13.9 68.0 3.7 14.1 0.3 100.0 41.0 1,103
Education ****
No education 8.9 69.9 4.8 15.9 0.5 100.0 47.6 628
Primary 15.5 67.8 4.2 12.1 0.4 100.0 35.7 239
Some secondary 25.1 61.5 1.1 11.8 0.5 100.0 30.6 187
SLC and above 22.2 68.9 0.0 8.9 0.0 100.0 32.6 90
Wealth index ****
Poorest 8.2 59.3 6.3 26.0 0.2 100.0 37.0 415
Poorer 13.0 68.7 3.9 13.4 1.1 100.0 40.6 284
Middle 18.9 76.8 0.8 3.5 0.0 100.0 49.4 259
Richer 20.7 76.7 0.0 2.7 0.0 100.0 37.1 150
Richest 29.4 67.6 2.9 0.0 0.0 100.0 54.5 34
Caste/Ethnicity ***
Chhetri/Thakuri 18.1 51.0 4.9 26.0 0.0 100.0 30.9 204
Bahun 24.2 71.0 0.0 4.8 0.0 100.0 25.8 61
Janjati 15.8 63.0 2.3 18.1 0.7 100.0 33.3 429
Terai Middle Castes 3.0 92.5 3.0 0.0 1.5 100.0 55.6 134
Dalit 13.2 69.2 7.3 10.3 0.0 100.0 52.1 233
Muslim 8.5 89.0 0.0 2.4 0.0 100.0 64.6 82
Type of programme area
CB-NCP pilot districts 23.4 62.9 4.6 8.6 0.6 100.0 40.5 175
Non CB-NCP districts 12.5 68.9 3.4 14.9 0.3 100.0 41.3 968
Total 14.1 68.0 3.6 13.9 0.4 100.0 41.2 1,143
among newborns is one of the principal causes of neonatal death, these practices should be more
common. Immediate wiping, skin-to-skin contact, and wrapping are more frequent among urban women and among those in the CB-NCP districts (Table 6).
Nationally 73 percent of newborns are bathed within an hour of birth, a practice that is not recommended. However, the practice of first bathing has improved among mothers from urban areas,
with education, and higher wealth quintiles (Table 6). Only 17 percent of mothers from the Terai
middle castes bathed their babies after 24 hours. Among the Dalit, 22 percent of women report bathing newborns 24 hours after birth. Among the Janjati and Muslim women, this practice is better,
but still over two in three women bathed their babies within 24 hours. In the CB-NCP pilot districts, a
higher proportion (30%) of newborns are bathed only 24 hours post-birth compared with 26 percent in
the non CB-NCP districts.
Early initiation of breastfeeding is important for both the mother and the child. The first liquid to
come from the breast, known as colostrums, is produced in the first few days after delivery. Colostrums is highly nutritious and contains antibodies that provide natural immunity to the infant. It
is recommended that children be fed colostrums immediately after birth (within one hour).

Page 9 of 13
Table 6 Percentage of non-institutional last live births in the two years preceding the survey that were wiped
before the placenta was delivered; the percentage placed on the mother’s belly/breast before the placenta was
delivered; the percentage wrapped in cloth before the placenta was delivered; and the percent distribution by timing of first bath, according to background characteristics, Nepal 2011
Background
characteristic
Wiped Placed on
belly/breast Wrapped in cloth
Timing of first bath
Numb
er of births
Within
24 hours
After 24 hours
Don’t know Total
Residence *
Urban 76.9 25.6 79.5 69.2 28.2 2.6 100.0 39
Rural 58.7 9.9 61.7 72.6 26.1 1.4 100.0 1,103
Education**
No education 57.9 10.4 60.6 76.4 22.3 1.3. 100.0 628
Primary 56.5 10.9 57.7 73.5 25.6 0.8. 100.0 239
Some secondary 61.5 11.8 67.9 65.8 33.7 0.5. 100.0 187
SLC and above 71.1 7.8 71.9 56.2 39.3 4.5. 100.0 90
Wealth index
Poorest 54.3 7.7. 57.6. 84.6 15.4 0.0 100.0 415
Poorer 55.6 8.1. 58.3. 70.7 27.6 1.8 100.0 284
Middle 60.0 12.0. 62.5. 63.8 33.3 3.1 100.0 259
Richer 68.9 15.8. 73.0. 61.2 36.8 2.0 100.0 150
Richest 97.1 23.5. 97.1. 55.9 44.1 0.0 100.0 34
Caste/Ethnicity ***
Chhetri/Thakuri 64.7 11.3 71.4 77.3 22.2 0.5 100.0 204
Bahun 72.1 11.5 70.5 66.1 27.4 6.5 100.0 61
Janjati 57.3 10.3 59.4 67.8 31.0 1.2 100.0 429
Terai Middle Castes 56.7 9.0 52.6 82.1 17.2 0.7 100.0 134
Dalit 59.5 7.3 64.8 75.5 22.3 2.1 100.0 233
Muslim 50.6 18.3 55.4 65.1 34.9 0.0 100.0 82
Type of programme area
CBNCP districts 58.6 12.6 57.5 70.3 29.7 0.0 100.0 175
Other districts 59.4 10.0 63.1 72.8 25.5 1.7 100.0 968
Total 59.3 10.4 62.2 72.5 26.1 1.4 100.0 1,143
Table 7 shows the percentage of most recently born children in the two years preceding the survey
according to whether they were ever breastfed and when they began breastfeeding. Ninety-eight percent of children have been breastfed at some time, with negligible differences based on socio-
demographic characteristics. In slightly over one in three non-institutional deliveries (36 percent), babies are breastfed within one
hour of birth. The majority (62 percent) of non-institutionally delivered babies are breastfed within one day of birth. Initiation of breastfeeding within one hour and within one day of birth varies by
socio-demographic characteristics. A significantly higher proportion (39%) of newborns was
breastfed within the first hour of birth in the CB-NCP intervention districts compared to the non intervention districts (36%, Table 7).

Page 10 of 13
Table 7 Among last-born non-institutional live births who were born in the two years preceding the survey, the
percentage who were ever breastfed and the percentages who started breastfeeding within one hour and after one
hour of birth, by background characteristics, Nepal 2011
Background characteristic
Among last-born children born in the past two years
Ever breastfed
Started breastfeeding
within one hour
Started breastfeeding
after one hour of birth
Number of last-born children
Residence
Urban 95.0 42.5 52.5 39
Rural 97.9 35.6 62.3 1,104
Education ****
No education 97.9 29.3 68.6 628
Primary 98.7 35.3 63.4 238
Some secondary 98.9 52.4 46.5 187
SLC and above 92.2 48.9 43.3 90
Wealth index **
Poorest 99.3 35.8 63.2 416
Poorer 98.2 34.9 63.4 284
Middle 95.3 33.3 62.0 258
Richer 97.4 39.5 57.9 152
Richest 100.0 45.5 54.5 33
Caste/Ethnicity ****
Chhetri/Thakuri 99.0 40.9 58.1 204
Bahun 96.7 36.1 60.7 61
Janjati 98.6 41.6 57.0 429
Terai Middle Castes 97.0 19.4 77.6 134
Dalit 96.1 32.3 63.8 233
Muslim 100.0 30.5 69.5 82
Type of programme area
CBNCP pilot districts* 100.0 38.5 61.5 175
Non CBNCP districts* 97.5 35.5 62.0 968
Total 97.8 35.9 62.0 1,143
Significant at *p≤0.10; **p≤0.05; ***p≤0.01; ****p≤0.001.
Multivariate analysis: The multivariate regression analyses show several socio-demographic factors
exercising important independent effects on women’s behaviour relating to newborn care practices. More educated mothers were significantly more likely than others to breastfeed within one hour of
birth and use CDK when the delivery is in non-institutional setting. Babies whose births had taken
place in CB-NCP intervention areas were more likely to have received their first postnatal check up on the day of birth, have their umbilical cords cut using instruments from CDK, have breastfed within
the first hour of birth, have been placed on mother's belly/breast, and to have been wiped and wrapped
in cloth soon after birth (Table 8).

Page 11 of 13
Table 8 Odds ratios from logistic regression models measuring effects of socio-demographic characteristics and
community based newborn care programme on non-institutional last live births in the two years preceding the
survey with respect to first post natal check up of newborn, breastfeeding, placing baby on belly/breast, CDK
use, new blade use, wiping the baby, wrapping baby in cloth and bathing baby, Nepal, 2011
Characteristics
First
post
natal check
up of
newbor
n on the
day of
birth
Breastfe
d within
one
hour of
birth
CDK
use
New
blade
use
Wiped
the baby
soon
after
birth
Placed
baby on
belly/b
reast
soon
after
birth
Wrapp
ed baby
in
cloth
soon
after
birth
Bathed
the baby
after 24
hours
Caste/ethnic group
Chhetri/Thakuri ('r') 1.0 1.0 1.0 1.0 1.0 1.0 1.0 1.0
Bahun
2.0 0.7 1.0 1.8 1.2 1.6 0.8 0.8
Janjati
1.3 1.3 1.0 1.1 1.0 1.5 0.8 1.4
Terai Middle Castes 1.0 0.5* 0.1*** 7.5*** 0.7 0.9 0.4 0.4**
Dalit
1.0 1.0 1.0 1.7** 1.0 0.9 1.0 1.0
Muslim
0.8 1.1 0.4* 5.1*** 0.6 2.4 0.6 1.2
Education
No education ('r') 1.0 1.0 1.0 1.0 1.0 1.0 1.0 1.0
Primary
1.3 1.2 1.4 1.1 0.8 1.1 0.8 1.0
Secondary
0.9 2.4*** 2.2** 0.7 0.7 0.9 0.9 1.2
Higher
0.8 2.3*** 1.9 0.9 1.1 0.5 1.1 1.5
Programme areas
Non-CB-NCP areas ('r') 1.0 1.0 1.0 1.0 1.0 1.0 1.0 1.0
CB-NCP areas 2.1** 1.2 2.4*** 0.6** 1.0 0.8 0.8 1.0
Wealth index
Poorest ('r') 1.0 1.0 1.0 1.0 1.0 1.0 1.0 1.0
Poorer
2.3** 0.9 2.1** 1.1 1.3 1.2 1.3 2.0***
Middle
6.0** 1.0 4.4*** 1.4 1.8*** 2.1* 1.9** 2.8***
Richer
3.2** 1.3 4.5*** 1.3 2.8*** 2.7** 3.4*** 3.8***
Richest
4.6** 1.3 6.3*** 0.8 41.5*** 4.5** 54.1** 6.1***
Residence
Urban ('r')
1.0 1.0 1.0 1.0 1.0 1.0 1.0 1.0
Rural
2.5 0.9 1.3 0.9 0.7 0.5 0.8 1.6
Constant
0.0** 0.4* 0.0*** 1.8 1.5 0.1*** 1.9 0.1***
Model summary
-2 Log likelihood 578 1,407 798 1,289 1,453 711 1,413 1,229
Cox & Snell R Sq 0.0 0.1 0.1 0.1 0.1 0.0 0.1 0.1
Nagelkerke R Sq 0.1 0.1 0.2 0.2 0.1 0.1 0.1 0.1
Number
1,143 1,143 1,143 1,143 1,143 1,143 1,143 1143
Impact of CB-NCP on neonatal mortality: In examining the effect of CB-NCP on early age
mortality using the NDHS 2011 data, it was found that in CB-NCP intervention areas, the neonatal mortality was almost half that estimated for the non-intervention areas. In the ten districts combined
where CB-NCP has been implemented, the neonatal mortality rate was 20 deaths per 1000 live births;
whereas, in the remaining non-intervention areas it was 39 deaths per 1000 live births (Figure 1).

Page 12 of 13
Conclusions: The analysis of neonatal data from NDHS 2011 indicates that the CB-NCP approach to
address neonatal problems prevailing in the country are yielding positive results. Further research is needed to identify the effectiveness of the different interventions on neonatal mortality. CB-NCP is a
two-pronged approach according to which community members such as FCHVs, Mothers' Group
members and community leaders are mobilized and at the same time health service facilities are made
capable to provide newborn care practices. Data shows that in CB-NCP districts ANC, PNC and skilled birth attendant (SBA) services are significantly higher than in the non-pilot areas. The
Government of Nepal has improved service facilities in most areas of the country but community
mobilization for newborn care has not been implemented simultaneously. Demand creation as well as increase in access to service utilization together may be the possible explanation for the reduction in
neonatal mortality in the pilot districts.
Keywords: neonatal deaths, Nepal, newborn, intervention, community, care

Page 13 of 13
References
Ahmad OB, Lopez AD, Inoue. 2000. The decline in child mortality: a reappraisal. Bull World Health
Organ 2000: 78: 1175-91. Central Bureau of Statistics (CBS). 2012. National Population and Housing Census 2011 (National Report).
Government of Nepal. National Planning Commission Secretariat. Kathmandu. November.
Karki, Yagya .B., P.L. Joshi, P.B. Karki, and K.B. Karki. 2010. Midterm survey of community based
newborn care program, Bardiya district. Kathmandu, Nepal: Save the Children/CB-NCP TWG Secretariat, Child Health Division, Ministry of Health and Population, and The Population, Health and
Development (PHD) Group.
Lawn JE, Causens SN, Wilczynska K. 2005. Estimating the causes of four million neonatal deaths in the year 2000: statistical annex – the world health report 2005. Geneva: World Health Organization.
Martin TC, Juarez F. 1995. The impact of women’s education on fertility in Latin America: searching for
explanations. Int Fam Plan Perspect. 1995;21:52-57.
Ministry of Health and Population (MOHP). 2012. Nepal Demographic and Health Survey 2011. New ERA and ICF International, Calverton Maryland, USA. March.
Ministry of Health and Population (MOHP). 2007. Nepal Demographic and Health Survey 2006. New ERA
and Macro International Inc. MOHP. 2009. CB-NCP. Department of Health Services. Kathmandu, Nepal (in Nepali).
Pradhan, A, Aryal, R. H., Regmi, G., Ban, B. and Govindasamy, P. 1997. Nepal Family Health Survey
1996. Kathmandu Nepal and Calverton, Maryland. USA. Retherford RD and Choe MK. 1993. Statistical Models for Causal Analysis. New York, NY: John Wiley.
Rutstein SO, Johnson K. 2004. The DHS Wealth Index. DHS Comparative Reports No 6. Calverton, MD:
ORC MACRO.
Travis P, Bennett S, Haines A, et al. 2004. Overcoming health-systems constraints to achieve the Millennium Development Goals. Lancet 2004:364: 900-06.
WHO. 2005. The World Health Report 2005: Make Every Mother and Child Count. WHO. Geneva.
Zupan J. and Elizabeth Aahman. 2005. Perinatal mortality for the year 2000: estimates developed by WHP. WHO. Geneva.