Embed Size (px)
Citation preview
The Impact of HBV Therapy on Fibrosis and Cirrhosis
This program is supported by an educational grant from Gilead Sciences
Jordan J. Feld, MD, MPHAssociate Professor of MedicineUniversity of TorontoHepatologistToronto Centre for Liver DiseaseSandra Rotman Centre for Global HealthToronto, Canada

About These Slides
§ Please feel free to use, update, and share some or all of these slides in your noncommercial presentations to colleagues or patients
§ When using our slides, please retain the source attribution:
§ These slides may not be published, posted online, or used in commercial presentations without permission. Please contact [email protected] for details
Slide credit: clinicaloptions.com

Disclosures
Jordan J. Feld, MD, MPH, has disclosed that he has received funds for research support from Abbott, AbbVie, Gilead Sciences, Janssen, Merck, and Regulus and consulting fees from AbbVie, Bristol-Myers Squibb, Gilead Sciences, Janssen, and Merck.

What Happens After HBeAg Loss?
Slide courtesy of Jordan J. Feld, MD, MPH.
Progressive fibrosis may occur more rapidlyin HBV than in HCV infection
HBeAg+ HBeAg- HBeAb+
Progressive fibrosis
InfectionMos-Yrs
HBV DNA
Immune clearanceImmune tolerance
ALT
Slide credit: clinicaloptions.com

§ Virus:– HBV DNA levels
(except for immune tolerant)
– HBeAg positive
– HBV genotype (?)
– C > B > A/D
Risk Factors for Progressive Fibrosis
§ Host:– Male sex
– Increasing age
– Metabolic syndrome
– Alcohol consumption
– Coinfections
– HCV, HDV, HIV
Slide credit: clinicaloptions.com

Iloeje UH, et al. Gastroenterology. 2006;130:678-686.
REVEAL: HBV DNA Level and Risk of Cirrhosis§ Long-term (mean follow-up: 11.4 yrs) cohort study to
determine risk of cirrhosis and HCC in untreated, HBsAg-positive individuals in Taiwan (N = 3582)
Follow-up (Yrs)
Cum
ulat
ive
Inci
denc
e of
Liv
er C
irrho
sis
0.4
0.3
0.2
0.1
00 1 2 3 4 5 6 7 8 9 10 11 12 13
Baseline HBV DNA Level (copies/mL)
Slide credit: clinicaloptions.com
≥ 1 million 100,000-999,99910,000-99,999300-9999< 300

§ Prospective study in same REVEAL cohort (N = 3653)
§ Increased HCC incidence with increasing DNA levels (P < .001)
§ HCC can occur in the absence of cirrhosisChen CJ, et al. JAMA. 2006;295:65-73.
REVEAL: HBV DNA Level and Risk of HCC
Follow-up (Yrs)
Cum
ulat
ive
Inci
denc
e of
HCC
(%)
14
6
4
2
00 1 2 3 4 5 6 7 8 9 10 11 12 13
Baseline HBV DNA (copies/mL)≥ 1 million 100,000-999,99910,000-99,999300-9999< 300
12
10
8
Slide credit: clinicaloptions.com

Chen CJ, et al. JAMA. 2006;295:65-73.
REVEAL: Risk Factors for HCC
Factor Adjusted HR 95% CI P ValueMale sex 2.1 1.3-3.3 .03Age (per yr) 1.09 1.07-1.11 < .001HBeAg positive 2.6 1.6-4.2 < .001Cirrhosis 9.1 5.9-13.9 < .001HBV DNA (copies/mL)§ < 300§ 300-9999§ 10,000-99,999§ 100,000-999,999§ ≥ 1,000,000
1.01.12.36.66.1
Ref0.5-2.31.1-4.93.3-13.12.9-12.7
< .001*.86.02
< .001< .001
*P value for trend.
Slide credit: clinicaloptions.com

Does Therapy Change the Outcome?

Liaw YF, et al. N Engl J Med. 2004;351:1521-1531.
HBV Treatment Reduces Risk of Disease Progression Including Decompensation§ Placebo-controlled, double-blind, parallel group study of pts with chronic HBV
infection and cirrhosis (F4) (N = 651) followed until HBeAg seroconversion or disease progression*
Pts
With
Dis
ease
Pro
gres
sion
(%)
P = .001
25
20
15
10
5
030181260 36
n = 198
n = 173
n = 417 n = 385
n = 43
n = 122
24
Lamivudine
Placebo
Mos*Hepatic decompensation, HCC, spontaneous bacterial peritonitis, bleeding gastroesophageal varices, or death related to liver disease.
Slide credit: clinicaloptions.com

§ Prospective cohort study in pts with HBV and first-onset complications of decompensated cirrhosis (N = 707)
§ Antiviral therapy improved transplant-free survival over 5 yrs (P = .0098 vs untreated)
HBV Treatment Reduces Risk of Liver Transplant
Jang JW, et al. Hepatology. 2015;61:1809-1820.
Treated,* responder (n = 245)Treated,* nonresponder (n = 178)Untreated (n = 284)
*Treated predominantly with lamivudine (n = 203) or entecavir (n = 198).
Bonferroni-adjusted P < .0003LT-F
ree
Surv
ival
(%)
Mos0 8412 24 36 48 60 72
100
80
60
40
20
0
Slide credit: clinicaloptions.com

Many HBV Treatment Endpoints Indicate None Is Ideal; Need to Use Surrogates§ Complications take yrs to decades to develop—
difficult to use as treatment endpoints§ Instead we use surrogate endpoints:
– Biochemical– Normalization of ALT
– Serologic– HBeAg loss and/or seroconversion for HBeAg positive
HBV– Ideally HBsAg loss and/or seroconversion
– Virologic– Histologic
Slide credit: clinicaloptions.com
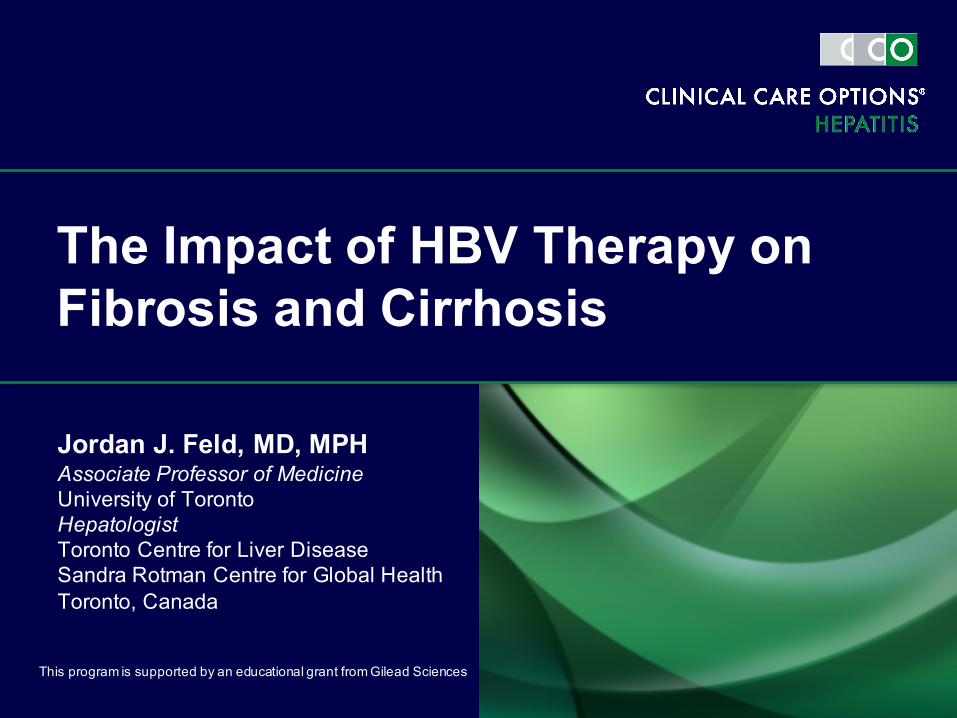
§ Open-label study of TDF in pts with chronic HBV infection (N = 585)
1. Buti M, et al. Dig Dis Sci. 2015;60:1457-1464.2. Marcellin P, et al. Lancet. 2013;381:468-475.
Long-term TDF in Pts With HBV: Reversal of Inflammation
Pts
(%)
P < .001P < .001
80%
Knodell Necroinflammatory Score
§ Necroinflammation improved over 5 yrs (n = 348 matched biopsies)[2]
8%
Parameter Outcome at 7 Yrs[1]
Normalized ALT, % (n/N)§ ITT*§ On treatment
57.1 (323/566)80.0 (328/410)
HBV DNA < 29 IU/mL,% (n/N)§ ITT§ On treatment
70.1 (418/596)99.3 (430/433)
HBeAg loss,† % (n/N) 54.5 (84/154)HBe seroconversion,†% (n/N) 39.6 (61/154)
HBsAg loss,† K-M % (95% CI) 11.8 (8.1, 16.9)
HBs seroconversion,†K-M % (95% CI) 9.7 (6.4, 14.6)
*Pts with data missing or FTC added counted as failures.†HBeAg-positive population.
100
80
60
40
20
0Baseline Yr 1 Yr 5
10-14
Slide credit: clinicaloptions.com
7-9 4-6 0-3

Marcellin P, et al. Lancet. 2013;381:468-475.
Long-term TDF in Pts With HBV: Regression of Fibrosis, Cirrhosis§ Overall regression of fibrosis in 51% of pts through 5 yrs
(176/348 pts with matched biopsies)§ Reversal of cirrhosis in 74% of pts through 5 yrs (71/96 pts with
cirrhosis at baseline)Ishak Fibrosis
Score
Pts
(%)
100
80
60
40
20
0
6543210
Baseline Yr 1 Yr 5
38%
39%
12%
63%
P < .001P < .001
Slide credit: clinicaloptions.com
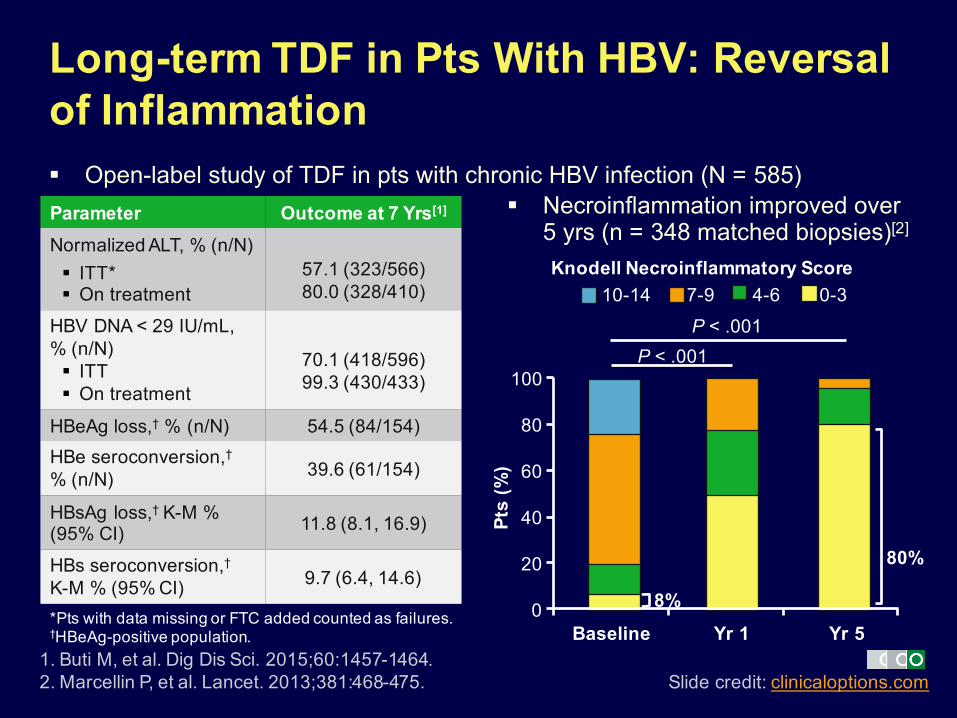
Chang TT, et al. Hepatology. 2010;52:886-893.
Long-term Entecavir in Pts With HBV: Reversal of Inflammation§ Histologic and virologic improvements evaluated by liver biopsy
in HBV pts (N = 69) with ≥ 3-yr cumulative entecavir treatment§ Median time on entecavir: 6 yrs (range: 3-7)
Pts
(n)
Parameter, % (n/N) OutcomeALT ≤ 1 x upper limit of normal 86 (49/57)
HBV DNA < 300 copies/mL 100 (57/57)
HBeAg loss 55 (22/40)
HBe seroconversion 33 (13/40)
HBsAg loss 0 (0/56)
60
50
40
30
20
10
0Baseline Wk 48 Long Term
Slide credit: clinicaloptions.com
Knodell Necroinflammatory Score10-14 7-9 4-6 0-3 Missing

Chang TT, et al. Hepatology. 2010;52:886-893.
Long-term Entecavir in Pts With HBV: Regression of Fibrosis, Cirrhosis§ Regression of fibrosis (≥ 1-point decrease in Ishak score) in 88% of
pts (50/57 pts with matched biopsies and baseline Knodell scores ≥ 2)
§ Reversal of cirrhosis in 4/10 pts with cirrhosis at baseline (median decrease in Ishak score: 3 points)
n = 57 matched biopsies
6
5
4
3
2
1
0
Missing
50
40
30
20
10
0Baseline Wk 48 Long
Term
60
Pts
(n)
Ishak Fibrosis Score
Slide credit: clinicaloptions.com

HCC Incidence in Pts With Chronic HBV Infection
1. Wong GL, et al. Hepatology. 2013;5:1537-1547.2. Wu CY, et al. Gastroenterology. 2014;147:143-151.3. Hosaka T, et al. Hepatology. 2013;58:98-107.
13.8
482 69
26.4
6.62
19.08
21,595
7.0
38.9
79 85
aHR: 0.31(95% CI: 0.27-0.53)
aHR: 0.55(95% CI: 0.31-0.99)
Slide credit: clinicaloptions.com
Nucleos(t)ide analoguesControl
0
10
20
30
40
n =
Hong Kong[1]
(Cirrhosis only)Taiwan*[2] Japan[3]
(Cirrhosis only)
5-Yr
Cum
ulat
ive
Inci
denc
e of
H
CC
21,595
*Incidence rates include cirrhotic pts (13.6% of pts had cirrhosis at baseline) and noncirrhotic pts.
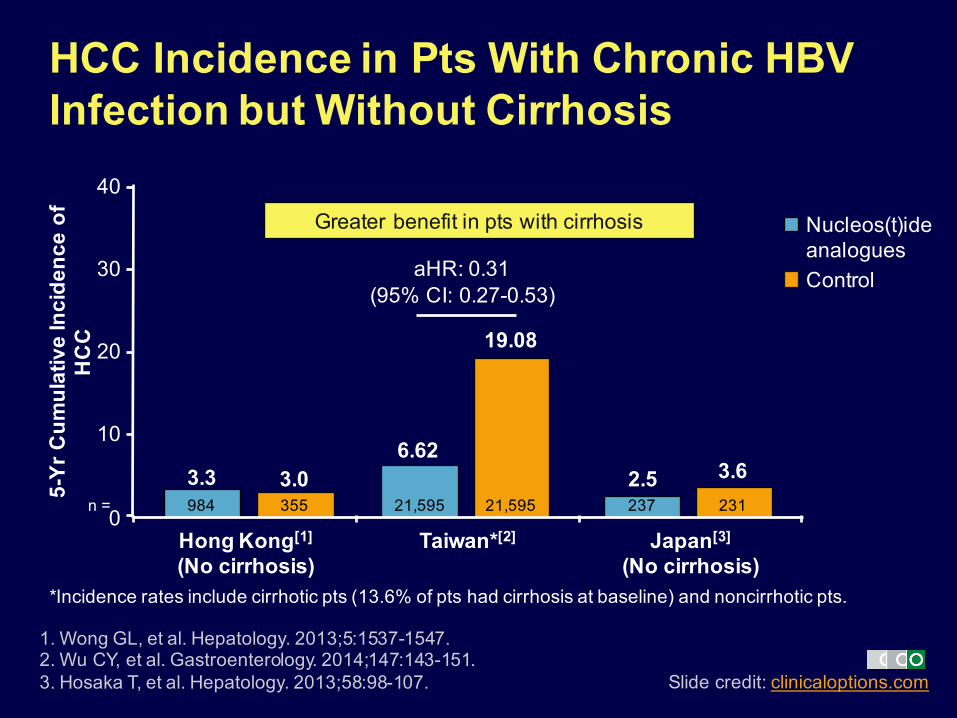
HCC Incidence in Pts With Chronic HBV Infection but Without Cirrhosis
1. Wong GL, et al. Hepatology. 2013;5:1537-1547.2. Wu CY, et al. Gastroenterology. 2014;147:143-151.3. Hosaka T, et al. Hepatology. 2013;58:98-107.
0
3.3984 355
3.05-Yr
Cum
ulat
ive
Inci
denc
e of
H
CC
2.5 3.6237 231
10
20
30
40Greater benefit in pts with cirrhosis
n =
Slide credit: clinicaloptions.com
Nucleos(t)ide analoguesControl
Hong Kong[1]
(No cirrhosis)Taiwan*[2] Japan[3]
(No cirrhosis)*Incidence rates include cirrhotic pts (13.6% of pts had cirrhosis at baseline) and noncirrhotic pts.
6.62
19.08
21,59521,595
aHR: 0.31(95% CI: 0.27-0.53)

Cho JY, et al. Gut. 2014;63:1943-1950.
Is HBV Suppression the Same as Inactive Disease?§ Retrospective cohort study of
treatment-naive pts with HBV starting oral nucleos(t)ide analogues (n = 1378) vs HBeAg-negative pts with inactive CHB (n = 1014)
– Group receiving nucleos(t)ide analogues divided by continuous viral suppression (complete vs incomplete responder)
§ Spontaneous control better than treatment
Complete responders
Inactive CHB
P < .001
Cum
ulat
ive
Inci
denc
e of
HC
C (%
)Mos
60
50
40
30
20
10
00 12 24 36 48 60 72
Pts at Risk, nNUC CRInactive CHB
11321014
848918
564724
497594
380469
128304
1980
Slide credit: clinicaloptions.com

Reduction in HCC Mortality Through National Viral Hepatitis Therapy Program§ Pts receiving treatment for chronic hepatitis after start of program in 2003 in Taiwan:
157,570 (HBV) and 61,823 (HCV)§ Reduced rate of HCC mortality in all age cohorts by 5-8 yrs after introduction of national
therapy program
Chiang CJ, et al. Hepatology. 2015;61:1154-1162.
30-39 40-49 50-59 60-69
1.00 1.00 1.00 1.00 0.98
0.8
0.6
0.4
0.2
0
Sex-
Adj
uste
d H
CC
M
orta
lity
Rat
e R
atio
0.93*
0.79†
1.00.88*
0.66†
0.92*
0.76† 0.77†
2000-20032004-20072008-2011
Age Group (Yrs)*P < .01 vs 2000-2003.†P < .005 vs 2000-2003.
Slide credit: clinicaloptions.com

§ Retrospective study comparing prognostic performance of TE vs FIB-4 serological biomarker score to identify risk of HCC in pts with CHB (N = 1308)
§ TE was more accurate than FIB-4 at identifying low HCC risk
Kim SU, et al. Medicine (Baltimore). 2016;95:e3434.
Identifying Risk of HCC: Transient Elastography vs Biomarkers
Yrs
TE
Cum
ulat
ive
Inci
denc
e
0.4
0.3
0.2
0.1
070 1 2 3 4 5 6
LSM ≤ 8 kPa8 < LSM ≤ 13 kPa13 < LSM ≤ 18 kPa18 < LSM ≤ 23 kPaLSM > 23 kPA
Yrs
FIB-4
Cum
ulat
ive
Inci
denc
e
0.4
0.3
0.2
0.1
070 1 2 3 4 5 6
FIB-4 < 1.251.25 ≤ FIB-4 < 1.701.70 ≤ FIB-4 < 2.40FIB-4 ≥ 2.40
Slide credit: clinicaloptions.com

Based on This . . .Whom and How Should We Treat?

Updated AASLD Guidelines: When to Treat
Terrault NA, et al. Hepatology. 2016;63:261-283.
HBeAg Positive HBeAg NegativeHBV DNA,
IU/mLALT Histologic
DiseaseHBV DNA,
IU/mLALT Histologic
DiseaseAny > 2 x ULN N/A Any > 2 x ULN N/A
> 20,000 Any Any > 2000 Any AnyAny Any Cirrhosis Any Any Cirrhosis
Do not stop treatment in HBeAg-negative pts with cirrhosis
Changes to guidance:
§ Lower threshold for treating HBeAg-negative pts
§ Treat all pts with cirrhosis regardless of HBV DNA
Slide credit: clinicaloptions.com

AASLD Guidelines: Initial Treatment
Terrault NA, et al. Hepatology. 2016;63:261-283.
Treatment Preferred NotesEntecavir Yes (unless previous history
of lamivudine resistance)High potency, high genetic barrier to resistance
Tenofovir Yes High potency, high genetic barrier to resistancePegIFN Yes Less safe in pts with cirrhosisAdefovir No Low genetic barrier to resistanceLamivudine No Low genetic barrier to resistanceTelbivudine No Low genetic barrier to resistance
§ Treatment with antivirals does not eliminate the risk of HCC, and surveillance for HCC should continue in persons who are at risk
Slide credit: clinicaloptions.com

TAF vs TDF in Pts With HBV Infection: Efficacy§ Multicenter phase III studies in pts with chronic HBV infection
(N = 1298), including pts with compensated cirrhosis
1. Seto WK, et al. AASLD 2016. Abstract 67. 2. Chan HL, et al. EASL 2016. Abstract GS12. 3. Buti M, et al. EASL 2016. Abstract GS06.
HBeAg-Positive Pts[2]
(N = 873)HBeAg-Negative Pts[3]
(N = 425)Outcome, % TAF TDF P Value TAF TDF P ValueHBV DNA < 29 IU/mL at Wk 72[1] 71.6 71.9 .78 92.6 92.1 .84
ALT normalization at Wk 48§ Central laboratory criteria*§ AASLD laboratory criteria†
7245
6736
.18.014
8350
7532
.076<.001
HBeAg§ Loss at Wk 48§ Seroconversion at Wk 48
1410
128
.47
.32
HBsAg§ Loss at Wk 48§ Seroconversion at Wk 48
<1<1
<10
.52
.22
Slide credit: clinicaloptions.com
*ULN for men, ≤ 43 U/L (≤ 35 U/L if age ≥ 69 yrs); for women, ≤ 34 U/L (≤ 32 U/L if age ≥ 69 yrs).†ULN for men, ≤ 30 U/L; for women, ≤ 19 U/L.

TAF vs TDF in Pts With HBV Infection: Safety§ Multicenter phase III studies in pts with chronic HBV infection
(N = 1298), including pts with compensated cirrhosis
1. Seto WK, et al. AASLD 2016. Abstract 67. 2. Agarwal K, et al. AASLD 2016. Abstract 1844. 3. Izumi N, et al. AASLD 2016. Abstract 1904.
Outcome TAF TDF P Value
Mean change in BMD at Wk 72, %[1]
§ Hip§ Spine
-0.16-0.57
-1.86-2.37
< .001< .001
Median change in serum creatinine at Wk 48, mg/dL[2] 0.01 0.02 .012Median change in eGFR at Wk 48, mL/min[2] -1.2 -5.4 < .001
Mean change in FibroTest score at Wk 48[3]
§ HBeAg-positive pts§ HBeAg-negative pts
-0.07-0.05
-0.04-0.03
.007
.028
Slide credit: clinicaloptions.com
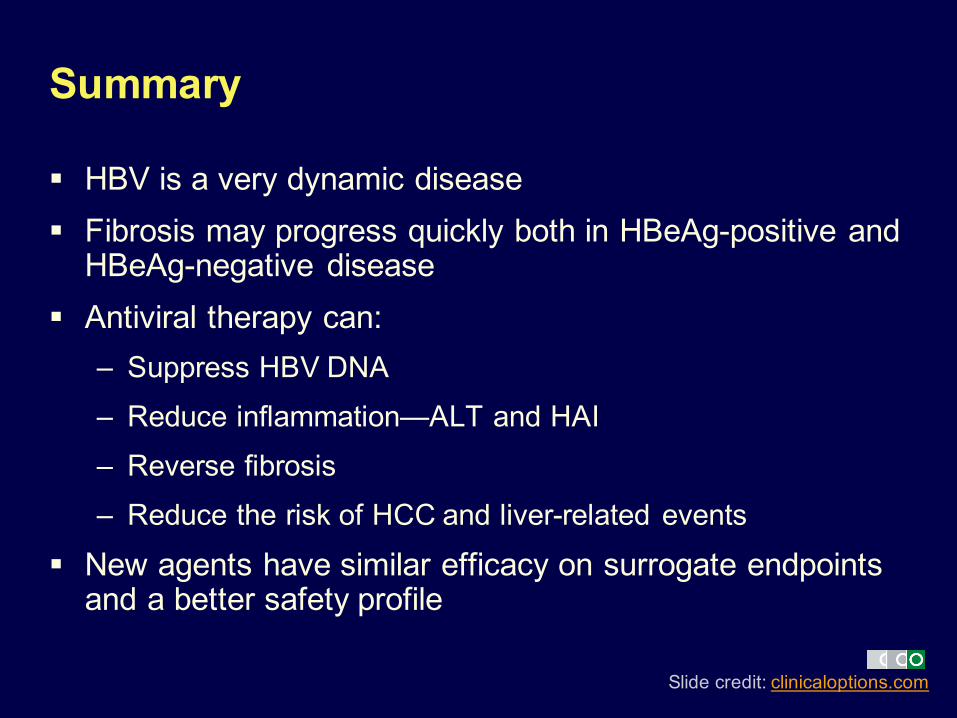
Summary
§ HBV is a very dynamic disease§ Fibrosis may progress quickly both in HBeAg-positive and
HBeAg-negative disease§ Antiviral therapy can:
– Suppress HBV DNA– Reduce inflammation—ALT and HAI– Reverse fibrosis– Reduce the risk of HCC and liver-related events
§ New agents have similar efficacy on surrogate endpoints and a better safety profile
Slide credit: clinicaloptions.com

Go Online for More CCO Coverage of HBV!
CME-certified interactive module on HBV with expert faculty commentary
clinicaloptions.com/hepatitis


![th Anniversary Special Issues (11): Cirrhosis Cellular and ... · WJG 20th Anniversary Special Issues (11): Cirrhosis TOPIC HIGHLIGHT. the liver[2]. If left untreated, fibrosis can](https://img.dokumen.tips/doc/110x75/5eca5937c38f4e40c93ea215/th-anniversary-special-issues-11-cirrhosis-cellular-and-wjg-20th-anniversary.jpg)