Embed Size (px)
Citation preview
THE IMPACT OF FOREIGN DIRECT INVESTMENT
INFLOWS ON SUSTAINABLE DEVELOPMENT:
EVIDENCE FROM AN EMERGING MIDDLE-INCOME
ECONOMY
MUNIRA BEGUM
A THESIS SUBMITTED IN FULFILMENT THE REQUIREMENT FOR THE
AWARD OF DOCTOR OF PHILOSOPHY
SCHOOL OF BUSINESS
WESTERN SYDNEY UNIVERSITY
APRIL 2020

DEDICATION
To my parents who have provided me all needed supports and facilities throughout my life and whose encouragement and inspiration have given me the strength to
work hard for the things that I aspire to achieve.

STATEMENT OF AUTHENTIFICATION
The work presented in this thesis is, to the best of my knowledge and belief, original except as
acknowledged in the text. I hereby declare that I have not submitted this material, either in full
or in part, for a degree at this or any other institution.
……… ………
(Signature)
ACKNOWLEDGEMENTS
First of all, I would like to extend my earnest admire, gratitude and thanks to my principal
supervisor, Dr. Neil Perry, whose valuable guidance and proper mentorship have motivated me
a lot all through my PhD study at Western Sydney University. His excellent supervision and
inspiring and constructive feedback have motivated me to engage vigorously in my research,
which eventually made me complete the thesis. His true mentorship and high level of inspiring
quality, as a supervisor, reminds me of a quote from Brad Hanry, "A good teacher can inspire
hope, ignite the imagination and instil a love of learning”. He is a high-quality teacher, a great
mentor and, overall, a nice person. I am greatly indebted to him.
I also express my profound gratitude and thanks to my co-supervisor, Dr. Mamta B Chowdhury.
Her guidance and critical feedback helped me a lot to improve the quality of my research,
especially the empirical analysis part of my thesis. I acknowledge all her guidance,
contributions, time, and encouragement, which made my PhD journey exciting and interesting.
I am extremely grateful to Western Sydney University for providing me with a scholarship
during the last year of my study. I like to take this opportunity to express my heartfelt gratitude
to my Principal supervisor once again for his sincere support in renewing my scholarship when
I needed it the most. In addition to that, the School of Business at Western Sydney University
has provided me with numerous facilities and activities for widening my research skills and
knowledge in various ways. The research networks, weekly seminars and conferences,
resources, training, intellectual endeavours provided me with thought-provoking research ideas
and strengthened my research skills.
I also highly benefitted from other academic members and teachers of the School of Business
through formal and informal consultation and discussion. In this respect, I would like to express
my sincere gratitude to Dr. Terry Sloan, Dr Maria Estela Varua, Dr. Girijasankar Mallik, and
Dr. Anil Mishra. I am also indebted to the members of the Graduate Research School and
Business Research of Western Sydney University for their magnificent and cordial support. I
have been accompanied by a number of intelligent, smart, friendly research fellows in Western
Sydney University during my PhD study. Their support and encouragement also made my PhD

journey smooth and interesting. Special thanks to Jufri Marsuki, Siddharth Jain, Ushi, Andy
Nguyen and Anwara Happy for supporting me and sharing your experiences. I also express my
heartfelt thanks to my friend Dr. Mohammad Salahuddin for his support and encouragement
throughout my PhD journey.
I am highly indebted to the Government of the People's Republic of Bangladesh for giving me
the opportunity to undertake PhD study at Western Sydney University. I am grateful to the
Planning Division of the Ministry of Planning, in particular. I like to express my gratitude to
my senior and colleagues at my work in the Government who have given me much inspiration,
guidance, and support to endeavour my knowledge in the development and planning area.
I owe a deep sense of gratefulness to my husband, Md. Sayedur Rahman, for being caring,
appreciative, sympathetic, and compassionate all through my PhD study. My daughter Nafisa
Yashfee is my inspiration for all good deeds. I could not give enough time and care during her
HSC period, but she continuously extended her support and helped me continue my study, even
at a hard time. Finally, I would like to extend my heartfelt thanks to all other well-wishers who
supported me throughout my PhD study.
TABLE OF CONTENT
LIST OF TABLES ................................................................................................................vi
LIST OF FIGURES ...............................................................................................................ix
LIST OF ABBREVIATIONS AND ACRONYMS ................................................................. x
ABSTRACT ........................................................................................................................ xiv
CHAPTER 1: INTRODUCTION ........................................................................................... 1
1.1 Background and motivation ........................................................................................... 1
1.2 Structure of the thesis .................................................................................................... 6
CHAPTER 2: SUSTAINABLE DEVELOPMENT AND FOREIGN DIRECT INVESTMENT
............................................................................................................................................... 8
2.1 Introduction ................................................................................................................... 8
2.2 Sustainable development (SD) ....................................................................................... 8
2.3 Foreign Direct Investment (FDI) ................................................................................. 17
2.4 Determinants of FDI inflows ....................................................................................... 20
2.4.1 Determinants related to the policy framework ....................................................... 22
2.4.2 Determinants related to the economic factors ........................................................ 24
2.4.3 Determinants related to the business facilitation .................................................... 26
2.5 Foreign Direct Investment and sustainability ............................................................... 28
2.6 Conclusion .................................................................................................................. 30
CHAPTER 3: FDI AND THE THREE DIMENSIONS OF SUSTAINABLE
DEVELOPMENT................................................................................................................. 31
3.1 Introduction ................................................................................................................. 31
3.2 The impacts of FDI on economic development ............................................................ 32
3.2.1 Theoretical context ............................................................................................... 32
3.2.2 Empirical studies .................................................................................................. 39
3.2.2.1 Studies finding a positive relationship between FDI and economic growth .... 39
3.2.2.2 Studies finding a negative and insignificant relationship between FDI and
economic growth ....................................................................................................... 41
3.2.2.3 Studies findings conditional positive results with a focus on the absorptive
capacity of the host country ....................................................................................... 42

ii
3.2.2.4 Studies focusing on the spillover or indirect effects of FDI ............................ 43
3.3 The impact of FDI inflows on environmental conditions ............................................. 46
3.3.1 Theoretical context ............................................................................................... 46
3.3.2 Empirical studies .................................................................................................. 51
3.3.2.1 Studies finding evidence of pollution halos .................................................... 51
3.3.2.2 Studies finding evidence of pollution havens ................................................. 53
3.3.2.3 Studies related to the EKC hypothesis ........................................................... 55
3.4 The impacts of FDI inflows on social development ..................................................... 58
3.4.1 FDI and employment generation ........................................................................... 58
3.4.2 FDI and poverty reduction .................................................................................... 60
3.4.2.1 The systematic channel of FDI-growth-poverty reduction .............................. 60
3.4.2.2 Redistribution of revenue income channel for poverty reduction .................... 62
3.4.2.3 Poverty reduction through enterprise channel ................................................ 62
3.4.2.4 Empirical studies investigate the direct relationship between FDI inflows and
poverty reduction ...................................................................................................... 64
3.4.3 FDI and income inequality .................................................................................... 67
3.5 FDI and sustainable development ................................................................................ 70
3.6 Conclusion .................................................................................................................. 73
CHAPTER 4: MANUFACTURING FDI AND ECONOMIC SUSTAINABILITY IN
BANGLADESH ................................................................................................................... 76
4.1 Introduction ................................................................................................................. 76
4.2 Evolution of Bangladesh economy .............................................................................. 77
4.3 Performance of the major economic indicators for the Bangladesh economy ............... 82
4.3.1 GDP Growth ......................................................................................................... 82
4.3.2 Structural Transformation ..................................................................................... 83
4.3.3 Savings and Investment ........................................................................................ 84
4.3.4 Government Revenue............................................................................................ 86
4.3.5 Inflation ................................................................................................................ 86
4.3.6 Import and Export Growth .................................................................................... 87
4.3.7 Balance of Payments ............................................................................................. 88
4.4 FDI inflow in Bangladesh: policies, trend, sectoral composition and determinants....... 90
4.4.1 The major policies to encourage and regulate foreign investment in Bangladesh ... 91
4.4.2 Foreign Direct Investment trends and composition ................................................ 95
4.4.3 Determinants of FDI inflows in Bangladesh (prospects and challenges) ................ 99
iii
4.5 The nexus between FDI inflows and economic sustainability: the performance of the
export-oriented manufacturing sector in Bangladesh ....................................................... 102
4.5.1 Impact on growth, structural dynamics and export performance of the
manufacturing sector ................................................................................................... 103
4.5.2 The impact of FDI on the domestic production base: the 'crowding in' and backward
linkages effects ............................................................................................................ 107
4.5.3 The impact on productive capacity (productivity, efficiency, competitiveness,
technological advancement,Table and innovation) ....................................................... 112
4.6 FDI inflows and economic sustainability in Bangladesh: an empirical analysis .......... 117
4.6.1 Model specification and data sources .................................................................. 119
4.6.2 Estimation procedures and finding ...................................................................... 122
4.6.2.1 Data distribution .......................................................................................... 122
4.6.2.2 Stationary (unit root) test ............................................................................. 123
4.6.2.3 Johansen Co-integration Test ....................................................................... 126
4.6.2.4 Vector error correction model (VECM) ....................................................... 128
4.6.2.5 VECM model stability and diagnostic analysis ............................................ 131
4.7 Conclusion ................................................................................................................ 132
CHAPTER 5: MANUFACTURING FDI AND ENVIRONMENTAL SUSTAINABILITY IN
BANGLADESH ................................................................................................................. 134
5.1 Introduction ............................................................................................................... 134
5.2 Major environmental pollution arising from industrial intensification in Bangladesh . 136
5.2.1 Air pollution ....................................................................................................... 136
5.2.2 Water pollution ................................................................................................... 141
5.2.3 Soil pollution ...................................................................................................... 142
5.3 Legal context of preventing environmental pollution in Bangladesh .......................... 142
5.4 The nexus between FDI inflows and environmental sustainability: the presence of
pollution havens or pollution halos in Bangladesh manufacturing ................................... 146
5.5 FDI and environmental sustainability in Bangladesh the empirical analysis ............... 154
5.5.1 Pollution halo hypothesis for renewable energy consumption in Bangladesh ....... 155
5.5.1.1 Model specification, hypothesis and data sources ........................................ 155
5.5.1.2 Data Distribution ......................................................................................... 159
5.5.1.3 Stationary (unit root) test ............................................................................. 159
5.5.1.4 ARDL Bounds Testing Approach ................................................................ 161
5.5.1.5 Validity of the model ................................................................................... 165
iv
5.5.1.6 Robustness analysis with Dynamic Ordinary Least Square (DOLS) estimation
............................................................................................................................... 166
5.5.1.7 Analysis of the empirical results .................................................................. 167
5.5.2 FDI, pollution haven and Environmental Kuznets Curve (EKC) hypothesis for CO2
emissions in Bangladesh .............................................................................................. 169
5.5.2.1 Model specification, hypothesis and data sources ........................................ 169
5.5.2.2 Data Distribution ......................................................................................... 171
5.5.2.3 Stationary (Unit root) test ............................................................................ 172
5.5.2.4 The Nonlinear ARDL (NARDL) Bound Testing Approach ......................... 173
5.5.2.5 Validity of the model ................................................................................... 176
5.5.2.6 Robustness analysis with Fully Modified Least Square (FMOLS) estimation
............................................................................................................................... 177
5.6 Challenges towards environmental sustainability in Bangladesh ................................ 177
5.7 Conclusion ................................................................................................................ 181
CHAPTER 6: MANUFACTURING FDI AND SOCIAL SUSTAINABILITY IN
BANGLADESH ................................................................................................................. 183
6.1 Introduction ............................................................................................................... 183
6.2 General socio-economic conditions in Bangladesh .................................................... 184
6.3 Manufacturing FDI inflows and its impact on the major social areas of sustainable
development in Bangladesh ............................................................................................. 187
6.3.1 Impact on employment generation ...................................................................... 187
6.3.2 Impact on poverty reduction................................................................................ 189
6.3.3 Impact on decent wage and working conditions .................................................. 191
6.3.4 Impact on income inequality ............................................................................... 194
6.4 The FDI inflow and the income inequality nexus in Bangladesh: an empirical analysis
....................................................................................................................................... 197
6.4.1 Model specification and data sources .................................................................. 197
6.4.2 Estimation procedures and findings ..................................................................... 199
6.4.2.1 Data Distribution ......................................................................................... 199
6.4.2.2 Stationary (Unit root) test ............................................................................ 200
6.4.2.3 Two-Stage Least Square (Instrumental Variable) Approach ......................... 201
6.4.3 Diagnostic check/ the validity of the model ......................................................... 205
6.5 Corporate social responsibility (CSR) practised by MNEs in Bangladesh .................. 206
6.6 Conclusions ............................................................................................................... 208
v
CHAPTER 7: FDI, SUSTAINABILITY AND POLICY MOVING FORWARD ................ 209
7.1 Introduction ............................................................................................................... 209
7.2 FDI and sustainable development in Bangladesh: key contributions, potentialities, and
challenges ....................................................................................................................... 209
7.3 Policy directions ........................................................................................................ 214
7.3.1 Policy suggestions in regards to attracting FDI inflows ....................................... 214
7.3.2 Policy suggestions in regards to strengthening domestic absorptive capabilities .. 217
7.3.3 Policy suggestions in regards to governance, institutional and regulatory
mechanisms for FDI inflows ........................................................................................ 218
7.4 Conclusion ................................................................................................................ 220
CHAPTER 8: CONCLUSIONS.......................................................................................... 221
8.1 Introduction ............................................................................................................... 221
8.2 Review and summary of the key findings .................................................................. 221
8.3 Contribution to theory and practice ............................................................................ 233
8.4 Limitations and future research ................................................................................. 236
9. REFERENCES ............................................................................................................... 239
vi
LIST OF TABLES
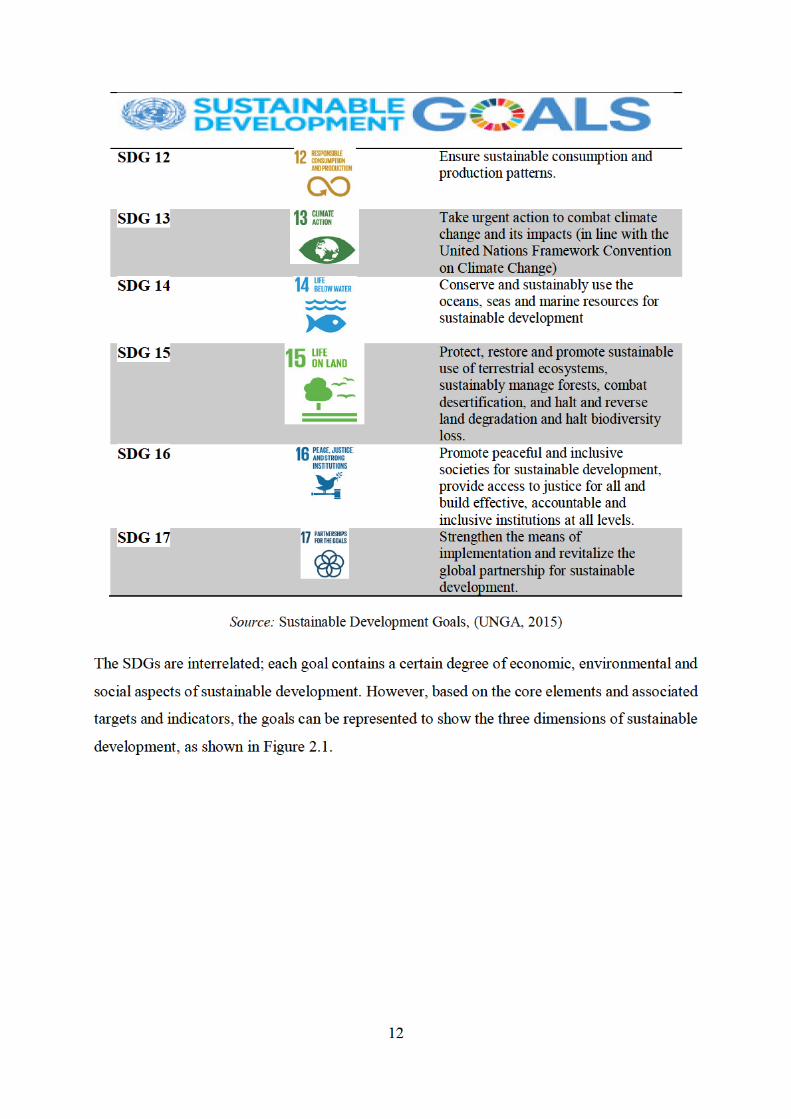
Table 2.1: The Sustainable Development Goals (SDGs) of Agenda 2030 declared by the UN
............................................................................................................................................. 11
Table 3.1: Summary of studies related to FDI and its spillover effects .................................. 44
Table 3.2: The consequences of FDI on sustainable development ......................................... 74
Table 4.1: Customs tariff rate and slabs in Bangladesh from 1994 to 2017 ............................ 79
Table 4.2: Main Industrial policies and features in Bangladesh ............................................. 81
Table 4.3: Tax holidays for various investment projects in Bangladesh ................................. 94
Table 4.4: The sector-wise FDI inflows in Bangladesh from 1996 to 2017 (in million USD) 97
Table 4.5: Doing Business Indicators in Selected South Asian Countries ............................ 101
Table 4.6: Structural dynamics of the manufacturing sector in Bangladesh ......................... 104
Table 4.7: Composition of Bangladesh exports ................................................................... 106
Table 4.8: FDI inflow and gross fixed capital formation (as % of GDP) in Bangladesh from
1996-2017 .......................................................................................................................... 107
Table 4.9: Investment as % of GDP (gross, public, private and foreign) in Bangladesh from
1991 to 2016 ....................................................................................................................... 108
Table 4.10: Import penetration ratio in Bangladesh during 1972-2015 ................................ 109
Table 4.11: Raw materials used in manufacturing firms ...................................................... 110
Table 4.12: Per-hour labour productivity levels from 1990 to 2015 in selected South Asian
countries (based on GDP at constant 2011 PPP).................................................................. 113
Table 4.13: Average growth of per-hour labour productivity from 1990 to 2015 in selected
South Asian countries (based on GDP at constant 2011 PPP) .............................................. 113
Table 4.14: Total factor productivity growth in selected South Asian countries from 1990 to
2015 ................................................................................................................................... 114
Table 4.15: Labour productivity growth in the manufacturing sector in selected South Asian
countries from 2000 to 2015 ............................................................................................... 114
Table 4.16: Selected indicators of industrial competitiveness for selected South Asian
countries ............................................................................................................................. 115
Table 4.17: Global Innovation Index, 2018 for selected South Asian countries ................... 116
Table 4.18: High- end technology exports (% of manufactured exports) in selected South
Asian countries from 1994- 2016 ........................................................................................ 116
Table 4.19: Descriptive statistics of the variables ................................................................ 123
Table 4.20: The results of the ADF and PP tests for the unit root of the variables ................ 124
Table 4.21: The results of the breakpoint unit root test ........................................................ 125
Table 4.22: Results of Chow's breakpoint test for break date 1996 ...................................... 125
Table 4.23: Results of Johansen co-integration test ............................................................. 127
Table 4.24: Long-run coefficients of Equation 4.1 .............................................................. 128

vii
Table 4.25: Results of the VEC estimation where dependent variable is Dlnmv with two lag
period ................................................................................................................................. 129
Table 4.26: Results of the VEC Granger Causality or Block Exogeneity Wald test ............. 130
Table 4.27: Results from Diagnostic tests ........................................................................... 132
Table 5.1: Top five air polluting industries in Bangladesh ................................................... 137
Table 5.2: The long-run Climate Risk Index (CRI): the most affected 10 countries from 1997-
2016 (annual averages) ....................................................................................................... 138
Table 5.3: Total Green House Gas and CO2 gas emissions from transport and manufacturing
industries in Bangladesh from 1990 to 2014 ....................................................................... 139
Table 5.4: Major components and sources of air pollution in Dhaka City ............................ 140
Table 5.5: Estimated and projected emissions (kilotons) from major sectors during 2010 and
2030 in Dhaka and percent difference ................................................................................. 140
Table 5.6: Major International Conventions, Treaties and Protocols (ICTPs) signed or ratified
by Bangladesh .................................................................................................................... 143
Table 5. 7: Categories and major requirements of industries/projects by pollution levels ..... 145
Table 5.8: Share of FDI inflows of the five ‘dirtiest’ industries in Bangladesh .................... 148
Table 5.9: Export share of the top three dirtiest industries in Bangladesh ............................ 148
Table 5.10: Stringency and enforcement of environmental regulation in selected South Asian
Countries in (2011-12 weighted average) ............................................................................ 149
Table 5.11: Descriptive statistics of the variables ................................................................ 159
Table 5.12: The results of the ADF and PP tests for the unit root of the variables ................ 160
Table 5.13: Results from the Bound test.............................................................................. 163
Table 5. 14: The long-run coefficients for Equation 5.3 using ARDL specification (1, 3, 2, 2)
based on AIC where REC is normalised as the dependent variable ..................................... 163
Table 5.15: Error Correction Representation of ARDL (1, 3, 2, 3) based on AIC where the
dependent variable is DREC ............................................................................................... 165
Table 5.16: Results from Diagnostic tests ........................................................................... 166
Table 5.17: Results from Fully Modified Least Square (FMOLS) estimation ...................... 167
Table 5.18: Descriptive statistics of the variables ................................................................ 172
Table 5.19: The results of the ADF and PP tests for the unit root of the variables ................ 172
Table 5.20: Results of the ARDL Bounds Test when dependent variable is DCO2 .............. 174
Table 5.21: The estimated short-run coefficients and error correction representation and the
long-run coefficients of the NARDL specifications (2, 0, 0, 0, 2, 0) based on AIC criteria .. 174
Table 5.22: Results from Diagnostic tests ........................................................................... 176
Table 5.23: Results from Fully Modified Least Square (FMOLS) estimation ...................... 177
Table 6.1: The progress of major social indicators in Bangladesh during 1991-2017 ........... 185
Table 6.2: HDI score and rank of selected South Asian Countries during 1990-2018 .......... 186
Table 6.3: Employment share of the top five industries in the manufacturing sector in
Bangladesh ......................................................................................................................... 188
Table 6.4: The Poverty Gap and the Squared Poverty Gap (in percentage) in Bangladesh ... 190
Table 6.5: Descriptive statistics of the variables .................................................................. 200
Table 6.6: The results of the ADF and PP tests for the unit root of the variables ................. 200
Table 6.7: Result of the first stage regression where the dependent variable is GDP ........... 203
Table 6.8: Estimated coefficients using Two-Stage Least Square Regression ...................... 203

viii
Table 6.9: Results of diagnostic tests .................................................................................. 205
Table 7.1: Major channels, key contributions, potentialities and challenges of FDI inflows for
promoting sustainable development in Bangladesh ............................................................. 211

ix
LIST OF FIGURES
Figure 1.1: World FDI inward flows (1990-2018) ................................................................... 2
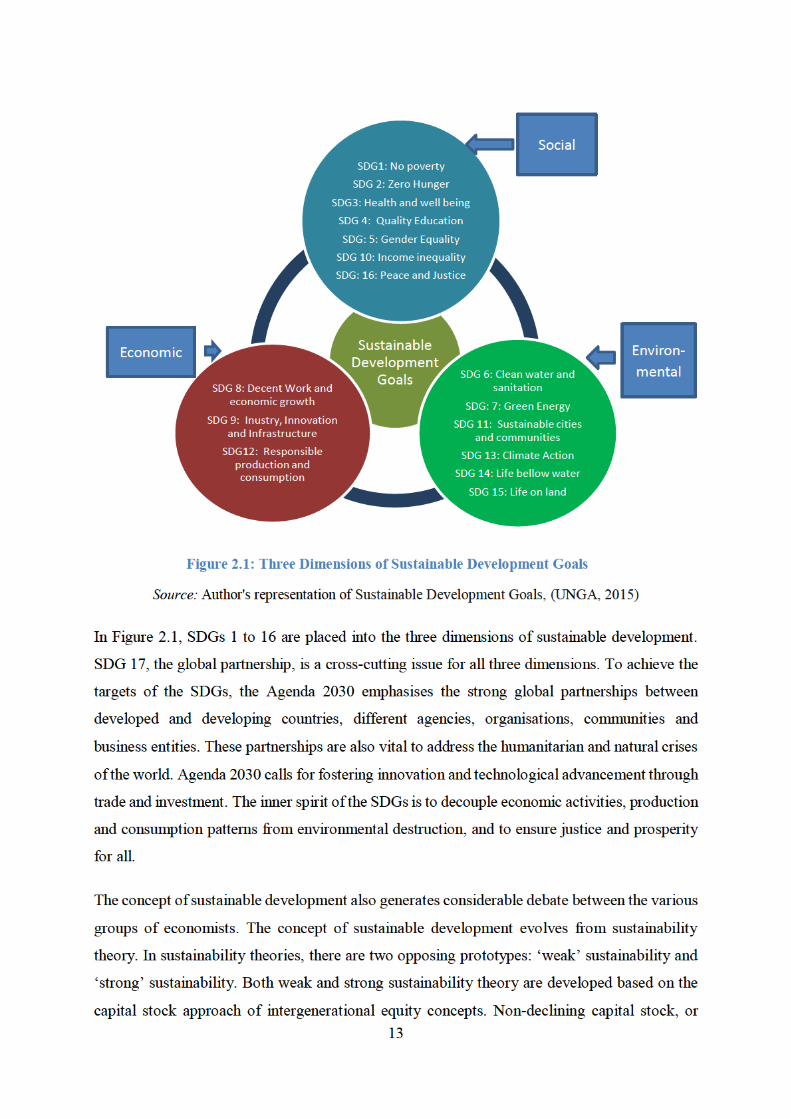
Figure 2.1: Three Dimensions of Sustainable Development Goals ........................................ 13
Figure 2.2: Determinants of FDI ........................................................................................... 22
Figure 3.1: The Environmental Kuznets Curve (EKC) .......................................................... 50
Figure 3.2: Effects of FDI inflows on poverty reduction ....................................................... 63
Figure 4.1: Five-year average real GDP Growth trend in Bangladesh from 1983-2017.......... 83
Figure 4.2: Sectoral Contribution to the GDP ........................................................................ 83
Figure 4.3 Gross national and domestic savings as % of GDP in Bangladesh from 1990-2017
............................................................................................................................................. 84
Figure 4.4: Public, private and gross investment as % GDP in Bangladesh from 1990-2017 . 85
Figure 4.5: Revenue as percentage of GDP in Bangladesh from 1990 to 2017 ...................... 86
Figure 4.6: Inflation trend in Bangladesh during 1985 to 2017 .............................................. 87
Figure 4.7: Export and Import growth during 1985-2015 ...................................................... 88
Figure 4.8: Trend of trade balance and current account balance in Bangladesh from 1993 to
2017 ..................................................................................................................................... 89
Figure 4.9: Net FDI inflow (in million USD) in Bangladesh from 1996-2017 ....................... 95
Figure 4.10: Manufacturing FDI inflows in 2017 .................................................................. 98
Figure 4.11: FDI inflows and the growth of real GDP and the manufacturing sector in
Bangladesh from 1988 to 2017 ........................................................................................... 103
Figure 4.12: Manufactured export growth in Bangladesh during 2001-2016 ....................... 105
Figure 4.13: Composition of major manufactured exports in Bangladesh in 2017 ............... 106
Figure 4.14: Integral parts of backward linkages of readymade garments industries ............ 111
Figure 4.15: Inverse Roots of AR Characteristic Polynomial .............................................. 131
Figure 5.1: FDI and new technology transfer in the selected South Asian Countries (1= not at
all and 7= to a great extent) ................................................................................................. 150
Figure 5.2: Untreated effluents from the textiles industry in Bangladesh ............................. 151
Figure 5.3: Plot of the cumulative sum and square cumulative sum of recursive residuals ... 166
Figure 5.4: Forecasted primary energy consumption in 2030 by sectors in Bangladesh ....... 168
Figure 5.5: Plot of the cumulative sum and square cumulative sum of recursive residuals ... 176
Figure 6.1: HDI trend in Bangladesh................................................................................... 186
Figure 6.2: Employment in manufacturing as a %of total labour force ................................ 188
Figure 6.3: Poverty reduction trend in Bangladesh .............................................................. 189
Figure 6.4: Growth of wage rate in Bangladesh................................................................... 191
Figure 6.5: Change in minimum wage between Jan 2014 to Jan 2015, real terms in local
currency unit (%) ................................................................................................................ 192
Figure 6.6: Trend in income inequality ............................................................................... 195
Figure 6.7: Percentage Distribution of Income Share to different income groups ................ 196
x
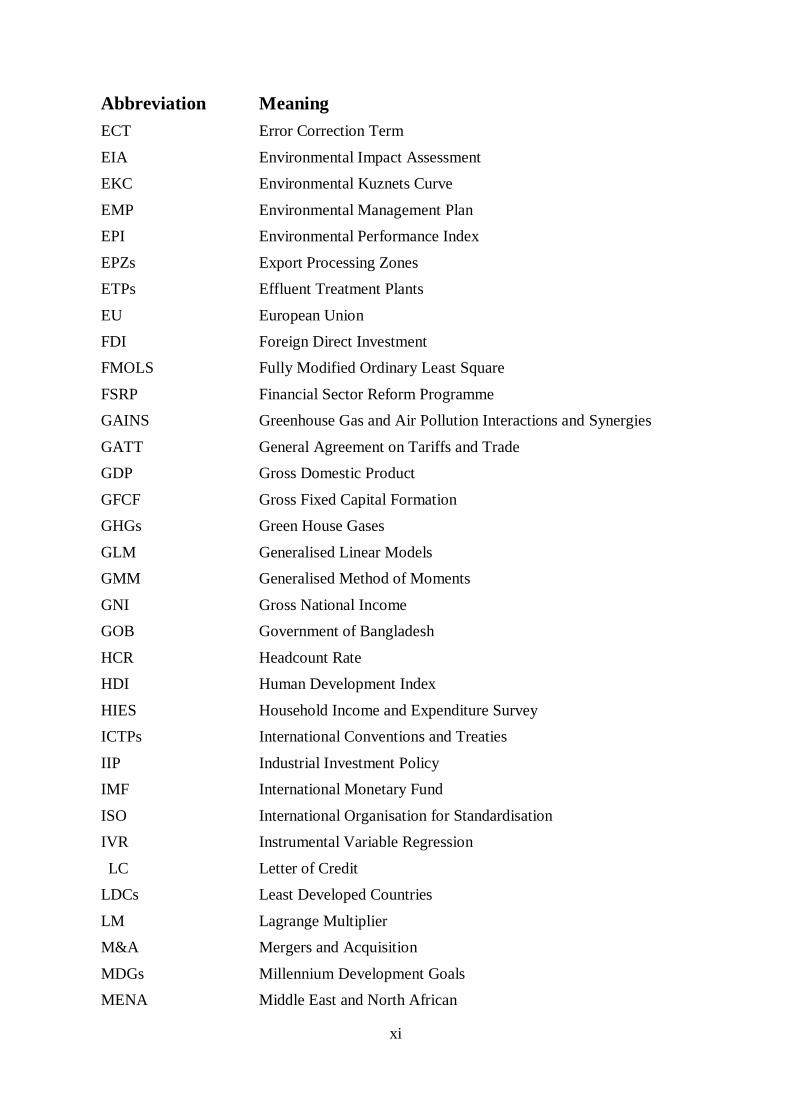
LIST OF ABBREVIATIONS AND ACRONYMS
Abbreviation Meaning
2SLS Two-Stage Least Square
3R Reduce, Reuse and Recycle
3SLS Three-Stage Least Square
ADF Augmented Dickey-Fuller
AIC Akaike's Information Criteria
APO Asian Productivity Organisation
ARDL Autoregressive Distributed Lag
ASEAN Association of Southeast Asian Nations
BBS Bangladesh Bureau of Statistics
BD Bangladesh
BDT Bangladesh Taka
BEPZA Bangladesh Export Processing Zone Authority
BEZA Bangladesh Economic Zones Authority
BIDA Bangladesh Investment Development Authority
BITs Bilateral Investment Treaties
BOI Board of Investment
BOP Balance of Payment
BRICS Brazil, Russia, India, China, and South Africa
CBN Cost of Basic Needs
CIP Competitive Industrial Performance
CO2 Carbon dioxide
CRI Climate Risk Index
CSR Corporate Social Responsibility
CUSUM Cumulative Sum
DOE Department of Environment
DOLS Dynamic Ordinary Least Squares
ECC Environmental Clearance Certificate
ECR Environment Conservation Rules
xi
Abbreviation Meaning
ECT Error Correction Term
EIA Environmental Impact Assessment
EKC Environmental Kuznets Curve
EMP Environmental Management Plan
EPI Environmental Performance Index
EPZs Export Processing Zones
ETPs Effluent Treatment Plants
EU European Union
FDI Foreign Direct Investment
FMOLS Fully Modified Ordinary Least Square
FSRP Financial Sector Reform Programme
GAINS Greenhouse Gas and Air Pollution Interactions and Synergies
GATT General Agreement on Tariffs and Trade
GDP Gross Domestic Product
GFCF Gross Fixed Capital Formation
GHGs Green House Gases
GLM Generalised Linear Models
GMM Generalised Method of Moments
GNI Gross National Income
GOB Government of Bangladesh
HCR Headcount Rate
HDI Human Development Index
HIES Household Income and Expenditure Survey
ICTPs International Conventions and Treaties
IIP Industrial Investment Policy
IMF International Monetary Fund
ISO International Organisation for Standardisation
IVR Instrumental Variable Regression
LC
Letter of Credit
LDCs Least Developed Countries
LM Lagrange Multiplier
M&A Mergers and Acquisition
MDGs Millennium Development Goals
MENA Middle East and North African

xii
Abbreviation Meaning
MOF Ministry of Finance
MNCs Multinational Companies
MNEs Multinational Enterprises
MVA Manufacturing Value Added
NARDL Nonlinear Auto-Regressive Distributed Lag
NEMP National Environmental Management Plan
NEP National Environmental Policy
NGOs Non-Governmental Organisations
NILU Norwegian Institute for Air Research
NIP New Industrial Policy
NOx Nitrogen-oxides
NSDS National Sustainable Development Strategy
NTPA Bangladesh Export Processing Authority
OECD Organisation for Economic Co-operation and Development
OLS Ordinary Least Square
PaCT Partnership for Cleaner Textiles
PP Phillips-Perron
PPP Public-Private-Partnership
R&D Research and Development
REC Renewable Energy Consumption
RMGs Readymade Garments
SAF Structural Adjustment Facility
SAP Structural Adjustment Programme
SDGs Sustainable Development Goals
SO2 Sulphur dioxide
SREDA Sustainable and Renewable Energy Development Authority
TO Trade Openness
UCEM Unrestricted Error Correction Model
UN United Nations
UNCTAD United Nations Conference on Trade and Development
UNEP United Nations Environmental Programme
UNFCCC United Nations Framework Convention On Climate Change
UNIDO United Nations Industrial Development Organisation
USD US Dollar
xiii
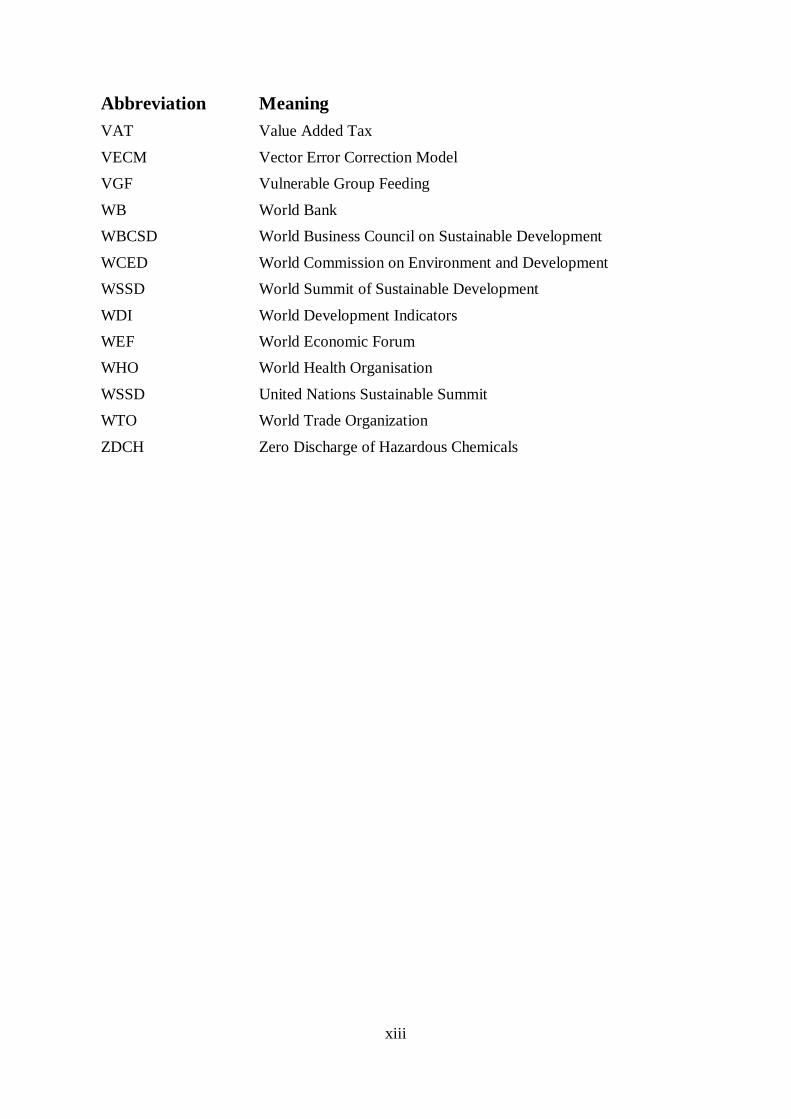
Abbreviation Meaning
VAT Value Added Tax
VECM Vector Error Correction Model
VGF Vulnerable Group Feeding
WB World Bank
WBCSD World Business Council on Sustainable Development
WCED World Commission on Environment and Development
WSSD World Summit of Sustainable Development
WDI World Development Indicators
WEF World Economic Forum
WHO World Health Organisation
WSSD United Nations Sustainable Summit
WTO World Trade Organization
ZDCH Zero Discharge of Hazardous Chemicals
xiv
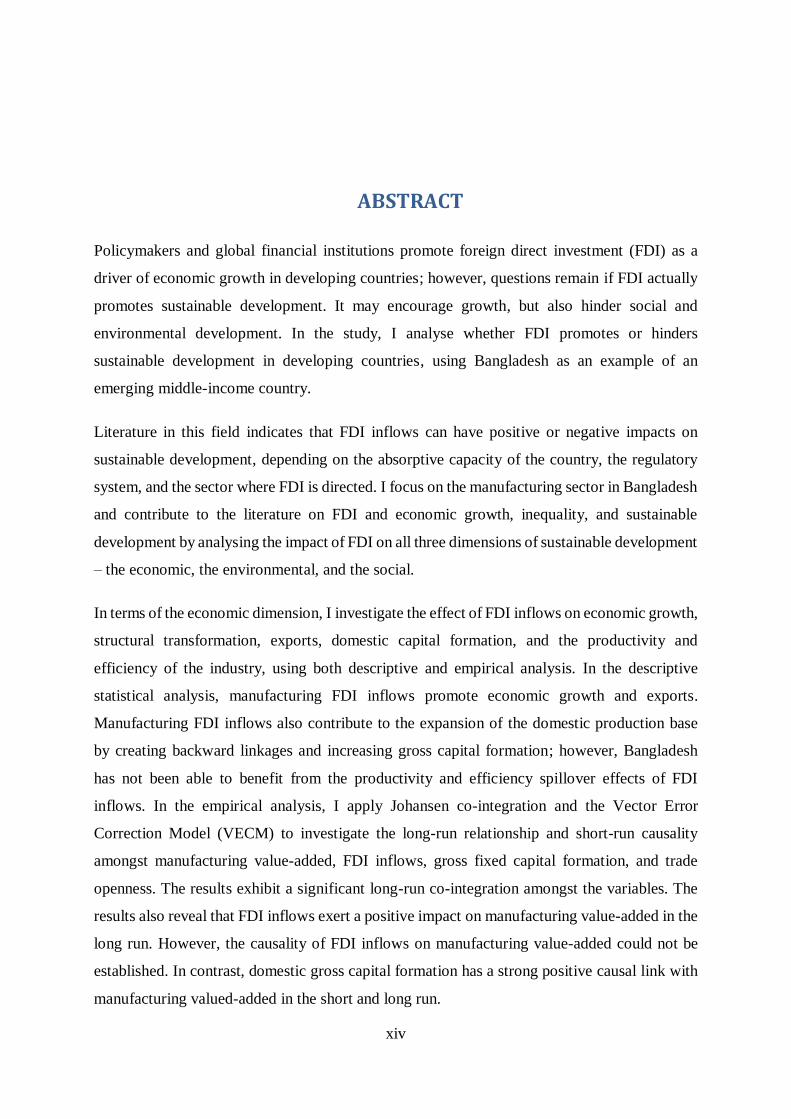
ABSTRACT
Policymakers and global financial institutions promote foreign direct investment (FDI) as a
driver of economic growth in developing countries; however, questions remain if FDI actually
promotes sustainable development. It may encourage growth, but also hinder social and
environmental development. In the study, I analyse whether FDI promotes or hinders
sustainable development in developing countries, using Bangladesh as an example of an
emerging middle-income country.
Literature in this field indicates that FDI inflows can have positive or negative impacts on
sustainable development, depending on the absorptive capacity of the country, the regulatory
system, and the sector where FDI is directed. I focus on the manufacturing sector in Bangladesh
and contribute to the literature on FDI and economic growth, inequality, and sustainable
development by analysing the impact of FDI on all three dimensions of sustainable development
– the economic, the environmental, and the social.
In terms of the economic dimension, I investigate the effect of FDI inflows on economic growth,
structural transformation, exports, domestic capital formation, and the productivity and
efficiency of the industry, using both descriptive and empirical analysis. In the descriptive
statistical analysis, manufacturing FDI inflows promote economic growth and exports.
Manufacturing FDI inflows also contribute to the expansion of the domestic production base
by creating backward linkages and increasing gross capital formation; however, Bangladesh
has not been able to benefit from the productivity and efficiency spillover effects of FDI
inflows. In the empirical analysis, I apply Johansen co-integration and the Vector Error
Correction Model (VECM) to investigate the long-run relationship and short-run causality
amongst manufacturing value-added, FDI inflows, gross fixed capital formation, and trade
openness. The results exhibit a significant long-run co-integration amongst the variables. The
results also reveal that FDI inflows exert a positive impact on manufacturing value-added in the
long run. However, the causality of FDI inflows on manufacturing value-added could not be
established. In contrast, domestic gross capital formation has a strong positive causal link with
manufacturing valued-added in the short and long run.
xv
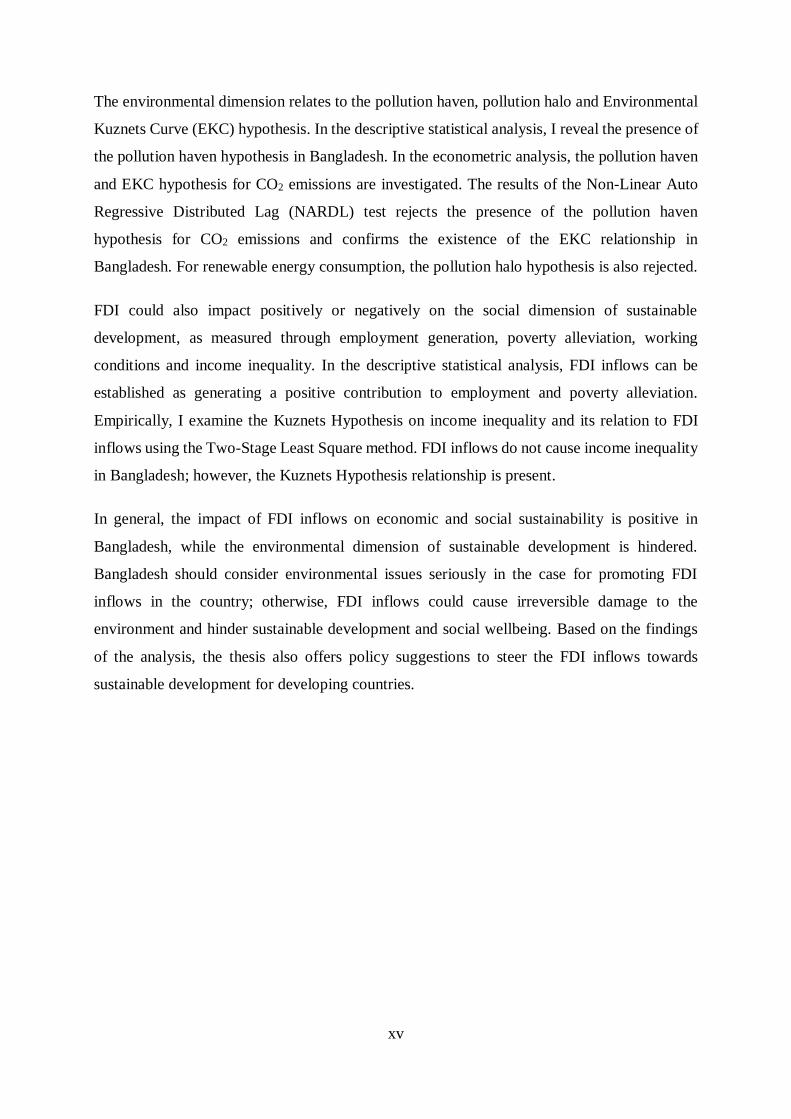
The environmental dimension relates to the pollution haven, pollution halo and Environmental
Kuznets Curve (EKC) hypothesis. In the descriptive statistical analysis, I reveal the presence of
the pollution haven hypothesis in Bangladesh. In the econometric analysis, the pollution haven
and EKC hypothesis for CO2 emissions are investigated. The results of the Non-Linear Auto
Regressive Distributed Lag (NARDL) test rejects the presence of the pollution haven
hypothesis for CO2 emissions and confirms the existence of the EKC relationship in
Bangladesh. For renewable energy consumption, the pollution halo hypothesis is also rejected.
FDI could also impact positively or negatively on the social dimension of sustainable
development, as measured through employment generation, poverty alleviation, working
conditions and income inequality. In the descriptive statistical analysis, FDI inflows can be
established as generating a positive contribution to employment and poverty alleviation.
Empirically, I examine the Kuznets Hypothesis on income inequality and its relation to FDI
inflows using the Two-Stage Least Square method. FDI inflows do not cause income inequality
in Bangladesh; however, the Kuznets Hypothesis relationship is present.
In general, the impact of FDI inflows on economic and social sustainability is positive in
Bangladesh, while the environmental dimension of sustainable development is hindered.
Bangladesh should consider environmental issues seriously in the case for promoting FDI
inflows in the country; otherwise, FDI inflows could cause irreversible damage to the
environment and hinder sustainable development and social wellbeing. Based on the findings
of the analysis, the thesis also offers policy suggestions to steer the FDI inflows towards
sustainable development for developing countries.

1
CHAPTER 1: INTRODUCTION
1.1 Background and motivation
As a part of the globalisation process, the world economy has experienced a massive surge of
foreign direct investment (FDI) inflows during the last three decades of the 21st century.
Developing countries' share in world FDI inflows increased over the same period. The last three
decades also witnessed some severe environmental and social challenges, such as global
warming, climate change, droughts/floods and extreme poverty. The environmental and social
challenges are more acute in developing countries, leading to a call for environmentally friendly
and inclusive development, as exemplified by the United Nations Sustainable Development
Goals (SDGs) (UNGA, 2015). World leaders are emphasising FDI in developing countries as a
way of achieving the SDGs (UNCTAD, 2017). However, the impact of FDI inflows on
sustainable development could be positive or negative, and the impacts could also be
dramatically different in different countries. In the study, I explore whether FDI promotes or
hinders sustainable development in an emerging middle-income developing country, taking
Bangladesh's manufacturing sector as the case study.
Since the beginning of the 1980s, globalisation has become one of the essential characteristics
of the world economy. Along with the various economic and trade liberalisation policies and
institutions, FDI inflows play a significant role in this globalisation process. Following the
export-oriented growth argument (Krueger, 1978; Lucas, 1988) and the success of the East
Asian tigers and South-East Asian countries, key leading policy institutions like the IMF and
the World Bank have advocated opening up economies to foreign investment in the belief that
production processes will be more efficient and competitive. As a result, global FDI inflows
increased eightfold from 1991 to 2001 and threefold from 2001 to 2011, with periodic
fluctuations (UNCTADSTAT, 2018). In total, world FDI inflows increased from USD154
billion in 1991 to USD 1357 billion in 2000 and reached to USD1891 billion in 2007. Since
2008 world FDI inflows have fluctuated around USD 1400 billion (UNCTADSTAT, 2018).
FDI inflows were mostly concentrated in developed countries; however, the average share of
world FDI in developing countries is increasing. In developing countries, the average world
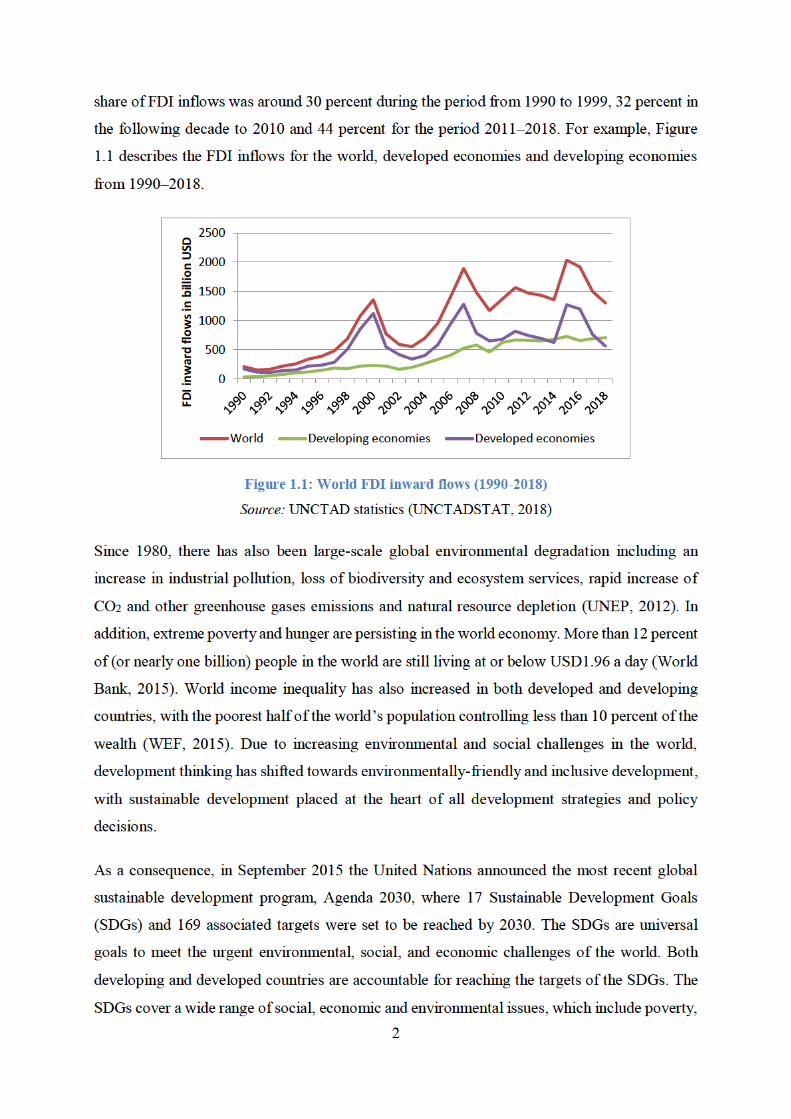
3
health, education, equality, water, sanitation, inclusive growth, decent working conditions,
industrialisation, innovation, energy use, urbanisation, climate change, and social justice. The
ambitious goals require considerable investment. UNCTAD (2014) estimated the investment
needs and current level of investment in key SDGs over the period 2015–2030: the total
investment needs in developing countries in key SDGs sectors are around USD 3.9 trillion. At
the current investment level, the investment gap is around USD 2.5 trillion per year. To meet
the gap, UNCTAD advocates mobilising FDI in developing countries and creating a favourable
environment for channelling more FDI to the SDG related sectors, such as education, health,
power, food, transport, industry and infrastructure.
However, FDI inflows may generate both negative and positive effects on the three dimensions
of sustainable development – the economic, the environmental and the social. FDI supplies the
capital to capital-scarce countries, which directly boosts the economic growth of the host
country. FDI inflows also channel advanced technology and management skills from developed
economies to developing economies, which increases the productivity and efficiency of the host
country. Therefore, FDI inflows directly and indirectly positively contribute to the host-country
economy. FDI inflows can also improve environmental conditions in a developing economy by
introducing ecologically-friendly technology and better environmental management systems in
the production process. Advanced technologies can require fewer inputs and energy and
generate less waste in the production system. FDI inflows can also contribute to employment
creation and, hence, social welfare in the host country. Employment generation provides income
and therefore contributes to reducing poverty and improving living standards. The corporate
social responsibility (CSR) activities by multinational enterprises (MNEs) can also positively
impact the social dimensions of sustainable development.
In contrast, FDI inflows could create a negative impact on the three dimensions of sustainable
development. The presence of foreign firms intensifies competition, which may force domestic
firms to leave the industry. Therefore, FDI inflows may adversely impact on the domestic
production base and sustainability of the host economy. In the case of the environment, instead
of promoting environmentally-friendly technology, FDI inflows may shift dirty or polluting
industries to the developing countries. As a result, environmental conditions in the host country
worsen due to the activities related to FDI inflows. In terms of the social dimension of
sustainable development, FDI inflows may increase inequalities by generating demand for
specific skilled labour and not other types of labour.
4
Moreover, the nature and degree of the impact of FDI inflows also depend on the absorptive
capacity and regulatory system of the host country. For instance, the transfer of advanced,
efficient technology is critical and desirable to gain positive benefits from FDI inflows.
However, if the host country does not have sufficient absorptive capacities, such as skilled
human resources and infrastructure facilities, advanced technology-based FDI will not be taking
place. Similarly, if the host country's regulatory system is weak, the natural and human
resources of the host country could be exploited. Case studies of different economies are
therefore needed to analyse the impacts of FDI inflows on sustainable development.
In the analysis, I have taken the Bangladesh manufacturing sector as a case study, as Bangladesh
is an emerging middle-income developing economy. In 2018, Bangladesh shifted from a low-
income economy to a lower-middle-income economy, and aspires to reach the level of an upper-
middle-income country by 2021 (World Bank, 2019). Bangladesh also has a strong commitment
towards achieving the targets of the SDGs and promoting FDI inflows through various
incentives.
The Bangladesh economy has passed through a number of reforms and refinements.
Immediately after independence in 1971, the Bangladesh government followed a socialist path
of development, nationalising most of the large and medium-scale industries and financial
institutions. As a result, more than 90 percent of industrial properties became government-
controlled entities (Nath, 2012). The government adopted an inward-looking, very rigid,
import-substituting industrialisation strategy. Foreign investment was restricted; only allowed
in a limited number of areas and forms (Salim, 2003). However, due to the poor performance
of state-owned enterprises, and conservative import-oriented trade policies, the performance of
the manufacturing sector was not satisfactory (GoB, 2015a).
The Bangladesh economy experienced an intensification of ‘outward-oriented’ economic
reforms from the late 1980s under the Structural Adjustment Program prescribed by the World
Bank, which includes liberalisation of financial and trade sectors, accelerating privatisation, as
well as fiscal and agricultural reform (Rahman, 1992). Bangladesh then opened up the economy
for foreign investment. The Foreign Private Investment Act (1980) was formulated for the
promotion and protection of foreign investors against nationalisation and expropriation. In
1989, Bangladesh set up a designated institution, the Board of Investment (BOI), to provide
complementary support and speed up foreign investment in the country.

5
One of the fundamental development strategies of the government is to transform the economy
from a low value-added agrarian economy to a high value-added industrial economy.
Considering the low resource, technology and production base of the country, pressure for job
creation for a growing labour force, and the increasing challenge of global competitiveness,
Bangladesh attempted to attract foreign direct investment to promote an export-oriented
manufacturing sector. The current Perspective Plan (2010-2021) and 7th Five-year Plan (2016-
2020) of the government recognise that export-led manufacturing growth is the driver of job
creation and sustainable development in the country1. The 7th Plan also suggests that FDI
inflows need to be increased to at least 3 percent of GDP to achieve the targeted growth rate.
However, at least until the late 1980s, FDI inflows in Bangladesh were very low and limited to
a few areas, mostly in the financial and banking sectors. FDI inflows in Bangladesh started to
increase gradually from 1996, due to supportive complementary policies. The establishment of
Export Processing Zones (EPZs) also stimulated FDI inflows. In 1996, net FDI inflow was USD
236 million and it had reached USD 1136 million in 2011, and USD 2151.56 million in 2017
(Bangladesh Bank, 2017). The FDI inflows are clustered in manufacturing, power, gas and
petroleum, trade and commerce, telecommunications, engineering, food and agriculture sectors
(Bangladesh Bank, 2017). The manufacturing sector has a major share (41 percent) of total FDI
inflows in 2017, which are mainly concentrated in textiles and wearing, chemicals and
pharmaceuticals, cement, fertiliser, and leather and footwear products. However, at 42 percent,
textiles and wearing have a major share of total manufacturing FDI in 2017 (Bangladesh Bank,
2017).
Along with the increased FDI inflows, the growth and export of the manufacturing sector also
increased, which contributed to economic growth (MOF, 2017). The average manufacturing
growth reached 7.2 percent during 1990–1999 and climbed to 10.4 percent during 2012–2016.
The manufactured export share in total exports was more than 95 percent in 2017 (MOF, 2017).
However, whether the FDI inflows drive the country towards sustainable development is a
different issue. Sustainable development is multi-dimensional and environmental protection
and social improvement must be considered, along with economic development. Further, the
economic dimension of sustainable development includes productivity, efficiency and capital
1The long-term development goals of the government of Bangladesh are outlined in the perspective plan. Based on the
development goals of the perspective plan, the government formulates medium-term (five- years) development plans and specifies the needed strategies and programs to achieve the targeted goals of the perspective plan (GOB, 2012; GOB 2015a).

6
formation along with the broader concept of economic growth. Environmental sustainability
includes resource use, pollution, waste generation, and energy savings within the production
process. The social aspects focus on inclusivity, justice and the equity of the development
process. Therefore, a comprehensive analysis covering all three dimensions of sustainable
development is required to assess the impact of FDI inflows on sustainable development of a
country. The existing research conducted on FDI inflows and sustainable development is
limited. Most of the existing literature discusses the three dimensions of sustainability in an
isolated way and the results are also inconclusive. In this study, I investigate the impact of FDI
inflows on all three dimensions of sustainable development in an integrated and systematic way.
1.2 Structure of the thesis
The thesis comprises eight chapters, including this introductory chapter, which describes the
background and motivation of the study. Chapter 2 explains the definitions, concepts and
various aspects of FDI inflows and sustainable development, which are used throughout the
thesis. Chapter 3 discusses the relevant theoretical and empirical literature. Based on the three
pillars of sustainable development, the discussion is broken into three main parts – FDI and its
impact on the economy; FDI and its impact on the environmental condition; and FDI and its
impact on social improvement. As sustainable development is an integrated and composite
concept, special attention has also been paid to the effects on FDI and overall sustainable
development. I also conduct empirical analysis in the thesis; therefore, the empirical literature
related to FDI and sustainable development is reviewed. Based on the findings of the review of
the literature, the research questions and methodology are developed.
In Chapter 4, I explore Research Question One, which focuses on the impact of manufacturing
FDI inflows on economic performance in Bangladesh. The chapter starts with a background
about the major economic reforms and performance of Bangladesh economy. The trend,
structure and relevant rules and regulations of FDI inflows are also discussed. Through
descriptive analysis, I examine the contribution of manufacturing FDI inflows to economic
growth, structural transformation, productivity and the efficiency of the manufacturing sector
of Bangladesh. The expansion of the domestic capital base is important for the economic
sustainability of a country. The literature suggests that FDI inflows can contribute to the
expansion of the domestic production base of the country by creating backward linkages in the
industry. Manufacturing FDI inflows concentrate in the readymade garments and textiles
industries; therefore, the backward linkages effect of FDI inflows on readymade garments and
7
textile industries in Bangladesh is also carried out. The structural transformation is one of the
fundamental development strategies of the country. With this backdrop, the empirical analysis
investigates the impact of FDI inflows on manufacturing value-added of the country.
In Chapter 5, I investigate Research Question Two, which focuses on the impact of
manufacturing FDI inflows on environmental sustainability in Bangladesh. At the outset, the
chapter provides an overview of the key environmental challenges, policies, laws and
implementation status in Bangladesh. The relationships between FDI inflows and
environmental sustainability are generally viewed via three popular hypotheses – pollution
haven, pollution halos, and the Environmental Kuznets Curve (EKC) hypotheses. Based on the
available statistics and information, the chapter investigates whether the pollution haven or
pollution halo hypothesis exists for manufacturing FDI inflows in Bangladesh. The chapter also
discusses the types of water pollution created by the textiles and readymade garments industries
in Bangladesh. The empirical analysis also investigates the existence of the pollution haven
hypothesis, pollution halo hypothesis and the Environmental Kuznets Curve (EKC) hypothesis
to discover the impact of FDI inflows on environmental sustainability in Bangladesh.
In Chapter 6, I explore Research Question Three, which focuses on the impact of manufacturing
FDI inflows on social improvement in Bangladesh. The chapter discusses the social conditions
of Bangladesh and examines the contribution of FDI inflows to the major social areas of
sustainable development in Bangladesh, such as poverty, human development, and decent
working conditions. As equity (or inclusiveness) is crucial to ensure the social justice of any
development, the study conducts an empirical analysis to examine the impact of FDI inflows
on income distribution in Bangladesh.
Chapter 7 unites the findings of Chapters 3, 4 and 5 to assess the overall impact of
manufacturing FDI on sustainable development in Bangladesh. The chapter also discusses the
prospects and challenges of FDI inflows towards achieving sustainable development goals in
Bangladesh. Sustainable development requires appropriate policy interventions. Based on the
findings of the analysis, I suggest policy interventions to steer the FDI inflows towards the
sustainable development of the country. Chapter 8 concludes the thesis, discusses the
limitations of the study and the directions for future research.
8
CHAPTER 2: SUSTAINABLE DEVELOPMENT AND FOREIGN
DIRECT INVESTMENT
2.1 Introduction
The study explores the impacts of FDI inflows on sustainable development in developing
countries. The topic comprises two core issues – sustainable development and FDI inflows. In
this chapter, I describe the concepts and different aspects of sustainable development and FDI
inflows. The concept of sustainable development evolved through a series of international
agreements and meetings (Stockholm Conference 1972 – Agenda 2030). The sustainable
development concept is also closely linked with the concept of sustainability. The concepts of
sustainability and sustainable development both require a balance between economic,
environmental and social dimensions of development. FDI inflows can impact on three
dimensions of sustainable development through its direct and indirect effects. However, the
impacts of FDI inflows vary on the type of the FDI inflows, absorptive strength and institutional
context of the host country and the corporate social responsibility (CSR) of MNEs. Therefore,
the various forms, types and nature of FDI inflows, the determining factors of FDI inflows are
briefly discussed. The nexus between FDI inflows and sustainability are also discussed in the
chapter.
2.2 Sustainable development (SD)
The concept of sustainable development is a complex issue, which has passed through different
phases. In its early phase, sustainable development mainly focused on the environmental
aspects of economic development. Later, along with economic and environmental issues, social
aspects also had priority in the concept of sustainable development. However, the three
dimensions of sustainable development – the economic, environmental and social dimensions
are interrelated, and intergenerational equity lies at the heart of the concept of sustainable
development.

9
The concept of sustainable development emerged through a series of global conferences,
conventions and treaties between 1972 and 1992. At the global scale, the UN Conference of
Human Environment was held in Stockholm in 1972, and addressed the need for sustainable
development for the first time. The Conference generated recommendations and called for
undertaking initiatives at all levels to protect and improve the environment for the prosperity of
the people and the planet. The Stockholm conference called for the founding of the United
Nations Environmental Program (UNEP). UNEP is the key organisation which establishes
world environmental protection agendas to coherently promote environmental sustainability
initiatives. In 1980, the World Conservation Strategy introduced a guideline on sustainable
development and identified key issues for environmental protection. The guideline generated
policies to promote sustainable development. The United Nations also initiated an independent
commission to prevent the deterioration of human and natural resources. In 1983, the UN
convened the World Commission on Environment and Development (WCED), better known as
the Brundtland Commission, which comprised representatives from developing and developed
countries.
In 1987, the WCED published Our Common Future or The Brundtland Report2. The Brundtland
Report provides the most cited and popular definition of the concept of sustainable
development:
“Sustainable development is development that meets the needs of the present
without compromising the ability of future generations to meet their own needs. It
contains within it two key concepts:
the concept of 'needs', in particular the essential needs of the world's
poor, to which overriding priority should be given; and
the idea of limitations imposed by the state of technology and social
organization on the environment's ability to meet present and future
needs” (WCED, 1987, p. 41).
The Commission recognised the environmental impact of economic activities and paid attention
to gender equality, poverty and wealth distribution in formulating development strategies. The
Brundtland Report also focused on food security, biodiversity, energy use, industry, population
growth and human settlements. The report embraced the idea of inter-generational equity of
sustainable development by mentioning the needs for the present and future.
2 Our Common Future has become known as the Brundtland Report in recognition of former Norwegian Prime Minister Gro
Harlem Brundtland's role as Chair of the World Commission on Environment and Development (WCED).
10
After twenty years of Stockholm Conferences, the Rio Earth Summit was convened in 1992.
The summit provided three frameworks to guide future development activities – Agenda 21,
the Rio Declaration, and the Statement of Forest Principles. Subsequently, many world summits
and conferences were held on a regular basis, including the Earth Summit (1995), the World
Summit of Sustainable Development (WSSD) (2002) and the Sustainable Development
Conference of the United Nations (2012). The 2012 Sustainable Conference is also known as
Earth Summit (2012) or Rio plus 20 Summit. The United Nations also organised the Sustainable
Summit, in 2015.
The conferences and summits reviewed the implementation progress of the previous action
plans. The WSSD recognised that globalisation provides opportunities, as well as adding new
types of challenges, for sustainable development efforts. The WSSD emphasised the role of the
private sector to promote equitable societies and communities. The Earth Summit called for
environmentally-friendly economic development and a reduction in worldwide poverty levels.
The Earth Summit 2012 prepared a non-obligatory document The Future We Want, which
largely reaffirms the earlier action plans and provides the basis for formulating the Sustainable
Development Goals (SDGs).
The Earth Summit 2012 or Rio+20 document recognises the three dimensions of sustainable
development, and defines sustainable development as:
Sustainable development aims to ensure the promotion of an economically, socially
and environmentally sustainable future for the planet and for present and future
generations (UN, 2013, p. 3).
The summit emphasised the integration of the three aspects of sustainable development,
especially adopting a holistic approach for the advancement of sustainable development.
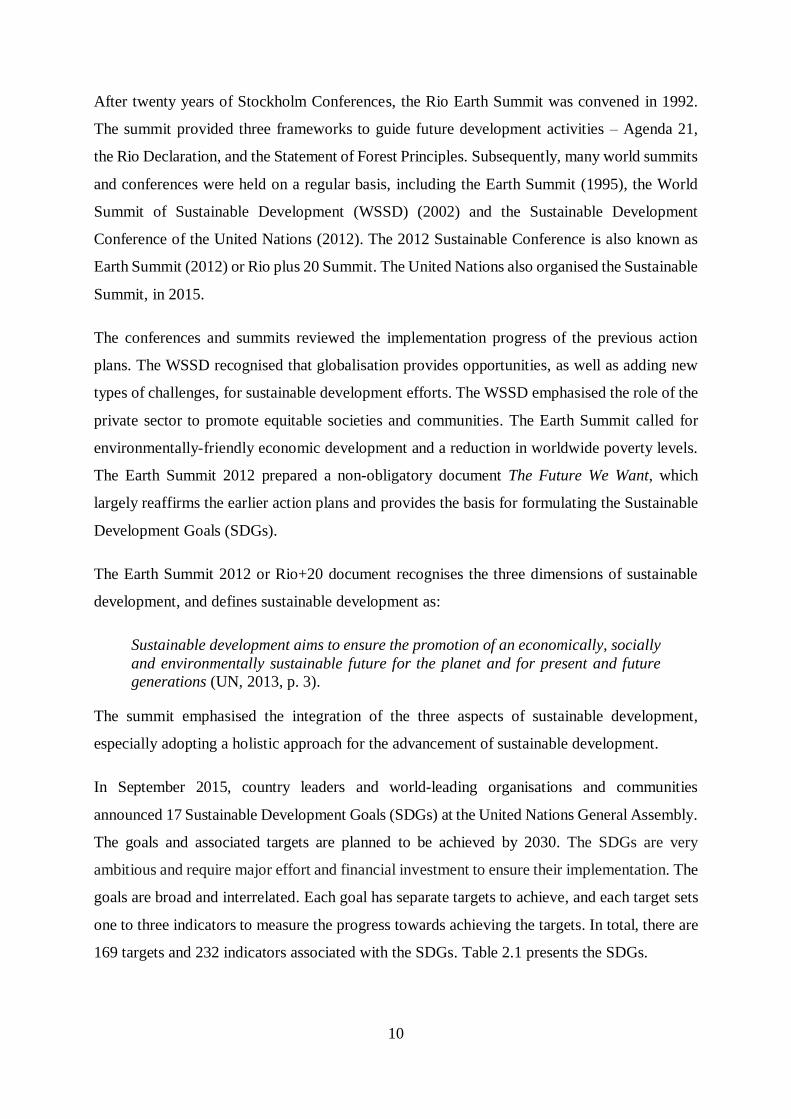
In September 2015, country leaders and world-leading organisations and communities
announced 17 Sustainable Development Goals (SDGs) at the United Nations General Assembly.
The goals and associated targets are planned to be achieved by 2030. The SDGs are very
ambitious and require major effort and financial investment to ensure their implementation. The
goals are broad and interrelated. Each goal has separate targets to achieve, and each target sets
one to three indicators to measure the progress towards achieving the targets. In total, there are
169 targets and 232 indicators associated with the SDGs. Table 2.1 presents the SDGs.

14
maintaining constant per capita consumption of capital stock over the period, is the necessary
condition of both weak and strong sustainability theory (Hartwick, 1977; Solow, 1974; Solow,
1986; Costanza 1991b; O’Connor, 2000). The fundamental difference between the concepts of
weak and strong sustainability is the degree of elasticity of substitution between natural and
physical capital. The weak sustainability supporters allow perfect substitution among the
physical capital stock and natural capital stock; in comparison, the supporters of strong
sustainability do not believe in perfect substitutability among different capital stocks (Hartwick,
1977; Solow, 1974; Solow, 1986). The supporters of strong sustainability argue that natural
capital stock cannot be substituted by physical capital stock, and it should be kept unchanged
(Costanza, 1991b; Daly, 1991; O’Connor, 2000). However, both the paradigms endorse the
need for the rational distribution of resources and facilities, between the present and future
generations; that is, establishing intergenerational equity.
Weak sustainability assumes a perfect elasticity of substitution among physical and natural
capital stock. The neoclassical growth models consider capital accumulation to be the engine
of economic growth. By including the non-renewable resources as an input of production, the
neoclassical growth models provide the framework of sustainability (Hartwick, 1977; Solow,
1974; Solow, 1986). Solow (1974), in a seminal paper, explains the concept of intergenerational
equity, with the Rawlsian ethical framework. To maintain intergenerational equity the per capita
consumption needs to be constant over time. Solow (1974) allows a given degree of
substitutability between physical capital and natural capital. He claims that the accumulation of
human capital (such as education, skills, knowledge) could replace the loss of natural resources
generated from economic activities: as a result, per capita consumption will remain constant
over time.
Hartwick (1977) provides sufficient conditions for constant per capita consumption. He notes
that all the rents earned from the exhaustible resources need to be reinvested to get a constant
consumption path, or to offset the declining stock of the non-renewable resources. The
reinvestment conditions of sustainability, also known as Hartwick's rule suggests that investing
all net returns (rents) from the use of exhaustible resources in reproducible capital implies
intergenerational equity (Hartwick 1977, pp. 973-4).
15
As per Hartwick's rule for sustainability, a mechanism needs to be established for ensuring the
reinvestment of the rents received from exhaustible resources to increase the level of physical
capital. Pearce and Atkinson (1993) and Hamilton (1994) contributed to the Hartwick rule by
introducing the methodology for measuring net investment of natural and man-made capital and
introduce the model of Genuine Savings. Genuine Savings estimates the monetary value of the
change of natural and man-made capital.
Weak sustainability allows some degree of natural destruction and acknowledges that the loss
of natural resources can be compensated by the gain of physical capital. In contrast, strong
sustainability emphasises the maintenance of ecological systems or critical life-supporting
elements, in at best their original form, to achieve sustainability (Faucheux and O’Connor,
1999).
The weak and strong sustainability approaches have little to say on the social dimensions of
sustainability. Both approaches consider that societies and their needs are homogeneous but
achieving sustainable development is not possible without the establishment of coherence
between and within societies. Therefore, in addition to natural and physical capital,
contemporary economists include the maintenance of social capital as a crucial factor for
sustainability (Dasgupta and Serageldin, 1999).
Social capital preserves and maintains social networks and relationships, and plays a
complementary role with physical and natural capital stock. Serageldin (1996) notes that social
capital works like ‘sticky tape as it connects different communities of society. Dasgupta and
Serageldin (1999) observe that social capital requires maintaining the operation of a coherent
social system. They also note that without the coherence between societies, the whole system
would breakdown, and there would be little relevance for the concept of welfare.
Within the social capital stock of sustainability, economist such as Sen (1989) and Anand and
Sen (1994) focus on reducing the prevailing inequality and deprivation of the poor communities
and suggest the need to improve human capital stock to achieve sustainability. They argued that
both weak and strong sustainability overlook the deprivation of the less privileged people of
today. Ignoring the deprivation of today’s generation implies that the prevention of the future
generation’s deprived people is not possible. Therefore, they focus on the development of the
individual’s capability or enhancement of the substantive freedom of choice (such as the ability
to choose the options of living), particularly for deprived people. They suggest that sustainable
16
human development is the key to sustainability more generally. The improvement in the human
development of the poor or deprived communities, such as through improved health, education
and nutrition, enhances the capability of the present gneration and it also enhances the capability
or substantive freedom of the future generations. For example, Anand and Sen (2000, p 2000)
noted that: “Human development directly enhances the capability of people to lead worthwhile
lives, so there are immediate gains in what is ultimately important, while safeguarding similar
opportunities in the future.”
The question regarding how sustainability can be measured also generates debate among
scholars. The 'genuine savings' approach proposed by Hamilton and Hartwick measures all the
changes of capital stock, both physical and natural in monetary terms (Hamilton, 1994;
Hartwick, 1977). However, it is not possible to calculate the losses of many natural resources
in monetary terms. In addition, the different dimensions and elements of sustainable
development also have spatial characteristics. The incidence and the scale of impacts differ
between countries and regions, and the needs and priorities are also varied by region. For
example, the global food demand might be fulfilled by global food production but it cannot
meet the food scarcities of many poor countries (Dasgupta et al., 2000a). Therefore, sustainable
development planning should consider the global, as well as local, constraints and needs.
Whatever the definition of sustainability, good institutional mechanism or governance is crucial
for sustainable development. As per the proponents of weak sustainability, all rent gained from
the exhaustible resources needs to be reinvested to replace the loss of the stock of natural capital.
Without strong governance, the redistribution of rent is not possible. The maintaining of a
constant level of critical natural capital stock, which is crucial for strong sustainability also
requires proper regulations and governance. Therefore, as future generations do not yet exist,
without strong governance, sustainability is impossible to ensure.
Global leaders and policymakers such as UNCTAD, World Bank, IMF are encouraging FDI as
a channel for promoting sustainable development in developing countries; however, there is no
direct theory which can explain the impact of FDI on sustainability or sustainable development.
Both the weak and strong sustainability theories are based on the conditions of non-declining
capital stock over the period. FDI supplies physical capital to the capital-scarce country. FDI
inflows can increase the stock of human capital through training, research and innovation, and
thus contribute to achieving the necessary conditions of weak sustainability. FDI can even help
to retain or protect natural resources stock by introducing and promoting energy savings and
17
waste reduction technology to the host country. Therefore, FDI inflows could be a potential
channel for achieving the necessary conditions of the weak or even strong sustainability.
However, the impact of FDI on sustainable development depends on the institutional
arrangement, absorptive strength of the host economy, type of FDI and the sector where FDI is
directed. For instance, if FDI inflows are the 'natural resource seeking' type, it will deplete the
natural capital stock and strong sustainability cannot be achieved. Again, if the institution and
governance are corrupt or inept and rent from the exhaustible resources is not reinvested entirely
for the improvement of physical capital, then even weak sustainability cannot be achieved. In
contrast, FDI inflows can impact on weak sustainability if it contributes to the productive base
of the host country.
Dasgupta (2007) measures sustainable development by the movements of the social and
economic productive base of the country. Institutions and capital assets (both physical and
natural) are included in the concept of the economic productive base. The social-productive
base considers wealth distribution. The presence and activities of FDI inflows may increase
demand for the outputs of other sectors. Therefore, the domestic investment will be stimulated
or the production base of the host country will expand, and thus FDI contributes to weak
sustainability.
On the other hand, the presence and activities of FDI inflows may increase competition between
firms. Increased competition may force domestic firms to exit the industry, and thus FDI
contributes to a decline of the productive base of the host country. In this scenario, FDI would
not meet the necessary conditions for weak sustainability.
2.3 Foreign Direct Investment (FDI)
In general, Foreign Direct Investment (FDI) inflows can be defined as a long term investment
or establishment of a business or production plant by a private company or business entity, from
one country to another country. An investor should have a degree of control over their business
to qualify as FDI. According to the Balance of Payment Manual of the International Monetary
Fund, at least 10 percent of equity ownership is needed to have effective control over the
management of the business (IMF, 1993). Keeping consistency with the definition of the IMF,
the third edition of the OECD Benchmark Definition provides the formal definition of FDI:
18
“Foreign direct investment reflects the objective of obtaining a lasting interest by
a resident entity in one economy (‘direct investor’) in an entity resident in an
economy other than that of the investor (‘‘direct investment enterprise’’). The
lasting interest implies the existence of a long-term relationship between the direct
investor and the enterprise and a significant degree of influence on the management
of the enterprise” (OECD, 1996, p. 7).
The benchmark definition of the OECD recommends that foreign investors must own 10 percent
or more of the ordinary shares or voting power of an incorporated enterprise or the equivalent
of an unincorporated enterprise to have a significant degree of influence on the management of
the enterprise. Incorporated enterprises are subsidiaries or associate companies and an
unincorporated enterprises are branches of a company.
FDI flows usually comprise three basic components: equity financing, reinvestment of earnings
and debt transaction within the company. Equity financing relates to the share ownership.
Through equity financing, a company raises capital by selling the company’s stock, and in
return, the company gives a certain percentage of ownership to the investor. Reinvested
earnings refers to the undistributed profits earned by overseas subsidiaries; the subsidiaries keep
and reinvest profits. Debt transactions within the company refers to the borrowing and lending
arrangement between parents and its affiliates (OECD, 1996).
FDI can be classified into different categories and types based on the nature, motive and
production process of the investments. Foreign Direct Investment can be an inflow or outflow.
FDI inflows occur when a non-resident or overseas company invests in the reporting country.
FDI outflows occur when residents or a company of the reporting country invest in an external
economy. FDI is usually channelled or directed through multinational enterprises (MNEs) with
multinational companies naturally establishing their plants and operations in more than one
country (Caves, 1996).
FDI inflows can take place as ‘greenfield investment’ or ‘merger and acquisition investment’.
In the case of greenfield investment, MNEs establish new plants or businesses in the host
country. In the case of mergers and acquisition or ‘brownfield investment’, MNEs purchase
existing business or plants from local investors.
Depending on the motive of the investors, Dunning and Lundan (2008) classify FDI inflows
into four groups: resource-seeking; market-seeking, efficiency-seeking; and strategic-asset-
seeking FDI. Resource-seeking FDI inflows aim to get access to and extract the natural
resources (such as minerals, abundant workforce, or land) of the host country. Resource-seeking

19
FDI usually takes place when the host countries have a lack of required capital and technical
expertise to extract, utilise and market the natural and mineral resources. Market seeking FDI
seeks access to the host country’s market. . Establishment of a plant in the host country provides
an opportunity to market the products directly to the consumers and thus, investors are able to
reduce the transportation, tariff and trade-related costs of marketing the product from the home
country. Efficiency-seeking FDI intends to locate in a country with skilled human resources,
and technological and physical infrastructure with the aim of reducing their production costs
through enhancing productivity. The motive of the strategic-asset-seeking FDI is to increase the
global competitiveness and physical assets of the company. By acquiring the strategic assets of
foreign enterprises (such as brands and networks), a company can promote and strengthen their
global competitiveness.
Based on the concept of a supply chain of production, FDI inflows are also classified as
‘horizontal FDI’ or ‘vertical FDI’(Görg and Greenaway, 2004). In the case of horizontal FDI
inflows, foreign-owned firms produce the same product and apply a similar type of production
technique as practiced in the host country. Horizontal FDI is common in the manufacturing
sector. Vertical FDI fragments its production cycle and establishes plants in different locations,
based on comparative advantages, with different countries having distinct cost advantages
(Beugelsdijk et al., 2008). For example, some raw materials could be non-tradeable, or
transportation costs might be very high. In this case, the firm shifts part of the production
process to another country. The geographic specialisation offers cost advantages in different
countries and for different products.
The literature emphasises the indirect or spillover effects of FDI inflows for assessing the
impact of FDI inflows on economic development (Aitken and Harrison, 1999 ; Blomström et
al., 2001; Smarzynska Javorcik, 2004). The spillover effects generally refer to the positive
external benefits created by the presence of foreign firms and their activities. Positive
externalities generate through knowledge transmission. MNEs usually have some ownership-
specific advantages of access to advanced technologies, patents and management and marketing
skills (Blomström et al., 2001; Smarzynska Javorcik, 2004). When MNEs enter theforeign
market through FDI, it is expected that MNEs will transfer advanced technology and knowledge
to their affiliates. The transmitted knowledge and technology may diffuse to other locally-
owned firms in the host country.
20
FDI inflows can also create 'crowding in' or 'crowding out' effects on the domestic investment
base of the host country (Gallagher and Zarsky, 2004). The 'crowding in' effect refers to the
presence and activities of MNEs helping to expand domestic industries or stimulate domestic
investment in the industry. On the other hand, the 'crowding out' effect implies that the presence
and activities of FDI can displace domestic firms or force them to quit the market due to
increased competition.
The extent to which FDI contributes to the host country economy also depends on two types of
linkages: backward linkages and forward linkages. The activities of foreign firms generate
demands for intermediate goods and upstream industries are expected to expand in the host
country through the backward linkages. Similarly, if MNEs help to expand the downstream
industries, or the sector related to the downstream production stages, then forward linkages
happen (Smarzynska Javorcik, 2004).
The institutional contexts of the host economy and the MNEs are also crucial for analysing the
impacts of FDI. Developing countries offer various incentives and undertake reform initiatives
to attract FDI inflows. The countries sometimes compete with each other to attract FDI inflows.
However, there are various other determining factors contributing to attracting FDI in a
particular country. Some factors are related to the internal issues of firms/investors, which
explain why a firm will invest abroad, such as cost reduction, economies of scale. Some factors
are related to the host country’s situation, such as resource availability, market size, and
business environment. The following part of this section discusses the various determining
factors of FDI inflows.
2.4 Determinants of FDI inflows
In the literature on the determinants of FDI inflows, the most popular theory is Dunning’s
‘Eclectic Paradigm’ or OLI (which stands for ownership, location, internalisation) approach
(Dunning, 1988, Dunning, 2001). The OLI approach describes the ownership advantages of
firms, locational advantages of the host country and internalisation or hierarchical governance
advantages for FDI inflows (Dunning, 2000).
The ownership advantages refer to market power and competitive advantages of the foreign
firms over local industries, such as product patents, product and production process, copyrights,
and ‘business/trade secrets’. ‘Location’ advantages refer to the geographical advantages of the
host country in establishing plants such as resource endowment, cultural, legal, political,
21
institutional and market structure of the host countries, or distribution and transaction cost
advantages. The internalisation advantages occur due to the diverse profit opportunities of
different forms of investment. Firms may operate directly or indirectly in a host country and
they can possess the business or authorise other firms or they could establish a joint venture. In
each case, the firm chooses the most profitable option and gains from the diversity of these
options relative to expanding in their home market.
The OLI Approach of Dunning considers both micro- and macro-aspects of FDI inflows.
Factors underlying ownership and internalisation advantages are micro-issues. Within
Dunning's framework, market size, trade openness, input cost, macro-economic stability, credit
rating, physical and financial infrastructure are critical macro-economic determinants of FDI
inflows (Nocke and Yeaple, 2007).
UNCTAD (1998), in the World Investment Report, classified the host country's determinants
of FDI inflows into three broad categories: policy frameworks, business facilitation and
economic factors. In the case of the policy framework, the political, economic and social
stability, level of globalisation, trade liberalisation, privatisation, rules and regulations of the
host country are specified as the core elements of determining FDI inflows. In the case of
business facilitation factors, the business environment, rule of law, trade agreements and treaties
are core determining factors for FDI inflows. Economic determinants for FDI inflow include
market size, natural resource endowments, technological advancement, and physical
infrastructure.
Based on an UNCTAD (1998) classification, the determinants of FDI inflows are classified in
Figure 2.2.
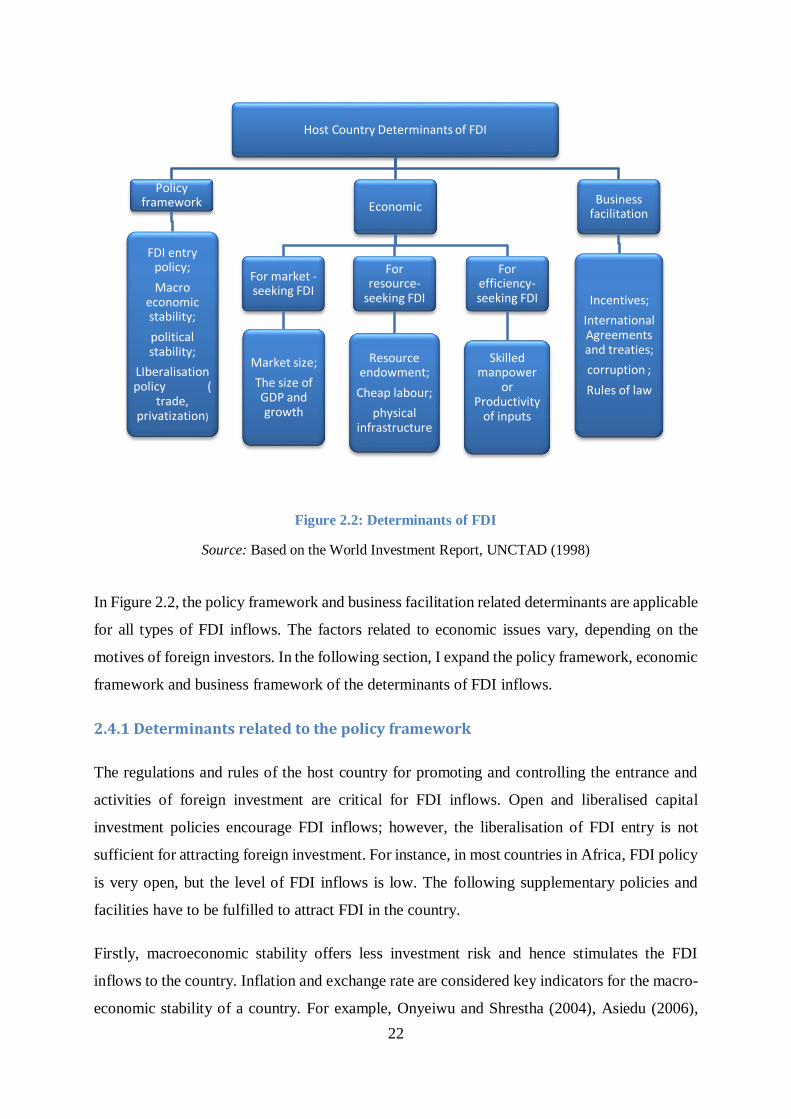
22
Figure 2.2: Determinants of FDI
Source: Based on the World Investment Report, UNCTAD (1998)
In Figure 2.2, the policy framework and business facilitation related determinants are applicable
for all types of FDI inflows. The factors related to economic issues vary, depending on the
motives of foreign investors. In the following section, I expand the policy framework, economic
framework and business framework of the determinants of FDI inflows.
2.4.1 Determinants related to the policy framework
The regulations and rules of the host country for promoting and controlling the entrance and
activities of foreign investment are critical for FDI inflows. Open and liberalised capital
investment policies encourage FDI inflows; however, the liberalisation of FDI entry is not
sufficient for attracting foreign investment. For instance, in most countries in Africa, FDI policy
is very open, but the level of FDI inflows is low. The following supplementary policies and
facilities have to be fulfilled to attract FDI in the country.
Firstly, macroeconomic stability offers less investment risk and hence stimulates the FDI
inflows to the country. Inflation and exchange rate are considered key indicators for the macro-
economic stability of a country. For example, Onyeiwu and Shrestha (2004), Asiedu (2006),
Host Country Determinants of FDI
Policy framework
FDI entry policy;
Macro economic stability;
political stability;
LIberalisation policy (
trade, privatization)
Economic
For market -seeking FDI
Market size;
The size of GDP and growth
For resource-
seeking FDI
Resource endowment;
Cheap labour;
physical infrastructure
For efficiency-seeking FDI
Skilled manpower
or Productivity
of inputs
Business facilitation
Incentives;
International Agreements and treaties;
corruption ;
Rules of law
23
Sekkat and Veganzones‐Varoudakis (2007), and Hailu (2010) found a negative association
between FDI flows and the level of inflation in African countries. Schneider and Frey (1985),
Faeth (2009) also show that inflation is negatively related to FDI inflows. On the other hand,
Mhlanga et al. (2010) (in terms of South African countries) and Vijayakumar et al. (2010) (for
BRIC3 economies) discovered that inflation is an insignificant determinant of FDI inflows.
Kandiero and Chitiga (2006) investigated the association between FDI inflows and the real
exchange rate for 38 African countries and found an inverse relationship between FDI inflows
and real exchange rate appreciation. Kyereboah-Coleman and Agyire-Tettey (2008)
investigated how exchange rate volatility influenced FDI inflows into Ghana; finding that
exchange rates significantly influenced the FDI inflows in Ghana and that the volatility of the
exchange rate exerts a negative impact on FDI inflows.
Secondly, a country’s political stability is crucial for a favourable business environment.
Political stability offers confidence in investment and promotes economic growth; and hence,
political stability stimulates FDI inflows into the host countries. However, the empirical
relationship between political instability and FDI flows is not unanimous. Harinder and Jun
(1995), Wheeler and Mody (1992) found that political risk did not exert any significant impact
on FDI inflows. Jaspersen et al. (2000) and Hausmann and Fernandez-Arias (2000) also failed
to discover any significant relationship between political stability and FDI inflows. However,
Root and Ahmed (1979), Schneider and Frey (1985), Tuman and Emmert (2004) observed that
political instability, such as riots and change of the government, generate a strong negative
impact on FDI inflows in the developing country. Schneider and Frey (1985) also revealed that
political risks related to the bureaucratic procedure, government regimes, administration delay,
and property ownership laws profoundly influenced the investment decision of MNEs. Bartels
et al. (2009) found a strong association between political factors and FDI inflows for African
countries. Zheng (2009) also found political risk as a significant determining factor of FDI for
China and India and Busse and Hefeker (2007) discovered that political disruption related to
ethnic conflicts and the bureaucratic procedure made a significant impact on FDI inflows in
Africa.
3 Goldman Sachs economists defined the BRIC economies as Brazil, Russia, India, China in 2003. It is speculated that, by
2050, these four economies will be the most dominant. Further, BRICS is an acronym for the combined economies of Brazil,
Russia, India, China and South Africa.
24
Thirdly, the liberalisation of national policy, especially privatisation in the industrial policy,
unleashes the potential of FDI inflows. At the same time, a liberalised trade regime is considered
a significant determinant of FDI inflows, as FDI inflows are usually export-oriented. Higher
trade restrictions imply higher transaction costs for exports and trade restrictions make
intermediate goods expensive. Moreover, trade liberalisation leads to a better business climate
and opens up the window for growth prospects (Jordaan, 2005). Ramasamy and Yeung (2010)
note that efficiency-seeking FDIs are usually interested in moving business to open liberalised
economies. Dumciuviene and Paleviciene (2017), Chakrabarti (2001), Asiedu (2006), Cleeve
(2008) and Mhlanga et al., (2010) found a strong positive significant relationship between trade
openness and FDI inflows. However, liberalisation does not necessarily increase FDI inflows.
Schmitz and Bieri (1972) found a weak correlation with openness and FDI flows and
Vijayakumar et al. (2010) also found trade openness as an insignificant determinant for FDI
inflows.
2.4.2 Determinants related to the economic factors
Market size is found to be the most robust FDI determinant in econometric studies. It is
particularly important for horizontal and market seeking FDI. FDI inflows usually search for
large and growing markets, with higher purchasing power. A large market also offers a high
return on capital (Jordaan, 2005). In a recent panel data analysis for EU countries, Dumciuviene
and Paleviciene (2017) found a strong positive impact of market size on inward FDI inflows.
In a cross-country study, O'Meara (2015) identified market size and the degree of economic
activity in the host country as the prime determining factors of FDI inflows. Chakrabarti (2001)
argues that big market size offers benefits of economies of scale in the production and marketing
and also promotes the efficient utilisation of resources. Vijayakumar et al. (2010), Ang (2008),
Cleeve (2008), Asiedu (2006), Schneider and Frey (1985), Tsai (1994), and Pärletun (2008)
also found a strong positive association between market size and FDI inflows of the host
country. However, Holland and Pain (1998) and Asiedu (2002) found that market size did not
exert any significant impact on FDI inflows and Laabas and Abdmoulah (2009) also found a
negative association between FDI inflows and market size.
The size of GDP and growth rate is considered an important determining factor for the market
seeking FDI. The growth trend indicates the level and prospects for the economic development
of a country indicates domestic market opportunities for investors. Johnson (2006) argues that
the growth potential of the host country attracts high FDI inflows and increases the confidence
25
of MNEs. Mohamed and Sidiropoulos (2010) studied 12 MENA4 and 24 developing countries,
Schneider and Frey (1985) 80 developing countries, Cleeve (2008) 16 Sub-Saharan African
countries, and Mhlanga et al. (2010) Southern African countries: collectively, they found that
there was a positive relationship between GDP growth and FDI inflow. However, Vijayakumar
et al. (2010) did not find any significant impact of GDP size on FDI inflows for BRIC countries.
The endowment of natural resources is desirable for resource-seeking FDI inflows. Using panel
data over the period from 1984 to 2000 for 22 African countries, Asiedu (2006) shows that
natural resource endowment is a significant determinant of FDI inflows for African countries.
In an OECD working paper, Houde and Lee (2000) note that the endowment of natural
resources such as energy reserves (coal, oil), land, iron and other minerals played a significant
role in attracting FDI in China. Onyeiwu and Shrestha (2004) also found the availability of
natural resources is a significant determinant of FDI inflows. Mohamed and Sidiropoulos
(2010), using panel data of 36 countries, found that natural resources played a vital role in FDI
inflows for MENA countries.
Low labour costs could be a determining factor for resource seeking FDI inflows, particularly
for labour-intensive industries. This argument is confirmed by the studies by Schneider and
Frey (1985) of 80 developing countries, and Vijayakumar et al. (2010) for BRIC countries.
However, Botrić and Škuflić (2006) found that low wages reduced FDI inflows for seven South
East European countries. The possible cause for the negative relationship is that in the South
East Asian countries the non-tradeable sectors are the major recipients of FDI and non-tradeable
sectors require a highly skilled workforce. Therefore, investors place importance on the quality
of the workforce rather than the wage level. Biswas (2002) failed to reach a conclusive result
between the wage level and FDI inflows in a panel estimation of 44 countries. Biswas' (2002)
study particularly investigates the determinants of the United States FDI. Investors in the United
States might give priority to other factors such as political stability and the availability of natural
resources rather that the wage level.
4 The acronym MENA refers to the Middle East and North Africa region; it covers an extensive region stretching from
Morocco to Iran, including all Mashriq and Maghreb countries.
26
Well-developed physical infrastructure provides a positive investment environment and reduces
the cost of setting up production units, thus encouraging FDI inflows to the country (Wheeler
and Mody, 1992). Faruk (2015), Mhlanga et al. (2010) and Sridharan and Rao (2010), Asiedu
(2006), Kok and Acikgoz Ersoy (2009), and Dupasquier and Osakwe (2006) found
infrastructure is a significant factor for attracting FDI inflow. UNCTAD (2008) and Woodward
and Rolfe (1993) note that well-developed infrastructure is particularly important in attracting
export-oriented and manufacturing FDI. Hobday (1994) says that multinationals establish their
business in Singapore due to the well-developed transportation and communications facilities.
However, Onyeiwu and Shrestha (2004) and Asiedu (2002) discovered that infrastructure did
not exert any significant influence in attracting FDI. Both studies, Onyeiwu and Shrestha (2004)
and Asiedu (2002) investigate the determinants of FDI inflows for African Countries. The FDI
inflows to African countries are natural resource based, concentrated on the extractive
industries. Therefore, infrastructure might not be a major factor for investors.
Human capital, or a skilled workforce, and productivity of inputs are considered critical
determining factors for efficiency-seeking FDI. Economies which have a high quality of human
capital and low wage rates are expected to attract higher FDI. Noorbakhsh et al. (2001) reveal
that skilled human capital is a significant determinant for FDI inflows for high value-added
industries. They argue that education promotes productivity and facilitates technological
advancement. Rodriguez and Pallas (2008) also found that labour productivity is an important
determinant of FDI inflows in Spain.
2.4.3 Determinants related to the business facilitation
Various fiscal and non-fiscal incentives offered by the host country (such as tax exemption,
subsidised infrastructure and repatriation of profit facilities), bilateral and international trade
agreements, as well as the institutional and governance system of the host country (such as rule
of law, administrative efficiency) are essential business facilitation-related determinants.
Developing countries usually offer various fiscal and non-fiscal incentives to attract FDI;
however, the response of MNES to the offered incentives depends on their motives and
strategies. Most of the literature regarding the relationship between incentives and FDI inflows
provide inconclusive results. Root and Ahmed (1978) discovered that corporate taxation played
a vital role in attracting manufacturing FDI. Bellak and Leibrecht (2009) also found that high
tax rates discouraged FDI inflows. Cleeve (2008) used three proxies to measure the role of fiscal
27
and financial incentives: temporary tax exclusions, tax concessions, and the repatriation of
profits. The author failed to find any significant relationship between financial and fiscal
incentives and FDI. UNCTAD (1998) notes that the effects of incentives can be potentially
distorting and harmful. Countries offering incentives intend to divert investment away from
competing host countries but in the process the government generally loses revenue and the cost
of the incentives is ultimately borne by the local community. Benefits are transferred to the
foreign investors. Moreover, incentives usually come with conditions that local investors cannot
meet, which can discourage domestic investment (UNCTAD, 1998, page 102)
International agreements and bilateral business treaties are used as a tool for investment and
trade facilitation between various countries. Büthe and Milner (2008) claim that international
trade agreements, such as WTO and GATT, as well as preferential trade agreements, create a
favourable investment climate and provide insurance for the investment. In a statistical model
for 122 developing countries, they found that, international agreements influenced the
investment decision of multi-national enterprises more than domestic policy. Biglaiser and
DeRouen (2010), in a study of 126 developing economies, discovered that MNES in the United
States preferred the countries which are more inclined to the IMF. In a quantitative study,
Neumayer and Spess (2005) found bilateral investment treaties (BITs) to be a significant
determining factor of FDI inflows and they exert a positive impact on FDI flows to a developing
country.
Corruption and administrative inefficiency add extra costs to business operations and reduces
the degree of profitability of investment projects. In the empirical analysis, Asiedu (2006),
Cleeve (2008) and Mohamed and Sidiropoulos (2010) found a negative and significant
relationship between a corruption index and FDI inflows. Al-Sadig (2009), based on panel data
over the period from 1984 to 2004 for 117 countries, also found that FDI inflows decreased
with higher corruption levels. The presence of administrative efficiency and the Rules of Law
offer a smooth business environment. The proper enforcement of rules of law gives the foreign
investor assurance of the safety of their life and property. Conversely, the weak or non-
enforcement of laws and rules discourage foreign investment in developing economies
(Mudambi et al., 2013). Thus, the proper application and enforcement of the Rules of Law
favourably attracts foreign investment into a country (Shahzad et al., 2012).
28
2.5 Foreign Direct Investment and sustainability
Global leaders and policymakers such as UNCTAD, the World Bank, and the IMF are
encouraging FDI as a channel for promoting sustainable development in developing countries;
however, there is no direct theory which can explain the impact of FDI on sustainability or
sustainable development. Both the weak and strong sustainability theories are based on the
conditions of non-declining capital stock over a period of time. FDI supplies physical capital to
a capital-scarce country. FDI inflows can increase the stock of human capital through training,
research and innovation, and thus contribute to achieving the necessary conditions of weak
sustainability. FDI can even help to retain or protect natural resource stocks by introducing and
promoting energy savings and waste reduction technology in the host country. Therefore, FDI
inflows could be a potential channel for achieving the necessary conditions for weak or even
strong sustainability.
However, achieving the conditions of sustainability or the promotion of sustainable
development through FDI inflows largely depends on the institutional arrangements, types of
FDI and the sector where FDI is directed. For instance, if FDI inflows are the 'natural resource
seeking' type, it will deplete the natural capital stock and strong sustainability cannot be
achieved. If institutions and governance arrangements are corrupt or inept and rent from the
exhaustible resources is not reinvested entirely in the improvement of physical capital, even
weak sustainability cannot be achieved.
In contrast, FDI inflows can provide for weak sustainability if it contributes to the productive
base of the host country. Dasgupta (2007) measures sustainable development through changes
in the social and economic productive base of the country. Institutions and capital assets (both
physical and natural) are included in the concept of the economic productive base. The social-
productive base considers wealth distribution. The presence and activities of FDI inflows may
increase demand for the outputs of other sectors. Therefore, domestic investment will be
stimulated or the production base of the host country will expand, and thus FDI contributes to
weak sustainability. On the other hand, the presence and activities of FDI inflows may increase
competition between firms. Increased competition may force domestic firms to exit the
industry, and thus FDI contributes to a decline of the productive base of the host country. In
this scenario, FDI would not meet the necessary conditions for weak sustainability.
29
However, FDI is a modern reality and plays a key role in the global economy. MNEs that
channel FDI produce one-third of the world’s GDP and two-thirds of the world’s trade (OECD,
2018). Therefore, without the involvement of MNEs, the promotion or the achievement of
sustainable development is not possible. The Agenda 2030 of sustainable development also
emphasises the partnership and engagement with business community for achieving the targets
of sustainable development and note:
“We acknowledge the diversity of the private sector, ranging from micro-
enterprises to cooperatives to multinationals. We call upon all businesses to apply
their creativity and innovation to solving sustainable development challenges. We
will foster a dynamic and well-functioning business sector, while protecting labour
rights and environmental and health standards in accordance with relevant
international standards” (UNGA, 2015, p. 28).
The practice of Corporate Social Responsibility (CSR) can make business or investment
activities beneficial for sustainable development. According to the World Business Council on
Sustainable Development (WBCSD), CSR is defined as follows:
“Corporate social responsibility is the continuing commitment by business to
behave ethically and contribute to economic development while improving the
quality of life of the workforce and their families as well as of the local community
and society at large.” (WBCSD, 1999, p. 3).
The definition of CSR calls for ethical business operations and the improvement in the quality
of life for local communities and society at large, which are important elements of sustainable
development. The United Nations Global Compact (2013) also emphasises that businesses need
to operate in a sustainable and responsible manner through business innovation and
collaboration initiatives. The OECD sets guidelines for MNEs, which outline the principles for
responsible business (OECD, 2011a). The guidelines state that enterprises have a responsibility
to economy, environment and society, and emphasise the protection of human rights,
strengthening of the capacity building of the community, job creation, environmental and social
safety.
However, CSR activities and their codes of conduct are voluntary initiatives. It is very hard to
measure and monitor the CSR activities and it is often cited that CSR is described in policy
manuals but not in action (Clarke and Klettner, 2007). Therefore, MNEs or FDI will not
necessarily promote sustainable development through practising CSR.
30
2.6 Conclusion
The concepts and characteristics of sustainable development, which is developed and adopted
by the different group of economists and through various international agreements, imply that
FDI inflows can potentially contribute to achieving the necessary conditions of sustainable
development. However, it varies according to the type, sector of FDI, institutional mechanism
and absorptive capacity of the country. It is essential to mobilise high quality, socially and
environmentally-friendly investments for advancing sustainable development via FDI inflows.
At the same time, developing countries are competing with each other to attract FDI. The
strengthening of absorptive capacity, the technological readiness of the host economy, the
suitable institutional mechanisms and policy frameworks are all crucial for good quality FDI
inflows. As sustainable development is a responsibility for all, therefore, MNEs must adopt and
practice a high level of corporate social responsibility and be aware of the possible impact of
their activities on sustainable development. In the next chapter, I explore in detail how FDI can
impact all three dimensions of sustainable development.

31
CHAPTER 3: FDI AND THE THREE DIMENSIONS OF
SUSTAINABLE DEVELOPMENT
3.1 Introduction
In this chapter, I discuss the issues and mechanisms behind the impact of FDI inflows on three
basic dimensions of sustainable development: the economy; the environment; and the social
dimension. Each dimension of sustainable development covers a broad range of elements and
issues; for instance, the economic dimension of sustainable development includes not only
productivity or growth aspects, but also trade, capital formation, and the fiscal and monetary
stability of the economy. The environmental dimension includes pollution, natural resource
depletion, energy efficiency, biodiversity, and climate changes. The inclusiveness or the
equitable distribution of the benefit of economic development is the main focus of the social
dimension of sustainable development; however, social dimensions also include the working
environment, human rights, labour rights, and other related issues.
The three dimensions of sustainable development are not separate; they are inter-related and
inter-connected. In some cases, the economic, environment and social issues might work in the
same direction; but in others, they might work counter-productively. Sustainable development
can only be achieved through the integration of policies that connect all three dimensions of
sustainable development and a balanced approach is needed. For instance, excessive emphasis
on environmental protection policies could hurt the economic activities of a country and hinder
the growth and development process. The slowdown of economic progress can create
unemployment, which can also trigger social problems. On the other hand, excessive emphasis
on boosting economic activities may lead to an increase in pollution levels and other
environmental problems, such as global warming, resource degradation, and climate change.
While an integrated approach to policy is needed, such policy can only derive from a deep
understanding of the impact of FDI on each of different elements of sustainable development.
While there are cross-overs and, I have broken down the impacts of foreign direct investment
inflows on sustainable development into three parts: FDI and economic development; FDI and

32
environmental conditions; and FDI and social development. Thus, the rest of the chapter is
structured as follows: Sections 3.2, 3.3 and 3.4 discuss the theoretical and empirical literature
related to the impact of FDI inflows on economic sustainability, environmental sustainability
and social sustainability, respectively; Section 3.5 discusses the literature related to the impact
of FDI inflows on the integrated concept of sustainable development; Section 3.6 synthesises
the discussion and outcomes of Sections 3.2, 3.3 and 3.4; Section 3.7 provides a conclusion and
based on the research gap and need, Section 3.7 also develops the research questions for the
study.
3.2 The impacts of FDI on economic development
3.2.1 Theoretical context
FDI inflows have the potential to generate a positive contribution to the economy directly or
indirectly. FDI inflows may contribute to increasing the economic growth and productive
capacity of a capital-scarce country by supplying external capital. FDI can improve the
productivity and efficiency of the host country by introducing new skills and advanced
technology through its indirect (spillover) effect. FDI can also diffuse better corporate
governance, managerial and organisational skills into affiliates and subsidiaries (OECD, 2001).
Further, FDI inflows are considered less volatile than other external capital flows, as long term
commitment is associated with the FDI. Although positive contributions are anticipated, FDI
inflow can also create a negative impact on the economy. Moreover, the effects of FDI inflows
to the host country largely depend on the absorptive capacity and type and mode of the FDI
inflows.
Traditional development theories recognise that investment is the lifeblood of the economy, and
economic growth is the engine of economic development. The neoclassical growth framework
(Solow, 1956; Solow 1957; Lucas, 1988; Romer, 1997) can explain the contribution of FDI
inflows to economic growth. The seminal papers of Solow (1956) and Solow (1957) provide
the basis of applied growth analysis within the neoclassical framework. Solow (1956) identifies
the aggregate production function and the sources of growth by the following derivation:
Equation 3.1 represents the aggregate production function:
𝑌 = 𝐴(𝑡)𝑓(𝐾, 𝐿) (3.1)

33
Where, 𝑌 = Total output produced; 𝐿 = Labour in the physical units; and K= Capital in the
physical units. 𝐴(𝑡) represents the cumulated effects of any shift of production function over
time (t) or technological change. The production function assumes neutral technological change
which implies any change in the technology does not change the ratio of marginal products of
labour and capital (Hicks, 1932). By differentiating Equation 3.1 with respect to time and
dividing by output Solow (1956) obtains Equation 3.2 as follows:
��
𝑌=
��
𝐴+ 𝐴
𝜕𝑓
𝜕𝐾
��
𝑌+ 𝐴
𝜕𝑓
𝜕𝐿
��
𝑌 (3.2)
Where, (��) represents the time derivative of variable x. As 𝜕𝑌
𝜕𝐾= 𝐴
𝜕𝑓
𝜕𝐾 and
𝜕𝑌
𝜕𝐿= 𝐴
𝜕𝑓
𝜕𝐿 ; therefore,
Equation 3.2 can be written as
��
𝑌=
��
𝐴+
𝜕𝑌
𝜕𝐾
��
𝑌+
𝜕𝑌
𝜕𝐿
��
𝑌 (3.3)
Here, capital (K) and labour (L) are the total factor inputs who are paid by their marginal
products. Therefore, the relative share of capital can be expressed as, 𝑤𝑘 =𝜕𝑌
𝜕𝐾
𝑌
𝐾 and the relative
share of labour can be expressed as, 𝑤𝐿 =𝜕𝑌
𝜕𝐿
𝑌
𝐿 .
Substituting the value of 𝑤𝑘 and 𝑤𝐿 , Equation 3.3 can be written as:
��
𝑌=
��
𝐴+ 𝑤𝐾
��
𝐾+ 𝑤𝐿
��
𝐿 (3.4)
The production function is considered to be homogeneous of degree 1 or 𝑤𝐿 + 𝑤𝑘 = 1. If per
capita output, 𝑌
𝐿= 𝑦 and capital-labour ratio,
𝐾
𝐿= 𝑘; then, Equation 3.4 can be expressed as:
��
𝑦=
��
𝐴+ 𝑤𝑘
��
𝑘 (3.5)
Equation 3.4 and Equation 3.5 imply that capital accumulation contributes to the economic
growth directly in proportion to the relative share of capital. Therefore, within the framework
of the Solow (1956) growth model, FDI inflows contribute to the growth process directly
through capital accumulation by increasing the capital stock of the host country. In the Solow
growth framework, technological progress �� is considered exogenous and a determinant of
long-run economic growth, but it fails to explain sources of technological progress. The Solow
growth model assumes that technological progress and capital has the property of diminishing
returns. The assumption of diminishing returns of capital in the Solow growth framework
implies that FDI inflow may only influence the level of income in the short-run, and long-run
growth will remain the same (De Mello, 1999).

34
The endogenous growth model proposed by Lucas (1988) and Romer (1997) explains the
sources of technological progress. According to the endogenous growth model, technological
progress emerges through the active choice of economic agents. Romer (1990) argues that
knowledge creation or innovation is the source of technological progress.
Romer (1990) assumes that there are three sectors in the economy: the final goods sector,
research and development (R&D) sector and intermediate capital good sector. The final goods
sector uses intermediate capital goods and labour to produce final goods for consumption and
investment. The R&D sector uses human capital and knowledge to produce new ideas or
knowledge. The intermediate capital good sector uses designs created by the R&D sector.
Romer (1990) breaks down the total amount of labour into two parts: the amount of labour
working in the final goods sector (𝐿𝐹) and the amount of labour working in the R&D sector
(𝐿𝑅). Workers decide which sector to work in; therefore, the structure of the labour force is also
an endogenous variable.
The following equation expresses the simplified aggregate production function for the Romer
(1990) model:
𝑌 = 𝐿𝑌1−𝛼(𝑋1
𝛼 + 𝑋2𝛼 + 𝑋3
𝛼 + ⋯ 𝑋𝐴𝛼) = 𝐿𝑌
1−𝛼 ∑ 𝑋𝑖𝐴1 (3.6)
Where, 𝐿𝑌 is the total number of labour producing output; 𝐿𝑌 = 𝐿𝐹 + 𝐿𝑅 . 𝑋𝑖 represents various
types of capital goods and 𝛼 represents the marginal return of the inputs, where 0 < 𝛼 < 1.
Unlike the Solow model, technology A is not fixed; it depends on the number of capital goods.
Workers engaged in the R&D sectors invent new capital goods. Romer (1990, p 83) specifies
the evolution of the technology as:
�� = 𝛿𝐿𝑅𝐴 (3.7)
In Equation 3.7, technological progress �� depends on the existing level of technology (A) and
the workers engaged in the R&D sectors (𝐿𝑅). In the endogenous growth model, technological
change generates from the knowledge creation and the spillover of knowledge. The profit-
seeking R&D sector is the main agent for the invention of new designs or technology. Investors
can patent their invented new technology butendogenous growth theories recognise the
diffusion and externalities of technological progress. For example, Romer (1986) stated: “The
creation of new knowledge by one firm is assumed to have a positive external effect on the
production possibilities of other firms because knowledge cannot be perfectly patented or kept
secret” (p. 1003).
35
The endogenous growth model implies that FDI incorporates innovation, technical expertise
and enhanced human capital stock through the introduction of new technology, and training and
skill-building activities, endogenously (Borensztein et al., 1998; Grossman and Helpman, 1993;
Lucas, 1988; Mankiw et al., 1992). Therefore, FDI can contribute to economic growth directly
through capital formation and indirectly through knowledge and technology spillover effects.
That is, in the endogenous growth framework, FDI inflows are able to accelerate economic
growth by generating positive impacts on the marginal return of inputs endogenously through
adding and diffusing new knowledge and technology (Ford et al., 2008; Herzer, 2012). The
technological spillover effects of FDI inflows can increase the capacity or productivity of the
human capital stock and can offset the diminishing returns of the capital stock inherent in the
Solow growth model (Barro and Sala-i-Martin, 1995; Romer, 1997).
Blomström and Kokko (1999), Wang and Blomström (1992) and Colen et al. (2009) categorise
the channels of knowledge and technology spillover effects of FDI inflows into five areas:
demonstration; competition; labour mobility, linkages; and exports. Demonstration effects take
place when domestic firms imitate or observe the advanced technologies and skills of foreign
firms and apply the acquired knowledge in their production systems, which will likely boost the
productivity of local firms (Wang & Blomström, 1992; Colen et al., 2009).
Domestic firms may copy the new superior products, technologies, and production processes of
the MNEs. This imitation generates horizontal spillover effects and accelerates the growth of
the host economy (Colen et al., 2009). However, domestic firms need sufficient technical skills
to apply the knowledge learned through imitation (Apergis et al., 2006).
FDI inflows can also generate spillover effects through competition. The presence of MNEs in
the host economy leads to an increase in competition in the industry. Increased competition
forces the local firms to improve efficiency in the production process and management system
through the invention of new technology(Glass and Saggi, 2002). Görg and Greenaway (2004)
claim that increased competition removes the barrier to adopting advanced technology and also
stimulates the speed of new technology adoption in the host country.
Through the labour mobility channel, positive knowledge spillovers take place when the
workers of MNEs move or migrate to other firms. MNEs usually arrange training and skill
development activities for their employees (Colen et al., 2009). Workers who receive training
may switch to domestic firms. In this case, new advanced technology and managerial systems
36
transmit from foreign-owned firms to locally-owned firms and contribute to increasing the
productivity and efficiency of the local firms (Thakur and Burange, 2016).
MNEs can create knowledge spillover effects by establishing linkages with affiliates,
subsidiaries, and domestic input suppliers of MNEs. MNEs have exposure to, and experiences
with, using advanced production techniques and managerial system. Therefore, the affiliates,
subsidiaries and domestic suppliers learn and adopt to advanced techniques and system from
MNEs. However, to realise this type of spillover benefits, establishing linkages in the
production system between foreign firms and local firms is crucially important (UNCTAD
2001). The linkages between foreign firms and local firms can be in the form of backward
linkages or forward linkages. Backward linkages have taken place when MNEs purchase
intermediate products or raw materials from domestic suppliers. On the other hand, forward
linkages generate from the downward streaming activities of MNES with the local industries.
The backward linkages of FDI promote domestic investment and help to enhance the domestic
production base and employment opportunity of the host country. The linkages of MNES with
the local industries also generate spillover effects through transferring knowledge directly from
foreign firms to local firms (Smarzynska Javorcik, 2004).
The knowledge spillovers may also occur through the export channel (Blomström and Kokko,
1999; Görg and Greenaway, 2004). MNEs are usually export-oriented and have the expertise
and advanced export networks and strategies. When MNEs do export through their affiliates,
they establish trade infrastructure and distribution networks in host countries. Local firms can
learn advance export strategies of MNEs and can use the network and trade infrastructure for
their exporting.
The spillover effect of FDI inflows can also be classified as horizontal and vertical spillovers.
Vertical spillover effects are as described previously with upstream or downstream effects
benefiting through knowledge acquisition. Horizontal (intra-industry) spillovers generate when
FDI inflows take place in industries that are already established in the host country (Görg and
Greenaway, 2004).
FDI may also generate a negative effect in the host country economy. The initial entry of FDI
inflows may improve the balance of payments situation of the host country. Later, the profit
repatriation, outflows of dividends and royalties of MNEs, may adversely impact the balance
of payment situation of the host country. Reis (2001) also notes that the transfer of profit to
37
overseas by the foreign investors might adversely affect the welfare of the host country.FDI
inflows are assumed less volatile compared with other foreign capital flows (such as portfolio
and equity investment). However, at the time of economic crisis, the volatility of FDI inflows
may be similar to any other portfolio investment flows (Singh and Zammit, 1997).
The spillover effects of FDI could be negative and can generate adverse effects on the economic
growth and productivity of the host country. In the case of imitation, the technology might be
too advanced to adopt by the host firms. For competition effects, foreign firms may crowd out
domestic investment that would have occurred in local competitors (Chudnovsky and López,
2008) and local firms could be squeezed out (Glass and Saggi, 2002). In some cases, local firms
are even forced to leave the industry. Aitken and Harrison (1999) note that foreign multinational
firms have firm-specific advantages and the benefits of economies of scale, which allows them
to drive demand away from local firms. Local firms may also lose human capital stock and
productivity if foreign-owned firms pay higher wages with skilled workers migrating from local
firms to foreign-owned firms (Fosfuri et al., 2001).
The linkage effects of FDI inflows could also be negative. Instead of sourcing intermediate
inputs from the local industries, multinational firms may import intermediate inputs. Therefore,
the net effect of backward linkages may be negative (Aitken et al., 1997; Greenaway et al.,
2004; Rodriguez-Clare, 1996). Aitken and Harrison (1999) also note that if local firms purchase
raw materials from domestic sources but the foreign-owned firms depend on imports, local
firms may also move to intermediate imports, leading to the displacement of domestic firms.
Further, the benefits of FDI on growth will not come automatically. The growth-generating
impacts of FDI inflows largely depend on the absorptive capacity of the host country.
Absorptive capacity refers to the strength of the host country in absorbing the knowledge and
technology spillovers associated with FDI. The level of human skills and knowledge, financial
development, quality of the institutions, infrastructure development, level of technological
advancement, and level of economic development are considered important factors for
absorbing the benefits of FDI spillover effects (Blomstrom and Kokko, 2003). Host countries
need to have sufficient absorptive capacity to realise the spillover effects of FDI inflows. For
example, Blomstrom et al. (1992) found that FDI inflows positively impact economic growth
only in the higher income developing countries. In most cases, developing countries suffer from
a lack of sufficient high-quality human capital stock to nurture and use the technology diffused
from FDI inflows.
38
Borensztein et al. (1998) examined the effect of FDI inflows on economic growth for selected
developing economies within the endogenous growth framework. They applied a cross-country
regression analysis, and the results reveal that FDI stimulates economic growth and
productivity; however, the higher productivity gain is achieved only if the host country exceeds
the threshold or minimum level of human capital development. Therefore, the literature
emphasises the improvement of human capital stock to strengthen the absorptive capacity of
the host economy to maximise the benefits of FDI inflows.
The realisation of the potential benefits of FDI inflows also depends on the host country's
economic policies and institutional arrangement (Gallagher and Zarsky, 2004).
Balasubramanyam et al. (1996) examined the role of trade policies in fostering economic
growth in the presence of FDI. The results support the outward-oriented liberalised trade policy
to boost economic growth through FDI inflows. Alfaro et al. (2004) emphasise the development
of the financial market for promoting economic growth through FDI inflows. Bengoa and
Sanchez-Robles (2003) explored the positive relationship between FDI inflows and economic
growth; in the long-run, the positive impact of FDI on growth was found to depend on the
improvement of human capital stock, the macro-economic stability and liberalisation policy of
the host country.
The impact of FDI also varies with the type and entry mode of FDI inflows. Nunnenkamp
(2002) argues that efficiency-seeking FDI inflows are more effective than market-seeking FDI
inflows for the enhancement of economic growth. It is also argued that FDI inflows in the
manufacturing sector are expected to generate a higher growth effect than FDI inflows in the
primary natural resource sector (UNCTAD, 2001). In most cases, the impact of FDI inflows on
economic growth depends on the linkage effects and in the primary sector, there is limited scope
of expansion through linkage activities. Therefore, if FDI inflows are channelled to the primary
or traditional sector, then it may generate negative net impacts on economic growth. In contrast,
manufacturing FDI inflows can expand the primary and services sector with the primary sector
supplying raw materials to the manufacturing sector and the services sector delivering
marketing and financial services for manufactured products. Further, Colen et al. (2009) express
that FDI inflows directed to high labour-intensive industries are likely to be more positive for
economic growth, than the technology-intensive industries. The prospects of linkages and
growth effects of FDI for the service sectors are found to be uncertain (Alfaro, 2003; UNCTAD,
2001; UNCTAD, 2005).

39
Some researchers also argue that greenfield FDI has more growth prospects compared with FDI
driven by mergers and acquisitions. Mergers and acquisitions initially do not supply new capital
or investment to the host economy; ownership of the investment is only transferred from local
to foreign investors. As a result, mergers and acquisitions do not contribute to enhancing the
capital formation of the host economy. In contrast, greenfield FDI inflows directly contribute
to the host country's capital formation by adding new investment (Colen et al., 2009).
Greenfield FDI is a new investment or new plant, and also generates additional job opportunities
for the local workforce. Capital formation is crucial for economic growth. Therefore, greenfield
FDI inflows are more positive in growth generation of the host country. However, in the later
phases of development and through the process of sequential investment, mergers and
acquisitions can make a positive impact on the host economy (UNCTAD, 1999).
3.2.2 Empirical studies
Due to the conflicting theoretical views about FDI inflows and economic growth and the
growing importance of FDI, empirical researchers have investigated the relationship between
FDI inflows and the host country's economic growth, some of which has been previously
described. The empirical literature provides mixed results. Several studies revealed a positive
impact of FDI inflows on economic growth, while others found evidence of a negative effect.
A number of studies also found conditional positive results and focus on the necessity of the
host country’s absorptive capacity to reap the benefit of FDI inflows.
3.2.2.1 Studies finding a positive relationship between FDI and economic growth
In developing countries, FDI inflows can contribute to boosting economic growth by supplying
new capital and introducing and diffusing advanced technology. Several empirical studies
(Ekanayake et al., 2010; Haseeb et al., 2014; Hassen and Anis, 2012) investigate the impact of
FDI inflows in developing countries and discover that FDI inflows exert a positive effect on
economic growth in developing countries. For Latin American countries, Bengoa and Sanchez-
Robles (2003) investigate the linkages between FDI, and economic growth covering data from
1970 to 1999. They employ a fixed effect and random effects panel Ordinary Least Square
(OLS) estimation procedure and find that FDI inflows are positively associated with economic
growth in these countries. Similarly, Choong and Lim (2009) investigated the role of FDI
inflows in improving Malaysia's economic condition. The study concluded that FDI inflow
performs a key role in expanding domestic sectors and overall economic growth.
40
An ample amount of empirical research applies various co-integration and causality analysis
technique such as the Autoregressive Distributed Lag (ARDL) approach, the Vector Error
Correction Model (VECM), and Granger causality to investigate the short-run and long-run
relationship and direction of causality between FDI inflows and economic growth. For example,
Acaravci and Ozturk (2012) employed the bound testing Autoregressive Distributed Lag
(ARDL) technique to examine the co-integration among FDI inflows, export and economic
growth for selected European economies. The finding of the study favoured FDI promotion
policies for accelerating economic growth. The study mentions FDI inflows as the main engine
of economic growth. Nguyen (2017) also applied ARDL to detect the short-run and long-run
impact of FDI using annual time-series statistics for the period of 1986-2015 in Vietnam. The
study found that FDI inflows influenced economic growth positively in the long-run. However,
the study did not find any significant impact on growth in the short-run.
Choe (2003) investigated the impact of FDI inflows and domestic investment on economic
growth for 80 developing countries. This study found a strong co-integration and causal
relationship among the variables and revealed that the causality from economic growth to FDI
inflows was more prominent than the causality from FDI to economic growth. Similarly, Sothan
(2017) investigated the causal link between economic growth and FDI for Cambodia over the
period from 1980 to 2014 and found a strong one-way causal relationship, from FDI to
economic growth, in Cambodia.
Employing the Pedroni panel co-integration technique and causality analysis, Agrawal (2015)
examined the linkages between FDI inflows and economic growth for five BRICS economies,
investigating data from 1989 to 2012. The study found that FDI inflows and economic growth
are strongly co-integrated. The study additionally discovered a long-run strong unidirectional
causality from foreign direct investment to economic growth in these countries. Iamsiraroj
(2016) also searched for a causal relationship between FDI inflows and economic growth,
applying a simultaneous equation analysis approach for 124 countries from 1971 to 2010. The
study revealed a strong two-way causal relationship between economic growth and FDI inflows.
The impact of FDI inflows on economic growth may differ by sector. Therefore, several
empirical studies investigate the impact of FDI inflows on economic growth for sector-level
data and discover that FDI inflows in the manufacturing sector have higher growth potentiality
than other sectors. For instance, Ehijiele et al. (2016) examined the contribution of FDI inflows
on the performance of the manufacturing sector in Nigeria. The study discovered that FDI

41
inflows exert a positive impact on the output growth of the manufacturing sector in Nigeria.
Eze et al. (2019) investigated the causality between FDI and manufacturing output growth in
Nigeria. The study discovered a unidirectional causality from FDI inflows to manufacturing
output growth. Wang (2009) investigated the impacts of sector-level FDI inflows on economic
growth for 12 Asian countries covering data from 1987 to 997. The study revealed that FDI
inflows in the manufacturing sector exerts a strong positive impact on economic growth for the
selected countries. While, in the case of non-manufacturing FDI inflows, the growth impacts
were found to be non-significant for the selected countries.
3.2.2.2 Studies finding a negative and insignificant relationship between FDI and
economic growth
FDI inflows may generate a negative impact on economic growth by creating crowding-out
effects on domestic investment. Several empirical studies supported the negative impact of FDI
inflows on economic growth in the host country. Elboiashi (2011) investigated the impact of
FDI inflows on economic growth for low-income and middle-income economies in Sub-
Saharan Africa, covering annual time series data from 1992 to 2012. The study found that FDI
inflows negatively impacts economic growth. FDI inflows also squeezed out the domestic
sector and hindered the growth prospect of the local industry.
Similarly, Ruranga et al. (2014) analysed the relationship amongst FDI, economic growth,
domestic savings and trade for Rwanda covering data from 1970 to 2011. Their study did not
find any significant relationship between FDI inflows and economic growth. Mencinger (2003)
investigated the correlation between FDI and economic growth for eight Central and East
European countries and found a negative relationship between FDI and economic growth. The
study mentioned that the crowding-out effect on domestic investment and the absence of the
establishment of backward linkages may be the cause of the negative relationship.
The FDI inflows in the selected countries were concentrated to the tertiary sector such as trade,
commerce and finance sector, which had little scope to generate backward linkages. Moreover,
the relationship between FDI inflows and fixed capital formation of the selected countries are
found to be negative, which implies a crowding out of domestic investment due to FDI inflows.
Several empirical studies discovered an insignificant relationship between FDI and economic
growth. Roy and Mandal (2012) investigated the causal link between economic growth and FDI
for nine selected Asian nations, employing the Granger causality test. The study did not find
42
causality from FDI to economic growth for most of the selected countries. In Turkey, Aga
(2014) explored the co-integration between economic growth and FDI inflows. The study could
not find any linkages between economic growth and FDI inflows. Alagöz et al. (2008) analysed
the link between FDI and economic growth for Turkey using data from 1992 to 2007. Their
study did not find evidence of Granger causality between FDI inflows and economic growth in
any direction for Turkey.
3.2.2.3 Studies findings conditional positive results with a focus on the absorptive
capacity of the host country
Several empirical studies supported the idea that FDI inflows have the potentiality to generate
a positive impact on the economic growth of the host country, conditional on their absorptive
capacity, such as sufficient human capital skills, institutional capacity, as well as trade and
economic openness. For instance, Zhang (2001) examined the causal pattern of FDI inflows
and output growth for selected East Asia and Latin American economies. The study found that
the impact of FDI on economic growth depends on the host country’s institutional and economic
characteristics. The study also revealed that FDI inflows were more likely to create a positive
impact on economic growth for those countries that had liberalised trade and economic policy,
improved educational levels, and macroeconomic stability.
Carkovic and Levine (2002) critically examined the contribution of FDI inflows on the
economic growth of the host country. The study did not find any significant positive impact of
FDI inflows on economic growth when the effects of other growth potential variables were
controlled; therefore, the study concluded that the presence of foreign investment does not
automatically exert a positive influence on economic growth. The study mentioned that the
growth generating effects of FDI depend on the level of financial development, educational
attainment and the level of economic development of the recipient country.
Brahim and Rachdi (2014) emphasised institutional arrangements in boosting economic
performance through FDI inflows for selected MENA economies covering the period from
1984 to 2011. The study discovered that the impact of foreign investment on economic growth
is not automatic, but instead, conditional. The development of good institutional arrangements
is required to foster economic growth through FDI inflows.
43
Furthermore, several empirical studies have emphasised the role of economic and trade
liberalisation for harnessing the potentialities of FDI inflows in boosting economic growth.
Basu et al. (2003) explored co-integration and causalities between FDI inflows and economic
performance for selected developing countries covering data from 1978 to 1996. The study
reveals two-way causality between FDI and economic growth, but only in the economies which
have a higher degree of open trade policy. The study did not find a causal relationship from FDI
inflows to economic growth for the less liberalised economies. Therefore, the study suggested
liberalisation is essential for boosting economic growth through FDI inflows.
Yao (2006) investigated the relationship between FDI inflows, exports and economic growth to
discover the effectiveness of export promotion and investment liberalisation policies in China.
The empirical results of the study support the open policies of China and found strong positive
effects of FDI inflows and export on economic growth. Azman-Saini et al. (2010) examined
the relationship between economic growth and FDI inflows utilising the panel data analysis
technique over the period 1976 to 2005. The study revealed that FDI inflows did not exert a
positive effect on economic growth independently. The positive benefit of FDI inflows is found
to be strongly dependent on the degree of openness of the country. Therefore, the study suggests
enacting liberalisation policies to harness the positive spillover effects of FDI inflows in
boosting economic growth. Similarly, Azman-Saini et al. (2010) and Iamsiraroj (2016) suggest
that the presence of trade and economic liberalisation are required for the benefits of FDI
inflows to be realised.
3.2.2.4 Studies focusing on the spillover or indirect effects of FDI
The indirect or spillover effects of FDI inflows are considered more prominent than the direct
effect. Therefore, several studies examined the direct and indirect effects of FDI inflows for
economic growth. For example, Li and Liu (2005) employed an instrumental variable analysis
approach to examine whether FDI triggers economic growth for a sample of 84 countries (both
developed and developing) covering data from 1970 to 1999. They conclude that FDI and
economic growth are positively associated with both developed and developing countries. The
study also revealed that FDI inflows have a strong positive interaction effect on the level of
human skills and a negative interaction effect with the technology gap in developing countries.
Therefore, the study concludes that FDI not only promotes growth directly but also stimulates
growth indirectly through its interaction with other growth-enhancing variables.
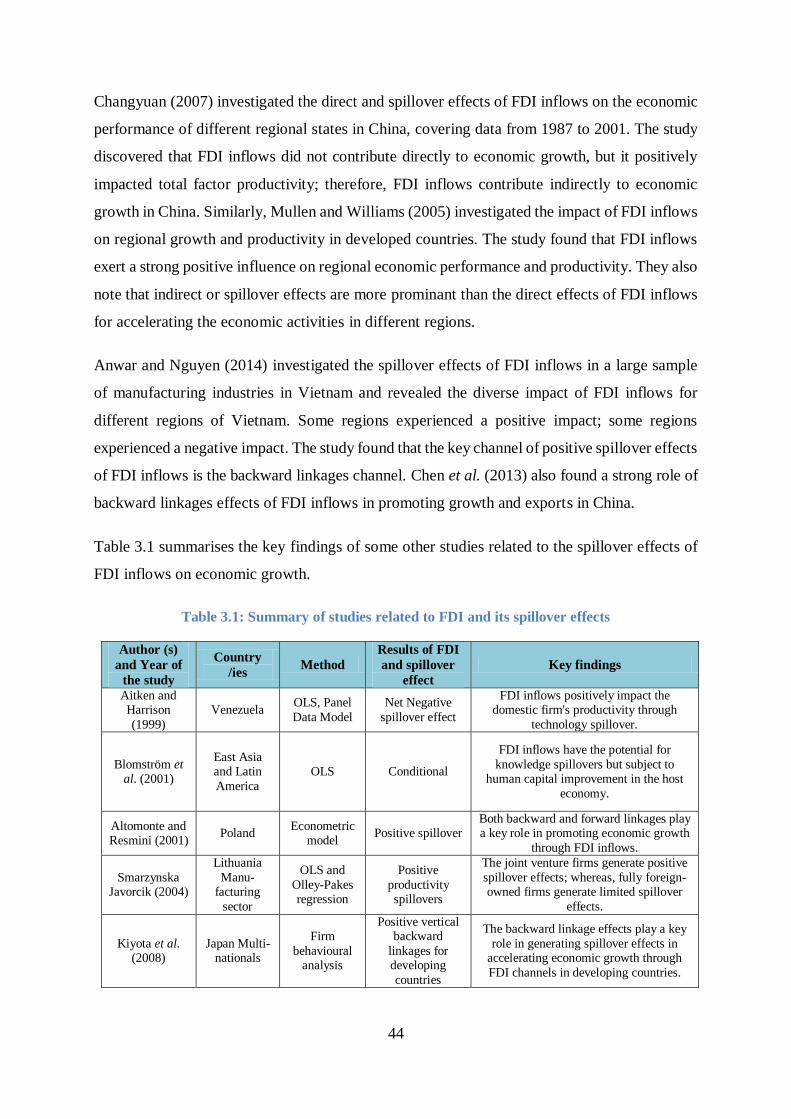
44
Changyuan (2007) investigated the direct and spillover effects of FDI inflows on the economic
performance of different regional states in China, covering data from 1987 to 2001. The study
discovered that FDI inflows did not contribute directly to economic growth, but it positively
impacted total factor productivity; therefore, FDI inflows contribute indirectly to economic
growth in China. Similarly, Mullen and Williams (2005) investigated the impact of FDI inflows
on regional growth and productivity in developed countries. The study found that FDI inflows
exert a strong positive influence on regional economic performance and productivity. They also
note that indirect or spillover effects are more prominant than the direct effects of FDI inflows
for accelerating the economic activities in different regions.
Anwar and Nguyen (2014) investigated the spillover effects of FDI inflows in a large sample
of manufacturing industries in Vietnam and revealed the diverse impact of FDI inflows for
different regions of Vietnam. Some regions experienced a positive impact; some regions
experienced a negative impact. The study found that the key channel of positive spillover effects
of FDI inflows is the backward linkages channel. Chen et al. (2013) also found a strong role of
backward linkages effects of FDI inflows in promoting growth and exports in China.
Table 3.1 summarises the key findings of some other studies related to the spillover effects of
FDI inflows on economic growth.
Table 3.1: Summary of studies related to FDI and its spillover effects
Author (s)
and Year of
the study
Country
/ies Method
Results of FDI
and spillover
effect
Key findings
Aitken and Harrison
(1999)
Venezuela OLS, Panel
Data Model
Net Negative
spillover effect
FDI inflows positively impact the domestic firm's productivity through
technology spillover.
Blomström et al. (2001)
East Asia and Latin
America
OLS Conditional
FDI inflows have the potential for
knowledge spillovers but subject to human capital improvement in the host
economy.
Altomonte and Resmini (2001)
Poland Econometric
model Positive spillover
Both backward and forward linkages play a key role in promoting economic growth
through FDI inflows.
Smarzynska Javorcik (2004)
Lithuania
Manu-facturing
sector
OLS and
Olley-Pakes regression
Positive
productivity spillovers
The joint venture firms generate positive
spillover effects; whereas, fully foreign-owned firms generate limited spillover
effects.
Kiyota et al. (2008)
Japan Multi-nationals
Firm
behavioural analysis
Positive vertical backward
linkages for developing
countries
The backward linkage effects play a key
role in generating spillover effects in accelerating economic growth through
FDI channels in developing countries.
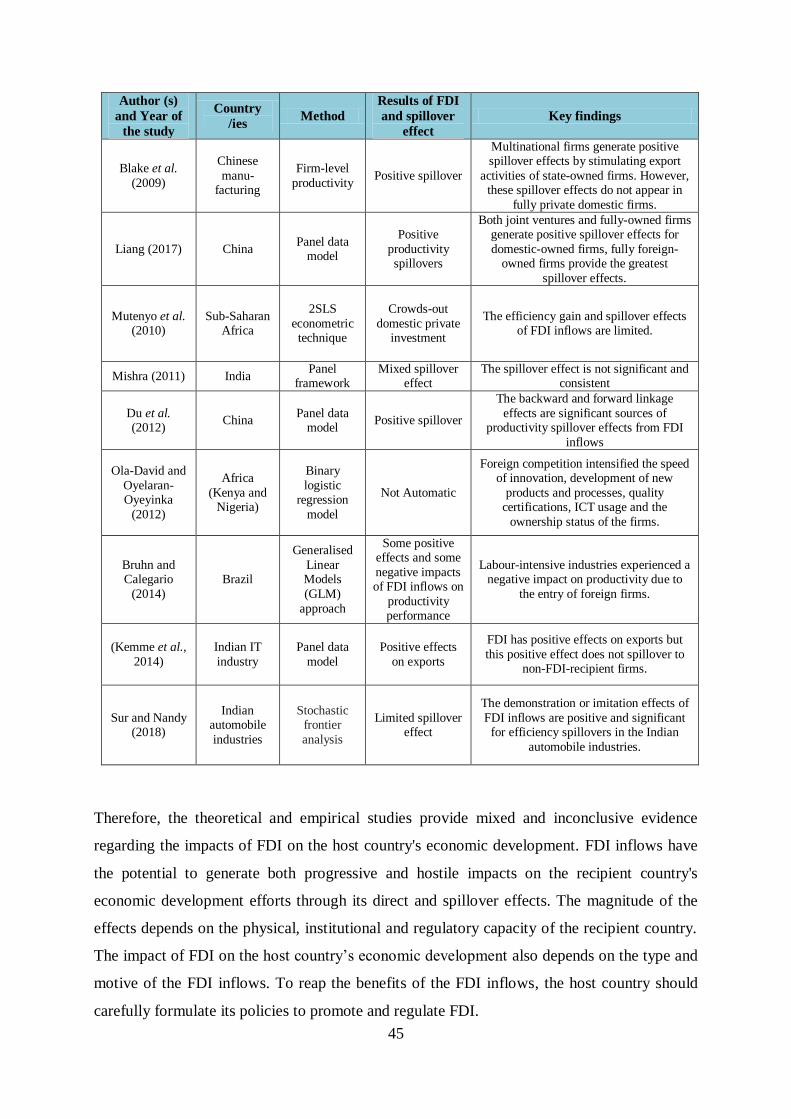
45
Author (s)
and Year of
the study
Country
/ies Method
Results of FDI
and spillover
effect
Key findings
Blake et al.
(2009)
Chinese
manu-facturing
Firm-level
productivity Positive spillover
Multinational firms generate positive spillover effects by stimulating export
activities of state-owned firms. However, these spillover effects do not appear in
fully private domestic firms.
Liang (2017) China Panel data
model
Positive
productivity spillovers
Both joint ventures and fully-owned firms generate positive spillover effects for
domestic-owned firms, fully foreign-owned firms provide the greatest
spillover effects.
Mutenyo et al. (2010)
Sub-Saharan Africa
2SLS
econometric technique
Crowds-out
domestic private investment
The efficiency gain and spillover effects of FDI inflows are limited.
Mishra (2011) India Panel
framework Mixed spillover
effect The spillover effect is not significant and
consistent
Du et al. (2012)
China Panel data
model Positive spillover
The backward and forward linkage
effects are significant sources of productivity spillover effects from FDI
inflows
Ola-David and
Oyelaran-Oyeyinka
(2012)
Africa
(Kenya and Nigeria)
Binary
logistic regression
model
Not Automatic
Foreign competition intensified the speed of innovation, development of new
products and processes, quality certifications, ICT usage and the
ownership status of the firms.
Bruhn and Calegario
(2014)
Brazil
Generalised
Linear Models
(GLM)
approach
Some positive effects and some
negative impacts of FDI inflows on
productivity performance
Labour-intensive industries experienced a negative impact on productivity due to
the entry of foreign firms.
(Kemme et al.,
2014)
Indian IT
industry
Panel data
model
Positive effects
on exports
FDI has positive effects on exports but
this positive effect does not spillover to non-FDI-recipient firms.
Sur and Nandy (2018)
Indian automobile
industries
Stochastic frontier
analysis
Limited spillover effect
The demonstration or imitation effects of
FDI inflows are positive and significant for efficiency spillovers in the Indian
automobile industries.
Therefore, the theoretical and empirical studies provide mixed and inconclusive evidence
regarding the impacts of FDI on the host country's economic development. FDI inflows have
the potential to generate both progressive and hostile impacts on the recipient country's
economic development efforts through its direct and spillover effects. The magnitude of the
effects depends on the physical, institutional and regulatory capacity of the recipient country.
The impact of FDI on the host country’s economic development also depends on the type and
motive of the FDI inflows. To reap the benefits of the FDI inflows, the host country should
carefully formulate its policies to promote and regulate FDI.
46
In this thesis, I investigate the broad research question of whether FDI assists or hinders
sustainable development in developing countries, using the Bangladesh manufacturing sector
as a case study. Based on the three dimensions of sustainable development, the analysis is
broken down into three parts – economic, environment and social sustainability. The diverse
outcomes regarding the impact of FDI on a host country’s economic development indicates the
need for country and sector specific analysis. As such, a key hypothesis being investigated in
the thesis is the degree to which FDI inflows in the manufacturing sector contribute to economic
sustainability in Bangladesh.
3.3 The impact of FDI inflows on environmental conditions
3.3.1 Theoretical context
The recent development literature has shifted the focus from economic growth to green growth
or ecologically-friendly development (Capasso et al, 2019; Recalde, 2014; Zhang, 2016). Green
growth or development activities require a decoupling of growth from environmental
destruction. FDI inflows are considered a viable means of promoting environmentally friendly
technology. However, there is debate in the literature about the impact of FDI inflows on the
host country’s environmental standards and outcomes. FDI inflow can improve, worsen or may
not generate any impact on the host country's environmental standards and outcomes. The
environmental impacts of FDI depend on the type of FDI inflows, or the industry where FDI
inflows take place, the performance of the MNEs, the growth and development pattern of the
host country. The host country's development and environmental policies, rules, and regulations
also influence the degree and nature of the environmental impacts of FDI.
In general, FDI can contribute positively to the environmental conditions of the host country by
introducing advanced, efficient technology in production and resource management systems.
FDI inflows can also diffuse environmentally-friendly technology and management system to
the local industries, through spillover effects (Araya, 2005; Eskeland and Harrison, 2003;
OECD, 2001). Multinational firms (MNEs) usually originate from advanced developed
countries. Therefore, MNEs have some advantages over local firms, such as access to state-of-
the-art technology, higher innovation capacity, experiences and exposure to better management
and marketing systems. Modern, sophisticated technology improves resource efficiency and can
reduce industrial waste and thus help to improve environmental conditions.

47
Moreover, multinational firms usually need to meet higher operational and management
compliances in their home country. The monitoring and reporting system of MNEs is likely to
be better than domestic firms, as MNEs not only follow the host country's regulations but also
comply with the international rules and regulations to satisfy their stakeholders (OECD, 2001).
If domestic firms learn from foreign firms and use better management and technology from the
foreign firms, or are forced to use the advanced technology to qualify as suppliers for foreign
firms, positive environmental spillovers can be generated in the host country. Therefore, FDI
inflows can make a positive contribution to the host country’s environmental conditions.
The linkages effects of FDI can also improve the environmental standard of the host economy.
Local industries may be voluntarily inspired to improve their environmental management due
to the linkages established with foreign affiliates; or, they may be forced to do that to meet the
international standard. Local firms may try to imitate foreign affiliate's environmental
technologies or hire workers with environmental expertise, as trained by multinational
enterprises. In India, Ruud (2002) found that local firms are part of a broader logistical network
and forced to improve their environmental performances to be eligible. In China, Christmann
and Taylor (2001) discovered that domestic firms with a large percentage of sales going to
multinational enterprises are more likely to adopt ISO 14001 than firms that are not part of such
linkages.
However, the consequences of FDI inflows on the environment could be harmful as well.
Copeland and Taylor (1994), in a theoretical explanation of the pollution haven hypothesis,
argue that developed countries maintain a higher environmental standard and more stringent
environmental regulation than developing countries. Therefore, the regulation costs for
polluting industries in developing countries is lower than in developed countries. Moreover,
developing countries might have a tendency to lower environmental regulations, or may not
enforce existing regulations, to attract more FDI inflows in the country (Gallagher and Zarsky,
2005). As a result, dirty or polluting industries may shift from developed economies to
developing economies, through FDI inflows.
The shifting of polluting industries from developed to developing economies via FDI is referred
to as the ‘pollution haven’ hypothesis. The presence of a pollution haven potentially results in
a degradation of environmental conditions and increases the pollution level of the host country.

48
In addition, Smarzynska and Wei (2001) and Copeland and Taylor (2013) note that foreign
investors have a preference to invest in countries where environmental regulations are already
compromised.
In contrast, research also shows that the cost of compliances with environmental regulations is
a small part of production costs; only 2 to 3 percent on average (Adams, 1997; OECD, 1998;
UNEP, 2000). Moreover, multinational firms can potentially improve the environmental
conditions of the host country by promoting advanced, efficient green technology and
management systems. Therefore, FDI can generate a ‘pollution halo effect’ in the host country.
The pollution halo hypothesis advocates that multinational firms not only need to comply with
the host country's regulations and standards, they also need to fulfil the requirements of the
parent country's environmental regulations, which forces MNEs towards improved
environmental performance. Moreover, due to the global corporate social responsibility
movement, high environmental standards sometimes do not discourage investment; rather, it is
preferred by investors (Gentry, 1998). Besides, the demonstration or imitation effects of FDI
can also contribute to improving the overall environmental standard of the host economy
(OECD, 2002).
The environmental impacts of FDI also depend on the types and sectoral structure of FDI
inflows. The natural resource-seeking or extractive FDI activities are more destructive than
efficiency-seeking and market-seeking FDI (Rothman, 1998; Zhang, 2014). Compared with
horizontal FDI, vertical FDI might be more polluting (Tang, 2015). In the case of vertical FDI
inflows, there is a tendency to shift the most polluting part of the production chain to the less
stringent regulated country to reduce the production cost.
Gallagher and Zarsky (2005) note that the environmental impacts of FDI are mostly depend on
the specific choices and decisions made by MNEs with regard to environmental practices. They
argue that the transfer of environmentally friendly technology and management practices
through FDI depends on the environmental performance of the MNEs, and the nature of the
sector where FDI has been directed. As developing countries have less bargaining power and
lack the capacity to enforce regulations and laws, the choice of technology (whether MNEs use
the best available, newer, cleaner technology or dump older, dirtier technologies) is a voluntary
decision of MNEs. In terms of management practice, whether the companies adopt the parent
country's system or follow the host country's system, is also a choice of MNEs.
49
The scale and compositional effects of FDI activities also play a significant role in the
environmental impacts of FDI inflows. Gallagher and Zarsky (2005) point out that even if
MNEs perform better compared to domestic industries in using environmentally friendly
technology and management practices, the scale effect of the additional economic activities of
MNEs is likely to accelerate the environmental degradation in the host country. On the other
hand, the compositional change in the production process can be beneficial for the host country
environment. MNEs may experience higher economic efficiency in production; therefore,
energy, water, and raw materials used per unit output will be lower than in the domestic
industries. Economic efficiency also contributes to reducing the amount of waste and emissions
in the production process. Therefore, the economic efficiency of MNEs can be translated into
greater environmental efficiency.
Araya (2005) emphasises the technology effects of FDI inflows in assessing its environmental
impacts. MNEs introduce new advanced technology in the transfer of machinery, equipment,
patent rights, expatriate managers and technicians, from the parent multinational enterprises to
the affiliates; further, MNEs train their affiliates about better environmental and risk
management practices. Araya (2005) argues that advanced, efficient techniques could reduce
pollution and resource depletion, as well as minimise, and even offset, scale effects of FDI.
However, the author also underscores that advanced environmental technology and the know-
how may or may not be transferred to the local industry. The transfer of technology responds
to cooperation between local firms and foreign investors through joint training programs.
Several theoretical and empirical literatures focus on the Environmental Kuznets Curve (EKC)
hypothesis, which explains the environmental impact of FDI. The EKC hypothesis is developed
based on the Kuznets hypothesis of income inequality (Kuznets, 1955). The Kuznets hypothesis
refers to an inverted U-shaped relationship between per capita income and income inequality.
In the investigation of the environmental impacts of the North American Free Trade Agreement,
Grossman and Krueger (1991) noticed the inverted-U relationship between economic growth
and the environmental quality for the first time. The EKC hypothesis refers to a situation where
the environmental condition of a country initially worsens with an increase in per capita income,
but improves once per capita income reaches a certain point. Grossman and Krueger (1991)
argue that at higher levels of per capita income, environmental regulations become more
stringent due to increased environmental awareness, compositional change in the output mix,
increased demand for green products and the ability to bear the cost of environmental
protection. Grossman and Krueger (1995) also argue that at a higher income level, the country
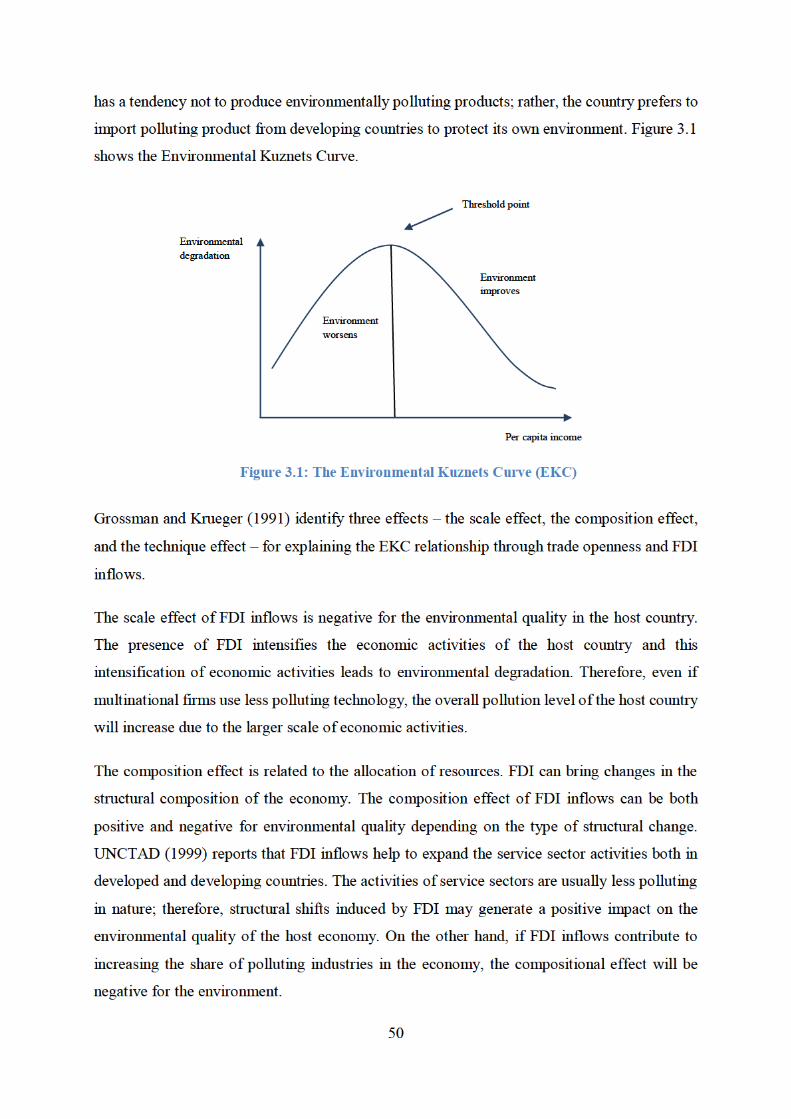
51
The technique effect refers to the effects of technological change in the production system.
Foreign firms are expected to use environmentally friendly technology compared with local
firms in developing countries. Cleaner technology may transfer or diffuse from foreign firms to
local firms. Therefore, the technique effect is expected to be positive in improving the
environmental quality of the host economy. In addition, FDI may promote economic growth
and increase the per capita income of the host economy. Higher-income level generates
increased environmental awareness among the community. Therefore, there will be a higher
demand for better environmentally friendly products. Environmental awareness forces local
governments to adopt and enforce stringent environmental regulations. Panayotou (1997)
defines increased environmental awareness as the income effect of FDI inflows on
environmental regulations.
In general, the scale effects from increased FDI inflows are likely to be negative for the
environment, while the composition and technique effects are expected to be positive to the
environmental conditions of the host country. In the short-run, the scale effect is more dominant
than the composition and technique effects; in the long-run, composition effects, and technique
effects play a more dominant role than scale effects and contribute to the inverted U-patterned
EKC relationship in the host country.
However, the existence of EKC is a subject of debate both in the theoretical and empirical
literature. Stern and Common (2001) commented that the pollution level relates to time rather
income level. Panayotou (1997) and Panayotou (2000) note that if the income levels of
developing countries are close to the turning point, the increases in pollution and resource
depletion will continue for a long time and can lead to significant and possibly irreversible
damage. I turn now to a broad discussion of the empirical literature.
3.3.2 Empirical studies
The empirical studies related to FDI and environmental performance mostly concentrate on the
validity of pollution halos, pollution havens and the existence of an EKC relationship.
3.3.2.1 Studies finding evidence of pollution halos
The pollution halos hypothesis postulates that FDI inflows improve the environmental
conditions of the host country. Eskeland and Harrison (2003) provide evidence in favour of the
pollution halo hypothesis. They found that foreign companies were cleaner and used less energy

52
in their factories in Mexico, Côte d’Ivoire and Venezuela. Blackman and Wu (1999) also found
strong support in favour of the pollution halo hypothesis in China. Their study suggests that
using advanced technology in electricity generations, FDI inflows contribute to reducing the
pollution level in China. The practice of better management and increased competition also
contribute to the halo effect of FDI.
Guoming et al. (1999) found that multinational enterprises transferred environmental
management skills to their Chinese partners, and some multinational enterprises co-operated
with the Chinese government on environmental matters. They also found that multinational
enterprises promoted less pollution and energy techniques to local manufacturing industries.
Warhurst (1999) conducted 25 case studies to analyse the role of FDI as a channel for clean
technology transfer in mineral extraction. The studies revealed that technological collaboration
between suppliers and recipients, and training, could potentially contribute to the improved
environmental performance of local firms.
Rondinelli and Vastag (2000) studied the Aluminium Company of America (Alcoa
Corporation) and revealed that the affiliates of the company generally used advanced
environmental technologies in their operations in developing countries. Andonova (2003) also
found that multinational enterprises performed better than other organisations in terms of
adopting and practising environmental norms and rules, and exert a positive impact on
environmental standards in European economies. Similarly, Albornoz et al. (2009) found that,
in Argentina, multinational firms exert a positive impact on environmental quality by practising
environmental management and insisting that affiliates follow higher environmental standards.
The study also discovered that environmental spillover is higher in those firms in which
absorptive strength and export activities are relatively high.
In a co-integration analysis, Maji and Habibullaha (2015) found evidence supporting the
pollution halo hypothesis. The study applied the ARDL Bound Testing approach and found FDI
inflows contribute to reducing CO2 emissions. Al-mulali and Tang (2013) also revealed
evidence supporting the pollution hallo hypothesis for gulf economies. For G20 countries, Lee
(2013) discovered that FDI inflows have little effect on CO2 emissions. Antweiler et al. (2001)
also supported the pollution halo hypothesis for SO2 emissions for a sample of 43 developed
and developing economies.
53
Several studies focus on corporate social responsibilities and the implementation of rules and
regulations for realising the halo effects of FDI. The corporate social responsibility practised
by MNES (or cross-border corporate environmental management) could play an important role
in improving environmental conditions. Haufler (2001) and Garcia-Johnson (2000) claim that
collaborative approaches, development of internal codes of conduct, and voluntary standards
play a key role in the promotion of environmental management and self-regulation. The rules
and regulations of the host and source countries are key in shaping corporate environmental
strategies. For example, host country regulations may influence investors' environmental
behaviour (Gentry, 1998; O’Connor, 2000; UNCTAD, 1993). In a case study of the Mexican
manufacturing sector, Gentry (1998) found Mexican regulations played a key role in the
investor's decision to undertake environmental investment.
Several studies suggest strengthening the role of NGOs or civil societies for promoting
environmental halo effects of FDI. The implementation of the law in developing countries, and
its enforcement, can be weak (Gentry, 1998; Guoming et al.; 1999, Jha, 1999; Rasiah, 1999).
Therefore, in addition to the formal regulations, non-formal efforts by NGOs can contribute to
improving the environmental standards of companies. Newell (2001) notes that the creation of
environmental NGOs increased the monitoring and scrutinising of the social and environmental
performance of MNEs. The NGOs place pressure on companies to disclose and follow the codes
of business. The World Bank policy research report, ‘Greening Industry: New Roles for
Communities, Markets, and Governments’ (World Bank, 2000) emphasises the role of civil
society in improving the environmental performance of firms. Mol and Carter (2006) also
highlight the role of the local community and civil society pressures in cleaning up industrial
toxic and hazardous waste in China.
3.3.2.2 Studies finding evidence of pollution havens
The pollution haven hypothesis postulates that the presence of FDI worsens the environmental
conditions of the host country. In a case study of Mexico, Dasgupta et al. (2000b) found that
foreign companies were not systematically cleaner than local companies. Guoming et al. (1999)
explored MNEs that managed natural resources poorly in plastic and leather industries in China.
Rasiah (1999) also provides evidence of MNEs engagement in destructive environmental
practices in Malaysia. Grimes and Kentor (2003) note that less develop countries, which have
a high dependency on foreign investment, faced a higher level of carbon dioxide (CO2)

54
emissions. The study also argues that foreign-owned firms have a high intensity of energy
consumption, which results in increased energy-related emissions and pollutions.
In a co-integration analysis, Baek and Koo (2009) also found evidence of the pollution haven
hypothesis for two Asian countries, India and China. The study revealed a co-integration
between FDI inflows, energy consumption and economic growth for two Asian countries. The
study found that FDI inflows strongly influenced the energy consumption level and degraded
environmental quality of the host countries. Pao and Tsai (2011) also confirmed the existence
of the pollution haven hypothesis for BRIC (Brazil, Russia, India, and China) countries.
Chandran and Tang (2013) also found a strong linkage between CO2 emissions and FDI for five
ASEAN countries. Kaya et al. (2017) investigated the long-run and short-run relationship
between FDI inflows, economic growth, trade openness and CO2 emissions in Turkey, using
data from 1974 to 2010. The study revealed a strong long-run co-integration among the
variables. The study also found that FDI inflows and trade openness positively impacts on CO2
emissions in the long-run. The study also identified bi-directional causalities between foreign
investment and CO2 emissions in Turkey. Bi-directional positively causality between FDI
inflows and CO2 emissions implies that pollution and FDI inflows influence each other. The
causality direction from FDI inflows to CO2 emissions indicates that an increase of FDI inflows
leads to an increase of CO2 emissions in the country. At the same time, the causal direction
from CO2 emissions to FDI inflows indicates that high pollution levels in the host country is
favourable for attracting more FDI inflows . The higher degree of pollution levels may indicate
limited environmental monitoring capacity or a low enforcement level of environmental
regulations in the host country. Therefore, positive bidirectional causality between FDI inflows
and CO2 emissions supports the pollution haven hypothesis.
Similarly, Omri et al. (2014) used a panel data analysis for 54 economies over the period from
1990 to 2001 and revealed bi-directional causalities between FDI inflows and CO2 emissions.
Hoffmann et al. (2005) tested the causalities and their directions between FDI inflows and CO2
emissions for low, middle and high-income countries at the global level. The study revealed
that a one-way causal link existed from CO2 emissions to FDI inflows in low-income
economies. The causality from CO2 emissions to FDI inflows in middle and high-income
economies was found to be insignificant. Therefore, the pollution haven hypothesis was rejected
for middle and high-income countries but found to be valid for low-income economies. As
above, poor monitoring and the lack of strict environmental regulations may be the cause for

55
FDI investments in low-income countries where CO2 emissions are high. Ridzuan et al. (2014)
also supported the pollution haven hypothesis for selected ASEAN countries.
3.3.2.3 Studies related to the EKC hypothesis
Several studies investigated the presence of the EKC hypothesis to explore the relationship
between FDI inflows and environmental conditions of the host country. However, the existence
of EKC is a long-debated issue. The results of the existence of EKC vary by the model
specification, estimation procedure and interpretation of the findings of the studies (Agras and
Chapman, 1999; Cole, 2003; Harbaugh et al., 2002; Heerink et al., 2001; Millimet et al., 2003;
Nahman and Antrobus, 2005). The results may also vary for different pollutants and countries.
Due to the availability of the data and the importance of CO2 emissions and energy consumption
on global climate change, several econometric studies investigated the validation of the EKC
hypothesis in the presence of FDI inflows by investigating the link and causality among foreign
investment, level of energy use, CO2 emissions, and economic growth. For example, Pao and
Tsai (2011) investigated the linkages between FDI inflows, economic growth, CO2 emissions
and energy consumption for BRIC countries covering data from 1992 to 2007. Employing
multivariate Granger causality analysis, the study found a long-run co-integration among the
variables and validated the Environmental Kuznets curve (EKC) relationship for BRIC
countries. The causality analysis of the study also found bi-directional causalities between FDI
inflows and energy pollutants. The study also detected that economic growth ‘Granger causes’
FDI inflows.
Similarly, Kivyiro and Arminen (2014) supported the EKC pattern for CO2 in the presence of
FDI inflows and energy use. Badri and Parvizkhanlu (2014) tested the EKC relationship for
selected petroleum exporting countries, applying the fixed-effects model in panel data (covering
1990 to 2009). Their study found evidence of the EKC U-shaped pattern. FDI inflows were
found to negatively impact on CO2 emissions and positively impact on economic growth, thus
FDI inflows contributed to improving environmental quality. Shahbaz et al. (2015) employed
a co-integration technique for different income groups using a global panel and validated the
EKC U-shaped pattern and pollution haven hypothesis. The study also identified that two-way
causalities are running between CO2 emissions and FDI inflows at a global level. Kim and Beak
(2011) also supported EKC relationship. The study discovered that in the long run, economic
56
growth deteriorated environmental quality in developing countries. However, economic growth
helps to improve environmental quality in developed economies.
In contrast, several empirical studies did not find sufficient evidence in favour of the EKC
hypothesis in the case of CO2 emissions, energy consumption and FDI inflows. Narayan and
Narayan (2010) investigated the Environment Kuznets Curve (EKC) hypothesis for developing
countries in different regions. The study assumes that if the short-run income elasticity of CO2
emissions is larger than the long-run elasticity, the EKC relationship exists. The study found
evidence supporting the EKC relationship in the Middle Eastern and South Asian region. The
short-run elasticities are larger than the long-run elasticities, which implies that CO2 emissions
have fallen over time with the increase of income.. However, in East Asian, Latin American
and African regions the study found that the income elasticity is smaller in the short run than in
the long run. Therefore, the study rejected the EKC relationship for East Asia, Latin America
and African regions. Asici (2013) explored the causal link between economic growth and
environmental performances for different income-group economies, and found that economic
growth worsens environmental quality in middle-income countries to a greater extent than low
and high-income countries. However, economic growth positively impacts the environmental
quality in high-income countries. Therefore, the study failed to validate the EKC hypothesis.
Furthermore, the EKC hypothesis might exist for some environmental pollutants, but not others
(Barbier, 1997; Munasinghe, 1999). Nordström and Vaughan (1999) underscore that the EKC
relationship exists for locally confined pollution, such as water pollution. However, EKC does
not seem to hold for pollutants that disperse into a greater geographical space (such as carbon
dioxide emissions). Torras and Boyce (1998) support the EKC hypothesis for sulphur dioxide
(SO2); although for heavy particles, they reveal a monotonically-decreasing relationship. In the
case of carbon dioxide (CO2) emissions, Holtz-Eakin and Selden (1995) found evidence of the
EKC for selected economies, covering data from 1951 to 1986. Kacar and Kayalica (2014) and
Hilton and Levinson (1998) also found evidence of the EKC pattern for sulphur and lead
emissions, respectively. Perman and Stern (2003) tested the validity of the Environmental
Kuznets curve for 74 countries. They employed panel data estimation process to investigate the
co-integration between sulphur emissions and economic growth; they confirm there is a long-
run co-integration between the variables. However, they did not find evidence of the existence
of the EKC hypothesis.

57
Hettige et al. (2000) express concerns about water pollution in the industrial sector and reject
the EKC relationship. They found that due to an intensification of industrial activities in middle-
income countries, water pollution was alarming and ongoing. Harbaugh et al. (2002), using a
panel data model, rejects the inverted-U shaped EKC relationship for major air pollutions.
Applying the simultaneous equations model, Shen (2006) explored the existence of the EKC
relationship for SO2 emissions, three water pollutants and dust in China, and found evidence of
the EKC relationship for water pollution and SO2 emissions. However, there was no significant
relationship for dust.
Several studies investigated the EKC relationship through the scale effect, composition effect,
and technological effect. For example, De Bruyn et al. (1998) conducted an empirical analysis
of three major air pollutants within a dynamic model to investigate the existence of the EKC
pattern. The study discovered a link between economic growth and air pollution. They note
structural and technological change may lead to declining emissions over time.
Cole and Elliot (2003) investigated which effects (scale or technique) played a key role in
different air pollutants. The study revealed that the technique effect is stronger than scale effects
in the case of sulphur dioxide (SO2) emissions, but scale effects are more prominent for CO2
and nitrogen oxide5 emissions. In contrast, for China, Jayanthakumaran and Liu (2012) found
that the scale effect is stronger than the technique effect for sulphur dioxide (SO2) emissions.
Therefore, the theoretical and empirical studies fail to establish any conclusive relationship
between foreign direct investment inflows and the host country's environmental conditions. It
mostly depends on the performance of the MNEs, host country’s environmental policies,
regulations, and their enforcement, nature of the sector/industry where FDI inflows are
channelling, the management methods and types of technology used in foreign affiliates of
transnational/multinational corporations. The diverse and inconclusive results regarding the
impact of FDI inflows on various aspects of environmental sustainability of a host country
suggests that country-specific analysis is required when making policy conclusions. As such, a
key hypothesis being investigated in the thesis is the degree to which FDI inflows in the
manufacturing sector contribute to environmental sustainability in Bangladesh.
5 Oxides of nitrogen are a mixture of gases comprising nitrogen and oxygen. Two of the most toxicologically significant
compounds are nitric oxide (NO) and nitrogen dioxide (NO2); other gases in this group are nitrogen monoxide (or nitrous
oxide, N2O), and nitrogen pentoxide (NO5).
58
3.4 The impacts of FDI inflows on social development
Improvement in the overall quality of life and social equality are the primary concerns of the
social dimensions of sustainable development. The quality of life depends on various issues
such as employment and income, environment, health, education, working conditions, and
social and political rights. Social equality mainly focuses on the inclusive nature of
development. In most cases, the literature related to the impact of FDI inflows on the social
dimension of sustainable development discusses the effects of FDI inflows on employment
generation, poverty reduction and income inequality.
3.4.1 FDI and employment generation
Employment generation is crucial for improving the quality of life as it provides income to
households and increases access to different social facilities, such as education, health, and
housing. FDI inflows can create direct and indirect employment to the host country (Gorg,
2000). Through new investment, FDI inflows often create jobs directly. It can also create
indirect jobs, through backward and forward linkages. Backward linkages occur when
multinationals procure raw materials from local industries. In purchasing intermediate products
from the domestic firms, multinationals can boost the economic activities of domestic firms,
which in turn generates further employment. By creating demand for the upstream products and
services, as well as establishing linkages with distributors of local firms, multinationals can also
generate additional jobs for the local workforce through forward linkage channels.
The activities of FDI can further create employment in other sectors through multiplier effects.
The increased income, in turn, generates additional demand for other sector products. As a
result, the production and activities of other sectors will increase, and employment generation
will also increase. The degree of the indirect effect of employment creation by FDI inflows is
higher than its direct effects. In 1997, the global FDI inflows generated 26 million direct jobs
and 42 million indirect jobs (IFC, 2013, p. 49). Therefore, each direct employment creation by
FDI inflows stimulated 1.6 indirect jobs through its linkages.
However, the scale of the impacts of foreign direct investment on employment creation depends
mostly on the types of the FDI inflows (greenfield or brownfield) production techniques used
in the sector (capital or labour-intensive) and linkages established with the local industries
('crowding in' or 'crowding out'). For example, if the presence of foreign direct investment
crowds out domestic investment due to increased competition, the net effects on employment
59
generation could be negative. Multinational enterprises (MNEs) are large international
organisations that have greater economic power and scale than local competitors. Therefore,
FDI inflows may force local firms to quit the market (Kurtishi-Kastrati, 2013). The number of
jobs created by the MNEs might be greater or smaller than the jobs lost in the local industries.
As a result, the net number of job creations by the FDI inflows could be negative due to
substitution effects (Hill, 2001). Similarly, if FDI inflows take place in labour-intensive sectors,
employment generation will be higher than capital-intensive FDI inflows. Moreover, MNEs use
relatively capital-intensive technology, compared with the local industries, which reduces their
possible effect on job creation.
The empirical findings of the impacts of foreign direct investment on employment generation
also provide mixed results. Several studies discover a positive impact of FDI inflows on
employment generation. For example, Craigwell (2006) found that FDI inflows contributed
strongly to employment creation in the Caribbean region. Nunnenkamp and Bremont (2007)
investigated the extent to which FDI inflows influenced job creation and in Mexico. They
employed a GMM estimator for panel data from 1994 to 2006 and discovered that foreign direct
investment had a strong positive impact on employment generation in the manufacturing sector
in Mexico. Federico and Alfredo (2008) evaluated the influence of export-oriented FDI inflows
on domestic employment generation for the period of 1996 to 2001 for selected manufacturing
industries in Italy. The results show that foreign direct investment has a strong positive
influence on employment generation. Federico and Alfredo's (2008) study also revealed that
FDI inflows did not crowd out the employment of small plants in the country.
Ajaga and Nunnenkamp (2008) also found a positive association with FDI inflows and
employment generation in the USA. They examined long-run links between foreign direct
investment, economic performances and employment for US states. Utilising the co-integration
technique and Granger causality tests covering data from 1977 to 2001, they reveal co-
integration and bi-directional causalities between economic performances and FDI inflows.
Ndikumana and Verick (2008) show that FDI inflows create crowding in effects on employment
and local investment in Sub-Saharan Africa. They also found bi-directional causalities between
domestic investment and FDI inflows.
In contrast, several studies reveal a negative impact of FDI inflows on employment generation.
For instance, Buffie (1993) (within a bi-sectoral dual economy system) investigated the
influence of FDI on domestic capital accumulation and underemployment. The study found that
60
in the long run, FDI inflows generated crowding-out effects in high-paid manufacturing
industries. However, the study also found that in traditional and primary sectors, FDI inflows
produced crowding-in results and helped to reduce underemployment levels significantly. Rizvi
and Nishat (2009) investigated the contribution of FDI inflows on employment using the panel
estimation technique for India, China, and Pakistan, covering data from 1985 to 2008. The
results of the study indicated that FDI inflows did not create employment opportunities in the
selected countries. The study suggested these countries should look for alternative strategies to
stimulate employment. Similarly, Onimisi (2014) also found a negative association between
employment level and foreign direct investment in Nigeria. The study recommends establishing
a partnership between the research institutions and industries to build necessary adaptable skills.
The theoretical and empirical literature related to the impact of FDI inflows on employment
creation indicates that the indirect effects are more prominent than the direct effects. The
empirical findings suggest that FDI inflows have a positive impact on employment creation in
the countries where FDI inflows help to expand backward industries or generate crowding in
effects in domestic investment. The presence of necessary skills and expertise is also important
for the effectiveness of FDI in generating employment. The impact of FDI inflows on
employment generation also depends on the type of FDI inflows such as labour-intensive or
capital intensive, greenfield or mergers and acquisition. In terms of employment creation,
labour-intensive and greenfield FDI inflows are more beneficial than mergers and acquisition
and capital intensive FDI inflows.
3.4.2 FDI and poverty reduction
Poverty reduction is another critical issue of concern in assessing the social effect of foreign
direct investment. In developing economies, poverty is a major social challenge. Poverty causes
a lot of social problems such as malnutrition, low life expectancy, childhood labour, and a low
standard of living. FDI might not create any direct effect on poverty reduction in the host
economy. However, FDI can indirectly contribute to poverty reduction through the following
channels: the systematic channel of foreign direct investment-growth-poverty reduction; the
redistribution of revenue income channel; and the enterprise's channel.
3.4.2.1 The systematic channel of FDI-growth-poverty reduction
The systematic FDI-growth-poverty reduction relationship suggests that if per capita GDP
increases, then the average income level of poor communities will increase. Therefore,
61
economic growth positively impacts on poverty reduction (World Bank, 1990; Goudie and
Ladd, 1999; Kakwani, 1993; Lipton and Ravallion, 1995; Osmani, 2005; Roemer and Gugerty,
1997). In general, boosting economic growth is often considered as a catalyst or tool to reduce
the poverty level. At the same time, FDI inflows can stimulate economic growth in various
ways; for example, through the direct supply of new capital and creating new employment. FDI
can also stimulate growth through various spillover effects, such as increasing productivity and
efficiency through the transfer of knowledge and technology, and by establishing production
linkages with local firms.
Dollar and Kraay (2001) claim that economic growth raises the income level of the bottom
income group at the same rate as the rate of economic growth. They also state that opening up
the economy stimulates growth and poverty reduction and reduces the income inequality. The
study revealed that a 100 percent increase in the trade share would have the cumulative effect
of raising incomes by 25 percent over a decade. The impact of FDI on economic growth was
found to be higher than the impact of total trade on growth; a one percentage point increase in
FDI inflows as a share of GDP would result in a cumulative effect on average incomes over the
course of a decade of 13 percent. The study also revealed that the distributional effect or the
effect of trade openness on income inequality was insignificant or close to zero. The estimated
coefficient for the overall per capita income growth was 1.04 when the dependent variable is
per capita income growth for the bottom quintile. Thus, globalization or FDI inflows contribute
to poverty reduction through stimulating economic growth in the host countries. Adams (2004)
estimates the elasticity of poverty in respect to economic growth using data from 126
economies, including 60 developing economies and found that economic growth reduces the
degree of poverty. The growth elasticity of poverty was -2.79 indicating that a one percent
increase in economic growth contributed to reducing the poverty level by 2.79 percent in the
selected economies.
Several studies also demonstrate that boosting economic growth is critical for reducing poverty,
as the intensification of economic activities contributes to employment generation and provides
opportunities for poor communities. Tsai and Huang (2007) investigated the link between
poverty and economic growth in Taiwan, and claim that economic growth reduced poverty in
the country in short and long run. The study also discovered that international trade contributed
to reducing the poverty level through direct and indirect effects. In Nigeria, Ijaiya et al. (2011)
investigated the effect of economic growth on poverty covering data from 1980 to 2008, and
found a positive effect of economic growth on poverty reduction.
62
However, economic growth may not always contribute directly to reducing the poverty level in
the host economy. Growth might be a necessary condition but insufficient for reducing poverty.
The origins of economic growth and how the growth benefits are distributed among different
income groups are also important for poverty reduction. Islam (2004) investigated the co-
integration among employment generation, poverty reduction and economic growth. The results
demonstrate that the effect of economic growth on poverty reduction is not homogeneous – that
is, the same level of growth rates could impact poverty reduction differently. The types of
growth and how it reacts with employment creation are more important for poverty reduction.
In Malaysia, Mulok et al. (2012) also examined the empirical linkage between poverty
reduction and economic growth, and claim that economic growth is essential but insufficient
for poverty reduction. The study focuses on the improvement of income distribution for
reducing poverty.
3.4.2.2 Redistribution of revenue income channel for poverty reduction
The redistribution of the revenue income channel suggests that the corporate tax paid by the
foreign firms and their subsidiaries helps to increase the tax base and capacity of the host
government to adopt more welfare and poverty alleviating activities, thus contributing to
reducing poverty. Klein et al. (2001) commented that multinationals and their subsidiaries are
paying revenue to the host government, which increases the likelihood of adopting basic service
facilities and redistributive activities by the government. Thus, FDI generally helps to reduce
the poverty level. Nonetheless, the revenue effects of foreign direct investment on poverty
reduction depend mostly on the fiscal incentive programs offered by the host government to
attract FDI. Developing countries often fear imposing a high corporate tax, especially for
foreign firms, as high taxes may draw away FDI inflows to other countries.
The empirical research on the impact of FDI inflows on poverty reduction is limited. No
empirical research has so far been carried out which investigates the impact of the redistribution
of revenue income channel of FDI on poverty reduction in the host country.
3.4.2.3 Poverty reduction through enterprise channel
The enterprise channel demonstrates that MNEs can contribute to poverty reduction directly by
creating employment opportunities for poor, unskilled communities and adopting corporate
social activities for the wellbeing of the poor. Prahalad (2012) argues that multinationals could
boost the economic activities of the lowest income group communities and thus help a huge
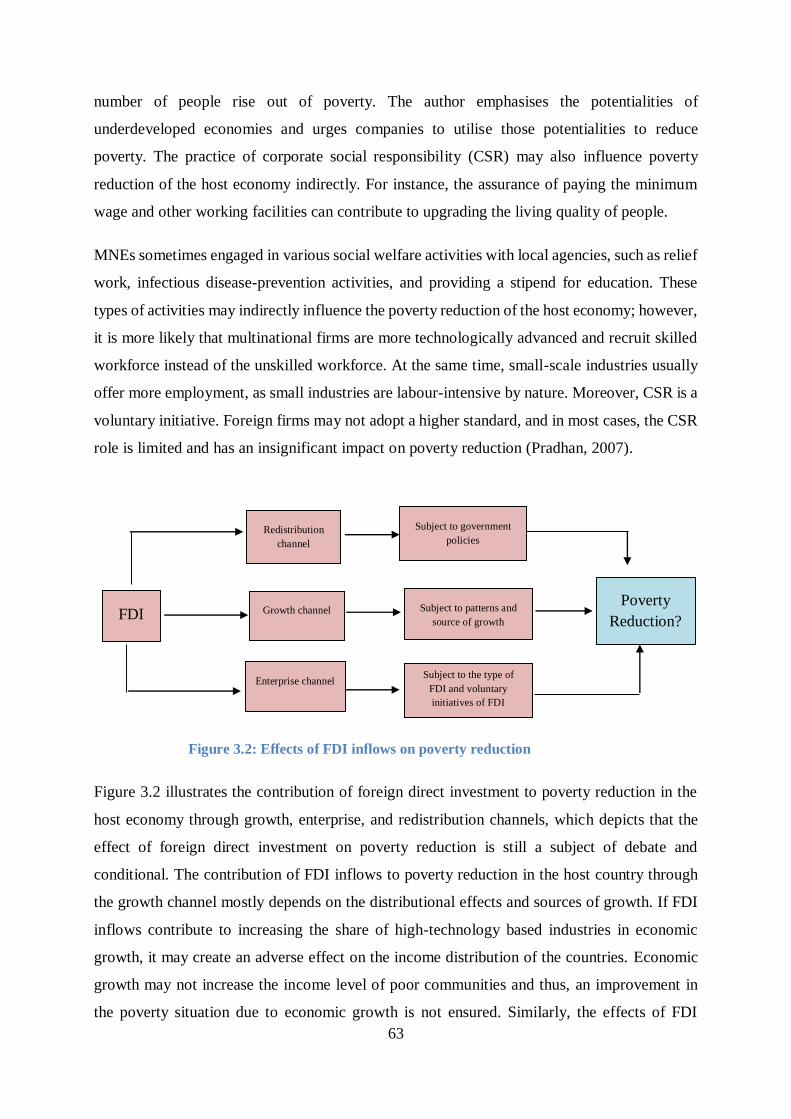
63
number of people rise out of poverty. The author emphasises the potentialities of
underdeveloped economies and urges companies to utilise those potentialities to reduce
poverty. The practice of corporate social responsibility (CSR) may also influence poverty
reduction of the host economy indirectly. For instance, the assurance of paying the minimum
wage and other working facilities can contribute to upgrading the living quality of people.
MNEs sometimes engaged in various social welfare activities with local agencies, such as relief
work, infectious disease-prevention activities, and providing a stipend for education. These
types of activities may indirectly influence the poverty reduction of the host economy; however,
it is more likely that multinational firms are more technologically advanced and recruit skilled
workforce instead of the unskilled workforce. At the same time, small-scale industries usually
offer more employment, as small industries are labour-intensive by nature. Moreover, CSR is a
voluntary initiative. Foreign firms may not adopt a higher standard, and in most cases, the CSR
role is limited and has an insignificant impact on poverty reduction (Pradhan, 2007).
Figure 3.2 illustrates the contribution of foreign direct investment to poverty reduction in the
host economy through growth, enterprise, and redistribution channels, which depicts that the
effect of foreign direct investment on poverty reduction is still a subject of debate and
conditional. The contribution of FDI inflows to poverty reduction in the host country through
the growth channel mostly depends on the distributional effects and sources of growth. If FDI
inflows contribute to increasing the share of high-technology based industries in economic
growth, it may create an adverse effect on the income distribution of the countries. Economic
growth may not increase the income level of poor communities and thus, an improvement in
the poverty situation due to economic growth is not ensured. Similarly, the effects of FDI
Subject to government
policies Redistribution
channel
Poverty
Reduction? FDI Growth channel
Subject to the type of
FDI and voluntary
initiatives of FDI
Enterprise channel
Subject to patterns and
source of growth
Figure 3.2: Effects of FDI inflows on poverty reduction
64
inflows on poverty reduction through redistribution of revenue channel largely depends on the
fiscal policy of the government. If the revenue income received from the MNEs is not reinvested
or spent on social programs (such as education, health) and welfare activities, the redistribution
effect will not materialise. Furthermore, the effects of poverty reduction through the enterprise
channel mostly depends on the CSR activities of MNEs. CSR is a voluntary initiative of MNEs
and has a very limited role for poverty reduction. Therefore, the growth, redistribution and
enterprises channels do not provide a guaranty of poverty reduction in the host country through
FDI inflows.
3.4.2.4 Empirical studies investigate the direct relationship between FDI inflows and
poverty reduction
Outside of the indirect linkages (through growth, enterprise, and redistribution channels),
several studies also empirically investigate the direct relationship between FDI inflows and
poverty reduction. The studies employ different econometric techniques and use different
indicators or measurements of poverty such as the poverty rate, income of the bottom 20
percent, the Human Development Index (HDI), and headcount ratios of poverty. Regardless of
indicators, the studies provide inconclusive and diverse findings about the impact of FDI
inflows on poverty reduction of the host country.
Using the poverty rate as an indicator of poverty measurement, Hung (2005) investigated the
relationship between poverty reduction and FDI inflows, covering data from 1992 and 2002 for
Vietnam. The study reveals that FDI contributed to reducing poverty, and shows that if foreign
direct investment increases by 1 percent, then 0.05% of people will be lifted out of poverty
(poverty rate). The study also discovered that FDI inflows positively contributes to the
economic growth in Vietnam and the economic growth did not make any significant adverse
effect on income distribution in the country. Jalilian and Weiss (2002) investigated the effect
of FDI on poverty for ASEAN economies covering data from 1987 to 2000. The study considers
the income of the bottom 20 percent as the poverty measure and also discovered a positive
contribution of foreign direct investment on poverty reduction. Ucal (2014) also supports the
view that FDI inflows contribute to reducing poverty for 26 developing economies.
Using the Human Development Index (HDI), several empirical studies show that FDI inflows
contribute to improving the poverty level of the host economy. Reiter and Steensma (2010)
investigated the relationship between foreign direct investment and poverty for 49 developing
65
economies, covering data from 1980 to 2005. The study indicates a strong positive effect of
foreign direct investment on human development. The study also revealed that the institutional
quality of the host country is crucial for making FDI inflows beneficial for poverty reduction in
the host country. For example, the impact of FDI inflows on poverty reduction was found to be
insignificant in countries with high corruption. Sharma and Gani (2004) investigated the effect
of foreign direct investment in human development for low and middle-income countries,
covering data from 1975 to 1999. The study also uses the Human Development Index (HDI)
and found bidirectional strong causal influences between the Human Development Index and
foreign direct investment. The presence of a bidirectional causal relationship between the
Human Development Index and FDI inflows implies that countries with a higher level of human
development attract more FDI inflows and that these inflows have a stronger effect on poverty
reduction.
Similarly, Gohou and Soumaré (2012) examined the impact of foreign direct investment on
poverty reduction of 52 African countries, using HDI during 1990 and 2007. Applying
Instrumental Variable Regression analysis, the study also discovered that foreign direct
investment had a strong positive effect on poverty reduction. The study also discovered that
FDI inflows had greater impacts on poverty reduction in poorer countries compared to relatively
wealthier countries. Poor countries usually attract labour-intensive FDI inflows and thus create
new jobs for poor, low-skilled workers, which contributes to reducing poverty. Soumaré (2015)
investigated the association of FDI and welfare improvement in Northern Africa, covering data
from 1990 to 2011, and shows that FDI inflows contribute significantly to improving welfare.
In contrast, several empirical studies did not find any significant effect of FDI inflows on
poverty reduction, taking HDI as an indicator of poverty measurement. For instance, Tsai and
Huang (2007) failed to find any significant relationship between poverty reduction and foreign
direct investment in Taiwan. Hussain et al. (2010) also examined the influence of FDI intensity
on human development in Pakistan, using the Human Development Index, and report neutral
effects of foreign direct investment in human development in Pakistan.
The studies, which consider the poverty headcount ratio, also found both positive and negative
results about the impact of FDI inflows on the poverty level in the host country. For example,
Shamim et al. (2014) and Zaman et al. (2012) use the poverty headcount ratio and found a
positive impact of FDI inflows on poverty reduction in Pakistan. Fowowe and Shuaibu (2014)
also used the poverty headcount ratio to discover how foreign direct investment affects a poor

66
community for 30 African economies and discovered a positive contribution of FDI on reducing
poverty. The study also revealed that higher human development and institutional quality
enhanced the efficiency of FDI in reducing poverty. Bharadwaj (2014) investigated the
influence of FDI inflows on poverty for selected developing economies, from 1990 to 2004.
The study found FDI inflows and the headcount ratio had a negative relationship and
contributed to poverty reduction. In a time series analysis, Israel (2014) also discovered a
positive co-integration between poverty reduction and FDI inflows in Nigeria. Using panel
analysis, Uttama (2015) found a positive impact of FDI in reducing poverty in the ASEAN
countries.
Some studies found a negative impact of FDI inflows on poverty reduction, using the headcount
ratio as the proxy of poverty reduction. Ali et al. (2009) examined the effects of foreign direct
investment on poverty reduction in Pakistan. The study shows that foreign direct investment
had a negative influence on poverty reduction in Pakistan in both the short run and long run.
The study also discovered that government expenditure on social sectors and the education level
of the country played significant roles in reducing poverty in Pakistan, Calvo and Hernandez
(2006) investigated the effect of FDI on poverty covering data from 1984 to 1998 for Latin
America. This study also used the poverty headcount ratio and discovered that the positive
impact of foreign direct investment differs from the primary economic situation of the host
economy and behaviour of the subsidiaries. In Nigeria, Akinmulegun (2012) and Ogunniyi and
Igberi (2014), in East and Latin America, Huang et al. (2010) also found a negative relationship
between FDI and poverty reduction
Therefore, the empirical results regarding the effects of foreign direct investment on poverty
reduction are inconclusive, and the findings vary by countries and regions. FDI is profit-driven;
poverty reduction is not the prime goal of FDI inflows. FDI inflows can contribute to the
poverty reduction of the host country through stimulating growth, employment creation,
strengthening government financial capacity through tax revenue and participating social
welfare activities. The findings of the empirical literature suggests that if the economic growth
generating from FDI inflows does not create an adverse impact on the income distribution of
the host country, FDI inflows will be found to be positive for poverty reduction. The
government’s fiscal policies, the social, political and economic intuitional quality, the economic
and human capital development level, and the type of FDI inflows are also important in
determining the effects of FDI inflows on poverty reduction in the host country.

67
3.4.3 FDI and income inequality
Equality is one of the core issues within the concept of sustainable development. In general,
equality refers to the degree of inclusiveness and fairness in resource distribution and decision-
making. Equality also refers to the degree of freedom or capabilities following Sen (1986).
Income inequality is an important parameter to measure the inclusiveness of development.
Income inequality indicates how the benefit of economic growth and development is being
distributed through the entire population.
FDI inflows may generate both negative and positive effects on the income distribution of the
host economy. Using Heckscher-Ohlin and Stolper-Samuelson models of international trade,
Mihaylova (2015) argue that multinationals can take advantage of the abundance of low-skilled
labour in developing countries Therefore, FDI is expected to funnel to the labour-intensive
sector and create employment for low skilled labour; thus, the demand for low skilled labour
will increase. This increased demand leads to increased wage levels for low-skilled labourers,
holding everything else constant. The increased wage of low-skilled workers contributes to
reducing income inequality.
The relationship between income inequality and FDI is also explained by the Kuznets
hypothesis of income inequality. According to the Kuznets hypothesis, the income inequality
of a country rises until the country reaches a certain income level, after which inequality begins
to fall (Kuznets, 1955). At the early development phase, an economy typically experiences a
transition process from the low paid traditional (agriculture) sector to the high-paid modern
industrial sector and service sector. This transition leads to an increase in the income variation
between low-income and high-income sectors. In the later phase, when the modern industrial
sector starts to produce more output, more labour will be transferred from the traditional
agriculture sector to the modern industrial sector. The number of excess labourers in the
traditional sector will decline, and marginal productivity of the labour force will increase in the
traditional sector. As a result, income inequalities decline in the country (Adelman and
Robinson, 1989). Therefore, FDI inflows might help to increase the average income level of
people and reduce income inequalities of the host country.
On the other hand, if FDI inflows are efficiency-seeking, it will increase demand for skilled
workers; the wages of the skilled workers will increase relative to unskilled workers. Therefore,
FDI inflows may raise income inequalities by increasing wage differences (Hemmer et al.,
68
2005). Further, Girling (1973) argues that FDI depth in low-income countries tends to develop
a new elite class, which is considerably more highly paid than other labour classes. Evans
(1979) also notes that the ‘labour elites’ usually play an influential role in the state mechanism,
and get extra economic and political advantages, which increases inequality further.
The theories regarding the impact of FDI inflows on income inequalities of the host country are
diverse and conditional. The issue is hard to settle theoretically. In recent years, researchers
have focused on investigating the relationship between income inequality and foreign direct
investment. However, the empirical finding on FDI inflows and income inequalities also show
mixed results.
Several studies found that FDI inflows lead to an increase in income inequality in the host
country. For example, using the pooled Gini coefficient, Choi (2006), covering data from 1993
to 2002 for 119 countries, found that foreign direct investment positively impacts the Gini
coefficient and worsens income inequality. In a panel data analysis, Alderson and Nielsen
(1999), for 88 countries and covering data from 1967 to 1994, found a positive link between
income inequality and FDI inflows. A survey study of fifteen countries on FDI and income
inequality conducted by Bornschier and Chase-Dunn (1985) demonstrates that FDI deepens
income inequality. Herzer et al. (2013) found that FDI contributed to increases in inequality in
the long-run and Halmos (2011) found that FDI leads to higher income inequality for 15 Eastern
European countries.
Further, several studies show that the impact of foreign direct investment on income equality
varies according to the degree of economic and human resource development of the host
economy. Mihaylova (2015) assessed the relationship between income inequality and foreign
direct investment for selected Central and Eastern Europe (CEE) covering data from 1990 to
2012, by employing the fixed effect regression analysis. The study found that FDI inflows
influence income inequality, but it varies according to the human capital and economic
development of the host country. The result shows that if the level of human capital and
economic development is low, it is more likely that FDI inflows will increase income inequality.
In the panel data analysis, Beer and Boswell (2002) and Basu and Guariglia (2007) also
discovered that FDI inflows deepen the income inequalities. The studies suggest adopting
policies for fostering educational facilities for the poor. In an IMF working paper, Jaumotte et
al. (2008) also found the detrimental distributional impact of FDI and stressed the need for

69
education and training to address the problem of rising inequality in developed and developing
countries.
Several studies, especially of developed countries, reveal that FDI contributes to reducing
income inequality. In the USA, Bhandari (2006) and Chintrakarn et al. (2012) found that FDI
had a beneficial distributional impact, but the impact was not homogeneous across states. Pan-
Long (1995) investigated the effect of FDI on the Gini coefficients and claims that FDI inflows
and income inequality are negatively related. For the European Union (EU) countries, Grimalda
et al. (2010) found that FDI increases income inequality only in the new EU member states.
Chintrakarn et al. (2012) (in a panel co-integration analysis for American states) found FDI
inflows contribute to reducing income inequality.
Furthermore, several studies fail to find any statistically significant relationship between
income inequality and FDI inflows. In a panel data analysis of 88 countries over the period from
1985 to 1991, Milanovic (2002) found that FDI inflows did not have any significant effect on
income distribution. Similarly, Sylwester (2005) failed to find any significant distributional
effects of foreign direct investment, for 29 developing economies from 1970 to 1990. Bhandari
(2007) empirically tested the impact of FDI inflows on income inequality for Eastern Europe
and Central Asian transitional economies (covering data from 1990 to 2002). Applying the
fixed-effect model, this study found that foreign direct investment did not exert any significant
effect on overall income inequality. Nevertheless, when the effects were broken down into
different components, the study revealed that FDI inflows increase wage income inequality but
reduce capital income inequality.
Ucal et al. (2016) examined the short- and long-run impact of FDI on income inequality in
Turkey. The study employed the ARDL modelling approach and covered data from 1970 to
2008. The empirical results show the existence of co-integration among the variables and found
FDI inflows positively impact income inequality in the short-run; however, the study did not
find any significant effect in the long-run.
Several empirical studies find evidence of the Kuznets hypothesis of income inequalities while
investigating the impact of FDI inflows on income inequality in the host economies. For
example, in Ireland, Figini and Görg (1999) supported the Kuznets hypothesis and found an
inverted U-shaped pattern, where FDI contributed to increasing inequality at the earlier stage
of development and, in the later phase of development when per capita income reached a certain
70
level, FDI reduces income inequality. Herzer and Nunnenkamp (2011) supported the Kuznets
hypothesis for a sample of ten European countries. Using panel co-integration and causality
techniques over the period 1980 to 2000, they discovered that foreign direct investment
contributes to reducing income inequality in the long-run. However, in the short-run, FDI
inflows contributed to increasing income inequality.
Aghion et al. (1998) support the Kuznets inverted U-shaped pattern of income inequality and
argue that due to the adoption of new technologies by domestic firms, initial-stage income
inequalities might increase with rising economic growth but later stage economic growth will
contribute to reducing income inequalities.
As with other areas, the empirical analysis provides mixed results about the impact of FDI
inflows on income distribution in the host country. It appears however that the stage of
development is important. FDI can reduce inequality when there are mature political and
economic institutions. Where a country is in the early phases of development, FDI worsens
inequality by creating an elite labour force that receives the local benefits of FDI while unskilled
workers suffer due to competition. It also appears that countries with a higher level of human
capital (such as education skill, knowledge) experienced a positive impact of FDI inflows in
reducing income inequality. The type of FDI inflows, such as labour-seeking or efficiency-
seeking FDI, is also an important factor. Compared to efficiency-seeking FDI, labour-seeking
FDI inflows are more beneficial for improving income distribution in the host country,
particularly in developing countries.
The theoretical and empirical literature reviewed in this section reveal that the impact of FDI
inflows on the social conditions of a country depends on the host country’s social, economic
and political context, the sector and industry where FDI is being channelled, and more
importantly the type and motive of FDI inflows. As such, a key hypothesis being investigated
in this thesis is the degree to which FDI inflows in the manufacturing sector contribute to social
sustainability in Bangladesh.
3.5 FDI and sustainable development
Sustainable development is a wide-ranging, integrated concept. The economic, social and
environmental dimensions of sustainable development are interrelated and interconnected.
Therefore, the impact of foreign direct investment in sustainable development must be
discussed in an integrated way. However, due to the inherent complexity, most of the earlier
71
studies and analysis discuss the impact of FDI on sustainable development by breaking down
the impacts on the three dimensions of sustainable development and focussing on one aspect.
The research that describes all three dimensions of sustainable development is very limited.
In contrast, Gallagher and Zarsky (2004) examined the performance of FDI inflows on
economic, environmental and social parameters of sustainable development in Mexico. They
found that FDI inflows generated some positive contribution to the Mexican economy, export
and productivity in the manufacturing sector. However, FDI failed to create sufficient backward
linkages in the economy, and the contribution of the domestic economy to export growth was
negligible. They also found that environmental performance worsened due to the scale effects
and inadequate government commitment to environmental regulation. In the case of social
performances, FDI inflows played a minimal role in employment creation and intensified the
income inequality and outgoing migration.
Chudnovsky and López (2008) also analysed the influence of foreign direct investment on
sustainable development in Argentina, based on the three pillars of sustainable development.
Their study shows that the direct effects of FDI on the economic performances in Argentina
seemed to be positive, but the indirect or spillover effects were less encouraging. They analysed
the effects of FDI inflows on unemployment and income inequality to investigate the social and
environmental impacts. The study found that the impact of FDI inflows on income inequality
was insignificant and FDI did not appear to be the main reason for income inequality in
Argentina. In terms of environmental impacts, they note that foreign-owned firms practise better
environmental management activities. The environmental management also spilled over to the
domestic firms, and thus contributed to improving the environmental quality of the host
economy.
Gallagher and Zarsky (2005) examined the case studies and statistical evidence of the impacts
of FDI on sustainable development in developing countries. They particularly examined the
impact of FDI inflows on economic growth, technology spillovers and environmental
performance of FDI inflows. They found no consistent relationship between FDI inflows and
the relevant variables. In the case of Mexico, they found that despite a large volume of FDI
inflows, technology and knowledge spillovers were minimal, or close to zero. The study also
shows that FDI ‘crowded out' domestic investment in Mexico and ‘hollowed out’ domestic
manufacturing capacity, as foreign firms were import-based and did not contribute much to the
expansion of backward industries. The foreign firms also had an insignificant influence on
72
domestic capacity building for innovation. In terms of environmental performance,
multinational firms out-performed local firms. The study also shows that the standard
environmental regulations of the host economy are the critical determining factor for the
environmental performances of the firms. In the case of the social consequences of FDI inflows,
the study found that the number of jobs created by FDI was small compared with the amount
of FDI inflows. They conclude that FDI is no ‘miracle cure’ for the recipient country to achieve
sustainable development.
In contrast, Nagaraja (2013) investigated the question of whether the deployment of foreign
direct investment fosters sustainable development. Based on secondary data, the study
examined the impact of FDI inflows on the gross domestic product, employment generation,
gross fixed capital formation, and exports for nine selected developing economies. The results
found that FDI inflows positively impact on economic growth and development for most of the
countries, particularly in Brazil, Malaysia, Republic of Korea, Uganda and Thailand. FDI
inflows also generated a positive impact on employment in Nigeria and Zambia. Nagaraja
(2013) also discovered that FDI inflows in the mining and manufacturing sector generate jobs
in Africa, and claims that FDI inflows made a positive contribution to employment growth
through boosting capital formation and exports.
Voica et al. (2015) investigated how sustainable development is related to the flow and stock
of FDI in the European Union, and demonstrates that the environmental effects of the FDI
inflows are the most prominent effects for sustainable development. Considering the
importance of the environmental effect, Voica et al. (2015) focused on the importance of
investment in mitigating climate change-related projects and fostering responsible green
business practice. They stress the importance of investing in renewable energy development
and clean technology innovation, and focus on economic growth to reap the beneficial effects
of FDI inflows for social improvement. The study notes that the social effect is closely related
to economic growth. The increased growth increases the capability of the country to allocate
financial resources to social sustainability projects. Voica et al. (2015) also note that foreign
investment can play a complementary role in addition to public efforts in achieving the SDGs.
WWF (2003) examined the potentialities and challenges of FDI inflows in economic
development and environmental protection in the context of sustainable investment. Based on
the outcome of six case studies, they recommended adopting a coherent development strategy
and effective policies. The report emphasised the establishment of high internal standards
73
throughout the global operations of MNEs, including 'corporate citizenship standards' in
investment areas and called for promoting institutional innovation at the local level.
Huang (2001) analyses the ways FDI inflows react with the three aspects of sustainable
development. The study notes that FDI provides both opportunities and challenges for
sustainable development, for both developing and developed countries. Huang (2001) argues
that the economic activities of FDI are not the leading causes of environmental and social
problems. Externalities, market failures, common property characteristics, and inadequate
policy frameworks are responsible for generating adverse environmental consequences of FDI
inflows. In the case of attracting FDI inflow, Huang (2001) did not find enough evidence in
favour of the 'race to the bottom' principle; nor did it find any evidence of the 'race to the top'
principle. Huang (2001) claims that most of the multinationals follow the guideline of CSR and
try to run their business in a responsible manner, for their own reputation. Therefore,
multinationals are contributing to sustainable development efforts.
Ridzuan et al. (2017) empirically investigated the effects of foreign direct investment on three
basic dimensions of sustainable development (environment, economy, and social dimensions)
for Singapore. Employing an Autoregressive Distributed Lag (ARDL) model, the study found
that FDI inflows positively contribute to the economic and environmental pillars of sustainable
development by boosting economic growth and reducing CO2 emission level in that country.
However, FDI inflows worsen social sustainability by increasing the income inequality of the
country. The study called for targeting FDI, which pays higher wages and facilities to reduce
the income gap of the country. It is the literature is this subsection that I particularly hope to
contribute to.
3.6 Conclusion
The chapter analyses the relationships and mechanisms by which FDI can impact upon three
dimensions of sustainable development in the recipient country. Although FDI inflows have
received substantial attention and are considered an important vehicle for advancing sustainable
development in developing countries, very limited research has been carried out in relation to
sustainable development and FDI inflows. Even less research integrates the impact on three
dimensions on sustainable development.
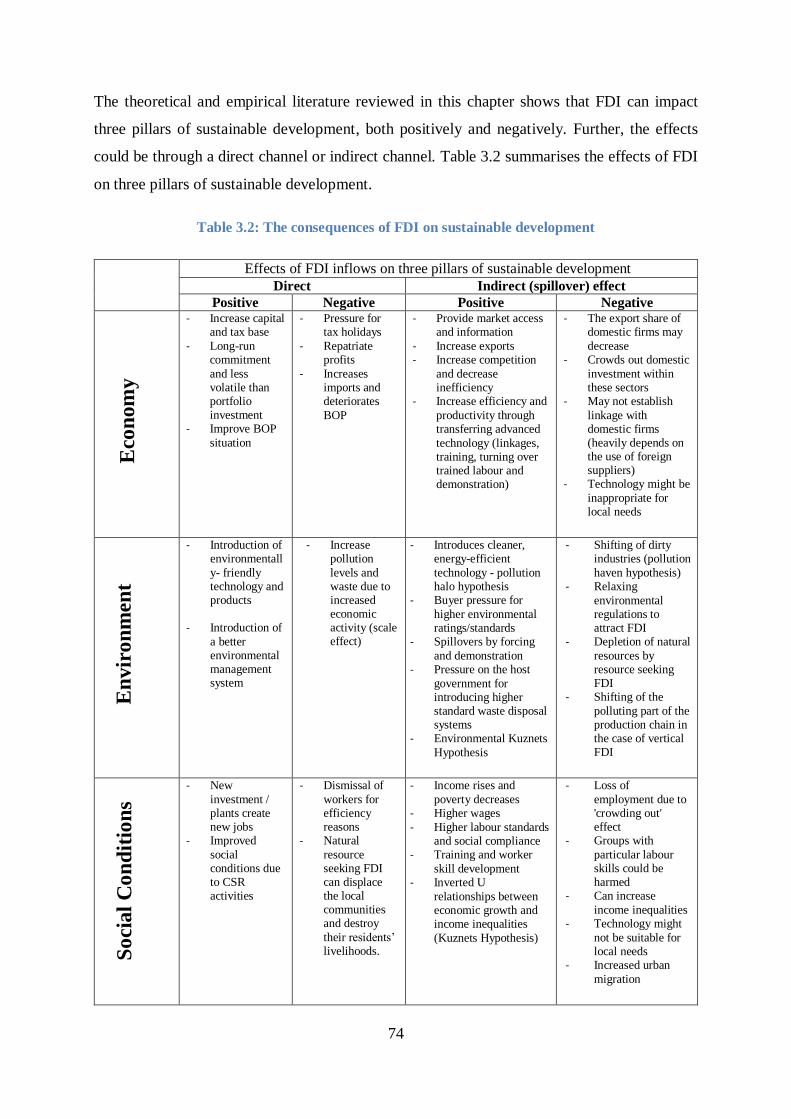
74
The theoretical and empirical literature reviewed in this chapter shows that FDI can impact
three pillars of sustainable development, both positively and negatively. Further, the effects
could be through a direct channel or indirect channel. Table 3.2 summarises the effects of FDI
on three pillars of sustainable development.
Table 3.2: The consequences of FDI on sustainable development
Effects of FDI inflows on three pillars of sustainable development
Direct Indirect (spillover) effect
Positive Negative Positive Negative
- Increase capital and tax base
- Long-run commitment
and less volatile than portfolio investment
- Improve BOP
situation
- Pressure for tax holidays
- Repatriate profits
- Increases imports and deteriorates
BOP
- Provide market access and information
- Increase exports - Increase competition
and decrease inefficiency
- Increase efficiency and
productivity through transferring advanced
technology (linkages, training, turning over trained labour and demonstration)
- The export share of domestic firms may
decrease - Crowds out domestic
investment within these sectors
- May not establish
linkage with domestic firms (heavily depends on the use of foreign suppliers)
- Technology might be
inappropriate for local needs
- Introduction of environmentall
y- friendly technology and products
- Introduction of
a better environmental management system
- Increase pollution
levels and waste due to increased economic activity (scale effect)
- Introduces cleaner, energy-efficient
technology - pollution halo hypothesis
- Buyer pressure for
higher environmental ratings/standards
- Spillovers by forcing
and demonstration - Pressure on the host
government for introducing higher standard waste disposal systems
- Environmental Kuznets
Hypothesis
- Shifting of dirty industries (pollution
haven hypothesis) - Relaxing
environmental regulations to attract FDI
- Depletion of natural
resources by resource seeking FDI
- Shifting of the
polluting part of the production chain in the case of vertical FDI
- New
investment / plants create new jobs
- Improved
social conditions due to CSR activities
- Dismissal of
workers for efficiency reasons
- Natural
resource seeking FDI can displace the local communities and destroy
their residents’ livelihoods.
- Income rises and
poverty decreases - Higher wages
- Higher labour standards and social compliance
- Training and worker
skill development - Inverted U
relationships between economic growth and income inequalities
(Kuznets Hypothesis)
- Loss of
employment due to 'crowding out' effect
- Groups with
particular labour skills could be harmed
- Can increase
income inequalities - Technology might
not be suitable for local needs
- Increased urban
migration
Eco
nom
y
En
vir
on
men
t S
ocia
l C
on
dit
ion
s

75
The theoretical and empirical literature shows that FDI inflows offer both opportunity and
challenges for sustainable development in a country. The impacts of FDI inflows on the various
components of the three dimensions of sustainable development are subject to FDI type, the
motivation for FDI, and the sector that FDI flows are directed. Appropriate regulatory and
institutional frameworks are crucial for making the FDI inflows effective for sustainable
development. Every country has a different productive structure, different domestic economic
policies, and different social, political and institutional frameworks; therefore, the impacts of
FDI inflows differ from country to country.
In this study, I investigate the research question of whether FDI promotes or hinders sustainable
development in developing countries, using Bangladesh as an example of an emerging middle-
income country. Based on the three dimensions of sustainable development, the three Research
Questions are:
1. To what extent are FDI inflows in the manufacturing sector contributing to the
economic sustainability in Bangladesh?
2. To what extent are FDI inflows in the manufacturing sector contributing to
environmental sustainability in Bangladesh?
3. To what extent are FDI inflows in the manufacturing sector contributing to social
sustainability in Bangladesh?
In the following three chapters – Chapter 4, Chapter 5 and Chapter 6, I examine the Research
Questions one, two and three respectively using both descriptive and empirical analysis taking
Bangladesh manufacturing sector as a case study. Chapter 7 unites the findings of Chapter 3, 4
and 6 to get the overall impact of FDI inflows on sustainable development in Bangladesh.
Chapter 8 provides the conclusions of the thesis.
76
CHAPTER 4: MANUFACTURING FDI AND ECONOMIC
SUSTAINABILITY IN BANGLADESH
4.1 Introduction
This chapter seeks to determine the answer to Research Question One, related to the impact of
manufacturing FDI inflows on economic sustainability in Bangladesh. The Bangladesh
economy has passed through various reforms and refinements since its independence in 1971.
From a macroeconomic perspective, the economy has achieved some success; however, the
country is still one of the lower-middle-income countries, and the industrial base of the country
is low. One of the prime goals of the development strategy of Bangladesh is to transform the
country from a low value-added agrarian economy to a high value-added industrial economy.
The manufacturing sector usually plays a key role in long-term structural change in an economy.
Generally, manufacturing brings changes to the economic structure and shifts the economy from
labour intensive to capital intensive and technology intensive (UNIDO, 2016). Since the
inception of the New Investment Policy (1982), the export-oriented manufacturing sector has
been the focus of attention with new development strategies, trade policies and industrial
policies. Technological advancement is the key to increase productivity, efficiency and
competitiveness. Considering the low investment base and the limited capacity of the country
in technological advancement, the government is promoting FDI in the manufacturing sector.
The government's current development plan suggests continuing liberalisation of the foreign
investment regime to ensure a more sophisticated production process and to improve product
quality (GOB, 2015a). Although positive contributions are anticipated, FDI inflows may also
adversely impact the economic advancement of the country through direct and indirect effects.
77
Sections 4.2 and 4.3 briefly describe the key development policy changes and the
macroeconomic performance of the Bangladesh economy. Section 4.4 describes the trend,
composition, determinants, policies and regulations of FDI inflows in Bangladesh. Section 4.5
provides a descriptive statistical analysis to investigate the impacts of export-oriented FDI
inflows on the economic sustainability in Bangladesh. Section 4.6 provides an empirical
analysis to explore the long-run and short-run effects and dynamics of FDI inflows in the
manufacturing sector in Bangladesh.
4.2 Evolution of Bangladesh economy
Bangladesh is a small South Asian country with a population of over 160 million. As per the
World Bank classification, Bangladesh is a lower-middle-income economy. Real GDP has been
growing at over 6 percent during the last two decades (MOF, 2017). The development strategy
and economy of Bangladesh has undergone successive refinements and reforms since its
independence in 1971.
In the early 1970s, economic management in Bangladesh mostly followed the import-
substituting, inward-looking development policy within an overall framework of a state-
controlled economy (Razzaque et al., 2003). The public sector played a key role, and high
government controls and regulations were imposed on private sector investment. Controls
included investment sanctioning, price controls, discretionary quantitative import restrictions,
exchange controls and high import tariffs (Ahmed, 2005; Mahmud et al., 2008). The
government imposed high tariffs at a maximum rate of 400 percent and imported products were
considered luxury items. Only a few items were permitted for importation and these were
known as the 'positive-list' (Rashid, 2000). The level of exports was also low; one item (raw
jute and jute products) accounted for more than 80 percent of the total exports until mid-1980s.
Therefore, the total trade volume was low (GOB, 2015b; Salim, 2003) and an overvalued fixed
exchange rate system was in operation.
Following the socialist development path, the government nationalised over 90 percent of
medium and large enterprises (Nath, 2012). Intending to protect the infant industries of the
newly independent country and to reduce the fiscal deficit and balance of payment deficit, the
government pursued a very rigid import-substituting industrialisation strategy (Rashid, 2000).
This import substitution policy can contribute to the industrialisation of the country by replacing
78
imported goods with domestic production. The reduction in imports can also contribute to
improving the external balance situation of the country.
However, the import substitution and inward-looking strategy was not only a constraint to the
advancement of industrialisation in the country but also generated a distorted incentive structure
and undermined the potential for export growth (Hossain and Alauddin, 2005). Both the fiscal
and trade balances underperformed as a result of the protected trade policy. The country faced
severe macroeconomic imbalances through the 1970s and early 1980s.
In the 1970s, the average real GDP growth was around 4 percent. However, the growth of
manufacturing was higher at around 8 percent with the growth of agriculture at around 2.5
percent (Nath, 2012; Rashid, 2000). The manufacturing value added to GDP ratio was around
10 percent. The country faced a high annual average inflation rate of about 37 percent during
the 1970s (Sultana and Uddin, 2013). High import tariffs make imports expensive, and the high
cost of imported raw materials also increased production costs. Further, the government
increased the money supply to feed the construction and rehabilitation needs of the newly
independent nation. The rise in international oil price also contributed to the rapid increase in
the price level.
The Bangladesh Government initiated major reform programs in the late 1980s and adopted
market-oriented liberalisation policies. The reforms programs were guided by the Structural
Adjustment Programme (SAP) as prescribed by the World Bank and the Structural Adjustment
Facility (SAF), prescribed by the IMF. The policy reforms included intensifying privatisation,
trade liberalisation, financial sector reforms, and agricultural reforms (Mahmud et al., 2008).
The key characteristics of trade liberalisation were reducing and withdrawing quotas from
imported items, removing the barriers against rationalisation of the tariff structure, and
depreciating the exchange rate to encourage exports (Razzaque et al., 2003; Mahmud et al.,
2008).
The government initiated various measures to stimulate export growth; significantly, the tariff
and other non-tariff barriers were removed. Most products were permitted for importation. Only
a few items were banned or restricted for importation for national security and welfare reasons;
therefore, the 'positive list' for imports was replaced by the 'negative list' and 'restricted list'
(Rashid, 2000).
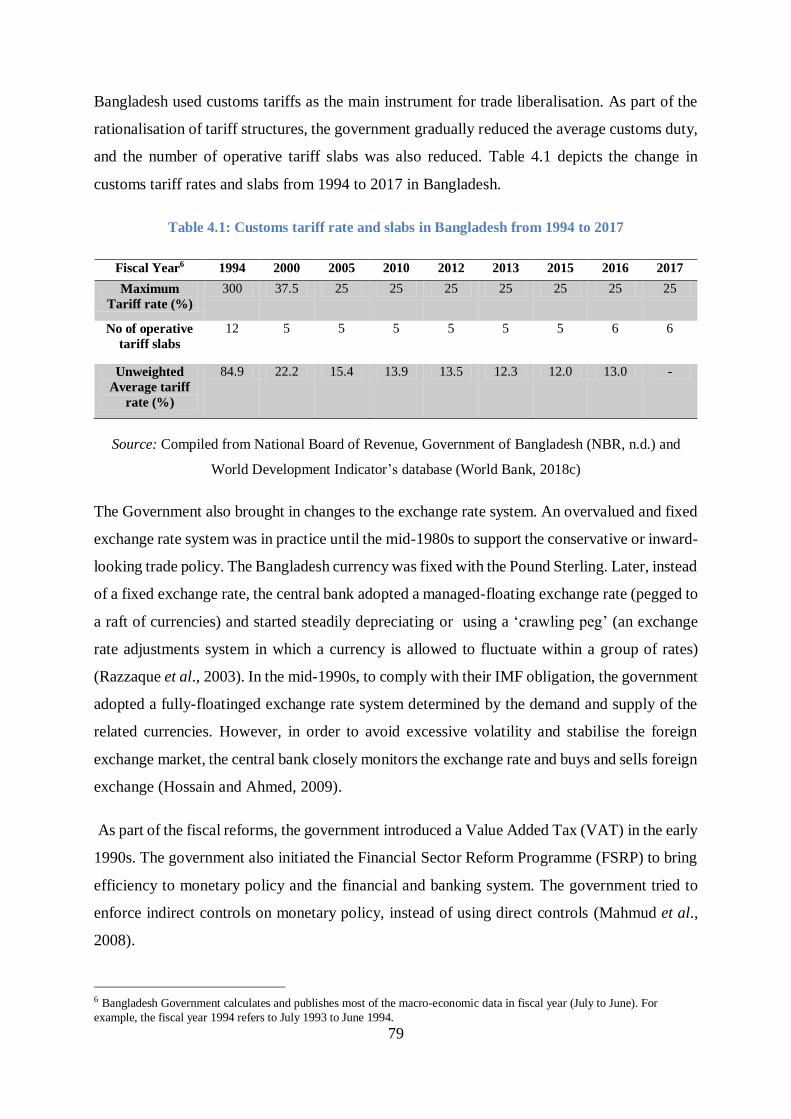
79
Bangladesh used customs tariffs as the main instrument for trade liberalisation. As part of the
rationalisation of tariff structures, the government gradually reduced the average customs duty,
and the number of operative tariff slabs was also reduced. Table 4.1 depicts the change in
customs tariff rates and slabs from 1994 to 2017 in Bangladesh.
Table 4.1: Customs tariff rate and slabs in Bangladesh from 1994 to 2017
Fiscal Year6 1994 2000 2005 2010 2012 2013 2015 2016 2017
Maximum
Tariff rate (%)
300 37.5 25 25 25 25 25 25 25
No of operative
tariff slabs
12 5 5 5 5 5 5 6 6
Unweighted
Average tariff
rate (%)
84.9 22.2 15.4 13.9 13.5 12.3 12.0 13.0 -
Source: Compiled from National Board of Revenue, Government of Bangladesh (NBR, n.d.) and
World Development Indicator’s database (World Bank, 2018c)
The Government also brought in changes to the exchange rate system. An overvalued and fixed
exchange rate system was in practice until the mid-1980s to support the conservative or inward-
looking trade policy. The Bangladesh currency was fixed with the Pound Sterling. Later, instead
of a fixed exchange rate, the central bank adopted a managed-floating exchange rate (pegged to
a raft of currencies) and started steadily depreciating or using a ‘crawling peg’ (an exchange
rate adjustments system in which a currency is allowed to fluctuate within a group of rates)
(Razzaque et al., 2003). In the mid-1990s, to comply with their IMF obligation, the government
adopted a fully-floatinged exchange rate system determined by the demand and supply of the
related currencies. However, in order to avoid excessive volatility and stabilise the foreign
exchange market, the central bank closely monitors the exchange rate and buys and sells foreign
exchange (Hossain and Ahmed, 2009).
As part of the fiscal reforms, the government introduced a Value Added Tax (VAT) in the early
1990s. The government also initiated the Financial Sector Reform Programme (FSRP) to bring
efficiency to monetary policy and the financial and banking system. The government tried to
enforce indirect controls on monetary policy, instead of using direct controls (Mahmud et al.,
2008).
6 Bangladesh Government calculates and publishes most of the macro-economic data in fiscal year (July to June). For
example, the fiscal year 1994 refers to July 1993 to June 1994.

80
In addition to liberalisation and fiscal reforms, the government offers various incentives to
expand the export-oriented industrialisation in the country which includes: duty drawback
facility (1983); back-to-back letter of credit facility (1987); easing international credit facility;
bonded warehouse (1978); incentives for export performance (1986); rebate on tax and duty for
machinery imports; exemption of income tax; subsidy on interest rate; and tax holiday facilities
(Mahmud et al., 2008, Rashid, 2000).
The government also brought changes to the development planning system. Since
independence, the government of Bangladesh has formulated and adopted eleven investment
and industrial policies for the industrial development of Bangladesh. From the first New
Industrial Policy (1982) to the latest, the industrial policies focus on the expansion of the private
sector, promotion of market forces, and the liberalisation of imports, exports and foreign
investment to bring efficiency and competitiveness in industry. The main features of the policies
are described in Table 4.2.
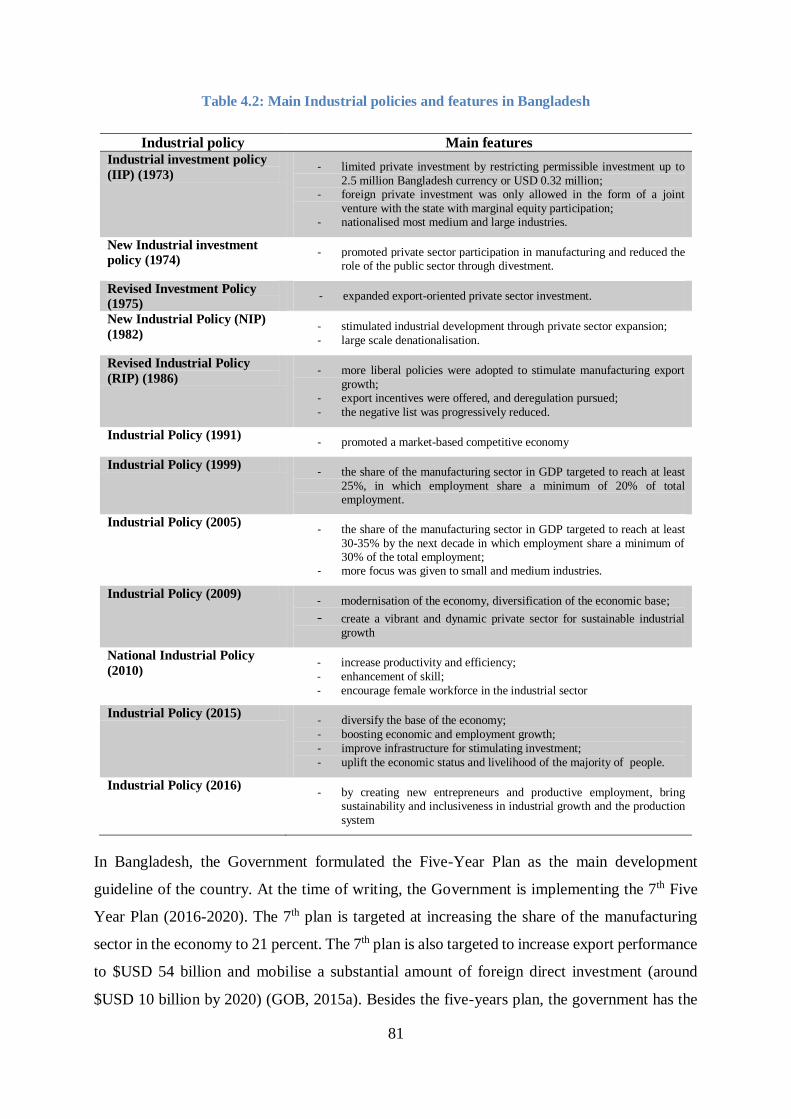
81
Table 4.2: Main Industrial policies and features in Bangladesh
Industrial policy Main features Industrial investment policy
(IIP) (1973) - limited private investment by restricting permissible investment up to
2.5 million Bangladesh currency or USD 0.32 million; - foreign private investment was only allowed in the form of a joint
venture with the state with marginal equity participation; - nationalised most medium and large industries.
New Industrial investment
policy (1974) - promoted private sector participation in manufacturing and reduced the
role of the public sector through divestment.
Revised Investment Policy
(1975) - expanded export-oriented private sector investment.
New Industrial Policy (NIP)
(1982) - stimulated industrial development through private sector expansion;
- large scale denationalisation.
Revised Industrial Policy
(RIP) (1986) - more liberal policies were adopted to stimulate manufacturing export
growth; - export incentives were offered, and deregulation pursued;
- the negative list was progressively reduced.
Industrial Policy (1991) - promoted a market-based competitive economy
Industrial Policy (1999) - the share of the manufacturing sector in GDP targeted to reach at least
25%, in which employment share a minimum of 20% of total employment.
Industrial Policy (2005) - the share of the manufacturing sector in GDP targeted to reach at least
30-35% by the next decade in which employment share a minimum of 30% of the total employment;
- more focus was given to small and medium industries.
Industrial Policy (2009) - modernisation of the economy, diversification of the economic base;
- create a vibrant and dynamic private sector for sustainable industrial
growth
National Industrial Policy
(2010) - increase productivity and efficiency;
- enhancement of skill;
- encourage female workforce in the industrial sector
Industrial Policy (2015) - diversify the base of the economy;
- boosting economic and employment growth;
- improve infrastructure for stimulating investment;
- uplift the economic status and livelihood of the majority of people.
Industrial Policy (2016) - by creating new entrepreneurs and productive employment, bring
sustainability and inclusiveness in industrial growth and the production
system
In Bangladesh, the Government formulated the Five-Year Plan as the main development
guideline of the country. At the time of writing, the Government is implementing the 7th Five
Year Plan (2016-2020). The 7th plan is targeted at increasing the share of the manufacturing
sector in the economy to 21 percent. The 7th plan is also targeted to increase export performance
to $USD 54 billion and mobilise a substantial amount of foreign direct investment (around
$USD 10 billion by 2020) (GOB, 2015a). Besides the five-years plan, the government has the
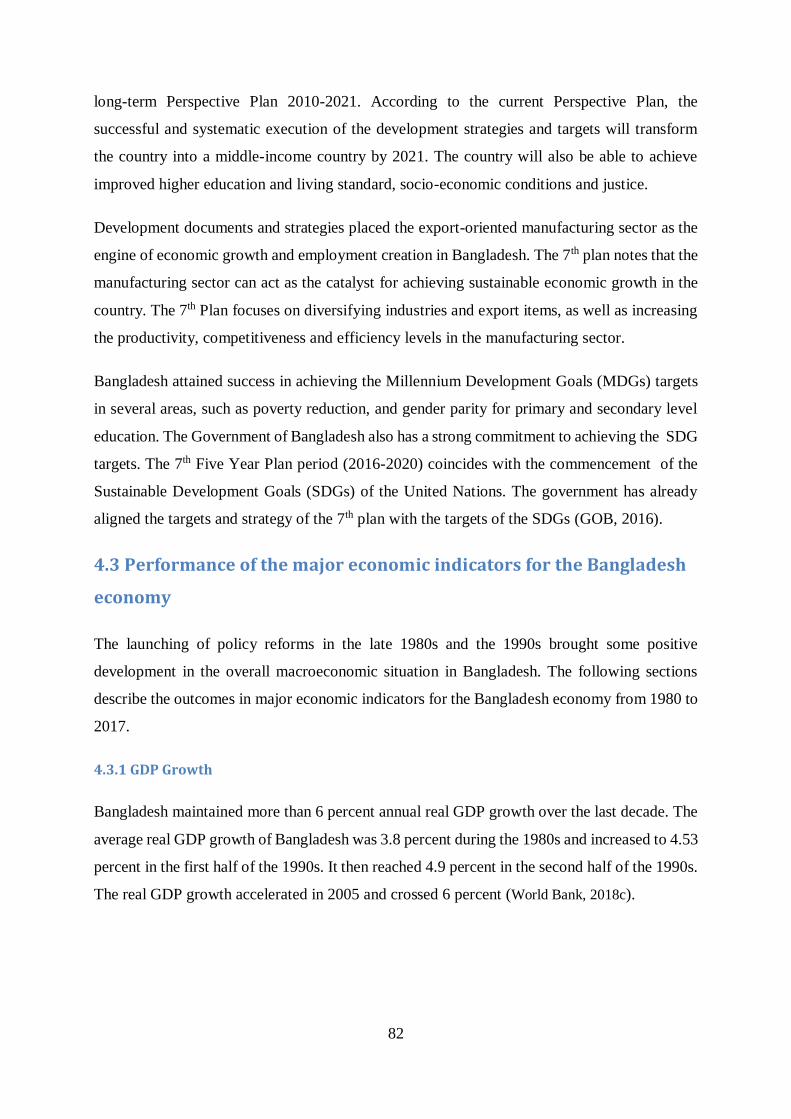
82
long-term Perspective Plan 2010-2021. According to the current Perspective Plan, the
successful and systematic execution of the development strategies and targets will transform
the country into a middle-income country by 2021. The country will also be able to achieve
improved higher education and living standard, socio-economic conditions and justice.
Development documents and strategies placed the export-oriented manufacturing sector as the
engine of economic growth and employment creation in Bangladesh. The 7th plan notes that the
manufacturing sector can act as the catalyst for achieving sustainable economic growth in the
country. The 7th Plan focuses on diversifying industries and export items, as well as increasing
the productivity, competitiveness and efficiency levels in the manufacturing sector.
Bangladesh attained success in achieving the Millennium Development Goals (MDGs) targets
in several areas, such as poverty reduction, and gender parity for primary and secondary level
education. The Government of Bangladesh also has a strong commitment to achieving the SDG
targets. The 7th Five Year Plan period (2016-2020) coincides with the commencement of the
Sustainable Development Goals (SDGs) of the United Nations. The government has already
aligned the targets and strategy of the 7th plan with the targets of the SDGs (GOB, 2016).
4.3 Performance of the major economic indicators for the Bangladesh
economy
The launching of policy reforms in the late 1980s and the 1990s brought some positive
development in the overall macroeconomic situation in Bangladesh. The following sections
describe the outcomes in major economic indicators for the Bangladesh economy from 1980 to
2017.
4.3.1 GDP Growth
Bangladesh maintained more than 6 percent annual real GDP growth over the last decade. The
average real GDP growth of Bangladesh was 3.8 percent during the 1980s and increased to 4.53
percent in the first half of the 1990s. It then reached 4.9 percent in the second half of the 1990s.
The real GDP growth accelerated in 2005 and crossed 6 percent (World Bank, 2018c).
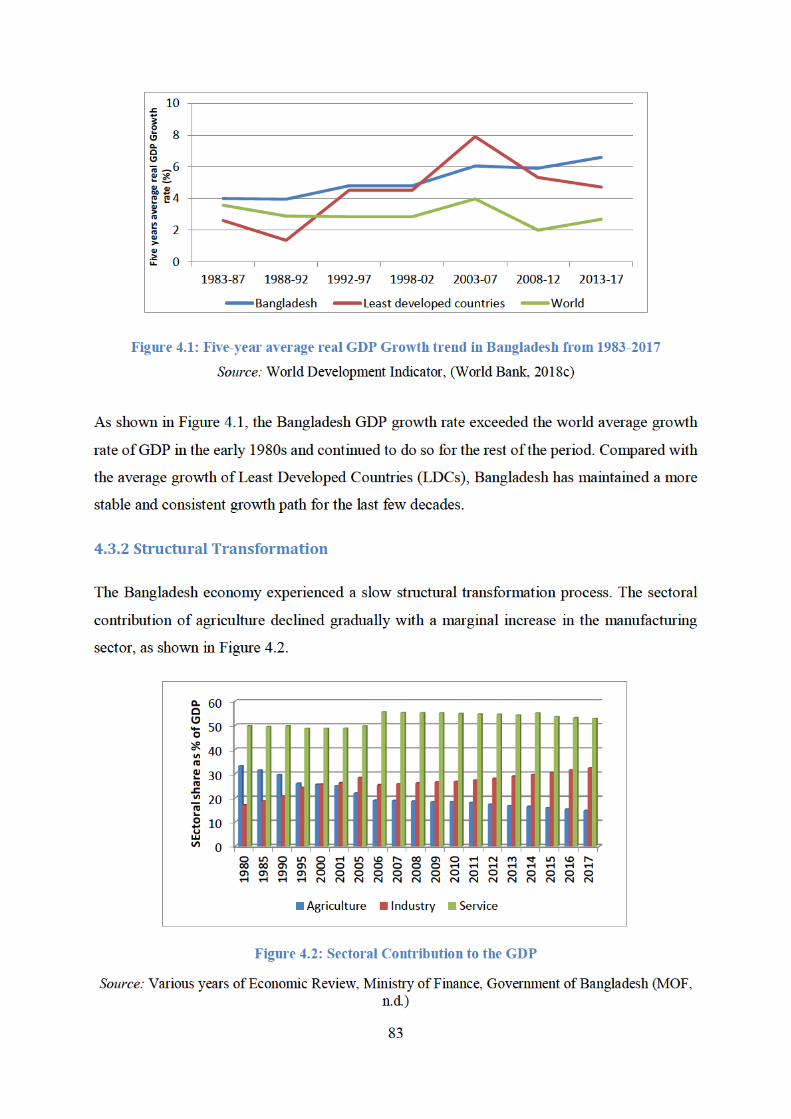
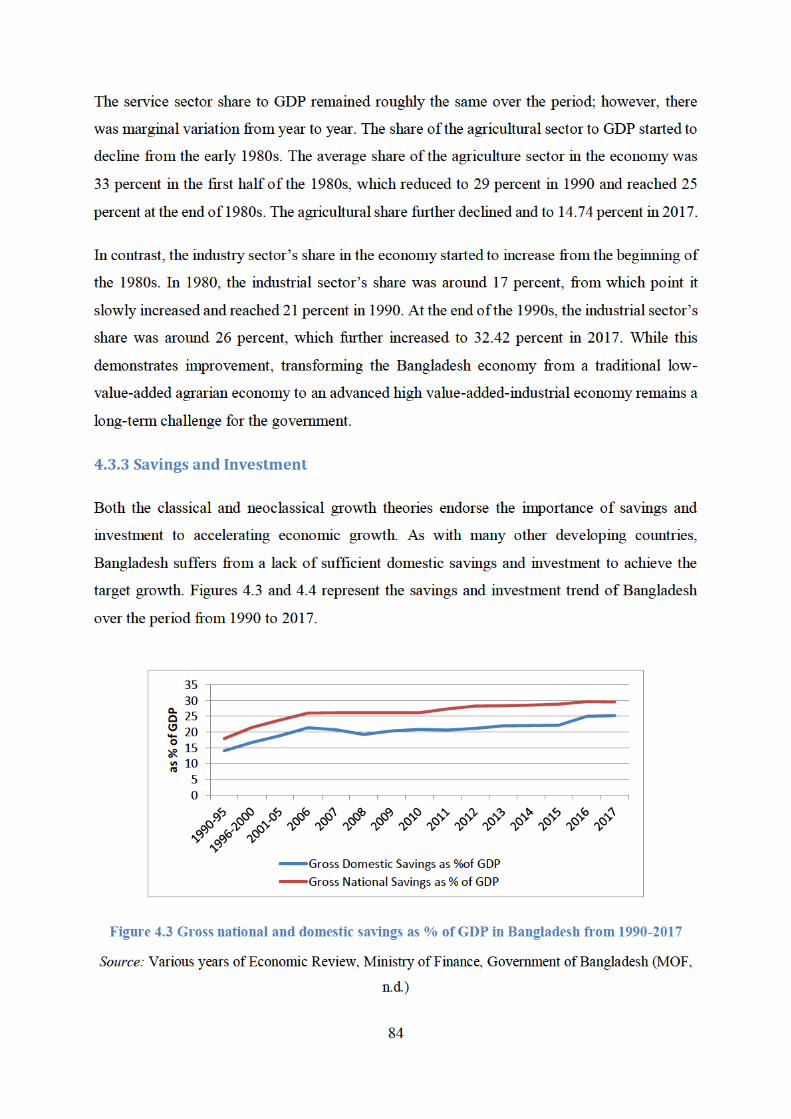

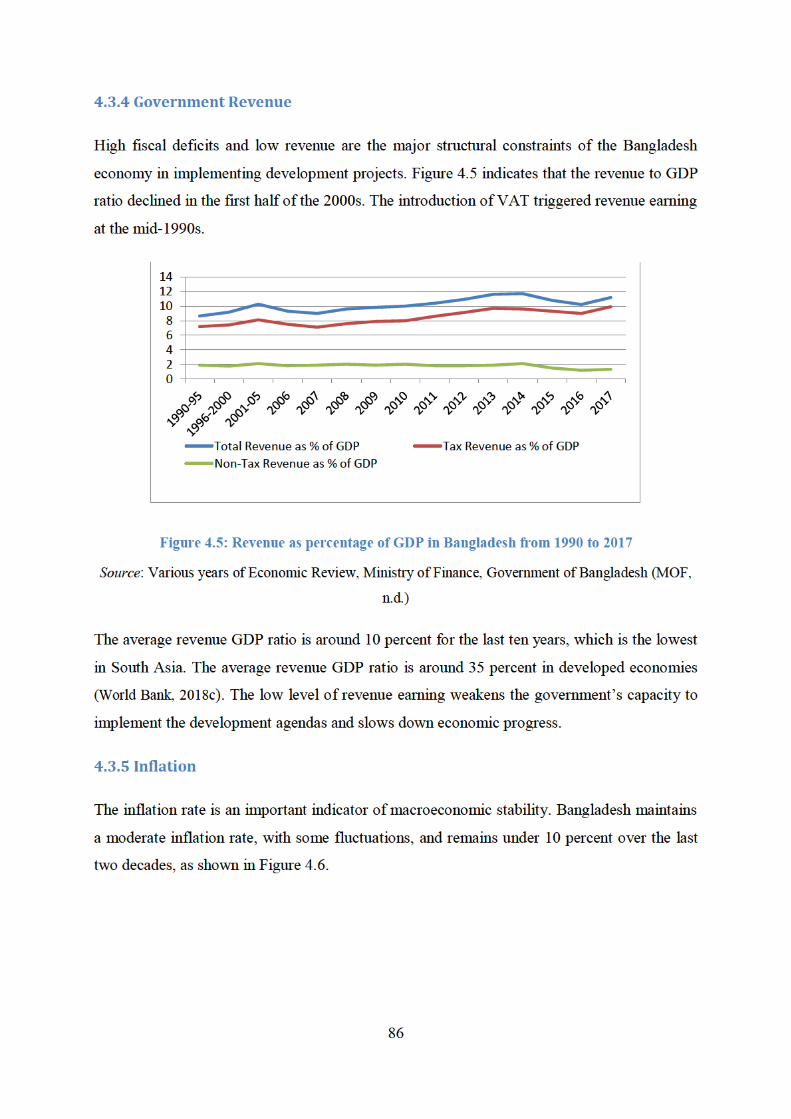

87
Figure 4.6: Inflation trend in Bangladesh during 1985 to 2017
Source: World Development Indicator (World Bank, 2018c)
The average inflation rate in the early 1990s was 5.5 percent; however, the average inflation
rate increased in the second half of the 1990s and crossed into double-digits in 1996. The
catastrophic cyclone and flood caused a loss of crops in 1995 and this contributed to increased
price levels. However, at the beginning of the 2000s, the average inflation rate fell to 3.03
percent, after which it increased reaching 9 percent in 2011. Recent inflation rates show a
declining trend; the average inflation rate for the last five years is around 7 percent. The inflation
rate in Bangladesh is still high compared to the global inflation rate or even the inflation rate of
other low-income countries (World Bank, 2018c) High inflation leads to weakening investor
confidence and lowering the incentive to save. High inflation also adversely affects the poor, as
their real wage reduces with the increase in prices. The poor also have less access to interest-
bearing accounts and hold minimal financial or real assets other than cash (Ha and Ohnsorge,
2019).
4.3.6 Import and Export Growth
The import and export growth of Bangladesh has fluctuated over the period. Figure 4.7
illustrates the high but fluctuating growth rate for imports over the last three decades. In the
early 1990s, Bangladesh adopted a liberalised import policy to support export-oriented
domestic industries. In the early 1990s, the average import growth was around 15 percent. In
the second half of the 1990s, the average growth rate was lower and Bangladesh maintained an
average of 11 percent import growth between 2000 and 2015.
0
5
10
15
20
25
Inflation (annual %)
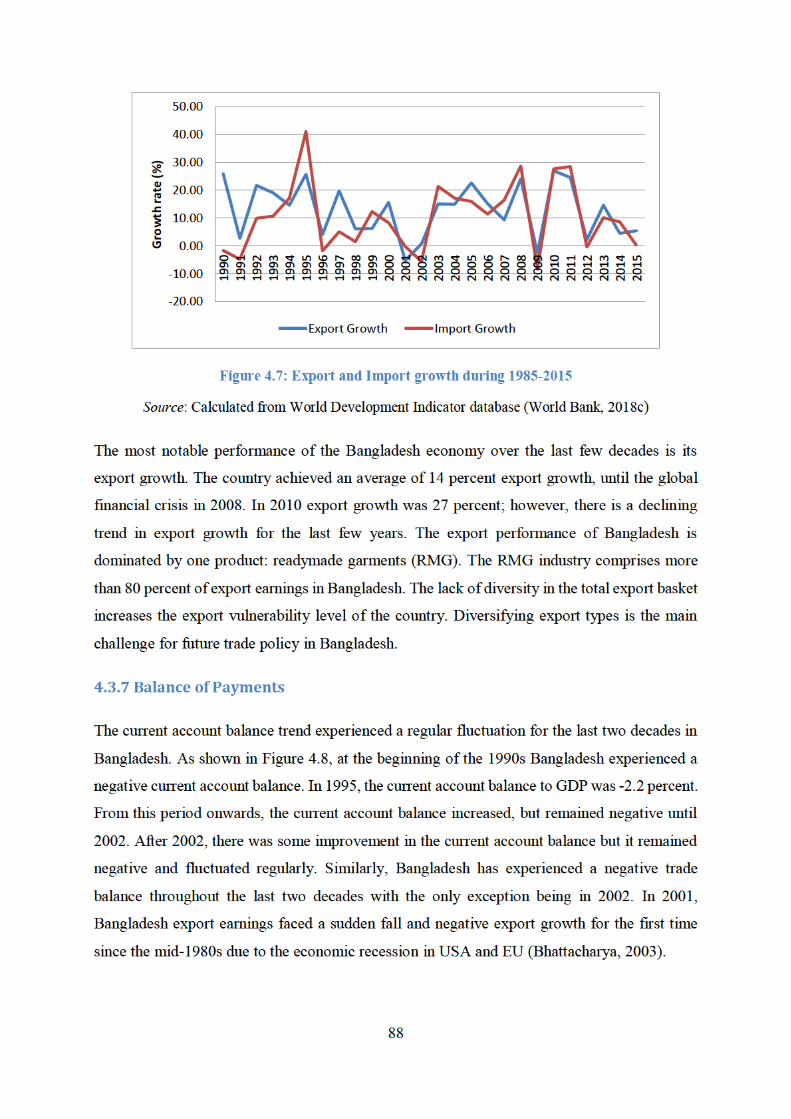
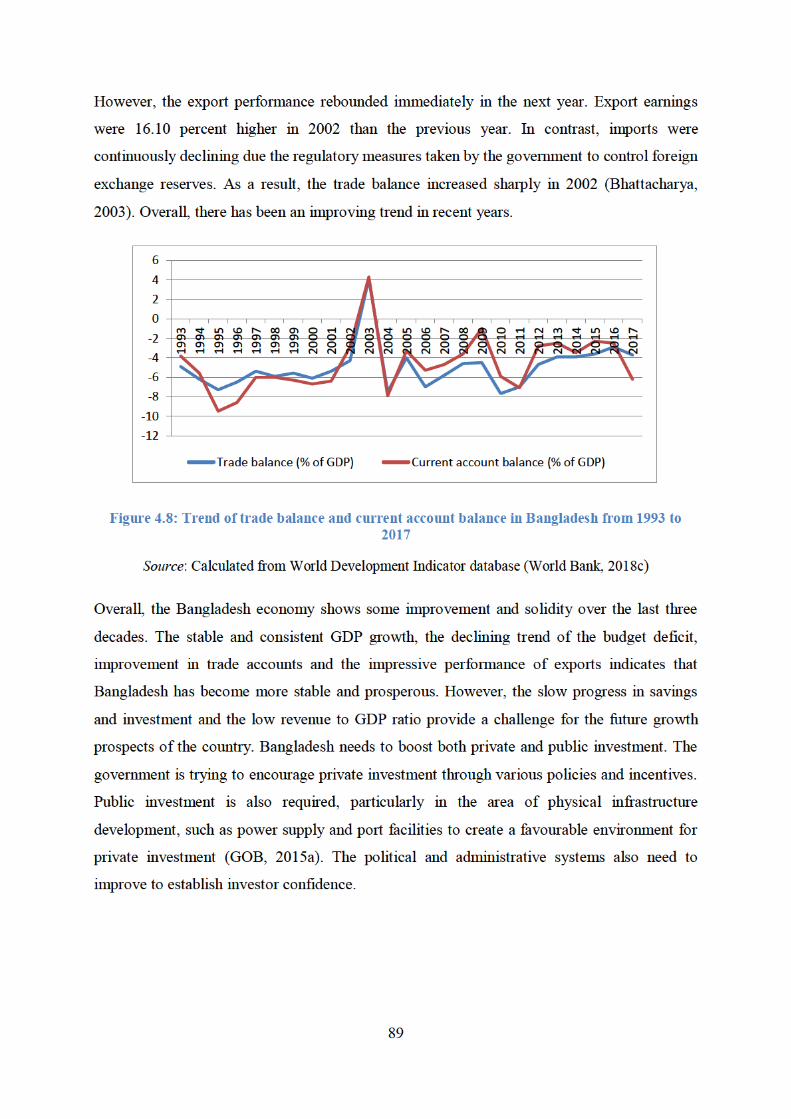
90
Although Bangladesh achieved success in GDP growth, the sources of growth or structural
composition of growth is not as impressive with the industry sector only slowly replacing the
agricultural sector. Therefore, transforming the economy from a low value-added agrarian
economy to the advanced high value-added industrial economy remains a long-term challenge
for the Bangladesh economy.
The Bangladesh economy also suffers from a lack of diversification. Economic growth and
export growth primarily come from one single industry (textile and clothing) which exposes the
fragility of this sector and makes the Bangladesh economy vulnerable to any domestic or
international crisis. The initiatives for diversifying the economy, especially in the industrial
sector in terms of product, market, and services, are crucial for sustainability. Moreover,
sustainability requires an inclusive and diverse economy.
The rapid expansion of the manufacturing sector is the cornerstone of development policies in
Bangladesh. Rapid globalisation offers many benefits, but also poses substantial challenges to
this sector. To make the sector globally competitive there is a need to improve product quality
and introduce industrial sophistication and technological advancement, with long-term
investment essential. The low level of domestic savings, investment, and revenue earning
clearly indicate the limited domestic capacity and the need for foreign investment.
4.4 FDI inflow in Bangladesh: policies, trend, sectoral composition and
determinants
Like many other developing countries, Bangladesh is progressively adopting more open
policies and offering various incentives to attract foreign direct investment for the last four
decades. Bangladesh recently reached the status of a lower-middle-income country due to its
strong growth performance over the last decade, stable macroeconomic situation and poverty
reduction efforts (World Bank, 2019). Bangladesh has a target to reach the level of an upper-
middle-income country by 2021. The country is also in the process of transitioning from an
agriculture-based economy to an industrial economy.
However, the industrial base of the country is low and suffers from limited technological
advancement. The country needs to raise the investment rate at least 33 percent of GDP to reach
the targets of the current development plan (GOB, 2015a). Public investment is estimated to
account for 23 percent of the total and private investment is targeted at around 77 percent of
91
total investment. It is estimated that foreign investment needs to increase to at least 3 percent
of GDP (GOB, 2015a, p. 40). The country is attempting to create a favourable investment
climate to attract more FDI inflows; however, it has achieved little success in FDI inflows in
the country. The net FDI inflow as a percentage of GDP is still low and concentrated to only a
few sectors. Lack of coherence policy, a low level of skilled workers, limited purchasing
capacity, inadequate infrastructure facilities, lack of good governance and high level of
corruption are the major impediments to attracting FDI in Bangladesh.
4.4.1 The major policies to encourage and regulate foreign investment in
Bangladesh
Bangladesh does not have any specific FDI policy to regulate and protect FDI in the country.
The country is actively promoting foreign investment through its industrial policy and various
liberalisation and export-oriented growth strategies. The Foreign Private (Promotion and
Protection) Investment Act, 1980, is the core legal basis to regulate the private investment in
the country. The other laws affecting foreign investment include Industrial Policy 2005, 2010
and 2016, The Bangladesh Export Processing Zones Authority Act, 1980, and The Bangladesh
Economic Zone Act, 2010.
The government enacted The Foreign Private (Promotion and Protection) Investment Act, 1980
to facilitate and mobilise foreign investment from capital-exporting developed countries. The
Act sets out the equal treatment of domestic and foreign investors and provides all legal
protections from nationalisation and expropriation. The Act also ensures the repatriation of
capital and dividend. The Act does not impose any prohibition for foreign investment for
specific sectors; however, the National Industrial Policy 2005 and 2010 reserves four sectors
exclusively for public investment due to national security. The sectors are defence, forests,
nuclear power, and security printing.
The government imposes an additional restriction on investing in 17 controlled or regulated
industries. The industries include (BIDA, 2018):
Private power generation and distribution;
Deep-sea fishing;
Setting up a private bank and financial institutions;
Setting up a private insurance company;
92
Investing in natural gas extraction and distribution;
Investing in coal extraction and distribution;
Investing in other minerals extraction and distribution;
Refining and recycling of crude oil;
Establishing industries that use mineral resources as inputs;
Telecommunication and satellite industries;
Aviation industry;
Shipping industry; and
Large physical infrastructure projects such as express highways, port, railways
The government provides special incentives to encourage investment in priority sectors: the
Industrial Policy Act of 2016 offers special financial incentives and policy support for high-
priority industries. High priority-industries include industries that have the potential to generate
large-scale employment, substantial export revenue and those with a recognised ability to
encourage innovation and technological advancement. The priority include software and
information technology; textiles and readymade garments; leather industries; jute industries;
pharmaceuticals and food processing and agricultural industries.
The government passed The Bangladesh Export Processing Zones Authority Act, 1980 to
regulate and encourage the export-oriented investment in the export promotion zone areas.
Under this Act, the government established the first Export Processing Zone (EPZ)7 in
Chittagong in 1983. Later, seven more EPZs were established in Dhaka (Savar), Mongla,
Ishwardi, Comilla, Uttara, Karnaphuli (Chittagong) and Adamjee (Dhaka). A private EPZ
owned by Korean investors is also in operation in Chittagong. The primary objective of
establishing the EPZ is to provide a territory or area with necessary facilities where potential
investors can find an investment-friendly climate (BEPZA, Website).
Bangladesh also enacted The Bangladesh Economic Zone Act, 2010 intending to accelerate
economic activities and create employment opportunities. Special Economic Zones (SEZs)8 are
geographically delineated areas set up by the government, offering various incentives to attract
7Export Processing Zones (EPZs) are special designated economic territories where production plants can manufacture,
import and shipp their products with reduced or minimum customs duty and tax. EPZ usually offers incentives and a barrier-
free environment to attract foreign investment for export-oriented production. It also provides better and well-maintained physical infrastructure facilities for business. 8Special Economic Zones (SEZs) are geographically located special economic enclave where rules and regulations are
applied differently from rest of the country for operating business and trades in those areas. The business entities enjoy special privileges to set up and run their business in SEZs.
93
inward investment. The Act permits private entrepreneurs to participate in managing the
economic zones and develop physical infrastructure facilities within the zones. At present, there
are 55 government-owned, and eleven privately-owned economic zones operating. As part of
the promotion of foreign investment, Bangladesh signed and ratified a number of bilateral and
multilateral investment and trade agreements. Bangladesh has already signed 28 bilateral
investment treaties with countries such as Austria, China, Denmark, France, Germany, India,
Indonesia, Iran, Italy, Japan, Republic of Korea, Malaysia, Pakistan, Philippines, Singapore,
Switzerland, Thailand, United Kingdom and the United States. The treaties provide the
guarantee of national treatment, avoidance of double taxation, duty-free access facilities and
preferential tariff treatment. Several other regional trade agreements are under negotiations
(BIDA, 2018).
Bangladesh also offers some fiscal incentives to attract domestic, as well as foreign, private
investment. Bangladesh provides tax holidays up to twelve years for encouraging foreign and
domestic investment into 'thrust' or critically important and some physical infrastructure sectors.
‘Thrust’ sectors include pharmaceuticals, textiles, fertiliser, biotechnology, chemicals and dyes,
automobiles, electronics, software and ICT related industries (BIDA, 2018). Physical
infrastructure projects such as deep seaports, express highways, renewable power generation,
water treatment plants, as well as export processing and special economic zones, also enjoy a
tax holiday facility. Table 4.3 represents the tax holidays for investment projects in Bangladesh.

94
Table 4.3: Tax holidays for various investment projects in Bangladesh
Year Rate of
tax
holidays
for thrust
sectors
located in
urban
areas
Rate of
tax
holidays
for thrust
sectors
located in
rural
areas
Rate of tax
holidays for
physical
infrastructure
projects
The maximum
rate for projects
located in EPZs
Infrastructure
Projects
Year-1 100% 100% 100% 100% 100%
Year-2 100% 100% 100% 100% 100%
Year-3 60% 70% 80% 100% 100%
Year-4 40% 55% 70% 50% 100%
Year-5 20% 40% 60% 50% 100%
Year-6 25% 50% 50% 100%
Year-7 10% 40% 25% 100%
Year-8 30% 100%
Year-9 20% 100%
Year-10 10% 100%
Year-11 70%
Year-12 30%
Source: Bangladesh Investment Development Authority website (BIDA, 2018)
Other fiscal incentives offered by the government include (Bangladesh Investment
Development Authority website (BIDA, 2018):
Duty-free importation of raw material and machinery;
Exemption from tax on dividends;
100 percent repatriation of capital and dividends;
Stamp duty exemption and a waiver from the registration fee for establishing a factory;
Duty and tax exemption on exports;
Waiver of customs duty for importing up to two vehicles;
Avoiding double taxation;
Rebate on income tax;
Foreign exchange account facility;
Exemption of income tax on royalty;
Zero capital gains tax;
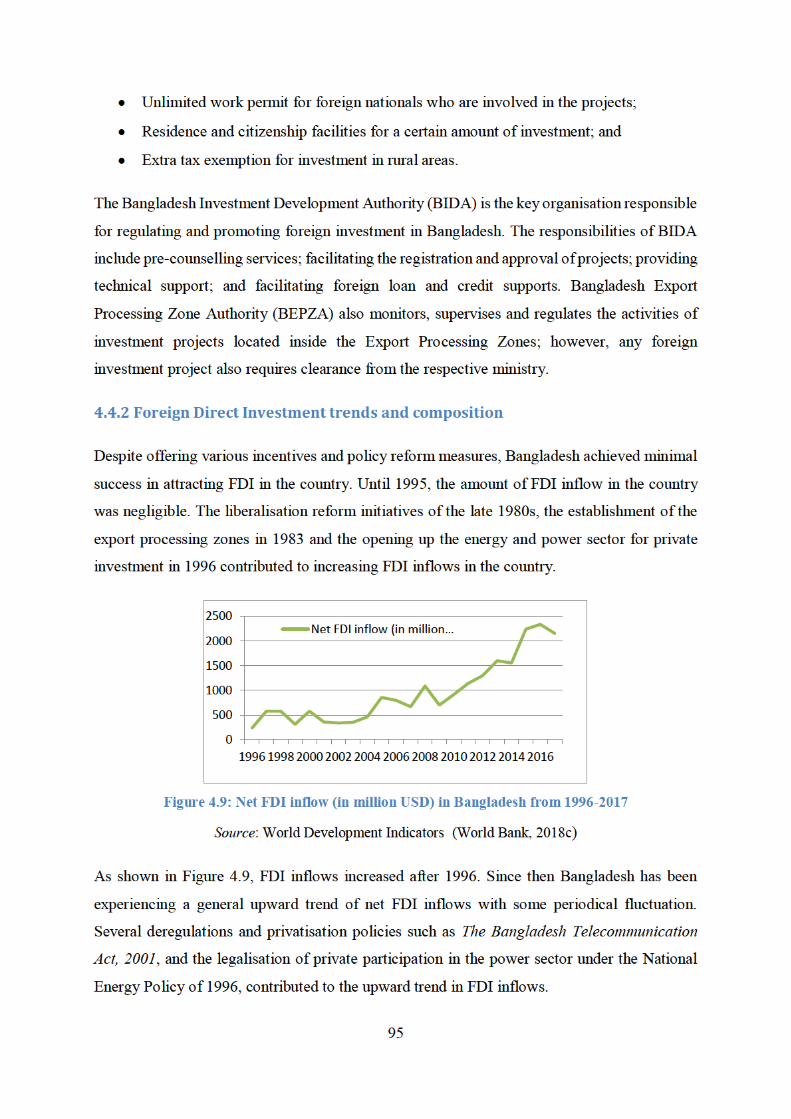
96
External shocks like the 1997 Asian Financial crisis and the 2008 Global Financial Crisis have
caused fluctuations but no lasting damage. Despite the upward trend, FDI inflows remain
generally low and recent growth is sluggish. During the first half of the 1990s, the annual
average FDI inflows were only USD 6.7 million, which increased to USD 339 million in the
second half of the 1990s and reached USD 2152 million in 2017. However, net FDI inflows as
a percentage of GDP in Bangladesh remains below 2 percent (World Bank, 2018c).
FDI inflows in Bangladesh are clustered into five broad sectors – agriculture, manufacturing,
power, trade and transport sectors. The manufacturing sector receives the highest share of FDI
inflows. Table 4.4 presents the sectoral inflow of FDI in Bangladesh from 1996 to 2017.

97
Table 4.4: The sector-wise FDI inflows in Bangladesh from 1996 to 2017 (in million USD)
Year Agriculture
& fishing
Manufacturing Power, gas,
and
petroleum
Trade and
Commerce
Transport and
telecommunications
Others Total
1996 0.26 89.07 46.98 92.25 1.48 1.57 231.61
1997 1.35 162.37 242.09 158.86 5.93 4.69 575.29
1998 1.38 139.78 235.19 164.31 25.31 10.49 576.46
1999 2.94 191.74 83.54 27.53 0.53 2.48 309.12
2000 15.18 193.46 301.09 53.24 5.4 10.27 578.64
2001 1.06 132.25 192.44 27.57 0.85 0.3 354.47
2002 1.59 142.95 57.87 70.83 48.54 13.69 335.47
2003 4.07 165.04 88.18 43.98 45.88 3.09 350.24
2004 1.73 139.46 124.05 66.59 127.51 1.09 460.41
2005 2.32 219.27 208.26 130.48 281.95 2.98 845.26
2006 1.26 104.86 208.25 130.24 346.91 0.96 792.48
2007 7.33 142.68 215.94 92.87 201.9 5.64 666.36
2008 14.43 168.49 101.02 153.4 641.39 7.58 1086.31
2009 11.79 211.29 51.15 161.59 250.14 14.2 700.16
2010 13.63 238.78 92.06 186.63 360.31 21.91 913.32
2011 5.59 425.5 238.21 263.39 182.78 20.91 1136.38
2012 60.85 515.21 126.63 163.7 375.64 50.53 1292.56
2013 31.04 702.05 98.88 354.51 326.21 86.57 1599.26
2014 31.58 722.87 49.76 414.16 237.18 95.73 1551.28
2015 24.72 841.23 573.6 419.16 258.42 118.26 2235.39
2016 43.15 846.81 434.31 283.22 582.05 143.18 2332.72
2017 35.17 980.24 260.37 409.58 238.71 227.49 2151.56
Source: FDI Survey Report, July-December, 2017, Bangladesh Bank (Bangladesh Bank, 2017)
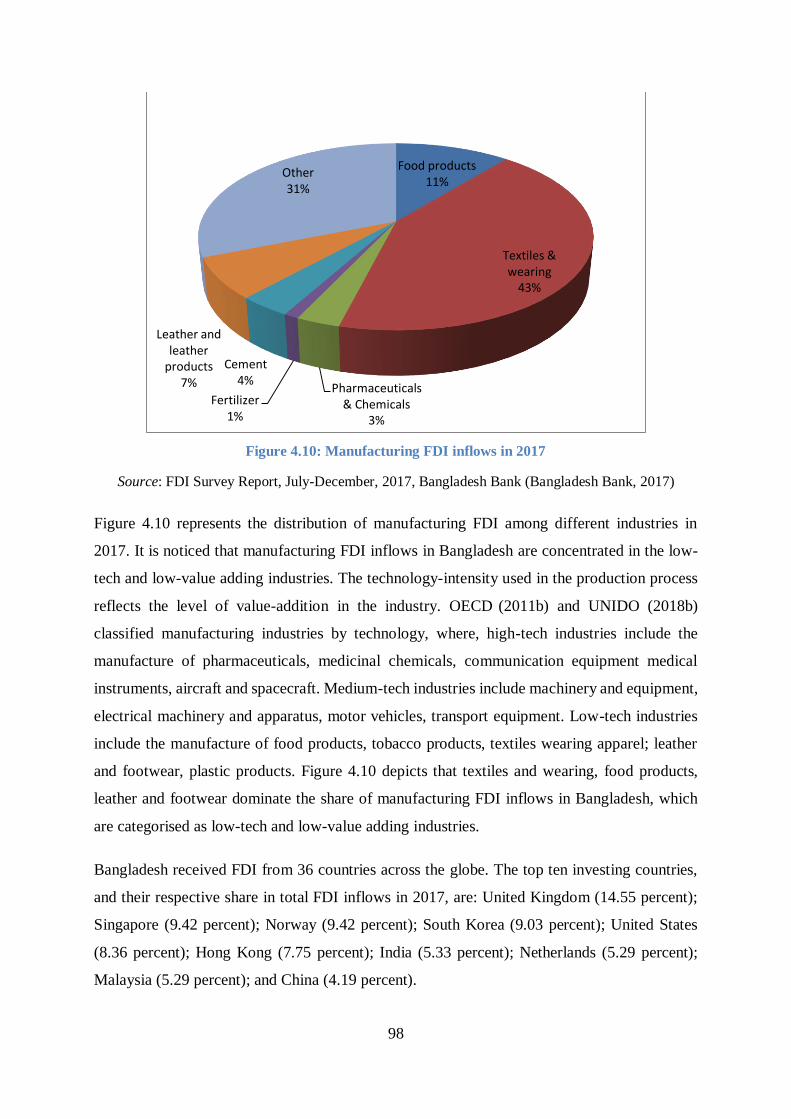
98
Figure 4.10: Manufacturing FDI inflows in 2017
Source: FDI Survey Report, July-December, 2017, Bangladesh Bank (Bangladesh Bank, 2017)
Figure 4.10 represents the distribution of manufacturing FDI among different industries in
2017. It is noticed that manufacturing FDI inflows in Bangladesh are concentrated in the low-
tech and low-value adding industries. The technology-intensity used in the production process
reflects the level of value-addition in the industry. OECD (2011b) and UNIDO (2018b)
classified manufacturing industries by technology, where, high-tech industries include the
manufacture of pharmaceuticals, medicinal chemicals, communication equipment medical
instruments, aircraft and spacecraft. Medium-tech industries include machinery and equipment,
electrical machinery and apparatus, motor vehicles, transport equipment. Low-tech industries
include the manufacture of food products, tobacco products, textiles wearing apparel; leather
and footwear, plastic products. Figure 4.10 depicts that textiles and wearing, food products,
leather and footwear dominate the share of manufacturing FDI inflows in Bangladesh, which
are categorised as low-tech and low-value adding industries.
Bangladesh received FDI from 36 countries across the globe. The top ten investing countries,
and their respective share in total FDI inflows in 2017, are: United Kingdom (14.55 percent);
Singapore (9.42 percent); Norway (9.42 percent); South Korea (9.03 percent); United States
(8.36 percent); Hong Kong (7.75 percent); India (5.33 percent); Netherlands (5.29 percent);
Malaysia (5.29 percent); and China (4.19 percent).
Food products11%
Textiles & wearing
43%
Pharmaceuticals & Chemicals
3%
Fertilizer1%
Cement4%
Leather and leather
products7%
Other31%
99
4.4.3 Determinants of FDI inflows in Bangladesh (prospects and challenges)
The discussion in section 4.4.1 and 4.4.2 show that the Government of Bangladesh is attempting
to increase FDI inflows in the country with various policy measures and incentives. However,
the success in attracting FDI inflows in the country is very limited. Market size, the availability
of cheap labour, and open and liberalised economic and trade policies offer Bangladesh good
prospects for attracting FDI inflows. However, political instability, lack of policy coherence,
the low purchasing power of the majority of people in the country, and insufficient
infrastructure facilities hinder the prospects for FDI inflows.
Large market size attracts market-seeking FDI in the host country. In terms of the nominal GDP
and the size of the population, the market size in Bangladesh is large. However, in terms of the
per capita income, the market size is relatively small. Per capita income in Bangladesh is low
with an average per capita income of only USD 1,900 (MOF, 2019). Therefore, low purchasing
power limits the scope of market-seeking FDI inflows. However, if Bangladesh can maintain
its high GDP growth and reach the level of a middle-income country with improved income
distribution, there are considerable prospects to attract market-seeking FDI.
Bangladesh is becoming an increasingly open and liberalised economy, which is necessary to
attract foreign investment, but not sufficient. In addition to the open, liberalised policy, other
conditions, such as skilled human resources, physical infrastructure facilities, prudential
macroeconomic conditions, efficient administrative and regulatory system, are essential to
attract FDI.
The availability of cheap labour is one of the prime determinants of FDI in labour-intensive
industries. Due to the high levels of unemployment, labour costs in Bangladesh are very low.
Globally, Bangladesh is the cheapest country for a high skilled labour and the second cheapest
for a low and unskilled labour (UNCTAD, 2013). Therefore, Bangladesh is an ideal destination
or a natural candidate for a labour-intensive industry. However, there is a concern that investors
might take advantage of the availability of cheap labour and loose labour laws to exploit local
labour markets.
The availability of cheap labour is not sufficient for FDI inflows. Strengthening the absorptive
capacity and particularly the development of human capital is crucial for attracting high-
technology based FDI inflows and realising the spillover effects of FDI inflows. The lack of an
adequately trained workforce is one of the top five impediments to doing business for
100
subsidiaries of multinational firms in Bangladesh (UNCTAD, 2013). Bangladesh achieved
some success in improving primary education enrolment, but the dropout rate beyond primary
education is high due to poverty. The gross enrolment for tertiary education is 17 percent, but
less than two percent of the population completed tertiary degrees and the number of
scientifically and technically trained people is low (World Bank, 2018c). Human resource
development is crucial in attracting efficiency-seeking FDI in Bangladesh. Recently, the
government took initiatives to build several High-tech Parks9 to attract FDI inflows in high
technology industries. However, Bangladesh needs to complement the physical facilities with
the development of the human skills required for high technology industries.
Poor physical infrastructure and facilities impedes FDI inflows in Bangladesh. The interrupted
and insufficient power supply, congested and high-trafficked road facilities, limited rail network
and, most importantly, the absence of deep and modern seaports, restricts FDI inflows. On the
other hand, infrastructure could be a potential sector for FDI inflows. With appropriate policy
measures, the government can encourage FDI inflows in infrastructure projects, such as the
construction of highways, bridges, railway networks, power plants, and upgrading the port
facilities.
Well-developed, modern infrastructure not only encourages foreign investment, it also
stimulates local investment in other sectors and industries. The limited land availability and
complications related to the acquisition and purchase of land by foreign companies also impose
obstacles to foreign-private investment projects occurring in the infrastructure sector (Rashed
et al., 2014). The government has been trying to promote foreign investment in the physical
infrastructure sector with the public-private-partnership (PPP) initiatives10. Bangladesh Public-
Private-Partnership Act, 2015 also emphasised the requirement for foreign financing
partnerships in infrastructure development projects.
Macroeconomic stability provides confidence to investors. Bangladesh has achieved some
success in maintaining macroeconomic stability in terms of GDP growth and inflation
management for the last two decades; however, instability in the external sector arises due to a
large trade deficit.
9 High-tech Park provide a one-stop platform, facilities and a congenial business environment to develop information-
technology based sophisticated industries. 10A Public-private partnership (PPP) is a collaboration between the government entity and private-owned company to build,
finance and mange projects to spur development.

101
In addition, tax revenue as a percentage of GDP is still very low, and the low level of savings
and investment, and large fiscal and external deficits generates threats to the overall
macroeconomic stability of the country. As investors require a stable, growing economy,
prudential macroeconomic policies and measures are required to improve FDI inflows.
Along with macroeconomic stability, political stability and the rule of law are essential factors
for doing business in a country. Bangladesh frequently suffers from political and social unrest.
General strikes called by political parties, students and workers movements reduce productivity
and increase business costs . Terrorist attacks, such as the one on 1st July 2016 in the diplomatic
area in which 20 people were killed (including foreign citizens), are also an ongoing threat for
FDI inflows in Bangladesh.
Bangladesh does not have any FDI policy. The bureaucratic procedure in Bangladesh is also
lengthy and complicated.. It is claimed that the Bangladesh Development Authority provides a
one-stop support facility to start an investment project in Bangladesh; in fact, several
institutions, department and laws are involved in the process. In terms of the ease of doing
business, Bangladesh ranks 177 out of 190 countries (World Bank, 2018b). In terms of the key
indicators of doing business, Bangladesh performs worst amongst other South Asian countries.
Table 4.5 presents the doing business indicators of selected South Asian countries.
Table 4.5: Doing Business Indicators in Selected South Asian Countries
Indicators (rank) Bangladesh India Pakistan Sri Lanka Nepal Maldives
Ease of doing business 177 100 147 111 105 24
Starting a business 131 156 142 77 109 111
Dealing with construction
permits
130 181 141 76 157 11
Getting electricity 185 29 167 93 133 8
Registering property 185 154 170 157 84 42
Getting credit 159 29 105 122 90 20
Protecting minority investors
76 4 20 43 62 4
Paying taxes 152 119 172 158 146 73
Trading across borders 173 146 171 86 76 61
Enforcing contracts 189 164 156 165 153 44
Resolving insolvency 152 103 82 88 76 46
Source: Doing Business 2018 (World Bank, 2018b)
102
High levels of corruption in the public sector also adds extra costs to doing business in
Bangladesh. Corruption is common in public procurement, project implementation, tax
collection, and other regulatory systems (Business Anti Corruption Portal, 2018; World Bank,
2018b). Bangladesh ranked 146 out of 176 countries in the corruption perception index of
Transparency International (TIB, 2018).
In general, Bangladesh has the potential to attract labour-intensive, market-seeking and even
efficiency-seeking FDI to the country. The low purchasing power of the large income group,
low levels of technical and higher education, corrupt and inefficient governance system and
poor infrastructure facilities are the major impediments for FDI inflows. The government needs
to improve this complex, multi-layered situation. FDI inflow can also play a significant role in
overcoming the challenges through projects in the infrastructure sector and extending their
activities in the training and skills development area.
4.5 The nexus between FDI inflows and economic sustainability: the
performance of the export-oriented manufacturing sector in
Bangladesh
The Bangladesh economy is slowly moving from an agricultural to an industrial economy. The
industrial base of the country is still low and also suffers from low technological advancement
and sophistication. The government has adopted open liberalised economic policies and is
encouraging private investment. Along with the domestic investment, Bangladesh is also
continuously trying to attract more FDI inflow, especially in the export-oriented manufacturing
sector, to give the country a sustainable industrial base. The improvement and expansion of the
physical capital base is a necessary condition for economic sustainability. FDI inflows can help
the country overcome the challenges, and can contribute towards the expansion of advanced,
sophisticated high value-added industrialisation. To set the scene for the econometric analysis
that follows, this section examines the extent to which FDI inflows have promoted economic
sustainability in Bangladesh using a descriptive analysis.

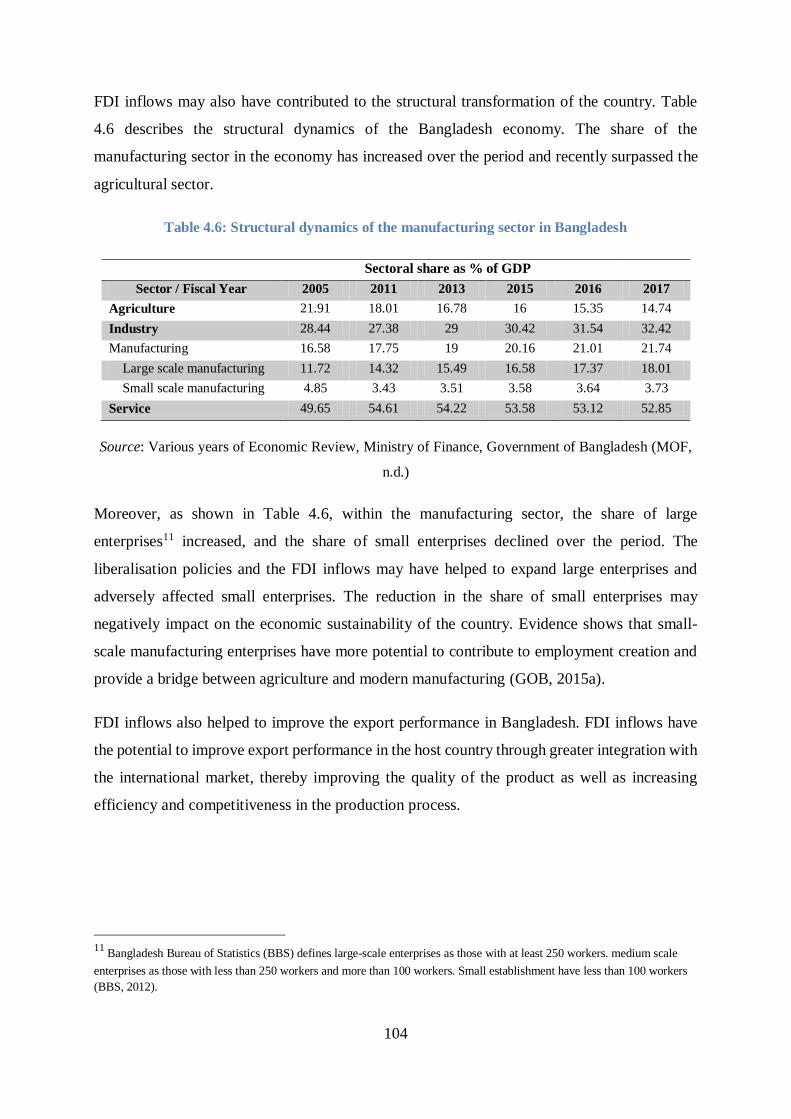
104
FDI inflows may also have contributed to the structural transformation of the country. Table
4.6 describes the structural dynamics of the Bangladesh economy. The share of the
manufacturing sector in the economy has increased over the period and recently surpassed the
agricultural sector.
Table 4.6: Structural dynamics of the manufacturing sector in Bangladesh
Sectoral share as % of GDP
Sector / Fiscal Year 2005 2011 2013 2015 2016 2017
Agriculture 21.91 18.01 16.78 16 15.35 14.74
Industry 28.44 27.38 29 30.42 31.54 32.42
Manufacturing 16.58 17.75 19 20.16 21.01 21.74
Large scale manufacturing 11.72 14.32 15.49 16.58 17.37 18.01
Small scale manufacturing 4.85 3.43 3.51 3.58 3.64 3.73
Service 49.65 54.61 54.22 53.58 53.12 52.85
Source: Various years of Economic Review, Ministry of Finance, Government of Bangladesh (MOF,
n.d.)
Moreover, as shown in Table 4.6, within the manufacturing sector, the share of large
enterprises11 increased, and the share of small enterprises declined over the period. The
liberalisation policies and the FDI inflows may have helped to expand large enterprises and
adversely affected small enterprises. The reduction in the share of small enterprises may
negatively impact on the economic sustainability of the country. Evidence shows that small-
scale manufacturing enterprises have more potential to contribute to employment creation and
provide a bridge between agriculture and modern manufacturing (GOB, 2015a).
FDI inflows also helped to improve the export performance in Bangladesh. FDI inflows have
the potential to improve export performance in the host country through greater integration with
the international market, thereby improving the quality of the product as well as increasing
efficiency and competitiveness in the production process.
11
Bangladesh Bureau of Statistics (BBS) defines large-scale enterprises as those with at least 250 workers. medium scale
enterprises as those with less than 250 workers and more than 100 workers. Small establishment have less than 100 workers
(BBS, 2012).
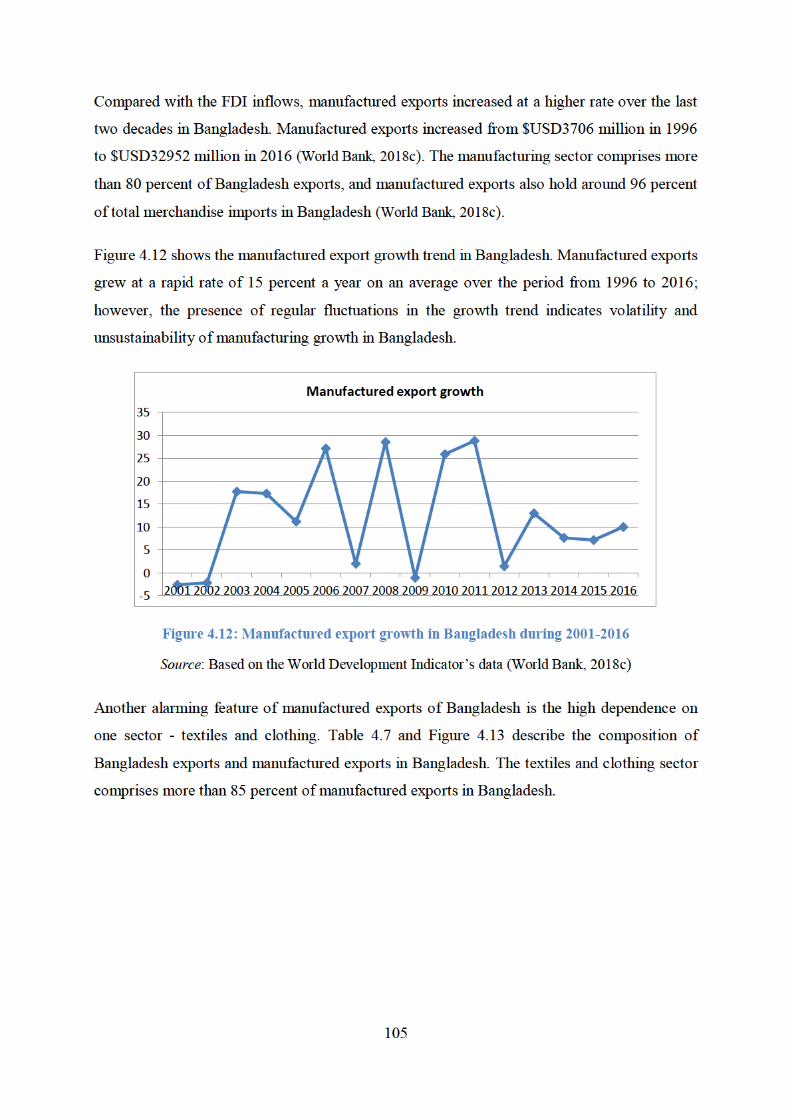

106
Table 4.7: Composition of Bangladesh exports
% of total export
Fiscal Year 2003 2006 2011 2012 2013 2014 2016
Primary commodities 7.06 7.34 4.18 4.12 3.99 4.57 3.81
Frozen food 4.91 4.36 2.73 2.46 2.01 2.11 1.56
Agricultural products 0.39 0.90 1.46 1.66 1.98 1.33 0.90
Jute 1.26 1.14 .. .. .. 0.42 0.51
Others primary 0.50 0.67 .. .. .. 0.70 0.84
Manufactured goods 92.94 92.66 95.82 95.88 96.01 95.43 96.19
RMG & textile 75.01 75.06 78.15 78.55 79.61 81.13 82.01
Jute goods 3.93 3.43 4.86 3.98 3.81 2.32 2.18
Chemical products 1.53 1.95 0.46 0.42 0.34 0.31 0.36
Engineering products 0.20 1.05 1.35 1.55 1.36 1.22 1.49
Leather & footwear 3.62 3.35 2.60 2.74 3.03 2.25 4.03
Other manufactured 8.64 7.81 8.40 8.64 7.85 8.21 6.12
TOTAL EXPORTS 100 100 100 100 100 100 100
Source: Calculated from various years Economic Review, Ministry of Finance, Government of
Bangladesh (MOF, n.d.)
Figure 4.13: Composition of major manufactured exports in Bangladesh in 2017
Source: Economic Review 2019, Ministry of Finance, Government of Bangladesh (MOF, 2019).
As shown in Table 4.7 and Figure 4.13, the composition of manufactured exports for the last
two decades has become increasingly dependent on readymade garments (RMG) and textiles.
Diversification of exports is a necessary condition for the sustained and long-run growth of the
manufacturing sector.
84%
2%
1% 2% 1%
10%
% of total manufactured exports in 2017
RMG &textile Jute goods Chemical products
Engineering products leather & Footwear other mfg.
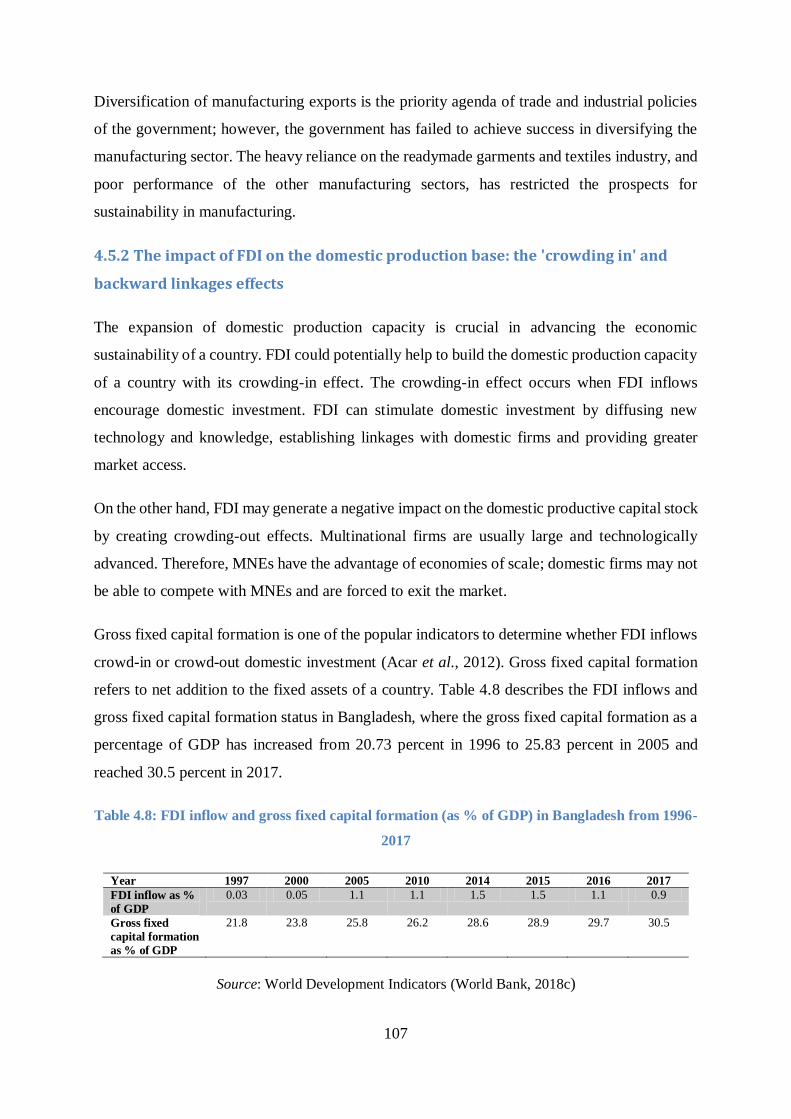
107
Diversification of manufacturing exports is the priority agenda of trade and industrial policies
of the government; however, the government has failed to achieve success in diversifying the
manufacturing sector. The heavy reliance on the readymade garments and textiles industry, and
poor performance of the other manufacturing sectors, has restricted the prospects for
sustainability in manufacturing.
4.5.2 The impact of FDI on the domestic production base: the 'crowding in' and
backward linkages effects
The expansion of domestic production capacity is crucial in advancing the economic
sustainability of a country. FDI could potentially help to build the domestic production capacity
of a country with its crowding-in effect. The crowding-in effect occurs when FDI inflows
encourage domestic investment. FDI can stimulate domestic investment by diffusing new
technology and knowledge, establishing linkages with domestic firms and providing greater
market access.
On the other hand, FDI may generate a negative impact on the domestic productive capital stock
by creating crowding-out effects. Multinational firms are usually large and technologically
advanced. Therefore, MNEs have the advantage of economies of scale; domestic firms may not
be able to compete with MNEs and are forced to exit the market.
Gross fixed capital formation is one of the popular indicators to determine whether FDI inflows
crowd-in or crowd-out domestic investment (Acar et al., 2012). Gross fixed capital formation
refers to net addition to the fixed assets of a country. Table 4.8 describes the FDI inflows and
gross fixed capital formation status in Bangladesh, where the gross fixed capital formation as a
percentage of GDP has increased from 20.73 percent in 1996 to 25.83 percent in 2005 and
reached 30.5 percent in 2017.
Table 4.8: FDI inflow and gross fixed capital formation (as % of GDP) in Bangladesh from 1996-
2017
Year 1997 2000 2005 2010 2014 2015 2016 2017
FDI inflow as %
of GDP
0.03 0.05 1.1 1.1 1.5 1.5 1.1 0.9
Gross fixed
capital formation
as % of GDP
21.8 23.8 25.8 26.2 28.6 28.9 29.7 30.5
Source: World Development Indicators (World Bank, 2018c)
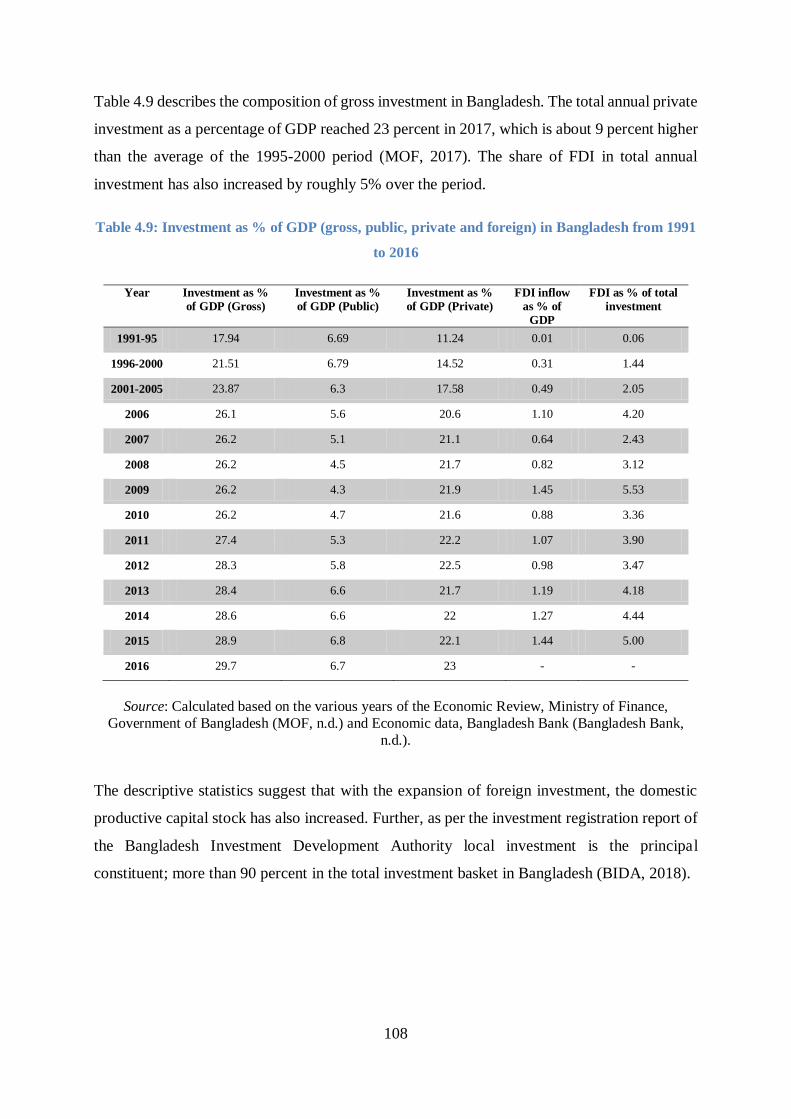
108
Table 4.9 describes the composition of gross investment in Bangladesh. The total annual private
investment as a percentage of GDP reached 23 percent in 2017, which is about 9 percent higher
than the average of the 1995-2000 period (MOF, 2017). The share of FDI in total annual
investment has also increased by roughly 5% over the period.
Table 4.9: Investment as % of GDP (gross, public, private and foreign) in Bangladesh from 1991
to 2016
Year Investment as %
of GDP (Gross)
Investment as %
of GDP (Public)
Investment as %
of GDP (Private)
FDI inflow
as % of
GDP
FDI as % of total
investment
1991-95 17.94 6.69 11.24 0.01 0.06
1996-2000 21.51 6.79 14.52 0.31 1.44
2001-2005 23.87 6.3 17.58 0.49 2.05
2006 26.1 5.6 20.6 1.10 4.20
2007 26.2 5.1 21.1 0.64 2.43
2008 26.2 4.5 21.7 0.82 3.12
2009 26.2 4.3 21.9 1.45 5.53
2010 26.2 4.7 21.6 0.88 3.36
2011 27.4 5.3 22.2 1.07 3.90
2012 28.3 5.8 22.5 0.98 3.47
2013 28.4 6.6 21.7 1.19 4.18
2014 28.6 6.6 22 1.27 4.44
2015 28.9 6.8 22.1 1.44 5.00
2016 29.7 6.7 23 - -
Source: Calculated based on the various years of the Economic Review, Ministry of Finance,
Government of Bangladesh (MOF, n.d.) and Economic data, Bangladesh Bank (Bangladesh Bank,
n.d.).
The descriptive statistics suggest that with the expansion of foreign investment, the domestic
productive capital stock has also increased. Further, as per the investment registration report of
the Bangladesh Investment Development Authority local investment is the principal
constituent; more than 90 percent in the total investment basket in Bangladesh (BIDA, 2018).
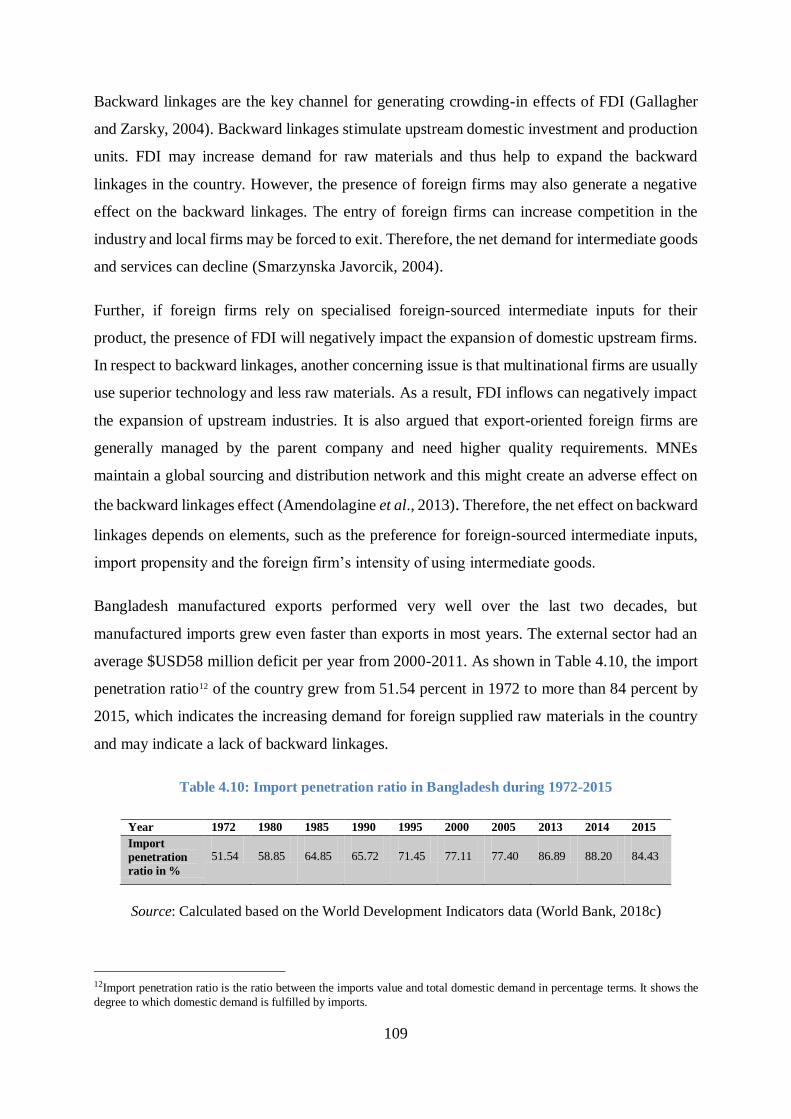
109
Backward linkages are the key channel for generating crowding-in effects of FDI (Gallagher
and Zarsky, 2004). Backward linkages stimulate upstream domestic investment and production
units. FDI may increase demand for raw materials and thus help to expand the backward
linkages in the country. However, the presence of foreign firms may also generate a negative
effect on the backward linkages. The entry of foreign firms can increase competition in the
industry and local firms may be forced to exit. Therefore, the net demand for intermediate goods
and services can decline (Smarzynska Javorcik, 2004).
Further, if foreign firms rely on specialised foreign-sourced intermediate inputs for their
product, the presence of FDI will negatively impact the expansion of domestic upstream firms.
In respect to backward linkages, another concerning issue is that multinational firms are usually
use superior technology and less raw materials. As a result, FDI inflows can negatively impact
the expansion of upstream industries. It is also argued that export-oriented foreign firms are
generally managed by the parent company and need higher quality requirements. MNEs
maintain a global sourcing and distribution network and this might create an adverse effect on
the backward linkages effect (Amendolagine et al., 2013). Therefore, the net effect on backward
linkages depends on elements, such as the preference for foreign-sourced intermediate inputs,
import propensity and the foreign firm’s intensity of using intermediate goods.
Bangladesh manufactured exports performed very well over the last two decades, but
manufactured imports grew even faster than exports in most years. The external sector had an
average $USD58 million deficit per year from 2000-2011. As shown in Table 4.10, the import
penetration ratio12 of the country grew from 51.54 percent in 1972 to more than 84 percent by
2015, which indicates the increasing demand for foreign supplied raw materials in the country
and may indicate a lack of backward linkages.
Table 4.10: Import penetration ratio in Bangladesh during 1972-2015
Year 1972 1980 1985 1990 1995 2000 2005 2013 2014 2015
Import
penetration
ratio in %
51.54 58.85 64.85 65.72 71.45 77.11 77.40 86.89 88.20 84.43
Source: Calculated based on the World Development Indicators data (World Bank, 2018c)
12Import penetration ratio is the ratio between the imports value and total domestic demand in percentage terms. It shows the
degree to which domestic demand is fulfilled by imports.
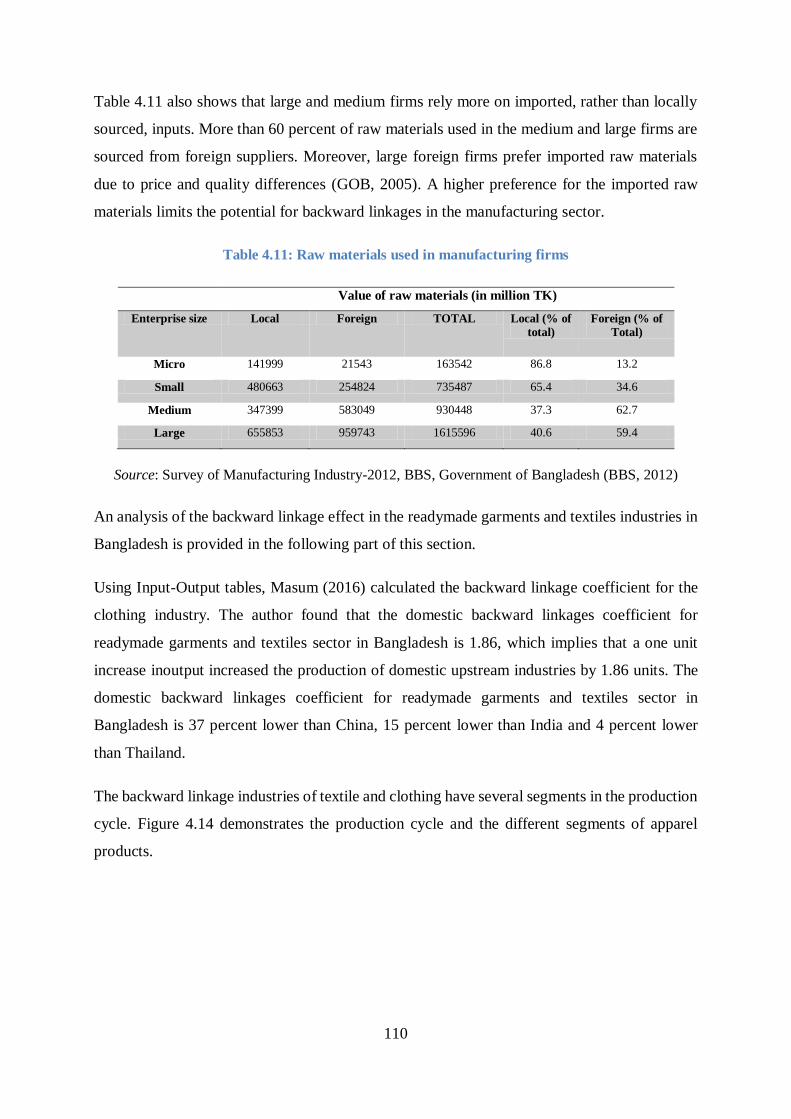
110
Table 4.11 also shows that large and medium firms rely more on imported, rather than locally
sourced, inputs. More than 60 percent of raw materials used in the medium and large firms are
sourced from foreign suppliers. Moreover, large foreign firms prefer imported raw materials
due to price and quality differences (GOB, 2005). A higher preference for the imported raw
materials limits the potential for backward linkages in the manufacturing sector.
Table 4.11: Raw materials used in manufacturing firms
Value of raw materials (in million TK)
Enterprise size Local Foreign TOTAL Local (% of
total)
Foreign (% of
Total)
Micro 141999 21543 163542 86.8 13.2
Small 480663 254824 735487 65.4 34.6
Medium 347399 583049 930448 37.3 62.7
Large 655853 959743 1615596 40.6 59.4
Source: Survey of Manufacturing Industry-2012, BBS, Government of Bangladesh (BBS, 2012)
An analysis of the backward linkage effect in the readymade garments and textiles industries in
Bangladesh is provided in the following part of this section.
Using Input-Output tables, Masum (2016) calculated the backward linkage coefficient for the
clothing industry. The author found that the domestic backward linkages coefficient for
readymade garments and textiles sector in Bangladesh is 1.86, which implies that a one unit
increase inoutput increased the production of domestic upstream industries by 1.86 units. The
domestic backward linkages coefficient for readymade garments and textiles sector in
Bangladesh is 37 percent lower than China, 15 percent lower than India and 4 percent lower
than Thailand.
The backward linkage industries of textile and clothing have several segments in the production
cycle. Figure 4.14 demonstrates the production cycle and the different segments of apparel
products.

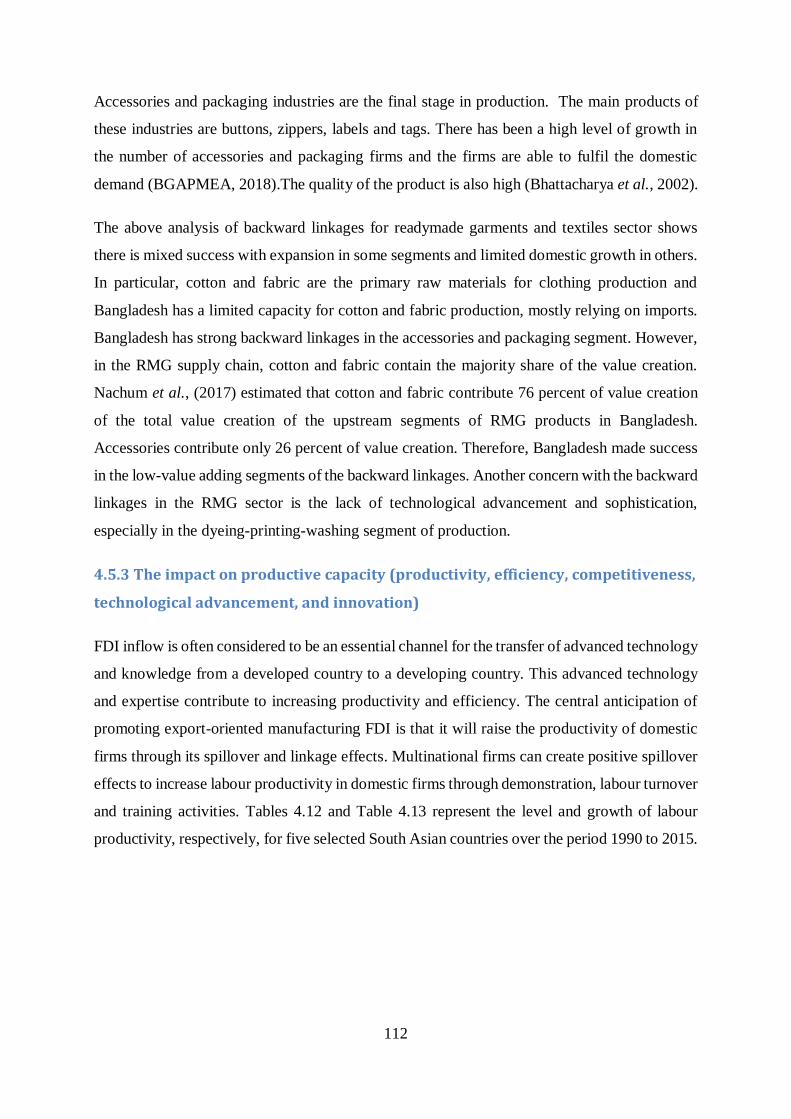
112
Accessories and packaging industries are the final stage in production. The main products of
these industries are buttons, zippers, labels and tags. There has been a high level of growth in
the number of accessories and packaging firms and the firms are able to fulfil the domestic
demand (BGAPMEA, 2018).The quality of the product is also high (Bhattacharya et al., 2002).
The above analysis of backward linkages for readymade garments and textiles sector shows
there is mixed success with expansion in some segments and limited domestic growth in others.
In particular, cotton and fabric are the primary raw materials for clothing production and
Bangladesh has a limited capacity for cotton and fabric production, mostly relying on imports.
Bangladesh has strong backward linkages in the accessories and packaging segment. However,
in the RMG supply chain, cotton and fabric contain the majority share of the value creation.
Nachum et al., (2017) estimated that cotton and fabric contribute 76 percent of value creation
of the total value creation of the upstream segments of RMG products in Bangladesh.
Accessories contribute only 26 percent of value creation. Therefore, Bangladesh made success
in the low-value adding segments of the backward linkages. Another concern with the backward
linkages in the RMG sector is the lack of technological advancement and sophistication,
especially in the dyeing-printing-washing segment of production.
4.5.3 The impact on productive capacity (productivity, efficiency, competitiveness,
technological advancement, and innovation)
FDI inflow is often considered to be an essential channel for the transfer of advanced technology
and knowledge from a developed country to a developing country. This advanced technology
and expertise contribute to increasing productivity and efficiency. The central anticipation of
promoting export-oriented manufacturing FDI is that it will raise the productivity of domestic
firms through its spillover and linkage effects. Multinational firms can create positive spillover
effects to increase labour productivity in domestic firms through demonstration, labour turnover
and training activities. Tables 4.12 and Table 4.13 represent the level and growth of labour
productivity, respectively, for five selected South Asian countries over the period 1990 to 2015.
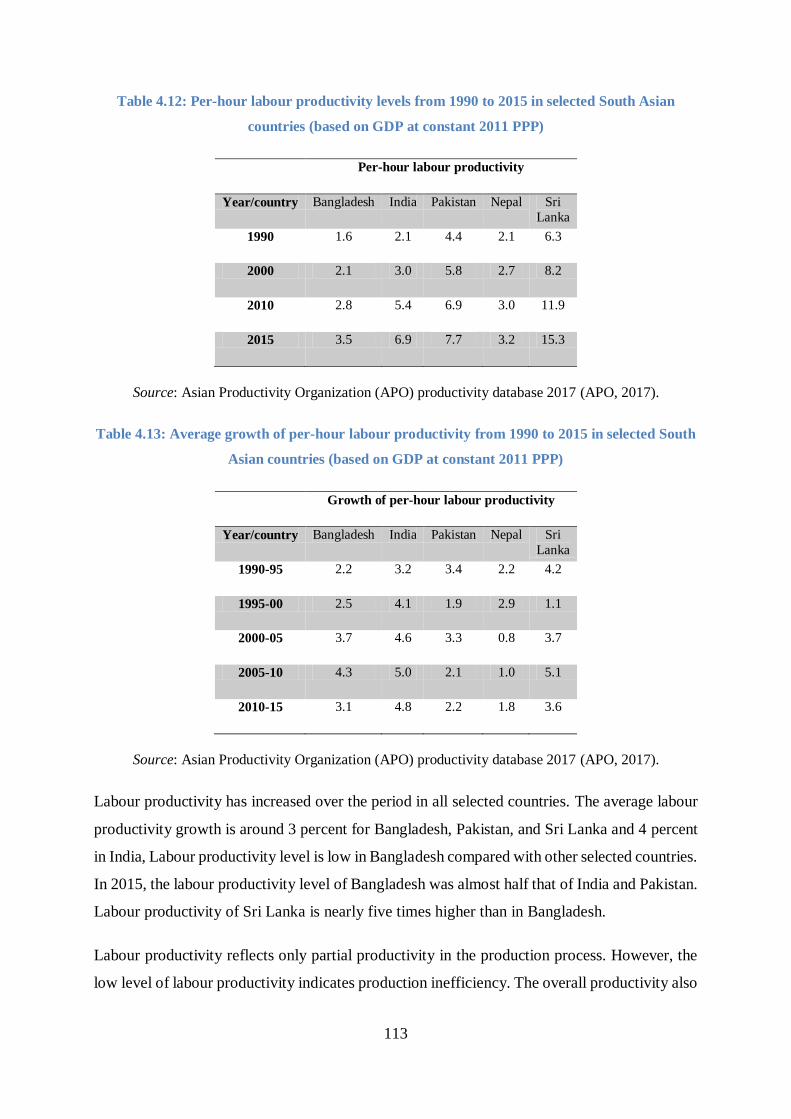
113
Table 4.12: Per-hour labour productivity levels from 1990 to 2015 in selected South Asian
countries (based on GDP at constant 2011 PPP)
Per-hour labour productivity
Year/country Bangladesh India Pakistan Nepal Sri
Lanka
1990 1.6 2.1 4.4 2.1 6.3
2000 2.1 3.0 5.8 2.7 8.2
2010 2.8 5.4 6.9 3.0 11.9
2015 3.5 6.9 7.7 3.2 15.3
Source: Asian Productivity Organization (APO) productivity database 2017 (APO, 2017).
Table 4.13: Average growth of per-hour labour productivity from 1990 to 2015 in selected South
Asian countries (based on GDP at constant 2011 PPP)
Growth of per-hour labour productivity
Year/country Bangladesh India Pakistan Nepal Sri
Lanka
1990-95 2.2 3.2 3.4 2.2 4.2
1995-00 2.5 4.1 1.9 2.9 1.1
2000-05 3.7 4.6 3.3 0.8 3.7
2005-10 4.3 5.0 2.1 1.0 5.1
2010-15 3.1 4.8 2.2 1.8 3.6
Source: Asian Productivity Organization (APO) productivity database 2017 (APO, 2017).
Labour productivity has increased over the period in all selected countries. The average labour
productivity growth is around 3 percent for Bangladesh, Pakistan, and Sri Lanka and 4 percent
in India, Labour productivity level is low in Bangladesh compared with other selected countries.
In 2015, the labour productivity level of Bangladesh was almost half that of India and Pakistan.
Labour productivity of Sri Lanka is nearly five times higher than in Bangladesh.
Labour productivity reflects only partial productivity in the production process. However, the
low level of labour productivity indicates production inefficiency. The overall productivity also

114
depends on production techniques, or the technology used in production. The technical
efficiency and total factor productivity give a more general picture of production efficiency.
Table 4.14: Total factor productivity growth in selected South Asian countries from 1990 to 2015
Total factor productivity growth
Year/country Bangladesh India Pakistan Nepal Sri
Lanka
1990-95 0.5 1.9 0.9 0.3 3.8
1995-00 -0.3 2.5 0.4 1.1 2.2
2000-05 -0.2 3.1 2.9 -0.4 1.8
2005-10 -0.5 3.5 0.2 0.5 1.7
2010-15 0.3 1.2 2.6 -0.2 0.9
Source: Asian Productivity Organization (APO)'s productivity database 2017 (APO, 2017).
Table 4.14 presents total factor productivity growth in selected South Asian countries over the
period 1990-2015. Compared with other South Asian countries, total factor productivity growth
is very low in Bangladesh, and the country also experiences negative total factor productivity
growth during the study period; however, the situation is improving.
Table 4.15 presents the average labour productivity growth in the manufacturing sector over
the period 2000 to 2015. In the manufacturing sector, the labour productivity growth
performance of Bangladesh is slightly better than some South Asian countries, but far behind
India.
Table 4.15: Labour productivity growth in the manufacturing sector in selected South Asian
countries from 2000 to 2015
The average annual growth rate of labour productivity in
the manufacturing sector
Year/country Bangladesh India Pakistan Nepal Sri Lanka
2000-2015 3.2 7.0 0.9 1.1 2.0
Source: Asian Productivity Organization (APO) productivity database, 2017 (APO, 2017)
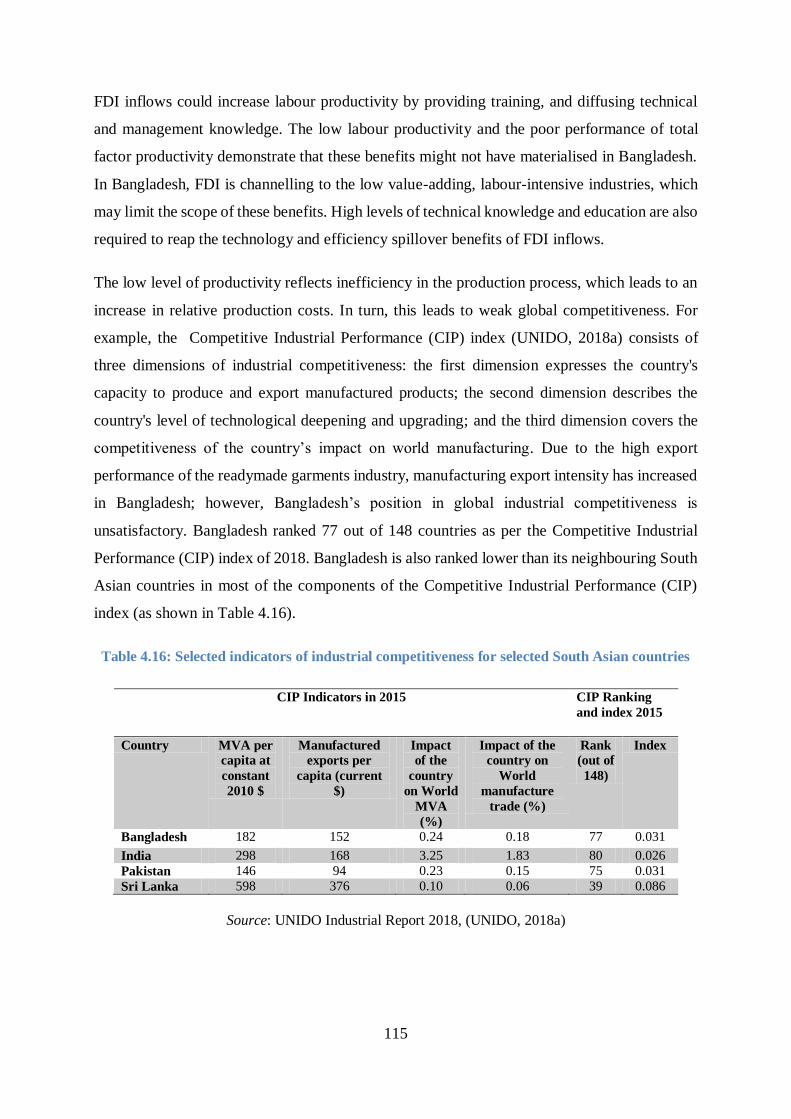
115
FDI inflows could increase labour productivity by providing training, and diffusing technical
and management knowledge. The low labour productivity and the poor performance of total
factor productivity demonstrate that these benefits might not have materialised in Bangladesh.
In Bangladesh, FDI is channelling to the low value-adding, labour-intensive industries, which
may limit the scope of these benefits. High levels of technical knowledge and education are also
required to reap the technology and efficiency spillover benefits of FDI inflows.
The low level of productivity reflects inefficiency in the production process, which leads to an
increase in relative production costs. In turn, this leads to weak global competitiveness. For
example, the Competitive Industrial Performance (CIP) index (UNIDO, 2018a) consists of
three dimensions of industrial competitiveness: the first dimension expresses the country's
capacity to produce and export manufactured products; the second dimension describes the
country's level of technological deepening and upgrading; and the third dimension covers the
competitiveness of the country’s impact on world manufacturing. Due to the high export
performance of the readymade garments industry, manufacturing export intensity has increased
in Bangladesh; however, Bangladesh’s position in global industrial competitiveness is
unsatisfactory. Bangladesh ranked 77 out of 148 countries as per the Competitive Industrial
Performance (CIP) index of 2018. Bangladesh is also ranked lower than its neighbouring South
Asian countries in most of the components of the Competitive Industrial Performance (CIP)
index (as shown in Table 4.16).
Table 4.16: Selected indicators of industrial competitiveness for selected South Asian countries
CIP Indicators in 2015 CIP Ranking
and index 2015
Country MVA per
capita at
constant
2010 $
Manufactured
exports per
capita (current
$)
Impact
of the
country
on World
MVA
(%)
Impact of the
country on
World
manufacture
trade (%)
Rank
(out of
148)
Index
Bangladesh 182 152 0.24 0.18 77 0.031
India 298 168 3.25 1.83 80 0.026
Pakistan 146 94 0.23 0.15 75 0.031
Sri Lanka 598 376 0.10 0.06 39 0.086
Source: UNIDO Industrial Report 2018, (UNIDO, 2018a)
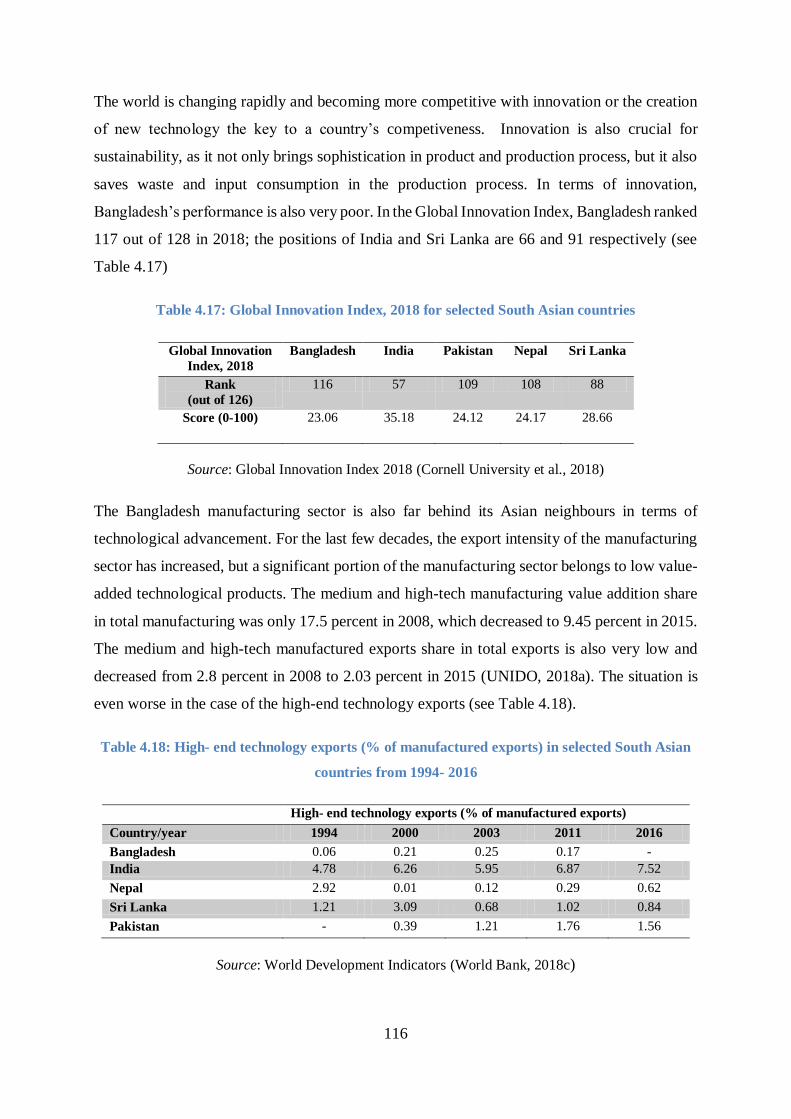
116
The world is changing rapidly and becoming more competitive with innovation or the creation
of new technology the key to a country’s competiveness. Innovation is also crucial for
sustainability, as it not only brings sophistication in product and production process, but it also
saves waste and input consumption in the production process. In terms of innovation,
Bangladesh’s performance is also very poor. In the Global Innovation Index, Bangladesh ranked
117 out of 128 in 2018; the positions of India and Sri Lanka are 66 and 91 respectively (see
Table 4.17)
Table 4.17: Global Innovation Index, 2018 for selected South Asian countries
Global Innovation
Index, 2018
Bangladesh India Pakistan Nepal Sri Lanka
Rank
(out of 126)
116 57 109 108 88
Score (0-100) 23.06 35.18 24.12 24.17 28.66
Source: Global Innovation Index 2018 (Cornell University et al., 2018)
The Bangladesh manufacturing sector is also far behind its Asian neighbours in terms of
technological advancement. For the last few decades, the export intensity of the manufacturing
sector has increased, but a significant portion of the manufacturing sector belongs to low value-
added technological products. The medium and high-tech manufacturing value addition share
in total manufacturing was only 17.5 percent in 2008, which decreased to 9.45 percent in 2015.
The medium and high-tech manufactured exports share in total exports is also very low and
decreased from 2.8 percent in 2008 to 2.03 percent in 2015 (UNIDO, 2018a). The situation is
even worse in the case of the high-end technology exports (see Table 4.18).
Table 4.18: High- end technology exports (% of manufactured exports) in selected South Asian
countries from 1994- 2016
High- end technology exports (% of manufactured exports)
Country/year 1994 2000 2003 2011 2016
Bangladesh 0.06 0.21 0.25 0.17 -
India 4.78 6.26 5.95 6.87 7.52
Nepal 2.92 0.01 0.12 0.29 0.62
Sri Lanka 1.21 3.09 0.68 1.02 0.84
Pakistan - 0.39 1.21 1.76 1.56
Source: World Development Indicators (World Bank, 2018c)

117
The above descriptive statistical analysis suggests that with the increased inflow of export-
oriented manufacturing FDI, the contribution of the manufacturing sector to GDP has increased.
Manufacture growth also accelerated over this period. However, the share of small-scale
enterprises declined, and large enterprises’ share in the total manufacturing sector has increased,
which might create adverse impacts on the inclusive nature of growth.
FDI inflows also contributed to triggering manufacturing exports. Manufacturing exports have
grown at a rapid rate for the last two decades; however, the impressive growth and export
performance of the manufacturing sector might not contribute to overall economic sustainability
or sustainable industrial development in the country. Sustainable development requires a
diverse and inclusive development. The sources of growth and exports are highly dependent on
just one industry (textiles and clothing) which is unsustainable from a macroeconomic
perspective.
The increase of capital stock or production capacity is an important parameter when considering
economic sustainability. FDI inflows may contribute positively to increase the production
capacity by the associated 'crowding in' and backward linkages effects. In Bangladesh, gross
capital formation appears to increase rises with the increased flow of FDI. However, backward
linkages were established mostly in the low-value adding part of the production chain, which
limits the backward linkage effects and the impact of FDI on economic sustainability.
FDI could also expand domestic productive capacity by increasing productivity and efficiency
in the production process through its spillover effects. The productivity indicators demonstrate
that Bangladesh fails to achieve success in increasing productivity. The technological and
innovation capacity of the country is also inadequate. Bangladesh should take immediate action
on diversification and technological advancement in the manufacturing sector. FDI inflows
could play a supportive role in international technology diffusion to enhance spillover effects.
4.6 FDI inflows and economic sustainability in Bangladesh: an
empirical analysis
The descriptive statistical analysis depicts that FDI inflows might have created some positive
impact on the performance of the manufacturing sector in Bangladesh. The growth and export
performances of the manufacturing sector have increased with the increased flow of FDI. The
crowding-in and backward linkages effects of FDI inflows also appear positive in some areas;

118
positive effects are only seen in the low-value adding parts of the production process. Besides,
the Bangladesh manufacturing sector has not made much improvement in productivity. The
country also performs very poorly in technological advancement and innovation. Therefore, the
overall impacts of FDI inflows on the sustainable growth of the manufacturing sector remain
an issue. Moreover, the statistical trend analysis only indicates the likelihood of the
relationships among the variables. There might be other causes which also contribute to
determining the trend. As sustainable development is an inter-generational concept,
determining the long-run relationship between FDI and economic growth is crucial to formulate
appropriate policies. An empirical or econometric analysis assists in determining the co-
integration and long-run relationship among the variables of interest.
Research on the importance and potentials of FDI and its conflicting theoretical outcomes on
economic development has generated inconclusive and diverse results (see Section 3.2). Several
empirical studies are also carried out to investigate the relationship between FDI inflows and
economic growth in Bangladesh. Hussain and Haque (2016), for example, investigated the
relationship among FDI inflows, economic growth, and trade openness in Bangladesh, covering
data from 1973 to 2014. The study used the Vector Error Correction Model (VECM) and
demonstrated that both FDI inflows and trade openness positively influenced economic growth
in Bangladesh.
In contrast, using Multiple Regression Analyses, Rahman (2015) examined the link between
economic growth and FDI inflows in Bangladesh, covering data from 1999 to 2013. The study
found a significant negative correlation between FDI and economic growth, and stressed the
need to make changes to policies and regulations to make FDI inflows beneficial for the country.
Adhikary (2011) examined the relationship between FDI inflows, economic growth, gross
capital formation and trade openness in Bangladesh covering annual time series data from 1986
to 2008. By applying the Johansen-Juselius co-integration procedure, the study found a strong,
long-run co-integration among the variables. The study also revealed that FDI inflows and gross
capital formation have a positive impact on economic growth in the long-run. However, the
impact of trade openness on economic growth was found to be negative in Bangladesh, and the
study proposed the formulation of FDI-led policies and emphasised the need for a high level of
capital formation to accelerate economic growth.
119
Tabassum and Ahmed (2014) investigated the impact of FDI inflows on economic growth in
Bangladesh, covering annual time series data from 1972 to 2011, by applying multiple
regression. The results indicate that domestic investment is effective and significant in boosting
economic growth in Bangladesh, while FDI inflows and trade openness are found to be less
significant for influencing economic growth. Rayhan (2014) examined the contribution of FDI
inflows to economic growth in Bangladesh over the period from 1975 to 2012. The study reveals
that FDI inflows had a significant positive contribution to economic growth. The study also
identifies bi-directional causalities between FDI inflows and economic growth. Ghosh and
Sarker (2015) investigated the FDI-led economic growth hypothesis for Bangladesh covering
data from 1980 to 2012 employing a Vector Error Correction Model (VECM). The results show
that FDI positively impacts economic growth in Bangladesh in the long-run.
Begum et al. (2018) investigated the long-run co-integration among FDI inflows, economic
growth, financial development, and trade openness for Bangladesh, using time series data from
1985 to 2014. By using the Dynamic Ordinary Least Squares (DOLS) method, the study found
a positive and significant long-run co-integration among the variables. The study also revealed
a bi-directional causality between FDI inflows and economic growth. The result of the variance
decomposition analysis of the study indicated the decisive prospects of FDI inflows in growth
generation in Bangladesh.
The number of studies conducted investigating the relationship between FDI and economic
growth in Bangladesh is limited; yet, the results are also conflicting. Further, GDP growth just
indicates the overall development of a country. It does not provide any specific information for
the sectoral contribution or the degree of industrial development of a country. In this thesis I
focus on the performances of the manufacturing sector in Bangladesh. No empirical study so
far has been conducted that investigates the impact of FDI inflows on the performance of the
manufacturing sector in Bangladesh.
4.6.1 Model specification and data sources
In the empirical analysis, I investigate the impact of FDI inflows on the advancement of the
manufacturing sector in Bangladesh. I consider the share of manufacturing value-added to GDP
as an indicator of the overall performance of the manufacturing sector as well as sustainable
industrialisation of the country. Manufacturing value-added is the total net-output of
manufacturing activities obtained by adding up outputs and subtracting intermediate inputs and
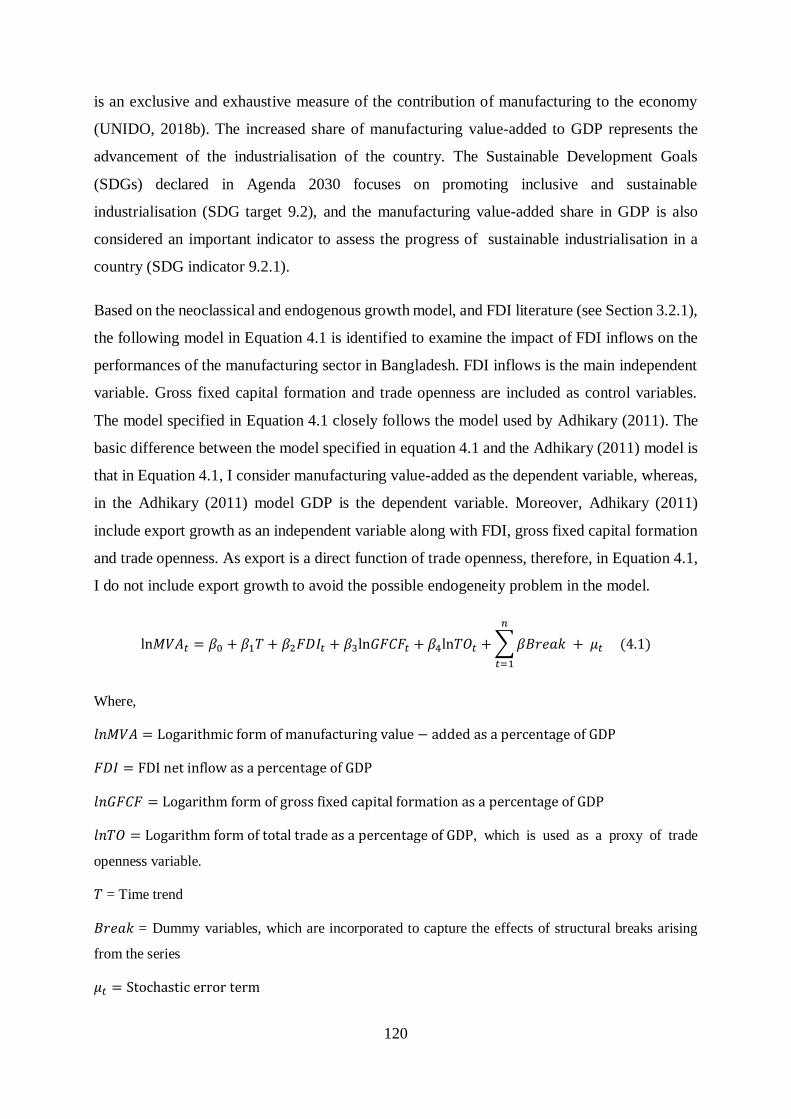
120
is an exclusive and exhaustive measure of the contribution of manufacturing to the economy
(UNIDO, 2018b). The increased share of manufacturing value-added to GDP represents the
advancement of the industrialisation of the country. The Sustainable Development Goals
(SDGs) declared in Agenda 2030 focuses on promoting inclusive and sustainable
industrialisation (SDG target 9.2), and the manufacturing value-added share in GDP is also
considered an important indicator to assess the progress of sustainable industrialisation in a
country (SDG indicator 9.2.1).
Based on the neoclassical and endogenous growth model, and FDI literature (see Section 3.2.1),
the following model in Equation 4.1 is identified to examine the impact of FDI inflows on the
performances of the manufacturing sector in Bangladesh. FDI inflows is the main independent
variable. Gross fixed capital formation and trade openness are included as control variables.
The model specified in Equation 4.1 closely follows the model used by Adhikary (2011). The
basic difference between the model specified in equation 4.1 and the Adhikary (2011) model is
that in Equation 4.1, I consider manufacturing value-added as the dependent variable, whereas,
in the Adhikary (2011) model GDP is the dependent variable. Moreover, Adhikary (2011)
include export growth as an independent variable along with FDI, gross fixed capital formation
and trade openness. As export is a direct function of trade openness, therefore, in Equation 4.1,
I do not include export growth to avoid the possible endogeneity problem in the model.
ln𝑀𝑉𝐴𝑡 = 𝛽0 + 𝛽1𝑇 + 𝛽2𝐹𝐷𝐼𝑡 + 𝛽3ln𝐺𝐹𝐶𝐹𝑡 + 𝛽4ln𝑇𝑂𝑡 + ∑ 𝛽𝐵𝑟𝑒𝑎𝑘
𝑛
𝑡=1
+ 𝜇𝑡 (4.1)
Where,
𝑙𝑛𝑀𝑉𝐴 = Logarithmic form of manufacturing value − added as a percentage of GDP
𝐹𝐷𝐼 = FDI net inflow as a percentage of GDP
𝑙𝑛𝐺𝐹𝐶𝐹 = Logarithm form of gross fixed capital formation as a percentage of GDP
𝑙𝑛𝑇𝑂 = Logarithm form of total trade as a percentage of GDP, which is used as a proxy of trade
openness variable.
𝑇 = Time trend
𝐵𝑟𝑒𝑎𝑘 = Dummy variables, which are incorporated to capture the effects of structural breaks arising
from the series
𝜇𝑡 = Stochastic error term
121
The variables are standardised as a percentage of GDP to overcome the problem of nominal
values. The variables are also transformed into logarithm form. The log-linear functional form
of the model usually provides more efficient and consistent results compared to simple linear
specifications (Cameron, 1994). In addition, the logarithmic form provides the values of
elasticities for interpreting the results directly. However, it is not possible to transform the
variable FDI inflows into the logarithm form as the value of the net inflow of FDI is negative
for a few years.
FDI can be measured by FDI inflow or FDI stock. I use net FDI inflow calculated by the World
Bank using the current account of the balance of payment, which represents the net additional
available foreign-owned capital stock for using production in a particular period (World Bank,
2018c). In contrast, FDI stock measures the total cumulative value of foreign capital. FDI stock
does not consider the depreciation of the capital and therefore does not reflect the true value of
the foreign capital stock (Iamsiraroj, 2016). I also acknowledge that the study focuses on the
manufacturing sector; therefore, taking sectoral FDI inflows or manufacturing FDI inflows data
would be more relevant. However, in Bangladesh, time-series data on FDI inflows by sector is
not available. Further, FDI inflows in Bangladesh is highly concentrated in the manufacturing
sector. Therefore, I take total FDI inflows as the main independent variable to investigate the
impact of FDI inflows on the performance of the manufacturing sector in Bangladesh.
FDI inflows are likely to influence the manufacturing production positively by establishing new
plants and projects, introducing and diffusing advanced technology, knowledge and
management practices through its direct and indirect effects. FDI inflows also help to widen
access to international markets. Therefore, the null hypothesis for FDI inflow is H0: FDI inflows
have a positive effect on manufacturing value-added in Bangladesh; thus, the coefficient of FDI
is expected to be positive (H0: β2>0).
In equation 4.1, I use gross fixed capital formation as a control variable representing the effect
of the change of domestic productive capital on manufacturing value added. Gross fixed capital
formation is a key component of domestic investment, which represents the domestic
productive base of the country. The expansion of the domestic production base of a country is
critical for economic sustainability. Furthermore, the change of gross fixed capital formation
due to FDI inflows provides information about the crowding in and crowding out effects of
FDI.
122
The neoclassical growth theory suggests that as developing countries have a low level of capital
stock, additional capital formation leads to increased productivity and efficiency of the
investment (Romer, 1986). The new capital stock can intensify technological progress, and thus
help to unlock the potentialities of economic growth. Therefore, the capital formation can
enhance manufacturing production and growth. Therefore, the null hypothesis for the gross
capital formation is H0: gross capital formation has a positive effect on manufacturing-value
added in Bangladesh; thus, the coefficient of gross capital formation is expected to be positive
(H0: β3>0).
Trade openness is included as the proxy variable of trade liberalisation. Traditional trade theory
postulates that trade liberalisation reduces the transaction costs associated with investment by
reducing tariff and non-tariff barriers. The endogenous growth theory also suggests that opening
up the economy to trade promotes allocative efficiency of investment and thus fosters economic
growth (Balasubramanyam et al. 1996). Therefore, the null hypothesis for trade openness is H0:
trade openness has a positive effect on manufacturing-value added in Bangladesh or coefficient
of trade openness is expected to be positive (H0: β4>0).
I obtain the annual time series data for Equation 4.1 from the online World Development
Indicators (WDI) database for the 1980-2017 periods.
4.6.2 Estimation procedures and finding
The estimation of the model follows the following steps:
1. The general characteristics of the data distribution and the stationarity properties of the
series are examined with the appropriate standardised tests.
2. The distributional and stationary properties of the series allow proceeding to the
Johansen co-integration test approach to check the long-run co-integration among the
variables.
3. Evidence of the existence of long-run correlation allows the application of the vector
error correction model (VECM) to investigate Granger causality and short-run
dynamics amongst the variables.
4.6.2.1 Data distribution
In order to check the homogeneity and normality characteristics of the series, I examine the
descriptive properties of data. Table 4.19 shows the descriptive statistics of the variables.

123
Table 4.19: Descriptive statistics of the variables
Variables Observations Mean Std.
Dev.
Min Max Skewness Kurtosis Jarque-Bera
(prob.)
lnMVA 38 2.70 0.07 2.55 2.85 0.15 1.98 1.40 (0.41)
FDI 38 0.46 0.54 -0.03 1.74 0.80 2.30 0.80 (0.10)
lnGFCF 38 3.06 0.23 2.67 3.42 -0.12 1.48 3.76 (0.15)
lnTO 38 -1.69 0.65 -2.47 -0.73 0.30 1.44 0.42 (0.11)
The mean and standard deviation of the variables reveals that the variation of data distribution
is not high, which implies a considerable degree of homogeneity in the data. The variation of
range between the maximum and minimum value is within a reasonable limit. The numeric
value of skewness of the variables is low. The values of kurtosis are below three, which
confirms near normality (Bai and Ng, 2005). The Jarque-Bera test statistics and associated
probabilities also accept the null hypothesis of the normal distribution for all variables (Jarque
and Bera, 1987). Therefore, the normality of the data distribution is confirmed in the model and
justifies proceeding to the next step of the estimation.
4.6.2.2 Stationary (unit root) test
It is essential to check the stationary properties of data for any co-integration analysis. The use
of non-stationary series in the co-integration analysis provides misleading or spurious results
(Granger and Newbold, 1974); therefore, I conduct unit root tests to examine the stationary
properties or the order of integration of the series. The conventional unit root tests, such as the
ADF (Augmented Dickey-Fuller) test developed by Dickey and Fuller (1979, 1981), and the
PP (Phillips–Perron) tests developed by Phillips and Perron (1988) are applied. The tests are
carried out in the presence of trend and without a trend. As the null hypothesis of the stationary
tests, variables are considered non-stationary or that a unit root exists.
The general form of the test equation of the ADF test is presented in Equation 4.2:
∆𝑦𝑡 = 𝛼 + βt + γ𝑦𝑡−1 + ∑ 𝛿𝑖
𝑚
𝑖=1
𝑦𝑡−𝑖 + 휀𝑡 (4.2)
Where ∆ denotes the first difference of the variables, y represents the series, t denotes linear
time trend, m represents the optimum lag of the dependent variable, and 휀 is the random error
term. The ADF unit root test assumes that error terms are not serially correlated. It assumes
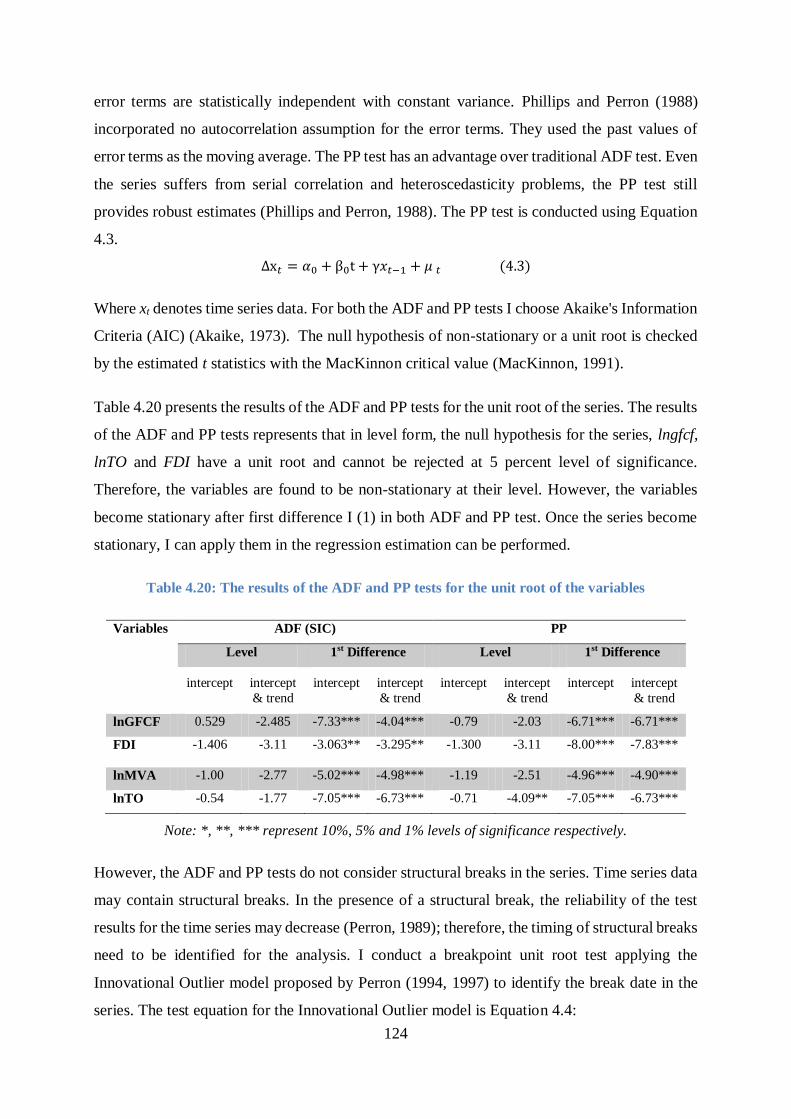
124
error terms are statistically independent with constant variance. Phillips and Perron (1988)
incorporated no autocorrelation assumption for the error terms. They used the past values of
error terms as the moving average. The PP test has an advantage over traditional ADF test. Even
the series suffers from serial correlation and heteroscedasticity problems, the PP test still
provides robust estimates (Phillips and Perron, 1988). The PP test is conducted using Equation
4.3.
∆x𝑡 = 𝛼0 + β0t + γ𝑥𝑡−1 + 𝜇 𝑡 (4.3)
Where xt denotes time series data. For both the ADF and PP tests I choose Akaike's Information
Criteria (AIC) (Akaike, 1973). The null hypothesis of non-stationary or a unit root is checked
by the estimated t statistics with the MacKinnon critical value (MacKinnon, 1991).
Table 4.20 presents the results of the ADF and PP tests for the unit root of the series. The results
of the ADF and PP tests represents that in level form, the null hypothesis for the series, lngfcf,
lnTO and FDI have a unit root and cannot be rejected at 5 percent level of significance.
Therefore, the variables are found to be non-stationary at their level. However, the variables
become stationary after first difference I (1) in both ADF and PP test. Once the series become
stationary, I can apply them in the regression estimation can be performed.
Table 4.20: The results of the ADF and PP tests for the unit root of the variables
Variables ADF (SIC) PP
Level 1st Difference Level 1st Difference
intercept intercept
& trend
intercept intercept
& trend
intercept intercept
& trend
intercept intercept
& trend
lnGFCF 0.529 -2.485 -7.33*** -4.04*** -0.79 -2.03 -6.71*** -6.71***
FDI -1.406
-3.11 -3.063** -3.295** -1.300 -3.11 -8.00*** -7.83***
lnMVA -1.00 -2.77 -5.02*** -4.98*** -1.19 -2.51 -4.96*** -4.90***
lnTO -0.54 -1.77 -7.05*** -6.73*** -0.71 -4.09** -7.05*** -6.73***
Note: *, **, *** represent 10%, 5% and 1% levels of significance respectively.
However, the ADF and PP tests do not consider structural breaks in the series. Time series data
may contain structural breaks. In the presence of a structural break, the reliability of the test
results for the time series may decrease (Perron, 1989); therefore, the timing of structural breaks
need to be identified for the analysis. I conduct a breakpoint unit root test applying the
Innovational Outlier model proposed by Perron (1994, 1997) to identify the break date in the
series. The test equation for the Innovational Outlier model is Equation 4.4:
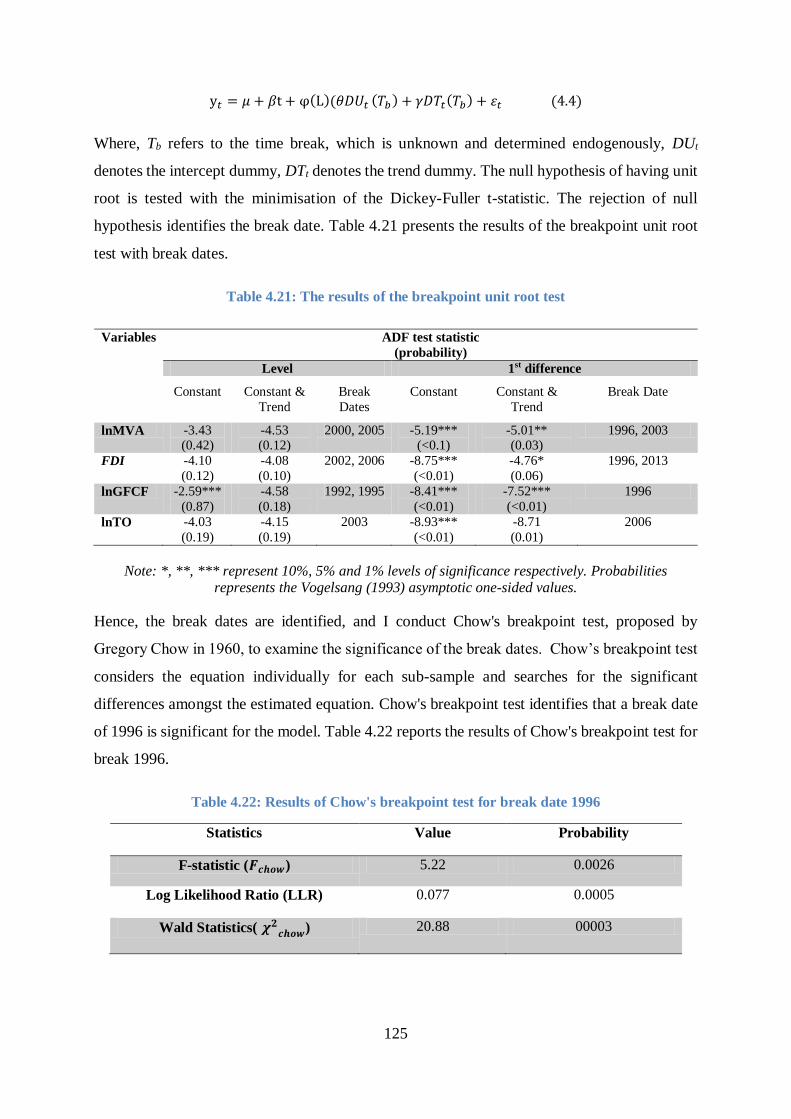
125
y𝑡 = 𝜇 + 𝛽t + φ(L)(𝜃𝐷𝑈𝑡 (𝑇𝑏) + 𝛾𝐷𝑇𝑡(𝑇𝑏) + 휀𝑡 (4.4)
Where, Tb refers to the time break, which is unknown and determined endogenously, DUt
denotes the intercept dummy, DTt denotes the trend dummy. The null hypothesis of having unit
root is tested with the minimisation of the Dickey-Fuller t-statistic. The rejection of null
hypothesis identifies the break date. Table 4.21 presents the results of the breakpoint unit root
test with break dates.
Table 4.21: The results of the breakpoint unit root test
Variables ADF test statistic
(probability)
Level 1st difference
Constant Constant &
Trend
Break
Dates
Constant Constant &
Trend
Break Date
lnMVA -3.43 (0.42)
-4.53 (0.12)
2000, 2005 -5.19*** (<0.1)
-5.01** (0.03)
1996, 2003
FDI -4.10
(0.12)
-4.08
(0.10)
2002, 2006 -8.75***
(<0.01)
-4.76*
(0.06)
1996, 2013
lnGFCF -2.59***
(0.87)
-4.58
(0.18)
1992, 1995 -8.41***
(<0.01)
-7.52***
(<0.01)
1996
lnTO -4.03
(0.19)
-4.15
(0.19)
2003 -8.93***
(<0.01)
-8.71
(0.01)
2006
Note: *, **, *** represent 10%, 5% and 1% levels of significance respectively. Probabilities represents the Vogelsang (1993) asymptotic one-sided values.
Hence, the break dates are identified, and I conduct Chow's breakpoint test, proposed by
Gregory Chow in 1960, to examine the significance of the break dates. Chow’s breakpoint test
considers the equation individually for each sub-sample and searches for the significant
differences amongst the estimated equation. Chow's breakpoint test identifies that a break date
of 1996 is significant for the model. Table 4.22 reports the results of Chow's breakpoint test for
break 1996.
Table 4.22: Results of Chow's breakpoint test for break date 1996
Statistics Value Probability
F-statistic (𝑭𝒄𝒉𝒐𝒘) 5.22 0.0026
Log Likelihood Ratio (LLR) 0.077 0.0005
Wald Statistics( 𝝌𝟐𝒄𝒉𝒐𝒘) 20.88 00003
126
The results of Chow's breakpoint test rejects the null hypothesis of no significant break in the
model and confirms that the break date 1996 as the significant break. Therefore, in the model I
include a break dummy (𝐵𝑟𝑒𝑎𝑘96) for the year 1996. It is also noticed that FDI inflows in
Bangladesh started to increase after 1996, which might be the cause for the structural break in
1996. The breakpoint unit root test results further confirm that all the series are stationary at
first difference; that is, I (1), even in the presence of structural breaks. Therefore, the maximum
order of the integration of the variables is one (1).
4.6.2.3 Johansen Co-integration Test
The focus of the empirical study is to determine the long-run relationship or co-integration
among the variables of interests. I have applied co-integration analysis to identify the long run
relationship between the variables of interest. Co-integration analysis provides information
about whether two-or more non-stationary time series variables are integrated in the long run
and follow an equilibrium path even if the linear relationship does not exist or is not strong in
the short run (Engle and Granger, 1987). Application of appropriate co-integration analysis
overcomes the problem of spurious regression. If there is spurious correlation or time series
variables are correlated coincidently then simple linear regression analysis may provide
misleading result. Therefore. Engle and Granger (1987) suggest the concept of the co-
integration technique to overcome the problem of spurious correlation.
There are several techniques in econometrics for testing and estimating the co-integrating
relationship. If all the time series are found stationary at the same order, then Johansen Co-
integration provides the most efficient co-integration test (Sjö, 2008). Engle and Granger (1987)
first introduced the Johansen Co-integration test; Johansen (1988) and Johansen and Juselius
(1990) further improved the technique.
The Johansen Co-integration test follows Equation 4.5.
∆𝑦𝑡 = 𝜇 + ᴨ𝑦𝑡−1 + ∑ г𝑖
𝑝−1
𝑖=1
𝑦𝑡−𝑖 + 휀𝑡 (4.5)
Where,
ᴨ = ∑ 𝐴𝑖𝑝𝑖=1 − 𝐼 and г𝑖 = ∑ 𝐴𝑗
𝑝𝑗=𝑖+1

127
Here, yt is n × 1 vectors of variables, which are integrated at order one and 휀𝑡 represents n×1
vector of innovations. ᴨ is the coefficient matrix, and its rank provides the number of existing
co-integration. If the rank of the п matrix is equal to zero, then it refers to no co-integration
among the variables. If it is equal to 1 then it refers to the existence of at least one co-integration
relationship among the variables. Similarly, if the rank of the п matrix is >1 then it implies there
is more than one co-integrating relationship existing among the variables. In Johnsen Co-
integration analysis, the co-integration relationships are determined based on the trace and
maximum eigenvalue statistics which are given in Equations 4.6 and 4.7 respectively.
𝜆𝑡𝑟𝑎𝑐𝑒 = −𝑇 ∑ 𝑙𝑛
𝑛
𝑖=𝑟+1
(1 − 𝜆𝑖) (4.6)
𝜆𝑚𝑎𝑥 = −𝑇𝑙𝑛 (1 − 𝜆𝑟+1) (4.7)
T refers to the sample size and 𝜆𝑖 represents the largest correlation. If the test statistics are found
to be greater than trace and maximum eigenvalue statistics, the null (H0) hypothesis can be
rejected. The test statistics are checked based on the appropriate null (H0: r = g co-integrating
vectors where, g = 0, 1, 2, 3….against the alternative H1: r ≤ g+1. If there is any conflict between
𝜆𝑡𝑟𝑎𝑐𝑒 and 𝜆𝑚𝑎𝑥, the researcher can choose either based on the characteristics of the sample
(Adhikary, 2012).
It is essential to select optimum appropriate lag before running any co-integration analysis. The
study applies the Akaike Information Criterion (AIC) to select the optimum lag for the model.
The lowest value of AIC offers the best model, and based on AIC, the optimum lag is
determined as 2 for the model.
In the Co-integration test, I include a linear deterministic trend and an exogenous time dummy
variable for the year 1996 in the model. Table 4.23 presents the results of the Johansen Co-
integration test.
Table 4.23: Results of Johansen co-integration test
H0 H1 Trace test Maximum eigenvalue test
𝝀𝒕𝒓𝒂𝒄𝒆 Critical
value
(5%)
Probability 𝝀𝒎𝒂𝒙 Critical
value
(5%)
Probability
r=0 r≥1 82.66 63.88 .00006 37.51 32.12 .0099
r≤1 r≥2 45.15 42.92 0.0294 22.70 25.82 0.1227
r≤2 r≥3 22.45 25.82 0.126 11.94 19.39 0.4199
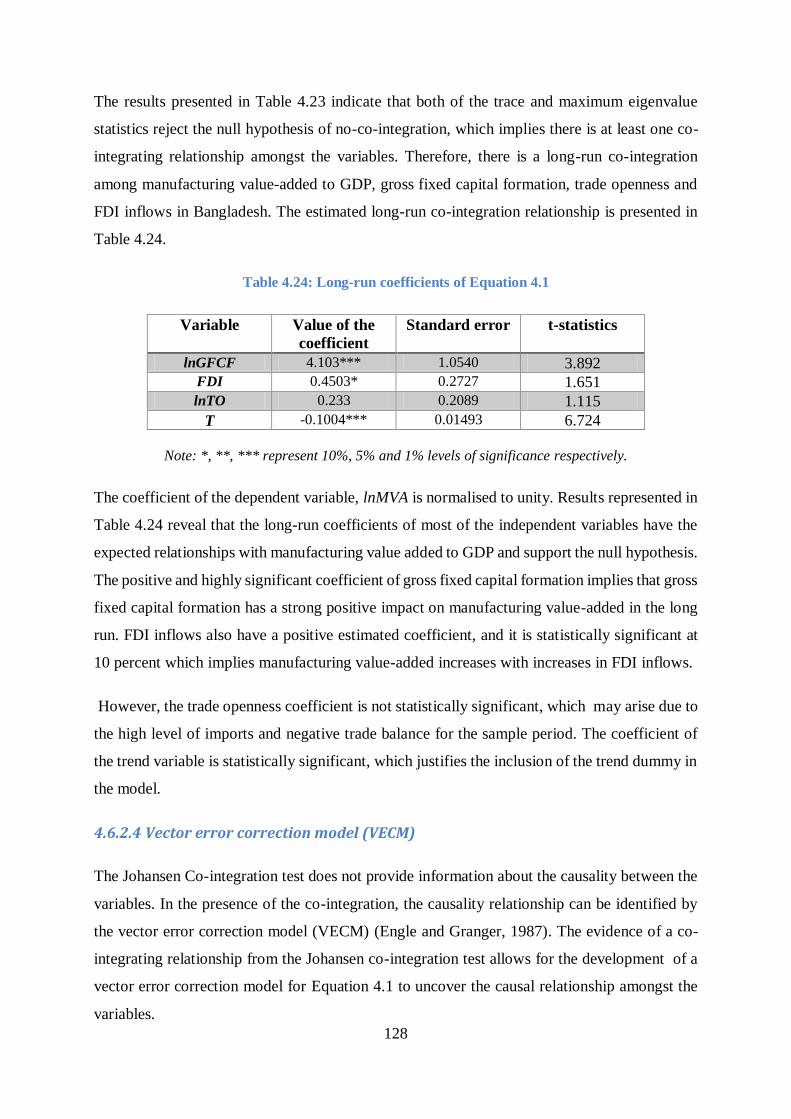
128
The results presented in Table 4.23 indicate that both of the trace and maximum eigenvalue
statistics reject the null hypothesis of no-co-integration, which implies there is at least one co-
integrating relationship amongst the variables. Therefore, there is a long-run co-integration
among manufacturing value-added to GDP, gross fixed capital formation, trade openness and
FDI inflows in Bangladesh. The estimated long-run co-integration relationship is presented in
Table 4.24.
Table 4.24: Long-run coefficients of Equation 4.1
Variable Value of the
coefficient
Standard error t-statistics
lnGFCF 4.103*** 1.0540 3.892 FDI 0.4503* 0.2727 1.651
lnTO 0.233 0.2089 1.115
T -0.1004*** 0.01493 6.724
Note: *, **, *** represent 10%, 5% and 1% levels of significance respectively.
The coefficient of the dependent variable, lnMVA is normalised to unity. Results represented in
Table 4.24 reveal that the long-run coefficients of most of the independent variables have the
expected relationships with manufacturing value added to GDP and support the null hypothesis.
The positive and highly significant coefficient of gross fixed capital formation implies that gross
fixed capital formation has a strong positive impact on manufacturing value-added in the long
run. FDI inflows also have a positive estimated coefficient, and it is statistically significant at
10 percent which implies manufacturing value-added increases with increases in FDI inflows.
However, the trade openness coefficient is not statistically significant, which may arise due to
the high level of imports and negative trade balance for the sample period. The coefficient of
the trend variable is statistically significant, which justifies the inclusion of the trend dummy in
the model.
4.6.2.4 Vector error correction model (VECM)
The Johansen Co-integration test does not provide information about the causality between the
variables. In the presence of the co-integration, the causality relationship can be identified by
the vector error correction model (VECM) (Engle and Granger, 1987). The evidence of a co-
integrating relationship from the Johansen co-integration test allows for the development of a
vector error correction model for Equation 4.1 to uncover the causal relationship amongst the
variables.
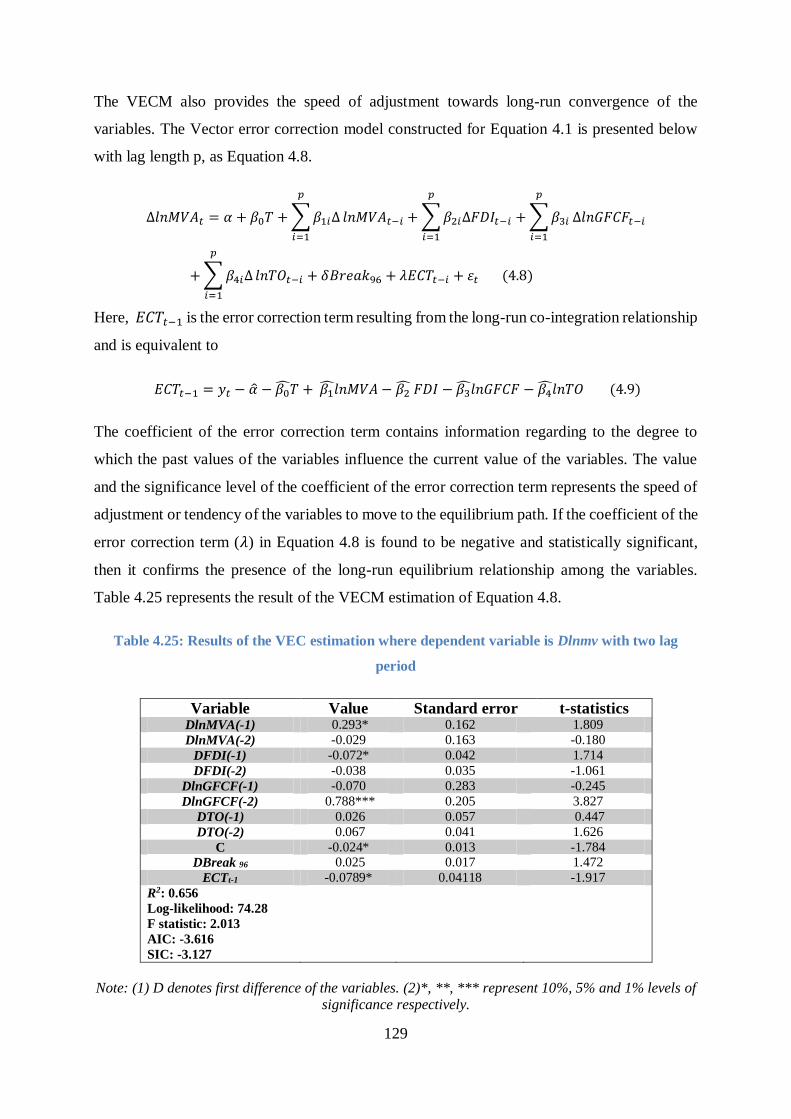
129
The VECM also provides the speed of adjustment towards long-run convergence of the
variables. The Vector error correction model constructed for Equation 4.1 is presented below
with lag length p, as Equation 4.8.
∆𝑙𝑛𝑀𝑉𝐴𝑡 = 𝛼 + 𝛽0𝑇 + ∑ 𝛽1𝑖∆
𝑝
𝑖=1
𝑙𝑛𝑀𝑉𝐴𝑡−𝑖 + ∑ 𝛽2𝑖∆𝐹𝐷𝐼𝑡−𝑖
𝑝
𝑖=1
+ ∑ 𝛽3𝑖
𝑝
𝑖=1
∆𝑙𝑛𝐺𝐹𝐶𝐹𝑡−𝑖
+ ∑ 𝛽4𝑖∆
𝑝
𝑖=1
𝑙𝑛𝑇𝑂𝑡−𝑖 + 𝛿𝐵𝑟𝑒𝑎𝑘96 + 𝜆𝐸𝐶𝑇𝑡−𝑖 + 휀𝑡 (4.8)
Here, 𝐸𝐶𝑇𝑡−1 is the error correction term resulting from the long-run co-integration relationship
and is equivalent to
𝐸𝐶𝑇𝑡−1 = 𝑦𝑡 − �� − 𝛽0𝑇 + 𝛽1𝑙𝑛𝑀𝑉𝐴 − 𝛽2 𝐹𝐷𝐼 − 𝛽3𝑙𝑛𝐺𝐹𝐶𝐹 − 𝛽4𝑙𝑛𝑇𝑂 (4.9)
The coefficient of the error correction term contains information regarding to the degree to
which the past values of the variables influence the current value of the variables. The value
and the significance level of the coefficient of the error correction term represents the speed of
adjustment or tendency of the variables to move to the equilibrium path. If the coefficient of the
error correction term (𝜆) in Equation 4.8 is found to be negative and statistically significant,
then it confirms the presence of the long-run equilibrium relationship among the variables.
Table 4.25 represents the result of the VECM estimation of Equation 4.8.
Table 4.25: Results of the VEC estimation where dependent variable is Dlnmv with two lag
period
Variable Value Standard error t-statistics DlnMVA(-1) 0.293* 0.162 1.809
DlnMVA(-2) -0.029 0.163 -0.180
DFDI(-1) -0.072* 0.042 1.714
DFDI(-2) -0.038 0.035 -1.061
DlnGFCF(-1) -0.070 0.283 -0.245
DlnGFCF(-2) 0.788*** 0.205 3.827
DTO(-1) 0.026 0.057 0.447
DTO(-2) 0.067 0.041 1.626
C -0.024* 0.013 -1.784
DBreak 96 0.025 0.017 1.472
ECTt-1 -0.0789* 0.04118 -1.917
R2: 0.656
Log-likelihood: 74.28
F statistic: 2.013
AIC: -3.616
SIC: -3.127
Note: (1) D denotes first difference of the variables. (2)*, **, *** represent 10%, 5% and 1% levels of significance respectively.
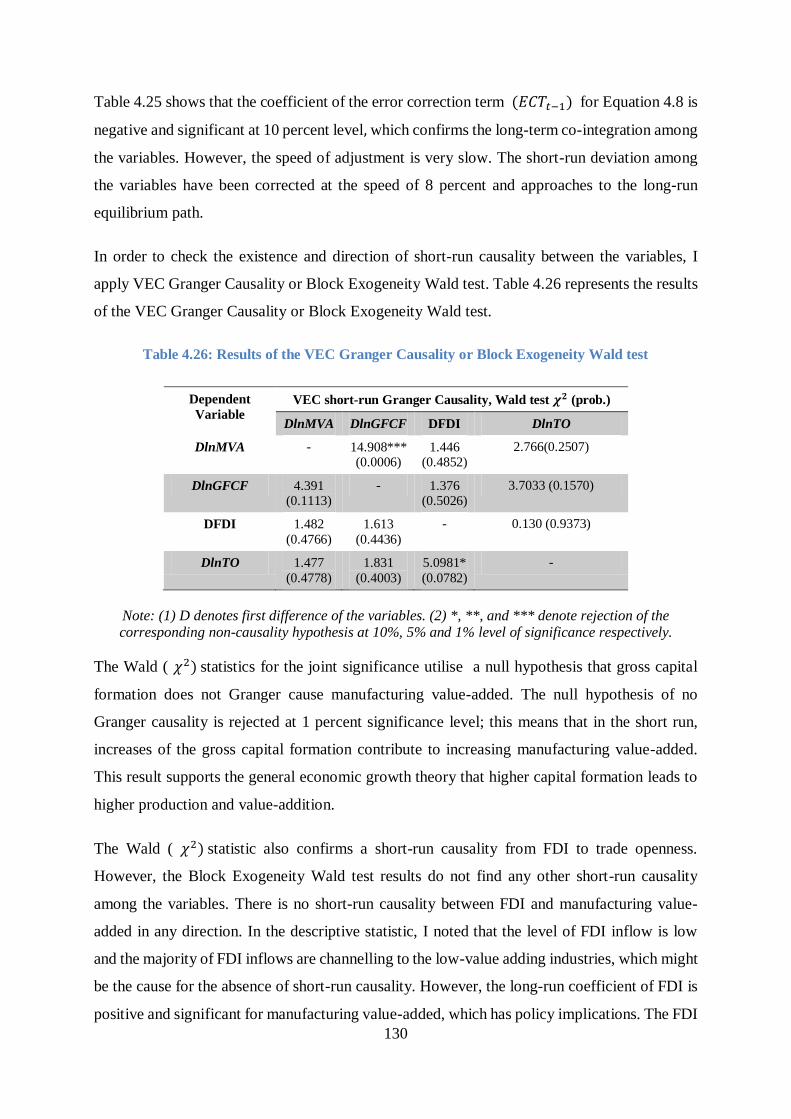
130
Table 4.25 shows that the coefficient of the error correction term (𝐸𝐶𝑇𝑡−1) for Equation 4.8 is
negative and significant at 10 percent level, which confirms the long-term co-integration among
the variables. However, the speed of adjustment is very slow. The short-run deviation among
the variables have been corrected at the speed of 8 percent and approaches to the long-run
equilibrium path.
In order to check the existence and direction of short-run causality between the variables, I
apply VEC Granger Causality or Block Exogeneity Wald test. Table 4.26 represents the results
of the VEC Granger Causality or Block Exogeneity Wald test.
Table 4.26: Results of the VEC Granger Causality or Block Exogeneity Wald test
Dependent
Variable VEC short-run Granger Causality, Wald test 𝝌𝟐 (prob.)
DlnMVA DlnGFCF DFDI DlnTO
DlnMVA - 14.908*** (0.0006)
1.446 (0.4852)
2.766(0.2507)
DlnGFCF 4.391 (0.1113)
- 1.376 (0.5026)
3.7033 (0.1570)
DFDI 1.482
(0.4766)
1.613
(0.4436)
- 0.130 (0.9373)
DlnTO 1.477
(0.4778)
1.831
(0.4003)
5.0981*
(0.0782)
-
Note: (1) D denotes first difference of the variables. (2) *, **, and *** denote rejection of the corresponding non-causality hypothesis at 10%, 5% and 1% level of significance respectively.
The Wald ( 𝜒2) statistics for the joint significance utilise a null hypothesis that gross capital
formation does not Granger cause manufacturing value-added. The null hypothesis of no
Granger causality is rejected at 1 percent significance level; this means that in the short run,
increases of the gross capital formation contribute to increasing manufacturing value-added.
This result supports the general economic growth theory that higher capital formation leads to
higher production and value-addition.
The Wald ( 𝜒2) statistic also confirms a short-run causality from FDI to trade openness.
However, the Block Exogeneity Wald test results do not find any other short-run causality
among the variables. There is no short-run causality between FDI and manufacturing value-
added in any direction. In the descriptive statistic, I noted that the level of FDI inflow is low
and the majority of FDI inflows are channelling to the low-value adding industries, which might
be the cause for the absence of short-run causality. However, the long-run coefficient of FDI is
positive and significant for manufacturing value-added, which has policy implications. The FDI
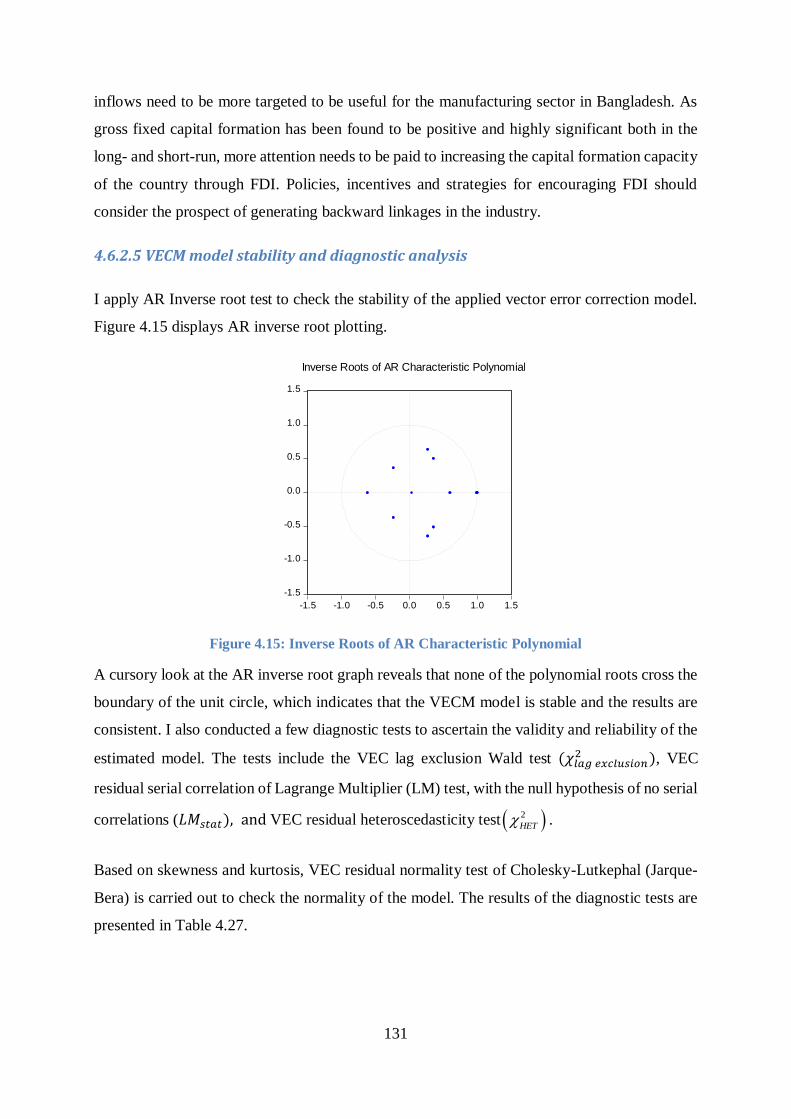
131
inflows need to be more targeted to be useful for the manufacturing sector in Bangladesh. As
gross fixed capital formation has been found to be positive and highly significant both in the
long- and short-run, more attention needs to be paid to increasing the capital formation capacity
of the country through FDI. Policies, incentives and strategies for encouraging FDI should
consider the prospect of generating backward linkages in the industry.
4.6.2.5 VECM model stability and diagnostic analysis
I apply AR Inverse root test to check the stability of the applied vector error correction model.
Figure 4.15 displays AR inverse root plotting.
Figure 4.15: Inverse Roots of AR Characteristic Polynomial
A cursory look at the AR inverse root graph reveals that none of the polynomial roots cross the
boundary of the unit circle, which indicates that the VECM model is stable and the results are
consistent. I also conducted a few diagnostic tests to ascertain the validity and reliability of the
estimated model. The tests include the VEC lag exclusion Wald test (𝜒𝑙𝑎𝑔 𝑒𝑥𝑐𝑙𝑢𝑠𝑖𝑜𝑛2 ), VEC
residual serial correlation of Lagrange Multiplier (LM) test, with the null hypothesis of no serial
correlations (𝐿𝑀𝑠𝑡𝑎𝑡), and VEC residual heteroscedasticity test 2
HET .
Based on skewness and kurtosis, VEC residual normality test of Cholesky-Lutkephal (Jarque-
Bera) is carried out to check the normality of the model. The results of the diagnostic tests are
presented in Table 4.27.
-1.5
-1.0
-0.5
0.0
0.5
1.0
1.5
-1.5 -1.0 -0.5 0.0 0.5 1.0 1.5
Inverse Roots of AR Characteristic Polynomial

132
Table 4.27: Results from Diagnostic tests
Diagnostic test Statistic Value [prob] Outcome
Lag exclusion Wald
test (𝜒𝑙𝑎𝑔 𝑒𝑥𝑐𝑙𝑢𝑠𝑖𝑜𝑛
2 )(lag 2) 32.55 [0.008] Lag selection is
appropriate
Heteroscedasticity
(no cross-term only
level and squares)
2
HET 189.47 [0.4972] No
heteroscedasticity
Normality Jarque-Bera 0.6387[0.726] Normality distributed
Serial Correlation (𝐿𝑀𝑠𝑡𝑎𝑡) (lag 1)
(𝐿𝑀𝑠𝑡𝑎𝑡) (lag 2)
24.9097 [0.0714]
12.65416 (0.6979)
No serial correlation
The results in Table 4.27 indicate that there is no serial correlation problem in the model. The
associated probability of the LM statistic at lag 1 for the serial correlation of the Lagrange
multiplier (LM) test is 0.0714, which is more than 5 percent. Therefore, the null hypothesis of
no serial correlation is accepted. The associated probability at lag 2 for the LM statistic is 0.6979
which is also greater than 5 percent. Therefore, the null hypothesis of the absence of serial
correlation cannot be rejected. Similarly, the null hypothesis of no heteroscedasticity is accepted
at the 5 percent level of significance. The Jarque-Bera statistic and associated probability
confirm the normality of the residual assumption.
4.7 Conclusion
In this chapter, I investigate the impact of manufacturing FDI inflows on economic
sustainability in Bangladesh. The government of Bangladesh is promoting FDI inflows in the
export-oriented manufacturing sector, intending to transform the economy from a low-value-
added agrarian economy to a high value-added advanced industrial economy. The
manufacturing industries may get access to advanced technology, brand names, and global
markets through FDI. Therefore, the productivity and efficiency of the manufacturing sector
are expected to increase with the presence of FDI. The expansion of productive capital stock
and the increase in productivity and efficiency are essential for the economic sustainability of
a country.
The descriptive statistical analysis reveals that manufacturing FDI inflows may assist in the
promotion of economic growth and exports. Manufacturing FDI inflows also may contribute to
the expansion of the domestic production base by creating backward linkages and increasing
gross capital formation. However, the backward linkages are established only in the low value-

133
adding parts of the production process, which restricts the generation of sufficient spillover
effects of FDI inflows. The productivity, efficiency and innovation indicators also show that
Bangladesh may not be exploiting the productivity and efficiency spillover effects of FDI
inflows.
The empirical analysis investigates the long-run relationship, and short-run causality among
manufacturing value-added, FDI inflows, gross fixed capital formation, and trade openness.
The results exhibit a significant long-run co-integration among the variables. The results also
reveal that FDI inflows exert a positive impact on manufacturing value-added in the long run.
However, there is no short-run causality between FDI inflows and manufacturing value-added
in any direction. The gross capital formation has a strong positive impact on manufacturing
valued-added both in the short- and long-run.
Therefore, in general, FDI inflows are favourable for the economic development of the country.
However, the technological spillover effects of FDI inflows are very limited. High
concentration of FDI inflows to low-tech and low-value added manufacturing and the low
absorptive capacity of the country are the main challenges in realising the spillover benefits of
FDI inflows. Bangladesh should take the necessary initiatives to encourage high technology-
based FDI inflows into the country. The country should also focus on strengthening the
domestic capacity to realise the benefits of FDI inflows. The positive short- and long-run impact
of gross capital formation on manufacturing valued-added indicate that, along with foreign
investment, domestic investment is also vital for sustainable industrialisation of the country.
Therefore, the FDI promoting strategies need to be designed in a way that it also encourages
domestic investment. The technological spillover issues must be considered while dealing with
foreign investment.
134
CHAPTER 5: MANUFACTURING FDI AND ENVIRONMENTAL
SUSTAINABILITY IN BANGLADESH
5.1 Introduction
In this chapter I explore Research Question Two, which relates to the impact of manufacturing
FDI inflows on environmental sustainability in Bangladesh. Like many other developing
countries, Bangladesh strives for industrialisation to achieve rapid economic growth and
generate employment for a huge and growing unemployed population. The expansion of export-
led manufacturing is the key strategy towards the industrialisation of the country. It is believed
that the industrial sector can generate a large number of high-paid jobs, contribute to scaling up
production in high-value adding goods and improving productivity (UNCTAD, 2012).
Moreover, the government can reinvest the foreign exchange earnings from the manufactured
exports for further development initiates. It is also claimed that, in general, the productivity of
the manufacturing sector is higher than the productivity of traditional agriculture and other
service-oriented industries (UNCTAD, 2012).
However, environmental pollution is often a by-product of industrial intensification. Further,
the protection of the environment and natural resources has unfortunately been neglected for
many years by policy planners in Bangladesh (Gain et al., 2002; Khan, 2017). As a result, rapid
population growth, coupled with increased economic activity, unplanned urbanisation,
industrial intensification, and improper management has led to serious environmental
degradation in the country. The country ranked amongst the lowest in the global Environmental
Performance Index (Index, 2018)13 and environmental degradation places pressure on the life
and livelihood of vulnerable poor communities more severely than others (GOB, 2011). The
profound environmental degradation puts at the sustainability of recent development efforts at
risk.
13Environmental Performance Index is estimated by Columbia University and Yale University in collaboration with the
World Economic Forum. They quantify and measure the environmental performance of State policies based on selected indicators. In 2018, Bangladesh was positioned 179 out of 180 countries in the Environmental Performance Index (Index, 2018).
135
Considering the severity of the consequences of environmental degradation, Bangladesh has
paid attention to environmental protection issues and taken initiatives to safeguard the
environment from further deterioration, at least at the policy level. The current 7th Plan
document of the Government of Bangladesh acknowledges that:
…Bangladesh faces a growing number of diverse environmental problems … which
severely affect not only the economy and ecosystem but also the well-being of people,
especially the poor … Pollution issues are most critical in urban and industrial areas
(GOB, 2015a, p. 422).
Recently, the government embraced the need for sustainability in its development strategies and
approved the National Sustainable Development Strategy (NSDS) (GOB, 2013). The 7th Plan
(2015-2020) document also emphasises the need for green growth or environmentally friendly
growth. However, a limited natural resource base, outdated technology, weak institutions, poor
enforcement of environmental policies and regulations and, above all, tremendous pressure for
intensification of economic activities to meet the demand for a huge growing population are
major challenges towards the achievement of green growth or environmental sustainability in
Bangladesh.
The government of Bangladesh is trying to attract more FDI inflows in the country with various
incentives to foster the industrialisation process, bring technological advancement and
sophistication in the production system and accelerate economic growth. In general,
environmental improvement is not the prime goal either for the host country or the investing
enterprises for channelling FDI. However, by transferring and diffusing advanced
environmental technology and adopting better environmental management system in the
production process, FDI can potentially contribute to promoting green growth or ecological
friendly development in the host country. In contrast, taking advantage of less stringent
environmental regulations of the host country, dirty or polluting industries can be relocated
from developed economies to developing economies (such as Bangladesh) through FDI
inflows. Therefore, the environmental situation could deteriorate further in the host economy.
Section 5.2 briefly describes the major environmental pollutions that arise from industrial
intensification in Bangladesh. Section 5.3 discusses the policies relating to the regulation and
environmental protection in Bangladesh. By analysing available information and statistics,
Section 5.4 investigates the concern that high-polluting or dirty industries are relocating in
Bangladesh due to FDI inflows (the pollution haven hypothesis).
136
To check for the presence of the pollution halo hypothesis, Section 5.5 empirically examines
the short-run and long-run impacts of FDI inflows on the renewable energy consumption in
Bangladesh. Section 5.5 also conducts an empirical analysis to check the validity of the inverse
U-patterned Environmental Kuznets curve relationship and pollution haven hypothesis for CO2
emissions in Bangladesh. Section 5.6 describes the major challenges towards environmental
sustainability in Bangladesh and Section 5.7 concludes the chapter.
5.2 Major environmental pollution arising from industrial
intensification in Bangladesh
Bangladesh is facing multifarious environmental problems, like many other overpopulated
developing countries. Environmental conditions are unsustainable due to development
activities, and particularly unplanned industrialisation, urbanisation and anthropogenic
activities of the huge population (GOB, 2017). The current population is 160 million, with a
population density amongst the highest in the world. At the current growth rate, the population
is expected to reach 270 million by 2050. The capital city Dhaka would itself be home to 50
million people by 2050. Population pressures lead to more intensive land use and agricultural
land is becoming scarcer due to the need for new dwelling settlements.
The country also faces tremendous pressure for employment generation. For these reasons,
policy makers are promoting industrialisation; however, the industrialisation process has
occurred, to date, in a very unplanned and unsustainable way (GOB, 2017). The unplanned
industrialisation, weak enforcement of law and poor corporate responsibility have caused
serious environmental problems in Bangladesh. The three basic elements of the environment
(air, water and soil) are severely polluted due to industrialisation as discussed in this section.
5.2.1 Air pollution
Air pollution occurs due to the introduction of various and harmful metallic, biological and gas
particulates into the atmosphere. The particulates alter the standard composition of air.
Industrial emissions and vehicular emissions are the two major causes of air pollution in
Bangladesh (Banglapedia, 2015). Industries and vehicles produce fumes, smokes, and dust and
this causes severe air pollution in the country by increasing carbon gases (CO, CO2), sulphur
dioxide (SO2), nitrogen gases and metallic particulates (such as lead and nickel) into the air
(Pavel, 2016). The industries that are mostly responsible for air pollution include cement, brick

137
kilns, chemical and pharmaceuticals, food processing, textiles and spinning mills, fertiliser
factories and construction industries. Rasul et al. (2006) estimated the total air pollution load
generated from major process industries in Bangladesh. The total emissions load was calculated
based on the emissions of selected air pollutant particulates (CO, SO2, NO2, volatile organic
compounds and total suspended particles) by industry. Table 5.1 lists the top five air polluting
industries and their relative share of the air pollution generated by industries in Bangladesh.
Food, cement, paper, textiles and tobacco industries together are responsible for 84.0 percent
of air pollution generated by processing industries in Bangladesh.
Table 5.1: Top five air polluting industries in Bangladesh
Industry Emission (tons/year) Share of the air pollution (as
% of total air pollution
generated by processing
industries)
Food Industry 146356 38.7
Cement 62726 16.6
Pulp and Paper 51964 13.7
Textiles 39831 10.5
Tobacco 16992 4.5
Source: (Rasul et al., 2006)
Bangladesh is one of the worst ‘victims’ of climate change and global warming due to its
location, high density of population and poverty level. The low-lying delta region and general
lack of altitude above sea level means that the country is very vulnerable to climate events
(GOB, 2015a). In the past, the country faced several catastrophic climate events, including
floods, which killed millions of people and impeded development efforts. Bangladesh ranked
sixth amongst the ten most climate-affected countries as per the average annual losses related
to climate change events (see Table 5.2). In addition, it is reported that an extra 14 percent of
the country will be extremely exposed to floods, due to sea level rising by 2050 (MOFAON,
2018).

138
Table 5.2: The long-run Climate Risk Index (CRI): the most affected 10 countries from 1997-
2016 (annual averages)
Climate Risk
Index (CRI)
Country Death toll Total losses in
million USD (PPP)
Losses as a
percentage
of GDP
Total
number
of events
(1997-
2016)
1 Honduras 301.65 561.11 1.97 62
2 Haiti 280.40 418.77 2.73 72
3 Myanmar 7097.75 1277.86 0.70 43
4 Nicaragua 162 234.60 1.13 44
5 Philippines 859.55 2893.41 0.61 289
6 Bangladesh 641.55 2311.04 0.68 187
7 Pakistan 523.10 3816.82 0.61 141
8 Vietnam 312.60 2029.80 0.55 216
9 Thailand 139.60 7696.59 0.97 137
10 Dominican Republic 210.90 243.53 0.26 49
Source: Global Climate Risk Index 2018 (Eckstein et al., 2017)
Greenhouse gases are largely responsible for global warming. Greenhouse gases work as a
temperature insulator device, which entangles heat in the earth and results in the gradual rise of
temperature level. Although climate change and global warming are the outcomes of global
activities and developed countries are mostly held responsible for global warming, developing
countries are also causing global warming at a significant level. Wei et al. (2016) show that
around 58 percent of the rising global temperature is caused by developed economies, while
developing economies are responsible for 45 percent of that, on an average.
In Bangladesh, vehicular and industrial emissions are the main sources of the rising level of
carbon or greenhouse gases in the air. Table 5.3 indicates that CO2 and greenhouse gas
emissions in the country have been increasing rapidly. Relative to 1990, total greenhouse gases
emissions had increased by 44 percent by 2012. The manufacturing sector alone caused nearly
18 percent of the total emission. The transportation and manufacturing sector together produce
more than 35 percent of total CO2 emissions of the country.
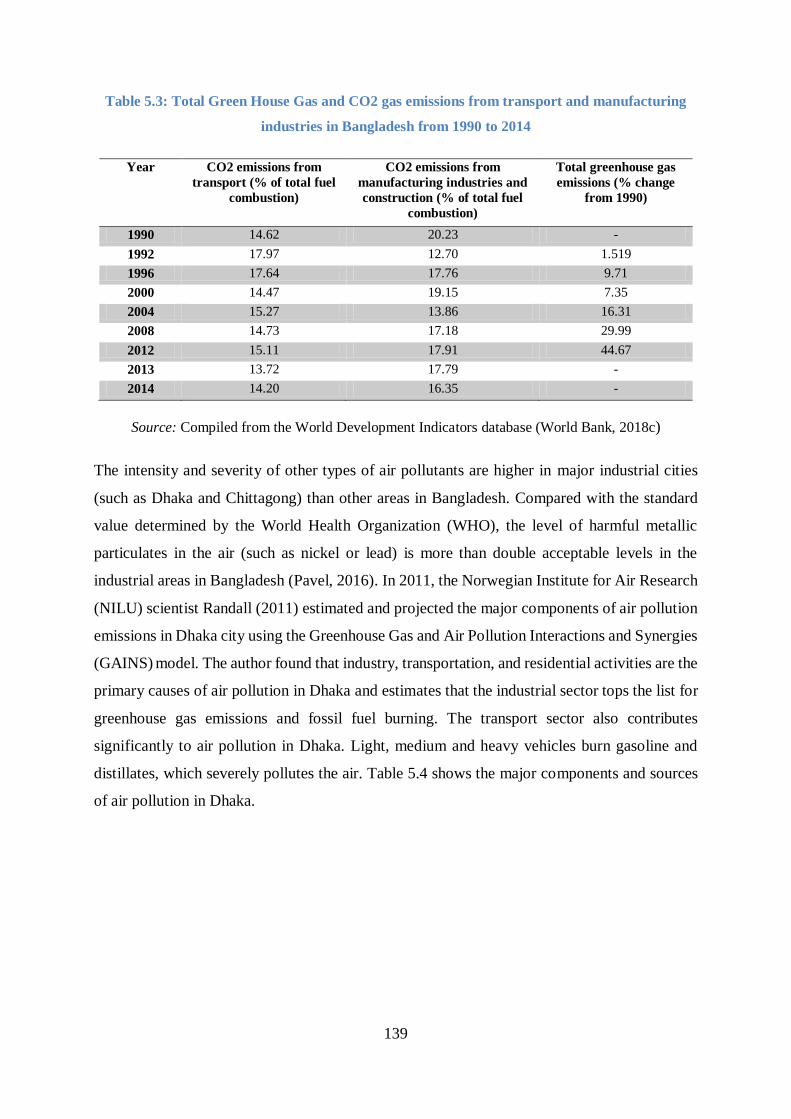
139
Table 5.3: Total Green House Gas and CO2 gas emissions from transport and manufacturing
industries in Bangladesh from 1990 to 2014
Year CO2 emissions from
transport (% of total fuel
combustion)
CO2 emissions from
manufacturing industries and
construction (% of total fuel
combustion)
Total greenhouse gas
emissions (% change
from 1990)
1990 14.62 20.23 -
1992 17.97 12.70 1.519
1996 17.64 17.76 9.71
2000 14.47 19.15 7.35
2004 15.27 13.86 16.31
2008 14.73 17.18 29.99
2012 15.11 17.91 44.67
2013 13.72 17.79 -
2014 14.20 16.35 -
Source: Compiled from the World Development Indicators database (World Bank, 2018c)
The intensity and severity of other types of air pollutants are higher in major industrial cities
(such as Dhaka and Chittagong) than other areas in Bangladesh. Compared with the standard
value determined by the World Health Organization (WHO), the level of harmful metallic
particulates in the air (such as nickel or lead) is more than double acceptable levels in the
industrial areas in Bangladesh (Pavel, 2016). In 2011, the Norwegian Institute for Air Research
(NILU) scientist Randall (2011) estimated and projected the major components of air pollution
emissions in Dhaka city using the Greenhouse Gas and Air Pollution Interactions and Synergies
(GAINS) model. The author found that industry, transportation, and residential activities are the
primary causes of air pollution in Dhaka and estimates that the industrial sector tops the list for
greenhouse gas emissions and fossil fuel burning. The transport sector also contributes
significantly to air pollution in Dhaka. Light, medium and heavy vehicles burn gasoline and
distillates, which severely pollutes the air. Table 5.4 shows the major components and sources
of air pollution in Dhaka.

140
Table 5.4: Major components and sources of air pollution in Dhaka City
Emissions
components
Total
Emissions
(tons/year)
Top
Sector
Sector
emissions
% of Top Sector emissions over
total emissions
PM2.5 35000 Industry 19000 54.29
PM10 45000 Industry 27000 60.00
SO2 34000 Industry 28000 82.35
NOx 30000 Industry 20000 66.67
GHGs 23000000 Industry 14000000 60.87
Source: (Randall, 2011)
Randall (2011) also projected the emissions level of the major pollutants in Dhaka city, which
is presented in Table 5.5. As per Randall's (2011) prediction, the emissions level of Dhaka city
will increase rapidly over time due to the increase of specific pollutants and specifically due to
the industrial sector. Sulphur dioxide (SO2) and greenhouse gas emissions will increase at the
higher rate through the industry sector's activities.
Table 5.5: Estimated and projected emissions (kilotons) from major sectors during 2010 and
2030 in Dhaka and percent difference
Emiss-
ions
comp-
onents
Top Sectors Total
Industry Transport
2010 2030 Diff
(%)
2010 2030 Diff
(%)
2010 2030 Diff
(%)
PM2.5 19.5 36.45 +87 1.36 1.29 -5 35.2 48.70 +38
PM10 27.1 49.71 +83 1.50 1.47 -2 44.9 64.02 +42
SO2 27.8 103.7 +273 2.50 3.84 +53 34.2 113.4 +231
NOx 20.3 36.57 +80 9.38 18.9 +102 32.8 60.05 +83
GHGs 13.8 30.18 +117 0.97 1.66 +71 22.7 42.17 +86
Source: (Randall, 2011)
Increasing air pollution is causing serious damage to the life, livelihood and development efforts
in the country. As per the World Bank Report, due to air pollution, the total welfare losses of
Bangladesh amount to $USD27.5 billion from 1990 to 2013, which is equivalent to 6.5 percent
of GDP. High levels of air pollution also cause a notable number of air pollution-related deaths,
human suffering and threaten sustainable development. In 2013, the estimated death cost of air
pollution was around $USD2.6 billion in Bangladesh (World Bank, 2016). The popular
newspaper, The Daily Star, reports that on average, more than 37,000 Bangladesh nationals die
141
each year due to air pollution-related diseases. Ischemic heart disease, heart attack and stroke
account for 60 percent of air-related deaths. Respiratory and lung infections and pulmonary
disorders are mostly responsible for the rest of the air pollution-related deaths in Bangladesh
(The Daily Star, 28 September, 2016).
5.2.2 Water pollution
Untreated industrial effluents are the key source of water pollution in Bangladesh (MOF, 2016).
Water pollution levels are particularly high in industrial belts and urban areas. Major cities and
industrial areas are located along the major rivers in Bangladesh and large, medium and small
enterprises discharge effluents directly into the rivers, creating severe river water pollution. The
textile and dyeing, leather and tannery, pharmaceuticals, metal processing, and fertiliser
industries are mostly responsible for water pollution in Bangladesh (Kabir, 2014).
A huge amount of industrial waste and effluents are discharged directly and indirectly into 200
rivers in Bangladesh. More than 700 leather processing industries are located near Dhaka, and
these discharge around 16,000 cubic metres of contaminated wastes directly into the river
systems. All of the rivers near the three major industrial areas (Dhaka, Chittagong, and Khulna)
are highly polluted. According to the list of the Department of Environment (DOE), around
1,200 industrial plants are causing serious water pollution nationally (Bhuyan et al., 2017).
Dhaka is located on the bank of the Buriganga River, the water of which has reached a state
such that hardly any aquatic life can survive in the water (GOB, 2013). The World Bank (2007)
reports that more than 7,000 industrial plants located around Dhaka city are discharging nearly
1.5 million cubic metres of contaminated water daily into the four major rivers: the
Shitalakhkha, Buriganga, Balu, and Turag. The dyeing and textiles industry is identified as the
primary source of water pollution of the Buriganga River. Dyeing and textiles industries
discharge various poisonous chemicals and substances, such as chromium, cadmium and
mercury to the water; these toxic chemicals also drain to the groundwater. Therefore,
groundwater is being contaminated, causing a severe threat to overall wellbeing and public
health (GOB, 2013).
Textile mills and fertiliser industries are mostly responsible for polluting the Sitalakhya river
water. Untreated effluents from textiles, pharmaceuticals, paints, iron, and steel industries are
causing severe pollution of the Balu River, which flows beside the Tongi Industrial area of
Dhaka. Human health, aquatic life, marine ecosystems, and livelihoods such as agriculture and
142
fishing are directly impacted as a result of this water pollution and waterborne diseases, such
as cholera, typhoid and Hepatitis-B are increasing at an alarming rate (GOB, 2017; World Bank,
2018a).
5.2.3 Soil pollution
Soil pollution also threatens ecosystems and human health in Bangladesh. The untreated
discharge of industrial effluents, inadequate, unplanned and non-scientific solid waste
management, and unsustainable agricultural practices are the main causes of soil pollution in
Bangladesh. The concentration of heavy metals, chemicals, lead and arsenic seriously degrade
soil quality. Land contamination is severe in Dhaka and surrounding areas where industries are
clustered (World Bank, 2018a).
A massive amount of solid waste is produced by the major administrative and industrial cities
of Bangladesh. The major six cities generate around 8,000 tons of solid waste per day, of which
Dhaka city accounts for nearly 70 percent (Abedin and Jahiruddin, 2015). The waste disposal
systems in Bangladesh is insufficient and inefficient. There is a lack of proper recycling,
minimal formal collection and poor transportation and treatment facilities in the waste disposal
system, which causes various forms of environmental degradation (ADB, 2004).
It is essential to introduce and implement pollution prevention measures to control industrial
pollution in Bangladesh; however, most industrial plants do not have an effective pollution
prevention system in Bangladesh (Hoque and Clarke, 2013). Most recycling is only done if it
is a part of a manufacturing process (Nishat, 2001), and most of the industries do not have any
treatment plants to neutralise hazardous compounds, although it is mandatory by the law (World
Bank, 2014). Section 5.3 describes the core rules, regulations, and policies for preventing
environmental pollution in Bangladesh.
5.3 Legal context of preventing environmental pollution in Bangladesh
For many years, policy planners ignored the environmental implications of industrial activities
in Bangladesh (Alam, 2007; Gain et al., 2002; Haque, 2013). At the global level, environmental
issues were receiving attention after the Rio Summit in 1992 and Bangladesh made some
progress in formulating environmental policies and strategies after the Rio Summit. Bangladesh
signed several environmentally-related international treaties and agreements; notably, 35
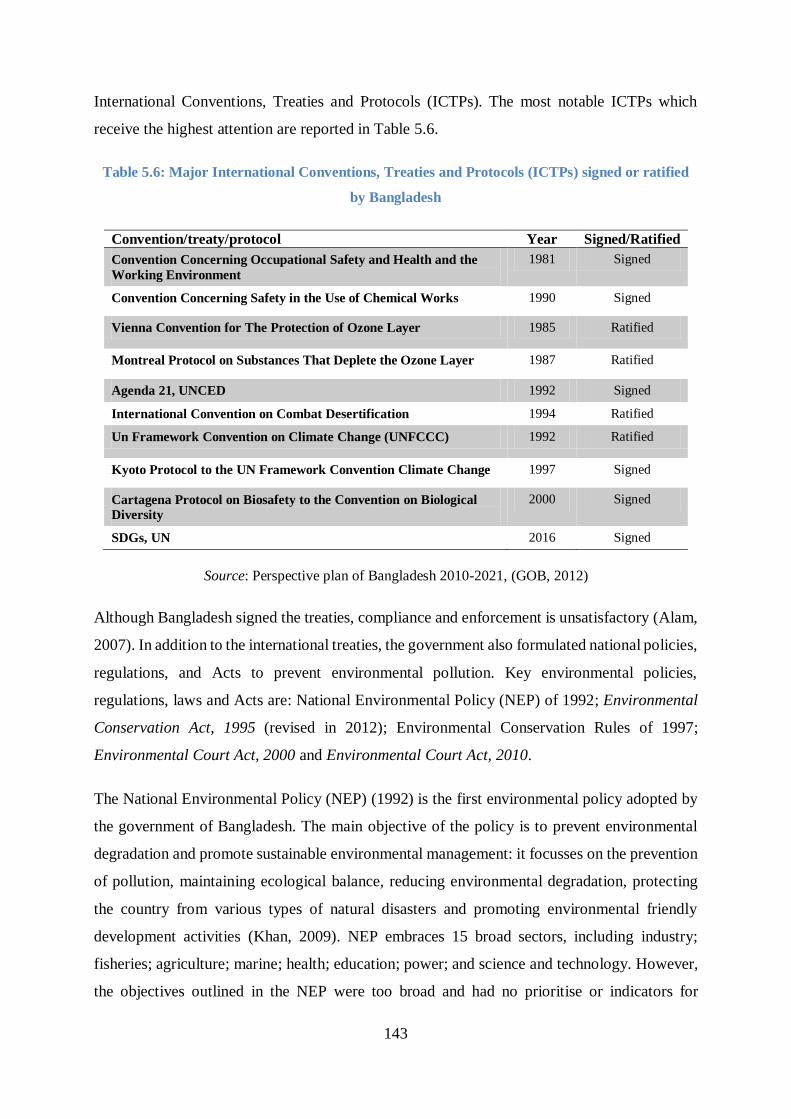
143
International Conventions, Treaties and Protocols (ICTPs). The most notable ICTPs which
receive the highest attention are reported in Table 5.6.
Table 5.6: Major International Conventions, Treaties and Protocols (ICTPs) signed or ratified
by Bangladesh
Convention/treaty/protocol Year Signed/Ratified
Convention Concerning Occupational Safety and Health and the
Working Environment
1981 Signed
Convention Concerning Safety in the Use of Chemical Works 1990 Signed
Vienna Convention for The Protection of Ozone Layer 1985 Ratified
Montreal Protocol on Substances That Deplete the Ozone Layer 1987 Ratified
Agenda 21, UNCED 1992 Signed
International Convention on Combat Desertification 1994 Ratified
Un Framework Convention on Climate Change (UNFCCC) 1992 Ratified
Kyoto Protocol to the UN Framework Convention Climate Change 1997 Signed
Cartagena Protocol on Biosafety to the Convention on Biological
Diversity
2000 Signed
SDGs, UN 2016 Signed
Source: Perspective plan of Bangladesh 2010-2021, (GOB, 2012)
Although Bangladesh signed the treaties, compliance and enforcement is unsatisfactory (Alam,
2007). In addition to the international treaties, the government also formulated national policies,
regulations, and Acts to prevent environmental pollution. Key environmental policies,
regulations, laws and Acts are: National Environmental Policy (NEP) of 1992; Environmental
Conservation Act, 1995 (revised in 2012); Environmental Conservation Rules of 1997;
Environmental Court Act, 2000 and Environmental Court Act, 2010.
The National Environmental Policy (NEP) (1992) is the first environmental policy adopted by
the government of Bangladesh. The main objective of the policy is to prevent environmental
degradation and promote sustainable environmental management: it focusses on the prevention
of pollution, maintaining ecological balance, reducing environmental degradation, protecting
the country from various types of natural disasters and promoting environmental friendly
development activities (Khan, 2009). NEP embraces 15 broad sectors, including industry;
fisheries; agriculture; marine; health; education; power; and science and technology. However,
the objectives outlined in the NEP were too broad and had no prioritise or indicators for

144
implementation (Khan, 2009). Followed by NEP, the Government formulated the National
Environmental Management Plan (NEMAP) as the guideline of implementing NEP.
The government approved the Environmental Conservation Act 1995 to implement the National
Environmental Policy, with an aim to conserve the natural environment, reduce environmental
pollution levels and improve overall environmental conditions in the country. This Act replaced
the earlier environmental rules and ordinances. The Department of Environment (DOE) of
Bangladesh has the foremost authority to enforce this Act. Under the Act, the respective
authority can impose fines and penalties if environmental obligations and compliances are
violated.
The government adopted the Environmental Conservation Rules in 1997 to provide support for
and facilitate the enforcement of the Environmental Conservation Act 1995. The most notable
outcome of the 1997 Environmental Conservation Rules is the categorisation of the industries
and projects based on their likely adverse effects on the environment. It also specifies the
procedure and management for establishing and operating different types of projects and
industries.
The types and major requirements of projects and industries outlined in Environmental
Conservation Rules, 1997 are summarised in Table 5.7.
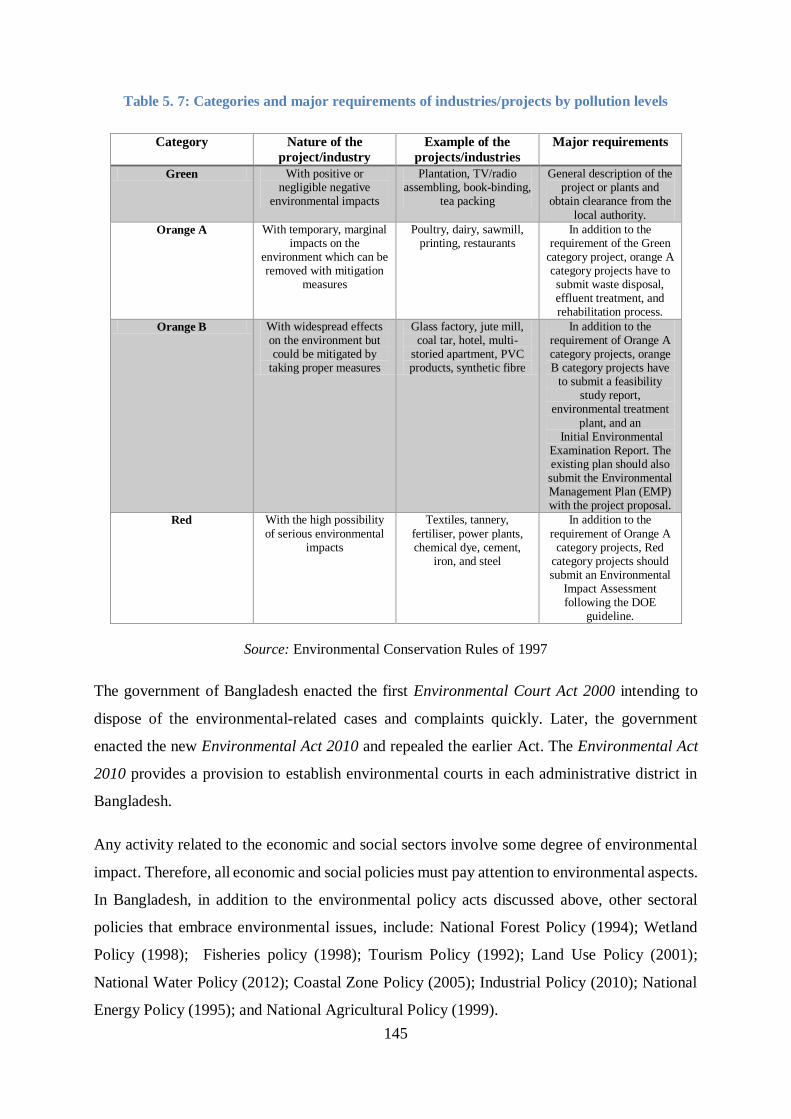
145
Table 5. 7: Categories and major requirements of industries/projects by pollution levels
Category Nature of the
project/industry
Example of the
projects/industries
Major requirements
Green With positive or negligible negative
environmental impacts
Plantation, TV/radio assembling, book-binding,
tea packing
General description of the project or plants and
obtain clearance from the
local authority.
Orange A With temporary, marginal impacts on the
environment which can be removed with mitigation
measures
Poultry, dairy, sawmill, printing, restaurants
In addition to the requirement of the Green
category project, orange A category projects have to submit waste disposal, effluent treatment, and rehabilitation process.
Orange B With widespread effects on the environment but could be mitigated by
taking proper measures
Glass factory, jute mill, coal tar, hotel, multi-
storied apartment, PVC products, synthetic fibre
In addition to the requirement of Orange A category projects, orange B category projects have
to submit a feasibility study report,
environmental treatment
plant, and an Initial Environmental
Examination Report. The existing plan should also submit the Environmental Management Plan (EMP) with the project proposal.
Red With the high possibility
of serious environmental impacts
Textiles, tannery,
fertiliser, power plants, chemical dye, cement,
iron, and steel
In addition to the
requirement of Orange A category projects, Red
category projects should submit an Environmental
Impact Assessment following the DOE
guideline.
Source: Environmental Conservation Rules of 1997
The government of Bangladesh enacted the first Environmental Court Act 2000 intending to
dispose of the environmental-related cases and complaints quickly. Later, the government
enacted the new Environmental Act 2010 and repealed the earlier Act. The Environmental Act
2010 provides a provision to establish environmental courts in each administrative district in
Bangladesh.
Any activity related to the economic and social sectors involve some degree of environmental
impact. Therefore, all economic and social policies must pay attention to environmental aspects.
In Bangladesh, in addition to the environmental policy acts discussed above, other sectoral
policies that embrace environmental issues, include: National Forest Policy (1994); Wetland
Policy (1998); Fisheries policy (1998); Tourism Policy (1992); Land Use Policy (2001);
National Water Policy (2012); Coastal Zone Policy (2005); Industrial Policy (2010); National
Energy Policy (1995); and National Agricultural Policy (1999).
146
In Bangladesh, the Environment and Forests Ministry is the key government organisation for
formulating, coordinating, and monitoring environmental policies, and planning. The
Department of Environment (DOE) is the focal technical institution that works under the
Ministry of Environment and Forests and implements the policies. As noted, the environment
is interlinked with all other sectors; therefore, almost all ministries and institution are involved
with environmental issues. An integrated, holistic approach is crucial to control and mitigate
environmental pollution problems. Civil society, NGOs and private sectors also need to be
involved with this process.
FDI could be a possible channel to diffuse environmentally-friendly technology and better
environmental management systems to Bangladesh; however, the impact of FDI inflows on the
host country's environmental situation depends on the enforcement and types of environmental
policies and regulations, the sectors where FDI is occurring, technological diffusion and the
corporate social responsibility of the MNEs.
5.4 The nexus between FDI inflows and environmental sustainability:
the presence of pollution havens or pollution halos in Bangladesh
manufacturing
The discussion in Section 5.2 demonstrates that industrial intensification and, particularly the
growth of the manufacturing sector, adversely impacts the state of the environment in
Bangladesh. Environmental degradation is likely fuelled by the increased growth of the
manufacturing sector. This study aims to determine the environmental consequences of FDI
inflows in the manufacturing sector in Bangladesh. The FDI-environment relationship is viewed
mainly from the perspective of two opposing hypotheses: the pollution haven hypothesis (or
race to the bottom); and the pollution halo hypothesis.
The pollution haven hypothesis postulates that the industries that generate high pollution tend
to move from developed economies towards developing economies. Over the last two decades,
environmental protection is highly important at the global level, and a number of international
agreements have been signed. The commitment to these agreements leads to the adoption of
increasingly strict environmental regulations. More advanced economies usually practice
stricter environmental laws and regulations. Therefore, manufacturing costs are relatively high,
especially for pollution-intensive industries. Developing countries are competing with each
other to attract FDI and tend to undermine their environmental laws as a result. Therefore,
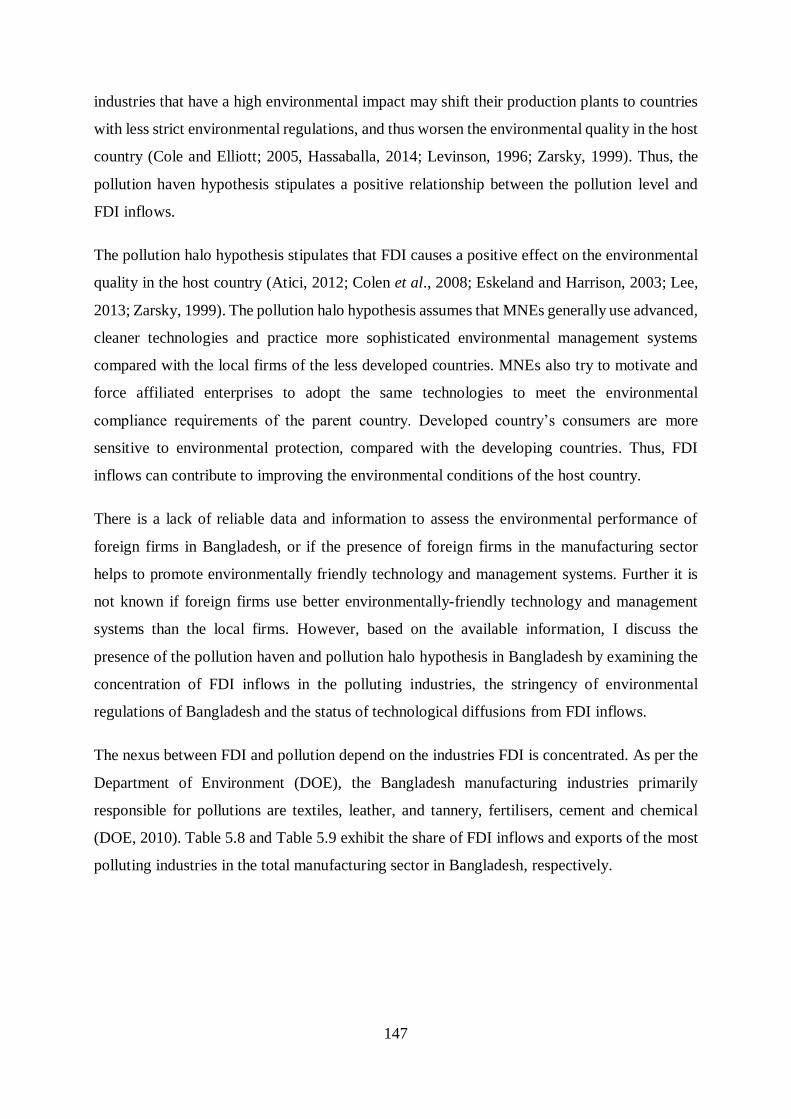
147
industries that have a high environmental impact may shift their production plants to countries
with less strict environmental regulations, and thus worsen the environmental quality in the host
country (Cole and Elliott; 2005, Hassaballa, 2014; Levinson, 1996; Zarsky, 1999). Thus, the
pollution haven hypothesis stipulates a positive relationship between the pollution level and
FDI inflows.
The pollution halo hypothesis stipulates that FDI causes a positive effect on the environmental
quality in the host country (Atici, 2012; Colen et al., 2008; Eskeland and Harrison, 2003; Lee,
2013; Zarsky, 1999). The pollution halo hypothesis assumes that MNEs generally use advanced,
cleaner technologies and practice more sophisticated environmental management systems
compared with the local firms of the less developed countries. MNEs also try to motivate and
force affiliated enterprises to adopt the same technologies to meet the environmental
compliance requirements of the parent country. Developed country’s consumers are more
sensitive to environmental protection, compared with the developing countries. Thus, FDI
inflows can contribute to improving the environmental conditions of the host country.
There is a lack of reliable data and information to assess the environmental performance of
foreign firms in Bangladesh, or if the presence of foreign firms in the manufacturing sector
helps to promote environmentally friendly technology and management systems. Further it is
not known if foreign firms use better environmentally-friendly technology and management
systems than the local firms. However, based on the available information, I discuss the
presence of the pollution haven and pollution halo hypothesis in Bangladesh by examining the
concentration of FDI inflows in the polluting industries, the stringency of environmental
regulations of Bangladesh and the status of technological diffusions from FDI inflows.
The nexus between FDI and pollution depend on the industries FDI is concentrated. As per the
Department of Environment (DOE), the Bangladesh manufacturing industries primarily
responsible for pollutions are textiles, leather, and tannery, fertilisers, cement and chemical
(DOE, 2010). Table 5.8 and Table 5.9 exhibit the share of FDI inflows and exports of the most
polluting industries in the total manufacturing sector in Bangladesh, respectively.
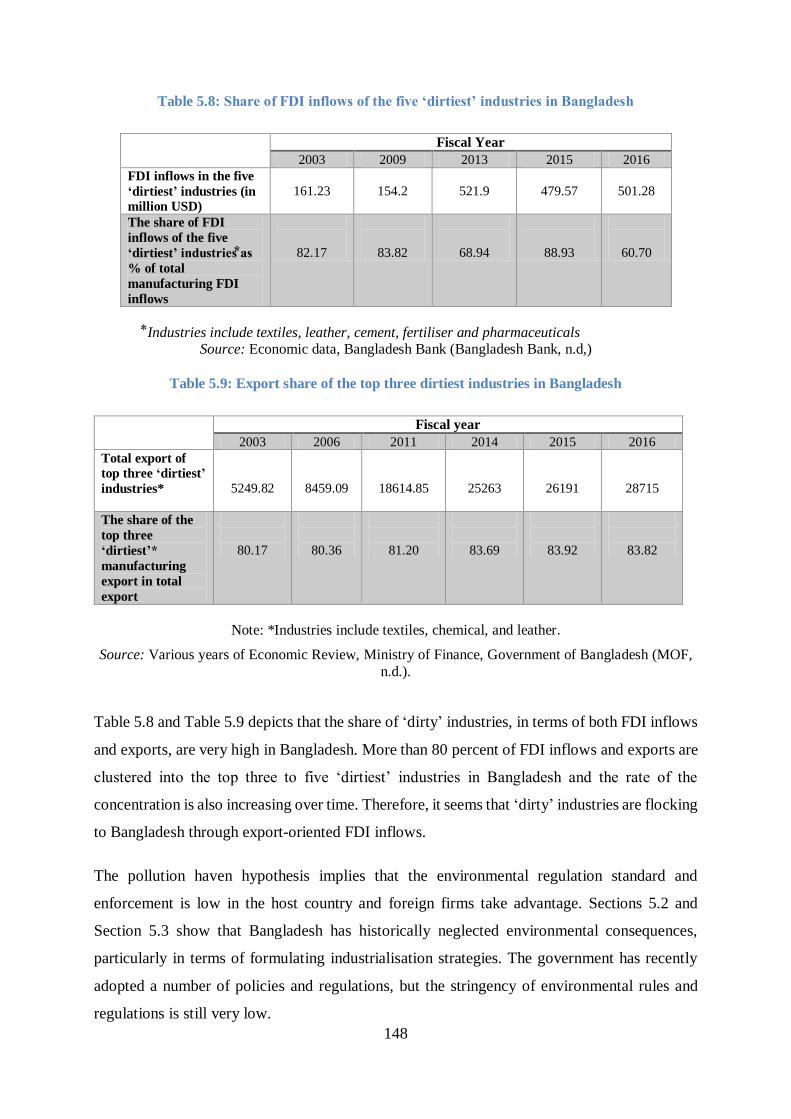
148
Table 5.8: Share of FDI inflows of the five ‘dirtiest’ industries in Bangladesh
Fiscal Year
2003 2009 2013 2015 2016
FDI inflows in the five
‘dirtiest’ industries (in
million USD)
161.23
154.2
521.9
479.57
501.28
The share of FDI
inflows of the five
‘dirtiest’ industries as
% of total
manufacturing FDI
inflows
82.17
83.82
68.94
88.93
60.70
Industries include textiles, leather, cement, fertiliser and pharmaceuticals Source: Economic data, Bangladesh Bank (Bangladesh Bank, n.d,)
Table 5.9: Export share of the top three dirtiest industries in Bangladesh
Fiscal year
2003 2006 2011 2014 2015 2016
Total export of
top three ‘dirtiest’
industries*
5249.82
8459.09
18614.85
25263
26191
28715
The share of the
top three
‘dirtiest’*
manufacturing
export in total
export
80.17
80.36
81.20
83.69
83.92
83.82
Note: *Industries include textiles, chemical, and leather.
Source: Various years of Economic Review, Ministry of Finance, Government of Bangladesh (MOF,
n.d.).
Table 5.8 and Table 5.9 depicts that the share of ‘dirty’ industries, in terms of both FDI inflows
and exports, are very high in Bangladesh. More than 80 percent of FDI inflows and exports are
clustered into the top three to five ‘dirtiest’ industries in Bangladesh and the rate of the
concentration is also increasing over time. Therefore, it seems that ‘dirty’ industries are flocking
to Bangladesh through export-oriented FDI inflows.
The pollution haven hypothesis implies that the environmental regulation standard and
enforcement is low in the host country and foreign firms take advantage. Sections 5.2 and
Section 5.3 show that Bangladesh has historically neglected environmental consequences,
particularly in terms of formulating industrialisation strategies. The government has recently
adopted a number of policies and regulations, but the stringency of environmental rules and
regulations is still very low.
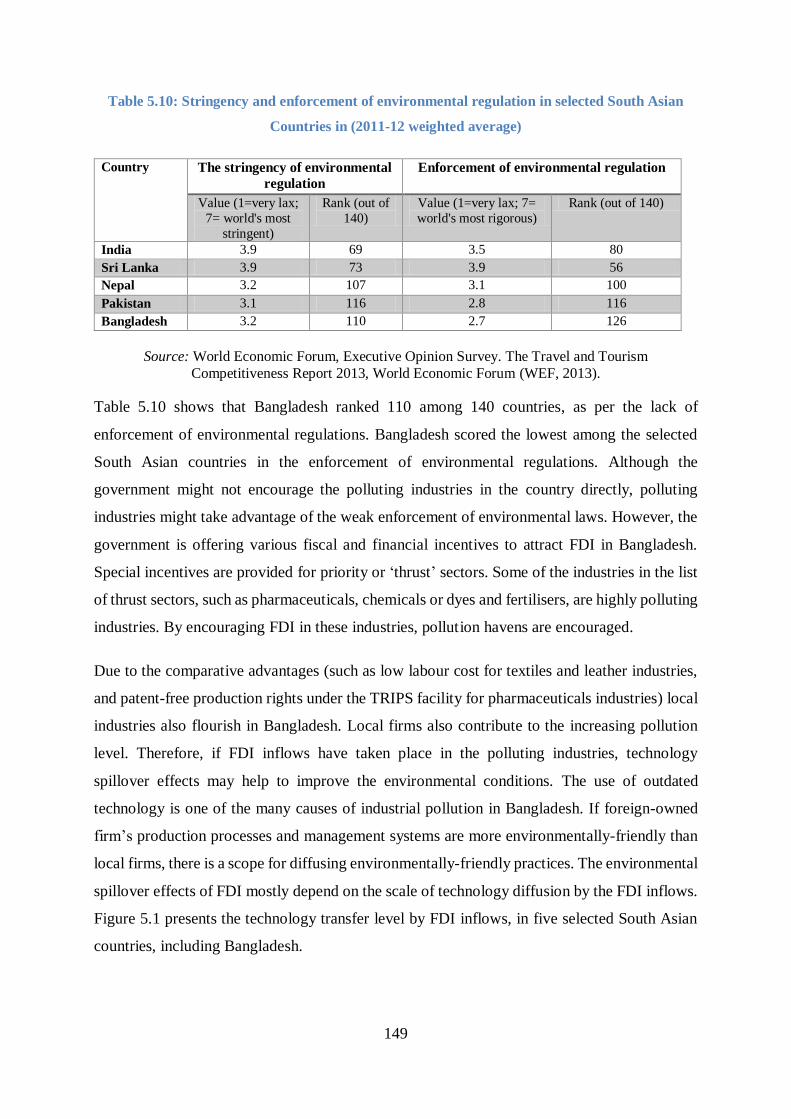
149
Table 5.10: Stringency and enforcement of environmental regulation in selected South Asian
Countries in (2011-12 weighted average)
Country The stringency of environmental
regulation
Enforcement of environmental regulation
Value (1=very lax;
7= world's most
stringent)
Rank (out of
140)
Value (1=very lax; 7=
world's most rigorous)
Rank (out of 140)
India 3.9 69 3.5 80
Sri Lanka 3.9 73 3.9 56
Nepal 3.2 107 3.1 100
Pakistan 3.1 116 2.8 116
Bangladesh 3.2 110 2.7 126
Source: World Economic Forum, Executive Opinion Survey. The Travel and Tourism
Competitiveness Report 2013, World Economic Forum (WEF, 2013).
Table 5.10 shows that Bangladesh ranked 110 among 140 countries, as per the lack of
enforcement of environmental regulations. Bangladesh scored the lowest among the selected
South Asian countries in the enforcement of environmental regulations. Although the
government might not encourage the polluting industries in the country directly, polluting
industries might take advantage of the weak enforcement of environmental laws. However, the
government is offering various fiscal and financial incentives to attract FDI in Bangladesh.
Special incentives are provided for priority or ‘thrust’ sectors. Some of the industries in the list
of thrust sectors, such as pharmaceuticals, chemicals or dyes and fertilisers, are highly polluting
industries. By encouraging FDI in these industries, pollution havens are encouraged.
Due to the comparative advantages (such as low labour cost for textiles and leather industries,
and patent-free production rights under the TRIPS facility for pharmaceuticals industries) local
industries also flourish in Bangladesh. Local firms also contribute to the increasing pollution
level. Therefore, if FDI inflows have taken place in the polluting industries, technology
spillover effects may help to improve the environmental conditions. The use of outdated
technology is one of the many causes of industrial pollution in Bangladesh. If foreign-owned
firm’s production processes and management systems are more environmentally-friendly than
local firms, there is a scope for diffusing environmentally-friendly practices. The environmental
spillover effects of FDI mostly depend on the scale of technology diffusion by the FDI inflows.
Figure 5.1 presents the technology transfer level by FDI inflows, in five selected South Asian
countries, including Bangladesh.
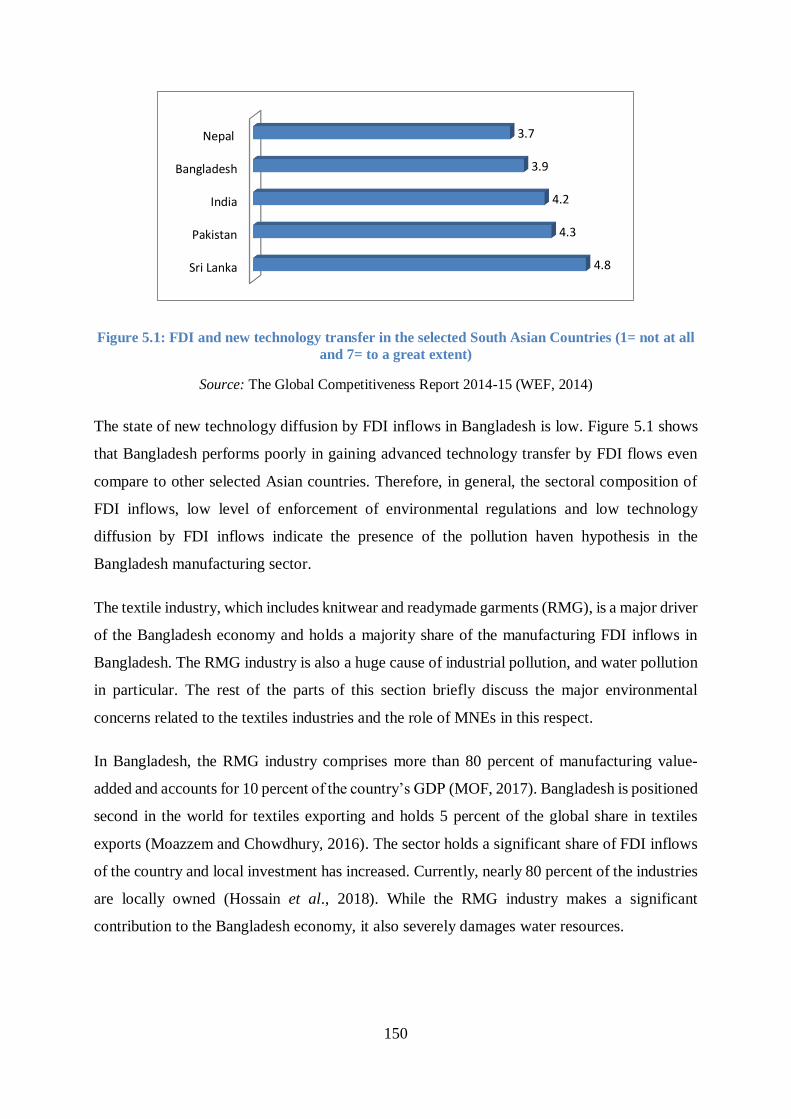
150
Figure 5.1: FDI and new technology transfer in the selected South Asian Countries (1= not at all
and 7= to a great extent)
Source: The Global Competitiveness Report 2014-15 (WEF, 2014)
The state of new technology diffusion by FDI inflows in Bangladesh is low. Figure 5.1 shows
that Bangladesh performs poorly in gaining advanced technology transfer by FDI flows even
compare to other selected Asian countries. Therefore, in general, the sectoral composition of
FDI inflows, low level of enforcement of environmental regulations and low technology
diffusion by FDI inflows indicate the presence of the pollution haven hypothesis in the
Bangladesh manufacturing sector.
The textile industry, which includes knitwear and readymade garments (RMG), is a major driver
of the Bangladesh economy and holds a majority share of the manufacturing FDI inflows in
Bangladesh. The RMG industry is also a huge cause of industrial pollution, and water pollution
in particular. The rest of the parts of this section briefly discuss the major environmental
concerns related to the textiles industries and the role of MNEs in this respect.
In Bangladesh, the RMG industry comprises more than 80 percent of manufacturing value-
added and accounts for 10 percent of the country’s GDP (MOF, 2017). Bangladesh is positioned
second in the world for textiles exporting and holds 5 percent of the global share in textiles
exports (Moazzem and Chowdhury, 2016). The sector holds a significant share of FDI inflows
of the country and local investment has increased. Currently, nearly 80 percent of the industries
are locally owned (Hossain et al., 2018). While the RMG industry makes a significant
contribution to the Bangladesh economy, it also severely damages water resources.
Sri Lanka
Pakistan
India
Bangladesh
Nepal
4.8
4.3
4.2
3.9
3.7
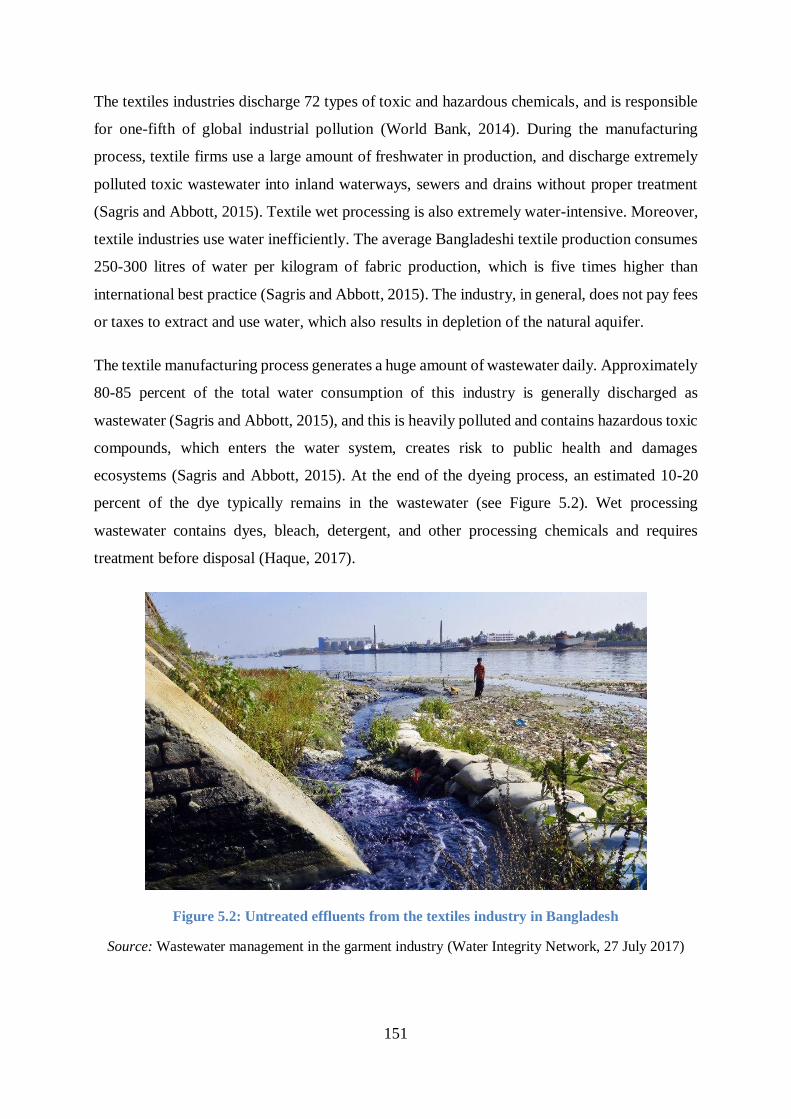
151
The textiles industries discharge 72 types of toxic and hazardous chemicals, and is responsible
for one-fifth of global industrial pollution (World Bank, 2014). During the manufacturing
process, textile firms use a large amount of freshwater in production, and discharge extremely
polluted toxic wastewater into inland waterways, sewers and drains without proper treatment
(Sagris and Abbott, 2015). Textile wet processing is also extremely water-intensive. Moreover,
textile industries use water inefficiently. The average Bangladeshi textile production consumes
250-300 litres of water per kilogram of fabric production, which is five times higher than
international best practice (Sagris and Abbott, 2015). The industry, in general, does not pay fees
or taxes to extract and use water, which also results in depletion of the natural aquifer.
The textile manufacturing process generates a huge amount of wastewater daily. Approximately
80-85 percent of the total water consumption of this industry is generally discharged as
wastewater (Sagris and Abbott, 2015), and this is heavily polluted and contains hazardous toxic
compounds, which enters the water system, creates risk to public health and damages
ecosystems (Sagris and Abbott, 2015). At the end of the dyeing process, an estimated 10-20
percent of the dye typically remains in the wastewater (see Figure 5.2). Wet processing
wastewater contains dyes, bleach, detergent, and other processing chemicals and requires
treatment before disposal (Haque, 2017).
Figure 5.2: Untreated effluents from the textiles industry in Bangladesh
Source: Wastewater management in the garment industry (Water Integrity Network, 27 July 2017)

152
According to the 1997 Environment Conservation Rules (ECR), washing, dyeing, and finishing
processing industries are categorised as ‘Red Industries’ which pose the highest environmental
threat. All dyeing, washing, and finishing related textile industries must have Effluent
Treatment Plants (ETP) to treat wastewater. However, wastewater and industrial effluents are
discharged without any or inadequate treatment. Rarely does any textile factory maintain
wastewater treatment processes at a level to meet the Government discharge standards (Haque,
2017). Nearly 50 percent of factories have Effluent Treatment Plants (ETPs), but most of these
plants are not appropriately designed and they do not operate effectively (Haque, 2017). As a
result, untreated and poorly treated effluents from the textile industry alter the physical,
chemical, and biological properties of the aquatic environment of the rivers and water bodies in
Bangladesh. High levels of PH, temperature, odour, toxicants, and turbidity are having harmful
effects on public health, as well as to livestock, wildlife, fish and biodiversity in general.
The environmental performances of MNEs in the textile industry is unsatisfactory. The foreign-
owned firms might be relatively efficient as they typically use advanced, environment-friendly
technology and management systems compared to the local firms (Wallace, 2017; Zarsky,
1999). Foreign firms also contribute to transferring environment-friendly technology and
management systems to domestic firms by establishing linkages and creating pressure on their
affiliates and subsidiaries. However, there is a lack of reliable and sufficient data and
information about the environmental performance of foreign-owned firms in Bangladesh.
Foreign and joint venture firms are mostly located in the Export Processing Zones (EPZs) in
Bangladesh where pollution levels are high. Khan et al. (2011) claim that a vast amount of
industrial waste and effluents are discharged from Dhaka EPZs, severely polluting the surface
and groundwater. The study analysed physicochemical properties and major anionic
contaminants of the wastewater from Dhaka EPZs and found that effluents from Dhaka EPZ
contain hazardous pollutants, which are destroying the geo-environment and ecosystem of the
surrounding area. The wastewater contains a higher concentrations of Cl-, SO4, SO2 and NO3
than the acceptable level set by the DOE.
Akter et al. (2014) tested the water quality in the aquatic body of Dhaka EPZ area, based on
some physicochemical parameters and heavy metal concentrations. The study also noted that
concentrations of heavy particulates, such as cadmium, lead, iron, mercury and manganese
exceeded the acceptable limits. The study notes that only a few industries installed Effluent
Treatment Plants (ETPs) to treat the wastewater they generate. Further, the firms which installed
ETPs also do not operate the ETPs regularly; they only operate the ETPS at the time of
153
inspection and at other times keep the ETPs switched off to save on operating costs. Most of
the industries discharge their effluents (containing heavy metals) without any prior treatment
into open drains; this then contaminates the water, soil, aquifers and environment of the
surrounding areas.
There is great potential to reduce the harmful environmental effects of textiles and RMG
industries. Introduction of environmentally-friendly technology and management systems in
the production process can reduce waste and use of energy, water, and harmful chemicals. For
example, if Bangladesh textiles mills could implement ten cleaner, best-practice production
techniques, as used in a few pilot Chinese textiles mills, they would save water use by 25
percent, energy use by 30 percent and chemicals by up to 10 percent (World Bank, 2014). Lack
of technical expertise, high initial investment costs and lack of initiative are the primary barriers
to introducing advanced techniques and technology such as this.
Multinational firms could make a positive role in initiating new environmentally-friendly
technology in the textiles sector. Multinational corporations have considerable influence over
the supply chain of textiles and apparel production in Bangladesh; they also control the
operational decisions of locally-owned individual firms and mills. Most textiles factories in
Bangladesh are locally owned, but local factories largely depend on subcontracting for
multinational firms. Multinational firms could preference local suppliers who adopt particular
environmental practices. MNEs can provide technical and financial support to their subsidiaries
to adopt environment-friendly technology; However, Belal et al., (2015) note that companies
are reluctant to take pro-environment action in developing countries. In contrast, multinationals
taking advantage of the lack of enforcement of environmental rules and regulations (Jamali,
2010).
Recently, in response to compliance with their home country’s regulations, country's buyer
preferences and other strategic reasons, MNEs in Bangladesh started collaborating with
government and other parties for greening the apparel and textile production process. For
example, the Zero Discharge of Hazardous Chemicals (ZDCH) program gained momentum in
Bangladesh, and Partnership for Cleaner Textiles (PaCT) has been initiated with the major
buyers, and the main local textiles and apparel industries association, BGMEA (Hasan and
Leonas, 2018; Textiles Today, 2018). However, progress has not been satisfactory due to the
lack of enforcement of environmental regulations, corruption, and high installation costs of
environmentally-friendly technology.

154
5.5 FDI and environmental sustainability in Bangladesh the empirical
analysis
The descriptive statistical analysis in Section 5.4 shows that polluting or dirty international
companies are coming to Bangladesh through export-oriented manufacturing FDI inflows. The
share of top polluting industries in the total manufacturing FDI inflows and export is high in
Bangladesh. The enforcement of environmental regulation strategy is weak, compared with
other South Asian countries. The textiles and RMG industry, which comprises a significant
share of manufacturing FDI inflows, is causing severe water pollution in Bangladesh; all these
features indicate the existence of the pollution haven hypothesis in Bangladesh.
However, the existence of the pollution haven hypothesis does not necessarily imply that
foreign direct investment inflows are negatively contributing to the environmental sustainability
of the country. If foreign-owned firms use advanced, environmentally-friendly technology and
practice better environmental management than the locally owned industries the hope is that the
advanced technology and management systems will spill over to the local industries; then FDI
inflows can make a positive contribution to the host country environment, even though FDI has
taken place in polluting industries. No substantive research so far has been done that explores
whether foreign-owned firms in Bangladesh use greener technology than locally-owned firms
or if there is any evidence that the environmental performances of locally-owned firms become
greener following exposure to foreign-owned firms and their positive practices. There is an
acute shortage of data to carry out any rigorous econometric study in this area. While water
pollution is the primary aspect of industrial pollution in Bangladesh, unfortunately, time-series
data on water pollution in the country is not available.
In addition to the pollution haven hypothesis, investigating the presence of a pollution halo is
essential to determine the impact of FDI inflows on environmental sustainability. The existence
of the pollution halo hypothesis indicates that a host country gains environmental benefits from
FDI inflows; however, no study has so far examined the pollution halo hypothesis in
Bangladesh. In the empirical analysis, I examine the validity of pollution halo hypothesis for
renewable energy use in Bangladesh. I also conduct an empirical analysis to check the validity
of pollution havens and the EKC relationships for CO2 emissions in Bangladesh.
155
5.5.1 Pollution halo hypothesis for renewable energy consumption in Bangladesh
5.5.1.1 Model specification, hypothesis and data sources
In the empirical analysis of the pollution halo hypothesis, I consider renewable energy
consumption as an indicator of environmental sustainability. There is a worldwide growing
concern about the use of finite non-renewable energy resources and the urgent need to increase
the use and production of renewable energy resources, such as solar, geothermal, energy entail
biofuel, tidal, wind power, biomass, hydropower, and wave (IEA, 2010). The targets of SD
Goal 7 of the 2030 Agenda for Sustainable Development (that is, ensure access to affordable,
reliable, sustainable, and modern energy for all) (See Table 2.1) clearly acknowledges the
importance of renewable energy resources. The targets related to SDG 7 emphasise the adoption
of renewable energy, improving energy efficiency, and extending international co-operation in
clean and renewable energy production and consumption.
Bangladesh suffers from insufficient energy security and industries mostly depend on fossil-
based energy power. Electricity is the key source of energy supply in Bangladesh; however,
nearly half of the population in Bangladesh lives in rural areas, without access to electricity.
The energy consumption of the country has increased rapidly over the past two decades, due to
industrialisation, urbanisation, modernisation of agricultural production and transformation of
the rural economy (Halder et al., 2015). The increasing trend of energy use will only intensify
in the coming years.
Power plants for electricity generation use non-renewable fossil fuels. Domestic natural gas is
the main fuel for electricity generation, accounting for 72.42 percent. Other sources of power
generation are furnace oil (15.44 percent), diesel 2.91 percent, and coal 2.54 percent. It is
estimated that energy consumption will increase threefold from 27,500-kiloton in 2015 to
71,600 kilotons in 2030 (SREDA, 2016). Due to the excessive use of natural gas, the natural
gas reserve is gradually decreasing, and the country will face a severe energy crisis. Globally,
reserves of fossil fuels are also being rapidly depleted; therefore, most countries face the same
concerns about methods of alternative renewable energy production.
In terms of the future energy security, the Bangladesh government has paid due consideration
to renewable energy. Recently, the government initiated the Renewable Energy Policy 2009,
which set a target to meet 20 percent of the power demand from renewable energy by 2020.
156
Apart from the Renewable Energy Policy, the government also passed the Sustainable and
Renewable Energy Development Authority (SREDA) Act, in December 2012. Bangladesh has
a geographical advantage and potential to utilise solar power, and also has the potential for
generating biogas and harnessing wind power.
FDI could be an important catalyst in promoting renewable energy use in developing
economies. As FDI generally flows from developed economy to developing economies;
developed economies follow the higher standards and more stringent environmental regulations
than developing countries. Therefore, MNEs are expected to practice green technology in their
production systems and contribute to reducing the level of non-renewable energy use in the host
economy (Mabey and McNally, 1999). Green production technology and management systems
can also spillover from the foreign-owned industries to local industries.
There are few empirical studies on the relationship between renewable energy consumption and
foreign direct investment inflows. Doytch and Narayan (2016) investigated the impact of
foreign direct investment in renewable energy use for 74 countries covering data from 1985 to
2012. The study employed Blundell-Bond dynamic panel estimation and found that foreign
direct investment has a positive influence on renewable energy consumption in moderately
high-income economies, but this positive effect is very low in low-income economies. The
study also found that the scale and significance of the impacts differ by the sectors where FDI
inflows are channelled. Marton and Hagert (2017) examined the effects of FDI on renewable
energy consumption for middle-income countries. Their research shows a negative relationship
between energy consumption and foreign direct investment inflows.
Based on the pollution halo hypothesis and earlier research, I specify the following model in
Equation 5.1 to examine the pollution halo hypothesis for renewable energy use in Bangladesh.
The model is influenced by the study of Doytch and Narayan (2016) which is among the few
studies to investigate a similar question. Doytch and Narayan (2016) consider renewable energy
consumption as a function of FDI inflows, per capita GDP, and an energy price index. In
Equation 5.1, I replace per capita GDP with the share of manufacturing value-added to examine
the effects of industrialisation on renewable energy consumption. I also include patent
applications as a control variable in the model to capture the effects of research and innovation
activities.

157
The model specified in Equation 5.1 also differs from Doytch and Narayan (2016) by the
estimation technique. Doytch and Narayan (2016) applied panel data estimation technique. In
my study, I examine the country specific effect; therefore, I apply time series analysis technique.
𝑙𝑛 𝑅𝐸𝐶𝑡 = 𝛽0 + 𝛽1 𝑙𝑛𝐹𝐷𝐼𝑡 + 𝛽2 𝑙𝑛𝑀𝑉𝐴𝑡+𝛽3 𝑙𝑛𝑃𝑎𝑡𝑒𝑛𝑡 + 𝜇𝑡 (5.1)
Where,
lnREC = logarithm form of renewable energy consumption as a percentage of total final energy
consumption
lnFDI = Logarithm form of FDI net inflow as a percentage of GDP
lnMVA = Logarithm form of manufacturing value-added as a percentage of GDP
lnPatent = Logarithm form of patent applications by the residents
𝜇𝑡 = Stochastic error term
In Equation 5.1, FDI inflows are included as the main independent variable to determine the
validity of the pollution halo hypothesis in Bangladesh. Manufacturing value added is included
as a control variable in order to discover the contribution of the manufacturing sector to
renewable energy consumption in Bangladesh. The research and development (R&D)
expenditure, patent applications by origin, and the number of scientific workers and projects
are considered important determinants for innovation and the technological capacity of a
country. Time series data on research and development expenditure is not available in
Bangladesh; therefore, patent applications by Bangladeshi residents are taken as a proxy
variable for the innovation and technological capacity in the model. The enforcement of
environmental regulations is critical for the pollution halo effects of FDI; however, due to the
unavailability of time-series data on enforcement of environmental regulations for Bangladesh,
the model could not incorporate this variable. The model also does not include the per capita
GDP income, to avoid the possible endogeneity problem between manufacturing value-added
and GDP.
The study assumes that FDI inflows promote environment-friendly technology in Bangladesh,
or that a pollution halo hypothesis exists in Bangladesh. Therefore, the null hypothesis for FDI
inflows is H0: FDI inflows have a positive effect on renewable energy consumption in
Bangladesh; thus, the coefficient of FDI is anticipated to be positive (H0: β1 > 0).
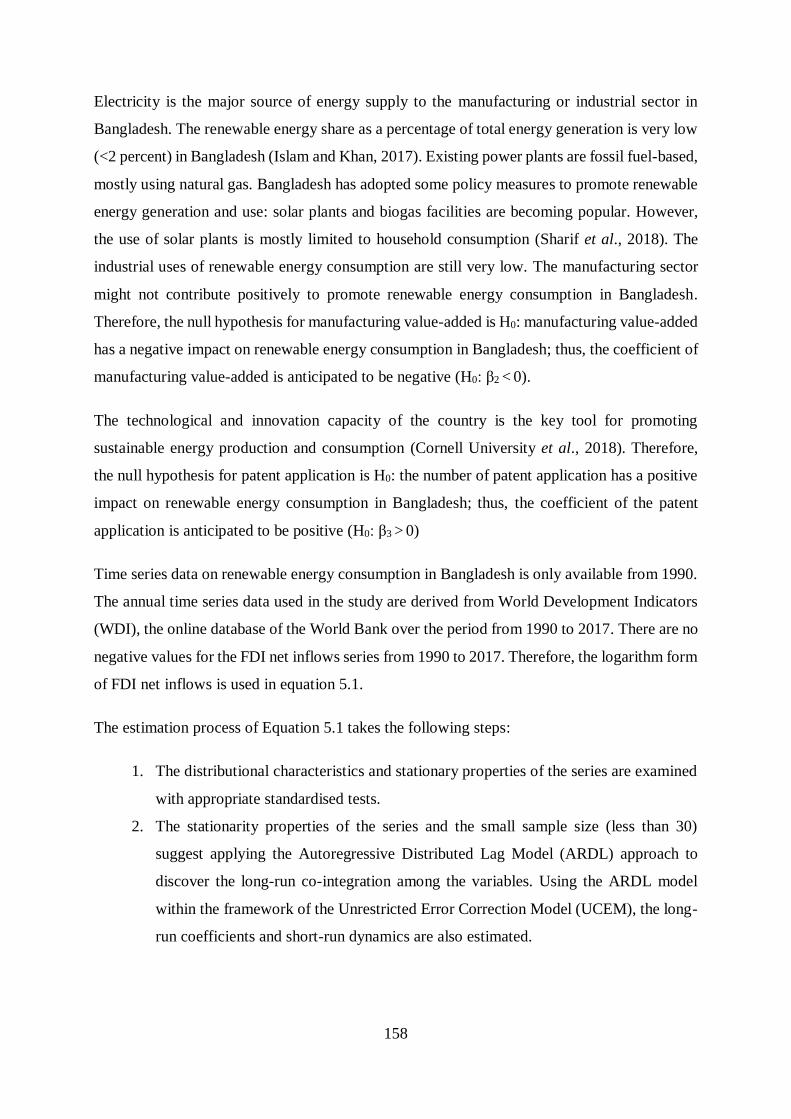
158
Electricity is the major source of energy supply to the manufacturing or industrial sector in
Bangladesh. The renewable energy share as a percentage of total energy generation is very low
(<2 percent) in Bangladesh (Islam and Khan, 2017). Existing power plants are fossil fuel-based,
mostly using natural gas. Bangladesh has adopted some policy measures to promote renewable
energy generation and use: solar plants and biogas facilities are becoming popular. However,
the use of solar plants is mostly limited to household consumption (Sharif et al., 2018). The
industrial uses of renewable energy consumption are still very low. The manufacturing sector
might not contribute positively to promote renewable energy consumption in Bangladesh.
Therefore, the null hypothesis for manufacturing value-added is H0: manufacturing value-added
has a negative impact on renewable energy consumption in Bangladesh; thus, the coefficient of
manufacturing value-added is anticipated to be negative (H0: β2 < 0).
The technological and innovation capacity of the country is the key tool for promoting
sustainable energy production and consumption (Cornell University et al., 2018). Therefore,
the null hypothesis for patent application is H0: the number of patent application has a positive
impact on renewable energy consumption in Bangladesh; thus, the coefficient of the patent
application is anticipated to be positive (H0: β3 > 0)
Time series data on renewable energy consumption in Bangladesh is only available from 1990.
The annual time series data used in the study are derived from World Development Indicators
(WDI), the online database of the World Bank over the period from 1990 to 2017. There are no
negative values for the FDI net inflows series from 1990 to 2017. Therefore, the logarithm form
of FDI net inflows is used in equation 5.1.
The estimation process of Equation 5.1 takes the following steps:
1. The distributional characteristics and stationary properties of the series are examined
with appropriate standardised tests.
2. The stationarity properties of the series and the small sample size (less than 30)
suggest applying the Autoregressive Distributed Lag Model (ARDL) approach to
discover the long-run co-integration among the variables. Using the ARDL model
within the framework of the Unrestricted Error Correction Model (UCEM), the long-
run coefficients and short-run dynamics are also estimated.
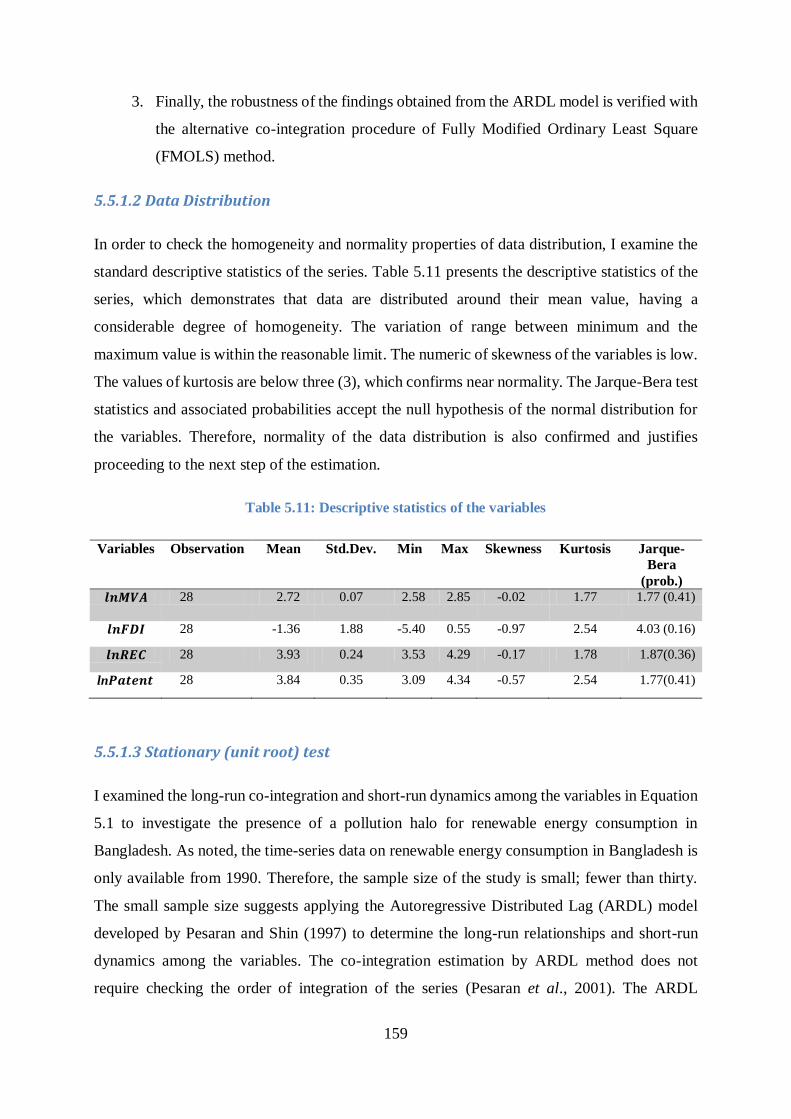
159
3. Finally, the robustness of the findings obtained from the ARDL model is verified with
the alternative co-integration procedure of Fully Modified Ordinary Least Square
(FMOLS) method.
5.5.1.2 Data Distribution
In order to check the homogeneity and normality properties of data distribution, I examine the
standard descriptive statistics of the series. Table 5.11 presents the descriptive statistics of the
series, which demonstrates that data are distributed around their mean value, having a
considerable degree of homogeneity. The variation of range between minimum and the
maximum value is within the reasonable limit. The numeric of skewness of the variables is low.
The values of kurtosis are below three (3), which confirms near normality. The Jarque-Bera test
statistics and associated probabilities accept the null hypothesis of the normal distribution for
the variables. Therefore, normality of the data distribution is also confirmed and justifies
proceeding to the next step of the estimation.
Table 5.11: Descriptive statistics of the variables
Variables Observation Mean Std.Dev. Min Max Skewness Kurtosis Jarque-
Bera
(prob.)
𝒍𝒏𝑴𝑽𝑨 28 2.72 0.07 2.58 2.85 -0.02 1.77 1.77 (0.41)
𝒍𝒏𝑭𝑫𝑰 28 -1.36 1.88 -5.40 0.55 -0.97 2.54 4.03 (0.16)
𝒍𝒏𝑹𝑬𝑪 28 3.93 0.24 3.53 4.29 -0.17 1.78 1.87(0.36)
ln𝑷𝒂𝒕𝒆𝒏𝒕 28 3.84 0.35 3.09 4.34 -0.57 2.54 1.77(0.41)
5.5.1.3 Stationary (unit root) test
I examined the long-run co-integration and short-run dynamics among the variables in Equation
5.1 to investigate the presence of a pollution halo for renewable energy consumption in
Bangladesh. As noted, the time-series data on renewable energy consumption in Bangladesh is
only available from 1990. Therefore, the sample size of the study is small; fewer than thirty.
The small sample size suggests applying the Autoregressive Distributed Lag (ARDL) model
developed by Pesaran and Shin (1997) to determine the long-run relationships and short-run
dynamics among the variables. The co-integration estimation by ARDL method does not
require checking the order of integration of the series (Pesaran et al., 2001). The ARDL

160
technique can apply in case of I (0) (integrated at level), I (1) (integrated at first difference) or
mixed order of integration. However, the ARDL model cannot apply if any of the series exceeds
the order of integration of I (1). Therefore, the study conducts stationary tests to confirm that
none of the series is stationary at I (2).
In the stationary test, I apply the conventional ADF (Augmented Dickey-Fuller) test developed
by Dickey and Fuller (1979, 1981). I also conduct PP (Phillips-Perron) test developed by
Phillips and Perron (1988) to check the stationary properties of the series. The stationary tests
are conducted with the trend and without a trend. Table 5.12 reports the results of the ADF and
PP unit root tests for the series.
Table 5.12: The results of the ADF and PP tests for the unit root of the variables
Variables ADF (SIC) PP
Level 1st Difference Level 1st Difference
intercept intercept
& trend intercept intercept
& trend intercept intercept
& trend intercept intercept
& trend
lnREC 0.52 -2.83 -4.17*** -4.04** 0.67 -3.22* -5.21*** -4.80***
lnFDI -4.65***
-3.19 -4.86*** -5.63*** -1.97 -1.98 -5.40*** -11.40***
lnMVA -1.51 -2.15 -3.59** -3.88** -1.51 -2.14 -4.41*** -4.40***
lnPatent -5.21*** -5.44*** -4.39*** -4.20** -5.22*** -5.46*** -24.83*** -24.26***
Note: *, **, *** represent 10%, 5% and 1% levels of significance respectively.
The results of the ADF and PP tests show that the series 𝑙𝑛𝑅𝐸𝐶 and 𝑙𝑛𝑀𝑉𝐴 are not stationary
at level. The results cannot reject the null hypothesis of having a unit root at a 5 percent
significance level; however, the variables become stationary after the first difference in both
ADF and PP tests. On the other hand, the series 𝑙𝑛𝐹𝐷𝐼 𝑎𝑛𝑑 𝑙𝑛𝑃𝑎𝑡𝑒𝑛𝑡 are stationary at the level
or the order of integration is I (0). Therefore, the stationary tests confirm that none of the series
exceeds the order of integration of I (1). The presence of a mixed order of integration further
justifies applying ARDL technique to check the co-integration among the variables for Equation
5.1.
Time series data might contain a structural break. I apply Bai and Perron's (1998) multiple
breakpoint test to identify the structural breaks in the model. The breakpoint test does not find
any significant break in the model; therefore, the model does not include any structural break
variable.
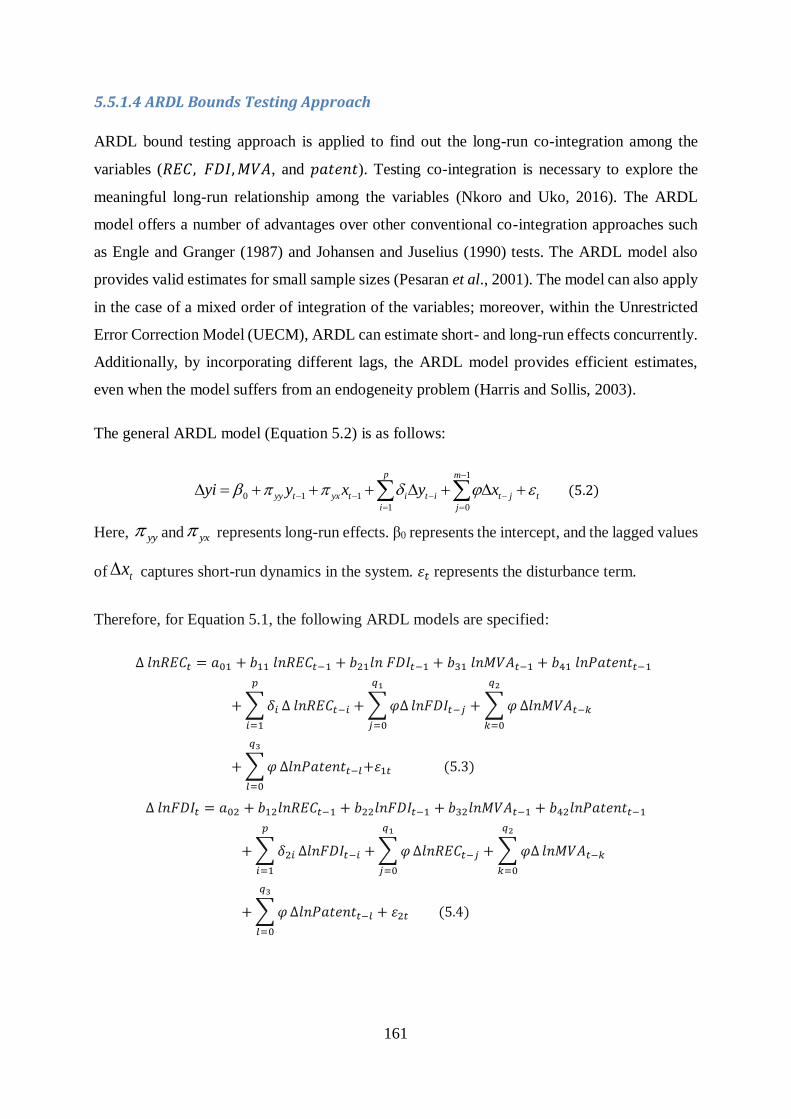
161
5.5.1.4 ARDL Bounds Testing Approach
ARDL bound testing approach is applied to find out the long-run co-integration among the
variables (𝑅𝐸𝐶, 𝐹𝐷𝐼, 𝑀𝑉𝐴, and 𝑝𝑎𝑡𝑒𝑛𝑡). Testing co-integration is necessary to explore the
meaningful long-run relationship among the variables (Nkoro and Uko, 2016). The ARDL
model offers a number of advantages over other conventional co-integration approaches such
as Engle and Granger (1987) and Johansen and Juselius (1990) tests. The ARDL model also
provides valid estimates for small sample sizes (Pesaran et al., 2001). The model can also apply
in the case of a mixed order of integration of the variables; moreover, within the Unrestricted
Error Correction Model (UECM), ARDL can estimate short- and long-run effects concurrently.
Additionally, by incorporating different lags, the ARDL model provides efficient estimates,
even when the model suffers from an endogeneity problem (Harris and Sollis, 2003).
The general ARDL model (Equation 5.2) is as follows:
1
0 1 1
1 0
p m
yy t yx t i t i t j t
i j
yi y x y x
(5.2)
Here, yy and yx represents long-run effects. β0 represents the intercept, and the lagged values
of tx captures short-run dynamics in the system. 휀𝑡 represents the disturbance term.
Therefore, for Equation 5.1, the following ARDL models are specified:
∆ 𝑙𝑛𝑅𝐸𝐶𝑡 = 𝑎01 + 𝑏11 𝑙𝑛𝑅𝐸𝐶𝑡−1 + 𝑏21𝑙𝑛 𝐹𝐷𝐼𝑡−1 + 𝑏31 𝑙𝑛𝑀𝑉𝐴𝑡−1 + 𝑏41 𝑙𝑛𝑃𝑎𝑡𝑒𝑛𝑡𝑡−1
+ ∑ 𝛿𝑖
𝑝
𝑖=1
∆ 𝑙𝑛𝑅𝐸𝐶𝑡−𝑖 + ∑ 𝜑∆
𝑞1
𝑗=0
𝑙𝑛𝐹𝐷𝐼𝑡−𝑗 + ∑ 𝜑
𝑞2
𝑘=0
∆𝑙𝑛𝑀𝑉𝐴𝑡−𝑘
+ ∑ 𝜑
𝑞3
𝑙=0
∆𝑙𝑛𝑃𝑎𝑡𝑒𝑛𝑡𝑡−𝑙+휀1𝑡 (5.3)
∆ 𝑙𝑛𝐹𝐷𝐼𝑡 = 𝑎02 + 𝑏12𝑙𝑛𝑅𝐸𝐶𝑡−1 + 𝑏22𝑙𝑛𝐹𝐷𝐼𝑡−1 + 𝑏32𝑙𝑛𝑀𝑉𝐴𝑡−1 + 𝑏42𝑙𝑛𝑃𝑎𝑡𝑒𝑛𝑡𝑡−1
+ ∑ 𝛿2𝑖
𝑝
𝑖=1
∆𝑙𝑛𝐹𝐷𝐼𝑡−𝑖 + ∑ 𝜑
𝑞1
𝑗=0
∆𝑙𝑛𝑅𝐸𝐶𝑡−𝑗 + ∑ 𝜑∆
𝑞2
𝑘=0
𝑙𝑛𝑀𝑉𝐴𝑡−𝑘
+ ∑ 𝜑
𝑞3
𝑙=0
∆𝑙𝑛𝑃𝑎𝑡𝑒𝑛𝑡𝑡−𝑙 + 휀2𝑡 (5.4)
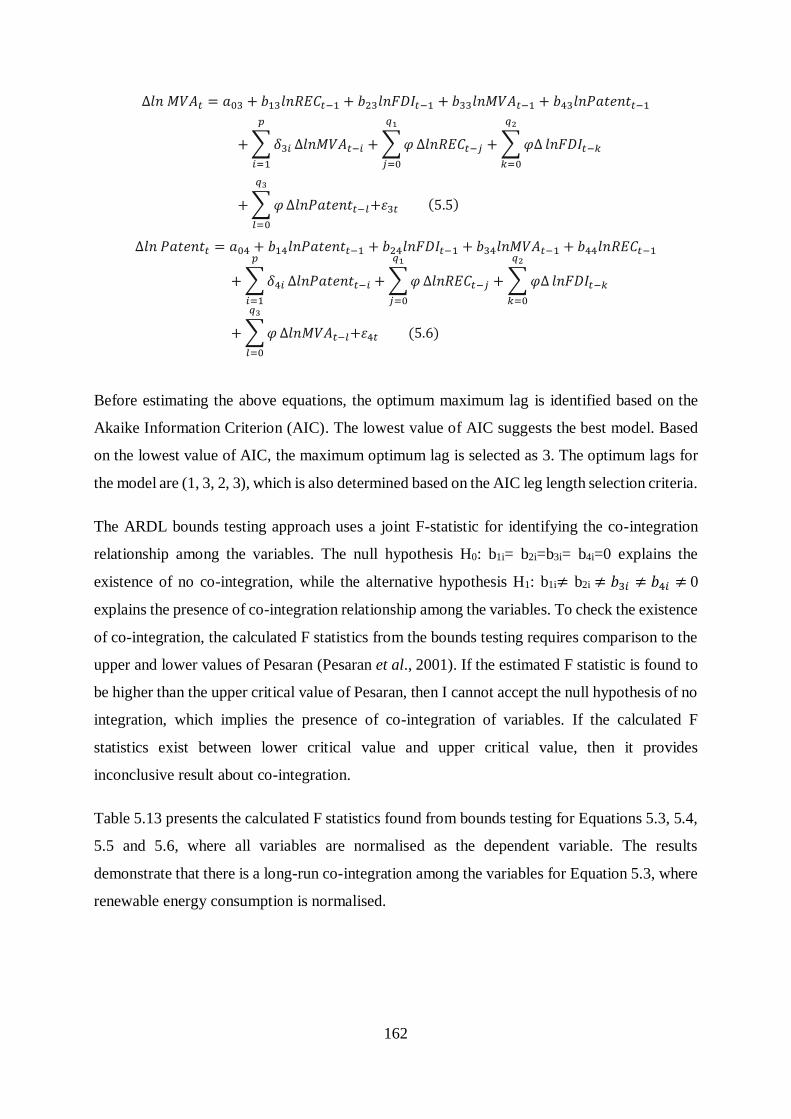
162
∆𝑙𝑛 𝑀𝑉𝐴𝑡 = 𝑎03 + 𝑏13𝑙𝑛𝑅𝐸𝐶𝑡−1 + 𝑏23𝑙𝑛𝐹𝐷𝐼𝑡−1 + 𝑏33𝑙𝑛𝑀𝑉𝐴𝑡−1 + 𝑏43𝑙𝑛𝑃𝑎𝑡𝑒𝑛𝑡𝑡−1
+ ∑ 𝛿3𝑖
𝑝
𝑖=1
∆𝑙𝑛𝑀𝑉𝐴𝑡−𝑖 + ∑ 𝜑
𝑞1
𝑗=0
∆𝑙𝑛𝑅𝐸𝐶𝑡−𝑗 + ∑ 𝜑∆
𝑞2
𝑘=0
𝑙𝑛𝐹𝐷𝐼𝑡−𝑘
+ ∑ 𝜑
𝑞3
𝑙=0
∆𝑙𝑛𝑃𝑎𝑡𝑒𝑛𝑡𝑡−𝑙+휀3𝑡 (5.5)
∆𝑙𝑛 𝑃𝑎𝑡𝑒𝑛𝑡𝑡 = 𝑎04 + 𝑏14𝑙𝑛𝑃𝑎𝑡𝑒𝑛𝑡𝑡−1 + 𝑏24𝑙𝑛𝐹𝐷𝐼𝑡−1 + 𝑏34𝑙𝑛𝑀𝑉𝐴𝑡−1 + 𝑏44𝑙𝑛𝑅𝐸𝐶𝑡−1
+ ∑ 𝛿4𝑖
𝑝
𝑖=1
∆𝑙𝑛𝑃𝑎𝑡𝑒𝑛𝑡𝑡−𝑖 + ∑ 𝜑
𝑞1
𝑗=0
∆𝑙𝑛𝑅𝐸𝐶𝑡−𝑗 + ∑ 𝜑∆
𝑞2
𝑘=0
𝑙𝑛𝐹𝐷𝐼𝑡−𝑘
+ ∑ 𝜑
𝑞3
𝑙=0
∆𝑙𝑛𝑀𝑉𝐴𝑡−𝑙+휀4𝑡 (5.6)
Before estimating the above equations, the optimum maximum lag is identified based on the
Akaike Information Criterion (AIC). The lowest value of AIC suggests the best model. Based
on the lowest value of AIC, the maximum optimum lag is selected as 3. The optimum lags for
the model are (1, 3, 2, 3), which is also determined based on the AIC leg length selection criteria.
The ARDL bounds testing approach uses a joint F-statistic for identifying the co-integration
relationship among the variables. The null hypothesis H0: b1i= b2i=b3i= b4i=0 explains the
existence of no co-integration, while the alternative hypothesis H1: b1i≠ b2i ≠ 𝑏3𝑖 ≠ 𝑏4𝑖 ≠ 0
explains the presence of co-integration relationship among the variables. To check the existence
of co-integration, the calculated F statistics from the bounds testing requires comparison to the
upper and lower values of Pesaran (Pesaran et al., 2001). If the estimated F statistic is found to
be higher than the upper critical value of Pesaran, then I cannot accept the null hypothesis of no
integration, which implies the presence of co-integration of variables. If the calculated F
statistics exist between lower critical value and upper critical value, then it provides
inconclusive result about co-integration.
Table 5.13 presents the calculated F statistics found from bounds testing for Equations 5.3, 5.4,
5.5 and 5.6, where all variables are normalised as the dependent variable. The results
demonstrate that there is a long-run co-integration among the variables for Equation 5.3, where
renewable energy consumption is normalised.
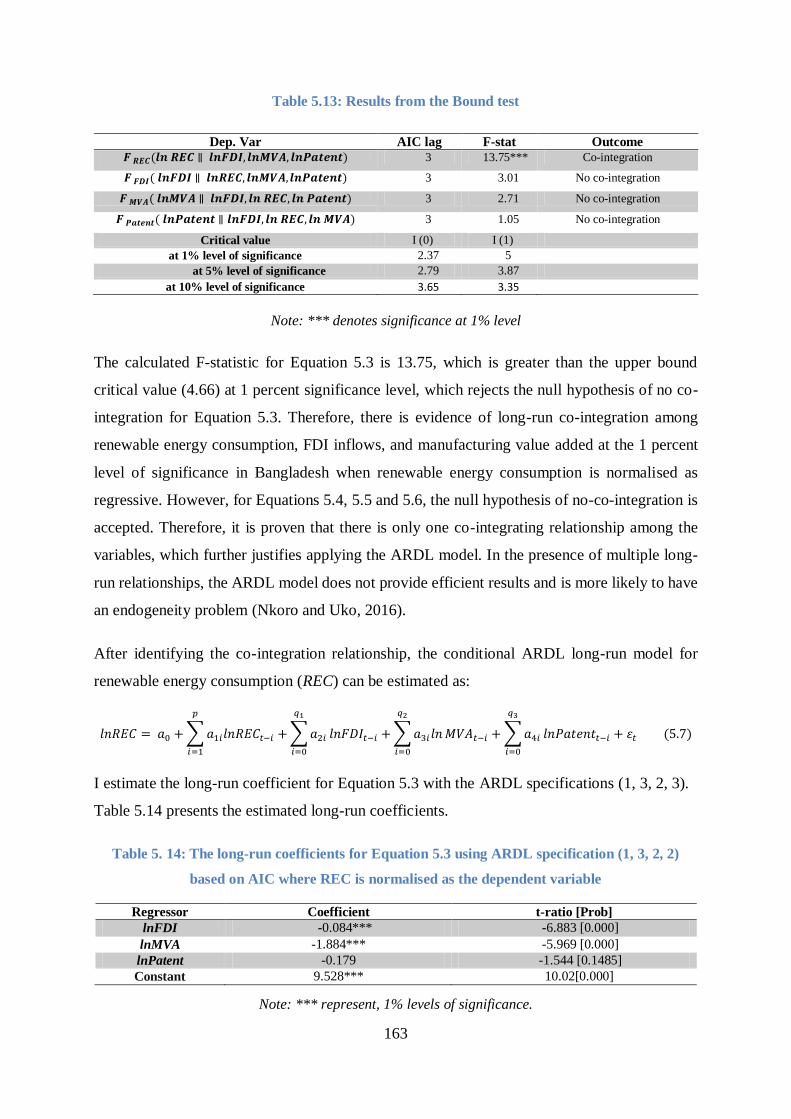
163
Table 5.13: Results from the Bound test
Dep. Var AIC lag F-stat Outcome
𝑭 𝑹𝑬𝑪(𝒍𝒏 𝑹𝑬𝑪 ∥ 𝒍𝒏𝑭𝑫𝑰, 𝒍𝒏𝑴𝑽𝑨, 𝒍𝒏𝑷𝒂𝒕𝒆𝒏𝒕) 3 13.75*** Co-integration
𝑭 𝑭𝑫𝑰( 𝒍𝒏𝑭𝑫𝑰 ∥ 𝒍𝒏𝑹𝑬𝑪, 𝒍𝒏𝑴𝑽𝑨, 𝒍𝒏𝑷𝒂𝒕𝒆𝒏𝒕) 3 3.01 No co-integration
𝑭 𝑴𝑽𝑨( 𝒍𝒏𝑴𝑽𝑨 ∥ 𝒍𝒏𝑭𝑫𝑰, 𝒍𝒏 𝑹𝑬𝑪, 𝒍𝒏 𝑷𝒂𝒕𝒆𝒏𝒕) 3 2.71 No co-integration
𝑭 𝑷𝒂𝒕𝒆𝒏𝒕( 𝒍𝒏𝑷𝒂𝒕𝒆𝒏𝒕 ∥ 𝒍𝒏𝑭𝑫𝑰, 𝒍𝒏 𝑹𝑬𝑪, 𝒍𝒏 𝑴𝑽𝑨) 3 1.05 No co-integration
Critical value I (0) I (1)
at 1% level of significance 2.37 5
at 5% level of significance 2.79 3.87
at 10% level of significance 3.65 3.35
Note: *** denotes significance at 1% level
The calculated F-statistic for Equation 5.3 is 13.75, which is greater than the upper bound
critical value (4.66) at 1 percent significance level, which rejects the null hypothesis of no co-
integration for Equation 5.3. Therefore, there is evidence of long-run co-integration among
renewable energy consumption, FDI inflows, and manufacturing value added at the 1 percent
level of significance in Bangladesh when renewable energy consumption is normalised as
regressive. However, for Equations 5.4, 5.5 and 5.6, the null hypothesis of no-co-integration is
accepted. Therefore, it is proven that there is only one co-integrating relationship among the
variables, which further justifies applying the ARDL model. In the presence of multiple long-
run relationships, the ARDL model does not provide efficient results and is more likely to have
an endogeneity problem (Nkoro and Uko, 2016).
After identifying the co-integration relationship, the conditional ARDL long-run model for
renewable energy consumption (REC) can be estimated as:
𝑙𝑛𝑅𝐸𝐶 = 𝑎0 + ∑ 𝑎1𝑖𝑙𝑛𝑅𝐸𝐶𝑡−𝑖
𝑝
𝑖=1
+ ∑ 𝑎2𝑖
𝑞1
𝑖=0
𝑙𝑛𝐹𝐷𝐼𝑡−𝑖 + ∑ 𝑎3𝑖𝑙𝑛
𝑞2
𝑖=0
𝑀𝑉𝐴𝑡−𝑖 + ∑ 𝑎4𝑖
𝑞3
𝑖=0
𝑙𝑛𝑃𝑎𝑡𝑒𝑛𝑡𝑡−𝑖 + 휀𝑡 (5.7)
I estimate the long-run coefficient for Equation 5.3 with the ARDL specifications (1, 3, 2, 3).
Table 5.14 presents the estimated long-run coefficients.
Table 5. 14: The long-run coefficients for Equation 5.3 using ARDL specification (1, 3, 2, 2)
based on AIC where REC is normalised as the dependent variable
Regressor Coefficient t-ratio [Prob]
lnFDI -0.084*** -6.883 [0.000]
lnMVA -1.884*** -5.969 [0.000]
lnPatent -0.179 -1.544 [0.1485]
Constant 9.528*** 10.02[0.000]
Note: *** represent, 1% levels of significance.
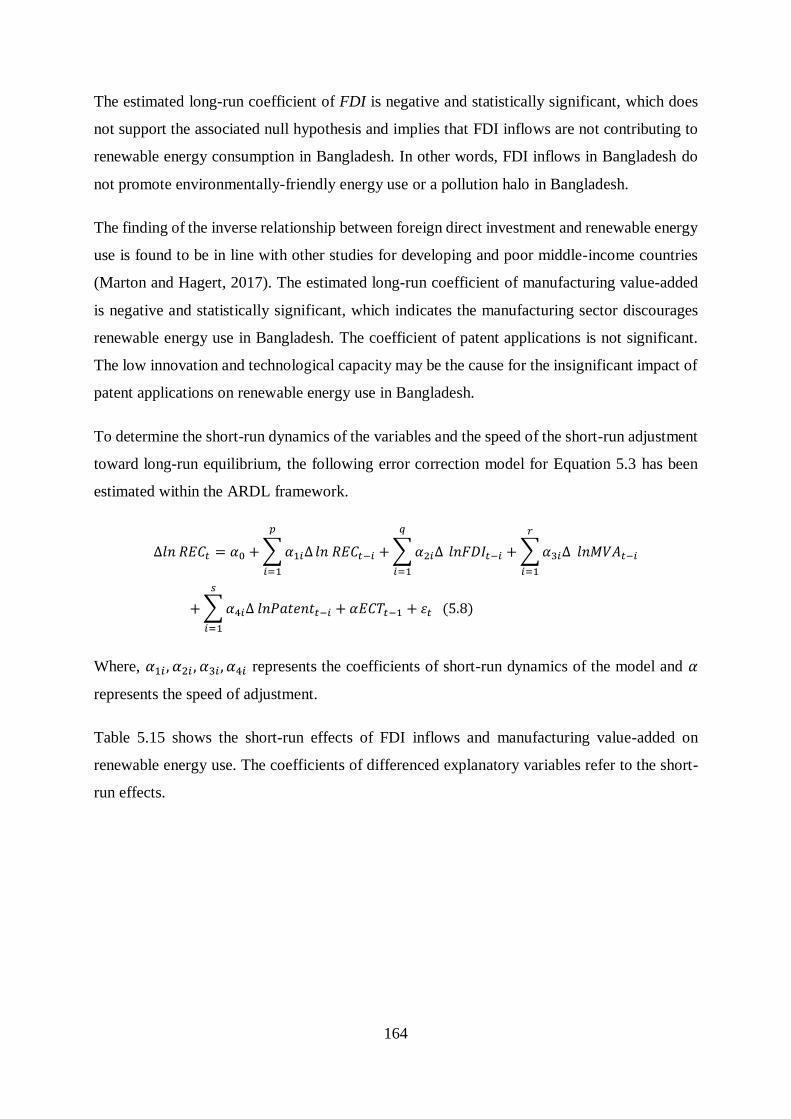
164
The estimated long-run coefficient of FDI is negative and statistically significant, which does
not support the associated null hypothesis and implies that FDI inflows are not contributing to
renewable energy consumption in Bangladesh. In other words, FDI inflows in Bangladesh do
not promote environmentally-friendly energy use or a pollution halo in Bangladesh.
The finding of the inverse relationship between foreign direct investment and renewable energy
use is found to be in line with other studies for developing and poor middle-income countries
(Marton and Hagert, 2017). The estimated long-run coefficient of manufacturing value-added
is negative and statistically significant, which indicates the manufacturing sector discourages
renewable energy use in Bangladesh. The coefficient of patent applications is not significant.
The low innovation and technological capacity may be the cause for the insignificant impact of
patent applications on renewable energy use in Bangladesh.
To determine the short-run dynamics of the variables and the speed of the short-run adjustment
toward long-run equilibrium, the following error correction model for Equation 5.3 has been
estimated within the ARDL framework.
∆𝑙𝑛 𝑅𝐸𝐶𝑡 = 𝛼0 + ∑ 𝛼1𝑖∆
𝑝
𝑖=1
𝑙𝑛 𝑅𝐸𝐶𝑡−𝑖 + ∑ 𝛼2𝑖∆
𝑞
𝑖=1
𝑙𝑛𝐹𝐷𝐼𝑡−𝑖 + ∑ 𝛼3𝑖∆ 𝑙𝑛𝑀𝑉𝐴𝑡−𝑖
𝑟
𝑖=1
+ ∑ 𝛼4𝑖∆ 𝑙𝑛𝑃𝑎𝑡𝑒𝑛𝑡𝑡−𝑖
𝑠
𝑖=1
+ 𝛼𝐸𝐶𝑇𝑡−1 + 휀𝑡 (5.8)
Where, 𝛼1𝑖 , 𝛼2𝑖 , 𝛼3𝑖 , 𝛼4𝑖 represents the coefficients of short-run dynamics of the model and 𝛼
represents the speed of adjustment.
Table 5.15 shows the short-run effects of FDI inflows and manufacturing value-added on
renewable energy use. The coefficients of differenced explanatory variables refer to the short-
run effects.
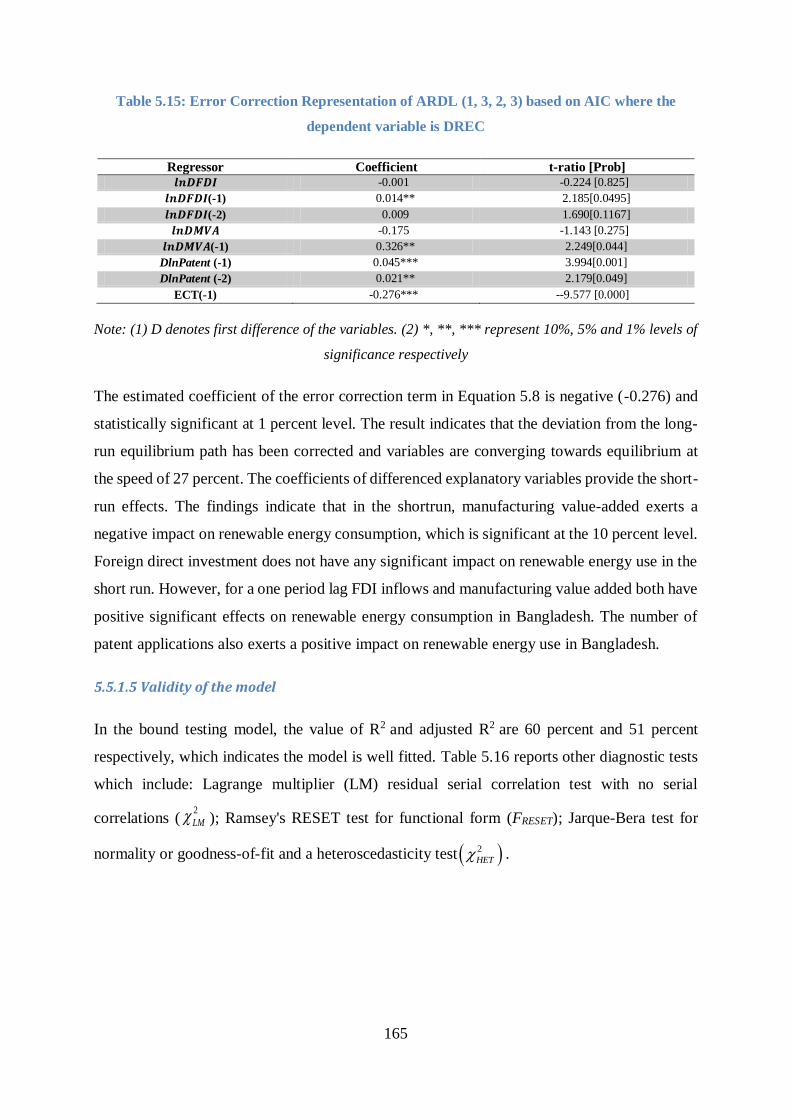
165
Table 5.15: Error Correction Representation of ARDL (1, 3, 2, 3) based on AIC where the
dependent variable is DREC
Regressor Coefficient t-ratio [Prob]
𝒍𝒏𝑫𝑭𝑫𝑰 -0.001 -0.224 [0.825]
𝒍𝒏𝑫𝑭𝑫𝑰(-1) 0.014** 2.185[0.0495]
𝒍𝒏𝑫𝑭𝑫𝑰(-2) 0.009 1.690[0.1167]
𝒍𝒏𝑫𝑴𝑽𝑨 -0.175 -1.143 [0.275]
𝒍𝒏𝑫𝑴𝑽𝑨(-1) 0.326** 2.249[0.044]
DlnPatent (-1) 0.045*** 3.994[0.001]
DlnPatent (-2) 0.021** 2.179[0.049]
ECT(-1) -0.276*** --9.577 [0.000]
Note: (1) D denotes first difference of the variables. (2) *, **, *** represent 10%, 5% and 1% levels of
significance respectively
The estimated coefficient of the error correction term in Equation 5.8 is negative (-0.276) and
statistically significant at 1 percent level. The result indicates that the deviation from the long-
run equilibrium path has been corrected and variables are converging towards equilibrium at
the speed of 27 percent. The coefficients of differenced explanatory variables provide the short-
run effects. The findings indicate that in the shortrun, manufacturing value-added exerts a
negative impact on renewable energy consumption, which is significant at the 10 percent level.
Foreign direct investment does not have any significant impact on renewable energy use in the
short run. However, for a one period lag FDI inflows and manufacturing value added both have
positive significant effects on renewable energy consumption in Bangladesh. The number of
patent applications also exerts a positive impact on renewable energy use in Bangladesh.
5.5.1.5 Validity of the model
In the bound testing model, the value of R2 and adjusted R2 are 60 percent and 51 percent
respectively, which indicates the model is well fitted. Table 5.16 reports other diagnostic tests
which include: Lagrange multiplier (LM) residual serial correlation test with no serial
correlations (2
LM ); Ramsey's RESET test for functional form (FRESET); Jarque-Bera test for
normality or goodness-of-fit and a heteroscedasticity test 2
HET .
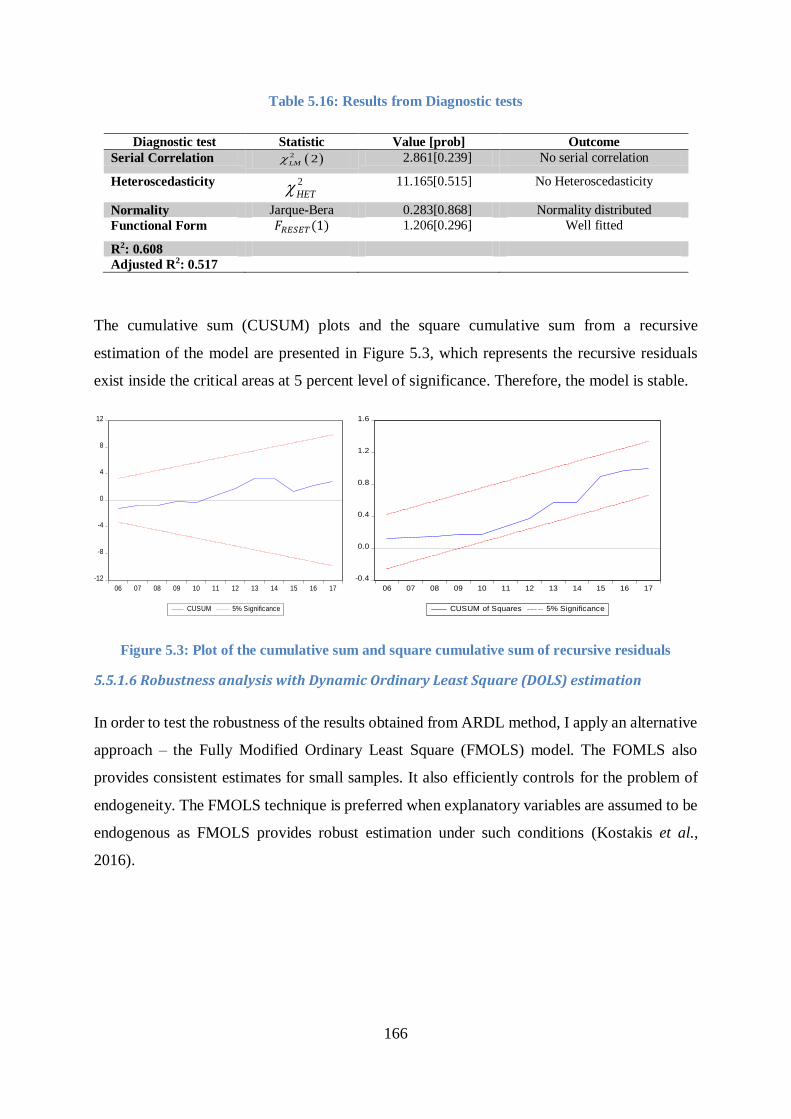
166
Table 5.16: Results from Diagnostic tests
Diagnostic test Statistic Value [prob] Outcome
Serial Correlation 2 2LM 2.861[0.239] No serial correlation
Heteroscedasticity 2
HET 11.165[0.515] No Heteroscedasticity
Normality Jarque-Bera 0.283[0.868] Normality distributed
Functional Form 𝐹𝑅𝐸𝑆𝐸𝑇(1) 1.206[0.296] Well fitted
R2: 0.608
Adjusted R2: 0.517
The cumulative sum (CUSUM) plots and the square cumulative sum from a recursive
estimation of the model are presented in Figure 5.3, which represents the recursive residuals
exist inside the critical areas at 5 percent level of significance. Therefore, the model is stable.
-12
-8
-4
0
4
8
12
06 07 08 09 10 11 12 13 14 15 16 17
CUSUM 5% Significance
-0.4
0.0
0.4
0.8
1.2
1.6
06 07 08 09 10 11 12 13 14 15 16 17
CUSUM of Squares 5% Significance
Figure 5.3: Plot of the cumulative sum and square cumulative sum of recursive residuals
5.5.1.6 Robustness analysis with Dynamic Ordinary Least Square (DOLS) estimation
In order to test the robustness of the results obtained from ARDL method, I apply an alternative
approach – the Fully Modified Ordinary Least Square (FMOLS) model. The FOMLS also
provides consistent estimates for small samples. It also efficiently controls for the problem of
endogeneity. The FMOLS technique is preferred when explanatory variables are assumed to be
endogenous as FMOLS provides robust estimation under such conditions (Kostakis et al.,
2016).
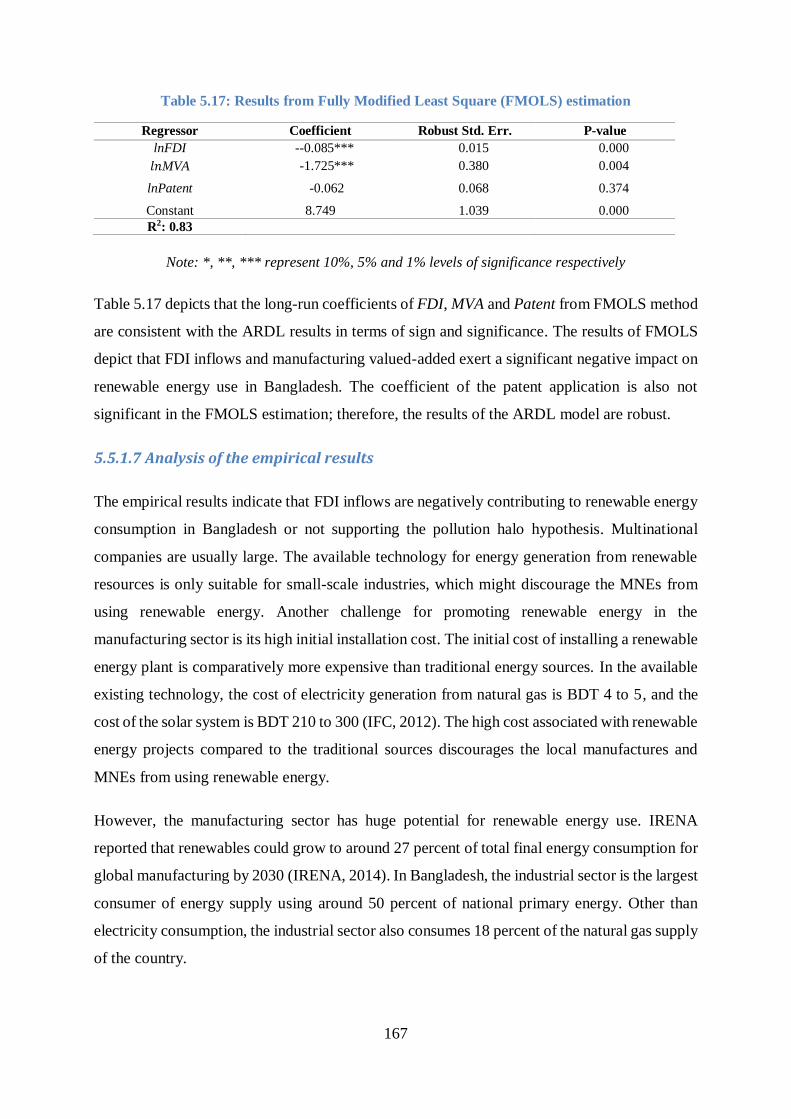
167
Table 5.17: Results from Fully Modified Least Square (FMOLS) estimation
Regressor Coefficient Robust Std. Err. P-value
lnFDI --0.085*** 0.015 0.000
𝑙𝑛MVA -1.725*** 0.380 0.004
lnPatent -0.062 0.068 0.374
Constant 8.749 1.039 0.000
R2: 0.83
Note: *, **, *** represent 10%, 5% and 1% levels of significance respectively
Table 5.17 depicts that the long-run coefficients of FDI, MVA and Patent from FMOLS method
are consistent with the ARDL results in terms of sign and significance. The results of FMOLS
depict that FDI inflows and manufacturing valued-added exert a significant negative impact on
renewable energy use in Bangladesh. The coefficient of the patent application is also not
significant in the FMOLS estimation; therefore, the results of the ARDL model are robust.
5.5.1.7 Analysis of the empirical results
The empirical results indicate that FDI inflows are negatively contributing to renewable energy
consumption in Bangladesh or not supporting the pollution halo hypothesis. Multinational
companies are usually large. The available technology for energy generation from renewable
resources is only suitable for small-scale industries, which might discourage the MNEs from
using renewable energy. Another challenge for promoting renewable energy in the
manufacturing sector is its high initial installation cost. The initial cost of installing a renewable
energy plant is comparatively more expensive than traditional energy sources. In the available
existing technology, the cost of electricity generation from natural gas is BDT 4 to 5, and the
cost of the solar system is BDT 210 to 300 (IFC, 2012). The high cost associated with renewable
energy projects compared to the traditional sources discourages the local manufactures and
MNEs from using renewable energy.
However, the manufacturing sector has huge potential for renewable energy use. IRENA
reported that renewables could grow to around 27 percent of total final energy consumption for
global manufacturing by 2030 (IRENA, 2014). In Bangladesh, the industrial sector is the largest
consumer of energy supply using around 50 percent of national primary energy. Other than
electricity consumption, the industrial sector also consumes 18 percent of the natural gas supply
of the country.
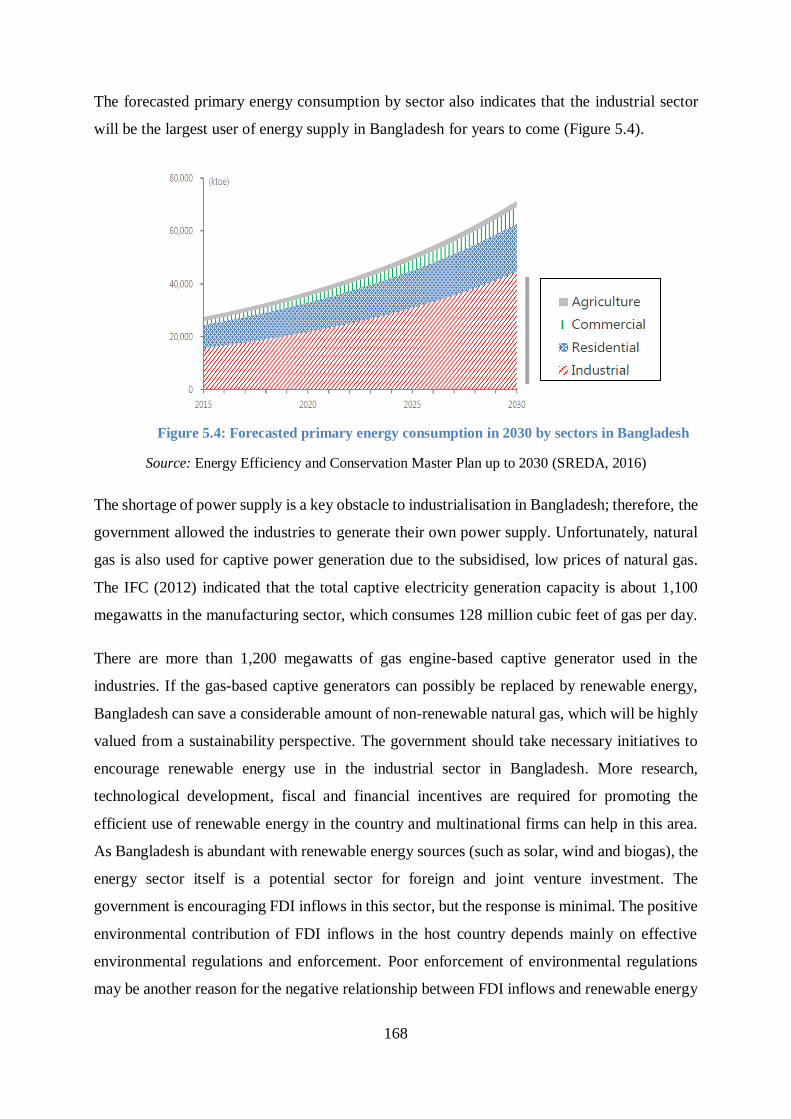
168
The forecasted primary energy consumption by sector also indicates that the industrial sector
will be the largest user of energy supply in Bangladesh for years to come (Figure 5.4).
Source: Energy Efficiency and Conservation Master Plan up to 2030 (SREDA, 2016)
The shortage of power supply is a key obstacle to industrialisation in Bangladesh; therefore, the
government allowed the industries to generate their own power supply. Unfortunately, natural
gas is also used for captive power generation due to the subsidised, low prices of natural gas.
The IFC (2012) indicated that the total captive electricity generation capacity is about 1,100
megawatts in the manufacturing sector, which consumes 128 million cubic feet of gas per day.
There are more than 1,200 megawatts of gas engine-based captive generator used in the
industries. If the gas-based captive generators can possibly be replaced by renewable energy,
Bangladesh can save a considerable amount of non-renewable natural gas, which will be highly
valued from a sustainability perspective. The government should take necessary initiatives to
encourage renewable energy use in the industrial sector in Bangladesh. More research,
technological development, fiscal and financial incentives are required for promoting the
efficient use of renewable energy in the country and multinational firms can help in this area.
As Bangladesh is abundant with renewable energy sources (such as solar, wind and biogas), the
energy sector itself is a potential sector for foreign and joint venture investment. The
government is encouraging FDI inflows in this sector, but the response is minimal. The positive
environmental contribution of FDI inflows in the host country depends mainly on effective
environmental regulations and enforcement. Poor enforcement of environmental regulations
may be another reason for the negative relationship between FDI inflows and renewable energy
Figure 5.4: Forecasted primary energy consumption in 2030 by sectors in Bangladesh
169
use in Bangladesh. FDI can also help in gaining energy efficiency in the manufacturing sector.
Better energy efficiency measures can save up to 25 percent to 30 percent energy, as compared
with the present consumption (SREDA, 2016).
5.5.2 FDI, pollution haven and Environmental Kuznets Curve (EKC) hypothesis for
CO2 emissions in Bangladesh
5.5.2.1 Model specification, hypothesis and data sources
Several studies empirically investigated the existence of the pollution haven hypothesis and
Environmental Kuznets Curve (EKC) in the presence of foreign direct investment flows for
CO2 emissions for different countries. The inverted U-patterned EKC argues that as FDI inflows
induce economic growth, the intensification of economic activities leads to an increase of
environmental pollution in the short-run due to its scale effect. When the economy reaches a
certain level of per capita income, it creates demand for an environment-friendly economy,
stringent regulations, efficient use of resources and technology, and changes in the structure of
the industry, which leads to an improvement in the environmental outcomes, due to composition
effects. However, the results of the empirical studies are mixed and inconclusive (see Section
3.3.2).
Few studies investigate the existence of the EKC relationship in Bangladesh for CO2 emissions,
and when they do they provide inconclusive results. For example, Rayhan et al. (2018)
investigated the impact of urbanisation and energy consumption on CO2 emissions in
Bangladesh. They also examined the EKC relationship, including FDI inflows as a controlled
variable, and employed the Autoregressive Distributed Lag (ARDL) model. They found the
existence of the EKC relationship in Bangladesh in the long-run. However, the impact of FDI
on CO2 emissions were found to be statistically insignificant in both the short- and long-run.
Husain (2016) empirically investigated the EKC for India and Bangladesh by applying the
Instrumental Variable method. The results of the study did not support any robust EKC
relationship for CO2 in Bangladesh; however, the study supported the EKC hypothesis in India.
Islam et al. (2013) examined the EKC hypothesis in Bangladesh for CO2 emissions applying
ARDL model. The result confirmed the presence of inverted U-patterned EKC in Bangladesh
in the long-run. Doytch and Uctum (2016) tested the pollution haven or halo hypothesis for
different income-group countries, and found evidence of the pollution haven hypothesis and
EKC relationship for poor and middle-income countries.
170
The descriptive analysis in Section 5.4 describes water pollution as the major concern for
industrialisation and FDI inflows in Bangladesh. However, due to the lack of data in water
pollution, I am unable to test the EKC relationship for water pollution in Bangladesh.
Considering the importance of the pollution haven hypothesis and EKC relationship for
adopting and promoting FDI and growth policies (and the inconclusive results of the earlier
studies) this study also revisits the EKC relationship for CO2 emission in Bangladesh.
Based on the Environmental Kuznets Curve (EKC) literature and pollution haven hypothesis,
and earlier research, Equation 5.9 is identified to examine the pollution haven hypothesis and
the existence of Environmental Kuznets Curve (EKC) relationship for CO2 emissions in
Bangladesh. Equation 5.9 closely follows Ang (2007), Ang (2008), Islam et al., (2013), Jalil
and Mahmud (2009), Rayhan et al., (2018) and Shahbaz et al., (2015). However, I apply the
most recent co-integration techniques in the form of the Nonlinear Auto-Regressive Distributed
Lag (NARDL) model developed by (Shin et al., 2014) to estimate Equation 5.9.
ln𝐶𝑂2𝑡 = 𝛽0 + 𝛽1𝐹𝐷𝐼𝑡 + 𝛽2ln𝐺𝐷𝑃𝑡 + 𝛽3(𝑙𝑛𝐺𝐷𝑃𝑡)2 + 𝛽4ln𝐸𝐶𝑡 + 𝛽 ∑ 𝐵𝑟𝑒𝑎𝑘 + 𝜇𝑡 (5.9)
Where,
ln𝐶𝑂2 = Logarithm form of per capita 𝐶𝑂2 emissions (metric tons per capita)
𝐹𝐷𝐼 = FDI net inflow as a percentage of GDP
ln GDPt = Logarithm form of per capita GDP (constant in US$)
(ln GDPt)2 = Squared per capita GDP in logarithm form
ln𝐸𝐶𝑡= Logarithm form of per capita energy consumption (kg of oil equivalent)
Break = Dummy variables for the structural break
µt = Stochastic error term
The FDI-pollution theory postulates that the scale effect of foreign direct investment on
environmental pollutions is to be positive as it intensifies economic activities. On the other
hand, the composition effects of FDI on environmental pollution are supposed to be negative
due to the introduction of advanced technology. Therefore, the impact of FDI inflows on CO2
emissions could be both positive and negative, which depends on the net effects of scale and
composition effects. However, in the case of developing countries, FDI tends to shift ‘dirty’
industries (Grossman and Krueger, 1995; Zarsky, 2005). Therefore, the null hypothesis for FDI
inflows is H0: FDI inflows have a positive effect on CO2 emissions in Bangladesh; thus the
coefficient of FDI is expected to be positive (H0: β1 > 0) in Equation 5.9.
171
Under the EKC hypothesis, the impact of per capita GDP and squared form of per capita GDP
are expected to be positive and negative respectively. Therefore, null hypothesis for per capita
GDP is H0: per capita GDP has a positive impact on CO2 emissions in Bangladesh. The null
hypothesis for the squared form of per capita GDP is H0: the squared form of per capita GDP
has a negative effect on CO2 emissions in Bangladesh. Thus, the coefficient of per capita GDP
and the squared form of per capita GDP are expected to be positive and negative respectively
(H0: β2 > 0 and β3 < 0).
In general, a high level of energy consumption represents a high level of economic activities,
which can intensify CO2 emissions. Therefore, the null hypothesis for energy consumption is
H0: energy consumption has a positive impact on CO2 emissions in Bangladesh; thus, the
coefficient of energy consumption is expected to be positive (H0: 𝛽4 > 0).
In this study, I use annual time series data from 1972 to 2014 for Bangladesh, which is derived
from the online World Development Indicators (WDI) dataset.
The estimation of the model takes the following steps:
1. The distributional characteristics and stationary properties of the time series data are
examined with appropriate standardised tests.
2. The study applies the Nonlinear Auto-Regressive Distributed Lag (NARDL) model
developed by (Shin et al., 2014) to detect the long-run co-integration among the
variables specified in Equation 5.9. The NARDL model works within the framework
of the linear ARDL model but captures long- and short-run asymmetric effects of
the independent variables on the dependent variable in a coherent way (Ucal et al.,
2016).
3. Finally, the robustness of the results obtained from the NARDL technique is
verified with the Fully Modified Ordinary Least Square (FMOLS) procedure.
5.5.2.2 Data Distribution
The descriptive statistics reported in Table 5.18 demonstrates the presence of considerable
homogeneity and normality in the data distribution.
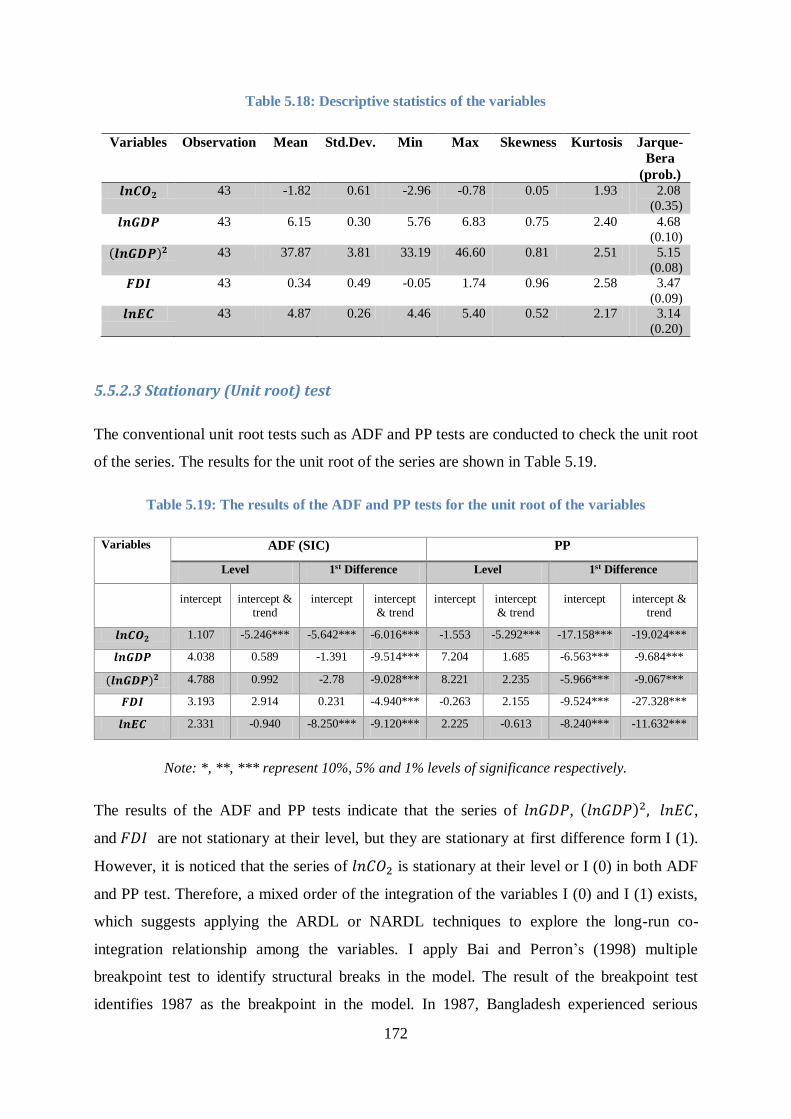
172
Table 5.18: Descriptive statistics of the variables
Variables Observation Mean Std.Dev. Min Max Skewness Kurtosis Jarque-
Bera
(prob.)
𝒍𝒏𝑪𝑶𝟐 43 -1.82 0.61 -2.96 -0.78 0.05 1.93 2.08
(0.35)
𝒍𝒏𝑮𝑫𝑷 43 6.15 0.30 5.76 6.83 0.75 2.40 4.68
(0.10)
(𝒍𝒏𝑮𝑫𝑷)𝟐 43 37.87 3.81 33.19 46.60 0.81 2.51 5.15
(0.08)
𝑭𝑫𝑰 43 0.34 0.49 -0.05 1.74 0.96 2.58 3.47
(0.09)
𝒍𝒏𝑬𝑪 43 4.87 0.26 4.46 5.40 0.52 2.17 3.14
(0.20)
5.5.2.3 Stationary (Unit root) test
The conventional unit root tests such as ADF and PP tests are conducted to check the unit root
of the series. The results for the unit root of the series are shown in Table 5.19.
Table 5.19: The results of the ADF and PP tests for the unit root of the variables
Variables ADF (SIC) PP
Level 1st Difference Level 1st Difference
intercept intercept &
trend intercept intercept
& trend intercept intercept
& trend intercept intercept &
trend
𝒍𝒏𝑪𝑶𝟐 1.107 -5.246*** -5.642*** -6.016*** -1.553 -5.292*** -17.158*** -19.024***
𝒍𝒏𝑮𝑫𝑷 4.038 0.589 -1.391 -9.514*** 7.204 1.685 -6.563*** -9.684***
(𝒍𝒏𝑮𝑫𝑷)𝟐 4.788 0.992 -2.78 -9.028*** 8.221 2.235 -5.966*** -9.067***
𝑭𝑫𝑰 3.193 2.914 0.231 -4.940*** -0.263 2.155 -9.524*** -27.328***
𝒍𝒏𝑬𝑪 2.331 -0.940 -8.250*** -9.120*** 2.225 -0.613 -8.240*** -11.632***
Note: *, **, *** represent 10%, 5% and 1% levels of significance respectively.
The results of the ADF and PP tests indicate that the series of 𝑙𝑛𝐺𝐷𝑃, (𝑙𝑛𝐺𝐷𝑃)2, 𝑙𝑛𝐸𝐶,
and 𝐹𝐷𝐼 are not stationary at their level, but they are stationary at first difference form I (1).
However, it is noticed that the series of 𝑙𝑛𝐶𝑂2 is stationary at their level or I (0) in both ADF
and PP test. Therefore, a mixed order of the integration of the variables I (0) and I (1) exists,
which suggests applying the ARDL or NARDL techniques to explore the long-run co-
integration relationship among the variables. I apply Bai and Perron’s (1998) multiple
breakpoint test to identify structural breaks in the model. The result of the breakpoint test
identifies 1987 as the breakpoint in the model. In 1987, Bangladesh experienced serious
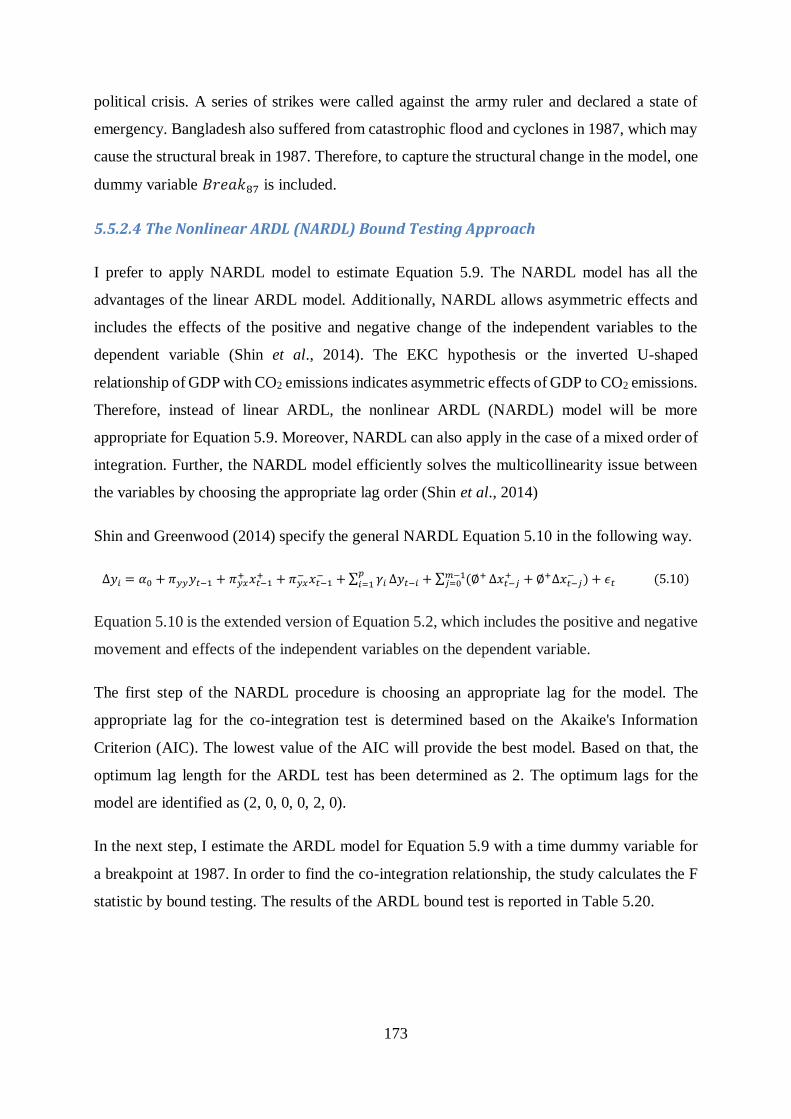
173
political crisis. A series of strikes were called against the army ruler and declared a state of
emergency. Bangladesh also suffered from catastrophic flood and cyclones in 1987, which may
cause the structural break in 1987. Therefore, to capture the structural change in the model, one
dummy variable 𝐵𝑟𝑒𝑎𝑘87 is included.
5.5.2.4 The Nonlinear ARDL (NARDL) Bound Testing Approach
I prefer to apply NARDL model to estimate Equation 5.9. The NARDL model has all the
advantages of the linear ARDL model. Additionally, NARDL allows asymmetric effects and
includes the effects of the positive and negative change of the independent variables to the
dependent variable (Shin et al., 2014). The EKC hypothesis or the inverted U-shaped
relationship of GDP with CO2 emissions indicates asymmetric effects of GDP to CO2 emissions.
Therefore, instead of linear ARDL, the nonlinear ARDL (NARDL) model will be more
appropriate for Equation 5.9. Moreover, NARDL can also apply in the case of a mixed order of
integration. Further, the NARDL model efficiently solves the multicollinearity issue between
the variables by choosing the appropriate lag order (Shin et al., 2014)
Shin and Greenwood (2014) specify the general NARDL Equation 5.10 in the following way.
∆𝑦𝑖 = 𝛼0 + 𝜋𝑦𝑦𝑦𝑡−1 + 𝜋𝑦𝑥+ 𝑥𝑡−1
+ + 𝜋𝑦𝑥− 𝑥𝑡−1
− + ∑ 𝛾𝑖𝑝𝑖=1 ∆𝑦𝑡−𝑖 + ∑ (∅+𝑚−1
𝑗=0 ∆𝑥𝑡−𝑗+ + ∅+∆𝑥𝑡−𝑗
− ) + 𝜖𝑡 (5.10)
Equation 5.10 is the extended version of Equation 5.2, which includes the positive and negative
movement and effects of the independent variables on the dependent variable.
The first step of the NARDL procedure is choosing an appropriate lag for the model. The
appropriate lag for the co-integration test is determined based on the Akaike's Information
Criterion (AIC). The lowest value of the AIC will provide the best model. Based on that, the
optimum lag length for the ARDL test has been determined as 2. The optimum lags for the
model are identified as (2, 0, 0, 0, 2, 0).
In the next step, I estimate the ARDL model for Equation 5.9 with a time dummy variable for
a breakpoint at 1987. In order to find the co-integration relationship, the study calculates the F
statistic by bound testing. The results of the ARDL bound test is reported in Table 5.20.
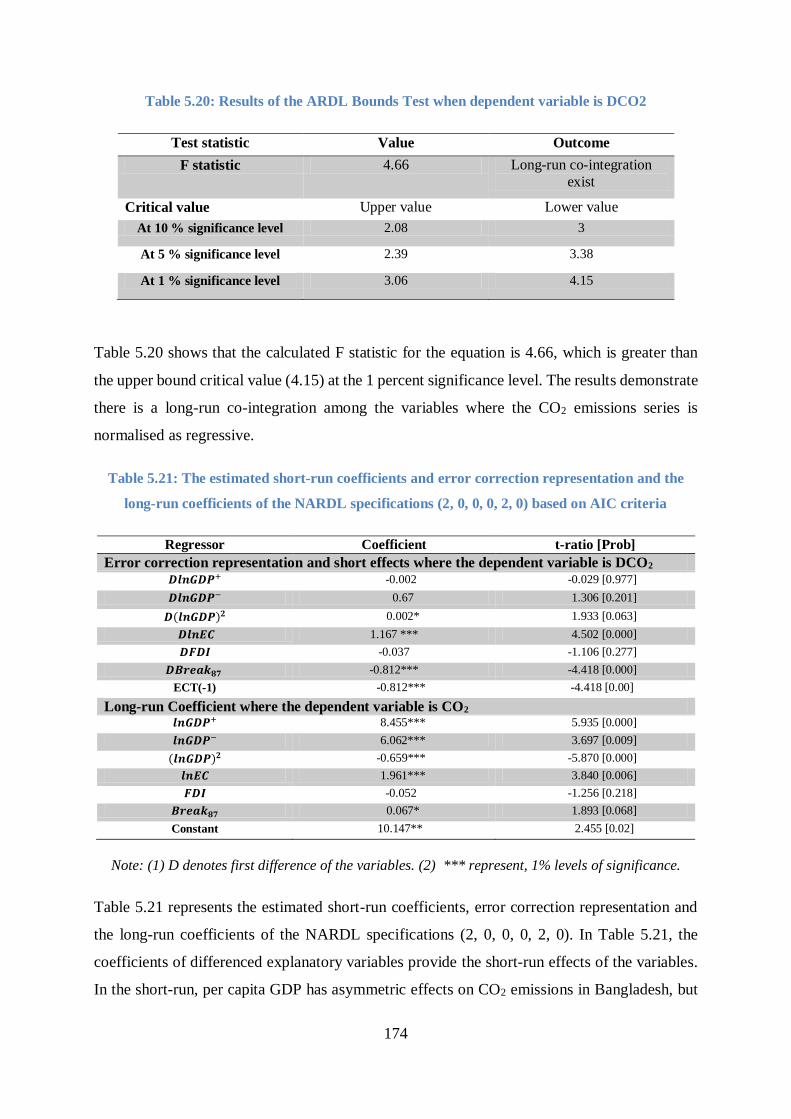
174
Table 5.20: Results of the ARDL Bounds Test when dependent variable is DCO2
Test statistic Value Outcome
F statistic 4.66 Long-run co-integration
exist
Critical value Upper value Lower value
At 10 % significance level 2.08 3
At 5 % significance level 2.39 3.38
At 1 % significance level 3.06 4.15
Table 5.20 shows that the calculated F statistic for the equation is 4.66, which is greater than
the upper bound critical value (4.15) at the 1 percent significance level. The results demonstrate
there is a long-run co-integration among the variables where the CO2 emissions series is
normalised as regressive.
Table 5.21: The estimated short-run coefficients and error correction representation and the
long-run coefficients of the NARDL specifications (2, 0, 0, 0, 2, 0) based on AIC criteria
Regressor Coefficient t-ratio [Prob]
Error correction representation and short effects where the dependent variable is DCO2 𝑫𝒍𝒏𝑮𝑫𝑷+ -0.002 -0.029 [0.977]
𝑫𝒍𝒏𝑮𝑫𝑷− 0.67 1.306 [0.201]
𝑫(𝒍𝒏𝑮𝑫𝑷)𝟐 0.002* 1.933 [0.063]
𝑫𝒍𝒏𝑬𝑪 1.167 *** 4.502 [0.000]
𝑫𝑭𝑫𝑰 -0.037 -1.106 [0.277]
𝑫𝑩𝒓𝒆𝒂𝒌𝟖𝟕 -0.812*** -4.418 [0.000]
ECT(-1) -0.812*** -4.418 [0.00]
Long-run Coefficient where the dependent variable is CO2 𝒍𝒏𝑮𝑫𝑷+ 8.455*** 5.935 [0.000]
𝒍𝒏𝑮𝑫𝑷− 6.062*** 3.697 [0.009]
(𝒍𝒏𝑮𝑫𝑷)𝟐 -0.659*** -5.870 [0.000]
𝒍𝒏𝑬𝑪 1.961*** 3.840 [0.006]
𝑭𝑫𝑰 -0.052 -1.256 [0.218]
𝑩𝒓𝒆𝒂𝒌𝟖𝟕 0.067* 1.893 [0.068]
Constant 10.147** 2.455 [0.02]
Note: (1) D denotes first difference of the variables. (2) *** represent, 1% levels of significance.
Table 5.21 represents the estimated short-run coefficients, error correction representation and
the long-run coefficients of the NARDL specifications (2, 0, 0, 0, 2, 0). In Table 5.21, the
coefficients of differenced explanatory variables provide the short-run effects of the variables.
In the short-run, per capita GDP has asymmetric effects on CO2 emissions in Bangladesh, but
175
the effects are not significant. The squared form of per capita GDP positively influenced CO2
emissions, which is significant at the 10 percent level. The energy consumption exerts a
significant positive impact on CO2 emissions in the short-run. The break dummy is also
significant in both the short- and long-run. The estimated coefficient of error correction term is
negative (-0.81) and statistically significant at 1 percent level. The result indicates that the
deviation from the long-run equilibrium has been corrected and variables are converging
towards the equilibrium path at the speed of 81 percent.
In the long-run, per capita GDP also has asymmetric effects on CO2 emissions in Bangladesh
and the effects are highly significant. The estimated long-run coefficient for positive changes
in per capita GDP is positive and statistically significant at the 1 percent level of significance.
The coefficient implies that if per capita GDP increased by 1 percent, CO2 emissions increase
by 8.4 percent in any year. The estimated long-run coefficient of negative changes in per capita
GDP is also positive and statistically significant at 1 percent level of significance. The
coefficient implies that if per capita GDP decreased by 1 percent, then CO2 emissions will
reduce by 6.06 percent. However, the magnitude of the impact is larger for positive changes in
per capita GDP.
The statistically significant negative sign of the quadratic form of per capita GDP confirms the
existence of EKC relationship for CO2 emissions in Bangladesh. Therefore, the level of CO2
emissions initially increases with income; but if income increases beyond a certain point, it
contributes to reducing CO2 emissions in Bangladesh. The point of inflection of the EKC curve
is calculated as 𝑌∗ = exp −𝛽2
2𝛽3⁄ , where 𝛽2 (= 8.455) is the estimated coefficient of per capita
GDP and 𝛽3(= -0.659) is the estimated coefficient of squared per capita GDP (Akbota and Baek,
2018). Therefore, the threshold point of the EKC relationship for Bangladesh is US$61,095.
Thus, when per capita GDP reaches US$61,095 pollution will start decreasing with growth in
per capita income.
The coefficient of per capita energy consumption is positive and statistically significant at the
1 percent level of significance, which also supports the associated null hypothesis. A one
percent increase in per capita energy consumption leads to a 1.96 percent increase of CO2
emissions in the long-run. The positive and significant coefficient of energy consumption is
theoretically expected and consistent with other studies such as Islam et al., (2013), Jalil and
Mahmud (2009), Rayhan et al., (2018) and Shahbaz et al., (2015).

176
However, the coefficient of FDI inflows is not statistically significant, which implies that FDI
inflows do not exert any significant impact on the CO2 emissions in Bangladesh, in the long-
run. The net effects of FDI inflows depend on the scale and composition effects. Moreover, the
amount of net FDI inflows in Bangladesh is low, which may cause the insignificant effects of
FDI inflows on the level of CO2 emissions. The results are consistent with the study by Rayhan
et al., (2018), which found the presence of an EKC relationship and insignificant impacts of
FDI for CO2 emissions in Bangladesh. In my study, I apply the more advanced econometric
technique and recent data set compared to the Rayhan et al., (2018) study. Moreover, I also
check the robustness of the results by applying alternative estimation techniques.
5.5.2.5 Validity of the model
Table 5.22 reports the diagnostic tests for the model, which confirm the absence of serial
correlations, homoscedasticity, normality and correct functional forms of the model.
Table 5.22: Results from Diagnostic tests
Diagnostic test Statistic Value [prob] Outcome
Serial Correlation 𝜒𝐿𝑀2 (2) 0.337[0.844] No serial correlation
Heteroscedasticity 2
HET 16.449[0.087] No Heteroscedasticity
Normality Jarque-Bera 1.872[0.391] Normality distributed
Functional Form 𝐹𝑅𝐸𝑆𝐸𝑇( 2) 2.901[0.071] Well fitted
The cumulative sum (CUSUM) plots and the square cumulative sum of the model are presented
in Figure 5.5, which shows that the recursive residuals exist inside the critical areas at 5 percent
level of significance. Therefore, the model is stable.
-15
-10
-5
0
5
10
15
90 92 94 96 98 00 02 04 06 08 10 12 14
CUSUM 5% Significance
-0.4
-0.2
0.0
0.2
0.4
0.6
0.8
1.0
1.2
1.4
90 92 94 96 98 00 02 04 06 08 10 12 14
CUSUM of Squares 5% Significance
Figure 5.5: Plot of the cumulative sum and square cumulative sum of recursive residuals
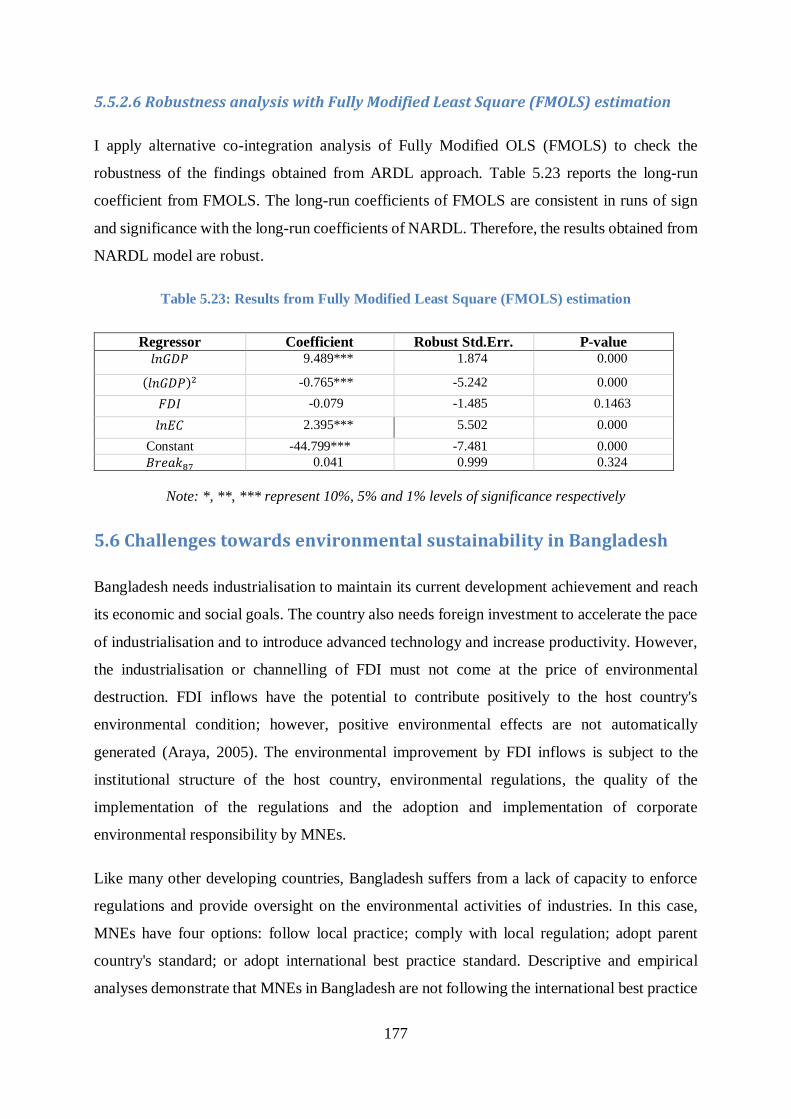
177
5.5.2.6 Robustness analysis with Fully Modified Least Square (FMOLS) estimation
I apply alternative co-integration analysis of Fully Modified OLS (FMOLS) to check the
robustness of the findings obtained from ARDL approach. Table 5.23 reports the long-run
coefficient from FMOLS. The long-run coefficients of FMOLS are consistent in runs of sign
and significance with the long-run coefficients of NARDL. Therefore, the results obtained from
NARDL model are robust.
Table 5.23: Results from Fully Modified Least Square (FMOLS) estimation
Regressor Coefficient Robust Std.Err. P-value
𝑙𝑛𝐺𝐷𝑃 9.489*** 1.874 0.000
(𝑙𝑛𝐺𝐷𝑃)2 -0.765*** -5.242 0.000
𝐹𝐷𝐼 -0.079 -1.485 0.1463
𝑙𝑛𝐸𝐶 2.395*** 5.502 0.000
Constant -44.799*** -7.481 0.000
𝐵𝑟𝑒𝑎𝑘87 0.041 0.999 0.324
Note: *, **, *** represent 10%, 5% and 1% levels of significance respectively
5.6 Challenges towards environmental sustainability in Bangladesh
Bangladesh needs industrialisation to maintain its current development achievement and reach
its economic and social goals. The country also needs foreign investment to accelerate the pace
of industrialisation and to introduce advanced technology and increase productivity. However,
the industrialisation or channelling of FDI must not come at the price of environmental
destruction. FDI inflows have the potential to contribute positively to the host country's
environmental condition; however, positive environmental effects are not automatically
generated (Araya, 2005). The environmental improvement by FDI inflows is subject to the
institutional structure of the host country, environmental regulations, the quality of the
implementation of the regulations and the adoption and implementation of corporate
environmental responsibility by MNEs.
Like many other developing countries, Bangladesh suffers from a lack of capacity to enforce
regulations and provide oversight on the environmental activities of industries. In this case,
MNEs have four options: follow local practice; comply with local regulation; adopt parent
country's standard; or adopt international best practice standard. Descriptive and empirical
analyses demonstrate that MNEs in Bangladesh are not following the international best practice
178
or their parent country's environmental standards. In most cases, MNEs are simply following
local practices. Therefore, adopting appropriate environmental policies and regulations, and
their strict enforcement, is vital for environmental sustainability in Bangladesh.
Several policies and laws embrace environmental protection in Bangladesh (see Section 5.3);
however, the implementation and enforcement of the environmental policies and laws in
Bangladesh are limited (Belal and Roberts, 2010). The lack of will or capacity by the relevant
authorities is a key obstacle in implementing environmental laws and regulations in Bangladesh
(Belal and Roberts, 2010). The main challenges towards environmental sustainability and the
compliance to environmental regulations in Bangladesh are discussed as follows.
Lack of resources and technical expertise obstruct the proper monitoring and enforcement of
environmental rules and regulations in Bangladesh. The Department of Environment (as the
national regulatory agency) is responsible for monitoring the implementation of environmental
laws and regulations in Bangladesh. However, due to an acute shortage of human resources and
other technical facilities, DOE fails to perform its duties properly (Haque, 2017). It is supposed
to organise regular inspections of the implementation status of environmental compliances of
the industries; however, again, the shortage of a trained workforce restricts DOE from regular
inspections. Even when inspections are carried out, and a factory is found to violate the rules
and regulations, the DOE is rarely able to manage a follow-up inspection to see if the factory
has complied with the directives.
Further, Bangladesh established an environmental court to speedily address environmental
offences; however, the court is overburdened and faces limited resource capacity. The judges
of the environmental court not only deal with the environmental cases, but they also have to
deal with general civil and criminal cases. Therefore, a huge backlog of cases occurs (Miah,
2015). Moreover, the environmental cases often require expert scientific and technical
knowledge to determine the level or presence of pollution. Due to the shortage of technical
expertise and facilities, DOE often delays in submitting the investigation report, which is
another obstacle to proper enforcement of the laws.
The lack of an effective Environmental Impact Assessment (EIA) system is a challenge in
promoting environmentally friendly development in Bangladesh. EIA helps to identify the
possible adverse environmental impact of a proposed project or investment. In Bangladesh, the
industries that are responsible for high pollution (such as textiles, dyeing, and finishing
179
industries) need an Environmental Clearance Certificate (ECC) from DOE prior to the
establishment of the enterprise. To obtain an ECC, the company must conduct an Environmental
Impact Assessment (EIA); however, there are no statutory EIA guidelines. Without a proper
EIA system, compliance with environmental laws and its enforcement are compromised
(Haque, 2017). Further, the consultants who prepare EIA reports are not expert or sufficiently
professional: they simply reproduce the previous EIA report for each new client (Haque, 2017).
Low penalties for violations of environmental law and regulations often discourage investors
from complying with the environmental rules and regulation in Bangladesh. Based on the
Environment Conservation Rules 1997, the DOE has the authority to issue penalties to industry
for violating emissions standards. The penalty amount is supposed to be determined by the
‘polluter pays’ principle14. The DOE may issue warnings and directives to mitigate the problem
within a stipulated time and can initiate legal proceedings in case of failure to comply; however,
the likelihood of imposing a penalty for non-compliance with environmental regulations is very
low (Sagris and Abbott, 2015). The environmental act allows both physical and financial
punishment for violating environmental law, regulations, ordinance, and compliances
obligations. As per the Environmental Acts 1995 and 2010, the respective authority can impose
a maximum BDT 10 lac (= $USD14,000). The amount of penalties is very negligible compared
with the gravity of the polluting offences. Often, the amount of penalty imposed is significantly
low compared with the cost of operating the compliance measures. For example, the average
cost of operating an ETP is 23.85 percent higher than the penalties or surcharges imposed
(Haque, 2015).
Inefficient natural resource use in the industries also cause environmental degradation in
Bangladesh. For example, the textile industry in Bangladesh has been excessively extracting
and using groundwater in Bangladesh (see Section 5.3). Water use efficiency is essential to
make the textiles industries competitive and sustainable. Efficiency in raw material
consumption, including water consumption, can also reduce effluent volume. Technological
advancement and the adoption of 3R strategy (reduces, reuse and recycle) is needed. Cleaner
production is central to efforts to prevent pollution. The elimination or reduction of wastewater
and chemicals is the key to water management for the textile industry.
14
The 'polluter pays' principle is the commonly held practice that those who produce pollution should bear the costs of
managing it to prevent damage to human health or the environment.
180
Corruption, unlawful influence and poor corporate attitude are also responsible for
environmental degradation in Bangladesh. For example, in the 2014-15 fiscal year budget, one
percent of the Environmental Protection Surcharge, or 'green tax', was imposed (on an ad
valorem basis) on all kinds of manufactured products of the polluting industries in Bangladesh.
The DOE initially made a list of 2,500 industries to be surcharged; however, due to lobbying,
especially from export-oriented manufacturing companies, the list is not yet finalised (Asif,
2017). It is reported that more than 30 RMG industry owners are parliamentary members of
Bangladesh, representing ten percent of total parliament members. Therefore, RMG industry
owners account for ten percent of Bangladeshi lawmakers. Moreover, half of the parliament
members who are involved in different businesses in Bangladesh take illegal advantages; this
hinders the effective enforcement of rules and regulations (Reuters, 2013).
Weak, corrupt and inefficient regulatory regimes is often an incentive for the poor corporate
attitudes of the companies. Many companies in Bangladesh choose to simply ignore the
problem, take a short-cut solution or bypass the rules. For example, although all manufacturing
industries must have ETP facilities, only five percent of companies listed on the Dhaka Stock
exchange actually have them (Belal et al., 2015).
Insufficient research and development activities by the government and private enterprises also
represents a key challenge towards promoting environmentally friendly technology in
Bangladesh. Sustainable development demands changes to the nature of economic growth,
instead of limiting economic activities. The aim of introducing new technology is to find the
balance between economic growth and environmental protection. For example, new technology
can contribute, in the production process, to waste reduction, recycling, pollution control, and
efficient resource use (Beder, 1994).
Intensification of research and development activities is needed urgently for technological
change and innovation. As noted, Bangladesh’s status in the research and innovation area is
very low, compared with many developing countries. The government expenditure on research
and development data for Bangladesh is not available. The private sector in Bangladesh also
takes a very casual approach to research and development activities (Arfanuzzaman, 2018).
Joint venture activities with large multinational enterprises could be very effective. Local
entrepreneurs also should contribute to, initiate and fund environmental research and
development activities.
181
5.7 Conclusion
The unplanned industrialisation and the ignorance of the environmental consequences of
industrialisation have severely damaged the natural resources and environment of Bangladesh.
The Bangladesh government has only recently started to pay attention to sustainable
industrialisation or green growth. The Agenda 2030 or Sustainable Development Goals (SDGs),
and particularly SDG 9 and SDG 12 emphasise the integration of environmental protection
issues in all economic development activities.
Various policies, laws, ordinances, and regulations are now in place to protect the natural
environment in Bangladesh. However, the limited capacity to enforce environmental
regulations and laws, unlawful intervention and corruption, and a poor corporate attitude of the
entrepreneurs limit the prospects of environmental sustainability in Bangladesh. The regulatory
authorities need to be equipped with sufficient facilities and fully trained technical personnel to
monitor, coordinate, assess and enforce pollution-related activities. Environmental laws and
policies in Bangladesh also do not offer sufficient incentives (or penalties) to prevent pollutions
(SAHA, 2014). Lack of inadequate environmental pollution-related data and an effective
system of disclosure of pollution information is an impediment in the process of preparation
and enforcement of environmental laws and regulations.
Technological advancement or introducing efficient, eco-friendly technology, is crucial to
preventing, preserving and reducing the use of unrenewable natural resources. Standard
Environmental management systems need to be implemented and practised by the enterprises
to prevent pollution. FDI can be a vehicle for promoting environmentally-friendly technology
and management systems in developing countries. The composition of FDI inflows and the
status of enforcement of environmental regulations indicates that polluting industries are
coming to Bangladesh, or the scale effects of environmental pollution of FDI inflows are
positive for water pollution in Bangladesh. Due to the shortage of sufficient data on water
pollution, I could not perform an empirical investigation of this aspect.
I conducted an empirical investigation to validate the pollution haven and EKC hypothesis for
CO2 emissions in Bangladesh. The study finds that FDI inflows are not contributing to the
increase of CO2 emissions in Bangladesh; therefore, the pollution haven hypothesis is not valid
for CO2 emissions in Bangladesh. However, the existence of the EKC relationship in both the
182
short- and long-run is a positive indication of that pollution levels will decrease in future when
income levels increase.
However, the pollution emission levels in Bangladesh are already at alarming levels. The
empirical results show a positive impact of energy consumption on CO2 emissions, in both the
short- and long-run. The acceleration of economic growth intensifies energy consumptions. In
Bangladesh, fossil fuels are the main sources of energy production; these produce a huge
amount of carbon and greenhouse gases. Therefore, Bangladesh should move towards
renewable energy sources and introduce energy efficiency in the production process.
The pollution halo hypothesis suggests that FDI could make a significant contribution to
promoting advanced, efficient, environmentally-friendly technology in the host country.
However, empirical evidence in this chapter rejects the pollution halo hypothesis for renewable
energy consumption in Bangladesh. Therefore, Bangladesh needs to pay more attention to
environmental sustainability issues in promoting FDI. FDI inflows need to be encouraged in
the environmentally-friendly technology sectors, such as renewable energy generation and
recycling. Considering the economic contribution of the textile and readymade garment
industries, and the importance of promoting green technology in this industry, Bangladesh
should only allow highly ranked environmentally-friendly multinationals into its textile
industry.
Local and multinational firms should take corporate environmental responsibilities seriously
and adhere to all policies and regulations in Bangladesh. The role of multinational enterprises
needs to be strengthened, as they have considerable soft power in influencing the local factories
via their prequalification inspection and supplier-buyer relationships.

183
CHAPTER 6: MANUFACTURING FDI AND SOCIAL
SUSTAINABILITY IN BANGLADESH
6.1 Introduction
In this chapter, I investigate research question three, which focuses on the impact of
manufacturing FDI inflows on social improvement in Bangladesh. Sustainable development
requires an equitable, inclusive development with the establishment of justice and peace for all.
In addition to the natural and physical capital stock, the maintenance of social capital stock is
critical for sustainability. Dasgupta and Serageldin (1999) note that society's needs are not
homogeneous, and social cohesion is essential to meet the necessary conditions for achieving
social sustainability. Agenda 2030, or the Sustainable Development Goals (SDGs), also places
the social aspects of sustainable development at the heart of its development agenda. Within the
social dimension is poverty reduction and food security, overall wellbeing and human
development, decent working conditions, and reduced inequalities; strong institutions or
corporate governance and partnerships are also considered important.
The theoretical and empirical literature suggests that FDI inflows can generate both positive
and negative effects on the social aspects of sustainable development. For instance, FDI inflows
can reduce the poverty level of the host country by creating income-generating activities. On
the other hand, FDI inflows may ‘crowd out’ domestic investment, negatively affect
employment generation and worsen inequality (Kurtishi-Kastrati, 2013). The corporate social
responsibility (CSR) of MNEs can also help to improve the social and working conditions of
the host country; however, CSR is a voluntary initiative, and MNEs may not practice the same
CSR practices in the host country as they do in their parent country.
Bangladesh has some improved in some macroeconomic and social conditions; however, the
problems of rising income inequality, high unemployment rates, and widespread poverty remain
major challenges for achieving the social goals of sustainable development in Bangladesh.
Research question three asks if FDI inflows in the manufacturing sector can help to meet the
social challenges of sustainable development in Bangladesh.
184
The chapter is structured as follows: Section 6.2 narrates the general socio-economic progress
of Bangladesh for the last three decades; Section 6.3 provides a descriptive analysis of the
impacts of manufacturing FDI inflows on the major social areas in Bangladesh, based on the
available information and statistics; Section 6.4 describes the procedure and findings of the
empirical analysis to discuss the nexus between FDI inflows and income inequality in
Bangladesh; Section 6.5 discusses the current corporate social responsibilities practised by
multinational enterprises in Bangladesh; and Section 6.6 provides conclusions with policy
implications in regards to social sustainability and the role of manufacturing FDI in Bangladesh.
6.2 General socio-economic conditions in Bangladesh
Since the 1990s Bangladesh has been able to achieve a degree of economic progress and
maintain macroeconomic stability in terms of GDP growth, inflation management, and export
performance. The country has also progressed in several major social indicators, such as life
expectancy, literacy, sanitation facilities, immunisation coverage, and empowerment of women.
Table 6.1 represents the progress of major social indicators in Bangladesh. The steady rise in
GDP growth, along with the fall of population growth, led to steady growth in per capita income
in Bangladesh. As shown in Table 6.1, the per capita income in Bangladesh has more than
doubled from 1990 to 2017 in real terms. Despite GDP growing at over 6 percent per annum,
inflation has been maintained below 7 percent in recent times. Bangladesh also progressed in
the health and education indicators. The adult literacy rate increased to 72.76 in 2016 from
35.32 percent in 1991. The average life expectancy was 59 years in 1991; this increased to 72
years in 2016. According to the World Economic Forum, Bangladesh ranked first in achieving
gender parity in the South Asia region (WEF, 2016).
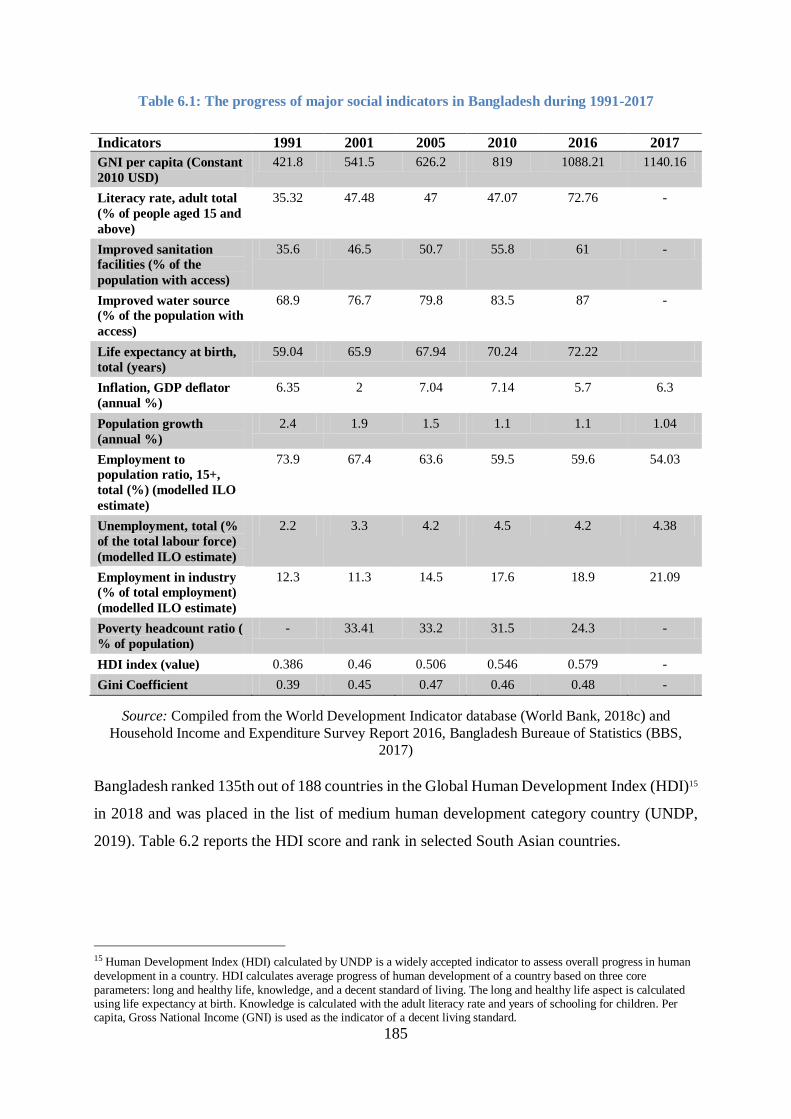
185
Table 6.1: The progress of major social indicators in Bangladesh during 1991-2017
Indicators 1991 2001 2005 2010 2016 2017
GNI per capita (Constant
2010 USD)
421.8 541.5 626.2 819 1088.21 1140.16
Literacy rate, adult total
(% of people aged 15 and
above)
35.32 47.48 47 47.07 72.76 -
Improved sanitation
facilities (% of the
population with access)
35.6 46.5 50.7 55.8 61 -
Improved water source
(% of the population with
access)
68.9 76.7 79.8 83.5 87 -
Life expectancy at birth,
total (years)
59.04 65.9 67.94 70.24 72.22
Inflation, GDP deflator
(annual %)
6.35 2 7.04 7.14 5.7 6.3
Population growth
(annual %)
2.4 1.9 1.5 1.1 1.1 1.04
Employment to
population ratio, 15+,
total (%) (modelled ILO
estimate)
73.9 67.4 63.6 59.5 59.6 54.03
Unemployment, total (%
of the total labour force)
(modelled ILO estimate)
2.2 3.3 4.2 4.5 4.2 4.38
Employment in industry
(% of total employment)
(modelled ILO estimate)
12.3 11.3 14.5 17.6 18.9 21.09
Poverty headcount ratio (
% of population)
- 33.41 33.2 31.5 24.3 -
HDI index (value) 0.386 0.46 0.506 0.546 0.579 -
Gini Coefficient 0.39 0.45 0.47 0.46 0.48 -
Source: Compiled from the World Development Indicator database (World Bank, 2018c) and
Household Income and Expenditure Survey Report 2016, Bangladesh Bureaue of Statistics (BBS,
2017)
Bangladesh ranked 135th out of 188 countries in the Global Human Development Index (HDI)15
in 2018 and was placed in the list of medium human development category country (UNDP,
2019). Table 6.2 reports the HDI score and rank in selected South Asian countries.
15
Human Development Index (HDI) calculated by UNDP is a widely accepted indicator to assess overall progress in human
development in a country. HDI calculates average progress of human development of a country based on three core
parameters: long and healthy life, knowledge, and a decent standard of living. The long and healthy life aspect is calculated using life expectancy at birth. Knowledge is calculated with the adult literacy rate and years of schooling for children. Per capita, Gross National Income (GNI) is used as the indicator of a decent living standard.

186
Table 6.2: HDI score and rank of selected South Asian Countries during 1990-2018
HDI score HDI rank
out of 188
countries in
2018
1990 2000 2010 2015 2018
Bangladesh 0.388 0.470 0.549 0.588 0.614 135
India 0.431 0.497 0.581 0.627 0.647 129
Nepal 0.380 0.446 0.527 0.568 0.579 147
Pakistan 0.404 0.449 0.524 0.550 0.560 152
Sri Lanka 0.625 0.687 0.750 0.772 0.780 71
Source: Human Development Report 2019, (UNDP, 2019)
As shown in Table 6.2, Bangladesh maintained an average annual HDI growth rate of 1.65
percent from 1990 to 2018, and the HDI score increased by 50 percent from 1990 to 2018.
However, the trend in the HDI scores is almost stagnant after 2010 (as shown in Figure 6.1).
Table 6.2 also depicts that the country is still behind many developing countries in terms of
HDI rankings.
Figure 6.1: HDI trend in Bangladesh
Source: Human Development Report 2019, (UNDP, 2019)
Table 6.1 also shows that the Gini Coefficient is increasing over the respective period. Thus,
while the poverty situation is improving, a large proportion of the population (more than 45
million) are under the poverty line, inequality has worsened. The rate of unemployment is not
that high at below 5 percent but around 40 percent of the population is underemployed, which
means people counted as employed work only a few hours a week or at a low-wage compared
to their skills and they are still searching for suitable jobs (CIA, The World Factbook, n.d).
Massive underemployment is also a big challenge for socio-economic improvement.
0
0.1
0.2
0.3
0.4
0.5
0.6
0.7
1990 2000 2010 2013 2015 2016 2017 2018
HD
I Sco
re
187
6.3 Manufacturing FDI inflows and its impact on the major social areas
of sustainable development in Bangladesh
This section provides an overview of the broad trends and descriptive statistics in relation to
FDI and the major social challenges for sustainable development in Bangladesh. The descriptive
analysis is followed by an econometric study of the FDI inflows and income inequality
relationship in Section 6.4.
6.3.1 Impact on employment generation
Employment generation is considered as an indicator of social development. Employment
provides income to households and thus increases the capability of the households to access
various social facilities, such as education, health and housing. FDI creates employment
opportunities through direct investments and also generates jobs indirectly through expanding
or stimulating domestic investment through backward and forward linkage effects. The indirect
effects of FDI inflows for employment creation are considered more effective than the direct
effects (IFC, 2013, p. 49); therefore, policymakers in Bangladesh are increasingly promoting
FDI in the manufacturing sector where indirect effects should be strong. The young and
working-age population has been expanding more rapidly than the total population in
Bangladesh. One-third of the total population is between 0 and 14 years. The percentage of the
very young population (32.4 percent) is also higher than the percentage of those aged 65 or
older (4.9 percent) (BBS, 2017). The rapid increase of a young and working-age population
creates opportunities for income generation and growth. However, high population growth also
poses a significant challenge for the labour market to absorb new entrants. Since 1990,
employment has increased at a rate of 1.6 percent per annum on average, which is low compared
with the growth rate of GDP (6%), while unemployment as a percentage of the total labour
force increased from 2.2 in 1991 to 4.2 in 2016 (World Bank, 2018c).
FDI inflows are mostly concentrated in the manufacturing sector in Bangladesh, but it is still
low compared with the total investment of this sector. Therefore, employment directly created
by MNEs is also low compared with the total employment in the manufacturing sector. Total
employment created by foreign and joint venture investment was 377,241 jobs, which is only
7.5 percent of total employment of the manufacturing sector (BBS, 2012). Although direct job
creation from FDI is low, its 'crowding in' effect for domestic industries, especially in the textile
and apparel industry, may have a positive contribution to employment generation in the
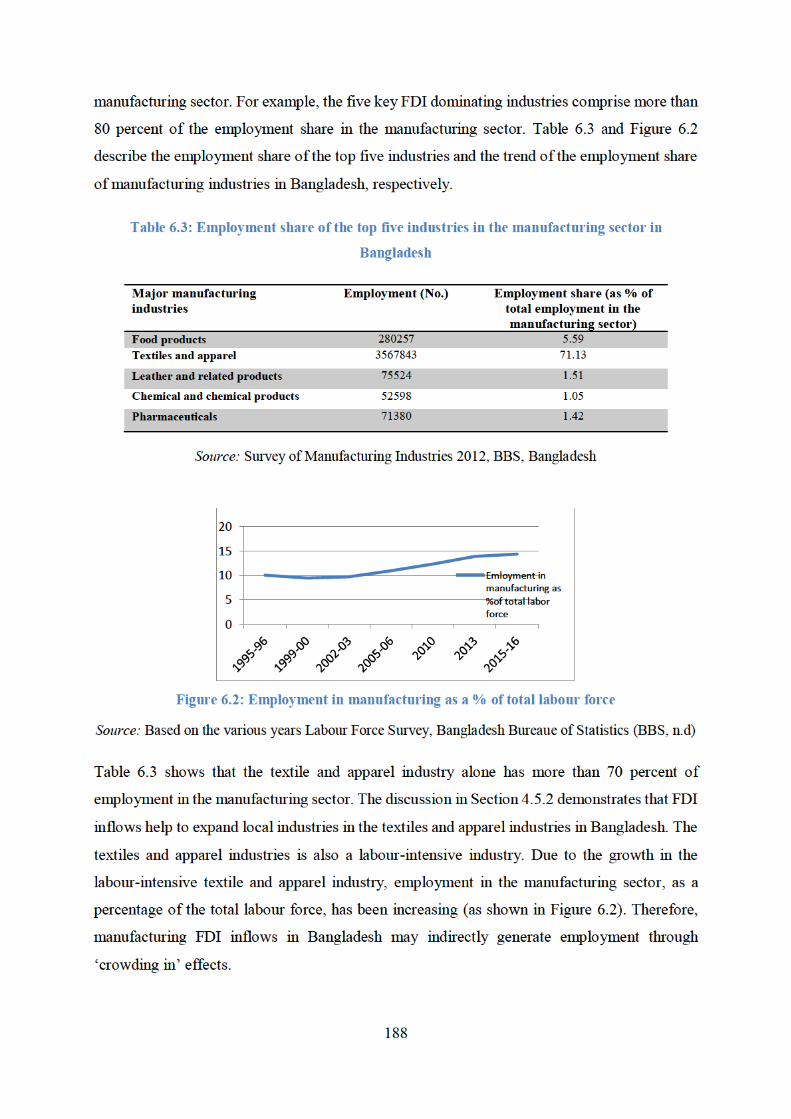


190
Table 6.4: The Poverty Gap and the Squared Poverty Gap (in percentage) in Bangladesh
Poverty Gap Squared Poverty Gap
2010 2016 2010 2016
As per the Upper Poverty Line
National 6.5 5.0 2.0 1.5
Rural 7.4 5.4 2.2 1.7
Urban 4.3 3.9 1.3 1.2
As per the Lower Poverty Line
National 3.1 2.3 0.8 0.6
Rural 3.7 2.6 1.0 0.7
Urban 1.3 1.3 0.4 0.4
Source: Household Income and Expenditure Survey (HIES) 2010 and 2016, BBS
FDI might not create any direct impact on poverty reduction in the host country, but FDI can
indirectly contribute to poverty reduction through employment generation, boosting growth,
revenue generation and through the practice of corporate social responsibility (see Section
3.4.2).
It is claimed that the labour-intensive textiles and apparel industries contribute the most to
poverty reduction in Bangladesh (UNDP, 2018). At the time of writing, over four million people
are working in the textiles and apparel industries in Bangladesh (MOF, 2017) and, as
mentioned, the industry receives the majority of FDI inflows. The textiles and readymade
industry is also the main source of export earning in Bangladesh. The export earnings from this
sector was $USD 28.14 billion in 2017, which was 80.7 percent of export earnings in total
exports and 12.36 percent of the country GDP (MOF, 2017). The government also earns
significant revenue from the textiles and apparel industries from export duties; therefore, the
textiles and apparel industries help to increase the government's capacity to undertake various
poverty alleviation programs.
In 2017, the Bangladesh government allocated $USD 5837 million to the government's social
safety net program (MOF, 2017) and poverty alleviation programs include Vulnerable Group
Feeding (VGF), allowances for widows, old aged and physically challenged insolvent citizens,
food for works, and Test Relief for ultra-poor communities (MOF, 2017). Along with NGOs,
the government is also operating the microcredit program for the social and economic
empowerment of poor people: all these efforts together contribute to poverty reduction in
Bangladesh. Therefore, FDI inflow in Bangladesh may indirectly contribute to the poverty


193
when the eight-story Rana Plaza factory collapsed in Savar (near Dhaka) killing 1,129 workers,
with more than 2,500 others seriously wounded (ILO, Employment injury, n.d.).
FDI inflows might not be directly responsible for the low wage levels, and poor working
conditions in the readymade garments industry in Bangladesh. The wage levels and working
conditions of foreign firms are better than locally-owned firms. There is evidence that the
foreign-owned and joint-venture companies maintain higher minimum wage policy compared
with locally-owned enterprises. Most of the foreign-owned and joint-venture companies in
Bangladesh are located in the eight Export Processing Zones (BEPZA, 2016). The EPZs are
controlled and administered by the Bangladesh Export Processing Authority (BEPZA). The
BEPZA has a minimum wage policy, and the wages offered in the EPZs are higher than the
statutory minimum wage elsewhere. The average wage of a worker in EPZs is 18.5 percent
higher than the wage of a worker in non-EPZ (Moazzem et al., 2018). Important non-wage
conditions, such as a 10 percent annual increment in basic wages, free medical, food and
transport facilities, overtime and night allowances, maternity and holiday leave payment, are
also offered by the enterprises located inside the EPZ (Bhattacharya, 1998; BEPZA, 2016).
The physical facilities are also better in factories located in the EPZs area. BEPZA also regularly
monitors the Workplace safety issues, and representatives of the well-known brands frequently
visit the factories in the EPZs. The Engineering Department of the BEZA ensures maintenance
and compliances of the building codes (Moazzem et al., 2018; BEPZA, 2016). Therefore, it can
be said that foreign and joint venture firm's working conditions and welfare issues are often
better than most of the locally owned factories in Bangladesh.
However, the corporate social responsibility practice of MNEs operating in Bangladesh is very
limited and piecemeal, and often does not focus on sustainability outcomes (Masud et al., 2013,
Momin, 2006, Moyeen and Huq, 2010). MNEs also have a weak relationship with the local
firms, which reduces spillover effects on the wage and working conditions in the sector. As
noted, the working conditions of the subsidiaries of the MNEs in Bangladesh are better
compared with most of the locally owned industries; however, often subsidiaries give
subcontracts to the local industries, and none of the subsidiaries or their parent companies
supervise or monitor the environmental and working conditions of these subcontracting
companies (Yasmin, 2014; Haque, 2018). The companies are only concerned about the quality
of the products, which are marketed by the big brands. For instance, at the time of the Tazreen
factory (locally owned) fire in Nov 2012, a local journalist found labels, order forms, and design
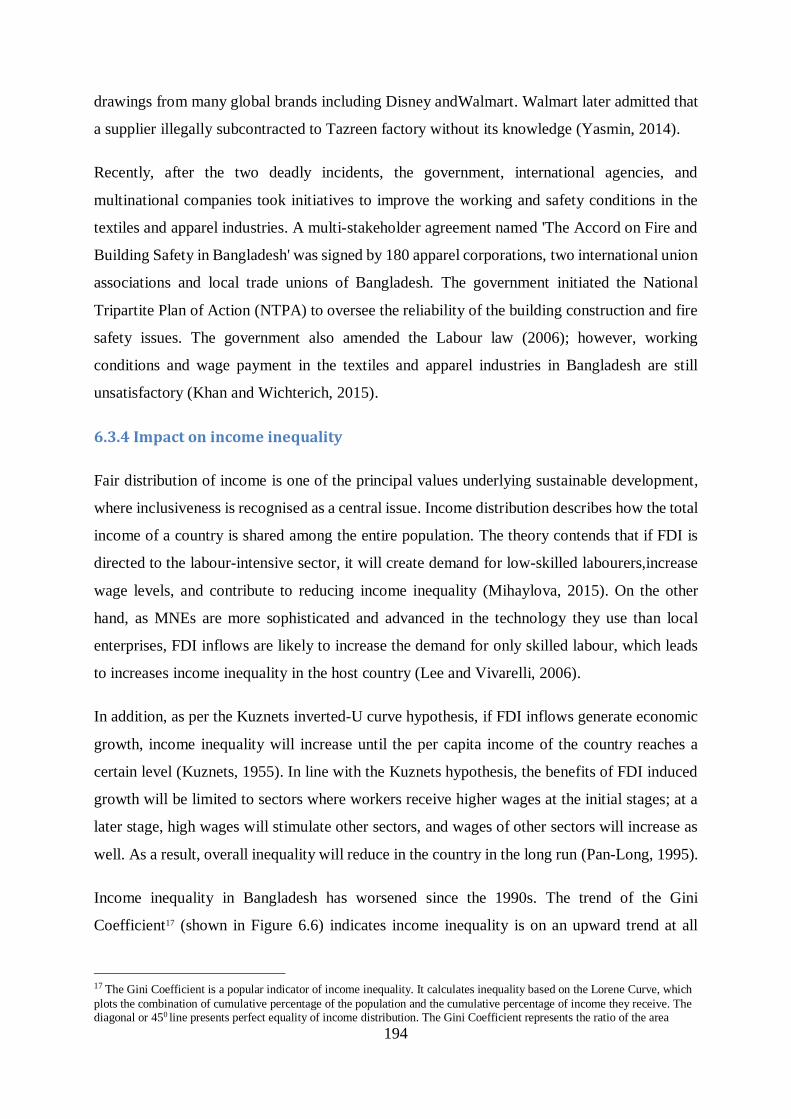
194
drawings from many global brands including Disney andWalmart. Walmart later admitted that
a supplier illegally subcontracted to Tazreen factory without its knowledge (Yasmin, 2014).
Recently, after the two deadly incidents, the government, international agencies, and
multinational companies took initiatives to improve the working and safety conditions in the
textiles and apparel industries. A multi-stakeholder agreement named 'The Accord on Fire and
Building Safety in Bangladesh' was signed by 180 apparel corporations, two international union
associations and local trade unions of Bangladesh. The government initiated the National
Tripartite Plan of Action (NTPA) to oversee the reliability of the building construction and fire
safety issues. The government also amended the Labour law (2006); however, working
conditions and wage payment in the textiles and apparel industries in Bangladesh are still
unsatisfactory (Khan and Wichterich, 2015).
6.3.4 Impact on income inequality
Fair distribution of income is one of the principal values underlying sustainable development,
where inclusiveness is recognised as a central issue. Income distribution describes how the total
income of a country is shared among the entire population. The theory contends that if FDI is
directed to the labour-intensive sector, it will create demand for low-skilled labourers,increase
wage levels, and contribute to reducing income inequality (Mihaylova, 2015). On the other
hand, as MNEs are more sophisticated and advanced in the technology they use than local
enterprises, FDI inflows are likely to increase the demand for only skilled labour, which leads
to increases income inequality in the host country (Lee and Vivarelli, 2006).
In addition, as per the Kuznets inverted-U curve hypothesis, if FDI inflows generate economic
growth, income inequality will increase until the per capita income of the country reaches a
certain level (Kuznets, 1955). In line with the Kuznets hypothesis, the benefits of FDI induced
growth will be limited to sectors where workers receive higher wages at the initial stages; at a
later stage, high wages will stimulate other sectors, and wages of other sectors will increase as
well. As a result, overall inequality will reduce in the country in the long run (Pan-Long, 1995).
Income inequality in Bangladesh has worsened since the 1990s. The trend of the Gini
Coefficient17 (shown in Figure 6.6) indicates income inequality is on an upward trend at all
17 The Gini Coefficient is a popular indicator of income inequality. It calculates inequality based on the Lorene Curve, which
plots the combination of cumulative percentage of the population and the cumulative percentage of income they receive. The diagonal or 450 line presents perfect equality of income distribution. The Gini Coefficient represents the ratio of the area
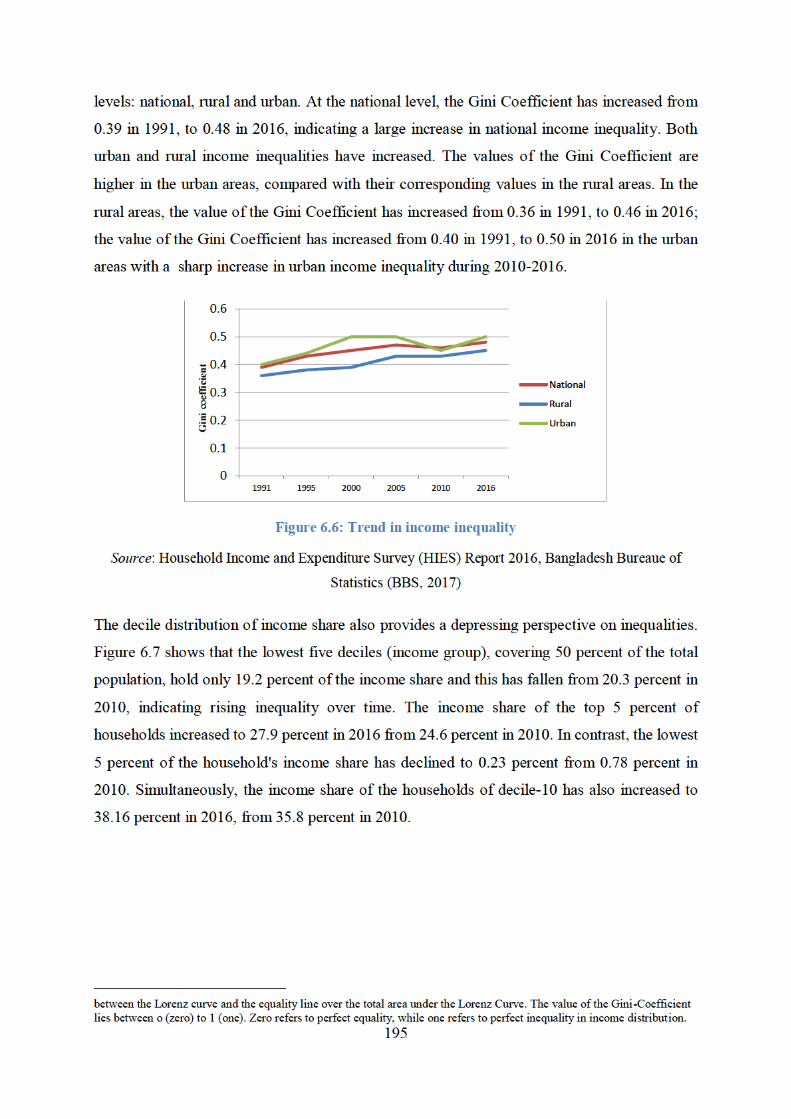
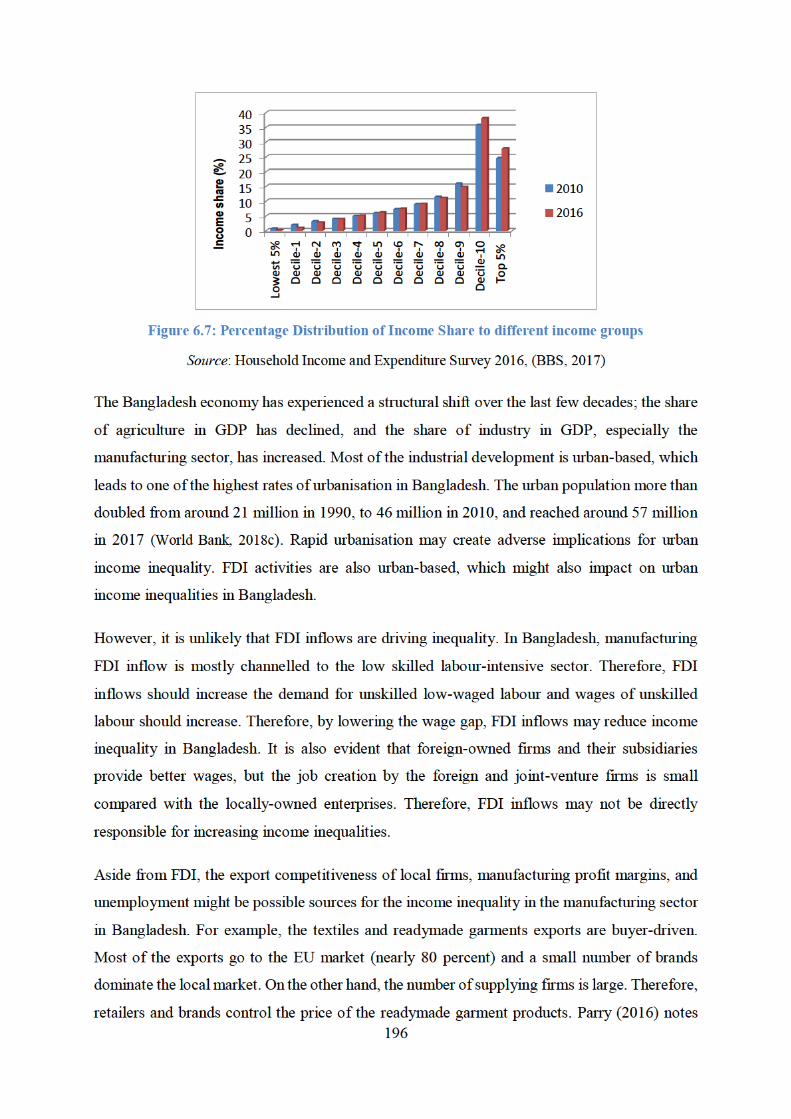
197
that buyers want quality products at a cheap rate and suppliers will accept a low price.
Muhammad ( 2014) estimates that if a garment product is sold at USD14 in a developed market,
the buyers and brand retailers get 60 percent of the value. Another 35 percent of the value goes
to the intermediate products (imported and local materials). The establishment costs and the
workers, the bottom of the supply chain, receive less than 1 percent. The unequal distribution
of income throughout this supply chain results in a narrow profit margin for manufacturers,
which decreases wage levels in the industry. Moreover, local subcontracting firms are very
competitive with each other over contracts. The supplying firms want to secure profit margins
and consider labour costs to be flexible, which may further boost the existing income inequality
in the sector.
The next section conducts an econometric analysis to explore the nexus between FDI inflows
and income inequality in Bangladesh. There are three main reasons why this study only
considers income inequality, and does not include poverty reduction, employment generation
and working conditions in the empirical analysis. Firstly, inclusiveness is the core element in
the social dimensions of sustainable development, and income inequality represents the the
degree to which the benefits of FDI are inclusive. Secondly, the descriptive analysis shows that
along with the increased inflow of FDI, Bangladesh has progressed in a few social areas,
including poverty reduction, over the last two decades; however, income inequality is increasing
and is a big challenge for sustainable development in Bangladesh. Thirdly, the data on
employment generation and working conditions are not available in Bangladesh for any
rigorous econometric analysis.
6.4 The FDI inflow and the income inequality nexus in Bangladesh: an
empirical analysis
6.4.1 Model specification and data sources
Based on the theoretical arguments outlined in Section 3.4.1 regarding the relationship between
FDI inflows and income inequalities and the Kuznets hypothesis of income inequalities, the
study specifies Equation 6.1 to examine the impact of FDI inflows on income inequality in
Bangladesh. Earlier studies, such as Pan-Long (1995) for Least Developped Countries (LDCs),
Ridzuan et al. (2017) for Singapore and Ucal et al. (2016) for Turkey also used a similar
equation to investigate the relationship between FDI inflows and income inequality.
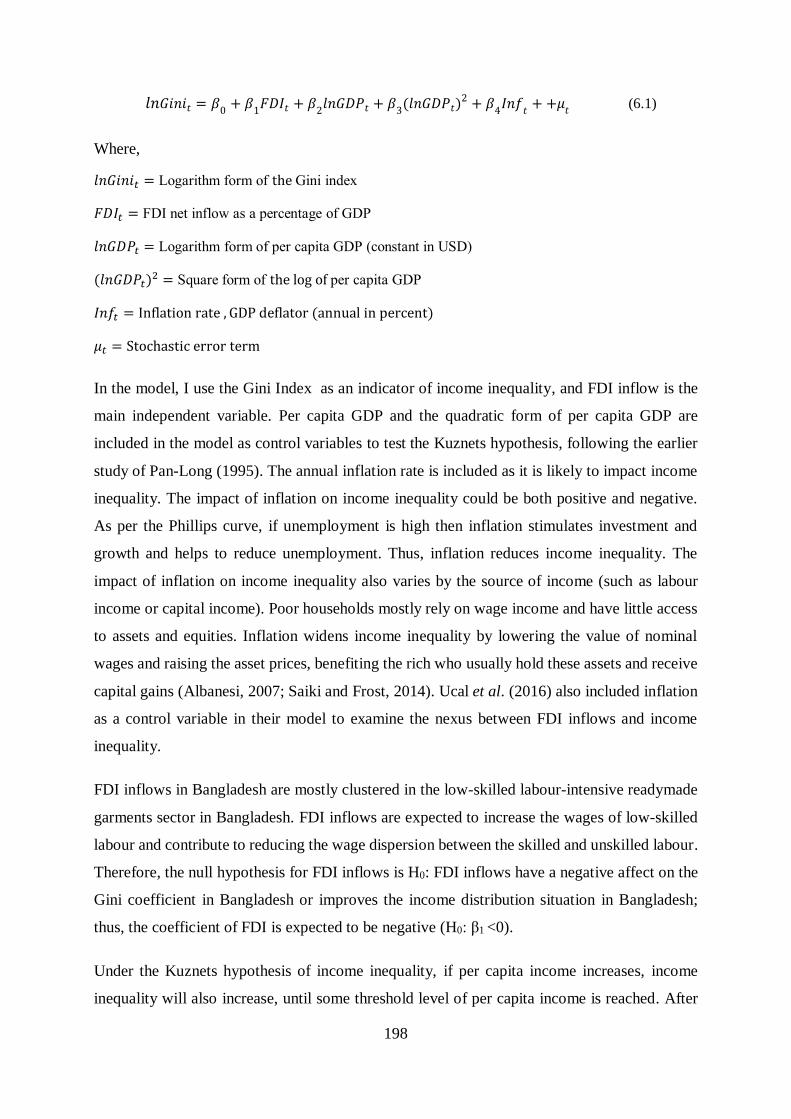
198
𝑙𝑛𝐺𝑖𝑛𝑖𝑡 = 𝛽0
+ 𝛽1𝐹𝐷𝐼𝑡 + 𝛽
2𝑙𝑛𝐺𝐷𝑃𝑡 + 𝛽
3(𝑙𝑛𝐺𝐷𝑃𝑡)2 + 𝛽
4𝐼𝑛𝑓
𝑡+ +𝜇
𝑡 (6.1)
Where,
𝑙𝑛𝐺𝑖𝑛𝑖𝑡 = Logarithm form of the Gini index
𝐹𝐷𝐼𝑡 = FDI net inflow as a percentage of GDP
𝑙𝑛𝐺𝐷𝑃𝑡 = Logarithm form of per capita GDP (constant in USD)
(𝑙𝑛𝐺𝐷𝑃𝑡)2 = Square form of the log of per capita GDP
𝐼𝑛𝑓𝑡 = Inflation rate , GDP deflator (annual in percent)
𝜇𝑡 = Stochastic error term
In the model, I use the Gini Index as an indicator of income inequality, and FDI inflow is the
main independent variable. Per capita GDP and the quadratic form of per capita GDP are
included in the model as control variables to test the Kuznets hypothesis, following the earlier
study of Pan-Long (1995). The annual inflation rate is included as it is likely to impact income
inequality. The impact of inflation on income inequality could be both positive and negative.
As per the Phillips curve, if unemployment is high then inflation stimulates investment and
growth and helps to reduce unemployment. Thus, inflation reduces income inequality. The
impact of inflation on income inequality also varies by the source of income (such as labour
income or capital income). Poor households mostly rely on wage income and have little access
to assets and equities. Inflation widens income inequality by lowering the value of nominal
wages and raising the asset prices, benefiting the rich who usually hold these assets and receive
capital gains (Albanesi, 2007; Saiki and Frost, 2014). Ucal et al. (2016) also included inflation
as a control variable in their model to examine the nexus between FDI inflows and income
inequality.
FDI inflows in Bangladesh are mostly clustered in the low-skilled labour-intensive readymade
garments sector in Bangladesh. FDI inflows are expected to increase the wages of low-skilled
labour and contribute to reducing the wage dispersion between the skilled and unskilled labour.
Therefore, the null hypothesis for FDI inflows is H0: FDI inflows have a negative affect on the
Gini coefficient in Bangladesh or improves the income distribution situation in Bangladesh;
thus, the coefficient of FDI is expected to be negative (H0: β1 <0).
Under the Kuznets hypothesis of income inequality, if per capita income increases, income
inequality will also increase, until some threshold level of per capita income is reached. After
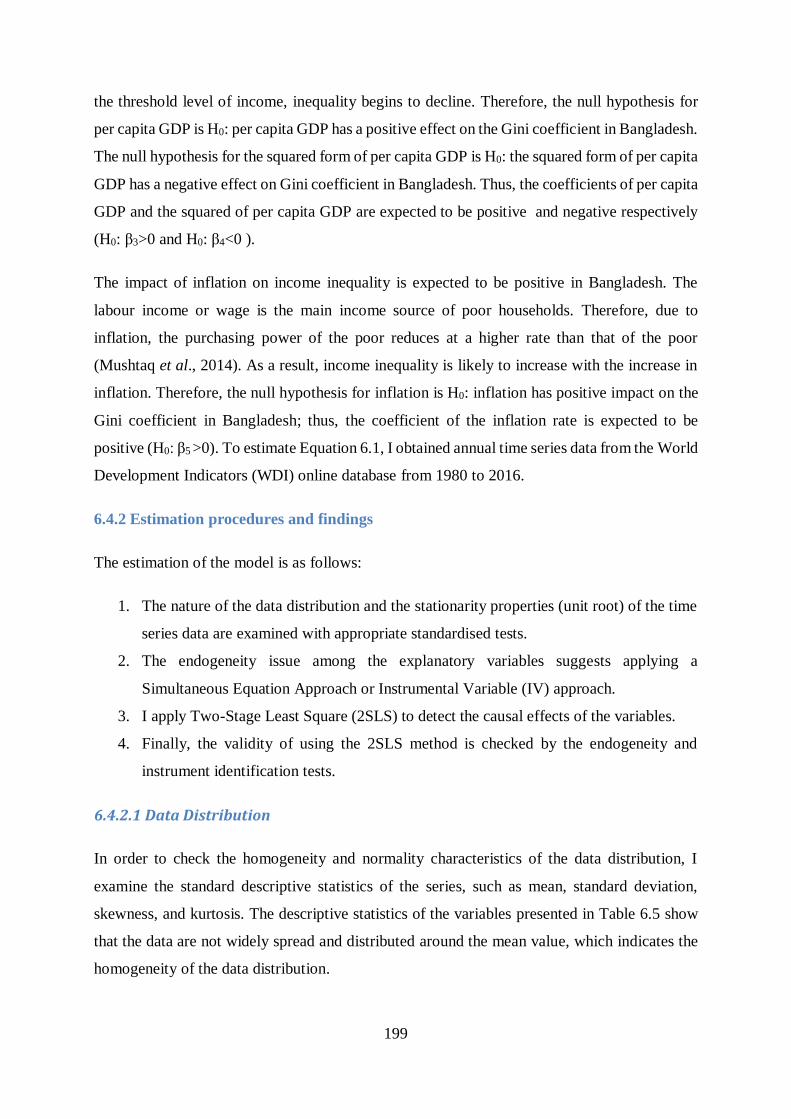
199
the threshold level of income, inequality begins to decline. Therefore, the null hypothesis for
per capita GDP is H0: per capita GDP has a positive effect on the Gini coefficient in Bangladesh.
The null hypothesis for the squared form of per capita GDP is H0: the squared form of per capita
GDP has a negative effect on Gini coefficient in Bangladesh. Thus, the coefficients of per capita
GDP and the squared of per capita GDP are expected to be positive and negative respectively
(H0: β3>0 and H0: β4<0 ).
The impact of inflation on income inequality is expected to be positive in Bangladesh. The
labour income or wage is the main income source of poor households. Therefore, due to
inflation, the purchasing power of the poor reduces at a higher rate than that of the poor
(Mushtaq et al., 2014). As a result, income inequality is likely to increase with the increase in
inflation. Therefore, the null hypothesis for inflation is H0: inflation has positive impact on the
Gini coefficient in Bangladesh; thus, the coefficient of the inflation rate is expected to be
positive (H0: β5 >0). To estimate Equation 6.1, I obtained annual time series data from the World
Development Indicators (WDI) online database from 1980 to 2016.
6.4.2 Estimation procedures and findings
The estimation of the model is as follows:
1. The nature of the data distribution and the stationarity properties (unit root) of the time
series data are examined with appropriate standardised tests.
2. The endogeneity issue among the explanatory variables suggests applying a
Simultaneous Equation Approach or Instrumental Variable (IV) approach.
3. I apply Two-Stage Least Square (2SLS) to detect the causal effects of the variables.
4. Finally, the validity of using the 2SLS method is checked by the endogeneity and
instrument identification tests.
6.4.2.1 Data Distribution
In order to check the homogeneity and normality characteristics of the data distribution, I
examine the standard descriptive statistics of the series, such as mean, standard deviation,
skewness, and kurtosis. The descriptive statistics of the variables presented in Table 6.5 show
that the data are not widely spread and distributed around the mean value, which indicates the
homogeneity of the data distribution.
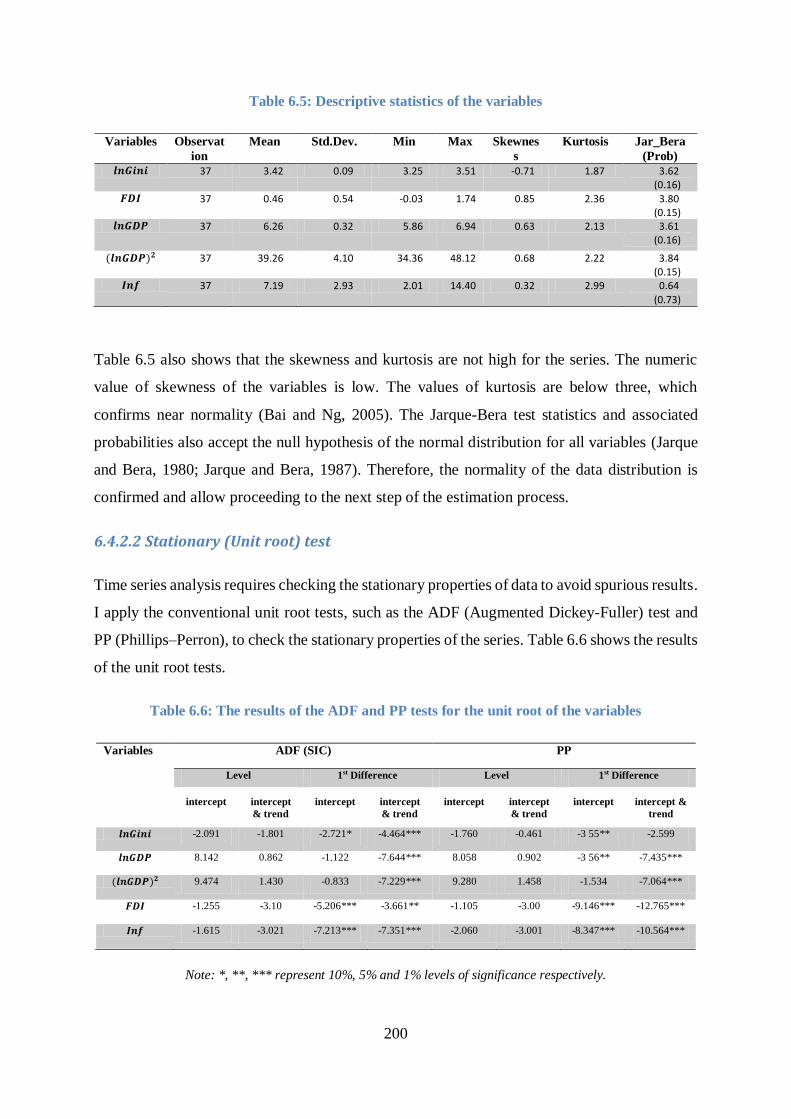
200
Table 6.5: Descriptive statistics of the variables
Variables Observat
ion
Mean Std.Dev. Min Max Skewnes
s
Kurtosis Jar_Bera
(Prob) 𝒍𝒏𝑮𝒊𝒏𝒊 37 3.42 0.09 3.25 3.51 -0.71 1.87 3.62
(0.16) 𝑭𝑫𝑰 37 0.46 0.54 -0.03 1.74 0.85 2.36 3.80
(0.15) 𝒍𝒏𝑮𝑫𝑷 37 6.26 0.32 5.86 6.94 0.63 2.13 3.61
(0.16)
(𝒍𝒏𝑮𝑫𝑷)𝟐 37 39.26 4.10 34.36 48.12 0.68 2.22 3.84 (0.15)
𝑰𝒏𝒇 37 7.19 2.93 2.01 14.40 0.32 2.99 0.64
(0.73)
Table 6.5 also shows that the skewness and kurtosis are not high for the series. The numeric
value of skewness of the variables is low. The values of kurtosis are below three, which
confirms near normality (Bai and Ng, 2005). The Jarque-Bera test statistics and associated
probabilities also accept the null hypothesis of the normal distribution for all variables (Jarque
and Bera, 1980; Jarque and Bera, 1987). Therefore, the normality of the data distribution is
confirmed and allow proceeding to the next step of the estimation process.
6.4.2.2 Stationary (Unit root) test
Time series analysis requires checking the stationary properties of data to avoid spurious results.
I apply the conventional unit root tests, such as the ADF (Augmented Dickey-Fuller) test and
PP (Phillips–Perron), to check the stationary properties of the series. Table 6.6 shows the results
of the unit root tests.
Table 6.6: The results of the ADF and PP tests for the unit root of the variables
Variables ADF (SIC) PP
Level 1st Difference Level 1st Difference
intercept intercept
& trend
intercept intercept
& trend
intercept intercept
& trend
intercept intercept &
trend
𝒍𝒏𝑮𝒊𝒏𝒊 -2.091 -1.801 -2.721* -4.464*** -1.760 -0.461 -3 55** -2.599
𝒍𝒏𝑮𝑫𝑷 8.142 0.862 -1.122 -7.644*** 8.058 0.902 -3 56** -7.435***
(𝒍𝒏𝑮𝑫𝑷)𝟐 9.474 1.430 -0.833 -7.229*** 9.280 1.458 -1.534 -7.064***
𝑭𝑫𝑰 -1.255 -3.10 -5.206*** -3.661** -1.105 -3.00 -9.146*** -12.765***
𝑰𝒏𝒇 -1.615 -3.021 -7.213*** -7.351*** -2.060 -3.001 -8.347*** -10.564***
Note: *, **, *** represent 10%, 5% and 1% levels of significance respectively.
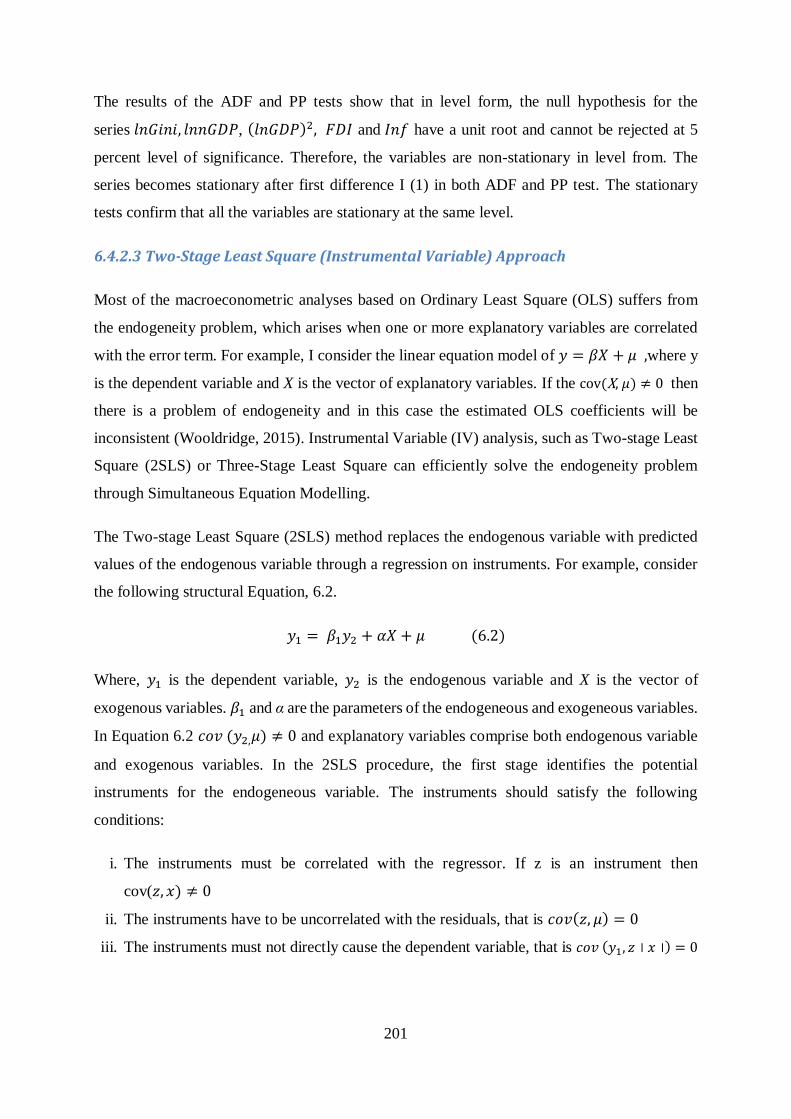
201
The results of the ADF and PP tests show that in level form, the null hypothesis for the
series 𝑙𝑛𝐺𝑖𝑛𝑖, 𝑙𝑛𝑛𝐺𝐷𝑃, (𝑙𝑛𝐺𝐷𝑃)2, 𝐹𝐷𝐼 and 𝐼𝑛𝑓 have a unit root and cannot be rejected at 5
percent level of significance. Therefore, the variables are non-stationary in level from. The
series becomes stationary after first difference I (1) in both ADF and PP test. The stationary
tests confirm that all the variables are stationary at the same level.
6.4.2.3 Two-Stage Least Square (Instrumental Variable) Approach
Most of the macroeconometric analyses based on Ordinary Least Square (OLS) suffers from
the endogeneity problem, which arises when one or more explanatory variables are correlated
with the error term. For example, I consider the linear equation model of 𝑦 = 𝛽𝑋 + 𝜇 ,where y
is the dependent variable and X is the vector of explanatory variables. If the cov(X, 𝜇) ≠ 0 then
there is a problem of endogeneity and in this case the estimated OLS coefficients will be
inconsistent (Wooldridge, 2015). Instrumental Variable (IV) analysis, such as Two-stage Least
Square (2SLS) or Three-Stage Least Square can efficiently solve the endogeneity problem
through Simultaneous Equation Modelling.
The Two-stage Least Square (2SLS) method replaces the endogenous variable with predicted
values of the endogenous variable through a regression on instruments. For example, consider
the following structural Equation, 6.2.
𝑦1 = 𝛽1𝑦2 + 𝛼𝑋 + 𝜇 (6.2)
Where, 𝑦1 is the dependent variable, 𝑦2 is the endogenous variable and X is the vector of
exogenous variables. 𝛽1 and α are the parameters of the endogeneous and exogeneous variables.
In Equation 6.2 𝑐𝑜𝑣 (𝑦2,𝜇) ≠ 0 and explanatory variables comprise both endogenous variable
and exogenous variables. In the 2SLS procedure, the first stage identifies the potential
instruments for the endogeneous variable. The instruments should satisfy the following
conditions:
i. The instruments must be correlated with the regressor. If z is an instrument then
cov(𝑧, 𝑥) ≠ 0
ii. The instruments have to be uncorrelated with the residuals, that is 𝑐𝑜𝑣(𝑧, 𝜇) = 0
iii. The instruments must not directly cause the dependent variable, that is 𝑐𝑜𝑣 (𝑦1, 𝑧 𝑥) = 0
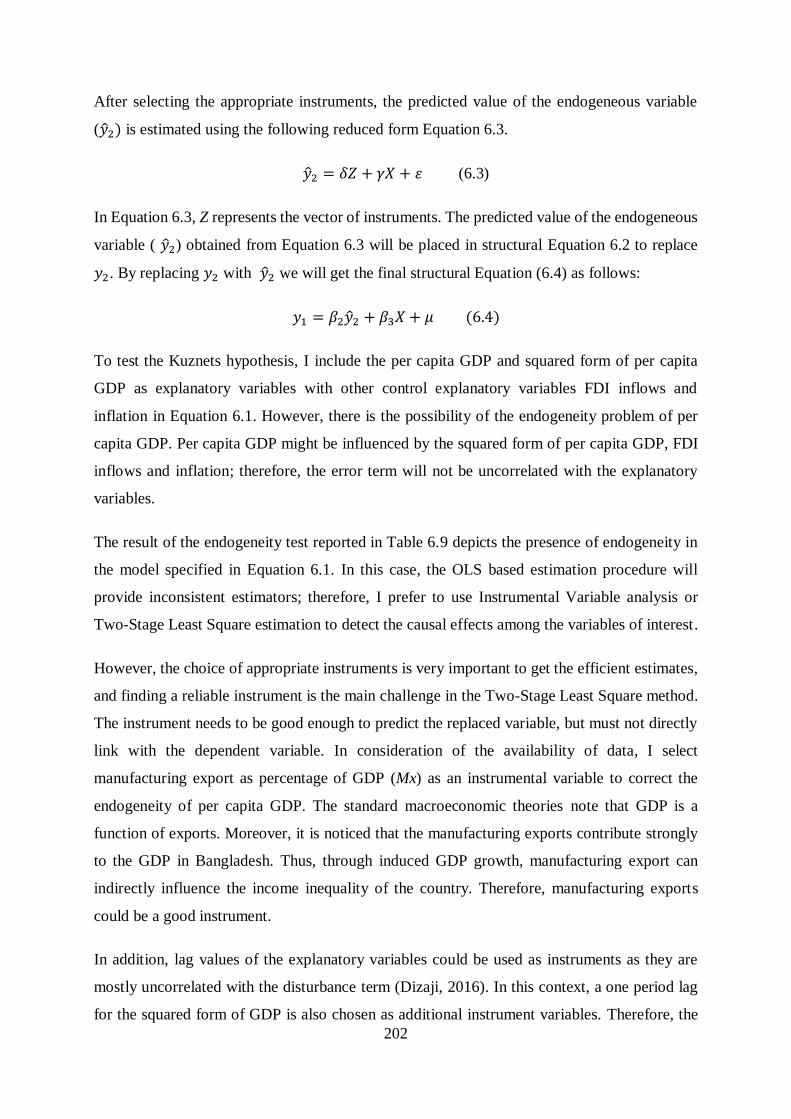
202
After selecting the appropriate instruments, the predicted value of the endogeneous variable
(��2) is estimated using the following reduced form Equation 6.3.
��2 = 𝛿𝑍 + 𝛾𝑋 + 휀 (6.3)
In Equation 6.3, Z represents the vector of instruments. The predicted value of the endogeneous
variable ( ��2) obtained from Equation 6.3 will be placed in structural Equation 6.2 to replace
𝑦2. By replacing 𝑦2 with ��2 we will get the final structural Equation (6.4) as follows:
𝑦1 = 𝛽2��2 + 𝛽3𝑋 + 𝜇 (6.4)
To test the Kuznets hypothesis, I include the per capita GDP and squared form of per capita
GDP as explanatory variables with other control explanatory variables FDI inflows and
inflation in Equation 6.1. However, there is the possibility of the endogeneity problem of per
capita GDP. Per capita GDP might be influenced by the squared form of per capita GDP, FDI
inflows and inflation; therefore, the error term will not be uncorrelated with the explanatory
variables.
The result of the endogeneity test reported in Table 6.9 depicts the presence of endogeneity in
the model specified in Equation 6.1. In this case, the OLS based estimation procedure will
provide inconsistent estimators; therefore, I prefer to use Instrumental Variable analysis or
Two-Stage Least Square estimation to detect the causal effects among the variables of interest.
However, the choice of appropriate instruments is very important to get the efficient estimates,
and finding a reliable instrument is the main challenge in the Two-Stage Least Square method.
The instrument needs to be good enough to predict the replaced variable, but must not directly
link with the dependent variable. In consideration of the availability of data, I select
manufacturing export as percentage of GDP (Mx) as an instrumental variable to correct the
endogeneity of per capita GDP. The standard macroeconomic theories note that GDP is a
function of exports. Moreover, it is noticed that the manufacturing exports contribute strongly
to the GDP in Bangladesh. Thus, through induced GDP growth, manufacturing export can
indirectly influence the income inequality of the country. Therefore, manufacturing exports
could be a good instrument.
In addition, lag values of the explanatory variables could be used as instruments as they are
mostly uncorrelated with the disturbance term (Dizaji, 2016). In this context, a one period lag
for the squared form of GDP is also chosen as additional instrument variables. Therefore, the
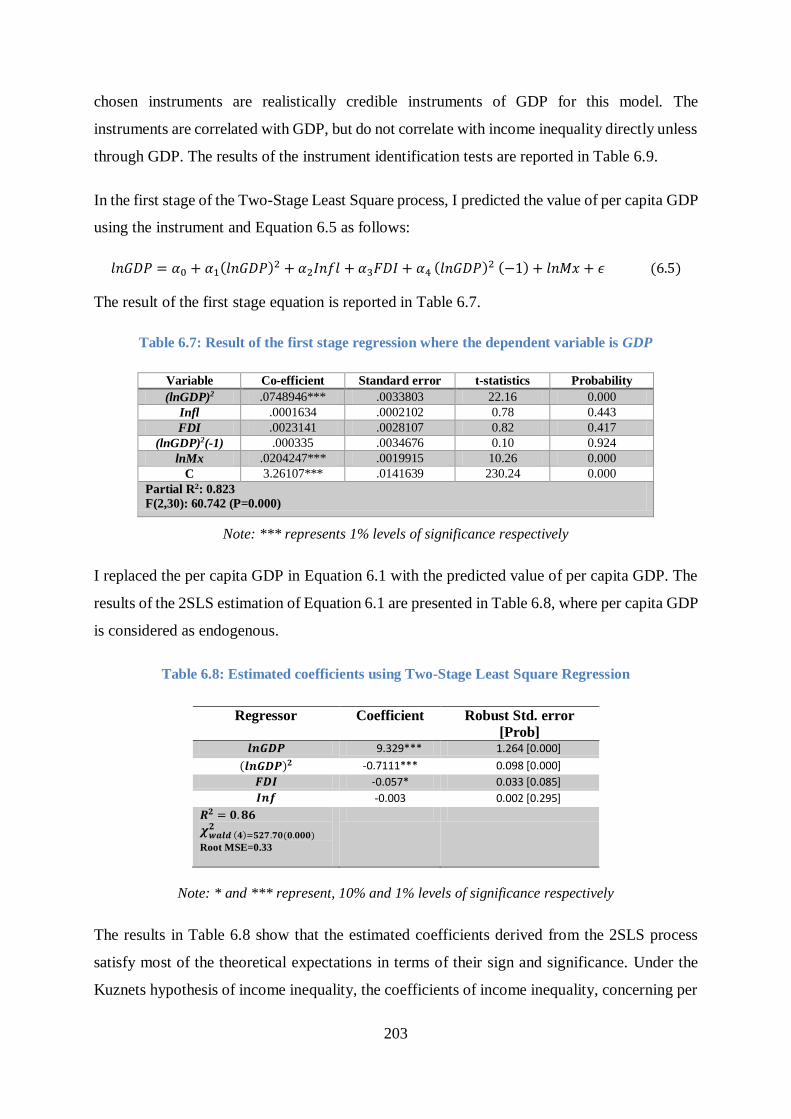
203
chosen instruments are realistically credible instruments of GDP for this model. The
instruments are correlated with GDP, but do not correlate with income inequality directly unless
through GDP. The results of the instrument identification tests are reported in Table 6.9.
In the first stage of the Two-Stage Least Square process, I predicted the value of per capita GDP
using the instrument and Equation 6.5 as follows:
𝑙𝑛𝐺𝐷𝑃 = 𝛼0 + 𝛼1(𝑙𝑛𝐺𝐷𝑃)2 + 𝛼2𝐼𝑛𝑓𝑙 + 𝛼3𝐹𝐷𝐼 + 𝛼4 (𝑙𝑛𝐺𝐷𝑃)2 (−1) + 𝑙𝑛𝑀𝑥 + 𝜖 (6.5)
The result of the first stage equation is reported in Table 6.7.
Table 6.7: Result of the first stage regression where the dependent variable is GDP
Variable Co-efficient Standard error t-statistics Probability
(lnGDP)2 .0748946*** .0033803 22.16 0.000
Infl .0001634 .0002102 0.78 0.443
FDI .0023141 .0028107 0.82 0.417
(lnGDP)2(-1) .000335 .0034676 0.10 0.924
lnMx .0204247*** .0019915 10.26 0.000
C 3.26107*** .0141639 230.24 0.000
Partial R2: 0.823 F(2,30): 60.742 (P=0.000)
Note: *** represents 1% levels of significance respectively
I replaced the per capita GDP in Equation 6.1 with the predicted value of per capita GDP. The
results of the 2SLS estimation of Equation 6.1 are presented in Table 6.8, where per capita GDP
is considered as endogenous.
Table 6.8: Estimated coefficients using Two-Stage Least Square Regression
Regressor Coefficient Robust Std. error
[Prob] 𝒍𝒏𝑮𝑫𝑷 9.329*** 1.264 [0.000]
(𝒍𝒏𝑮𝑫𝑷)𝟐 -0.7111*** 0.098 [0.000]
𝑭𝑫𝑰 -0.057* 0.033 [0.085]
𝑰𝒏𝒇 -0.003 0.002 [0.295]
𝑹𝟐 = 𝟎. 𝟖𝟔
𝝌𝒘𝒂𝒍𝒅 (𝟒)=𝟓𝟐𝟕.𝟕𝟎(𝟎.𝟎𝟎𝟎)𝟐
Root MSE=0.33
Note: * and *** represent, 10% and 1% levels of significance respectively
The results in Table 6.8 show that the estimated coefficients derived from the 2SLS process
satisfy most of the theoretical expectations in terms of their sign and significance. Under the
Kuznets hypothesis of income inequality, the coefficients of income inequality, concerning per
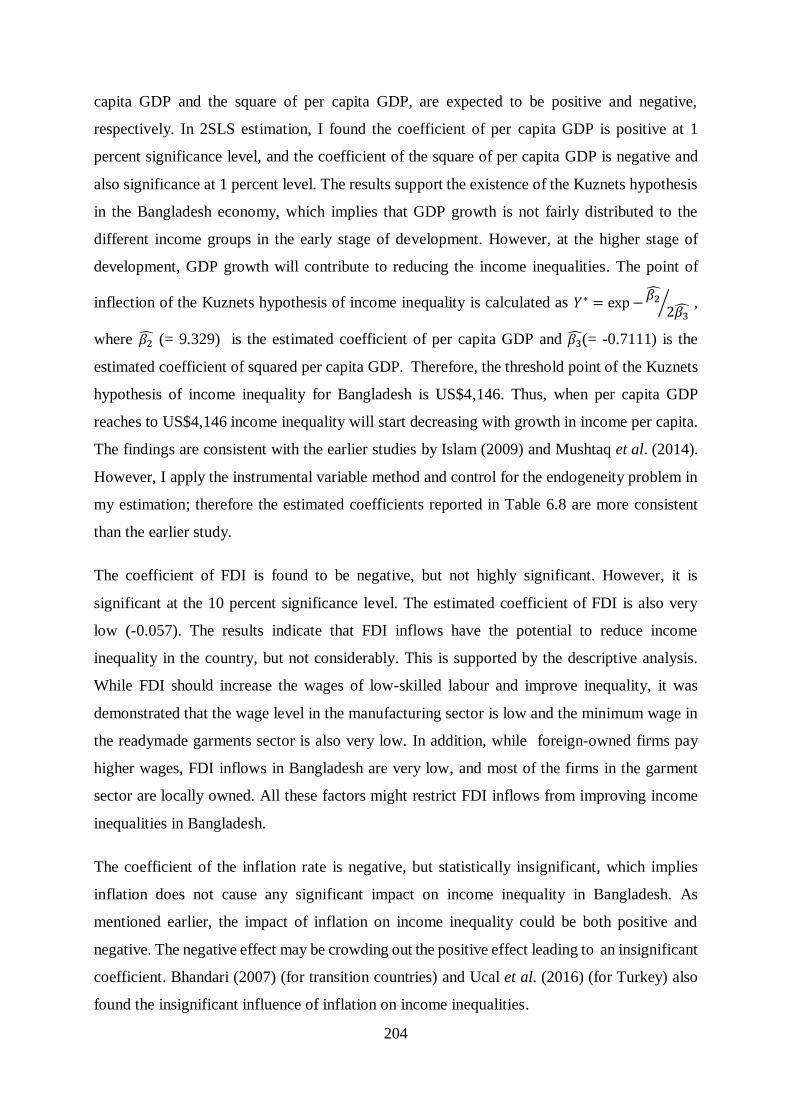
204
capita GDP and the square of per capita GDP, are expected to be positive and negative,
respectively. In 2SLS estimation, I found the coefficient of per capita GDP is positive at 1
percent significance level, and the coefficient of the square of per capita GDP is negative and
also significance at 1 percent level. The results support the existence of the Kuznets hypothesis
in the Bangladesh economy, which implies that GDP growth is not fairly distributed to the
different income groups in the early stage of development. However, at the higher stage of
development, GDP growth will contribute to reducing the income inequalities. The point of
inflection of the Kuznets hypothesis of income inequality is calculated as 𝑌∗ = exp −𝛽2
2𝛽3⁄ ,
where 𝛽2 (= 9.329) is the estimated coefficient of per capita GDP and 𝛽3(= -0.7111) is the
estimated coefficient of squared per capita GDP. Therefore, the threshold point of the Kuznets
hypothesis of income inequality for Bangladesh is US$4,146. Thus, when per capita GDP
reaches to US$4,146 income inequality will start decreasing with growth in income per capita.
The findings are consistent with the earlier studies by Islam (2009) and Mushtaq et al. (2014).
However, I apply the instrumental variable method and control for the endogeneity problem in
my estimation; therefore the estimated coefficients reported in Table 6.8 are more consistent
than the earlier study.
The coefficient of FDI is found to be negative, but not highly significant. However, it is
significant at the 10 percent significance level. The estimated coefficient of FDI is also very
low (-0.057). The results indicate that FDI inflows have the potential to reduce income
inequality in the country, but not considerably. This is supported by the descriptive analysis.
While FDI should increase the wages of low-skilled labour and improve inequality, it was
demonstrated that the wage level in the manufacturing sector is low and the minimum wage in
the readymade garments sector is also very low. In addition, while foreign-owned firms pay
higher wages, FDI inflows in Bangladesh are very low, and most of the firms in the garment
sector are locally owned. All these factors might restrict FDI inflows from improving income
inequalities in Bangladesh.
The coefficient of the inflation rate is negative, but statistically insignificant, which implies
inflation does not cause any significant impact on income inequality in Bangladesh. As
mentioned earlier, the impact of inflation on income inequality could be both positive and
negative. The negative effect may be crowding out the positive effect leading to an insignificant
coefficient. Bhandari (2007) (for transition countries) and Ucal et al. (2016) (for Turkey) also
found the insignificant influence of inflation on income inequalities.
205
6.4.3 Diagnostic check/ the validity of the model
It is essential to conduct an endogeneity test to justify the use of Instrumental Variable approach.
If the variables are exogenous, then Instrumental Variable method may not necessarily be
required. Table 6.9 represents the results of the diagnostic tests.
Table 6.9: Results of diagnostic tests
Diagnostic test Statistic Value [prob] Outcome
Endogeneity 𝜒𝐷𝑢𝑟𝑏𝑖𝑛2
𝐹𝑤−𝐻𝑎𝑢𝑠𝑚𝑎𝑛
6.669 [0.009]
16.532 [0.0003]
Endogeneity exist
Instrument
Identification tests
Over-identification 𝜒𝑜𝑣𝑒𝑟𝐼𝑑2 2.479 [0.1153] Not over-
identified
Weak Identification 𝑅2𝑃𝑎𝑟𝑡𝑖𝑎𝑙
𝐹𝑤𝑒𝑎𝑘𝐼𝑑
0.823
60.742 [0.000]
Not weak
In the endogeneity test, the probabilities associated with the Durbin Chi-square and W-
Hausman F statistics are less than 5 percent, which rejects the null hypothesis of the absence of
endogeneity. Therefore, the presence of endogeneity justifies using the Instrumental Variable
or Two-Stage Least Square approach for the estimation.
To achieve efficient and consistent estimates in the Instrumental Variable model, instruments
should be properly identified. Therefore, I also conducted over-identification and weak-
identification tests for the instruments. In the Sargan-Hansen test of over-identification, I find
that the probability value of the Sargan chi-square is greater than 0.1, which accepts the null
hypothesis - H0: the instruments are not over-identified.
In the weak identification test, I find that the partial R2 from the first stage regression is quite
high and the joint F statistic is much higher than the critical values, which rejects the null
hypothesis - H0: the instruments are weak (Bound et al., 1995). Large partial R2 and F statistic
values indicate that the instruments contribute substantially to the prediction of per capita GDP.
Therefore, the diagnostic tests of endogeneity and instrument identifications confirm that the
model and estimation process is valid, and the estimated results are consistent and efficient.

206
6.5 Corporate social responsibility (CSR) practised by MNEs in
Bangladesh
The Corporate Social Responsibility (CSR) of companies could play an important role in
achieving sustainable development goals in host countries. Clarke and Klettner (2007) note that
CSR activities are voluntarily pursued by enterprises for the benefit of ecosystems and
humanity, such as activities that improve human rights, or environmental protection. In the case
of the sustainability of the enterprises themselves, CSR has become a key agenda for MNEs as
it tends to promote positive attitudes amongst stakeholders, and especially buyers, towards the
companies, thus providing them with s a competitive advantage (Porter and Kramer, 2002 ;
Waddock and Graves, 1997). CSR is becoming an important issue in the developed countries
where most of the MNEs are located. It is assumed that as developed countries maintain a higher
level of environmental, labour and social standards, through CSR practices, MNEs will promote
better working conditions, corporate governance and high-level business ethics in the host
country.
On the other hand, instead of adopting a parent country's standard, the MNEs or their
subsidiaries may adopt host country's environmental, labour and social standards and reduce
their CSR involvement in the developing countries. The big retailers and brands have their own
codes of conduct and have signed many declarations and initiatives to retain customers’ faith
in their products (Locke and Romis, 2007).
Nevertheless, there is a continuous criticism that CSR is only on policy manuals, and not in
action. Global brands and MNEs are more concerned with their financial reputation, product
quality and profitability (Locke, 2013; Görg et al. 2018).
A large number of studies have been conducted on CSR practices in developed countries;
however, few have been carried out in respect of developing countries, particularly in
Bangladesh (Adams et al., 1998; Azim et al., 2009; Rahman Belal, 2001). Momin (2006)
examined the corporate social reporting (CSR) of large enterprises and the subsidiaries of the
multinationals in Bangladesh, and found MNEs do not mention anything specific about the
subsidiaries' CSR activities in Bangladesh or their CSR disclosure to the parent countries. The
study also compares the reporting style of the MNE’s subsidiaries and selected domestic
companies, and did not find any substantial differences between them. However, the average
volume of reporting is slightly higher in the MNE’s subsidiaries. Instead of following and
207
promoting the parent country’s higher standard, the subsidiaries of the multinationals operating
in Bangladesh disclose their environmental and social reporting at the standard of local
companies. The study also notes that subsidiaries do not report anything related to opportunity,
environmental audit, and environmental policy as their parent company does in the home
country.
In another study, Moyeen and Huq (2010) examined the CSR activities of selected MNEs
operating in Bangladesh and how the activities are aligned with their global commitment of
lifting social and environmental standards in developing countries. The study observed that a
good number of CSR programmes were either initiated or often operated by the parent company
to fulfil their global commitments. However, the study claimed that CSR activities of MNEs in
Bangladesh are somewhat piecemeal and do not focus on sustainability outcomes.
Masud et al. (2013) also conducted a study on the CSR activities of a multinational company
named Hop Lun (BD) Limited (fully Swedish-owned apparel company) located in the Dhaka
EPZ. The study found that the company operated its CSR on a limited scale. The issue of moral
obligation did not appear in most of the company’s CSR activities. The social responsibilities
were performed only to satisfy employees and buyers. The company is only treating employees,
shareholders, and government as stakeholders, while the broader community (the political,
environmental and social bodies and organisations and systems) are not considered or included
in the CSR activities of the company. However, minimum wage, work health safety and workers
welfare issues are properly maintained by the company. Thus, MNEs in Bangladesh have taken
some CSR initiatives to retain their brand image in the global market, but they are mostly
limited to employee's welfare. MNEs should extend their CSR practice in other social and
environmental areas, such as investment on ecological and environmentally friendly
technology, diffusion of technology, better corporate governance and poverty alleviation.
More importantly, although the foreign-owned firms and their subsidiaries maintained
relatively improved working conditions and higher CSR, in many cases, the subcontracting
local firms performed very poorly. The regular monitoring and supervision of the
subcontracting firms could improve the situation. In principle, CSR is a voluntary activity
adopted by the companies and is highly localised; however, the government should develop a
mechanism to monitor CSR adoption and performance of MNEs, as well as locally owned
companies. The government can also provide directions and specify priorities for CSR practice
to achieve sustainable development agendas in a coordinated way.
208
6.6 Conclusions
The growth of the FDI dominated export-led manufacturing sector, especially the textiles and
readymade garments industry, has been the driving force to sustain GDP growth in Bangladesh
over the last three decades. The manufacturing sector also makes a positive contribution to
employment generation. There has also been a gradual improvement in the poverty situation,
both in terms of the poverty gap and severity of the poverty, in Bangladesh. The growth in the
labour-intensive readymade garments sector contributes significantly to the improvement in
poverty in Bangladesh (GoB, 2015a ; UNDP, 2018); however, the low wage level and poor
working conditions in the FDI-backed manufacturing sectors create significant challenges
regarding the contribution of FDI inflows towards sustainable development in Bangladesh.
The descriptive analysis reveals that the unequal distribution of income throughout the global
value chain of the RMG products, intense competition among the subcontracting firms. The
fear of losing contracts, the weak bargaining power of the suppliers, the limited corporate social
responsibilities of the companies, weak linkages of MNEs with the subcontracting firms,
narrow profit margins of the suppliers, and wage flexibility due to high unemployment, are the
major causes for the poor wage levels and working conditions in the RMG industry in
Bangladesh. The government has the central responsibility for monitoring labour rights in the
country; however, MNEs can play an important role in this area by implementing their home
country’s codes of conduct and strengthening the supervision of their subsidiaries, as well as
subcontracting local firms
Income inequality in Bangladesh is deteriorating, but FDI is not the cause. The empirical
analysis shows that in the long-run, FDI inflows are not creating a negative impact on the
income distribution of the country. In contrast, FDI exerts a positive contribution to income
distribution. The findings of the empirical analysis also proves the existence of a Kuznets curve
relationship in Bangladesh. Per capita GDP growth initially increases income inequality. Thus,
the benefit of growth is not distributing equally; however, at the later stages of development,
this impact will fade out, and GDP will create a positive contribution to income distribution in
Bangladesh. The time period to reach the later stage of development is uncertain. Further,
growth at the expense of equity and justice is not acceptable, and it contradicts the aims of
sustainable development. While FDI is generally positive, the government should be cautious
in adopting growth and export-promoting strategies in Bangladesh.
209
CHAPTER 7: FDI, SUSTAINABILITY AND POLICY MOVING
FORWARD
7.1 Introduction
In this study, I investigate the impact of manufacturing FDI inflows on sustainable development
in Bangladesh. The concept of sustainability or sustainable development is a multidimensional,
interrelated and interdependent concept. The impact of FDI inflows on sustainable development
has a similar level of complexity. Based on the three dimensions of sustainable development
and considering the complexity of the topic, I have broken down the analysis into three parts:
the impacts of FDI inflows on economic sustainability; the impacts of FDI inflows on
environmental sustainability; and the impacts of FDI inflows on social sustainability. However,
given that the three dimensions of sustainable development are interrelated, I synthesise the
findings of the analysis of each dimension to get an integrated picture of the impacts of FDI
inflows on sustainable development in Bangladesh. Further, I provide policy suggestions to
unlock the potential for FDI inflows in achieving sustainable development.
7.2 FDI and sustainable development in Bangladesh: key
contributions, potentialities, and challenges
FDI inflows have the potential to generate both positive and negative impacts on all three
dimensions of sustainable development, and it is not possible to isolate the impact of FDI
inflows on one dimension without considering others. Therefore, a combined, integrated
approach of analysis is indispensable for assessing the impact of FDI inflows on sustainable
development.
Moreover, appropriate policy strategies are essential to drive the FDI inflows towards
sustainable development and maximise its positive potentialities, and minimise its adverse
effects. Any government policies should consider wider, integrated dimensions of sustainable
development and connect the economy, environment, and society. To develop an integrated
framework, Table 7.1 summarises the main findings of the thesis in the context of the major
210
channels for FDI inflows to contribute to sustainable development in Bangladesh, the
potentialities yet to be realised, and the major challenges in realising the potentialities of FDI
inflows. This is an integrated approach in the sense that some of the realisations in the economic
dimension can be discussed as lacking in their potential to also achieve environmental and social
objectives and vice versa. For example, in the economic dimension, FDI may create structural
change but there is potential for FDI to create a green-technology driven structural change (see
row 3 of Table 7.1).
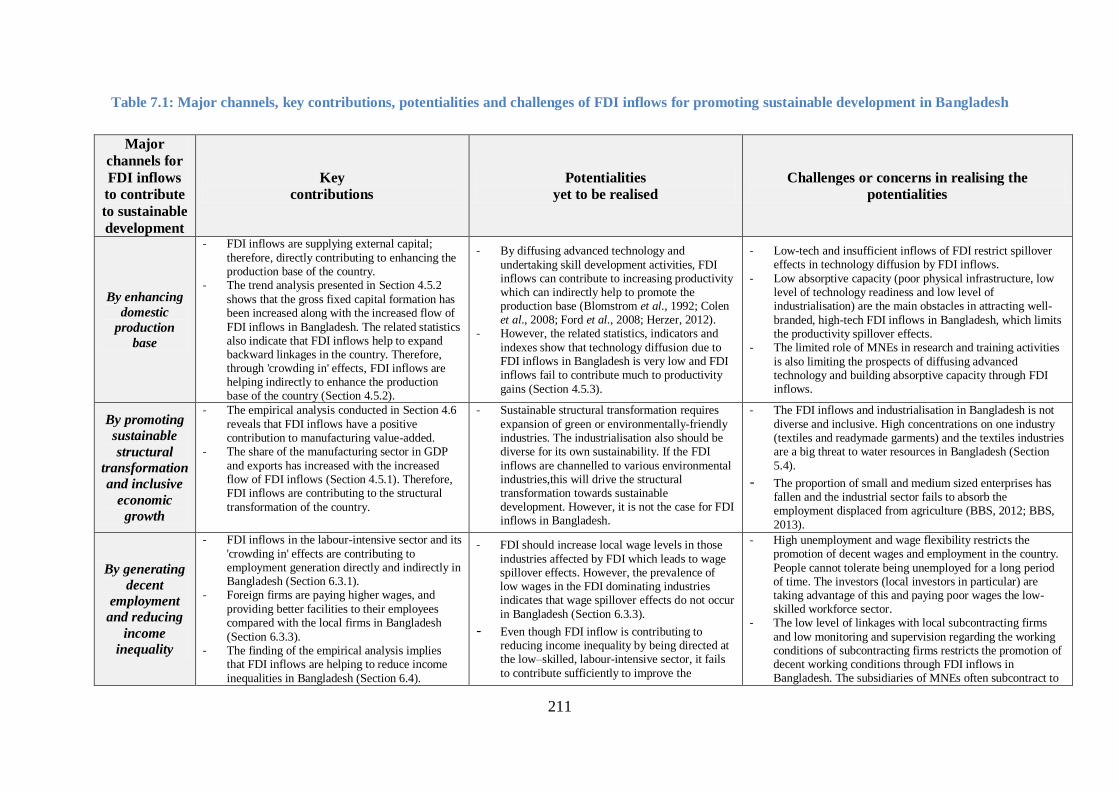
211
Table 7.1: Major channels, key contributions, potentialities and challenges of FDI inflows for promoting sustainable development in Bangladesh
Major
channels for
FDI inflows
to contribute
to sustainable
development
Key
contributions
Potentialities
yet to be realised
Challenges or concerns in realising the
potentialities
By enhancing
domestic
production
base
- FDI inflows are supplying external capital;
therefore, directly contributing to enhancing the production base of the country.
- The trend analysis presented in Section 4.5.2
shows that the gross fixed capital formation has been increased along with the increased flow of
FDI inflows in Bangladesh. The related statistics also indicate that FDI inflows help to expand backward linkages in the country. Therefore, through 'crowding in' effects, FDI inflows are helping indirectly to enhance the production base of the country (Section 4.5.2).
- By diffusing advanced technology and
undertaking skill development activities, FDI inflows can contribute to increasing productivity which can indirectly help to promote the production base (Blomstrom et al., 1992; Colen et al., 2008; Ford et al., 2008; Herzer, 2012).
- However, the related statistics, indicators and
indexes show that technology diffusion due to FDI inflows in Bangladesh is very low and FDI inflows fail to contribute much to productivity
gains (Section 4.5.3).
- Low-tech and insufficient inflows of FDI restrict spillover effects in technology diffusion by FDI inflows.
- Low absorptive capacity (poor physical infrastructure, low level of technology readiness and low level of industrialisation) are the main obstacles in attracting well-
branded, high-tech FDI inflows in Bangladesh, which limits the productivity spillover effects.
- The limited role of MNEs in research and training activities
is also limiting the prospects of diffusing advanced technology and building absorptive capacity through FDI inflows.
By promoting
sustainable
structural
transformation
and inclusive
economic
growth
- The empirical analysis conducted in Section 4.6
reveals that FDI inflows have a positive contribution to manufacturing value-added.
- The share of the manufacturing sector in GDP
and exports has increased with the increased flow of FDI inflows (Section 4.5.1). Therefore, FDI inflows are contributing to the structural
transformation of the country.
- Sustainable structural transformation requires
expansion of green or environmentally-friendly industries. The industrialisation also should be diverse for its own sustainability. If the FDI
inflows are channelled to various environmental industries,this will drive the structural transformation towards sustainable development. However, it is not the case for FDI inflows in Bangladesh.
- The FDI inflows and industrialisation in Bangladesh is not
diverse and inclusive. High concentrations on one industry (textiles and readymade garments) and the textiles industries are a big threat to water resources in Bangladesh (Section
5.4).
- The proportion of small and medium sized enterprises has fallen and the industrial sector fails to absorb the employment displaced from agriculture (BBS, 2012; BBS,
2013).
By generating
decent
employment
and reducing
income
inequality
- FDI inflows in the labour-intensive sector and its
'crowding in' effects are contributing to employment generation directly and indirectly in Bangladesh (Section 6.3.1).
- Foreign firms are paying higher wages, and
providing better facilities to their employees compared with the local firms in Bangladesh
(Section 6.3.3). - The finding of the empirical analysis implies
that FDI inflows are helping to reduce income
inequalities in Bangladesh (Section 6.4).
- FDI should increase local wage levels in those
industries affected by FDI which leads to wage spillover effects. However, the prevalence of low wages in the FDI dominating industries indicates that wage spillover effects do not occur
in Bangladesh (Section 6.3.3).
- Even though FDI inflow is contributing to reducing income inequality by being directed at the low–skilled, labour-intensive sector, it fails
to contribute sufficiently to improve the
- High unemployment and wage flexibility restricts the promotion of decent wages and employment in the country.
People cannot tolerate being unemployed for a long period of time. The investors (local investors in particular) are taking advantage of this and paying poor wages the low-skilled workforce sector.
- The low level of linkages with local subcontracting firms
and low monitoring and supervision regarding the working conditions of subcontracting firms restricts the promotion of decent working conditions through FDI inflows in Bangladesh. The subsidiaries of MNEs often subcontract to
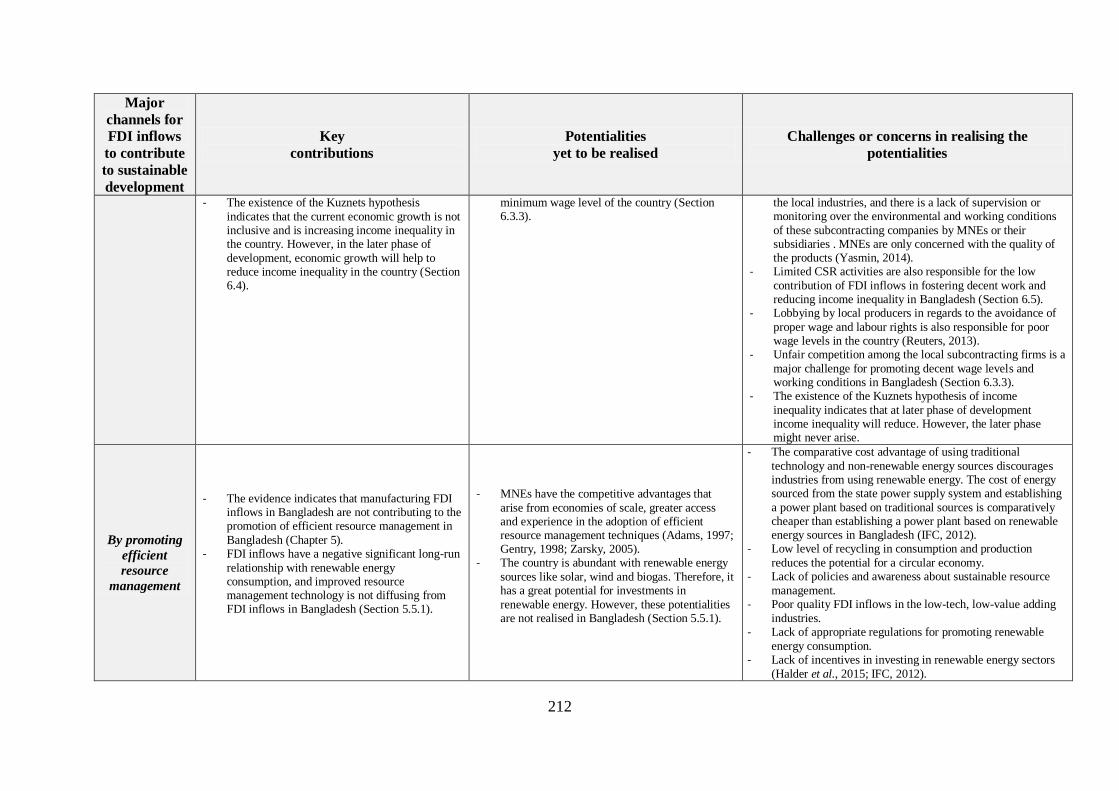
212
Major
channels for
FDI inflows
to contribute
to sustainable
development
Key
contributions
Potentialities
yet to be realised
Challenges or concerns in realising the
potentialities
- The existence of the Kuznets hypothesis
indicates that the current economic growth is not inclusive and is increasing income inequality in the country. However, in the later phase of
development, economic growth will help to reduce income inequality in the country (Section 6.4).
minimum wage level of the country (Section 6.3.3).
the local industries, and there is a lack of supervision or monitoring over the environmental and working conditions
of these subcontracting companies by MNEs or their subsidiaries . MNEs are only concerned with the quality of the products (Yasmin, 2014).
- Limited CSR activities are also responsible for the low
contribution of FDI inflows in fostering decent work and reducing income inequality in Bangladesh (Section 6.5).
- Lobbying by local producers in regards to the avoidance of
proper wage and labour rights is also responsible for poor wage levels in the country (Reuters, 2013).
- Unfair competition among the local subcontracting firms is a
major challenge for promoting decent wage levels and working conditions in Bangladesh (Section 6.3.3).
- The existence of the Kuznets hypothesis of income
inequality indicates that at later phase of development income inequality will reduce. However, the later phase might never arise.
By promoting
efficient
resource
management
- The evidence indicates that manufacturing FDI inflows in Bangladesh are not contributing to the promotion of efficient resource management in
Bangladesh (Chapter 5). - FDI inflows have a negative significant long-run
relationship with renewable energy consumption, and improved resource management technology is not diffusing from FDI inflows in Bangladesh (Section 5.5.1).
- MNEs have the competitive advantages that
arise from economies of scale, greater access and experience in the adoption of efficient resource management techniques (Adams, 1997; Gentry, 1998; Zarsky, 2005).
- The country is abundant with renewable energy
sources like solar, wind and biogas. Therefore, it has a great potential for investments in
renewable energy. However, these potentialities are not realised in Bangladesh (Section 5.5.1).
- The comparative cost advantage of using traditional
technology and non-renewable energy sources discourages industries from using renewable energy. The cost of energy sourced from the state power supply system and establishing
a power plant based on traditional sources is comparatively cheaper than establishing a power plant based on renewable energy sources in Bangladesh (IFC, 2012).
- Low level of recycling in consumption and production
reduces the potential for a circular economy. - Lack of policies and awareness about sustainable resource
management. - Poor quality FDI inflows in the low-tech, low-value adding
industries. - Lack of appropriate regulations for promoting renewable
energy consumption. - Lack of incentives in investing in renewable energy sectors
(Halder et al., 2015; IFC, 2012).
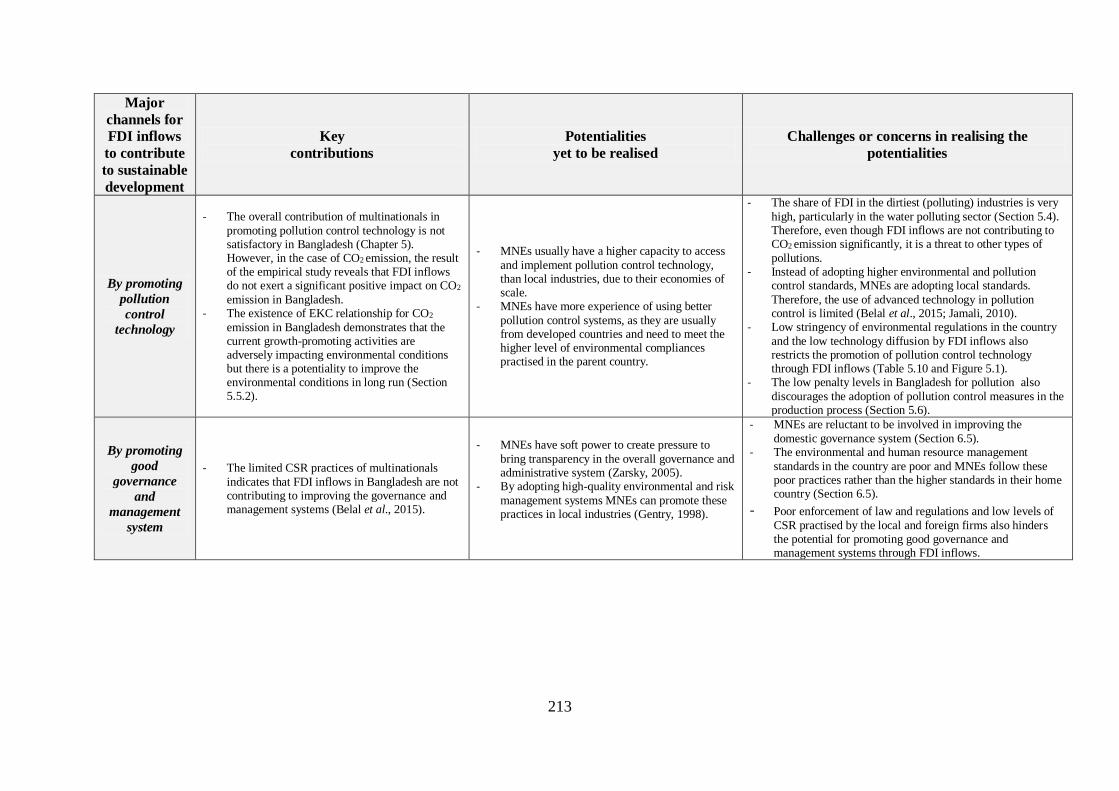
213
Major
channels for
FDI inflows
to contribute
to sustainable
development
Key
contributions
Potentialities
yet to be realised
Challenges or concerns in realising the
potentialities
By promoting
pollution
control
technology
- The overall contribution of multinationals in
promoting pollution control technology is not satisfactory in Bangladesh (Chapter 5). However, in the case of CO2 emission, the result of the empirical study reveals that FDI inflows do not exert a significant positive impact on CO2
emission in Bangladesh. - The existence of EKC relationship for CO2
emission in Bangladesh demonstrates that the current growth-promoting activities are adversely impacting environmental conditions but there is a potentiality to improve the environmental conditions in long run (Section 5.5.2).
- MNEs usually have a higher capacity to access
and implement pollution control technology, than local industries, due to their economies of scale.
- MNEs have more experience of using better
pollution control systems, as they are usually from developed countries and need to meet the higher level of environmental compliances practised in the parent country.
- The share of FDI in the dirtiest (polluting) industries is very
high, particularly in the water polluting sector (Section 5.4). Therefore, even though FDI inflows are not contributing to CO2 emission significantly, it is a threat to other types of
pollutions. - Instead of adopting higher environmental and pollution
control standards, MNEs are adopting local standards.
Therefore, the use of advanced technology in pollution control is limited (Belal et al., 2015; Jamali, 2010).
- Low stringency of environmental regulations in the country
and the low technology diffusion by FDI inflows also restricts the promotion of pollution control technology through FDI inflows (Table 5.10 and Figure 5.1).
- The low penalty levels in Bangladesh for pollution also
discourages the adoption of pollution control measures in the production process (Section 5.6).
By promoting
good
governance
and
management
system
- The limited CSR practices of multinationals
indicates that FDI inflows in Bangladesh are not contributing to improving the governance and management systems (Belal et al., 2015).
- MNEs have soft power to create pressure to
bring transparency in the overall governance and administrative system (Zarsky, 2005).
- By adopting high-quality environmental and risk
management systems MNEs can promote these practices in local industries (Gentry, 1998).
- MNEs are reluctant to be involved in improving the
domestic governance system (Section 6.5). - The environmental and human resource management
standards in the country are poor and MNEs follow these poor practices rather than the higher standards in their home country (Section 6.5).
- Poor enforcement of law and regulations and low levels of
CSR practised by the local and foreign firms also hinders the potential for promoting good governance and management systems through FDI inflows.
214
Table 7.1 demonstrates that FDI inflows have the potential to contribute to sustainable
development in the host economy. However, the main aims of promoting FDI inflows, such as
the transference and diffusion of advanced technology, increased productivity and efficiency,
the fostering of environmentally friendly technology, and the practising of improved CSR
activities, are not realised in Bangladesh. Table 7.1 also identifies challenges and concerns in
realising the potentialities of FDI inflows towards sustainable development. Appropriate
government policy decisions can help to overcome the challenges and unlock the potentials of
FDI inflows towards achieving sustainable development conditions. Section 7.3 provides policy
recommendations to drive FDI inflows towards sustainable development in Bangladesh.
7.3 Policy directions
Sustainable development requires specific and deliberate policy interventions and an effective
regulatory system. The theoretical and empirical evidence outlined in Chapter 3 demonstrates
that while FDI inflows have potentiality, they are not a miracle solution in the advancement of
sustainable development. To reap the potential benefits of FDI inflows requires favourable
conditions in the host economy, such as a certain level of economic, human and technical
development, the appropriate policy settings and a strong institutional and regulatory
environment. The realisation of the positive contribution of FDI inflows in promoting
sustainable development also depends on mobilising the right kind of FDI inflows in the
country.
The challenges identified in Table 7.1 towards realising the positive benefits of FDI inflows in
the advancement of sustainable development in Bangladesh are mostly associated with
attracting good quality FDI inflows, the capabilities of the country to reap the spillover benefits
of FDI inflows and the governing and regulation of FDI inflows for sustainable development.
The adoption and implementation of proper initiatives and policy strategies can minimise the
adverse effects, and maximise the benefits of FDI inflows. Based on the findings of this study
and earlier literature on sustainable development and FDI inflows, policy suggestions are
provided below to steer FDI inflows towards sustainable development in Bangladesh.
7.3.1 Policy suggestions in regards to attracting FDI inflows
Limitations in the quantity and quality of FDI inflows is a challenge for creating sufficient
spillover effects through FDI inflows in Bangladesh. The amount of FDI inflows in Bangladesh
is very low, and the quality of FDI inflows is also poor and concentrated in a few low value-
215
adding, labour-intensive industries (see Section 4.4.2). The country must build a conducive
business climate, particularly regarding the development of infrastructure facilities, to
encourage good quality investment in the country.
A well-developed investment climate, particularly physical infrastructure facilities, is vital for
attracting good quality FDI (UNCTAD, 2008). Infrastructure facilities (such as good
transportation, port facilities, telecommunication and networking, internet facilities, water
supply, electrical systems) provide basic structural arrangements for production and marketing
products and reducing the cost of business (Wheeler and Mody, 1992). In Bangladesh, poor
infrastructure facilities, particularly the shortage of energy supply, absence of a modern, deep
seaport, and congested roads with high traffic, are major impediments to attract good quality
investment (UNCTAD, 2013).
However, the poor infrastructure facilities also offers an opportunity for channelling FDI into
this sector. Bangladesh should encourage foreign investment in physical infrastructure, such as
the construction of highways, bridges, railway networks, power plants and upgrading the port
facilities. Developed infrastructure not only encourages foreign investment, but it also
stimulates local investment in other sectors and industries. However, a lot of preliminary work
has to be done for this to occur. The initial return from the investment of this sector is low.
Moreover, high externalities and technical and legal complexities, such as land acquisition, are
associated with these types of investment (OECD, 2015). The government can promote FDI
inflows in infrastructure development projects through public-private-partnerships. The long-
term return on investment in infrastructure projects is high, and it is beneficial for long-run
sustainable development due to the high spillover effects to other sectors (UNCTAD, 2014).
Infrastructure development is crucial for promoting FDI inflows, but it requires a long lead-
time. Therefore, along with overall infrastructure development, to attract high value-adding FDI
inflows, the country should focus on building Special Economic Zones; Export Processing
Zones; industrial parks and technology parks. These are becoming popular and successful
globally for attracting targeted FDI inflows, employment and export diversification. Zeng
(2010) estimates that Special Economic Zones and industrial parks contributed to attracting
nearly half of the FDI inflows in China. Export Processing Zones have also become successful
in export diversification and economic growth in Mauritius, Malaysia and Sri Lanka (Johansson
and Nilsson, 1997).
216
The statistical evidence provided in Chapter 4 indicates that Bangladesh is far behind in terms
of innovation and technological progress. The initiatives of high-tech and industrial parks could
help in improving and expanding technologically advanced, high value-adding industries. Lall
(2000) found that Special Economic Zones played a vital role in industrial and technological
transformation in Taiwan, Malaysia, South Korea, and the Philippines.
Recognising the lack of basic infrastructure, and to create a conducive investment climate for
attracting specialised high-tech industries, the government has already taken initiatives to
establish Special Economic Zones and high-tech parks. Special Economic Zones create
facilities for encouraging investment in high technology and knowledge-based industries in the
country. The government should continue this initiative and build more Specialized Economic
Zones and technology parks in different parts of the country. Skill development activities are
also required for ensuring an adequate supply of sufficient labourers for the specialised
industries.
Further, the renewable energy sector could be a promising sector for sustainable FDI inflows in
Bangladesh. The discussion of Section 5.5.1.7 reveals that Bangladesh is suffering from energy
shortages. The energy crisis is one of the main impediments for both local and foreign
investment in the industrial sector in Bangladesh (IFC, 2012). Presently, electricity and natural
gas are the main sources of energy in Bangladesh. Electricity is generated mostly from natural
gas; however, the reserves of natural gas are gradually decreasing. Bangladesh has a natural
geographical advantage and potential to utilise renewable energy sources, particularly solar
energy.
The empirical evidence in Chapter 5 shows that current FDI inflows in Bangladesh are not
helping to promote renewable energy. Relatively high costs of establishing a captive power
plant from renewable energy sources, compared with the establishment of a power plant from
subsidised traditional energy sources (IFC, 2012), lack of technological knowledge in
renewable energy production, insufficient research and laboratory facilities, and the lack of
proper incentives are the main challenges in promoting renewable energy use in Bangladesh.
Bangladesh can encourage FDI inflows in the renewable energy sector by providing financial
incentives.
217
Bangladesh also needs to continue its initiatives for attracting labour-intensive FDI inflows to
generate employment for the huge and growing unemployed labour force. However, the
majority of the labour-intensive manufacturing FDI inflows are concentrated in the polluting
industries; the textiles industry is a particular concern as it is the major cause of water pollution
in rivers and waterways in Bangladesh (see Chapter 5). Given that the readymade garment and
textiles industry is saturated, Bangladesh should discourage FDI inflows in the textiles industry.
In contrast, Bangladesh should take initiatives to encourage FDI in other industries which have
the potential for large scale employment generation such as food processing, automobiles, and
electronic goods, which are relatively less polluting.
7.3.2 Policy suggestions in regards to strengthening domestic absorptive
capabilities
Strengthening absorptive capabilities is an essential condition to reap the benefits of spillover
effects of FDI inflows. There is a strong interlinkage between domestic technological capability,
technology transfer, and investment inflows (Blomström and Kokko, 2003; Borensztein et al.,
1998). The acceleration of advanced technology diffusion is the most desirable and important
channel for FDI inflows to effectively contribute to the sustainable development efforts of a
country. FDI provides a package for technology diffusion by combining technical know-how,
equipment, management, market access and other skills. However, only good quality and high
value-adding FDI inflows can generate a high level of technological diffusion.
The composition of FDI inflows in Bangladesh demonstrates that the country fails to attract
high-quality manufacturing FDI inflows and, as such, technological diffusion is very low (see
Figure 5.1). Higher quality FDI cannot be attracted if the local economy is not able to offer a
high level of complementary skills and technological efforts. High-tech technology requires a
next-generation, dynamic, efficient workforce who are equipped with advanced knowledge and
have the ability to adapt quickly with the dynamic globalised market (Lall, 1993). Quality
education with technical expertise can assist in providing this dynamic workforce.
As a developing country, Bangladesh has a lack of technical graduates and facilities for skill
development, such as training centres, laboratories, and technical institutions. FDI can
indirectly help to build up this capacity through the demonstration of new technological
processes. However, foreign investors cannot themselves create a skilled workforce (Lall,
1993). Therefore, the Bangladesh government should focus on human capacity building
218
activities, such as the expansion of technical education, establishing technical institutions, and
building training and research centres.
In addition to the skilled workforce, other complementary institutional facilities, such as
standard laboratories, research centres and support institutions is required to attract
sophisticated high-tech FDI. Moreover, for efficient utilisation of transferred technology and
further improvement of the technology, the host country must have a certain level of
technological readiness: the cost of absorbing and deploying new technology will be higher if
local technological capabilities are weak.
The careful selection of desirable projects for investment, and identifying the associated adverse
impact, is necessary for sustainability. Projects or investment, which have high potential to
generate more economic, environmental and social benefits and can minimise the adverse
effects, require expertise in project assessment and selection. The quality of the project
appraisal, including the environmental impact assessment, is very low in Bangladesh (see
Section 5.6). In most cases, the feasibility study for projects, and the environmental impact
assessment, is conducted only to meet the basic requirements of the approval process. The
implementation of the feasibility study and compliance with the directions given in the
environmental impact assessment is poor (Haque, 2017) Therefore, necessary training and skill-
building initiatives to strengthen the project appraisal capacity of the related agencies, as well
as the proper enforcement of the compliances, is urgently needed to drive projects and
investment towards sustainable development.
7.3.3 Policy suggestions in regards to governance, institutional and regulatory
mechanisms for FDI inflows
Good governance is a key prerequisite for achieving sustainability. As business is profit-driven,
a strong and efficient regulatory and governance system is needed to drive activities towards
projects that also enhance social and environmental goals. Unfortunately, a poor governance
system is a challenge for Bangladesh (UNCTAD, 2013; UNIDO, 2018a). To promote justice,
the governance system should be transparent, accountable and free of corruption. Corruption
and administrative inefficiency generate extra expense in business operations and cause a
decline in the profitability of the investment. The presence of high corruption and weak
institutional capacity gives some companies the opportunity to exploit Bangladesh’s natural and
human resources. Sustainable development is also a very complex and transformative concept;
219
therefore, the governing system should also be dynamic and adaptive and engage all
stakeholders.
Proper enforcement of regulations and laws is the precondition of good governance. The
stringency of environmental protection laws and their enforcement is very low in Bangladesh
(World Bank, 2018b). Environmental pollution and destruction are increasing at an alarming
rate due to unsustainable activities (see Chapter 5). In most cases, penalties are very low
compared with the gravity of the offence, and also compared with the cost of compliance
measures. The capacity of the regulatory authority to inspect, monitor and enforce
environmental rules and regulations is also very poor, in terms of manpower, technical expertise
and facilities (see Section 5.6).
The presence of high-level corruption and unlawful influence also limits the enforcement of
environmental laws and regulations in the country. Therefore, to protect the destruction of the
environment from industrial activities, the government needs to undertake necessary initiatives
for increasing the size of the penalties for violating environmental regulations; ensuring proper
and regular monitoring, inspection and enforcement of environmental regulations;
strengthening the capacity of the regulatory agency; and addressing corruption.
Fixing a decent minimum wage level for all sectors and the proper enforcement of labour rights
are critical to establish justice and protect the labour force from exploitation, as required by the
equality and justice aspects of sustainable development. Therefore, along with employment
creation and income generation, protection for the basic rights of workers is vital. Bangladesh
does not have a minimum wage for most sectors. After some recent crises, the government fixed
a minimum wage for the readymade garments industry; however, it is still very low compared
with the real wages of other south Asian countries (Figure 6.5). This study also shows that
industrial working conditions are very poor and other labour rights are badly violated in
Bangladesh (see Section 6.3.3). Although wages in foreign firms and working conditions are
more favourable than local firms, minimum wage laws are needed for all sectors as well as
strictly enforced labour rights to establish justice and equality.
In addition to formal governance, an informal oversight system is also helpful and effective for
the promotion of sustainable development. Sustainable development requires a holistic multi-
stakeholder approach where governments, the business community, international agencies, civil
societies, NGOs, and the community are all involved. For example, when the community itself
220
practices sustainable consumption it not only helps to reduce waste and natural resource use,
but it can also force investors and the business community to adopt sustainable production and
marketing. Civil society and NGOs can also play a complementary role in building
sustainability awareness (White, 1999), as they can undertake the monitoring and oversight role
of the government in promoting a sustainable business practice. Newell (2001) notes that 'civil
regulations' can play an important role in increasing environmental disclosure by companies,
compliance with the codes of business, and reduced adverse environmental impacts of the
business. The author also says that the increasing importance of some NGOs (such as
‘Corporate Watch' and ‘Oil Watch') has made impacts on the environmental and social
performances of multinational enterprises.
7.4 Conclusion
The chapter synthesises the findings of the impacts of manufacturing FDI inflows on economic,
environmental and social sustainability in Bangladesh, described in Chapters 4, 5 and 6,
respectively, to get a complete picture of the impact of FDI inflows on overall sustainable
development in Bangladesh. The findings indicate that in terms of economic and social
sustainability, FDI inflows are generally positive. FDI inflows are contributing positively to
economic growth, structural transformation, export earning, employment creation and poverty
reduction, through both direct and indirect effects. However, the spillover effects of FDI
inflows, particularly in technological advancement and innovation is not realised in Bangladesh.
This is crucial in order to drive economic development towards sustainable development.
In terms of environmental sustainability, the impact of FDI inflows is not positive; rather it is
negative and destructive, particularly of water resources in Bangladesh. In this chapter, I also
identify the challenges of realising the positive benefits of FDI inflows for sustainable
development including: the limited and low value-adding FDI inflows; poor governance and
weak institutional systems, poor infrastructure and business facilities, weak domestic absorbing
capacity and technological readiness; and poor corporate attitudes. A set of policy suggestions
is also offered to overcome the challenges and drive the FDI inflows towards sustainable
development.
221
CHAPTER 8: CONCLUSIONS
8.1 Introduction
This chapter provides an overview of the study, limitations of the study and directions for future
research. The overarching Research Question explored in this study is whether manufacturing
FDI inflows are assisting or hindering sustainable development in Bangladesh. Considering the
complexity and multidimensional issues of the topic, the main Research Question has been
broken down into three Research Questions, each of which is based on the three dimensions of
sustainable development. Research Question One asks whether manufacturing FDI inflows are
contributing to economic sustainability in Bangladesh. Research Question Two asks whether
manufacturing FDI inflows are contributing to environmental sustainability in Bangladesh and
Research Question Three asks whether manufacturing FDI inflows are contributing to social
sustainability in Bangladesh.
The following section of this chapter 8.2 provides an overview of the earlier chapters with key
findings. Subsequently, Section 8.3 outlines the theoretical contributions and policy
implications of the study. Finally, section 8.4 discusses the limitations of the study and suggests
future research directions.
8.2 Review and summary of the key findings
This study was a comprehensive analysis of the effects of manufacturing FDI inflows on
sustainable development in Bangladesh. The chapters are designed and developed to explore
and analyse the research topic and related research questions.
The first chapter introduces the thesis topic and provides a background and motivation to
explore the research questions. Since the 1990s, Bangladesh has undergone large-scale
environmental degradation, including a sharp increase in the level of pollution, depletion of
natural resources, and loss of biodiversity. Along with large-scale climate change, the world
faces social challenges, such as the growing patterns of inequality, poverty and hunger.
Therefore, traditional development thinking has been shifting toward sustainable development.
222
Sustainable development places environmental protection and social improvement on the same
footing as economic development. The United Nations declared Agenda 2030 in September
2015, whereby 17 Sustainable Development Goals (SDGs) were adopted to be achieved by
2030. All of the signatory nations are committed to achieving the SDGs; however, a huge
investment is required to do so. Developing countries are already suffering from insufficient
resources to achieve their own development agendas; therefore, implementing SDGs would
only be an extra burden.
Considering resource limitations, the UNCTAD (the main UN body dealing with trade,
investment and development issues) is continuously advocating channelling more FDI inflows
to developing countries, particularly in the SDG sectors. FDI inflows not only supply capital to
the capital scare countries, but they are also the primary vehicle of supplying advanced
technology and management systems from developed to developing countries.
However, FDI inflows can have dramatically different impacts – both positive and negative –
on the three basic pillars of sustainable development. The impacts of FDI inflows depend on
the type of FDI, the sector where it is channelling, the role of multinational enterprises and the
absorptive capacity of the host country. The formulation and implementation of appropriate
policies are indispensable for realising the benefits of FDI inflows and driving it towards
sustainable development. Therefore, comprehensive case studies are needed to analyse the
impact of FDI inflows towards achieving the sustainable development goals of different
countries.
There has been a rising trend of FDI inflows in both developed and developing countries since
the 1980s. Bangladesh, in particular, has a strong commitment to achieve the SDGs targets.
Considering the low resource and technological base, high demand for creating employment for
the growing labour force, and urgent need to improve the quality of the product and production
processes, the government of Bangladesh is trying to attract more FDI inflows to the export-
oriented manufacturing sector, in particular. As a result, FDI inflows have been increasing in
Bangladesh, and the manufacturing sector holds the major share (particularly the readymade
and textiles industry). With this knowledge, in this study, I conducted a comprehensive analysis
to explore if FDI inflows in the export-oriented manufacturing sector are assisting or hindering
the achievement of sustainable development targets in Bangladesh.

223
Chapter 2 describes the two central concepts of the topic, sustainable development and foreign
direct investment (FDI) inflows. Sustainable development is a multidimensional,
intergenerational, interdependent and holistic concept. The concept evolved through a series of
international agreements, conferences, meetings and reports (from Stockholm Conference 1972
to, most recently, Agenda 2030). The central spirit of sustainable development is to ensure
intergenerational equity of development efforts, which sufficiently protect the environment and
establish justice for all communities and generations. Sustainable development has three basic
dimensions: economy, environment, and society. The concept of sustainability also focuses on
the intergenerational equity of preserving and using capital stock (natural capital stock, physical
capital stock and social capital stock). Based on the assumption of substitutability between
natural capital stock and physical capital stock, the proponents of sustainability principles are
divided into two principles: weak and strong sustainability. Weak sustainability assumes a
perfect elasticity of substitution among physical and natural capital stock. On the other hand,
considering the characteristic of the irreversibility of natural capital stock and its importance for
the existence of life, the strong sustainability proponents oppose the substitutability between the
physical capital and natural capital stock. More recently, the social values or social capital stock,
has also been included in the concept of sustainability, acknowledging the heterogeneity of social
structure, needs, values and capabilities in society.
Foreign Direct Investment (FDI) is a long-run investment channelled usually by multinational
companies and enterprises, and investors have a degree of control over the business. FDI
inflows are classified in different categories and types based on the motive, nature of the
investment and supply chain of the production process. Dunning and Lundan (2008) classified
FDI into four categories, based on the investment motives of companies: market seeking;
resource seeking; efficiency-seeking; and strategic asset or capability seeking.
Based on the supply chain of the production process, FDI inflows are also classified as being
horizontal or vertical FDI. Developing countries are offering various incentives and undertaking
reform initiatives to attract FDI inflows as they are considered an important catalyst for rapid
economic growth and technological transformation. These countries compete with each other;
however, there are various determining factors that contribute to attracting FDI in a particular
country. Some factors are related to the internal issues of firms/investors and explain why a
firm will invest abroad, such as cost reduction and economies of scale. Some factors are related
to the host country's situation, such as resource availability, market size, and the business
environment.
224
Global leaders and policymakers are encouraging FDI as a channel for promoting sustainable
development in developing countries; however, there is no clear theory that can explain the
impact of FDI on sustainability or sustainable development. Both the weak and strong
sustainability theories are based on the conditions of non-declining capital stock over the
respective time period. FDI supplies physical capital to the capital-scarce country. With its spill-
over effect, it can increase the stock of human capital through training, research, and innovation,
which can then contribute to achieving the necessary conditions for weak sustainability.
Through its contribution to technological advancement, FDI can even help to retain or protect
the natural resource stock by introducing and promoting energy savings and waste reduction
technology to the host country. On the other hand, the presence and activities of FDI inflows
may increase competition between companies, which may force the domestic firms to leave the
industry; this results in a decline of the productive base of the host country. Therefore, FDI
inflows have the potential to contribute to achieve the necessary conditions of sustainable
development; however, this depends on the type, sector of FDI, institutional mechanism and
absorptive capacity of the country.
Chapter 3 reviews the theoretical and empirical literature on FDI inflows and the way in which
FDI inflows interact with the three basic pillars of sustainable development. This chapter
provides the foundation for developing the three Research Questions and the analytical
approach in the thesis. The economic, social and environmental dimensions of sustainable
development each include a large number of issues. FDI inflows can generate both positive and
negative consequences to most of the elements of all three dimensions of sustainable
development through its direct and indirect (spillover) effects.
The economic dimension of sustainable development not only includes economic growth, but
also includes expansion of the productive capacity base (physical capital and human capital),
and innovation and technological development. In theory, both neoclassical and endogenous
growth models endorse the role of FDI inflows in economic growth as it supplies capital (direct
channel) and diffuses technological advancement (indirect channel) to developing countries.
The literature is more focused on the indirect or spillover effects of FDI inflows than the direct
effects. FDI inflows can diffuse advanced, efficient technology and management systems to the
host economy through the following: demonstration effects (learning by doing); competition
effects (increasing competition forces domestic firms to adopt new technology); linkage effects
(establishing linkages with domestic firms promotes new technology); labour turnover effects
225
(moving labour from foreign-owned firms to local firms); and human capital accumulation
effects (providing training and research activities).
On the other hand, FDI inflows may also generate negative spillover effects in the host country.
In the case of FDI contributing to learning by doing, the technology might be too advanced to
be acquired by other firms in the host economy. For competition effects, foreign firms may
‘crowd-out’ domestic investment. In the case of labour turnover, the skilled workforce of local
firms might move to foreign firms for higher wages. Foreign firms might not create sufficient
linkages with the domestic firms by sourcing materials and inputs from overseas. Therefore, the
net effects on the economy will be negative instead of positive. Further, the benefits of FDI on
growth will not come automatically, but depends on the absorption capacity of the host country.
The empirical literature about the impact of FDI inflows on the host economy also provides
inconclusive results; the results vary by country, nature, and mode of FDI inflows.
The environmental dimension concerns the ecological balance of development, which includes
emission of pollutants, natural resource depletion, use of renewable energy, energy efficiency,
biodiversity and climate change. The pollution haven hypothesis and pollution halo hypothesis
generate debate about the effects of FDI inflows on the host country’s environmental conditions.
The pollution halo hypothesis supports the notion that foreign firms engaging in FDI usually
have advantages over local firms in the host markets, which includes greater access to state-of-
the-art technologies, the development of new products and new processes of production.
Modern, sophisticated technology brings resource efficiency and reduces industrial waste and
pollution in the production process. Multinational firms usually also need to meet higher
standard operational and management compliances. They not only follow the host country’s
environmental standard but also need to comply with their parent country's higher
environmental standards. Therefore, the presence of FDI inflows may help to improve the
environmental conditions and reduce the pollution level in the host country.
On the other hand, the pollution haven hypothesis postulates that the status of the enforcement
of environmental regulations is found to be low in developing countries, compared with
developed economies. Hence, MNEs prefer to shift the polluting industries to the developing
countries to lower the costs and penalties related to environmental compliance. As a result, the
environmental situation worsens in developing countries due to the activities of FDI.
226
FDI inflows have the potential to generate economic growth; therefore, the relationship between
FDI inflows and the environment is also linked to the Environmental Kuznets Curve (EKC)
hypothesis. The EKC hypothesis argues that with the increase of per capita income, the
environmental situation worsens, but when a country reaches a certain income level,
environmental quality starts to improve. At low income levels, the adverse ‘scale effect' of FDI
inflows seems to be more prominent, which leads to increasing pollution levels as indicated by
the upward rising part of the EKC. After reaching a certain level of development, the
composition effects and technique effects (by adopting advanced, efficient technology) play a
more dominant role than the scale effects, and pollution levels start to decline with the
increasing per capita income and contribute to the inverted U-shaped EKC relationship in the
host country.
The empirical literature explores the validation of the pollution haven, pollution halo and EKC
hypothesis; however, the results of the empirical studies are inconclusive. Some studies found
evidence of the pollution haven hypothesis, and some studies found evidence of pollution halo
hypothesis; others reject the EKC relationship for FDI, and some support the EKC relationship.
depend on the performance of the MNEs, the host country’s environmental policies, regulations
and their enforcement, types of FDI inflows and technology used by the MNEs.
In regards to the social dimension of sustainable development, social equality is the primary
goal and people and their quality of life the main concern. In the literature, the impacts of FDI
inflows on the social dimension mostly focus on the impact of FDI inflows on employment
generation, poverty reduction and income inequality. FDI creates new employment
opportunities through direct investments and generates jobs indirectly through expanding or
stimulating domestic investment through its backward and forward linkage effects. FDI might
not create any direct impact on poverty reduction in the host country, but it can indirectly
contribute to poverty reduction through the following channels: the systematic channel of FDI-
growth-poverty reduction; the redistribution of revenue income channel; and the enterprise's
channel, or through CSR activities. In the case of income inequality, it is argued that if FDI is
channelled to the labour-intensive sector, it creates employment and increases the demand for
low-skilled labour, thus leading to increased wage levels and a reduction in income inequality.
In addition, as per the Kuznets inverted-U curve hypothesis, if FDI induces growth, then the
presence of FDI may contribute to raising the income inequality of the host country; but FDI
can later help to reduce income inequality. However, the extent to which FDI affects
227
employment generation, poverty reduction and income inequalities mostly depends on the type
of FDI (greenfield or brownfield investment), the production techniques applied in the sectors
(labour intensive or capital intensive), linkages established with the local industries ('crowding
in' or 'crowding out'), the sources of growth, the fiscal policies of the government and the CSR
practices of the MNEs. The results of the empirical study regarding the impact of FDI inflows
on social improvements are also inconclusive and diverse. The results vary by country.
The theoretical and empirical literature shows that FDI inflows offer both opportunities and
challenges for sustainable development. Appropriate regulatory and institutional frameworks
are crucial to make FDI inflows effective for sustainable development. Every country has a
different productive structure, different domestic economic policies, and varying social,
political and institutional frameworks; therefore, the impacts of FDI inflows differ from country
to country. Case studies are required to find out if FDI inflows are assisting the country to
achieve the goals of sustainable development or what policy reforms and strategies are essential
to make FDI inflows effective for sustainable development. In particular, no studies have
analysed the impact of FDI on sustainable development in Bangladesh.
With the backdrop discussed above, this study explores the broad Research Question: are
manufacturing FDI inflows assisting or hindering in advancing sustainable development in
Bangladesh? Against the goals and hopes of promoting FDI and the three dimensions of
sustainable development (economy, environment and social) the research question is broken
down as follows:
Research Question One: To what extent are manufacturing FDI inflows contributing
to economic sustainability in Bangladesh?
Research Question Two: To what extent are manufacturing FDI inflows contributing
to environmental sustainability in Bangladesh?
Research Question Three: To what extent are manufacturing FDI inflows contributing
to social sustainability in Bangladesh?
Chapter 4 explores Research Question One, which focuses on the contribution of manufacturing
FDI inflows to economic sustainability in Bangladesh. The chapter starts with an overview of
the various reforms and policy changes and the performance in Bangladesh economy. Since its
independence in 1971, the Bangladesh economy has passed through various reforms and

228
refinements. First, the country adopted a state-controlled, inward-looking, import-substitution
development policy. In the late 1980s, the country initiated various liberalising policy reforms
under the guidelines of the World Bank's Structural Adjustment Programme (SAP) and the
IMF’s Structural Adjustment Facility (SAF). One of the prime goals of the development
strategy of Bangladesh is to transform the country from a low value-adding agrarian economy
to a high value-adding industrial economy. The government of Bangladesh has formulated and
adopted eleven investment and industrial policies. Since the inception of the New Investment
Policy (1982), the export-oriented manufacturing sector has received extra attention in all
development strategies, trade policies and industrial policies in Bangladesh and is considered
the engine for accelerating economic growth. Bangladesh is promoting foreign direct inflows
in the export-oriented manufacturing sector to access advanced technology, brand names and
global markets, and to also realise the benefits of productivity and efficiency spillovers from
FDI inflows.
To address Research Question One, I conducted both a descriptive statistical analysis and an
econometric analysis. The key findings from the descriptive analysis are as follows:
The export-oriented manufacturing FDI helps the structural transformation of the
country. With the increased flow of FDI, the share of the manufacturing sector to GDP
and export performance of manufactured products also increased.
FDI inflows are contributing to an increase in the production capacity through the
'crowding in' and backward linkages effects. Gross capital formation increases along
with the increased flow of FDI.
The productivity and efficiency spillover effects are seemingly not realised in
Bangladesh; the technology diffusion by the FDI inflows is very low. The productivity
indicators in the manufacturing sector paint a depressing picture in Bangladesh. The
technological and innovation capacity of the country is also poor.
The sources of growth and exports are highly dependent on just one industry, textiles
and clothing, which leads polarises the manufacturing sector and reduces the economic
sustainability of the country.
Backward linkages are only established in the low value-adding parts. The low value-
adding parts of upstream industries have expanded in the country. High value-adding
229
segments of the upstream industries fail to expand, which limits the backward linkages
effects in this sector.
The major findings from the empirical analysis are:
Evidence of long-run co-integration among the manufacturing value-added FDI inflows,
gross fixed capital formation and trade openness in Bangladesh.
FDI inflows and gross fixed capital formation have a long-run positive and significant
impact on manufacturing value-added in Bangladesh.
A short-run causality is running from gross fixed capital formation to manufacturing
value-added.
In the short-run, FDI inflows do not Granger cause or make any impact on
manufacturing value-added in Bangladesh.
Therefore, FDI inflows are providing some positive contributions to economic sustainability in
Bangladesh; that is, FDI inflows help to expand the productive base of the country through
'crowding in' effects and establishing backward linkages. FDI It also has a long-run positive
impact on manufacturing value-added; however, a high concentration of FDI inflows in one of
the low value-adding industries, failure to create backward linkages in high value-adding parts
of the production process, and the low technology diffusion by the FDI inflows, combine to
restrict the realisation of the benefits of productivity and efficiency spillover effects, which are
crucial for economic sustainability.
Chapter 5 explores Research Question Two, which focuses on the contribution of
manufacturing FDI inflows for environmental sustainability in Bangladesh. Rapid population
growth, coupled with increased economic activity, unplanned urbanisation, industrial
intensification and improper management, has led to serious environmental degradation in the
country. For a long time, policymakers have ignored the environmental consequences of
industrialisation in Bangladesh. In recent years, the government has paid attention to sustainable
industrialisation or promoting green growth. Along with the enforcement of proper
environmental regulations, technological advancement and the introducing of efficient,
environmentally-friendly technology is also crucial to prevent, preserve and reduce the use of
critical natural resources and for the achievement of environmental sustainability. FDI could be
230
a vehicle for promoting environmentally-friendly technology and management systems in
developing countries.
To address Research Question Two, the study investigates the presence of evidence supporting
the pollution haven hypothesis, the pollution halo hypothesis and EKC hypothesis in
Bangladesh through descriptive and empirical analysis. The main findings from the descriptive
analysis are:
The statistical analyses of available indexes and trends provide evidence of the pollution
haven hypothesis in Bangladesh.
The proportion of dirty industries, both in terms of FDI inflows and exports, is very high
(more than 80 percent) and also has an increasing trend. Dirty industries are flocking to
Bangladesh through export-oriented FDI inflows.
The textile industry is causing severe pollution of waterways and is also extracting vast
quantities of water from the aquifers of Bangladesh unsustainably.
The enforcement of environmental regulations is very weak in Bangladesh. Bangladesh
scored the lowest among the selected South Asian Countries for the enforcement of
environmental regulations; therefore, polluting industries might take advantage of the
lax environmental regulations and their enforcement.
The industries in the list of ‘thrust sectors’ (such as pharmaceuticals, chemicals or dyes
and fertilisers) are highly polluting industries. By encouraging FDI in these industries
the pollution haven effect is being encouraged.
There is little evidence of the pollution halo hypothesis in Bangladesh. Foreign-owned
firms might have a better environmental performance than local firms, but there is no
substantial difference.
The main barriers to promoting environmentally-friendly technology are poor
enforcement of environmental regulations, low penalties, the comparative cost
advantage of old technology, lack of technical expertise and high initial investment
costs.

231
In the empirical analysis, the study examined the presence of the pollution halo effect for
renewable energy consumption and the existence of the pollution haven effects and
Environmental Kuznets Curve (EKC) for CO2 emissions in Bangladesh. The main findings are
as follows:
A long-run co-integration exists among renewable energy consumption, FDI inflows,
and manufacturing value-added.
The estimated long-run coefficient of FDI is negative and statistically significant, which
indicates FDI inflows in Bangladesh are not helping to promote environmentally-
friendly energy use in Bangladesh. Therefore, the pollution halo effect in renewable
energy consumption does not exist in Bangladesh.
The estimated long-run coefficient of manufacturing valued added is found to be
statistically insignificant. The result indicates that the manufacturing sector does not
have any significant contribution to promoting renewable energy in Bangladesh.
The Granger causality test indicates that there is no causality running from FDI inflows
to renewable energy consumption, which means the FDI inflows in Bangladesh are not
influencing renewable energy consumption.
Uni-directional causalities are running from renewable energy consumption to FDI
inflows and manufacturing value-added, which indicates that the domestic capacity of
technological advancement stimulates industrial expansion and FDI inflows in the
country.
The empirical study does not find any significant evidence of the pollution haven effect
for CO2 emissions in Bangladesh.
The significant positive relationship between per capita GDP and CO2 emissions, and
the negative relationship between the squared form of per capita GDP and CO2
emissions, confirms the existence of an EKC relationship in Bangladesh, both in the
short- and long-run.

232
The empirical results also reveal a positive relationship between energy consumption
and CO2 emissions both in the short- and long-run. Therefore, innovation and the
introduction of low carbon, energy-efficient technology is urgently required for
environmental and economic sustainability.
Therefore, the current FDI inflows are not helping to advance environmental sustainability in
Bangladesh. Although the empirical analysis rejects the pollution haven effect for CO2
emissions in Bangladesh, the arrival of many ‘dirty’ industries, through FDI inflows in the
water-polluting sector, is a big concern for environmental sustainability in Bangladesh. The
empirical study also rejects the pollution halo effect for renewable energy consumption in
Bangladesh, which proves that FDI inflows are not promoting environmentally-friendly
technology in Bangladesh. The presence of the EKC relationship implies that it’s the growth-
enhancing strategy in Bangladesh should lead to improved environmental protection in the
long-run. However, growth-enhancing strategies could be more environmentally-friendly to
reduce short-run environmental impacts.
Chapter 6 explores Research Question Three, which focuses on the contribution of
manufacturing FDI inflows to the social sustainability in Bangladesh. Justice, equality and
capabilities are key elements of social sustainability. In relation to FDI, employment generation,
poverty reduction, income equality, and decent wages and working conditions are considered
important in assessing the contribution to social sustainability. Through descriptive and
empirical analysis, this chapter investigates the extent to which FDI inflows in the
manufacturing sector are helping to achieve the social goals of sustainable development in
Bangladesh. The main findings from the descriptive analysis are:
The manufacturing FDI inflows may have made a positive contribution to employment
generation in Bangladesh, through direct and indirect effects;
FDI inflow in Bangladesh may contribute to poverty alleviation efforts indirectly
through its contribution to GDP growth, which increases government revenue and
therefore the capacity of the government to provide employment creation programs;
FDI inflows do not help to promote ‘decent’ wage and working conditions in
Bangladesh. Wage flexibility, high unemployment, weak linkages with the local firms,
narrow profit margins, intense competition between subcontracting firms, and the
233
limited corporate social responsibility practices of MNEs are the main reasons hindering
improvements to wages and working conditions.
The empirical study explored the Kuznets hypothesis and the impact of FDI inflows on income
inequality in Bangladesh. The main findings from the empirical analysis are as follows:
Income inequality in Bangladesh is increasing, but FDI inflows are not the cause.
The Kuznets Hypothesis of income inequality exists in Bangladesh. The per capita GDP
growth initially creates a positive impact on income inequality. If per capita GDP
increases beyond some point it has a negative relationship with income inequality.
Therefore, in general, FDI is positive for social sustainability in Bangladesh in the long run.
The presence of the Kuznets hypothesis indicates that growth is needed to reduce income
inequality in the long-run; however, the immediate impact of growth is creating adverse effects
on income equality. Therefore, the government should be cautious in adopting growth and
export promoting strategies in Bangladesh.
Chapter 7 synthesises the findings of Chapters 4, 5 and 6, based on the different channels
through which FDI could promote sustainable development in the host country. It provides an
integrated picture of the impact of FDI inflows on overall sustainable development in
Bangladesh. The chapter also identifies the challenges towards the achievement of sustainable
development through FDI inflows and provides several policy recommendations to steer FDI
inflows towards sustainable development.
8.3 Contribution to theory and practice
In this study, I examine the impact of FDI inflows on various dimensions of sustainable
development in a systematic and comprehensive way. In doing so, the study contributes to
existing theories and literature related to foreign direct investment and sustainable development.
Based on the principles, characteristics, and elements of sustainable development, I connect the
existing theories and literature of FDI inflows with the broader integrated concept of sustainable
development.
In Chapter 2, I connected FDI inflows and the weak and strong versions of sustainability. In
Chapter 3, I compiled and discussed a wide range of theoretical and empirical studies on the
impact of FDI inflows on various elements of sustainable development. The earlier literature

234
discusses the impact of FDI inflows on various elements of sustainable development in an
isolated way. Some theories and literature explain the impact of FDI inflows on economic
sustainability, some explain the impact on environmental sustainability, and others explain the
impact on social sustainability. In contrast, I compiled and connected the literature and theories
within the framework of a broader integrated concept of sustainable development.
I also connected the direct and indirect or spillover effects of FDI inflows on various elements
of sustainable development throughout the study. The theoretical and empirical literature
discussed in Chapters 2 and 3 demonstrates that the impacts of FDI inflows on all three
dimensions of sustainable development are inconclusive and diverse, and the impacts vary by
country; thus, the case study was required. Therefore, the study contributes to the existing
debate and knowledge regarding the impact of FDI inflows and sustainable development by
analysing the impact of FDI inflows on sustainable development using the case study of
Bangladesh.
The study also contributes to the empirical literature in the area of FDI inflows and sustainable
development. I conducted three empirical analyses to explore the impact of FDI inflows on
economic, environmental and social sustainability in Bangladesh. Most of the earlier literature
considers economic growth, or Gross Domestic Product (GDP), as the dependent variable to
determine the impact of FDI inflows on economic performances of the country. The main aim
behind promoting FDI inflows in Bangladesh is to accelerate industrialisation and structural
transformation of the country. Therefore, instead of focussing on GDP, the study considers
manufacturing value-added as the dependent variable with a view to exploring the impact of
FDI inflows on the performances of the manufacturing sector, and the structural transformation
of the country. No empirical research has been located that investigates the impact of FDI
inflows on manufacturing value addition. Therefore, this study opens up a new avenue to
examine the economic performance of FDI inflows.
The environmental impact of FDI inflows is viewed with regard to three hypotheses: pollution
halo, pollution haven and Environmental Kuznets Curve (EKC). The earlier empirical studies
mostly investigate the pollution haven and EKC hypothesis for FDI inflows. Due to the
limitation of the availability of data, very few or no empirical study has been carried out in
relation to the pollution halo hypothesis. This study is the first empirical study to investigate
the pollution halo hypothesis by investigating the impact of FDI inflows on renewable energy
consumption in Bangladesh. Sustainable energy production and consumption are essential
235
elements in environmental sustainability. Therefore, the empirical analysis of the pollution halo
hypothesis is a significant contribution in the area of environmental sustainability, which opens
up a new avenue for further research in this area.
Quite a few studies have already been carried out in relation to the pollution haven and EKC
hypothesis. Almost all the earlier studies applied linear regression and co-integration analysis
to investigate the EKC relationship; however, the Environmental Kuznets Curve suggests a
nonlinear, inverted U-shaped relationship. Therefore, this study applies a more recent advanced
econometric co-integration technique of the Nonlinear Autoregressive Distributed Lag Model
(NARDL) method to investigate the pollution haven and EKC relationship for FDI inflows in
Bangladesh. The application of the NARDL model provides improved estimates of the EKC
relationship (Ur Rahman et al., 2019).
The social aspects of sustainability have received less attention than the economic and
environmental relationships and only a few empirical studies have analysed the social
sustainability of FDI inflows. Moreover, most of the earlier research uses the OLS regression
method, which frequently suffers from an endogeneity problem. This study conducts an
empirical analysis to investigate the distributional impact of FDI inflows, using a simultaneous
equation modelling approach, which corrects for the endogeneity problem. Therefore, the
results are more efficient and the analysis addresses a research gap in the literature on the impact
of FDI inflows on social sustainability.
The findings of this study also contribute to policy. At the time of conducting the research, the
United Nations announced the adoption of the most recent universal guideline of sustainable
development via Agenda 2030 or the Sustainable Development Goals (SDGs). This study
embraces the SDGs in the discussion and analysis of the impact of FDI inflows on sustainable
development. Agenda 2030 is the roadmap or policy framework for developing and
implementing development planning until 2030. Countries, states, world-leading organisations,
the business community and civil societies all are committed to achieving the targets of SDGs.
Monitoring progress towards the SDGs, at both the global and national level, is emphasised in
Agenda 2030 and169 targets and 232 indicators are developed to monitor progress. The journey
towards SDGs is a participatory and inclusive process and UNCTAD is advocating the
channelling of more FDI inflows for achieving the SDG targets in the developing countries
(UNCTAD, 2014). The findings of this study contribute to assessing and reviewing the impact
236
of FDI on the SDGs. I have taken the Bangladesh manufacturing sector as a case study because
Bangladesh is promoting FDI inflows in the manufacturing sector with various incentives. The
country also has a strong commitment towards the achievement of the SDGs. The findings of
this research and policy suggestions will assist in designing FDI policies for Bangladesh, and
other developing countries in the future.
8.4 Limitations and future research
The study explores how FDI inflows are influencing sustainable development in developing
countries, and Bangladesh in particular. As noted, sustainable development is a vast,
multidimensional concept that comprises a wide range of interrelated issues. To analyse the
impact of FDI on some of the core elements of sustainable development, I have divided the
study in terms of the three broad dimensions of sustainable development and analysed them
separately; however, the three dimensions of sustainable development and their elements are
interrelated. While I have attempted to integrate the analysis in chapter 7, a methodology for
systematically analysing the impact of FDI on an integrated index of sustainable development
may be a worthwhile avenue for future research.
I have carried out descriptive and empirical analysis based on secondary data and information.
Primary data collection or field surveys may provide a more updated and precise picture of the
economic, environmental and social performances of foreign- and locally-owned firms. In
particular, assessing the indirect or spillover effects of FDI inflows is important for identifying
the net effects of FDI inflows for all three dimensions of sustainable development. I have
attempted to analyse the indirect or spillover effects on different areas of sustainable
development through descriptive analysis based on available statistics and information;
however, I could not assess the spillover effects through empirical econometric analysis due to
a lack of firm-level data. Therefore, I recommend conducting a field survey for assessing the
indirect effects of FDI. A field survey should include both the performances of foreign- and
locally-owned firms in various economic, environmental and social areas. Data on how MNEs
are interacting with the local firms and subsidiaries, and the monitoring and supervision of
MNEs on the activities of their subsidiaries and subcontracting companies are also required to
investigate the linkage effects of FDI inflows.
237
The lack of regional-level and industry-based data also imposes a limitation in conducting
impact analysis of FDI inflows. The indirect or spillover effects of FDI inflows may differ by
regions within a country. For instance, well-developed physical infrastructure provides a
positive investment environment and may amplify the spillover effects of FDI. If a region has
improved physical infrastructure facilities, such as railway, highway, port, and power plants,
the indirect or spillover effects of FDI inflows could be higher than a region which does not
have those facilities. Therefore, a spatial or regional-based analysis of the spillover effects of
FDI will provide a more complete picture and will be useful for policy formulation. Given the
lack of regional-level data, such an analysis could not be carried out and, as such, I recommend
the development of regional databases that could be used to assess the spatial spillover effects
of FDI inflows.
Good governance and rule of law are important in realizing the benefits of FDI inflows as
discussed in the thesis. Proper enforcement of the rule of law can also drive FDI inflows toward
promoting sustainable development. Conducting a comparative regional analysis of how the
direct and indirect impact of FDI inflows differ by indicators of governance would provide a
useful area for policy formation. Therefore, when regional level data becomes available, I
recommend conducting a regional impact analysis of FDI inflows incorporating good
governance indicators such as the corruption level and participation in the electoral system and
assessing the interaction of these variables with FDI inflows in determining economic,
environmental and social sustainability.
The literature reviewed in this thesis suggests that FDI inflows generate heterogeneous effects
across industries. For example, FDI inflows in the automobile industry may generate higher
backward and forward linkages to the local economy and might be less polluting than the
textiles industry. Therefore, an industry-specific analysis would help for promoting and
regulating FDI inflows. The availability of industry-specific data will open up future research
opportunities in this area.
The limited timeframe also imposed a barrier to the study. Each dimension of sustainable
development covers a broad range of topics and time limited the degree to which each element
could be studied. For instance, in the case of social sustainability, I was unable to conduct an
empirical analysis regarding the impact of FDI inflows on gender equality and poverty
reduction in addition to the study on income inequality. Further, in the case of inequality, I only
consider income inequality. However, inequality may persist through differences in basic social
238
and economic services such as access to education, health, employment. I also could not
conduct an empirical investigation regarding the impact of FDI inflows on water pollution due
to the lack of data and time constraints in creating such data; therefore, more research is required
in these areas.
Although it is also a strength of the thesis, another limitation is that the results are focussed on
Bangladesh, and the manufacturing sector in particular, and have not been generalised to other
countries and contexts. However, the findings provide indications of the implications of FDI
inflows for developing countries more generally. The study recommends undertaking the same
comprehensive, and integrated approach in other case studies of developing countries to
determine the relationship between FDI inflows and sustainable development.
Findings of this study depict that FDI inflows are generally positive for economic and social
sustainability in Bangladesh. However, the high concentration of FDI inflows in the polluting
industries is the major concern for environmental sustainability in Bangladesh. Further,
Bangladesh fails to reap the spillover benefits of FDI inflows in terms of technology transfer,
productivity and efficiency gains and the diffusion of better environmental management and
working condition. MNEs in Bangladesh are also very reluctant to practice corporate social
responsibility.
In conclusion, I strongly advocate considering efficient, environmentally-friendly technology
diffusion when promoting FDI inflows in Bangladesh and other developing economies.
Domestic absorptive capacity and the enforcement of rules and regulation also need to be
strengthened to harness the positive spillover benefits of FDI inflows.
239
9. REFERENCES
Abdin, J. 2015. Investment climate in Bangladesh: performances and possibilities. International Journal of Economics & Management Sciences, 4 (9), pp.1-8. Available at
https://www.omicsonline.org/open-access/investment-climate-in-bangladesh-performance-
and-possibilities-2162-6359-1000290.php?aid=63727. [Accessed 17 August 2017]. Abedin, M. A. & Jahiruddin, M. 2015. Waste generation and management in Bangladesh: an
overview. Asian Journal of Medical and Biological Research, 1(1), pp.114-120.
Acar, S., Eris, B. & Tekce, M. 2012. The effect of foreign direct investment on domestic investment: evidence from MENA countries. 14th annual conference, September 2012, European Trade
Study Group, Leuven, Belgium, pp.13-15.
Acaravci, A. & Ozturk, I. 2012. Foreign direct investment, export and economic growth: empirical
evidence from new EU countries. Romanian Journal of Economic Forecasting, 15(2), pp.52-67.
Adams, C. A., Hill, W.Y. & Roberts, C. B. 1998. Corporate social reporting practices in Western
Europe: legitimating corporate behaviour? The British Accounting Review, 30(1), pp.1-21. Adams, J. 1997. Globalisation, trade, and environment. In OECD (ed.), Globalisation and the
environment: preliminary perspectives, pp.179-198, OECD, France.
Adams, R. H. 2004. Economic growth, inequality and poverty: estimating the growth elasticity of poverty. World Development, 32(12), pp.1989-2014.
Adelman, I. & Robinson, S. 1989. Income distribution and development. In H. Chenery & T.N.
Srinivasan (eds.), Handbook of development economics, 2nd edition, pp.949-1003, North
Holland. Adhikary, B. K. 2011. FDI, trade openness, capital formation, and economic growth in Bangladesh: a
linkage analysis. International Journal of Business and Management, 6(1), pp.16-28.
Adhikary, B. K. 2012. Impact of foreign direct investment, trade openness, domestic demand, and exchange rate on the export performance of Bangladesh: a VEC approach. Economics
Research International. Available at https://www.hindawi.com/journals/ecri/2012/463856/.
[Accessed 27 September 2017].
Aga, A. A. K. 2014. The impact of foreign direct investment on economic growth: a case study of Turkey 1980–2012. International Journal of Economics and Finance, 6(7), pp.71-84.
Aghion, P., Howitt, P., Brant-Collett, M. & García-Peñalosa, C. 1998. Endogenous growth theory,
MIT Press, Cambridge, MA. Agras, J. & Chapman, D. 1999. A dynamic approach to the environmental Kuznets Curve hypothesis.
Ecological Economics, 28(2), pp.267-277.
Agrawal, G. 2015. Foreign direct investment and economic growth in BRICS economies: a panel data analysis. Journal of Economics, Business and Management, 3(4), pp.421-424.
Ahmed, S. 2005. Development performance and policy reforms since independence. In S. Ahmed
(ed.), Transforming Bangladesh into a middle-income economy, pp.1-48, Macmillan, India.
Available at http://documents.worldbank.org/curated/en/134281468007228566/pdf/630500PUB0Tran00Bo
x0361515B0PUBLIC0.pdf. [Accessed 25 June 2017].
Aitken, B., Hanson, G. H. & Harrison, A. E. 1997. Spillovers, foreign investment, and export behaviour. Journal of International economics, 43(1), pp.103-132.
Aitken, B. J. & Harrison, A. E. 1999. Do domestic firms benefit from direct foreign investment?
evidence from Venezuela. American Economic Review, 89(3), pp.605-618.
240
Ajaga, E. & Nunnenkamp, P. 2008. Inward FDI, value added and employment in US states: a panel
cointegration approach. Aussenwirtschaft, 63(4), pp.347-367. Akinmulegun, S. O. 2012. Foreign direct investment and standard of living in Nigeria. Journal of
Applied Finance and Banking, 2(3), pp.295-309.
Akter, M., Sikder, T. & Ullah, A. 2014. Water quality assessment of an industrial zone polluted aquatic body in Dhaka, Bangladesh. American Journal of Environmental Protection, 3(5),
pp.232-237.
Akbota, A. & Baek, J. 2018. The environmental consequences of growth: empirical evidence
from the Republic of Kazakhstan. Economies, 6(1), p.19. Al-Mulali, U. & Tang, C. F. 2013. Investigating the validity of pollution haven hypothesis in the gulf
cooperation council (GCC) countries. Energy Policy, 60, pp.813-819. Al-Sadig, A. 2009. The effects of corruption on FDI inflows. Cato Journal, 29(2), pp.267-294.
Alagöz, M., Erdoğan, S. & Topallı, N. 2008. Foreign direct investment and economic growth:
evidence from Turkey 1992-2007. Gaziantep University-Journal of Social Sciences, 7(1), pp.78-89.
Alam, K. 2007. The environment and policy-making in Bangladesh. In S.S. Andaleeb & M.F.Islam
(eds.), Development issues of Bangladesh-III: human development and quality of life, pp.253-
268, University Press Limited, Dhaka, Bangladesh. Available at https://eprints.usq.edu.au/1937/1/Alam Chapter13.pdf. [Accessed 24 September 2017].
Albornoz, F., Cole, M. A., Elliott, R. J. & Ercolani, M. G. 2009. In Search of environmental spillovers.
The World Economy, 32(1), pp.136-163. Albanesi, S. 2007. Inflation and inequality. Journal of Monetary Economics, Elsevier, 54(4), pp.1088-
1114.
Alderson, A. S. & Nielsen, F. 1999. Income inequality, development, and dependence: a reconsideration. American Sociological Review, 64(4), pp.606-631.
Alfaro, L. 2003. Foreign direct investment and growth: does the sector matter? Available at
https://www.researchgate.net/publication/228966060 Foreign Direct Investment andGrowth
does the sector matter. [Accessed 24 June 2017]. Alfaro, L., Chanda, A., Kalemli-Ozcan, S. & Sayek, S. 2004. FDI and economic growth: the role of
local financial markets. Journal of International Economics, 64(1), pp.89-112.
Ali, M., Nishat, M. & Anwar, T. 2009. Do foreign inflows benefit Pakistani poor? The Pakistan Development Review, pp.715-738.
Altomonte, C. & Resmini, L. 2001. Multinational corporations as catalyst for industrial development:
the case of Poland. Working papers series, 368, William Davidson Institute. Available at https://pdfs.semanticscholar.org/7a79/9e47ef2b4c2bdd02b14db64b40e62d7e060c.pdf.
[Accessed 24 September 2018].
Amendolagine, V., Boly, A., Coniglio, N. D., Prota, F. & Seric, A. 2013. FDI and local linkages in
developing countries: evidence from Sub-Saharan Africa. World Development, 50, pp.41-56. Anand, S. & Sen, A. 1994. Sustainable human development: concepts and priorities. Occasional
Papers, UNDP Human Development Report Office. Available at
http://hdr.undp.org/sites/default/files/anand sudhir - sustainable human development-concepts and priorities.pdf. [Accessed 8 February 2017].
Anand, S. & Sen, A. 2000. Human development and economic sustainability. World
development, 28(12), pp.2029-2049.
Andonova, L. B. 2003. Openness and the environment in Central and Eastern Europe: can trade and foreign investment stimulate better environmental management in enterprises? The Journal of
Environment & Development, 12(2), pp.177-204.
Ang, J. B. 2007. CO2 emissions, energy consumption, and output in France. Energy Policy, 35(10), pp.4772-4778.
Ang, J. B. 2008. Determinants of foreign direct investment in Malaysia. Journal of Policy Modeling,
30(1), pp.185-189. Antweiler, W., Copeland, R. & Taylor, M. S. 2001. Is free trade good for the emissions. American
Economic Review, 91(4), pp.877-908.
Anwar, S. & Nguyen, L. P. 2014. Is foreign direct investment productive? a case study of the regions
of Vietnam. Journal of Business Research, 67(7), pp.1376-1387.
241
Apergis, N., Katrakilidis, C. P. & Tabakis, N. M. 2006. Dynamic linkages between FDI inflows and
domestic investment: a panel cointegration approach. Atlantic Economic Journal, 34(4), pp.385-394.
Araya, M. 2005. FDI and the environment: what empirical evidence does–and does not tell us? In L.
Zarsky (ed.), International investment for sustainable development: balancing rights and rewards, pp.46-73, Earthscan, UK.
Arfanuzzaman, M. 2018. Low R&D expenditure hinders innovation and development. The Daily Star,
21 September. Available at https://www.thedailystar.net/opinion/perspective/news/low-rd-
expenditure-hinders-innovation-and-development-1636630. [Accessed 21 December 2018]. Asian Development Bank (ADB) 2004. Country environmental analysis for Bangladesh, ADB,
Manila. Available at https://www.adb.org/sites/default/files/institutional-document/32179/ban-
cea-jul2004.pdf. [Accessed 24 August 2018]. Asian Productivity Organization (APO) 2017. APO productivity databook 2017, APO, Japan.
Available at https://www.apo-tokyo.org/publications/wp-content/uploads/sites/5/APO-
Productivity-Databook 2017.pdf. [Accessed 27 October 2018].
Aşıcı, A.A. 2013. Economic growth and its impact on environment: a panel data analysis. Ecological Indicators, 24, pp.324-333.
Asiedu, E. 2002. On the determinants of foreign direct investment to developing countries: is Africa
different? World Development, 30(1), pp.107-119. Asiedu, E. 2006. Foreign direct investment in Africa: the role of natural resources, market size,
government policy, institutions and political instability. The World Economy, 29(1), pp.63-77.
Asif, A. K. M. A. H. 2017. An overview of sustainability on apparel manufacturing industry in Bangladesh. Science Journal of Energy Engineering, 5(1), pp.1-12.
Atici, C. 2012. Carbon emissions, trade liberalization, and the Japan–ASEAN interaction: a group-
wise examination. Journal of the Japanese and International Economies, 26(1), pp.167-178.
Azim, M. I., Ahmed, S. & Islam, M. S. 2009. Corporate social reporting practice: evidence from listed companies in Bangladesh. Journal of Asia-Pacific Business, 10(2), pp.130-145.
Azman-Saini, W., Law, S. H. & Ahmad, A. H. 2010. FDI and economic growth: new evidence on the
role of financial markets. Economics Letters, 107(2), pp.211-213. Badri, A. K. & Parvizkhanlu, K. J. 2014. Foreign direct investment and environmental consequences
of economic growth. International Journal of Modern Management and Foresight, 1, pp.1-8.
Baek, J. & Koo, W. W. 2009. A dynamic approach to the FDI-environment nexus: the case of China and India. Journal of International Economic Studies, 13, pp.87-109.
Bai, J. & Ng, S. 2005. Tests for skewness, kurtosis, and normality for time series data. Journal of
Business & Economic Statistics, 23(1), pp.49-60.
Bai, J. & Perron, P. 1998. Estimating and testing linear models with multiple structural changes. Econometrica, 66(1), pp.47-78.
Balasubramanyam, V. N., Salisu, M. & Sapsford, D. 1996. Foreign direct investment and growth in EP
and IS countries. The Economic Journal, 106(434), pp.92-105. Bangladesh Bank. Economic data, Bangladesh Bank, The Government of Bangladesh. Available at
https://www.bb.org.bd/econdata/index.php. [Accessed 5 June 2018].
Bangladesh Bank 2017. Foreign direct investment in Bangladesh: survey report July -December 2017,
Bangladesh Bank. Available at https://www.bb.org.bd/pub/halfyearly/fdisurvey/fdisurveyjuldec2017.pdf. [Accessed 23
August 2018].
Bangladesh Bureau of Statistics (BBS). Labour force survey, Bangladesh Bureaue of Statistics. Available at http://www.bbs.gov.bd/site/page/111d09ce-718a-4ae6-8188-f7d938ada348/-.
[Accessed 13 February 2018].
Bangladesh Bureau of Statistics (BBS) 2010. Report of the household income and expenditure survey 2010, Bangladesh Bureau of Statistics. Available at
http://203.112.218.65:8008/WebTestApplication/userfiles/Image/LatestReports/HIES-10.pdf.
[Accessed 14 January 2018].
242
Bangladesh Bureau of Statistics (BBS) 2012. Survey of manufacturing industries 2012, Bangladesh
Bureau of Statistics. Available at http://203.112.218.65:8008/WebTestApplication/userfiles/Image/LatestReports/SMI-
%202012.pdf. [Accessed 13 February 2017].
Bangladesh Bureau of Statistics (BBS) 2013. Labour force survey 2013, Bangladesh Bureau of Statistics. Available at
http://203.112.218.65:8008/WebTestApplication/userfiles/Image/LatestReports/LabourForceS
urvey.2013.pdf. [Accessed 13 January 2017].
Bangladesh Bureau of Statistics (BBS) 2016. Statistical year book 2016, Bangladesh Bureau of Statistics. Available at
http://bbs.portal.gov.bd/sites/default/files/files/bbs.portal.gov.bd/page/b2db8758 8497 412c
a9ec 6bb299f8b3ab/StatisticalYearBookFinal2016.pdf. [Accessed 18 February 2018]. Bangladesh Bureau of Statistics (BBS) 2017. Preliminary report of household income and expenditure
survey 2016, Bangladesh Bureau of Statistics. Available at
http://bbs.portal.gov.bd/sites/default/files/files/bbs.portal.gov.bd/page/b343a8b4 956b 45ca 8
72f 4cf9b2f1a6e0/HIES%20Preliminary%20Report%202016.pdf. [Accessed 14 February 2018].
Bangladesh Export Processing Zones Authority (BEPZA) 2016. Annual report 2015-16, BEPZA, The
Goverment of Bangladesh. Available at https://bepza.gov.bd/files/reports/file 1499665109.pdf. [Accessed 5 June 2018].
Bangladesh Export Processing Zones Authority (BEPZA) Website. Home page, BEPZA. Available at
https://www.bepza.gov.bd/. [Accessed 17 December 2018]. Bangladesh Garments Accessories & Packaging Manufacturers & Exporters Association
(BGAPMEA) 2018. A Glimpse of the growth & status of BGAPMEA. Available at
http://www.bgapmea.org/index.php/about/statistics. [Accessed 8 July 2018].
Bangladesh Investment Development Authority (BIDA) 2018. Investment opportunity, investment incentives, fiscal & non fiscal incentives, BIDA, The Government of Bangladesh. Available at
http://bida.gov.bd/fiscal-non-fiscal-incentives. [Accessed on 4 October 2018].
Bangladesh Knitwear Manufacturers & Exporters Association (BKMEA) 2018. Dynamics of Bangladesh knitwear sector: contribution on socio-economic development, BKMEA. Available
at http://www.bkmea.com/contribution-knitwear.html. [Accessed 8 June 2018].
Bangladesh Public-Private Partnership Act, 2015. Act no.18 of 2015. Available at https://www.pppo.gov.bd/download/ppp office/PPP Law 2015 (Approved Translation).pdf.
[Accessed 6 June 2018].
Banglapedia 2015. Air pollution. Banglapedia: national encyclopedia of Bangladesh, 25 September.
Available at http://en.banglapedia.org/index.php?title=Air Pollution. [Accessed 5 June 2018]. Barbier, E. B. 1997. Introduction to the environmental Kuznets curve special issue. Environment and
Development Economics, 2(4), pp.357-367.
Barro, R. J. & Sala-I-Martin, X. 1995. Technological diffusion, convergence, and growth. Working paper 5151, National Bureau of Economic Research, Cambridge, MA. Available at
https://www.nber.org/papers/w5151.pdf. [Accessed 12 January 2017].
Bartels, F. L., Alladina, S. N. & Lederer, S. 2009. Foreign direct investment in Sub-Saharan Africa:
motivating factors and policy issues. Journal of African Business, 10(2), pp.141-162. Basu, P., Chakraborty, C. & Reagle, D. 2003. Liberalization, FDI, and growth in developing countries:
a panel cointegration approach. Economic Inquiry, 41(3), pp.510-516.
Basu, P. & Guariglia, A. 2007. Foreign direct investment, inequality, and growth. Journal of Macroeconomics, 29(4), pp.824-839.
Bearnot, E. 2013. Bangladesh: a labour paradox. World Policy Journal, 30(3), pp.88-97. Available at
https://doi.org/10.1177/0740277513506386. [Accessed 11 November 2017]. Beckerman, W. 1994. 'Sustainable development': is it a useful concept? Environmental Values, 3(3),
pp.191-209.
Beder, S. 1994. The role of technology in sustainable development. IEEE Technology and Society
Magazine, 13(4), pp.14-19.
243
Beer, L. & Boswell, T. 2002. The resilience of dependency effects in explaining income inequality in
the global economy: a cross national analysis, 1975-1995. Journal of World-Systems Research, 8(1), pp.30-59.
Begum, M., Salahuddin, M., Chowdhury, M. & Wahid, A. N. 2018. Foreign direct investment-growth
nexus revisited: new evidence from Bangladesh. International Journal of Economics and Financial Issues, 8(3), pp.168-174.
Beugelsdijk, S., Smeets, R. & Zwinkels, R. 2008. The impact of horizontal and vertical FDI on host's
country economic growth. International Business Review, 17(4), pp.452-472.
Belal, A. R., Cooper, S. M. & Khan, N. A. 2015. Corporate environmental responsibility and accountability: what chance in vulnerable Bangladesh? Critical Perspectives on Accounting,
33, pp.44-58.
Belal, A. R. & Roberts, R. W. 2010. Stakeholders’ perceptions of corporate social reporting in Bangladesh. Journal of Business Ethics, 97(2), pp.311-324.
Bellak, C. & Leibrecht, M. 2009. Do low corporate income tax rates attract FDI? evidence from
Central-and East European countries. Applied Economics, 41(21), pp.2691-2703.
Bengoa, M. & Sanchez-Robles, B. 2003. Foreign direct investment, economic freedom and growth: new evidence from Latin America. European Journal of Political Economy, 19(3), pp.529-
545.
Bhandari, B. 2006. Essays on foreign direct investment and income inequality and cross-price effects in the US trade balance. Doctoral thesis, University of Oregon. Available at
https://search.proquest.com/docview/305252377?pq-origsite=gscholar. [Accessed 28 July
2017]. Bhandari, B. 2007. Effect of inward foreign direct investment on income inequality in transition
countries. Journal of Economic Integration, 22(4), pp.888-928.
Bharadwaj, A. 2014. Reviving the globalization and poverty debate: effects of real and financial
integration on the developing world. Advances in Economics and Business, 2(1), pp.42-57. Bhattacharya, D. 1998. Export Processing Zones in Bangladesh: economic impact and social Issues.
Multinational enterprises working paper 80, International Labour Organization, Geneva.
Available at https://www.ilo.org/wcmsp5/groups/public/---ed emp/---emp ent/---multi/documents/publication/wcms 126103.pdf. [Accessed 27 August 2018]
Bhattacharya, D. 2003. State of the Bangladesh economy in FY 2003. Centre for Policy Dialogue.
Available at http://cpd.org.bd/downloads/IRBD/INT03-01.pdf. [Accessed 10 September 2018].
Bhattacharya, D., Rahman, M. & Raihan, A. 2002. Contribution of the RMG Sector to the Bangladesh
economy. Occasional paper series 50(6), Centre for Policy Dialogue. Available at
https://www.researchgate.net/publication/5224225 Contribution of the RMG Sector to theBangladesh Economy. [Accessed 27 August 2018].
Bhuyan, M., Bakar, M., Hoque, M., Sharif, A. & Islam, M. 2017. Industrial pollution and its effects on
fish in Bangladesh: a review. Indian Journal of Science, 24(90), pp.46-57. Biglaiser, G. & Derouen, K. 2010. The effects of IMF programs on US foreign direct investment in the
developing world. The Review of International Organizations, 5(1), pp.73-95.
Biswas, R. 2002. Determinants of foreign direct investment. Review of Development Economics, 6(3),
pp.492-504. Blackman, A. & WU, X. 1999. Foreign direct investment in China's power sector: trends, benefits and
barriers. Energy Policy, 27(12), pp.695-711.
Blake, A., Deng, Z. & Falvey, R. 2009. How does the productivity of foreign direct investment spill over to local firms in Chinese manufacturing? Journal of Chinese Economic and Business
Studies, 7(2), pp.183-197.
Blomström, M. & Kokko, A. 1999. How foreign investment affects host countries. Policy research working paper series 1745, World Bank. Available at
https://papers.ssrn.com/sol3/papers.cfm?abstract id=620572. [Accessed 8 July 2017].
Blomström, M. & Kokko, A. 2001. FDI and human capital: a research agenda. Paper presented in
OECD technical meeting on FDI, human capital and education in developing countries,13-14 December, OECD, Paris. Available at http://www.oecd.org/dev/2699493.pdf. [Accessed 5
April 2017].
244
Blomstrom, M. & Kokko, A. 2003. Human capital and inward FDI. IDEAS working paper series,
167, RePEc. Available at https://swopec.hhs.se/eijswp/papers/eijswp0167.pdf. [Accessed 8 February 2017].
Blomström, M., Kokko, A. & Globerman, S. 2001. The determinants of host country spillovers from
foreign direct investment: a review and synthesis of the literature. Working paper 76, The European Institute of Japanese Studies, Strockholm, Sweden. Available at
https://pdfs.semanticscholar.org/0682/4f2f915eecc483e55de4370ec206a65bc347.pdf.
[Accessed 8 June 2017].
Blomstrom, M., Lipsey, R. E. & Zejan, M. 1992. What explains developing country growth? Working paper 4132, National Bureau of Economic Research. Available at
https://www.researchgate.net/publication/5192107 What Explains Developing Country Gro
wth. [Accessed 3 February 2017]. Böhringer, C. & Jochem, P. E. 2007. Measuring the immeasurable–a survey of sustainability indices.
Ecological Economics, 63(1), pp.1-8.
Borensztein, E., DE Gregorio, J. & Lee, J.-W. 1998. How does foreign direct investment affect
economic growth? Journal of International Economics, 45(1), pp.115-135. Bornschier, V. & Chase-Dunn, C. 1985. Transnational corporations and underdevelopment, Praeger
Publishers, NY.
Botrić, V. & Škuflić, L. 2006. Main determinants of foreign direct investment in the southeast European countries. Transition Studies Review, 13(2), pp.359-377.
Bound, J., Jaeger, D. A. & Baker, R. M. 1995. Problems with instrumental variables estimation when
the correlation between the instruments and the endogenous explanatory variable is weak. Journal of the American Statistical Association, 90(430), pp.443-450.
Brahim, M. & Rachdi, H. 2014. Foreign direct investment, institutions and economic growth: evidence
from the MENA region. Journal of Reviews on Global Economics, 3, pp.328-339.
Bruhn, N. C. P. & Calegario, C. L. L. 2014. Productivity spillovers from foreign direct investment in the Brazilian processing industry. BAR-Brazilian Administration Review, 11(1), pp.22-46.
Buffie, E. F. 1993. Foreign direct investment, crowding out, and underemployment in the dualistic
economy. Oxford Economic Papers, 45(4), pp.639-667. Business Anti Corruption Portal 2018. Bangladesh corruption report. Available at
https://www.business-anti-corruption.com/country-profiles/bangladesh/. [Accessed 1
December 2018]. Busse, M. & Cardosa, J. L. G. 2006. Foreign direct investment, regulations and growth. Working
paper series 3882, World Bank. Available at
https://openknowledge.worldbank.org/bitstream/handle/10986/8728/wps3882.pdf?sequence=1
. [Accessed 23 May 2018]. Busse, M. & Hefeker, C. 2007. Political risk, institutions and foreign direct investment. European
Journal of Political Economy, 23(2), pp.397-415.
Büthe, T. & Milner, H. V. 2008. The politics of foreign direct investment into developing countries: increasing FDI through international trade agreements. American Journal of Political Science,
52(4), pp.741-762.
Calvo, C. C. & Hernandez, M. A. 2006. Foreign direct investment and poverty in Latin America.
Paper delivered at the globalisation and economic policy fifth annual postgraduate conference, University of Nottingham. Available at
http://beta.nottingham.ac.uk/gep/documents/conferences/2006/postgradconf2006/hernandez-
postgradconf2006.pdf. [Accessed 8 January 2019]. Cameron, S. 1994. A review of the econometric evidence on the effects of capital punishment. The
Journal of Socio-Economics, 23(1), pp.197-214.
Capasso, M., Hansen, T., Heiberg, J., Klitkou, A. & Steen, M. 2019. Green growth–a synthesis of scientific findings. Technological Forecasting and Social Change, 146, pp.390-402.
Carkovic, M. V. & Levine, R. 2002. Does foreign direct investment accelerate economic growth?
Working paper, Department of Finance, University of Minnesota. Available at
http://siteresources.worldbank.org/INTFR/Resources/fdi.pdf. [Accessed 8 January 2018] Caves, R. E. 1996. Multinational enterprise and economic analysis, Cambridge University Press, UK.

245
Central Intelligence Agency (CIA). The World Factbook. Available at
https://www.cia.gov/library/publications/the-world-factbook/fields/220.html. [Accessed 18 December 2019].
Chakrabarti, A. 2001. The determinants of foreign direct investments: sensitivity analyses of cross‐
country regressions. Kyklos, 54(1), pp.89-114. Chandran, V. & Tang, C. F. 2013. The impacts of transport energy consumption, foreign direct
investment and income on CO2 emissions in ASEAN-5 economies. Renewable and
Sustainable Energy Reviews, 24, pp.445-453.
Changyuan, L. 2007. FDI, domestic capital and economic growth: evidence from panel data at China’s provincial level. Frontiers of Economics in China, 2(1), pp.92-113.
Chen, C., Sheng, Y. & Findlay, C. 2013. Export spillovers of FDI on China's domestic firms. Review
of International Economics, 21(5), pp.841-856. Chintrakarn, P., Herzer, D. & Nunnenkamp, P. 2012. FDI and income inequality: evidence from a
panel of US states. Economic Inquiry, 50(3), pp.788-801.
Choe, J.I. 2003. Do foreign direct investment and gross domestic investment promote economic
growth? Review of Development Economics, 7(1), pp.44-57. Choi, C. 2006. Does foreign direct investment affect domestic income inequality? Applied Economics
Letters, 13, pp.811-814.
Choong, C.-K. & Lim, K.-P. 2009. Foreign direct investment, financial development, and economic growth: the case of Malaysia. Macroeconomics and Finance in Emerging Market Economies,
2(1), pp.13-30.
Christmann, P. & Taylor, G. 2001. Globalization and the environment: determinants of firm self-regulation in China. Journal of International Business Studies, 32(3), pp.439-458.
Chudnovsky, D. & López, A. 2008. Foreign investment and sustainable development in Argentina.
Discussion paper 12, Working Group on Development and Environment in the Americas.
Available at https://sustainabledevelopment.un.org/content/documents/857argentina.pdf. [Accessed 28 January 2019].
Clarke, T. & Klettner, A. L. 2007. Tip of the iceberg? corporate social responsibility and
sustainability: the new business imperatives? an international comparison. Financial Services Institute of Australasia (FINSIA), pp 1-52. Available at
https://opus.lib.uts.edu.au/handle/10453/12243. [Accessed 13 February 2019].
Cleeve, E. 2008. How effective are fiscal incentives to attract FDI to Sub-Saharan Africa? The Journal of Developing Areas, 42(1), pp.135-153.
Cole, M. A. 2003. Development, trade, and the environment: how robust is the environmental Kuznets
curve? Environment and Development Economics, 8(4), pp.557-580.
Cole, M.A.& Elliott, R.J. 2003. Determining the trade–environment composition effect: the role of capital, labour and environmental regulations. Journal of Environmental Economics and
Management, 46(3), pp.363-383.
Cole, M. A. & Elliott, R. J. 2005. FDI and the capital intensity of 'dirty' sectors: a missing piece of the pollution haven puzzle. Review of Development Economics, 9(4), pp.530-548.
Colen, L., Maertens, M. & Swinnen, J. 2009. Foreign direct investment as an engine for economic
growth and human development: a review of the arguments and empirical evidence. Human
Rights and International Legal Discourse, 3(2), pp.177-227. Copeland, B. R. & Taylor, M. S. 1994. North-south trade and the environment. The Quarterly Journal
of Economics, pp.755-787.
Copeland, B. R. & Taylor, M. S. 2013. Trade and the environment: theory and evidence, Princeton University Press, United States.
Cornell University, INSEAD & WIPO 2018. The global innovation index 2018 ranking. In Dutta, S.,
Reynoso, R. E., Garanasvili, A., Saxena, K., Lanvin, B., Wunsch-Vincent, S., León, L. R. & Guadagno, F. (eds.), Global innovation index 2018: energizing the world with innovation,
pp.xx-xli, Geneva. Available at
https://www.wipo.int/edocs/pubdocs/en/wipo pub gii 2018.pdf. [Accessed 3 March 2019].
Costanza, R. 1991a. Assuring sustainability of ecological economic systems. In R. Costanza (ed.), Ecological economics: the science and management of sustainability, pp.331-343, Columbia
University Press.

246
Costanza, R. 1991b. The ecological economics of sustainability. In R. Goodland, H. Daly, S.E. Serafy
& B.V. Droste (eds.), Environmentally sustainable economic development: building on Brundtland, pp.83-90, UNESCO, Paris.
Cowgill, M., Luebke, M. & Xia, C. 2015. Minimum wages in the global garment industry: update for
2015. Research note, December, ILO. Available at https://www.ilo.org/wcmsp5/groups/public/---ed protect/---protrav/---
travail/documents/publication/wcms 436867.pdf. [Accessed 17 December 2018].
Craigwell, R. 2006. Foreign direct investment and employment in the English and Dutch-speaking
Caribbean. Project Report, ILO, Trinidad and Tobago. Available at https://www.ilo.org/wcmsp5/groups/public/---americas/---ro-lima/---sro-
port of spain/documents/meetingdocument/wcms 306245.pdf. [Accessed 15 December
2018]. Daly, H. E. 1991. Elements of environmental macroeconomics. In R. Contaza (ed.), Ecological
Economics: The Science and Management of Sustainability, pp.32-46, Columbia University
Press.
Daly, H. E. 1995. On Wilfred Beckerman's critique of sustainable development. Environmental Values, 4(1), pp.49-55.
Dasgupta, P. 2007. The idea of sustainable development. Sustainability Science, 2(1), pp.5-11.
Dasgupta, P., Levin, S. & Lubchenco, J. 2000a. Economic pathways to ecological sustainability. BioScience, 50(4), pp.339-345.
Dasgupta, P. & Serageldin, I. 1999. Social capital: a multifaceted perspective, World Bank,
Washington DC. Available at https://doi.org/10.1596/0-8213-4562-1. [Accessed 10 December 2017].
Dasgupta, S., Hettige, H. & Wheeler, D. 2000b. What improves environmental compliance? evidence
from Mexican industry. Journal of Environmental Economics and Management, 39(1), pp.39-
66. De Bruyn, S. M., Van Den Bergh, J. C. & Opschoor, J. B. 1998. Economic growth and emissions:
reconsidering the empirical basis of environmental Kuznets curves. Ecological Economics,
25(2), pp.161-175. De Mello, L. R. 1999. Foreign direct investment-led growth: evidence from time series and panel data.
Oxford Economic Papers, 51(1), pp.133-151.
Dickey, D. A. & Fuller, W. A. 1979. Distribution of the estimators for autoregressive time series with a unit root. Journal of the American Statistical Association, 74(36a), pp.427-431.
Dickey, D. A. & Fuller, W. A. 1981. Likelihood ratio statistics for autoregressive time series with a
unit root. Econometrica: Journal of the Econometric Society, 49(4), pp.1057-1072.
Dizaji, S. F. 2016. Oil rents, political institutions, and income inequality in Iran. In M.R. Farzanegan & P. Alaedini (eds.), Economic welfare and inequality in Iran, pp. 85-109, Palgrave
Macmillan, New York.
Department of Environment, Ministry of Environment and Forests (DOE) 2010. A guide to environmental clearance procedure, Ministry of Environment and Forests, The Government
of Bangladesh. Available at
http://doe.portal.gov.bd/sites/default/files/files/doe.portal.gov.bd/page/71a829c3 6b74 4ee9
90a6 158e2898b228/Environmental%20Clearance%20Procedure.pdf. [Accessed 15 December 2018].
Dollar, D. & Kraay, A. 2001. Trade, growth, and poverty, World Bank, Washington DC. Available at
https://elibrary.worldbank.org/doi/pdf/10.1596/1813-9450-2615. [Accessed 17 December 2018].
Doytch, N. & Narayan, S. 2016. Does FDI influence renewable energy consumption? an analysis of
sectoral FDI impact on renewable and non-renewable industrial energy consumption. Energy Economics, 54, pp.291-301.
Doytch, N. & Uctum, M. 2016. Globalization and the environmental impact of sectoral FDI. Economic
Systems, 40(4), pp.582-594.
Du, L., Harrison, A. & Jefferson, G. H. 2012. Testing for horizontal and vertical foreign investment spillovers in China, 1998–2007. Journal of Asian Economics, 23(3), pp.234-243.
247
Dumciuviene, D. & Paleviciene, A. 2017. Finding the determinants of FDI Inflows to EU member
states. In M.H. Biling, H. Danis, E. Demir & U. Can (eds.), Country experiences in economic development, management and entrepreneurship: proceedings of the 17th Eurasia Business
and Economics Society Conference, pp.139-149, Springer, New York.
Dunning, J. H. 1988. The eclectic paradigm of international production: a restatement and some possible extensions. Journal of International Business Studies, 19(1), pp.1-31.
Dunning, J. H. 2000. The eclectic paradigm as an envelope for economic and business theories of
MNE activity. International Business Review, 9(2), pp.163-190.
Dunning, J. H. 2001. The eclectic (OLI) paradigm of international production: past, present and future. International Journal of the Economics of Business, 8(2), pp.173-190.
Dunning, J. H. & Lundan, S. M. 2008. Multinational enterprises and the global economy, Edward
Elgar Publishing. Dupasquier, C. & Osakwe, P. N. 2006. Foreign direct investment in Africa: performance, challenges,
and responsibilities. Journal of Asian Economics, 17(2), pp.241-260.
Eckstein, D., Künzel, V. & Schafer, L. 2017. Global climate risk index 2018: who suffers most from
extreme weather events? weather-related loss events in 2016 and 1997 to 2016, Germanwatch. Available at https://germanwatch.org/sites/germanwatch.org/files/publication/20432.pdf.
[Accessed 17 January 2018].
Ehijiele, E., Sunday, A. & Nuruddeen, L. 2016. Foreign direct investment and its effect on the manufacturing sector in Nigeria. International Journal of Scientific and Research
Publications, 6(5), pp.671-679.
Ekanayake, E.M. & Ledgerwood, J.R. 2010. How does foreign direct investment affect growth in developing countries? An empirical investigation. The International Journal of Business and
Finance Research, 4(3), pp.43-53.
Elboiashi, H. A. 2011. The effect of FDI and other foreign capital inflows on growth and investment in
developing economies. Doctoral thesis, University of Glasgow. Available at https://pdfs.semanticscholar.org/649f/486319e087577a2b55b26a676361046e5323.pdf? ga=2.
133981902.1782206733.1565680884-884099293.1559628433. [Accessed 17 June 2017].
Engle, R. F. & Granger, C. W. 1987. Co-integration and error correction: representation, estimation, and testing. Econometrica: Journal of the Econometric Society, 55(2), pp.251-276.
Eskeland, G. & Harrison, A. 2003. Moving to greener pastures? multinationals and the pollution haven
hypothesis. Journal of Development Economics, 70(1), pp.1-23. Evans, P. B. 1979. Dependent development: the alliance of multinational, state, and local capital in
Brazil, Princeton University Press.
Eze, A.A., Nnaji, M. & Nkalu, N.C. 2019. Impact of foreign direct investment on manufacturing
sector output growth in Nigeria. International Journal of Applied Economics, Finance and Accounting, 5(2), pp.55-64.
Faeth, I. 2009. Determinants of foreign direct investment–a tale of nine theoretical models. Journal of
Economic Surveys, 23(1), pp.165-196. Faruk, M. O. 2015. The effect of FDI to accelerate the economic growth of Bangladesh and some
problems & prospects of FDI. Asian Business Review, 2(2), pp.37-43.
Faucheux, S. & O’connor, M. 1999. Natural capital and the national product: a controversial terrain.
International Journal of Development Planning Literature, 14(2), pp.233-274. Federico, S. & Alfredo, G. 2008. Outward FDI and local employment growth in Italy. Review of World
Economics, 144(2), pp.295-324.
Figini, P. & Görg, H. 1999. Multinational companies and wage inequality in the host country: the case of Ireland. Review of World Economics, 135(4), pp.594-612.
Ford, T. C., Rork, J. C. & Elmslie, B. T. 2008. Foreign direct investment, economic growth, and the
human capital threshold: evidence from US states. Review of International Economics, 16(1), pp.96-113.
Foreign Private Investment (Promotion and Protection) Act, 1980. Act no. 11 of 1980. Available at
http://bdlaws.minlaw.gov.bd/act-details-597.html. [Accessed 15 June 2019].
Fosfuri, A., Motta, M. & Rønde, T. 2001. Foreign direct investment and spillovers through workers’ mobility. Journal of International Economics, 53(1), pp.205-222.

248
Fowowe, B. & Shuaibu, M. I. 2014. Is foreign direct investment good for the poor? new evidence from
African countries. Economic Change and Restructuring, 47(4), pp.321-339. Gain, P., Moral, S., Raj, P. & Sircar, L. 2002. Bangladesh environment: facing the 21st century,
Society for Environment and Human Development.
Gallagher, K. P. & Zarsky, L. 2004. Sustainable industrial development? the performance of Mexico’s FDI-led integration strategy. Global Development and Environment Institute, Tufts
University. Available at
https://www.researchgate.net/profile/Lyuba Zarsky2/publication/242152472 Sustainable Ind
ustrial Development The Performance of Mexico's FDI-led Integration Strategy/links/0a85e. [Accessed 15 June 2017].
Gallagher, K. P. & Zarsky, L. 2005. No miracle drug: foreign direct investment and sustainable
development. In L. Zarsky (ed.), International investment for sustainable Development: balancing rights and rewards, pp.26-48, Routledge.
Garcia-Johnson, R. 2000. Exporting environmentalism: US multinational chemical corporations in
Brazil and Mexico, MIT Press, Cambridge, Massachusetts.
Gentry, B. S. 1998. Private capital flows and the environment: lessons from Latin America, Edward Elgar Publishing, Cheltenham.
Ghosh, S. K. & Sarker, S. 2015. Foreign direct investment and economic growth–an empirical study
on Bangladesh economy. International Journal of Economics and Business Research, 10(2), pp.167-178.
Girling, R. 1973. Dependency and persistent income inequality. In F. Bonilla & R. Girling (eds.),
Structures of Dependency, pp.83-101, Institute of Political Studies, Stanford. Glass, A. J. & Saggi, K. 2002. Intellectual property rights and foreign direct investment. Journal of
International Economics, 56(2), pp.387-410.
Gohou, G. & Soumaré, I. 2012. Does foreign direct investment reduce poverty in Africa and are there
regional differences? World Development, 40(1), pp.75-95. Gorg, H. 2000. Multinational companies and indirect employment: measurement and evidence.
Applied Economics, 32(14), pp.1809-1818.
Görg, H. & Greenaway, D. 2004. Do domestic firms really benefit from foreign direct investment? The World Bank Research Observer, 19(2), pp.171-197.
Görg, H., Hanley, A. & Seric, A. 2018. Corporate social responsibility in global supply chains: deeds
not words. Sustainability, 10(10), p.3675. Available at https://doi.org/10.3390/su10103675. [Accessed 12 November 2019].
Goudie, A. & Ladd, P. 1999. Economic growth, poverty and inequality. Journal of International
Development, 11(2), pp.177-195.
Government of Bangladesh (GOB) 2005. Bangladesh: poverty reduction strategy paper–PRSP, Ministry of Planning, The Government of Bangladesh.
Government of Bangladesh (GOB) 2011. Sixth five-year plan, Ministry of Planning, The Government
of Bangladesh. Government of Bangladesh (GOB) 2012. Perspective plan of Bangladesh 2010-2021: making vision
2021 a reality, Ministry of Planning, The Government of Bangladesh.
Government of Bangladesh (GOB) 2013. National sustainable development strategy 2010-21,
Ministry of Planning, The Government of Bangladesh. Government of Bangladesh (GOB) 2015a. 7th five-year plan (FY2016-FY2020): accelerating growth,
empowering citizens, Planning Commission, The Government of Bangladesh.
Government of Bangladesh (GOB) 2015b. A quarterly publication from the House of Tariff Commission Bangladesh. Journal of Tariff and Trade, Volume 1, January–March. Available
at
http://btc.portal.gov.bd/sites/default/files/files/btc.portal.gov.bd/publications/138c6dab 68144e26 8ee5 164b0287e164/Volume1issue1.pdf. [Accessed 15 December 2017].
Government of Bangladesh (GOB) 2016. Integration of sustainable development goals into the 7th
five year plan, General Economic Division, The Government of Bangladesh.
Government of Bangladesh (GOB) 2017. Bangladesh delta plan 2100 (draft report), General Economic Division, The Government of Bangladesh.
249
Granger, C. W. & Newbold, P. 1974. Spurious regressions in econometrics. Journal of Econometrics,
2(2), pp.111-120. Greenaway, D., Sousa, N. & Wakelin, K. 2004. Do domestic firms learn to export from
multinationals? European Journal of Political Economy, 20(4), pp.1027-1043.
Grimalda, G., Barlow, D. & Meschi, E. 2010. Varieties of capitalisms and varieties of performances: accounting for inequality in post‐Soviet Union transition economies. International Review of
Applied Economics, 24(3), pp.379-403.
Grimes, P. & Kentor, J. 2003. Exporting the greenhouse: foreign capital penetration and CO2
emissions 1980 to 1996. Journal of World-Systems Research, 9(2), pp.261-275. Grossman, G. M. & Helpman, E. 1993. Innovation and growth in the global economy, MIT Press.
Grossman, G. M. & Krueger, A. B. 1991. Environmental impacts of a North American free trade
agreement. Working paper 3914, National Bureau of Economic Research, Cambridge, MA. Grossman, G. M. & Krueger, A. B. 1995. Economic growth and the environment. The Quarterly
Journal of Economics, 110, pp.353-377.
Guoming, X., Cheng, Z., Yangui, Z., Shunqi, G. & Zhan, J. X. 1999. The interface between foreign
direct investment and the environment: the case of China. Report as part of the UNCTAD/DICM project, cross border environmental management in transnational
economies, occasional paper, 3, Copenhagen Business School. Available at
https://openarchive.cbs.dk/bitstream/handle/10398/6994/guoming.pdf?sequence=1. [Accessed 2 February 2019].
Habib, M. R. I. 2016. Backward linkages in the readymade garment industry of Bangladesh: appraisal
and policy implications. The South East Asian Journal of Management, 3(2), pp.129-146. Hailu, Z. A. 2010. Demand side factors affecting the inflow of foreign direct investment to African
countries: does capital market matter? International Journal of Business and Management,
5(5), pp.104-116.
Ha, J., Kose, M.A. & Ohnsorge, F. 2019. Inflation in emerging and developing economies: evolution, drivers, and policies, World Bank Publications. Available at
https://www.worldbank.org/en/research/publication/inflation-in-emerging-and-developing-
economies. [Accessed 10 December 2019]. Halder, P., Paul, N., Joardder, M. & Sarker, M. 2015. Energy scarcity and potential of renewable
energy in Bangladesh. Renewable and Sustainable Energy Reviews, 51, pp.1636-1649.
Halmos, K. 2011. The effect of FDI, exports and GDP on income inequality in 15 Eastern European countries. Acta Polytechnica Hungarica, 8(1), pp.123-136.
Hamilton, K. 1994. Green adjustments to GDP. Resources Policy, 20(3), pp.155-168.
Haque, M. 2013. Environmental governance: emerging challenges for Bangladesh, A H Development
Publishing House. Dhaka, Bangladesh. Haque, N. 2015. Implementing industrial energy efficiency (IEE) in Bangladesh lessons learned from
the textile and garment industry. International Journal of Environment, 5(1), pp.20-25.
Haque, R. 2017. Use and effectiveness of effluent treatment plants (ETPs) in the garments industry of Bangladesh: a water sector integrity perspective, Transparency International, Bangladesh.
Available at https://www.ti-
bangladesh.org/beta3/images/2017/ENRAC/ETP Use Effectiveness water-Integrity.pdf
[Accessed 17 December 2018]. Haque, M. 2018. Workers at 3000 subcontracting RMG units in danger. New Age Business, 17 April.
Available at http://www.newagebd.net/article/39148/workers-at-3000-subcontracting-rmg-
units-in-danger. [Accessed 12 January 2019]. Harbaugh, W. T., Levinson, A. & Wilson, D. M. 2002. Reexamining the empirical evidence for an
environmental Kuznets curve. The Review of Economics and Statistics, 84(3), pp.541-551.
Harinder Singh & Jun, K. W. 1995. Some new evidence on determinants of foreign direct investment in developing countries. Policy research working paper 1531, World Bank, Washington DC.
Harris, R. & Sollis, R. 2003. Applied time series modelling and forecasting, Wiley, West Sussex.
Hartwick, J. M. 1977. Intergenerational equity and the investing of rents from exhaustible resources.
The American Economic Review, 67(5), pp.972-974.
250
Hasan, R. & Leonas, K.K. 2018. Collaborative approach for water & energy conservation: clothing
industry of Bangladesh. Journal of Textile and Apparel, Technology and Management, 10(4). Available at https://ojs.cnr.ncsu.edu/index.php/JTATM/article/view/14724/6432. [Accessed
15 May 2019].
Haseeb, M., Hartani, N.H., Bakar, A., Azam, M. & Hassan, S. 2014. Exports, foreign direct investment and economic growth: empirical evidence from Malaysia (1971-2013). American
Journal of Applied Sciences, 11(6), pp.1010-1015.
Hassaballa, H. 2014. Testing for Granger causality between energy use and foreign direct investment
inflows in developing countries. Renewable and Sustainable Energy Reviews, 31, pp.417-426. Hassen, S. & Anis, O. 2012. Foreign direct investment (FDI) and economic growth: an approach in
terms of co-integration for the case of Tunisia. Journal of Applied Finance and Banking, 2(4),
pp.193-204. Haufler, V. 2001. A public role for the private sector: industry self-regulation in a global economy,
Carnegie Endowment for International Peace, Washington DC.
Hausmann, R. & Fernandez-Arias, E. 2000. Foreign direct investment: good cholesterol? Working
paper 348, Inter-American Development Bank (IDB). Available at http://dx.doi.org/10.2139/ssrn.1817215. [Accessed 5 June 2018].
Heerink, N., Mulatu, A. & Bulte, E. 2001. Income inequality and the environment: aggregation bias in
environmental Kuznets curves. Ecological Economics, 38(5), pp.359-367. Helal, M. & Hossain, M. A. 2013. Four decades of economic development of Bangladesh: an
assessment. Journal of the Asiatic Society of Bangladesh (Hum.), 58(2), pp.335-362.
Hemmer, H.-R., Krüger, R. & Seith, J. 2005. Foreign direct investment and income inequality revisited. In M. El-Sagi & G. Rubel (eds.), Aspects of international economics, pp.97-115,
Springer, New York.
Herzer, D. 2012. How does foreign direct investment really affect developing countries' growth?
Review of International Economics, 20(2), pp.396-414. Herzer, D. & Nunnenkamp, P. 2011. FDI and income inequality: evidence from Europe, Working
paper 1675, Kiel.
Hettige, H., Mani, M. & Wheeler, D. 2000. Industrial pollution in economic development: the environmental kuznets curve revisited. Journal of Development Economics, 62(2), pp.445-
476.
Hill, C. 2001. International business: competing in the global marketplace, Irwin/McGraw-Hill, Boston.
Hicks, J.R. 1932. Marginal productivity and the principle of variation. Economica, (35), pp.79-88.
Hilton, F. H. & Levinson, A. 1998. Factoring the environmental Kuznets curve: evidence from
automotive lead emissions. Journal of Environmental Economics and Management, 35(2), pp.126-141.
Hobday, M. 1994. Export‐led technology development in the four dragons: the case of electronics.
Development and Change, 25(2), pp.333-361. Hoffmann, R., Lee, C. G., Ramasamy, B. & Yeung, M. 2005. FDI and pollution: a Granger causality
test using panel data. Journal of International Development, 17(3), pp.311-317.
Holland, D. & Pain, N. 1998. The diffusion of innovations in Central and Eastern Europe: a study of
the determinants and impact of foreign direct investment, National Institute of Economic and Social Research, London. Available at
https://pdfs.semanticscholar.org/3112/9c01f3ca2743d48f3afb8113841faaa1343c.pdf.
[Accessed 17 March 2017]. Holtz-Eakin, D. & Selden, T. M. 1995. Stoking the fires? CO2 emissions and economic growth.
Journal of Public Economics, 57(1), pp.85-101.
Hoque, A. & Clarke, A. 2013. Greening of industries in Bangladesh: pollution prevention practices. Journal of Cleaner Production, 51, pp.47-56.
Hossain, A. 1995. Inflation, economic growth and the balance of payments in Bangladesh, University
Press Limited, Dhaka.
Hossain, J., Ahmed, M. & Sharif, J. H. 2018. Linking trade and decent work in global supply chains in Bangladesh, Friedrich-Ebert-Stiftung (FES), Bangladesh. Available at http://library.fes.de/pdf-
files/bueros/bangladesch/14406-20180614.pdf. [Accessed12 January 2019].
251
Hossain, M. & Ahmed, M. 2009. Exchange rate policy under floating regime in Bangladesh: an
assessment and strategic policy options. Working paper series 2, BIDS-PRP. Available at https://www.researchgate.net/publication/46445387 Exchange Rate Policy under Floating
Regime in Bangladesh An Assessment and Strategic Policy Options. [Accessed 13
August 2017]. Hossain, M. A. & Alauddin, M. 2005. Trade liberalization in Bangladesh: the process and its impact
on macro-variables particularly export expansion. The Journal of Developing Areas, 39(1),
pp.127-150.
Huang, C.-H., Teng, K.-F. & Tsai, P.-L. 2010. Inward and outward foreign direct investment and poverty: East Asia vs. Latin America. Review of World Economics, 146(4), pp.763-779.
Huang, Y. 2001. New horizons and policy challenges for foreign direct investment in the 21st century.
Global forum on international investment, 26-27 November, OECD, Mexico City, Mexico. Hung, T. T. 2005. Impacts of foreign direct investment on poverty reduction in Vietnam. Discussed
paper, GRIPS, Vietnam. Available at
http://www.grips.ac.jp/vietnam/VDFTokyo/Doc/18TTHungPaper.pdf. [Accessed 11 December
2017] Husain, H. 2016. Determinants of environmental degradation and empirical investigation of kuznets
curve: a comparative study of India and Bangladesh. Asian Journal of Empirical Research,
6(5), pp.131-141. Hussain, A., Majeed, S., Muhammad, S. D. & Lal, I. 2010. Impact of globalization on HDI (Human
Development Index): case ctudy of Pakistan. European Journal of Social Sciences, 13(1),
pp.46-55. Hussain, M. E. & Haque, M. 2016. Foreign direct investment, trade, and economic growth: an
empirical analysis of Bangladesh. Economies, 4 (2), p.7.
Iamsiraroj, S. 2016. The foreign direct investment-economic growth nexus. International Review of
Economics & Finance, 42, pp.116-133. Ijaiya, G. T., Ijaiya, M. A., Bello, R. A. & Ajayi, M. A. 2011. Economic growth and poverty reduction
in Nigeria. International Journal of Business and Social Science, 2(15), pp.147-154.
Index, E.P., 2018. Environmental performance index, Yale University and Columbia University, New Haven, CT, USA. Available at
https://epi.envirocenter.yale.edu/downloads/epi2018policymakerssummaryv01.pdf. [Accessed
17 May 2018]. International Energy Agency(IEA) 2010. World energy outlook 2010, International Energy Agency.
Available at https://webstore.iea.org/world-energy-outlook-2010. [Accessed 26 August 2018].
International Finance Corporation (IFC) 2012. Industry specific study on sustainable energy finance
market potential for financial institutions in Bangladesh, International Finance Corporation, World Bank Group, Washington DC. Available at
http://documents.worldbank.org/curated/pt/541541492769676554/pdf/114453-WP-BD-SEF-
Market-potential-study-Bangladesh-PUBLIC.pdf. [Accessed 15 December 2017]. International Finance Corporation (IFC) 2013. IFC jobs study: assessing private sector contributions
to job creation and poverty reduction, World Bank, Washington DC. Available at
http://documents.worldbank.org/curated/en/157191468326714061/pdf/835080WP0IFC0J00B
ox382079B00PUBLIC0.pdf. [Accessed 11 January 2017]. International Labour Organization (ILO). Employment injury insurance and protection: the Rana Plaza
accident and its aftermath, ILO. Available at
https://www.ilo.org/global/topics/geip/WCMS 614394/lang--en/index.htm. [Accessed 17 December 2018].
International Labour Organization (ILO) 2016. Wages and productivity in the garment sector in Asia
and the Pacific and the Arab states. Research notes, ILO, Geneva. Available at https://www.ilo.org/wcmsp5/groups/public/---asia/---ro-
bangkok/documents/publication/wcms 534369.pdf. [Accessed 17 December 2018].
International Monetary Fund (IMF) 1993. Balance of payment Manual 5, International Monetary
Fund, Washington, DC.

252
International Renewable Energy Agency (IRENA) 2014. REmap 2030: a renewable energy roadmap,
summary of findings, International Renewable Energy Agency, Abu Dhabi. Available at https://www.irena.org/-
/media/Files/IRENA/Agency/Publication/2014/IRENA REmap summary findings 2014.pdf.
[Accessed 17 March 2019]. Islam, F., Shahbaz, M. & Butt, M. S. 2013. Is there an environmental Kuznets curve for Bangladesh?
evidence from ARDL bounds testing approach. The Bangladesh Development Studies, pp.1-
23.
Islam, R. 2004. The nexus of economic growth, employment and poverty reduction: an empirical analysis. Issues in employment and poverty, discussion paper 14, Recovery and
Reconstruction Department, ILO, Geneva. Available at
http://www.ilo.int/wcmsp5/groups/public/---ed emp/documents/publication/wcms 120690.pdf. [Accessed 15 October 2017].
Islam, S. M. A. 2009. Inequality and economic growth in Bangladesh-a diversified evidence on
Kuznets pattern 'U' hypothesis. Journal of the Bangladesh Agricultural University, 7(1),
pp.117-123. Islam, S. & Khan, M.Z.R. 2017. A review of energy sector of Bangladesh. Energy Procedia, 110,
pp.611-618.
Israel, A. O. 2014. Impact of foreign direct investment on poverty reduction in Nigeria,(1980-2009). Journal of Economics and Sustainable Development, 5(20), pp.34-45.
Jalil, A. & Mahmud, S. F. 2009. Environment kuznets curve for CO2 emissions: a cointegration
analysis for China. Energy Policy, 37(12), pp.5167-5172. Jalilian, H. & Weiss, J. 2002. Foreign direct investment and poverty in the ASEAN region. ASEAN
Economic Bulletin 19(3), pp.231-53.
Jamali, D. 2010. The CSR of MNC subsidiaries in developing countries: global, local, substantive or
diluted? Journal of Business Ethics, 93, pp.181-200. Jarque, C. & Bera, A. 1980. Efficient tests for normality homoscedasticity and serial independence of
regression residuals. Econometric Letters 6(3), pp.255–259.
Jarque, C. & Bera, A. 1987. A test for normality of observations and regression residuals. International Statistical Review 55(2), pp.163–172.
Jaspersen, F. Z., Aylward, A. H. & Knox, A. D. 2000. The effects of risk on private investment: Africa
compared with other developing areas. In Collier, P. & Pattillo, C. (eds.), Investment and Risk in Africa, pp.71-95, St Martins Press, New York.
Jaumotte, F., Lall, S. & Papageorgiou, C. 2008. Rising income inequality: technology, or trade and
financial globalization? Working paper 185, International Monetary Fund, Washington, DC.
Jayanthakumaran, K. & Liu, Y. 2012. Openness and the environmental Kuznets curve: evidence from China. Economic Modelling, 29(3), pp.566-576.
Jha, V. 1999. Investment liberalization and environmental protection: conflicts and compatibilities in
the case of India. Occasional paper 1, UNCTAAD/DICM Project. Available at http://citeseerx.ist.psu.edu/viewdoc/download?doi=10.1.1.201.8615&rep=rep1&type=pdf.
[Accessed 12 March 2017].
Johansen, S. 1988. Statistical analysis of cointegration vectors. Journal of Economic Dynamics and
Control, 12(2-3), pp.231-254. Johansen, S. & Juselius, K. 1990. Maximum likelihood estimation and inference on cointegration–with
applications to the demand for money. Oxford Bulletin of Economics and Statistics, 52(2),
pp.169-210. Johansson, H. & Nilsson, L. 1997. Export process zone as catalysts. World Development, 25(12),
pp.2115-2128.
Johnson, A. 2006. The effects of FDI inflows on host country economic growth. working paper series 8, Centre of Excellence for Sudies in Science and Innovation, The Royal Institute of
Technology. Available at https://static.sys.kth.se/itm/wp/cesis/cesiswp58.pdf. [Accessed 10
March 2017].
Jordaan, J. A. 2005. Determinants of FDI-induced externalities: new empirical evidence for Mexican manufacturing industries. World Development, 33 (12), pp.2103-2118.
253
Kabir, M. R. 2014. Social impact assessment of water pollution: a case study on Bangshi River, Savar,
BRAC University, Bangladesh. Available at https://pdfs.semanticscholar.org/ded0/4871839d5cb3081d8e9cfbe722de12ace621.pdf.
[Accessed 10 December 2017].
Kacar, S. B. & Kayalica, M. O. 2014. Environmental Kuznets curve and sulfur emissions: a comparative econometric analysis. Environmental Economics, 5(1), pp.8-20.
Kakwani, N. 1993. Poverty and economic growth with application to Cote d'Ivoire. Review of Income
and Wealth, 39(2), pp.121-139.
Kandiero, T. & Chitiga, M. 2006. Trade openness and foreign direct investment in Africa. South African Journal of Economic and Management Sciences, 9(3), pp.355-370.
Kardos, M. 2014. The relevance of foreign direct investment for sustainable development: empirical
evidence from European Union. Procedia Economics and Finance, 15, pp.1349-1354. Kaya, G., Kayalica, M. O., Kumas, M. & Ulengin, B. 2017. The role of foreign direct investment and
trade on carbon emissions in Turkey. Environmental Economics, 8(1), pp.8-17.
Kemme, D. M., Nikolsko‐Rzhevskyy, A. & Mukherjee, D. 2014. Foreign capital, spillovers and export
performance in emerging economies: evidence from Indian IT firms. Review of Development Economics, 18(4), pp.681-692.
Khan, B. F. 2017. Governance of green growth in Bangladesh: policies, institutions, and political
economy, UK Department for International Development (DfID) and Adam Smith International,. Available at
https://www.greengrowthknowledge.org/sites/default/files/downloads/resource/Governance%
20for%20Green%20Growth%20in%20Bangladesh Policies%2C%20Institutions%2C%20and%20Political%20Economy 0.pdf. [Accessed 8 March 2017].
Khan, M., Alam, M., Islam, M., Hassan, M. & Al-Mansur, M. 2011. Environmental pollution around
Dhaka EPZ and its impact on surface and groundwater. Bangladesh Journal of Scientific and
Industrial Research, 46(2), pp.153-162. Khan, M. M. 2009. Governance and management of environmental policies in Bangladesh.
Environmental policy: a multi-national conference on policy analysis and teaching methods,
11 June–13 June 2009, KDI School of Public Policy and Management, Seoul, Korea. Available at http://www.umdcipe.org/conferences/epckdi/18.PDF. [Accessed 7 March 2017].
Khan, M. R. I. & Wichterich, C. 2015. Safety and labour conditions: the accord and the national
tripartite plan of action for the garment industry of Bangladesh. Working paper 38, Global Labour University. Available at
https://www.econstor.eu/bitstream/10419/121446/1/835378594.pdf. [Accessed 13 July2018].
Kim, H. S. & Baek, J. 2011. The environmental consequences of economic growth revisited.
Economics Bulletin, 31(2), pp.1-13. Kivyiro, P. & Arminen, H. 2014. Carbon dioxide emissions, energy consumption, economic growth,
and foreign direct investment: causality analysis for Sub-Saharan Africa. Energy, 74, pp.595-
606. Kiyota, K., Matsuura, T., Urata, S. & Wei, Y. 2008. Reconsidering the backward vertical linkages of
foreign affiliates: evidence from Japanese multinationals. World Development, 36(8), pp.1398-
1414.
Klein, M. U., Aaron, C. & Hadjimichael, B. 2001. Foreign direct investment and poverty reduction, World Bank, Washington DC. Available at
https://pdfs.semanticscholar.org/f726/718f6e33fc2a4a9a0e1b13086db4c56e2add.pdf.
[Accessed 12 August 2018]. Kok, R. & Acikgoz Ersoy, B. 2009. Analyses of FDI determinants in developing countries.
International Journal of Social Economics, 36(1/2), pp.105-123.
Kónya, L. 2006. Exports and growth: Granger causality analysis on OECD countries with a panel data approach. Economic Modelling, 23(6), pp.978-992.
Kostakis, I., Lolos, S. & Sardianou, E. 2016. Foreign direct investment and environmental
degradation: further evidence from Brazil and Singapore. MPRA paper 75643, Munich
Personal RePEC Archive. Available at https://mpra.ub.uni-muenchen.de/75643/. [Accessed 9 August 2017].
254
Krueger, A. O. 1978. Foreign trade regimes and economic development: liberalization attempts and
consequences, Lexington, MA. Kurtishi-Kastrati, S. 2013. The effects of foreign direct investments for host country's economy.
European Journal of Interdisciplinary Studies, 5(1), pp.26-38.
Kuznets, S. 1955. Economic growth and income inequality. The American Economic Review, 45(1), pp.1-28.
Kyereboah-Coleman, A. & Agyire-Tettey, K. F. 2008. Effect of exchange-rate volatility on foreign
direct investment in Sub-Saharan Africa: the case of Ghana. The Journal of Risk Finance,
9(1), pp.52-70. Laabas, B. & Abdmoulah, W. 2009. Determinants of Arab intraregional foreign direct investments.
Journal of Business & Policy Research, 4(2), pp.138-169.
Lall, S. 1993. Promoting technology development: the role of technology transfer and indigenous effort. Third World Quarterly, 14(1), pp.95-108.
Lall, S. 2000. Technological change and industrialization in the Asian newly industrializing
economies: achievements and challenges. In L. Kim & R. R. Nelson (eds.), Technological
learning and innovation: experiences of newly industrialising economies, Chapter 2, pp. 13-68. Cambridge University Press, Cambridge, England. Available at
https://pdfs.semanticscholar.org/5bd5/f13aa72f83b8ad9ed6c45ca4dc614891d08f.pdf.
[Accessed 13 July2017]. Lee, E. & Vivarelli, M. 2006. The social impact of globalization in the developing countries.
International Labour Review, 145, pp.167-184.
Lee, J. W. 2013. The contribution of foreign direct investment to clean energy use, carbon emissions and economic growth. Energy Policy, 55, pp.483-489.
Levinson, A. 1996. Environmental regulations and manufacturers' location choices: evidence from the
census of manufactures. Journal of Public Economics, 62(1-2), pp.5-29.
Liang, F. H. 2017. Does foreign direct investment improve the productivity of domestic firms? technology spillovers, industry linkages, and firm capabilities. Research Policy, 46(1), pp.
138-159.
Lipton, M. & Ravallion, M. 1995. Poverty and policy. In H.Chenery & T.N. Srinivasan (eds.), Handbook of Development Economics, Edition 1, 3. pp.2551-2657, Elsevier.
Li, X. & Liu, X. 2005. Foreign direct investment and economic growth: an increasingly endogenous
relationship. World development, 33(3), pp.393-407. Locke, R. M. 2013. The promise and limits of private power: promoting labor standards in a global
economy, Cambridge University Press, Cambridge, England.
Locke, R. M. & Romis, M. 2007. Improving work conditions in a global supply chain. MIT Sloan
Management Review, 48(2), pp.54-62. Lucas, R. E. 1988. On the mechanics of economic development. Journal of Monetary Economics,
22(1), pp.3-42.
Mabey, N. & Mcnally, R. 1999. Foreign direct investment and the environment: from pollution havens to sustainable development. WWf-UK report, Godalming, UK. Available at
http://citeseerx.ist.psu.edu/viewdoc/download?doi=10.1.1.456.7872&rep=rep1&type=pdf.
[Accessed 13 January 2018].
Mackinnon, J. G. 1991. Critical values for cointegration tests. In R.F.Engle & C.W.J Granger (eds.), Long-run economic relationships: readings in cointegration , Chapter 13, pp.267-276. Oxford
University Press, Oxford, UK.
Mahmud, W., Ahmed, S. & Mahajan, S. 2008. Economic reforms, growth, and governance: the political economy aspects of Bangladesh’s development surprise. Working paper 22,
Commission on Growth and Development, The World Bank Group. Available at
http://documents.worldbank.org/curated/en/763541468013237841/pdf/577220NWP0Box353766B01PUBLIC10gcwp022web.pdf. [Accessed 10 February 2018].
Maji, I. K. & Habibullaha, M. S. 2015. Impact of economic growth, energy consumption and foreign
direct investment on CO2 emissions: evidence from Nigeria. World Applied Sciences Journal,
33(4), pp.640-645. Mankiw, N. G., Romer, D. & Weil, D. N. 1992. A contribution to the empirics of economic growth.
The Quarterly Journal of Economics, 107(2), pp.407-437.
255
Marton, C. & Hagert, M. 2017. The Effects of FDI on Renewable Energy Consumption. Bachelor
thesis, Laund University. Available at http://lup.lub.lu.se/luur/download?func=downloadFile&recordOId=8912090&fileOId=891209
4. [Accessed 13 October 2018].
Masud, A., Hoque, A., Hossain, M. S. & Hoque, M. R. 2013. Corporate social responsibility practices in garments sector of Bangladesh, a study of multinational garments, CSR view in Dhaka
EPZ. Developing Country Studies, 3(5), pp.27-37.
Masum, M. 2016. The Bangladesh textile-clothing industry: a demand-supply review. Social Systen
Research, 33, pp.109-139. Available at http://www.ritsumei.ac.jp/acd/re/ssrc/result/memoirs/kiyou33/33-05.pdf. [Accessed 11
July2018].
Mencinger, J. 2003. Does foreign direct investment always enhance economic growth? Kyklos, 56(4), pp.491-508.
Mhlanga, N., Blalock, G. & Christy, R. 2010. Understanding foreign direct investment in the Southern
African development community: an analysis based on project‐level data. Agricultural
Economics, 41(3-4), pp.337-347. Miah, M. K. 2015. Effective functioning of environment court. The Daily Star, 25 August. Available
at https://www.thedailystar.net/law-our-rights/effective-functioning-environment-court-
131956. [Accessed 13 July2018]. Mihaylova, S. 2015. Foreign direct investment and income inequality in Central and Eastern Europe.
Theoretical & Applied Economics, 22(2), pp.23-42.
Milanovic, B. 2002. Can we discern the effect of globalization on income distribution? evidence from household budget surveys. Policy research paper 2876, World Bank. Available at
http://citeseerx.ist.psu.edu/viewdoc/download?doi=10.1.1.19.3651&rep=rep1&type=pdf.
[Accessed 13 January 2018].
Millimet, D. L., List, J. A. & Stengos, T. 2003. The environmental Kuznets curve: real progress or misspecified models? The Review of Economics and Statistics, 85(4), pp.1038-1047.
Ministry of Finance (MOF). Economic review, Ministry of Finance, The Government of Bangladesh.
Available at https://mof.gov.bd/site/page/44e399b3-d378-41aa-86ff-8c4277eb0990/BangladeshEconomicReview. [Accessed 10 May 2018].
Ministry of Finance (MOF) 2016. Economic review 2016, Ministry of Finance, The Government of
Bangladesh. Available at https://mof.gov.bd/site/page/44e399b3-d378-41aa-86ff-8c4277eb0990/BangladeshEconomicReview. [Accessed 11 January 2017].
Ministry of Finance (MOF) 2017. Economic review 2017, Finance Division, Ministry of Finance, The
Government of Bangladesh. Available at https://mof.gov.bd/site/page/44e399b3-d378-41aa-
86ff-8c4277eb0990/BangladeshEconomicReview. [Accessed 10 December 2017]. Ministry of Finance (MOF) 2019. Economic review 2019, Finance Division, Ministry of Finance, The
Government of Bangladesh. Available at https://mof.portal.gov.bd/site/page/28ba57f5-59ff-
4426-970a-bf014242179e/Bangladesh-Economic-Review. [Accessed 10 December 2019]. Ministry of Foreign Affairs of the Netherlands (MOFAON) 2018. Climate change profile:
Bangladesh, The Government of the Netherlands. Available at
https://www.government.nl/documents/publications/2019/02/05/climate-change-profiles.
[Accessed 10 December 2018]. Mishra, B. R. 2011. Spill-over effects of foreign direct investment: an econometric study of Indian
firms. International Economics and Finance Journal, 8(1), pp.67-89.
Moazzem, K. G., Arfanuzzaman M., Halim, F.B., Reza, M. M. & Azim S. S. 2018. Performance of EPZ: RMG enterprises are they still better compared to non-EPZ enterprises? Policy Brief 15,
Centre for Policy Dialogue. Available at https://cpd.org.bd/wp-content/uploads/2018/09/PB-
15-Performance-of-EPZ-RMG-Enterprises-Are-They-Still-Better-Compared-to-Non-EPZ-Enterprises.pdf. [Accessed 10 March, 2019].
256
Moazzem, K. G. & Chowdhury, M. I. 2016. Green growth in Bangladesh – improving regulations,
monitoring and enforcement in the textile sector. SANDEE’s policy brief 96, 16 January. The South Asian Network for Development and Environmental Economics (SANDEE). Available
at
http://www.sandeeonline.org/uploads/documents/publication/1080 PUB Policy Brief 96 Mehruna.pdf. [Accessed 13 October 2017].
Mohamed, S. E. & Sidiropoulos, M. G. 2010. Another look at the determinants of foreign direct
investment in MENA countries: an empirical investigation. Journal of Economic
Development, 35(2), pp.75-95. Mol, A. P. & Carter, N. T. 2006. China's environmental governance in transition. Environmental
Politics, 15(2), pp.149-170.
Momin, M. A. 2006. Corporate social responsibility and reporting by multinational corporations in Bangladesh: an exploration. Doctoral thesis, University of Glasgow. Available at
http://theses.gla.ac.uk/1074/1/2006mominphd.pdf. [Accessed 13 July2018].
Moyeen, A. & Huq, A. 2010. Corporate social responsibility in multinational enterprises: A
developing country study. 24th annual conference proceeding, pp. 1-26, Australian and New Zealand Academy of Management (ANZAM).
Mudambi, R., Navarra, P. & Delios, A. 2013. Government regulation, corruption, and FDI. Asia
Pacific Journal of Management, 30(2), pp.487-511. Muhammad, A. 2014. Bangladesh garments: crisis and challenges. The Daily Star, 1 January.
Available at http://www.thedailystar.net/bangladesh-garments-crisis-and-challenges-4797.
[Accessed 17 August 2018]. Mullen, J. K. & Williams, M. 2005. Foreign direct investment and regional economic performance.
Kyklos, 58(2), pp.265-282.
Mulok, D., Kogid, M., Asid, R. & Lily, J. 2012. Is economic growth sufficient for poverty alleviation?
empirical evidence from Malaysia. Cuadernos de economía, 35(97), pp.26-32. Munasinghe, M. 1999. Is environmental degradation an inevitable consequence of economic growth?:
tunneling through the environmental Kuznets curve. Ecological Economics, 29(1), pp.89-109.
Mushtaq, M., Ahmad, K., Ahmed, S. & Nadeem, M. 2014. Impact of FDI on income distribution in selected SAARC countries. Journal of Applied Environmental and Biological Science, 4, pp.1-
10.
Mutenyo, J., Asmah, E. & Kalio, A. 2010. Does foreign direct investment crowd-out domestic private investment in Sub-Saharan Africa? The African Finance Journal, 12(1), pp.27-52.
Nachum, L., Ahmed, N., & Uramoto, Y. 2017. Corporate Governance and Sustainability of the global
value chain: Bangladesh ready-made garment industry, Bangladesh Institute of Development
Studies, Dhaka. Available at http://bids.org.bd/uploads/events/almanac2017/TS%206 P3 Nazneen%20Ahmed.pdf.
[Accessed 6 June 2018].
Nagaraja, B. 2013. Can sustainable development be achieved by the employment of foreign direct investment?…Yes. International Journal of Humanities and Social Science Invention, 2(5),
pp.41-47.
Nahman, A. & Antrobus, G. 2005. The environmental Kuznets curve: a literature survey. South
African Journal of Economics, 73(1), pp.105-120. Narayan, P.K. & Narayan, S. 2010. Carbon dioxide emissions and economic growth: panel data
evidence from developing countries. Energy policy, 38(1), pp.661-666.
Nath, N. 2012. Manufacturing Sector of Bangladesh-Growth, Structure and Strategies for Future Development. The biennial conference: global economy and vision 2021, 12-14 July.
Institution of Engineers, Dhaka.
National Board of Revenue (NBR). Tariff schedule, Ministry of Finance, The Government of Bangladesh. Available at http://nbr.gov.bd/taxtype/tariff-schedule/eng. [Accessed 12 June
2018].
Ndikumana, L. & Verick, S. 2008. The linkages between FDI and domestic investment: unravelling
the developmental impact of foreign investment in Sub‐Saharan Africa. Development Policy Review, 26(6), pp.713-726.
257
Neumayer, E. 2003. Weak versus strong sustainability: exploring the limits of two opposing
paradigms, Edward Elgar Publishing, Cheltenham, UK. Neumayer, E. & Spess, L. 2005. Do bilateral investment treaties increase foreign direct investment to
developing countries? World Development, 33(10), pp.1567-1585.
Newell, P. 2001. Environmental NGOs, TNCs, and the question of governance. In D. Stevis & V. Assetto (eds.), The international political economy of the environment: critical perspectives,
pp.85-107, Lynne Rienner Publishers, Boulder.
Nguyen, N. T. K. 2017. The long run and short run impacts of foreign direct investment and export on
economic growth of vietnam. Asian Economic and Financial Review, 7(5), pp.519-527. Nishat, A., Shammin, P., Faisal, I. & Junaid, J. 2001. Bangladesh environment outlook-2001, Centre
for Sustainable Development (CSD), Dhaka.
Nkoro, E. & Uko, A. K. 2016. Autoregressive Distributed Lag (ARDL) cointegration technique: application and interpretation. Journal of Statistical and Econometric Methods, 5(4), pp.63-91.
Nocke, V. & Yeaple, S. 2007. Cross-border mergers and acquisitions vs. greenfield foreign direct
investment: the role of firm heterogeneity. Journal of International Economics, 72(2), pp.336-
365. Noorbakhsh, F., Paloni, A. & Youssef, A. 2001. Human capital and FDI inflows to developing
countries: new empirical evidence. World Development, 29(9), pp.1593-1610.
Nordström, H. & Vaughan, S. 1999. Trade and the environment. WTO special studies 4, World Trade Organisation. Available at
https://www.wto.org/english/res e/booksp e/special study 4 e.pdf. [Accessed 10 August
2018]. Nunnenkamp, B. & Bremont, J. E. A. 2007. FDI in Mexico: an empirical assessment of employment
effects. Working paper1328, Kiel Institute for the World Economy (IfW).
Nunnenkamp, P. 2002. Determinants of FDI in developing countries: has globalization changed the
rules of the game? Working paper 112, Kiel Institute for the World Economy (IfW). Available at https://pdfs.semanticscholar.org/0325/4aba7b457425aaf793b088cdc049645e698c.pdf.
[Accessed 19 July 2017].
O’connor, D. 2000. Global capital flows and the environment in the 21st century. Working paper 161, OECD Development Centre. Available at https://www.oecd-
ilibrary.org/docserver/072873485602.pdf?expires=1565832541&id=id&accname=guest&ch
ecksum=1F3A2ECC2F5854BF30C96BAE8B93096B. [Accessed 24 July 2017]. Ogunniyi, M. B. & Igberi, C. O. 2014. The impact of foreign direct investment on poverty reduction in
Nigeria. Journal of Economics and Sustainable Development, 5(14), pp.73-89.
Ola-David, O. & Oyelaran-Oyeyinka, O. 2012. Can FDI foster inclusive innovation and technology
development in Africa. African economic conference on fostering inclusive and sustainable development in Africa in an age of global economic uncertainty, 30 October to 2 November.
Available at
https://www.afdb.org/fileadmin/uploads/afdb/Documents/Knowledge/AEC%202012%20-%20Can%20FDI%20Foster%20Inclusive%20Innovation%20and%20Technology%20Develop
ment%20in%20Africa.pdf. [Accessed 8 February 2018].
O'meara, G. 2015. Examining the determinants of foreign direct investment. Undergraduate Economic
Review, 11(1), p.13. Omri, A., Nguyen, D. K. & Rault, C. 2014. Causal interactions between CO2 emissions, FDI, and
economic growth: evidence from dynamic simultaneous-equation models. Economic
Modelling, 42, pp.382-389. Onimisi, A. T. 2014. Foreign direct investments and employment generation nexus in Nigeria. Journal
of Educational and Social Research, 4(5), pp.119-128.
Onyeiwu, S. & Shrestha, H. 2004. Determinants of foreign direct investment in Africa. Journal of Developing Societies, 20(1-2), pp.89-106.
Organisation for Economic Co-operation and Development (OECD)1996. OECD benchmark
definition of foreign direct investment, 3rd Edition, OECD Publishing, Paris. Available at
https://www.oecd.org/daf/inv/investment-policy/2090148.pdf. [Accessed 8 February 2017].
258
Organisation for Economic Co-operation and Development (OECD)1998. Open markets matter: the
benefits of trade and investment liberalisation, OECD, Paris. Available at http://www.oecd.org/trade/understanding-the-global-trading-system/why-open-markets-
matter/. [Accessed 9 March 2017].
Orgnnisation of Economic Cooperation and Development (OECD) 2000. Main determinants and impacts of foreign direct investment on China’s economy. Working papers on international
investment, 4, OECD, Paris.
Organisation for Economic Co-operation and Development (OECD) 2001. Foreign direct investment
and sustainable development. OECD global forum on international investment: new horizons and policy challenges for foreign direct investment, 26-27 November, Mexico. Available at
https://www.oecd.org/daf/inv/investmentstatisticsandanalysis/2408079.pdf. [Accessed 17 May
2018]. Organisation for Economic Co-operation and Development (OECD) 2002. Foreign direct investment:
maximising benefits, minimising cost, OECD Publishing, Paris. Available at
https://www.oecd.org/investment/investmentfordevelopment/1959815.pdf. [Accessed 17
March 2017]. Organisation for Economic Co-operation and Development (OECD) 2011a. OECD guidelines for
multinational enterprises, OECD Publishing, Paris. Available at
http://dx.doi.org/10.1787/9789264115415-en. [Accessed 17 March 2018]. Organisation for Economic Co-operation and Development (OECD) 2011b. ISIC Rev.3 Technology
intensity definition, OECD Directorate for Science, Technology and Industry. Available at
https://www.oecd.org/sti/ind/48350231.pdf. [Accessed 12 August 2019]. Organisation for Economic Co-operation and Development (OECD) 2015. Risk and return
characteristics of infrastructure investment in low-income countries. The 4th Meeting of the
G20 Development Working Group, 14-16 September, Antalya, Turkey. Available at
https://www.oecd.org/g20/topics/development/Report-on-Risk-and-Return-Characteristics-of-Infrastructure-Investment-in-Low-Income-Countries.pdf. [Accessed 18 September, 2019].
Organisation for Economic Co-operation and Development (OECD) 2018. Multinational enterprises in
the global economy heavily debated but hardly measured. Policy note, OECD. Available at https://www.oecd.org/industry/ind/MNEs-in-the-global-economy-policy-note.pdf. [Accessed
20 June 2018].
Osmani, S. R. 2005. The impact of globalization on poverty in Bangladesh. Working paper 65, Policy Integration Department, International Labour Organisation
Pan-Long, T. 1995. Foreign direct investment and income inequality: further evidence. World
Development, 23(3), pp.469-483.
Panayotou, T. 1997. Demystifying the environmental Kuznets curve: turning a black box into a policy tool. Environment and Development Economics, 2(4), pp.465-484.
Panayotou, T. 2000. Economic growth and the environment. CID working papers 56, Center for
International Development, Harvard University. Available at https://www.hks.harvard.edu/sites/default/files/centers/cid/files/publications/faculty-working-
papers/056.pdf. [Accessed 13 November 2017].
Pao, H.-T. & Tsai, C.-M. 2011. Multivariate Granger causality between CO2 emissions, energy
consumption, FDI (foreign direct investment) and GDP (gross domestic product): evidence from a panel of BRIC (Brazil, Russian Federation, India, and China) countries. Energy, 36(1),
pp.685-693.
Pärletun, J. 2008. The determinants of foreign direct investment: a regional analysis with focus on Belarus. Master's thesis, Lund University. Available at
https://lup.lub.lu.se/luur/download?func=downloadFile&recordOId=1336912&fileOId=1646
641. [Accessed 10 January 2017]. Parry, S. 2016. The true cost of your cheap clothes: slave wages for Bangladesh factory workers. South
China Morning Post, 11 June, 2016 Available at http://www.scmp.com/magazines/post-
magazine/article/1970431/true-cost-your-cheap-clothes-slave-wages-bangladesh-factory.
[Accessed 10 October 2018]. Pavel, O. F. 2016. Air pollution in Bangladesh. The Daily Observer, 24 June. Available at
http://www.observerbd.com/2016/06/24/157908.php. [Accessed 10 August 2017].

259
Pearce, D. W. & Atkinson, G. D. 1993. Capital theory and the measurement of sustainable
development: an indicator of weak sustainability”. Ecological Economics, 8(2), pp.103-108. Perman, R. & Stern, D. I. 2003. Evidence from panel unit root and cointegration tests that the
environmental Kuznets curve does not exist. Australian Journal of Agricultural and Resource
Economics, 47(3), pp.325-347. Perron, P. 1989. The great crash, the oil price shock, and the unit root hypothesis. Econometrica:
Journal of the Econometric Society, 57(6), pp.1361-1401.
Perron, P. 1994. Trend, unit root and structural change in macroeconomic time series. In B.B. Rao
(ed.), Cointegration for the applied economics, pp 113-146, Palgrave Macmillan. Perron, P. 1997. Further evidence on breaking trend functions in macroeconomic variables. Journal of
Econometrics, 80(2), pp.355-385.
Pesaran, H. & Shin, Y. 1997. An autoregressive distributed lag modelling approach to cointegration. The Ragnar Frisch Centennial symposium, March 3-5, 1995, Norwegian Academy of Science
and Letters. Available at
http://citeseerx.ist.psu.edu/viewdoc/download;jsessionid=1F9DDB93F0D2D95CB9FAC3E07
C21A0F6?doi=10.1.1.153.3246&rep=rep1&type=pdf. [Accessed 5 April 2017]. Pesaran, M. H., Shin, Y. & Smith, R. J. 2001. Bounds testing approaches to the analysis of level
relationships. Journal of Applied Econometrics, 16(3), pp.289-326.
Phillips, P. C. & Perron, P. 1988. Testing for a unit root in time series regression. Biometrika, 75(2), pp.335-346.
Porter, M. E. & Kramer, M. R. 2002. The competitive advantage of corporate philanthropy. Harvard
Business Review, 80(12), pp.56-68. Pradhan, J. 2007. Corporate social responsibility and poverty. CSR paper 33, Centre for Social
Research. Available at
http://dspace.nitrkl.ac.in/dspace/bitstream/2080/969/1/CSR Jpradhan1.pdf. [Accessed 5 April
2018]. Prahalad, C. K. 2012. Bottom of the pyramid as a source of breakthrough innovations. Journal of
Product Innovation Management, 29(1), pp.6-12.
Quasem, A. 2002. Backward linkages in the textile and clothing sector of Bangladesh. Paper presented in the executive forum on national export strategies organised by ITC and SECO,
Montreux, Switzerland. Available at
http://www.intracen.org/uploadedFiles/intracen.org/Content/Exporters/Sectoral Information/Manufactured Goods/Textiles/Backward%20Linkages%20in%20the%20Textile%20and%20
Clothing%20Sector%20of%20Bangladesh.pdf. [Accessed 5 April 2017].
Rahman, A. 2015. Impact of foreign direct investment on economic growth: empirical evidence from
Bangladesh. International Journal of Economics and Finance, 7(2), pp.178-185. Rahman Belal, A. 2001. A study of corporate social disclosures in Bangladesh. Managerial Auditing
Journal, 16(5), pp.274-289.
Rahman, H. 1992. Structural adjustment and macroeconomic performances in Bangladesh in the 1980s. The Bangladesh Development Studies, 20(3), pp.89-125.
Ramasamy, B. & Yeung, M. 2010. The determinants of foreign direct investment in services. The
World Economy, 33(4), pp.573-596.
Randall, S. 2011. Top-down assessment of air pollution and GHGs for Dhaka, Bangladesh: analysis of GAINS derived model data. Technical paper 3, Norwegian Institute of Air Research.
Available at http://www.indiaenvironmentportal.org.in/files/file/Top-
down%20Assessment%20of%20Air%20Pollution%20in%20Dhaka.pdf. [Accessed 5 October 2017].
Rashed, M.A., Alam, M.M. & Fahim, F. 2014. The performances and challenges of public-private
partnership (PPP) Projects in Bangladesh. Journal of Bangladesh Studies. Vol. 15(2), pp. 62-71.
Rashid, M. A. 2000. Impact of trade policy reforms on industrial capacity and employment in
Bangladesh. Report prepared for structural adjustment participatory review initiative, Dhaka,
Bangladesh. Available at http://itpc2015.ir/Content/upload/ban trade.pdf. [Accessed 9 September 2017].
260
Rasiah, R. 1999. Transnational corporations and the environment: the case of Malaysia Occasional
paper 4, Cross Border Environmental Management in Transnational Corporations, UNCTAD and Copenhagen Business School, Copenhagen.
Rasul, M. G., Faisal, I. & Khan, M. M. K. 2006. Environmental pollution generated from process
industries in Bangladesh. International Journal of Environment and Pollution, 28(1-2), pp.144-161.
Rayhan, I., Akter, K., Islam, S. & Hossain, A. 2018. Impact of urbanization and energy consumption
on CO2 emissions in Bangladesh: an ARDL bounds test approach. International Journal of
Scientific and Engineering Research 9(6), pp.838-843. Rayhan, M. A. 2014. Contribution of foreign direct investment to economic growth in Bangladesh.
Master's thesis, Eastern Illinois University. Available at https://thekeep.eiu.edu/theses/1339/.
[Accessed 1 October 2017]. Razzaque, A., Khondker, B. H., Ahmed, N. & Mujeri, M. K. 2003. Micro impacts of macroeconomic
and adjustment policies in Bangladesh. Focus study 03, Bangladesh Institute of Development
Studies. Available at https://idl-bnc-
idrc.dspacedirect.org/bitstream/handle/10625/31979/118892.pdf. [Accessed 8 January 2017]. Recalde, M.Y., Guzowski, C. & Zilio, M.I. 2014. Are modern economies following a sustainable
energy consumption path? Energy for sustainable development, 19, pp.151-161.
Reis, A. B. 2001. On the welfare effects of foreign investment. Journal of International Economics, 54(2), pp.411-427.
Reiter, S. L. & Steensma, H. K. 2010. Human development and foreign direct investment in
developing countries: the influence of FDI policy and corruption. World Development, 38(12), pp.1678-1691.
Reuters, T. 2013. How textile kings weave a hold on Bangladesh as retailers reap the rewards.
Financial Post, 3 May. Available at https://business.financialpost.com/news/retail-
marketing/how-textile-kings-weave-a-hold-on-bangladesh-as-retailers-reap-the-rewards. [Accessed 26 October 2017].
Ridzuan, A. R., Ismail, N. A. & Che Hamat, A. F. 2017. Does foreign direct investment successfully
lead to sustainable development in Singapore? Economies, 5(3), p.29. Ridzuan, A. R., Noor, A. H. M. & Ahmed, E. M. 2014. The Impact of foreign direct investment
towards carbon dioxide level: pollution havens model for ASEAN-5 countries. Asian Journal
of Agricultural Extension, Economics & Sociology 5(3), pp.392-404. Rizvi, S. Z. A. & Nishat, M. 2009. The impact of foreign direct investment on employment
opportunities: panel data analysis: empirical evidence from Pakistan, India and China. The
Pakistan Development Review, 48(4-II), pp.841-851.
Rodriguez-Clare, A. 1996. Multinationals, linkages, and economic development. The American Economic Review, American Economic Association, 86(4), 852-873.
Rodriguez, X. A. & Pallas, J. 2008. Determinants of foreign direct investment in Spain. Applied
Economics, 40(19), pp.2443-2450. Roemer, M. & Gugerty, M. K. 1997. Does economic growth reduce poverty? CAER II Discussion
paper 4, Cambridge, MA: Harvard Institute for International Development. Available at
http://citeseerx.ist.psu.edu/viewdoc/download?doi=10.1.1.525.7199&rep=rep1&type=pdf.
[Accessed 23September 2017]. Romer, P. M. 1986. Increasing returns and long-run growth. The Journal of Political Economy, 94(5),
pp.1002-1037. Available at http://www.dklevine.com/archive/refs42232.pdf. [Accessed 10
March 2017]. Romer, P.M. 1990. Endogenous technological change. Journal of Political Economy, 98(5), pp.S71–
S102.
Romer, P. M. 1997. Endogenous technological change. Journal of Political Economy, 98(5), pp.S71-S102. Available at http://web.stanford.edu/~klenow/Romer 1990.pdf. [Accessed 10 March
2017].
Rondinelli, D. & Vastag, G. 2000. Panacea, common sense, or just a label? The value of ISO 14001
environmental management systems. European Management Journal, 18(5), pp.499-510.
261
Root, F. R. & Ahmed, A. A. 1978. The influence of policy instruments on manufacturing direct
foreign investment in developing countries. Journal of International Business Studies, 9(3), pp.81-94.
Root, F. R. & Ahmed, A. A. 1979. Empirical determinants of manufacturing direct foreign investment
in developing countries. Economic Development and Cultural Change, 27(4), pp.751-767. Rothman, D. S. 1998. Environmental Kuznets curves–real progress or passing the buck?: a case for
consumption-based approaches. Ecological Economics, 25(2), pp.177-194.
Roy, S. & Mandal, K. K. 2012. Foreign direct investment and economic growth: an analysis for
selected Asian countries. Journal of Business Studies Quarterly, 4(1), pp.15-24. Ruranga, C., Ocaya, B. & Kaberuka, W. 2014. VAR analysis of economic growth, domestic
investment, foreign direct investment, domestic savings and trade in Rwanda. Greener Journal
of Economics and Accountancy, 3(2), pp.30-41. Ruud, A. 2002. Environmental management of transnational corporations in India–are TNCs creating
islands of environmental excellence in a sea of dirt? Business Strategy and the Environment,
11(2), pp.103-118.
Sagris, T. & Abbott, J. 2015. An analysis of industrial water use in Bangladesh with a focus on the textile and leather industries, 2030 Water Resources Group, Bangladesh. Available at
https://www.2030wrg.org/wp-content/uploads/2016/02/WRG-Bangladesh-Report.pdf.
[Accessed 10 December 2017]. Saha, B. K. 2014. Inland water pollution in Bangladesh: the need for regulatory reform. Doctoral
thesis, School of Law, University of Western Sydney (UWS). Available at
https://pdfs.semanticscholar.org/ed42/8d38444c4f5aaebd1b34a6000d90d1829ffc.pdf. [Accessed 5 October 2017].
Saiki, A. & Frost, J. 2014. How does unconventional monetary policy affect inequality? evidence from
Japan. CEP Working Paper 2, Council on Economic Policies. Available at
https://www.cepweb.org/wp-content/uploads/CEP WP Unconventional Monetary Policy and Inequality.pdf. [Accessed
20 May 2019].
Salim, R. A. 2003. Economic liberalization and productivity growth: further evidence from Bangladesh. Oxford Development Studies, 31(1), pp.85-98.
Schmitz, A. & Bieri, J. 1972. EEC tariffs and US direct investment. European Economic Review, 3(3),
pp.259-270. Schneider, F. & Frey, B. S. 1985. Economic and political determinants of foreign direct investment.
World Development, 13(2), pp.161-175.
Sekkat, K. & Veganzones‐Varoudakis, M. A. 2007. Openness, investment climate, and FDI in
developing countries. Review of Development Economics, 11(4), pp.607-620. Sen, A. 1986. Commodities and capabilities. The Economic Journal, 96(383), pp.820-822. Available
at https://www.jstor.org/stable/2232999. [Accessed 14 August 2018].
Sen, A. 1989. Development as capability expansion. Journal of Development Planning, 19, pp.41–58. Serageldin, I. 1996. Sustainability as opportunity and the problem of social capital. The Brown Journal
of World Affairs, 3(2), pp.187-203.
Shaari, M. S., Hussain, N. E., Abdullah, H. & Kamil, S. 2014. Relationship among foreign direct
investment, economic growth and CO2 emission: a panel data analysis. International Journal of Energy Economics and Policy, 4(4), pp.706-715.
Shahbaz, M., Nasreen, S., Abbas, F. & Anis, O. 2015. Does foreign direct investment impede
environmental quality in high-, middle-, and low-income countries? Energy Economics, 51, pp.275-287.
Shahzad, A., Al-Swidi, A. K., Mithani, D. A., Fadzil, F. H. B. & Golamuddin, A. G. B. 2012. An
empirical investigation on the effect of business environment factors on the FDI inflows in Pakistan: the moderating role of political stability. Business and Economic Research, 2(2),
pp.156-170.
Shamim, A., Azeem, P. & Naqvi, S. M. M. A. 2014. Impact of foreign direct investment on poverty
reduction in Pakistan. International Journal of Academic Research in Business and Social Sciences, 4(10), pp.465-490.
262
Sharif, S. I., Md, A., Al-Amin, M. & Md, A. 2018. The prospect of renewable energy resources in
Bangladesh: a study to achieve the national power demand. Energy and Power, 8(1), pp.1-6. Sharma, B. & Gani, A. 2004. The effects of foreign direct investment on human development. Global
Economy Journal, 4(2), pp. 1-18.
Shen, J. 2006. A simultaneous estimation of environmental Kuznets curve: evidence from China. China Economic Review, 17(4), pp.383-394.
Shin, Y., Yu, B. & Greenwood-Nimmo, M. 2014. Modelling asymmetric cointegration and dynamic
multipliers in a nonlinear ARDL framework. In R.C. Sickles & W.C.Horrace (eds.),
Festschrift in honor of Peter Schmidt, pp.281-314, Springer, New York. Singh, A. & Zammit, J. A. 1997. Foreign direct investment, development and the new global economic
order: a policy brief for the south. MPRA paper 53533, Munich Personal RePEc Archive.
Available at https://mpra.ub.uni-muenchen.de/53533/1/MPRA paper 53533.pdf. [Accessed 16 October 2017].
Sjö, B. 2008. Testing for unit roots and cointegration. Lectures in modern econometric time series
Analysis. Available at
https://pdfs.semanticscholar.org/7ce6/2a0c7f6dab85f264a5403bf9b99a0f20a156.pdf. [Accessed 5 November 2017].
Smarzynska, B. K. & Wei, S.-J. 2001. Pollution havens and foreign direct investment: dirty secret or
popular myth? Working paper series 8465, National Bureau of Economic Research. Available at https://www.nber.org/papers/w8465.pdf. [Accessed 5 October 2017].
Smarzynska Javorcik, B. 2004. Does foreign direct investment increase the productivity of domestic
firms? in search of spillovers through backward linkages. The American Economic Review, 94(3), pp.605-627.
Solow, R. M. 1956. A contribution to the theory of economic growth. The Quarterly Journal of
Economics, 70(1), pp.65-94. Available at http://piketty.pse.ens.fr/files/Solow1956.pdf.
[Accessed 5 January 2017]. Solow, R. M. 1957. Technical change and the aggregate production function. The Review of
Economics and Statistics, 39(3), pp. 312-320. Available at
http://www.piketty.pse.ens.fr/files/Solow1957.pdf. [Accessed 5 January 2017]. Solow, R. M. 1974. Intergenerational equity and exhaustible resources. The Review of Economic
Studies, 41, pp. 29-45. Available at http://folk.uio.no/gasheim/zSol1974.pdf. [Accessed 3
January 2018]. Solow, R. M. 1986. On the intergenerational allocation of natural resources. The Scandinavian Journal
of Economics, 88(1), pp.141-149. Available at
https://www.uio.no/studier/emner/sv/oekonomi/ECON4925/h16/pensumliste/solow on-the-
intergenerational-allocation-of-natural-resources.pdf. [Accessed 5 May 2017]. Sothan, S. 2017. Causality between foreign direct investment and economic growth for Cambodia.
Cogent Economics & Finance, 5(1). Available at
https://www.cogentoa.com/article/10.1080/23322039.2016.1277860. [Accessed 5 January 2017].
Soumaré, I. 2015. Does FDI improve economic development in North African countries? Applied
Economics, 47(51), pp.5510-5533.
Sustainable and Renewable Energy Development Authority (SREDA) 2016. Energy efficiency and conservation master plan up to 2030, SREDA, Power Division, Ministry of Power, The
Government of Bangladesh.
Sridharan, P. & Rao, K. 2010. Determinants of FDI in BRICS countries: a panel analysis. International Journal of Business Sciences and Applied Management, 5(3), pp.1-13.
Stern, D. I. & Common, M. S. 2001. Is there an environmental Kuznets curve for sulfur? Journal of
Environmental Economics and Management, 41(2), pp.162-178. Stretesky, P. B., Lynch, M. J., Long, M. A. & Barrett, K. L. 2017. Does the modernization of
environmental enforcement reduce toxic releases? an examination of self-policing, criminal
prosecutions, and toxic releases in the United States, 1988–2014. Sociological Spectrum,
37(1), pp.48-62. Sultana, S. & Uddin, M. S. 2013. Inflation: perspective Bangladesh: a trend analysis since
independence. The Bangladesh Accountant, April-June 2013, pp.27-42.

263
Sur, A. & Nandy, A. 2018. FDI, technical efficiency and spillovers: evidence from Indian automobile
industry. Cogent Economics & Finance, 6(1), pp.1-18. Sylwester, K. 2005. Foreign direct investment, growth and income inequality in less developed
countries. International Review of Applied Economics, 19(3), pp.289-300.
Tabassum, N. & Ahmed, S. P. 2014. Foreign direct investment and economic growth: evidence from Bangladesh. International Journal of Economics and Finance, 6(9), p.117.
Tang, J. 2015. Testing the pollution haven effect: does the type of FDI matter?. Environmental and
Resource Economics, 60(4), pp.549-578.
Textiles Today 2018. How ZDHC and sustainability can be implemented in Bangladesh textile industry. Textiles Today, 12 August. Available at https://www.textiletoday.com.bd/zdhc-
sustainability-can-implemented-bangladesh-textile-industry/. [Accessed 5 October 2018].
Thakur, P. & Burange, L. 2016. An analysis of productivity spillovers from foreign direct investment in India’s services sector. Foreign Trade Review, 51(4), pp.271-286.
The Bangladesh Economic Zone Act, 2010. Act no. 42 of 2010. Available at http://beza.gov.bd/wp-
content/uploads/2015/06/BEZA-Act-English.pdf. [Accessed 12 May 2019].
The Bangladesh Export Processing Zones Authority Act, 1980. Act no. 36 of 1980. Available at http://bdlaws.minlaw.gov.bd/act-608/section-10860.html. [Accessed 15 June 2018].
The Bangladesh Telecommunication Act, 2001. Act no. 18 of 2001. Available at
http://www.btrc.gov.bd/telecommunication-act-2001-english. [Accessed 12 May 2019]. The Daily Star 2016. 37,000 die from air pollution a year. The Daily Star, 28 September. Available at
https://www.thedailystar.net/backpage/air-pollution-kills-37000-people-every-year-1290760.
[Accessed 5 October 2017]. Torras, M. & Boyce, J. K. 1998. Income, inequality, and pollution: a reassessment of the
environmental Kuznets curve. Ecological Economics, 25(2), pp.147-160.
Transparency International (TIB) 2018. Corruption Perception Index 2017, Transparency
International, Berlin. Available at https://www.transparency.org/news/feature/corruption perceptions index 2017. [Accessed 5
April 2018].
Tsai, P.-L. 1994. Determinants of foreign direct investment and its impact on economic growth. Journal of Economic Development, 19(1), pp.137-163.
Tsai, P.-L. & Huang, C.-H. 2007. Openness, growth and poverty: the case of Taiwan. World
Development, 35(11), pp.1858-1871. Tuman, J. P. & Emmert, C. F. 2004. The political economy of US foreign direct investment in Latin
America: a reappraisal. Latin American Research Review, 39(3), pp.9-28.
Ucal, M., Haug, A. A. & Bilgin, M. H. 2016. Income inequality and FDI: evidence with Turkish data.
Applied Economics, 48(11), pp.1030-1045. Ucal, M. Ş. 2014. Panel data analysis of foreign direct investment and poverty from the perspective of
developing countries. Procedia-Social and Behavioral Sciences, 109, pp.1101-1105.
United Nations (UN) 2013. Report of the Secretary-General on mainstreaming of the three dimensions of sustainable development throughout the United Nations system, United Nations, New York.
Available at https://sustainabledevelopment.un.org/content/documents/1799sgreport.pdf.
[Accessed 12 August 2018].
United Nations General Assembly (UNGA) 2015. Transforming our world: the 2030 agenda for sustainable development, United Nations, New York. Available at
https://www.un.org/ga/search/view doc.asp?symbol=A/RES/70/1&Lang=E. [Accessed 12
August 2018]. United Nations Conference on Trade and Development (UNCTAD) 1993. World investment report
1993: transnational corporations and integrated international production, UNCTAD,
Geneva. Available at https://unctad.org/en/Docs/wir1993 en.pdf. [Accessed 12 August 2017]. United Nations Conference on Trade and Development (UNCTAD) 1998. World investment report
1998: trends and determinants, UNCTAD, Geneva. Available at
https://unctad.org/en/Docs/wir1998 en.pdf. [Accessed 10 April 2017].
United Nations Conference on Trade and Development (UNCTAD) 1999. World investment report 1999: foreign direct investment and the challenge of development, UNCTAD, Geneva.
Available at https://unctad.org/en/Docs/wir1999 en.pdf. [Accessed 10 April 2017].
264
United Nations Conference on Trade and Development (UNCTAD) 2001. World investment report
2001: promoting linkages, UNCTAD, Geneva. Available at https://unctad.org/en/Docs/wir2001 en.pdf. [Accessed 10 April 2017].
United Nations Conference on Trade and Development (UNCTAD) 2005. World investment report
2005: transnational corporations and the internationalization of R&D, UNCTAD, Geneva. Available at https://unctad.org/en/Docs/wir2005 en.pdf. [Accessed 10 April 2017].
United Nations Conference on Trade and Development (UNCTAD) 2008. World investment report
2008: transnational corporations and the infrastructure challenge, UNCTAD, Geneva.
Available at https://unctad.org/en/Docs/wir2008 en.pdf. [Accessed 10 April 2017]. United Nations Conference on Trade and Development (UNCTAD) 2012. Sector-specific investment
strategy and action plan, G20 indicators for measuring and maximizing economic value added
and job creation from private investment in specific value chains. Pilot study results, Bangladesh, UNCTAD. Available at
https://unctad.org/Sections/diae dir/docs/diae G20 Bangladesh en.pdf. [Accessed 1 January
2018].
United Nations Conference on Trade and Development (UNCTAD) 2013. Investment policy review Bangladesh, UNCTAD, Geneva. Available at
https://unctad.org/en/PublicationsLibrary/diaepcb2013d4 en.pdf. [Accessed 10 April 2017].
United Nations Conference on Trade and Development (UNCTAD) 2014. World investment report 2014: investing in the SDGs: an action plan, UNCTAD, Geneva. Available at
https://unctad.org/en/PublicationsLibrary/wir2014 en.pdf. [Accessed 10 April 2017].
United Nations Conference on Trade and Development (UNCTAD) 2017a. From decisions to actions: investment and enterprise development as catalysts for accomplishing the 2030 agenda for
sustainable development. Investment, enterprise and development commission, ninth session,
20-24 November 2017. Available at
https://unctad.org/en/pages/MeetingDetails.aspx?meetingid=1329. [Accessed 20 October 2018].
United Nations Conference on Trade and Development (UNCTAD) 2017b. World investment report
2017: investment and the digital economy, UNCTAD, Geneva. Available at https://unctad.org/en/PublicationsLibrary/wir2017 en.pdf. [Accessed 20 October 2018].
UNCTADSTAT 2018. Foreign direct investment: inward and outward flows and stock, annual data,
1970-2018. Available at http://unctadstat.unctad.org/wds/TableViewer/tableView.aspx?ReportId=96740
United Nations Development Programme (UNDP) 2016. Human development report 2016: human
development for everyone, UNDP, New York. Available at
http://hdr.undp.org/sites/default/files/2016 human development report.pdf. [Accessed 1 October 2018].
United Nations Development Programme (UNDP) 2018. Bangladesh quarterly update: October to
December 2017, United Nations Development Programme Country Office Dhaka, Bangladesh. Available at
https://www.undp.org/content/dam/bangladesh/docs/Publications/Pub-
2018/Bangladesh%20Quarterly%20Development%20Update.pdf. [Accessed 20 October
2018]. United Nations Development Programme (UNDP) 2019. Human development report 2016:beyond
income, beyond averages, beyond today:inequalities in human development in the 21st century,
UNDP, New York. Available at http://hdr.undp.org/sites/default/files/hdr2019.pdf.[Accessed 1 October 2019].
United Nations Environment Programme (UNEP) 2000. Environment and trade: a handbook, United
Nations Environment Programme, Nairobi. UN Global Compact 2013. The ten principles of the UN Global Compact, United Nations Global
Compact. Available at https://www.unglobalcompact.org/what-is-gc/mission/principles.
[Accessed 10 January 2018].
265
United Nations Industrial Development Organization (UNIDO) 2016. Industrial development report
2016: the role of technology and innovation in inclusive and sustainable development, UNIDO, Vienna, Austria. Available at https://www.unido.org/sites/default/files/2015-
12/EBOOK IDR2016 FULLREPORT 0.pdf. [Accessed 20 September 2017].
United Nations Industrial Development Organization (UNIDO) 2018a. Industrial development report 2018: demand for manufacturing: driving inclusive and sustainable industrial development,
UNIDO, Vienna, Austria. Available at https://www.unido.org/sites/default/files/files/2017-
11/IDR2018 FULL%20REPORT.pdf. [Accessed 10 March 2019].
United Nations Industrial Development Organization (UNIDO) 2018b. What is manufacturing value added? UNIDO. Available at https://stat.unido.org/content/focus/what-is-manufacturing-
value-added%3F;jsessionid=DD57DDDC4FE2614B46BB3AD144CA5A24. [Accessed 10
March 2019]. Ur Rahman, Z., Chongbo, W. & Ahmad, M., 2019. A symmetric analysis of the pollution haven
hypothesis in the context of Pakistan: a non-linear approach. Carbon Management, 10(3),
pp.227-239.
Uttama, N. P. 2015. Foreign direct investment and the poverty reduction nexus in Southeast Asia. In A. Heshmati, E. Maasoumi & G. Wan (eds.), Poverty reduction policies and practices in
Developing Asia, pp. 281-298. ADB and Springer. Available at
https://link.springer.com/content/pdf/10.1007%2F978-981-287-420-7.pdf. [Accessed 16 March 2018].
Vijayakumar, N., Sridharan, P. & Rao, K. C. S. 2010. Determinants of FDI in BRICS countries: a
panel analysis. International Journal of Business Science & Applied Management, 5(3), pp.1-13.
Voica, M. C., Panait, M. & Haralambie, G. A. 2015. The Impact of foreign direct investment on
sustainable development. Economic Insights–Trends and Challenges, 3, pp.89-103.
Waddock, S. A. & Graves, S. B. 1997. The corporate social performance-financial performance link. Strategic Management Journal, 18(4), pp.303-319.
Wallace, D. 2017. Sustainable industrialization, Earthscan, London. Available at
https://doi.org/10.4324/9781315145372. [Accessed 20 March 2018]. Wang, J.Y. & Blomström, M. 1992. Foreign investment and technology transfer: a simple model.
European Economic Review, 36(1), pp.137-155.
Wang, M., 2009. Manufacturing FDI and economic growth: evidence from Asian economies. Applied Economics, 41(8), pp.991-1002.
Water Integrity Network 2017. Wastewater management in the garment industry. Water Integrity
Network, 27 July 2017. Available at
https://www.waterintegritynetwork.net/2017/07/27/wastewater-management-garment-industry/ [Accessed 26 October 2018].
Warhurst, A. 1999. Mining and the environment: case studies from the Americas, IDRC, Canada.
Available at https://www.idrc.ca/en/book/mining-and-environment-case-studies-americas. [Accessed 1 September 2019].
Wei, T., Dong, W., Yan, Q., Chou, J., Yang, Z. & Tian, D. 2016. Developed and developing world
contributions to climate system change based on carbon dioxide, methane and nitrous oxide
emissions. Advances in Atmospheric Sciences, 33(5), pp.632-643. Wheeler, D. & Mody, A. 1992. International investment location decisions: the case of US firms.
Journal of International Economics, 33(1-2), pp.57-76.
White, S. C. 1999. NGOs, civil society, and the state in Bangladesh: the politics of representing the poor. Development and Change, 30(2), pp.307-326.
Woodward, D. P. & Rolfe, R. J. 1993. The location of export-oriented foreign direct investment in the
Caribbean Basin. Journal of International Business Studies, 24(1), pp.121-144. Wooldridge, J. M. 2015. Introductory econometrics: a modern approach, USA, CENGAGE Learning.
World Bank 1990. World development report 1990: poverty, World Bank, Oxford University Press,
UK. Available at https://openknowledge.worldbank.org/handle/10986/5973. [Accessed 2
February 2017].

266
World Bank 2000. Greening industry: new roles for communities, markets, and governments. Policy
Research Report, World Bank, Oxford University Press, UK. Available at http://documents.worldbank.org/curated/en/421701468772781985/310436360 200500070247
13/additional/multi-page.pdf. [Accessed 1 February 2017].
World Bank 2007. Bangladesh-Dhaka environment and water resources management, World Bank, Washington DC. Available at
http://documents.worldbank.org/curated/en/954161468206954088/Bangladesh-Dhaka-
Environment-and-Water-Resources-Management. [Accessed 1 February 2017].
World Bank 2014. The Bangladesh responsible sourcing initiative: a new model for green growth, World Bank, Washington D.C. Available at
http://documents.worldbank.org/curated/en/614901468768707543/The-Bangladesh-
Responsible-Sourcing-Initiative-A-new-model-for-green-growth. [Accessed 1 June 2018]. World Bank 2015. The poverty overview, World Bank. Available at
https://www.worldbank.org/en/topic/poverty/overview. [Accessed 1 February 2017].
World Bank 2016. The cost of air pollution: strengthening the economic case for action, World Bank,
Washington D.C. Available at http://documents.worldbank.org/curated/en/781521473177013155/pdf/108141-REVISED-
Cost-of-PollutionWebCORRECTEDfile.pdf. [Accessed 1 June 2018].
World Bank 2018a. Country environmental analysis 2018: Bangladesh, World Bank, Washington D.C. Available at
http://documents.worldbank.org/curated/en/585301536851966118/pdf/129915-CEA-P161076-
PUBLIC-Disclosed-9-16-2018.pdf. [Accessed 12 April 2019]. World Bank 2018b. Doing business 2018, reforming to create jobs, World Bank, Washington D.C.
Available at www.doingbusiness.org. [Accessed 12 April 2019].
World Bank 2018c. World Development Indicators. The World Bank data. Available at
http://databank.worldbank.org/data/source/world-development-indicators/preview/on [Accessedon 28 February 2019].
World Bank 2019. The World Bank in Bangladesh: Overview, World Bank. Available at
https://www.worldbank.org/en/country/bangladesh/overview. [Accessed on 28 February 2019].
World Business Council for Sustainable development (WBCSD) 2006. From challenge to opportunity
the role of business in tomorrow’s society, WBCSD. Available at https://www.globalhand.org/system/assets/1759c470b1dc6e588d98857733a9585b7bae9306/or
iginal/tomorrows-leaders.pdf?1315627402. [Accessed 10 June 2019].
World Commission on Environment and Development (WCED) 1987. Our common future, United
Nations, New York. Available at https://sustainabledevelopment.un.org/content/documents/5987our-common-future.pdf .
[Accessed 1 February 2017].
World Economic Forum (WEF) 2013. The travel and tourism competitiveness report 2013, World Economic Forum, Geneva, Switzerland. Available at
http://www3.weforum.org/docs/WEF TT Competitiveness Report 2013.pdf. [Accessed 18
January 2018].
World Economic Forum (WEF) 2014. The global competitiveness report, 2014-15, World Economic Forum, Geneva, Switzerland. Available at
http://www.eces.org.eg/MediaFiles/events/38b0d5ca.pdf. [Accessed 1 February 2017].
World Economic Forum (WEF) 2015. The outlook on the global agenda 2015, World Economic Forum, Geneva, Switzerland. Available at
http://www3.weforum.org/docs/GAC14/WEF GAC14 OutlookGlobalAgenda Report.pdf.
[Accessed 1 February 2017]. World Economic Forum (WEF) 2016. The global gender gap report 2016, World Economic Forum,
Geneva, Switzerland.
World Wide Fund for Nature (WWF) 2003. Searching for the holy grail? making FDI work for
sustainable development. WWF analytical paper, March 2003. Available at http://www.ase.tufts.edu/gdae/publications/articles reports/KG-LZ FDI report.pdf.
[Accessed 2 February 2017].
267
Yao, S. 2006. On economic growth, FDI and exports in China. Applied Economics, 38(3), pp.339-351.
Yasmin, T. 2014. Unsafe working conditions in the RMG sector of Bangladesh: role of the international retailers. South Asia Journal, 25 December. Available at
http://southasiajournal.net/unsafe-working-conditions-rmg-sector-bangladesh-role-
international-retailers/ [Accessed 10 May 2018]. Zaman, K., Khan, M. M. & Ahmad, M. 2012. The relationship between foreign direct investment and
pro-poor growth policies in Pakistan: the new interface. Economic Modelling, 29(4), pp.1220-
1227.
Zarsky, L. 1999. Havens, halos and spaghetti: untangling the evidence about the relationship between foreign investment and the environment. Conference on Foreign Direct Investment and the
Environment, 28-29 January, OECD, Hague, Netherlands. Available at
http://www.oecd.org/officialdocuments/publicdisplaydocumentpdf/?cote=CCNM/EMEF/EPOC/CIME(98)5&docLanguage=En. [Accessedon 8 February 2017].
Zarsky, L. 2005. International investment for sustainable development: balancing rights and rewards,
Earthscan, UK.
Zhang, J. 2014. Foreign direct investment, governance, and the environment in China: regional dimensions, Palgrave Macmillan, UK.
Zhang, K. H. 2001. Does foreign direct investment promote economic growth? evidence from East
Asia and Latin America. Contemporary Economic Policy, 19(2), pp.175-185. Zhang, Z., Xue, B., Pang, J. & Chen, X. 2016. The decoupling of resource consumption and
environmental impact from economic growth in China: spatial pattern and temporal
trend. Sustainability, 8(3), p.222. Zeng, D.Z. 2010. Building engines for growth and competitiveness in China: experience with special
economic zones and industrial clusters, World Bank, Washington D.C.
Zheng, P. 2009. A comparison of FDI determinants in China and India. Thunderbird International
Business Review, 51(3), pp.263-279.