Embed Size (px)
Citation preview

The impact of fiber networks in Japan
Kiyoshi MORIKiyoshi MORIPresident, Japan Data Communications AssociationPresident, Japan Data Communications Association
(Ex(Ex--Vice Minister for Policy CoordinationVice Minister for Policy CoordinationMinistry of Internal Affairs and Communications, JAPAN)Ministry of Internal Affairs and Communications, JAPAN)
23, March 200923, March 2009

1.1. Overview of JapanOverview of Japan’’s Broadbands Broadband
2.2. Why has FTTH grown in popularity in Japan? Why has FTTH grown in popularity in Japan?
3.3. Challenges for the future of FTTH Challenges for the future of FTTH
Table of Contents
1

0
200
400
600
800
1,000
1,200
1,400
1,600
CATV DSL
FW A FTTH
【Number of Telecommunication Service Users】
(Unit: 10 thousand)
Transition in the Number of Japan’s Broadband Subscribers
【Number of Broadband Service Users】
1,197
1
1,376
402
(Unit: 10 thousand)
0
2,000
4,000
6,000
8,000
10,000
12,000
Fixed Com m unications (telephony)
M obile Com m unication (telephony)
Broadband Service
IP Telephony
FTTH exceeded DSL (June 2008)
10,942
4,936
2.976
1,905
Source : Ministry of Internal Affairs and Communications Source : Ministry of Internal Affairs and Communications 2

5.12
6.016
6.144
6.144
6.144
8
8.128
8.128
8.192
10.24
12.288
12.288
20.48
24
24
30.72
51.2
51.2
0 10 20 30 40 50 60
Philippines
Germ any
Poland
Hong Kong,China
Iceland
Brazil
Portugal
The U.K.
Kazakhstan
France
Italy
Taiwan,China
Netherlands
Finland
Sweden
Singpore
Korea
Japan
1.20
1 .08
1 .07
0 .94
0 .91
0 .83
0 .70
0 .63
0 .52
0 .49
0 .37
0 .36
0 .31
0 .30
0 .25
0 .24
0 .18
0 .14
0 .08
0 .06
0.0 0 .2 0 .4 0 .6 0 .8 1 .0 1 .2 1 .4
B razil
C anada
M acau(China)
P ortugal
B osnia
H ong Kong, China
Lithuania
U K
G erm an
U nited States
France
Finland
Italy
M alta
S ingapore
S w eden
Taiw an,China
N etherlands
K orea
Source : ITU Internet Reports 2006 ”digital.life”(December 2006)
Broadband prices (100kbit/s)Broadband prices (100kbit/s)(US dollar)(US dollar)
Japanese Broadband Service in Global Comparison
Speed of DSLSpeed of DSL((Mbit/sMbit/s))Japan
Source : ITU ”World Information Society Report 2007」” (June 2007)3
Japan

45
39
19 18
9 9 84 3 3
05
10
15
20
25
3035
40
45
Japan
Korea
Sweden
Slovak
Republic
OECD
Denmark
Norway
Czech
Republic
USA
Italy
Source :OECD Broadband Statisticshttp://www.oecd.org/dataoecd/21/58/39574845.xls
Percentage of FTTH Subscribers per Broadband Subscribers
(June 2008)
Japanese Broadband Service in Global Comparison
4

About 4.85 million
DSL CATVDSL
[France]
DSL CATV
[South Korea]
About 5.10 million
[Japan]DSL CATV
About 3.96 millionAbout 15.48 million
About 17.60 million
DSL[Germany]
(September 2007)
CATV
(June 2008)
Others(Including
mobile wireless access)
About 37.28 million
(March 2008,FTTH: Sept. 2007)
[China]
About 13.08 million
About 12.29 million
About 9.73 million
DSL Others
About 4.65 million
April 2008,FTTH: Dec. 2007)
(June 2007)
(September 2007)
About 57.71million
DSL[UK]
CATV
About 10.17 million About 3.13
million
(March 2007)
About 27.84 million
About 34.41 million
About 3.22 million
DSL
[Canada](2006)
CATV
About 4.09 million
[USA]
Current Status of Broadband Services in Various Countries
Others
About 0.15 million
About 0.90 million
[India](December 2007)
About 0.20 million
[Singapore]CATVDSL
About 0.50 million
About 0.40 million
(March 2008)
Wireless access
About 2.75 million
About 2.59 million
DSL CATV
About 0.34 million
OthersFTTHAbout 0.73
million
DSL
About 0.20 million
[Indonesia](2007)
About 3.00 million
3G mobile phones
Others(Including
mobile wireless access)
[Malaysia](June 2008)
DSL
About 1.17 million
About 0.2 million
OthersWireless access
About 0.36 million
FTTH
About 1.40 million
Notes:1. The penetration status of any broadband service is
shown by the number of subscription contracts. 2. “CATV” services are super-high-speed Internet services utilizing CATV networks.
3. Sources: USA (FCC), UK (Ofcom), Germany (BNetzA), France (ARCEP etc.), Canada (CRTC), China (Ministry of Information Industry), South Korea (Ministry of Information Communications), India (TRAI), Indonesia (Ministry of Communications Information) Singapore (Information CommunicationsDevelopment Authority), Malaysia(MCMC), Japan (Ministry of Internal Affairs and Communications), Tribune, Fuji Chimera Research Institute , Inc , etc.
About 0.02 million
FTTH
FTTH
About 6.00 million
FTTH
5


1.1. Overview of JapanOverview of Japan’’s Broadbands Broadband
2.2. Why has FTTH grown in popularity in Japan? Why has FTTH grown in popularity in Japan?
3.3. Challenges for the future of FTTH Challenges for the future of FTTH
Table of Contents
7

① National target② Competition policy③ Continuous investment by NTT④ Demand for FTTH services⑤ Government support⑥ Geographical features of Japan etc.
Why has FTTH grown in popularity in Japan?
8

①National target : Steps taken in Japan on ICT Strategies
2001 2003 2004 2005 2006
e-Japan Priority Policy Program(March 2001)
e-Japan Strategy u-Japan policy of MIC
e-Japan Priority Policy Program - 2002 (June 2002)
e-Japan Priority Policy Program - 2003(August 2003)
e-Japan Priority Policy Program - 2004(June 2004)
Realizing a
Ubiquitous N
etwork
Society
ee--Japan StrategyJapan Strategy((January 2001January 2001))
e-Japan Strategy Ⅱ(July 2003)
e-Japan Strategy II Acceleration
Package (February 2004)
IT Policy package(February 2005)
New IT Reform New IT Reform StrategyStrategy
((January 2006January 2006))
◆IT Basic Law◆Establishment of IT Strategy Headquarters(Director General: Prime Minister)
u-Japan Promotion Program 2006(September 2006)
uu--Japan Promotion Program Japan Promotion Program 20062006((September 2006September 2006))
Realization of a self-sustaining ICT Society
New IT Reform StrategyPolicy package(April 2007)
2007
Priority Policy Program - 2007(July 2007)
Priority Policy Program - 2006(July 2006)
20109

BroadbandBroadband 100%100%93.9%(47.33 m
households)
93.9%(47.33 m
households)
95.2%(48.63 m
households)
95.2%(48.63 m
households)
98.6%(50.83 m
households)
98.6%(50.83 m
households)
Ultra-High-Speed
Ultra-High-Speed
79.7%(40.15 m
households)
79.7%(40.15 m
households)
83.5%(42.68 m
households)
83.5%(42.68 m
households)
89.5%(44.71 m
households)
89.5%(44.71 m
households)90%90%
FY2010Targets
(by March 2011)
Total number of households: 51.71 million (Census in 2005)
March 2006March 2006 March 2007March 2007 September 2008
September 2008
(Estimation)
Next Generation Broadband Strategy 2010 (August 2006)
10

Promote Service Based Competition Policy
Promote Facility Based Competition Policy
Collocation Rules (Oct.2000)Unbundling Rules (Apr. 2001)
Facilitation of applying into public property such as roads (Nov.2000)Guidelines on right of way (Apr. 2001)
②Competition Policy
11

1. Government’s quick and thorough measures for collocation and unbundling
2. Introduction of flat-rate fee
3. New entries with drastic markdown
4. Early settlement of dispute between telecommunication operators through utilizing ADR
5. Low-penetration rate of CATV
6. NTT’s inactive preparation for ADSL
Background of ADSL Development
12

70 8
0
2
4
6
8
10
12
14
16
Mar-99 Sep-99 Mar-00 Sep-00 Mar-01 Sep-01 Mar-02 Sep-02 Mar-03 Sep-03 Mar-04 Sep-04 Mar-05 Sep-05 Mar-06 Sep-06 Mar-07 Sep-07 Mar-08 Sep-08
DSLDSL
Cable ModemCable Modem
(millions)
FTTHFTTH
Trend in the Number of Japan’s Broadband Subscribers
OthersApprox. 57.2%
Approx. 38.0%
【End-Mar.07】
NTT E/W
Establishment of collocation and Establishment of collocation and unbundling rules for access networks unbundling rules for access networks of NTT E/Wof NTT E/W
Autumn 2000Autumn 2000Autumn 2000
13

0% 20% 40% 60% 80% 100%
Japan
United States
Korea
United Kingdom
G erm any
France
Italy
Sweden
Finland
Spain
Netherlands
EU(27)
37.7%
81.9%
84.3%
59.8%
61.9%
59.2%
76.6%
62.6%
76.0%
78.1%
72.4%
69.6%
62.3%
18.1%
15.7%
40.2%
38.1%
40.8%
23.4%
37.4%
24.0%
21.9%
27.6%
30.4%
Incum bents
N ew Entrants
Competition in DSL Market
【Date】European Countries:Jun.2007(European Committee)Japan:Jun.2007(MIC)USA:Jun.2006 (FCC) Korea:Jan.2006 (MIC)
14

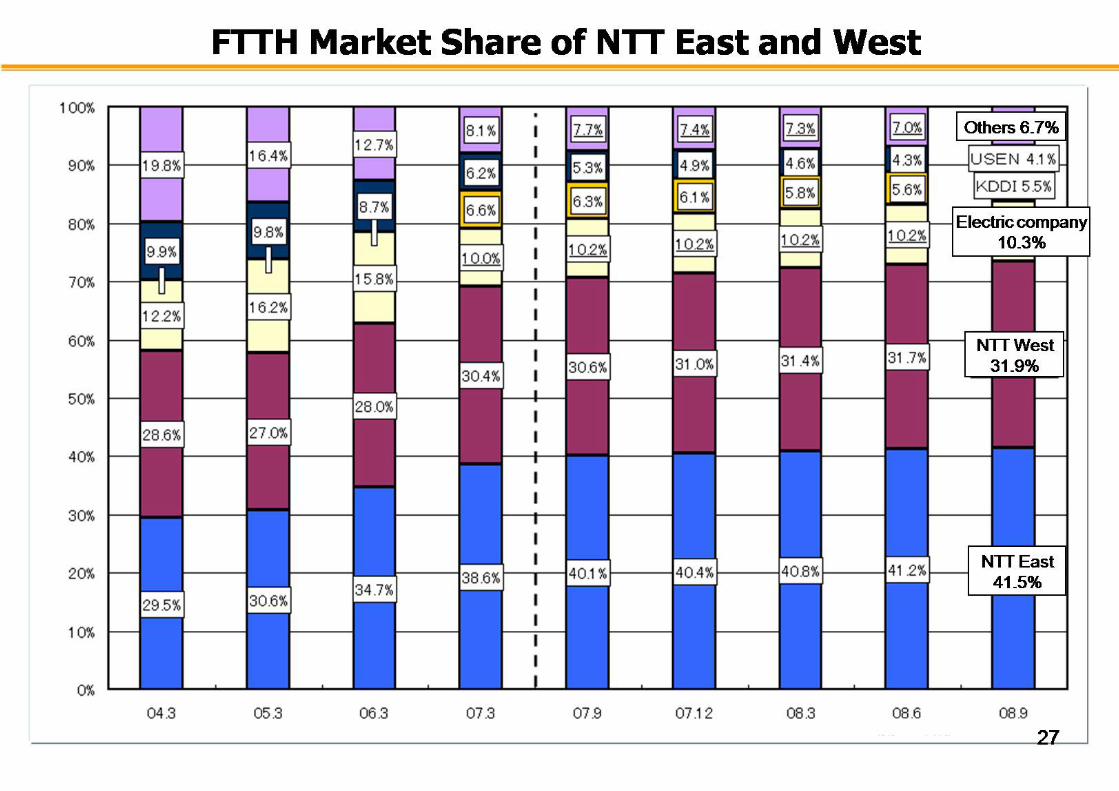
DSL Market Share of NTT East and West
(From MICdata)
Others 3.3%
Acca Networks 7.3%
E-access 15.1%
NTT West 17.5%
NTT East 18.8%
Softbank BB 38.0%
15

0
1,000
2,000
3,000
4,000
5,000
6,000
7,000
01.4 01.10 02.4 02.10 03.4 03.10 04.4 04.10 05.4 05.10 06.4 06.10
0
10
20
30
40
50
60
fastest
highest
cheapest
ADSL Service Speed and Price (yen/month) (M
)
FY2006 Evaluation of Competitive Situation in the Telecommunications Business Field (MIC)
07.03
16

70 8
0
2
4
6
8
10
12
14
16
Mar-99 Sep-99 Mar-00 Sep-00 Mar-01 Sep-01 Mar-02 Sep-02 Mar-03 Sep-03 Mar-04 Sep-04 Mar-05 Sep-05 Mar-06 Sep-06 Mar-07 Sep-07 Mar-08 Sep-08
DSLDSL
Cable ModemCable Modem
(millions)
FTTHFTTH
Trend in the Number of Japan’s Broadband Subscribers
KK--OPTI. Com, a subsidiary of an OPTI. Com, a subsidiary of an electric power company, introduced a electric power company, introduced a lowlow--price double play.price double play.
September 2004September 2004September 2004
17

③Investment Trend for Optical Fiber of NTT East and West【NTT東西の設備投資総額とアクセス網の光化投資額の推移】
※The rate of coverage is the average of NTT East and West. The opticalization of access network means the ratipo of opticalized feeder points of the all the feeder points.
10,977
7,662
6,966
7,7547,969
8,8518,483
8,235
1,490 1,640
2,370
3,330
2,830
3,490 3,5603,280
0
2,000
4,000
6,000
8,000
10,000
12,000
2000 2001 2002 2003 2004 2005 2006 2007
Total investm ent
Investm ent for fiber local loops
【Total investment and trend of investment for fiber local loop】(unit: hundred million yen)

Opticalization of NTT East and West
※The ratio of coverage is the average of NTT East and West. The ratio of opticalized access network means that of opticalized feeder i t
【The trend of Opticalization of access network】
19

Feeder Point
AO Closure
NTT East/West Bldg
InternalSplitter
Optical Signal
Transmission Equipment(OLT)
Cabinet
Indoor Equipment
Indoor Equipment
1,500 m600 m100 m
Conduit/Culvert
FeederPoint
FeederPoint
Outdoor Splitter
(one strand) (24 to 100 strands) (100 to 1,000 strands)
8 branches from 1 strand
Drop Cable (East: ¥655, West: ¥707) Main Cable (East: ¥5,020, West: ¥4,987)
20

1 Speed – Demand for high speed data transmission
2 Price - Demand for high grade and low price
3 Service - Demand for Video Broadcasting Triple play (Data, Voice, Video)
④Demand for FTTH Service
21

Examples of services provided through NGN
Business: SaaSTelepresenceDigital CinemaDigital Signage
Home:IPTVHigh-quality optical IP telephonyHome ICT-Security, Remote control
22

⑤Government Support
1.Support for telecommunication operators(1) Low-interest loans provided by Development Bank of Japan (DBJ)
(introduced in 1995)(2) Preferential corporate tax and fixed asset tax treatment(3) Debt guarantee by government agency (introduced in 1991)
2.Support for local governments(1) Subsidies to promote broadband infrastructure (introduced in 2006)(2) Subsidies to build local public network (introduced in 1999)
Annual budget: Approx. 10 billion JPY.In 1,092 cases, local authorities have already been subsidized.
3.Other government agencies’ subsidies(1) Ministry of Agriculture, Forestry and Fisheries:
Revitalization of agricultural, mountain, and fishing villages(2) Ministry of Land, Infrastructure, Transport and Tourism:
Urban regeneration(3) Cabinet Office: Remote islands development

FTTH
Wireless access
Antenna tower, BB cabinet
小中学校診療所
Homes
Schools
Branch
Clinic
Island B
Conceptual Diagram of Local Intranet Project (Case of remote islands)
Island E
Island FIsland G
Island D
Island C
Island A
Local Intranet
Toshima Village office(Center)
●Remote teaching system
Connecting schools by BB network to enable remote teaching through TV conference system and to promote IT use in education.
Building BB infrastructure using optical cable and wireless network
●Remote Health Consultation SystemConnecting each islands’ nurses and
doctors by means of the TV conference system. Health consultations for residents can be held referring to measured data such as blood pressure .
Optical undersea cableSchools
Branch
Clinic
Schools
Branch
Clinic
Schools
Branch
ClinicSchools Branch
Schools
Branch
Clinic
Clinic

FTTH Penetration Rate
0% 20% 40% 60% 80% 100%
Less than5,000(676)
5,001 -10,000
(783)
10,001 -50,000
(1,186)
Over 50,000
(478)449
(93.9% )
401(33.8% )
83(10.6% )
14(2.1% )
29
785
700
662
Number of local communities where FTTH is available (by population)
Population (Number of local communities)
25

① National target ② Competition policy③ Continuous investment by NTT④ Demand for FTTH services⑤ Government support⑥ Geographical features of Japan etc.
Why has FTTH grown in popularity in Japan?
26


1.1. Overview of JapanOverview of Japan’’s Broadbands Broadband
2.2. Why has FTTH grown in popularity in Japan? Why has FTTH grown in popularity in Japan?
3.3. Challenges for the future of FTTH Challenges for the future of FTTH
Table of Contents
29

101.9 102.7 107.4
132.0 158.7
193.2
214.9
238.7
294.2
303.3
343.0
74.4 75.9 79.3 99.1 116.1
139.3 150.1 167.0
199.4 207.5
233.7269.4 298.1
319.7
424.5 469.1
523.6
636.6
721.7
812.9
879.6
988.4
111.8 124.9
133.0 178.3 194.2
226.2 264.2
306.0 339.8
374.7
432.9
30.9 31.8 33.0 41.6 48.1 60.1 62.3 70.8 83.4 88.3
102.5
0
200
400
600
800
1000
1月 3月 5月 7月 9月 11月 1月 3月 5月 7月 9月 11月 1月 3月 5月 7月 9月 11月 1月 3月 5月 7月 9月 11月 1月 3月 5月 7月 9月 11月 1月 3月 5月 7月 9月 11月 1月 3月 5月 7月 9月 11月 1月 3月 5月 7月 9月 11月 1月 3月 5 月 7月 9月 11月 1月 3月 5月 7月 9月 11月 1月 3月 5月 7月 9月 11月 1月 3月 5月 7月 9月 11月
1997年 1998年 1999年 2000年 2001年 2002年 2003年 2004年 2005年 2006年 2007年 2008年
Broadband Usage : IP Traffic on the Networks (Total Volume)
(Gbps)
(2008.5)
(2007.11)
(2007.5)
(2006.11)
(2006.5)
(2005.11)
(2005.5)
(2004.11)(2004.10)
(2004.9)
(2008.11)
The total amount of IP traffic in Japan was estimated at 988.4Gbps (November 2008),which accounts for 1.2 times more than that of last year(812.9 Gbps), and about doublethat of three years ago (469.1Gbps).
(ref.2) Monthly average of daily traffic exchanged at major IXs in Japan
Estimated download traffic of broadband users in Japan
(source: MIC Japan)
(ref.1) Monthly average of daily peak traffic exchanged at major IXs in Japan
Monthly average of daily traffic of broadband customers (ADSL/CATV/FTTH) of major ISPs in Japan
30

Performance of Computer will increase 2 timesEvery 1.5 -2 years(Silicon Semiconductor)
Where to go , the Information Society?
Computer
0
200
400
600
800
1000
1200
1995 2000 2005 2010
Moore’s law
Broadband Traffic increase exponentiallyAccording to growth of Subscribers
InternetMori’s law
(Provided by Mr. Fujiwara)
31

Dr. Gordon.E.Moore recognized Mori’s Law
With Dr.Gordon Moore (Founder of Intel Corporation) on May 1 ,2008 in Hawaii
(Provided by Mr. Fujiwara)
Mr.Kiyoshi Mori,Vice Minister of Ministry of Internal Affairs and Communications, presented experienced law about the growth of the broadband traffic in Japan in oct.2007 in North America. Only Japan has the experimental data of the broadband traffic on the world.
32

IP Traffic
Download
Upload
Others( web or mail etc)
Others( web or mail etc)

75%P2P traffic(less than 10% of all users)
Bandwidth Usage and P2P Users
25%Other traffic
(more than 90% of all users)
63% Heavy users
(10% of P2P users)
37%average users
(90% of P2P users)
average user : 550Mbyte
P2P user : 17Gbyte
P2P heavy users: 104Gbyte
Traffic volume
User (ascending sort )
Top 10% among P2P users occupy over 60% of the traffic
Traffic volume
P2P User (ascending sort )
x 30 x 190
10% of all users occupy 60 through 90% of the traffic Distribution of users in all traffic
Top 10% of P2P users(*) occupy more than 60% of the traffic Bandwidth used by heavy users completely
differs from that used by average users.
P2P users (10%) controls 60 through 90% of the traffic.
(*) the Plala Networks has controlled its P2P bandwitdth since November 2003, therefore the latest published data in uncontrolled situation is for 2003.
Measured : 2003/6/30 – 2003/7/1 11:59(*) “the P2P users” are considered as the users whose P2P traffic exceeds over
1 Mbyte within 24 hrs.
(Note) The data was provided by Plala Networks) (partly extracted)
©2008 Ministry of Internal Affairs and Communications. All Rights Reserved.
34

35
Measures to alleviate “Traffic Jams”
1. Reducing geographical concentrationsDeveloping advanced P2P technologies to keep track of data
location informationDecentralization of IXs and Internet data centers
2. Reducing traffic congestion at peak timesDeveloping traffic-sensitive P2P technologiesExploring methods that enable the prior downloading of data during
off-peak times
3. Consideration of price plan diversification for the operatorsFor example, plans such as a partially-metered rate system or premium flat rate system could be introduced to make for a level playing-field for all users
4. Reviewing the “Guideline for Packet Shaping”On going reviews of bandwidth control guidelines established and adhered to by the operators from the view point of user protection

©2008 MIC. All Rights Reserved.
New Competition Promotion Program 2010 Sep. 2006
1. Promote Facility Based Competition
2. Review of Designated TelecommunicationsFacilities System (Dominant Regulations)
3. Review of Calculation Method for Interconnection Charges of NTT East/West
Main Policies Items
(b) Facilitate to use fibre networks owned by local governments etc.
(e) Development of interconnection rules for NGNs of NTT E&W
(a) Promote open-up policy for establishment of network infrastructure
4. Promotion of Competition in Mobile Market
5. Development of Environment for Realization of IP-based Terminal Equipments
6. Review of Tariff Policy
7. Review of Universal Service System
8. Development of Environment for Ensuring Network Neutrality
9. Strengthen Dispute Resolution Function
10. Strengthen Consumer Protection Policy
(a) Development of environment for effective operation of network
(b) Study and review of network neutrality and pro-competition framework
(c) Study of measures to strengthen coordination among platforms
(a)Review of calculation method for fixed line interconnection charge
(b) Review of calculation method for optical fibre interconnection charge
(c) Study of calculation method for interconnection charge of NGN
36