Embed Size (px)
Citation preview

P R I V A T E & C O N F I D E N T I A L P a g e i / 2 5
The Impact of Economic Downturns on
Income Elasticity of Demand
PreSort Barcoded Small Letters
M A Y 2 0 0 9
P a g e i i
prepared for Australia Post 321 Exhibition Street MELBOURNE VIC 3000 GPO Box 1777 MELBOURNE VIC 3001 t. +61 3 13 13 18 w. www.auspost.com.au prepared by Diversified Specifics Pty Ltd Aquavista Tower Suite 922, Level 9 401 Docklands Drive DOCKLANDS VIC 3008 t. +61 3 9001 0665 e. [email protected] w. www.diversifiedspecifics.com.au ACN 096 063 295
Disclaimer: While every effort has been made to ensure the accuracy of this document, the uncertain nature of economic data, forecasting and analysis means that Diversified Specifics Pty Ltd is unable to make any warranties in relation to the information contained herein. Diversified Specifics Pty Ltd, its employees and agents disclaim liability for any loss or damage which may arise as a consequence of any person relying on the information contained within this document.
M A Y 2 0 0 9

P a g e i i i
TABLE OF CONTENTS
1 . 0 E C O N O M I C S L O W D O W N 4
1 . 1 . R E C E N T E L A S T I C I T Y M O V E M E N T S 5
2 . 0 E C O N O M E T R I C A N A L Y S I S 10
2 . 1 . I N C O M E E L A S T I C I T Y & E C O N O M I C A C T I V I T Y 1 1
2 . 2 . M E T H O D O L O G Y 1 2
2 . 3 . M O D E L R E S U L T S 1 3
2 . 4 . C O N C L U S I O N S 1 4
3 . 0 M O V I N G F O R W A R D 15
3 . 1 . F U T U R E A N A L Y S I S 1 6
A P P E N D I X A 17
C O M P A R A T I V E M O D E L S - O U T P U T 1 8

P R I V A T E & C O N F I D E N T I A L P a g e 4 / 2 5
1 . 0 E C O N O M I C S L O W D O W N

P a g e 5
1 . 1 . R E C E N T E L A S T I C I T Y M O V E M E N T S 1 . 1 . 1 I n c o m e E l a s t i c i t y As part of Diversified Specifics ongoing efforts to maintain and refine a complete set of predictive and explanatory mail volume models at Australia Post the following study was undertaken to analyse the degree to which the prevailing income elasticity estimates for bulk small letter items hold during conflicting periods of economic growth. The preferred PreSort Barcoded Small Letter volume model was developed using quarterly data from the September quarter 1995 to the December quarter 2008 i.e. a total of 54 quarterly observations. Over that period, the income elasticity of demand approximated unitary elasticity (estimated at 0.987). Truncating the model timeframe however reveals that the income elasticity of demand has increased substantially over the course of the past six months. Specifically, the demand for PreSort Barcoded Small Letter volumes has become increasingly elastic, as seasonally adjusted non-farm quarterly economic growth declined in the September and December quarters of 2008. Non-farm economic growth declined by 0.6% in the September quarter 2008 and declined by 0.9% in the December quarter 2008. At the same time, the income elasticity estimate increased by 3.5% in the September quarter 2008 and by 4.4% in the December quarter 2008. Despite the estimated income elasticity of demand not being statistically significantly different from one another1, there does appear to be some preliminary support that demand for PreSort Barcoded Small Letter volumes may be increasingly elastic during times of economic downturn. This however, would need to be substantiated over a longer timeframe and in a more robust manner than presented in this example and Section 2 of this document seeks to conduct such an analysis. Table 1.1.1.1 summarises the income elasticity estimates for the PreSort Barcoded Small Letter volumes model over the total and truncated model timeframes.
Table 1.1.1.1
Variable Timeframe (Quarterly)
Elasticity Estimate
95% confidence interval
Real GDP (Non-farm)*# Sep95 – Dec08 0.987 Lower: 0.837 | Upper: 1.137 Real GDP (Non-farm)*# Sep95 – Sep08 0.945 Lower: 0.796 | Upper: 1.095 Real GDP (Non-farm)*# Sep95 – Jun08 0.913 Lower: 0.759 | Upper: 1.067 Real GDP (Non-farm)*# Sep95 – Mar08 0.875 Lower: 0.715 | Upper: 1.034 Real GDP (Non-farm)*# Sep95 – Dec07 0.871 Lower: 0.704 | Upper: 1.038 Real GDP (Non-farm)*# Sep95 – Sep07 0.858 Lower: 0.684 | Upper: 1.031 Real GDP (Non-farm)*# Sep95 – Jun07 0.871 Lower: 0.689 | Upper: 1.053
*Denotes: Seasonally Adjusted Variable #Denotes: Natural Logarithm
1 This is evident by each of the elasticity estimates over the truncated timeframes falling within each of the determined 95% confidence intervals for Real Non-farm GDP.
P a g e 6
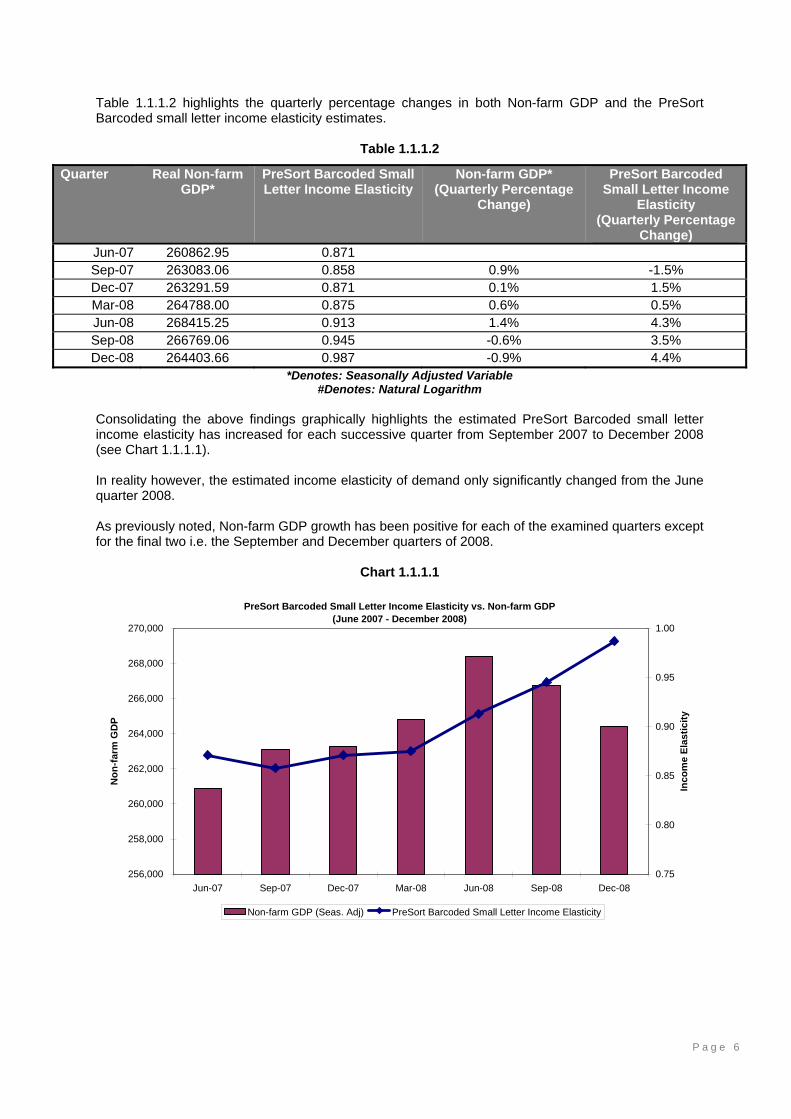
Table 1.1.1.2 highlights the quarterly percentage changes in both Non-farm GDP and the PreSort Barcoded small letter income elasticity estimates.
Table 1.1.1.2
Quarter Real Non-farm GDP*
PreSort Barcoded Small Letter Income Elasticity
Non-farm GDP* (Quarterly Percentage
Change)
PreSort Barcoded Small Letter Income
Elasticity (Quarterly Percentage
Change) Jun-07 260862.95 0.871 Sep-07 263083.06 0.858 0.9% -1.5% Dec-07 263291.59 0.871 0.1% 1.5% Mar-08 264788.00 0.875 0.6% 0.5% Jun-08 268415.25 0.913 1.4% 4.3% Sep-08 266769.06 0.945 -0.6% 3.5% Dec-08 264403.66 0.987 -0.9% 4.4%
*Denotes: Seasonally Adjusted Variable #Denotes: Natural Logarithm
Consolidating the above findings graphically highlights the estimated PreSort Barcoded small letter income elasticity has increased for each successive quarter from September 2007 to December 2008 (see Chart 1.1.1.1). In reality however, the estimated income elasticity of demand only significantly changed from the June quarter 2008. As previously noted, Non-farm GDP growth has been positive for each of the examined quarters except for the final two i.e. the September and December quarters of 2008.
Chart 1.1.1.1
PreSort Barcoded Small Letter Income Elasticity vs. Non-farm GDP(June 2007 - December 2008)
256,000
258,000
260,000
262,000
264,000
266,000
268,000
270,000
Jun-07 Sep-07 Dec-07 Mar-08 Jun-08 Sep-08 Dec-08
Non
-farm
GD
P
0.75
0.80
0.85
0.90
0.95
1.00
Inco
me
Elas
ticity
Non-farm GDP (Seas. Adj) PreSort Barcoded Small Letter Income Elasticity

P a g e 7
Chart 1.1.1.2 below graphically depicts the quarterly growth movements in both the estimated PreSort Barcoded small letter income elasticity and Non-farm GDP. Whilst no conclusive pattern is evident, there is preliminary evidence that demand for PreSort Barcoded Small Letter volumes may be increasingly elastic during times of economic downturn.
Chart 1.1.1.2
PreSort Barcoded Small Letter Income Elasticity vs. Non-farm GDP (Quarterly Percentage Change)
September 2007 - December 2008
-1.0%
-0.5%
0.0%
0.5%
1.0%
1.5%
Sep-07 Dec-07 Mar-08 Jun-08 Sep-08 Dec-08
Non
-farm
GD
P
-2.0%
-1.0%
0.0%
1.0%
2.0%
3.0%
4.0%
5.0%
Inco
me
Elas
ticity
Non-farm GDP (Seas. Adj) (Quarterly Percentage Change) Income Elasticity (Quarterly Percentage Change)
P a g e 8
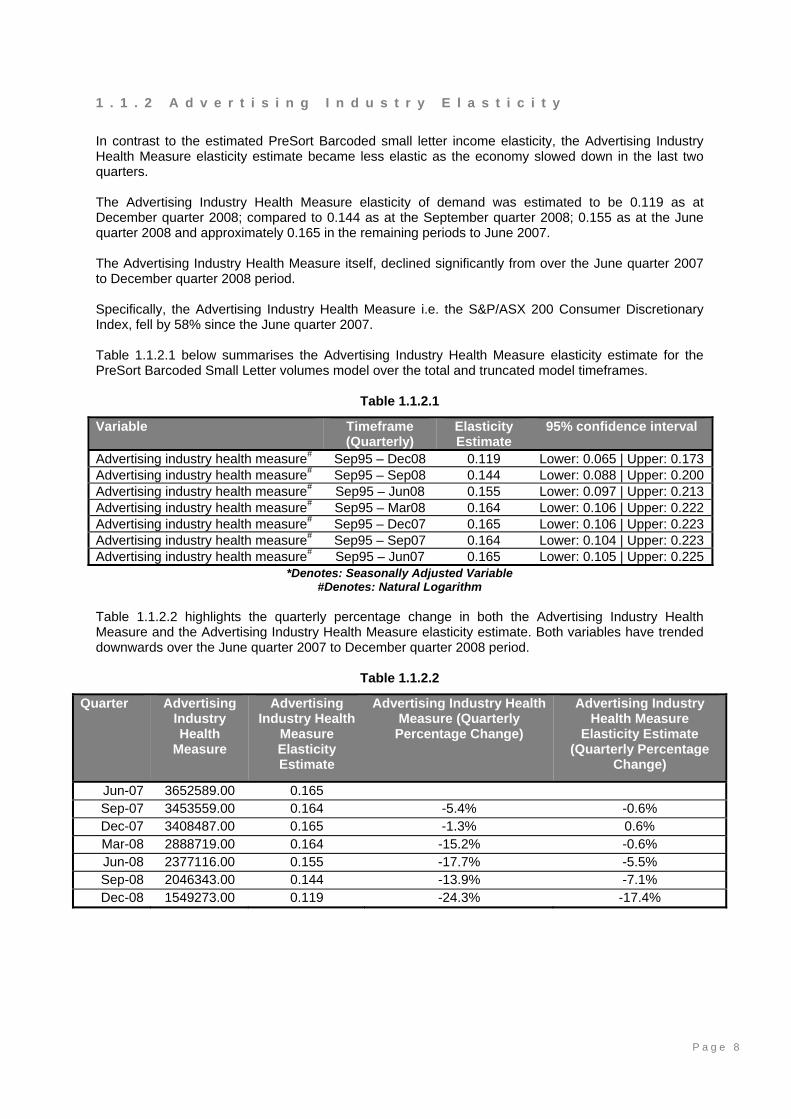
1 . 1 . 2 A d v e r t i s i n g I n d u s t r y E l a s t i c i t y In contrast to the estimated PreSort Barcoded small letter income elasticity, the Advertising Industry Health Measure elasticity estimate became less elastic as the economy slowed down in the last two quarters. The Advertising Industry Health Measure elasticity of demand was estimated to be 0.119 as at December quarter 2008; compared to 0.144 as at the September quarter 2008; 0.155 as at the June quarter 2008 and approximately 0.165 in the remaining periods to June 2007. The Advertising Industry Health Measure itself, declined significantly from over the June quarter 2007 to December quarter 2008 period. Specifically, the Advertising Industry Health Measure i.e. the S&P/ASX 200 Consumer Discretionary Index, fell by 58% since the June quarter 2007. Table 1.1.2.1 below summarises the Advertising Industry Health Measure elasticity estimate for the PreSort Barcoded Small Letter volumes model over the total and truncated model timeframes.
Table 1.1.2.1
Variable Timeframe (Quarterly)
Elasticity Estimate
95% confidence interval
Advertising industry health measure# Sep95 – Dec08 0.119 Lower: 0.065 | Upper: 0.173 Advertising industry health measure# Sep95 – Sep08 0.144 Lower: 0.088 | Upper: 0.200 Advertising industry health measure# Sep95 – Jun08 0.155 Lower: 0.097 | Upper: 0.213 Advertising industry health measure# Sep95 – Mar08 0.164 Lower: 0.106 | Upper: 0.222 Advertising industry health measure# Sep95 – Dec07 0.165 Lower: 0.106 | Upper: 0.223 Advertising industry health measure# Sep95 – Sep07 0.164 Lower: 0.104 | Upper: 0.223 Advertising industry health measure# Sep95 – Jun07 0.165 Lower: 0.105 | Upper: 0.225
*Denotes: Seasonally Adjusted Variable #Denotes: Natural Logarithm
Table 1.1.2.2 highlights the quarterly percentage change in both the Advertising Industry Health Measure and the Advertising Industry Health Measure elasticity estimate. Both variables have trended downwards over the June quarter 2007 to December quarter 2008 period.
Table 1.1.2.2
Quarter Advertising Industry Health
Measure
Advertising Industry Health
Measure Elasticity Estimate
Advertising Industry Health Measure (Quarterly
Percentage Change)
Advertising Industry Health Measure
Elasticity Estimate (Quarterly Percentage
Change)
Jun-07 3652589.00 0.165 Sep-07 3453559.00 0.164 -5.4% -0.6% Dec-07 3408487.00 0.165 -1.3% 0.6% Mar-08 2888719.00 0.164 -15.2% -0.6% Jun-08 2377116.00 0.155 -17.7% -5.5% Sep-08 2046343.00 0.144 -13.9% -7.1% Dec-08 1549273.00 0.119 -24.3% -17.4%
P a g e 9
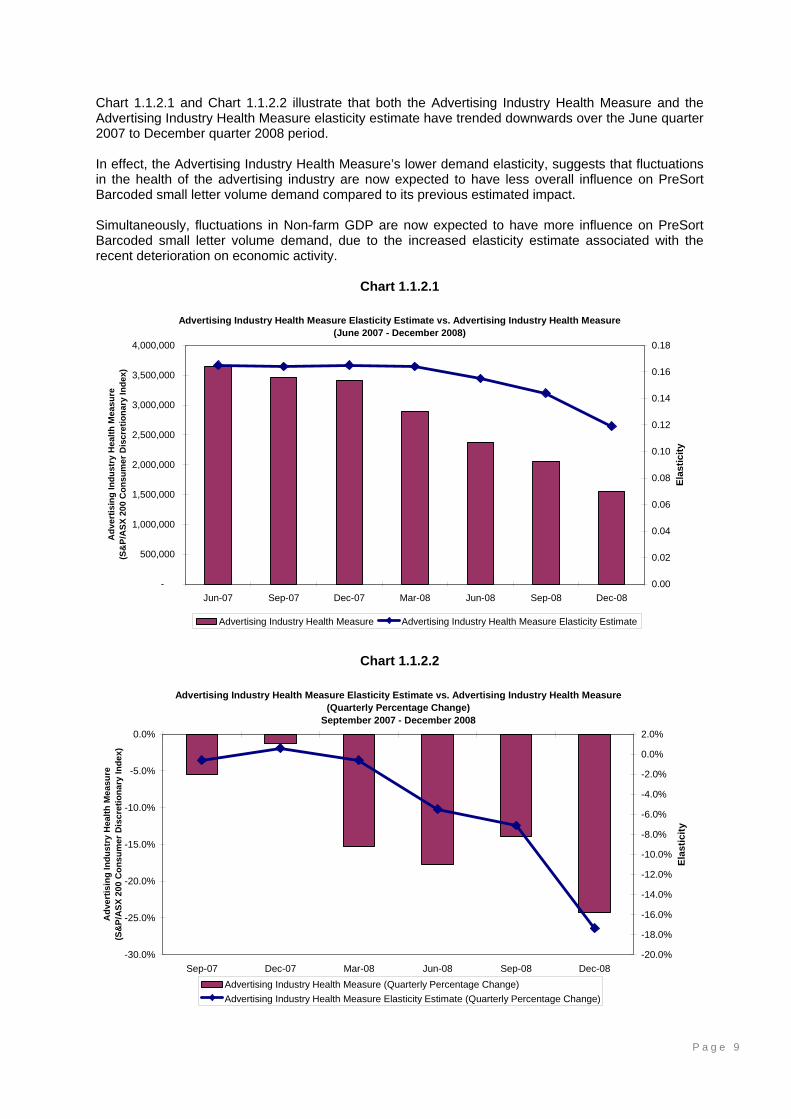
Chart 1.1.2.1 and Chart 1.1.2.2 illustrate that both the Advertising Industry Health Measure and the Advertising Industry Health Measure elasticity estimate have trended downwards over the June quarter 2007 to December quarter 2008 period. In effect, the Advertising Industry Health Measure’s lower demand elasticity, suggests that fluctuations in the health of the advertising industry are now expected to have less overall influence on PreSort Barcoded small letter volume demand compared to its previous estimated impact. Simultaneously, fluctuations in Non-farm GDP are now expected to have more influence on PreSort Barcoded small letter volume demand, due to the increased elasticity estimate associated with the recent deterioration on economic activity.
Chart 1.1.2.1
Advertising Industry Health Measure Elasticity Estimate vs. Advertising Industry Health Measure(June 2007 - December 2008)
-
500,000
1,000,000
1,500,000
2,000,000
2,500,000
3,000,000
3,500,000
4,000,000
Jun-07 Sep-07 Dec-07 Mar-08 Jun-08 Sep-08 Dec-08
Adv
ertis
ing
Indu
stry
Hea
lth M
easu
re
(S&
P/A
SX 2
00 C
onsu
mer
Dis
cret
iona
ry In
dex)
0.00
0.02
0.04
0.06
0.08
0.10
0.12
0.14
0.16
0.18
Elas
ticity
Advertising Industry Health Measure Advertising Industry Health Measure Elasticity Estimate
Chart 1.1.2.2
Advertising Industry Health Measure Elasticity Estimate vs. Advertising Industry Health Measure(Quarterly Percentage Change)
September 2007 - December 2008
-30.0%
-25.0%
-20.0%
-15.0%
-10.0%
-5.0%
0.0%
Sep-07 Dec-07 Mar-08 Jun-08 Sep-08 Dec-08
Adv
ertis
ing
Indu
stry
Hea
lth M
easu
re
(S&
P/A
SX 2
00 C
onsu
mer
Dis
cret
iona
ry In
dex)
-20.0%
-18.0%
-16.0%
-14.0%
-12.0%
-10.0%
-8.0%
-6.0%
-4.0%
-2.0%
0.0%
2.0%
Elas
ticity
Advertising Industry Health Measure (Quarterly Percentage Change)Advertising Industry Health Measure Elasticity Estimate (Quarterly Percentage Change)

P a g e 1 0
2 . 0 E C O N O M E T R I C A N A L Y S I S
P a g e 1 1
2 . 1 . I N C O M E E L A S T I C I T Y & G D P Section 1.1.1 of this document provided preliminary evidence that demand for PreSort Barcoded Small Letter volumes may be more elastic during times of economic downturn. In other words, preliminary support was presented that suggested that, all else being equal, the negative impact of a given percentage decrease in Non-farm GDP on PreSort Barcoded Small Letter volumes will be greater than the stimulatory impact of an equivalent percentage increase in Non-farm GDP on PreSort Barcoded Small Letter volumes. As stated in Section 1.1.1 however, this finding would need to be further validated in a more robust manner. To this end, Diversified Specifics undertook econometric demand analysis that focused on ascertaining whether PreSort Barcoded Small Letter volumes income elasticity was statistically significantly higher in periods of lower economic growth. The results of which are presented in this section.

P a g e 1 2
2 . 2 . M E T H O D O L O G Y To assess whether the elasticity of income demand was higher in periods of lower economic growth, the quarterly data employed to develop the PreSort Barcoded Small Letter volumes model, was split into two separate samples based on low growth and non-low growth periods. To ensure that the analysis was robust, it was imperative to split the sample data in accordance with a theoretically relevant GDP growth rate cut-off value (that accurately identified low-growth and non-low growth periods) that also ensured a sufficient number of observations in each of the samples. Total GDP growth rather than Non-farm GDP growth was used, as this reflects the headline measure of economic activity upon which many business forecasts are based upon. The average quarterly growth rates in total GDP over the September quarter 1995 to the December quarter 2008 period was 0.8%. As such, the cut-off growth rate to identify low-growth periods had to be below the average value but at a rate that also ensured a sufficient number of observations in each of the samples. With that in mind, it was determined that 0.5% best reflected the cut-off growth rate value. That is, low growth periods were defined as total GDP quarterly growth rates less than 0.5% and non-low growth was defined as total GDP quarterly growth rates of 0.5% or higher. This resulted in 13 observations in the low-growth sample and 41 observations in the non-low growth periods. The objective of the analysis was to subsequently compare the income elasticities for each of the samples i.e. compare the income elasticities derived in low-growth versus non-low growth periods. Further, to validate the findings outlined in Section 1.1.1, it was necessary to illustrate that demand for PreSort Barcoded Small Letter volumes was more elastic during times of economic downturn to a statistically significant degree (at a 95% level of confidence).

P a g e 1 3
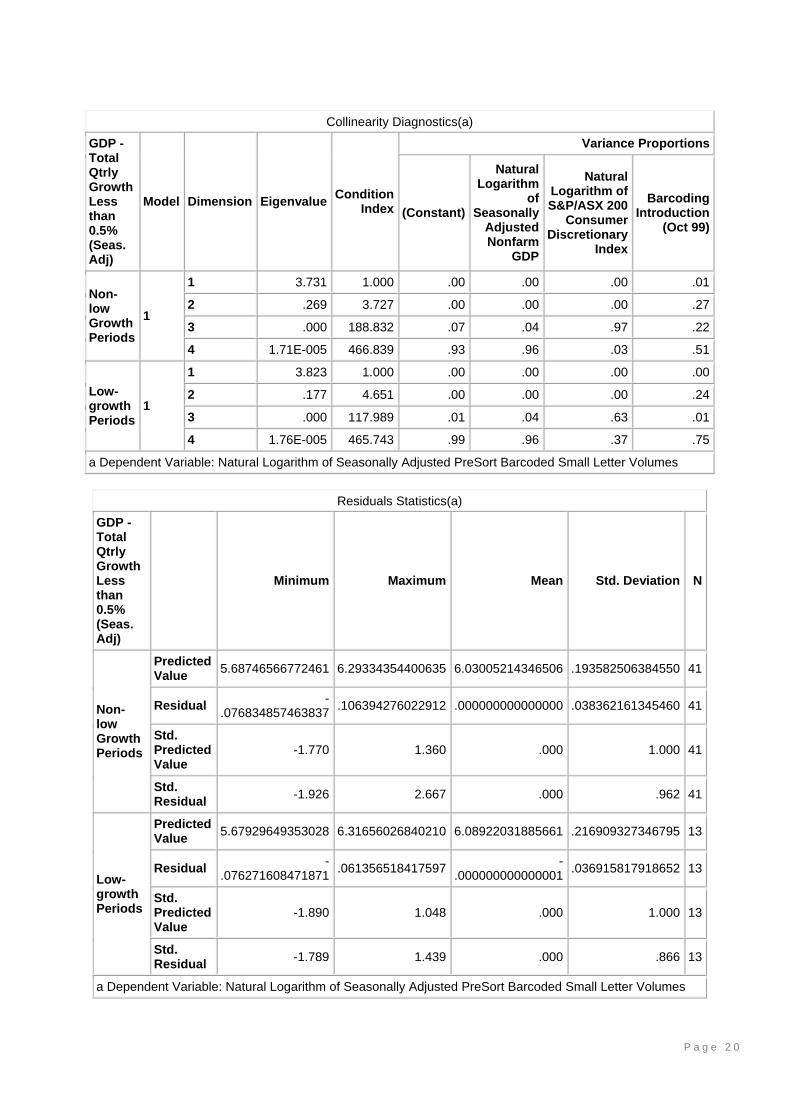
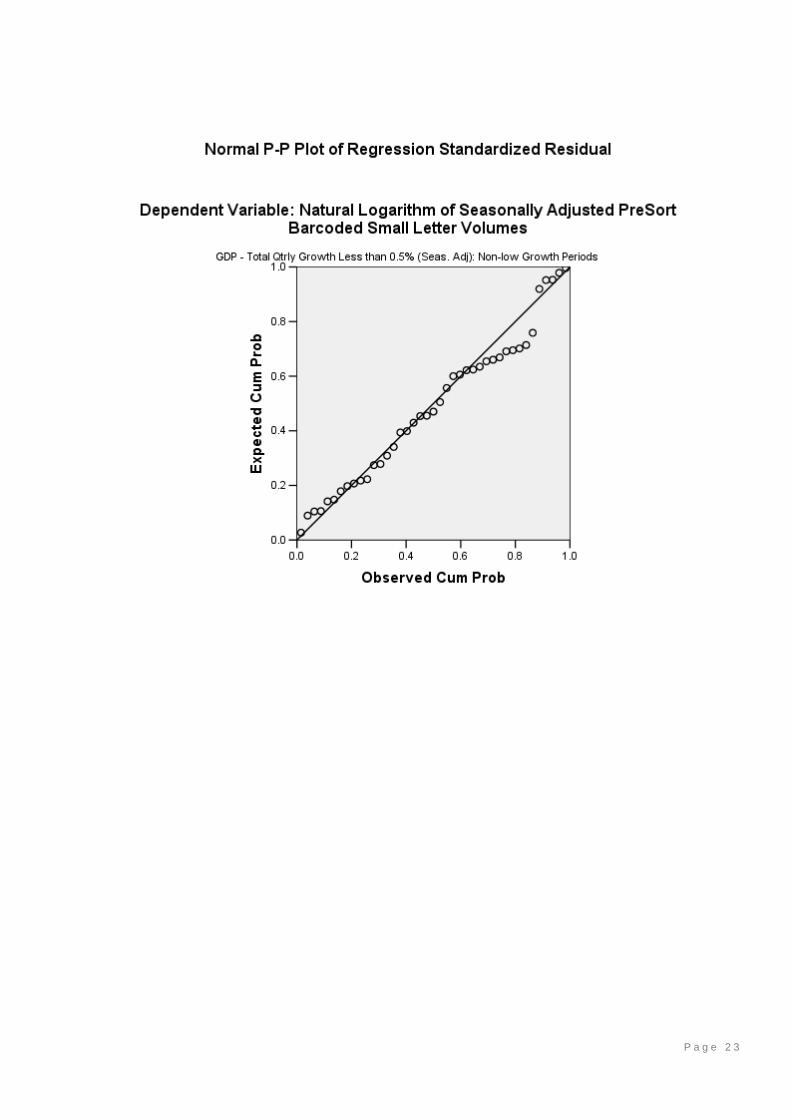
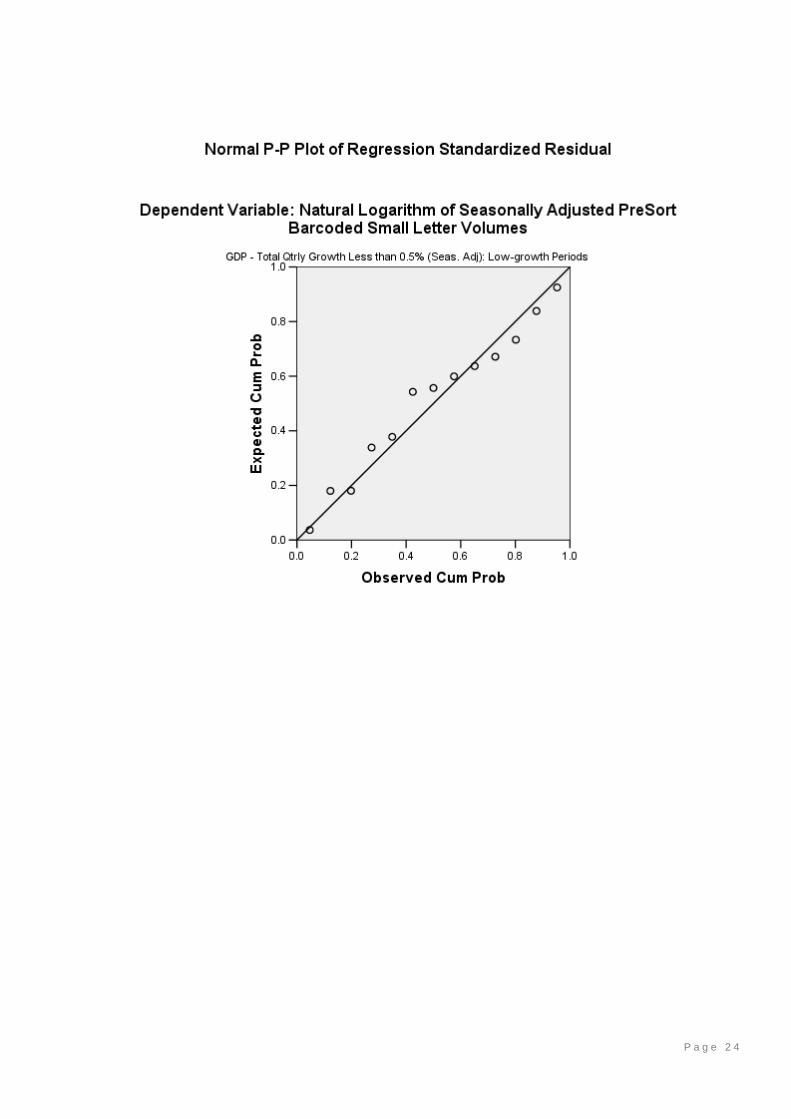
2 . 3 . M O D E L R E S U L T S Splitting the quarterly data used to develop the PreSort Barcoded Small Letter volumes model as described in Section 2.2, provided robust support that demand for PreSort Barcoded Small Letter volumes is more elastic during times of economic downturn and/or lower economic growth periods. The income elasticity for the Low-growth model was more elastic than the equivalent income elasticity obtained for the Non-low growth model. Specifically, the income elasticity for the Low-growth model was 1.179 compared to 0.806 for the Non-low growth model. Moreover, the income elasticity estimate for the Low-growth model is not contained within the Non-low growth model’s 95% confidence interval. Likewise, the income elasticity estimate of the Non-low growth model is not contained within the Low-growth model’s 95% confidence interval. This suggests that the income elasticity estimates for each model, differs to one another to a statistically significant degree at a 95% level of confidence. Table 2.3.1.1 summarises the key results obtained.2
Table 2.3.1.1
Key Results Low-growth Model Non-low Growth Model Total GDP quarterly growth rates < 0.5% > or equal to 0.5% Income Elasticity 1.179* 0.806* Income Elasticity 95% Confidence Interval Lower: 0.849 | Upper: 1.509 Lower: 0.620 | Upper: 0.992Advertising Industry Elasticity .096** 0.179* Advertising Industry Elasticity 95% Confidence Interval Lower: -0.015 | Upper: 0.207 Lower: 0.109 | Upper: 0.248
Adjusted R2 96.2% 95.9% Durbin-Watson Statistic 1.960 1.794 Observations (N) 13 41
* Statistically significant at a 95% level of confidence; ** Statistically significant at a 90% level of confidence
2 Refer to Appendix A for the detailed model output.

P a g e 1 4
2 . 4 . C O N C L U S I O N S The results of this study provide valid quantitative support that demand for PreSort Barcoded Small Letter volumes are more elastic during times of economic downturn. The conclusion that may be drawn from this study therefore, is that PreSort Barcoded Small Letter volumes are more negatively impacted during times of economic slowdown compared to the upside effect on volumes during times of more prosperous economic activity. Formally, the conclusion that may be drawn from this study is as follows: All else being equal, the negative impact of a given percentage decrease in economic growth on PreSort Barcoded Small Letter volumes was found to be greater than the stimulatory impact of
an equivalent percentage increase in economic growth on PreSort Barcoded Small Letter volumes.

P a g e 1 5
3 . 0 M O V I N G F O R W A R D

P a g e 1 6
3 . 1 . F U T U R E A N A L Y S I S
(i) Broadening the Analysis by Letter Segment and Letter Size The results of this study may be and should be extended to cover the following letter segments:
o PreSort Barcoded large letters; o Other small letters; and o Other large letters.
In particular, Diversified Specifics has shown previously that both the PreSort Barcoded large letter segment and the Other large letter segment are statistically associated with Non-farm GDP. As such, the income elasticities for each of these segments may be assessed, to provide insight regarding the impact of changing economic conditions on income elasticity. (ii) Comparative Industry Analysis This study showed that income elasticity for PreSort Barcoded small letters was more elastic in times of lower economic growth. The extent to which this finding may be generalised to other industries is not known at this point. Furthermore, the extent to which this finding is applicable among industries characterised by high income elasticity (e.g. luxury goods, automotive industry, construction industry) and low income elasticity (e.g. retail industry) is also not known at this point. Further econometric analysis could therefore potentially be undertaken to model the demand drivers for a select group of industries characterised by different income elasticity levels e.g. high (greater than 1), moderate (0.5 to 0.7) and low (less than 0.3). The benefit of such an undertaking would be to assess the degree to which the notion that income elasticity of demand is more elastic in times of lower economic growth may be generalised. This in turn may provide further support to this study’s findings.

P a g e 1 7
A P P E N D I X A

P a g e 1 8
C O M P A R A T I V E M O D E L S - O U T P U T
Model Summary(b)
GDP - Total Qtrly Growth Less than 0.5% (Seas. Adj)
Model R R Square
Adjusted R Square
Std. Error of the Estimate
Durbin-Watson
Non-low Growth Periods 1 .981(a) .962 .959 .039887076049498 1.794
Low-growth Periods 1 .986(a) .972 .962 .042626714825378 1.960
a Predictors: (Constant), Barcoding Introduction (Oct 99), Natural Logarithm of S&P/ASX 200 Consumer Discretionary Index, Natural Logarithm of Seasonally Adjusted Nonfarm GDP
b Dependent Variable: Natural Logarithm of Seasonally Adjusted PreSort Barcoded Small Letter Volumes
ANOVA(b)
GDP - Total Qtrly Growth Less than 0.5% (Seas. Adj) Model Sum of
Squares df Mean Square F Sig.
Non-low Growth Periods 1
Regression 1.499 3 .500 314.056 .000(a)
Residual .059 37 .002
Total 1.558 40
Low-growth Periods 1
Regression .565 3 .188 103.574 .000(a)
Residual .016 9 .002
Total .581 12
a Predictors: (Constant), Barcoding Introduction (Oct 99), Natural Logarithm of S&P/ASX 200 Consumer Discretionary Index, Natural Logarithm of Seasonally Adjusted Nonfarm GDP
b Dependent Variable: Natural Logarithm of Seasonally Adjusted PreSort Barcoded Small Letter Volumes

P a g e 1 9
Coefficients(a)
GDP - Total Qtrly Growth Less than 0.5% (Seas. Adj)
Model
Unstandardized Coefficients
Standardized Coefficients
t Sig.
95% Confidence
Interval for B Collinearity
Statistics
B Std. Error
Beta Lower Bound
Upper Bound Tolerance VIF
Non-low Growth Periods
1
(Constant) -6.563 1.052 -6.239 .000 -8.695 -4.432
Natural Logarithm of Seasonally Adjusted Nonfarm GDP
.806 .092 .538 8.763 .000 .620 .992 .271 3.689
Natural Logarithm of S&P/ASX 200 Consumer Discretionary Index
.179 .034 .270 5.210 .000 .109 .248 .379 2.636
Barcoding Introduction (Oct 99)
.101 .025 .246 4.000 .000 .050 .152 .270 3.698
Low-growth Periods
1
(Constant) -9.914 2.164 -4.580 .001 -
14.810 -5.017
Natural Logarithm of Seasonally Adjusted Nonfarm GDP
1.179 .146 .808 8.082 .000 .849 1.509 .313 3.193
Natural Logarithm of S&P/ASX 200 Consumer Discretionary Index
.096 .049 .142 1.955 .082 -.015 .207 .596 1.677
Barcoding Introduction (Oct 99)
.082 .058 .163 1.412 .192 -.049 .212 .236 4.237
a Dependent Variable: Natural Logarithm of Seasonally Adjusted PreSort Barcoded Small Letter Volumes
P a g e 2 0
Collinearity Diagnostics(a)
GDP - Total Qtrly Growth Less than 0.5% (Seas. Adj)
Model Dimension Eigenvalue Condition Index
Variance Proportions
(Constant)
Natural Logarithm
of Seasonally
Adjusted Nonfarm
GDP
Natural Logarithm of S&P/ASX 200
Consumer Discretionary
Index
Barcoding Introduction
(Oct 99)
Non-low Growth Periods
1
1 3.731 1.000 .00 .00 .00 .01
2 .269 3.727 .00 .00 .00 .27
3 .000 188.832 .07 .04 .97 .22
4 1.71E-005 466.839 .93 .96 .03 .51
Low-growth Periods
1
1 3.823 1.000 .00 .00 .00 .00
2 .177 4.651 .00 .00 .00 .24
3 .000 117.989 .01 .04 .63 .01
4 1.76E-005 465.743 .99 .96 .37 .75
a Dependent Variable: Natural Logarithm of Seasonally Adjusted PreSort Barcoded Small Letter Volumes
Residuals Statistics(a)
GDP - Total Qtrly Growth Less than 0.5% (Seas. Adj)
Minimum Maximum Mean Std. Deviation N
Non-low Growth Periods
Predicted Value 5.68746566772461 6.29334354400635 6.03005214346506 .193582506384550 41
Residual -.076834857463837 .106394276022912 .000000000000000 .038362161345460 41
Std. Predicted Value
-1.770 1.360 .000 1.000 41
Std. Residual -1.926 2.667 .000 .962 41
Low-growth Periods
Predicted Value 5.67929649353028 6.31656026840210 6.08922031885661 .216909327346795 13
Residual -.076271608471871 .061356518417597 -
.000000000000001 .036915817918652 13
Std. Predicted Value
-1.890 1.048 .000 1.000 13
Std. Residual -1.789 1.439 .000 .866 13
a Dependent Variable: Natural Logarithm of Seasonally Adjusted PreSort Barcoded Small Letter Volumes

P a g e 2 1

P a g e 2 2
P a g e 2 3
P a g e 2 4

P a g e 2 5

P a g e 2 6

P a g e 2 7

P a g e 2 8