Embed Size (px)
Citation preview

UNIVERSITY OF NAIROBI
COLLEGE OF HUMANITIES AND SOCIAL SCIENCES
FACULTY OF ARTS
DEPARTMENT OF SOCIOLOGY AND SOCIAL WORK
THE IMPACT OF E-LEARNING ON ACADEMIC PERFORMANCE: A CASE
STUDY OF GROUP LEARNING SETS
BY
ODHIAMBO STEPHEN OWINO
C50/62926/2010
A RESEARCH PROJECT SUBMITTED IN PARTIAL FULFILLMENT OF THE
REQUIREMENTS FOR THE AWARD OF MASTER OF ARTS IN SOCIOLOGY
(RURAL SOCIOLOGY AND COMMUNITY DEVELOPMENT) OF THE
UNIVERSITY OF NAIROBI
NOVEMBER 2013

DECLARATION
This research project is my original work and has not been submitted for any award in
any university.
Sign…………………………………Date………………….
Odhiambo Stephen Owino
This research project has been submitted for examination with my approval as the
university supervisor.
Sign.…………………………………….. Date…………………
Professor Edward K. Mburugu
ii

DEDICATION
This work is in memory of my late father Michael Odhiambo and mother Angeline
Atieno both of who believed in the value of education and inspired me to pursue a
lifelong quest for learning and research..
iii

ABSTRACT
This study focused on the impact of e-learning on academic performance. The study
relates to a level one undergraduate module delivered using traditional lectures and e-
learning based methods. E-learning has been revealed in this study not to have a positive
impact on academic achievement contrary to the expectations of this study.
The paper also examines the data for the presence of interaction effects between e-
learning study hours and socio-demographic characteristics. This is undertaken to
identify whether or not personal-characteristic-related learning style differences influence
the extent to which students benefit from e-learning. It is found that, after controlling for
other factors, female students benefited less from e-leaning material than their male
counterparts.
The methodology that was employed in this study was systematic random sampling for
students under traditional study mode and purposive sampling in identification of
students under the e-learning study mode.
It is concluded that in order to improve teaching effectiveness and academic
achievement, higher education should consider aiming to develop e-learning teaching
strategies that encourage greater engagement and also take into consideration the
different learning styles found within the student body.
The study recommends that critical factors such as institutional issue, management issue,
pedagogical factors, technological issue, interface design issue, evaluation issue, and
resource support issue and the factors within each issue have not yet been investigated
with detail coverage. It further suggests that there is need to carry out detail research
involving case studies based on survey questionnaires involving various learning
institutions which will ultimately give a better understanding of impact of e-learning
aspects within implementation process.
iv

ACKNOWLEDGEMENT
I am deeply grateful to Prof Mburugu and Dr. Agnes Zani, my advisors and mentors
throughout my master’s studies. Their commitment to imparting peace and love into
education, to raising complex issues of gender, culture, and justice and their relationship
to education and to nurturing the diverse interests of their students was a constant
inspiration for me. They helped me to discover the scholar within and directed my project
and other coursework in a way that expanded my thinking about Rural Sociology and
Community Development. I always appreciated their constructive comments and their
personal support of my academic endeavors. I would also like to extend a sincere thanks
to Vincent Otieno my research assistant who helped in data collection and proof reading
my paper. Much gratitude go to the many students who spared their time to respond to
my questionnaire and to give their insights that was very helpful in this project.
This research and the relationships I have been privileged to develop during this work
have immeasurably enriched my life and my spirit. I will always be grateful for this
opportunity to have explored with others the importance and meaning e-learning on
academic performance.
v

TABLE OF CONTENTS
DECLARATION..............................................................................................................................ii
DEDICATION.................................................................................................................................iii
ABSTRACT..................................................................................................................................... iv
ACKNOWLEDGEMENT................................................................................................................v
TABLE OF CONTENTS.................................................................................................................vi
LIST OF TABLES...........................................................................................................................ix
CHAPTER ONE...............................................................................................................................1
INTRODUCTION............................................................................................................................1
1.1 Background of the Study............................................................................................................1
1.1.1 Electronic Learning (E-learning).............................................................................................3
1.1.2 Group Learning Sets................................................................................................................4
1.2 Problem Statement......................................................................................................................5
1.3 Research Questions.....................................................................................................................7
1.4 Objectives of the Study...............................................................................................................7
1.4.1 General Objective....................................................................................................................7
1.4.2 Specific Objectives of the Study..............................................................................................7
1.5 Justification of the Study............................................................................................................7
1.6 Significance of the Study............................................................................................................8
1.7 Limitations of the Study..............................................................................................................9
CHAPTER TWO............................................................................................................................11
LITERATURE REVIEW...............................................................................................................11
2.1 Introduction...............................................................................................................................11
2.2 The Role of E-Learning on Academic Performance.................................................................11
2.3 The Role of Prior Computer Skills on Performance in E-Learning Setup...............................14
2.4 The Role of Socio-Demographic Characteristics on Academic Achievement.........................15
2.5 Student Engagement (Hours Spent Online/Offline).................................................................17
2.6 Theoretical Framework.............................................................................................................19
2.6.1 Constructivism Theory...........................................................................................................19
2.6.2 Facilitation Theory (The Humanist Approach)......................................................................21
2.7 Conceptual Framework.............................................................................................................23
Figure 2.1: Conceptual Framework................................................................................................23
CHAPTER THREE........................................................................................................................25
vi

RESEARCH METHODOLOGY....................................................................................................25
3.1 Introduction.........................................................................................................................25
3.2 Research Design..................................................................................................................25
3.4 Unit of Observation...................................................................................................................26
3.5 Study Population.......................................................................................................................26
Table: 3.1 Population sample size..................................................................................................27
3.6 Sampling Method and Procedures............................................................................................27
3.7 Data Collection Procedures and Instruments......................................................................28
3.7.1 Reliability........................................................................................................................28
3.7.2 Validity...........................................................................................................................29
3.8 Data Analysis and Reporting..............................................................................................29
3.9 Ethical Issues............................................................................................................................30
CHAPTER FOUR...........................................................................................................................31
DATA PRESENTATION, ANALYSIS AND INTERPRETATION............................................31
4.1 Introduction...............................................................................................................................31
4.2 Questionnaire Return Rate........................................................................................................31
4.3: Socio Demographic Characteristics.........................................................................................32
4.3.1 Distribution by Gender..........................................................................................................32
4.3.2 Marital Status.........................................................................................................................32
4.3.3 Marital status versus academic performance.........................................................................33
4.3.3 Family Size............................................................................................................................34
4.3.4 Students Average Scores........................................................................................................35
4.3.5 Online Study Hours................................................................................................................37
4.4: Study Hours Impact on Academic Performance......................................................................38
4.4.1 Study Hours in a Day.............................................................................................................38
4.4.2 Impact of study hours on academic performance..................................................................39
4.4.3 Ease in Keeping Up with Reading Hours Required for Online Courses...............................40
4.4.4 Ease in finding time to complete online courses...................................................................41
4.5: Impact of Prior Computer Skills on Performance...................................................................42
4.5.1 Anxiety while using computers.............................................................................................42
4.5.2 Impact of Anxiety on Academic Performance.......................................................................43
4.5.3 Dramatization of Computer Situation in Mind......................................................................44
4.5.4 Difficulty in Using Computers...............................................................................................45
vii

4.5.5 Comparison between Difficulty in Using Computer and Average College Score................46
4.5.6 Action in Case of Computer Complication............................................................................47
4.6 Inferential Analysis...................................................................................................................48
4.6.1 Coefficient of Correlation......................................................................................................48
4.6.2 Coefficient of Determination.................................................................................................49
4.6.3 ANOVA.................................................................................................................................50
4.6.4 Regression Coefficient...........................................................................................................51
CHAPTER FIVE............................................................................................................................53
SUMMARY OF FINDINGS, CONCLUSIONS AND RECCOMENDATIONS..........................53
5.1 Introduction...............................................................................................................................53
5.2 Summary of Findings................................................................................................................53
5.3 Conclusion................................................................................................................................56
5.4 Recommendations for Further Reading....................................................................................57
REFERENCES...............................................................................................................................58
APPENDIX 1: QUESTIONNAIRE...............................................................................................64
APPENDIX 2: TIME FRAME.......................................................................................................71
viii

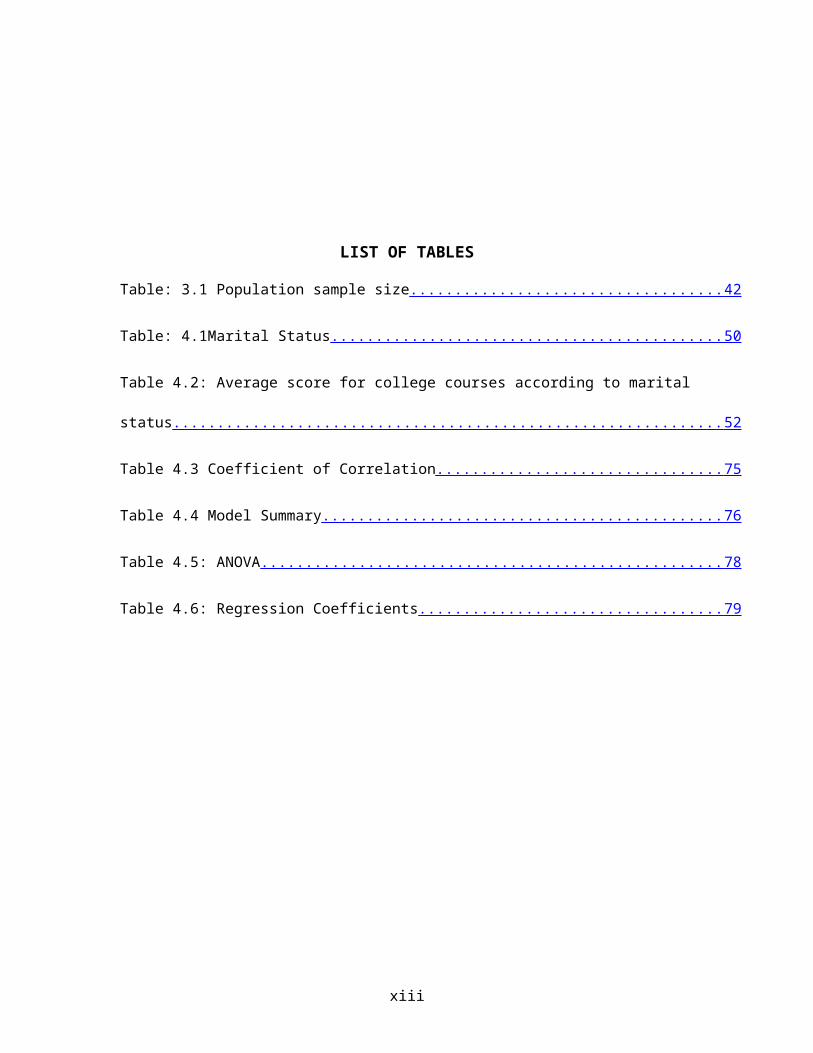
LIST OF TABLES
Table: 3.1 Population sample size ............................................................................................................... 27
Table: 4.1Marital Status ............................................................................................................................... 32
Table 4.2: Average score for college courses according to marital status ................................................... 34
Table 4.3 Coefficient of Correlation ............................................................................................................ 49
Table 4.4 Model Summary .......................................................................................................................... 50
Table 4.5: ANOVA ...................................................................................................................................... 51
Table 4.6: Regression Coefficients .............................................................................................................. 52
ix
LIST OF FIGURES
Figure: 4.1 Distribution by number of children ........................................................................................... 35
Figure: 4.2 Average score for college courses ............................................................................................. 36
Figure: 4.3 Hours dedicated for online studies per day ............................................................................... 37
Figure: 4.4 Study Hours in a Day ................................................................................................................ 38
Figure: 4.5 Impact of study hours on grade scored ...................................................................................... 39
Figure 4.6 Ease in keeping up with reading required for online courses ..................................................... 40
Figure: 4.7 Ease in finding time to complete online courses ....................................................................... 41
Figure: 4.8 Anxiety while using computers ................................................................................................. 42
Figure: 4.9 Impact of anxiety on academic performance ............................................................................ 43
Figure: 4.10 Dramatization of computer situation in mind .......................................................................... 44
Figure: 4.11 Difficulty in using computers .................................................................................................. 45
Figure: 4.12 Difficulty in using computer and average college score ......................................................... 46
Figure: 4.13 Action in case of computer complication ................................................................................ 47
x

CHAPTER ONE
INTRODUCTION
1.1 Background of the Study
Education is a key factor for sustainable development (Chimombo 2005). The
significance of education, especially in developing countries, is increasing because of
progressing pressure to catch up with the developed world regarding, for example, global
competitiveness (Hawkins 2002). Predictably, educational settings are different in
developing countries than in developed countries, such as low quality of education and
narrow possibilities in attending schools in rural areas because of far distances and high
opportunity costs (Ibid 2005). Chimombo, 2005 opines that country-specific
circumstances have to be improved regarding compulsory and free education to foster
general access to education. In Article 26 of the 1948 UN universal declaration of human
rights the right of obligatory and free education for everyone is already committed (UN
Human Rights 1948).
Every year, more of the world’s people become connected to the network, its bandwidth
increases and its use becomes more integrated to all that happens in the globe.
Connectivity to this network has becomes key to opportunity, success and fulfillment for
individuals. Kenya has defined a national ICT policy with a view of creating an e-enabled
and knowledge-based society by the year 2015. Just like the technology has changed the
world, it is now changing the learning and teaching environment.
1

A broad range of learning approaches exists already, for example, e-learning, blended
learning (Maier, 2007), and distance learning which utilize information and
communication technology (ICT). The use of ICT can benefit, for example, students in
rural areas by having them attend classes as distance learners and motivating them to
learn like the “Group Learning Sets” (GLS) initiative offers. Regarding this, the potential
of e-learning seems very assuring, but because of gaps between developed and
developing countries knowledge transfer is not only difficult but also costly.
E-learning denotes the use of ICT by teachers and learners. Schmidt 2005 holds that e-
learning consists of conventional training, such as courses, ad-hoc training, selected
learning objects, formalization through document collections and community formation
which can be achieved via social software.
According to case studies, there are already a number of e-learning programs offered in
developing countries (Kohn et al. 2008). These programs are developed by various
national and international initiatives, for example, the group learning sets initiated by
Computer Aid International in collaboration with Kenyatta University. The growth of e-
learning programs according to Lockwood and Gooley, 2002 is driven by the need for
and potential of providing education in less expensive ways, increased access to
information, effective learning and greater flexibility.
Stephenson, 2001 posits that there is little systematic research into the overall
effectiveness of e-learning as a learning medium despite the great interest in it. He
2
acknowledges that while there is much more work to be done, a variety of e-learning
courses aimed at making sustainable development a reality have been developed and
demonstrate how e-learning can reach thousands if not millions of minds and potentially
plant the seeds of change.
1.1.1 Electronic Learning (E-learning)
Fry 2000 and Wild et al. 2002 describe E-learning as the delivery of training and
education via networked interactivity and distribution technologies. Other authors notably
Roffe, 2002; Schank, 2002; and Sambrook, 2003 see e-learning simply as learning and
communication exercises across computers and networks or for that matter any other
electronic sources.
Khan (2005) pointed that E-learning has been described in various ways as learning using
a number of different technologies and methods for delivery e.g. Computer Based
Training (CBT), Internet-based training (IBT), Web-based instruction (WBI), advanced
distributed learning(ADL), distributed learning (DL), distance learning, online learning
(OL), mobile learning (or m-learning) or remote learning and learning management
systems (LMS).
In the 70s and 80s distance learning became popular and was done via mail until the rise
of Internet usage. In late 90s the digital learning environment was heightened and World
Wide Web started as a distributed learning mechanism to support on campus student and
distance learners. With the use of this delivery technology learners can get a range of
3

resources like discussion forums, multimedia, chat, video conferencing and electronic
black boards (Gulatee and Combes, 2007).
In E-learning system, students are able to interact anytime from wherever with different
instructional material (text, sound, pictures, video and so on) through Internet. In
addition, learners can communicate with teachers and classmates both individually and as
a group discussion with the use of message boards, instant message exchanges and video
conferencing (Al-Ammari and Hamad, 2008).
Khan 2005suggests that e-learning system is used for an open, flexible, and diverse E-
learning environment. Moreover E-learning system can be analyzed as an inventive
approach for delivering, learner-centered, interactive, and facilitated learning
environment to anyplace, anyone, anytime by utilizing the features and resources of
different digital technologies along with other types of learning materials suited for an
open, distributed, and flexible learning environment (Ibid, 2008).
1.1.2 Group Learning Sets
Computer Aid provided over 1,500 PCs to Kenyatta University. Many of these computers
are being used for the university's cutting edge e-learning project, which is enabling rural
students to pursue university courses remotely. Kenyatta University has made its courses
accessible to people living and working in those communities. In particular, the
university is targeting people who are already engaged in work that is vital to the social
and economic development of rural and marginalised areas. These ‘key workers’ include
4
nurses, teachers, entrepreneurs and agricultural advisors. The University is encouraging
students to study together and benefit from each other. In order to facilitate this
collaborative learning, the University through the help from ComputerAid further put in
place mechanism of providing students with computers. Students are encouraged to form
small learning groups of five or six students called Group Learning Sets (GLS).
1.2 Problem Statement
The importance of education is increasing because of increasing pressure to catch up with
the developed world regarding, for example, global competitiveness (Hawkins 2002).
Before the introduction of e-learning many people who wanted to obtain university
degree had to compete for the few places that were offered by the public universities.
Those offered places had to apply for study leave as they had to go through the traditional
learning system. This kind of further education system was characterized by limited
number of students that could be absorbed per an academic year and consequent removal
from their places of work for the duration of their study.
From the reviewed literature, it can be deduced that there seems to be no research studies
on the joint contributions of e-learners’ socio-demographic, hours spent online/offline
and prior computer skills variables to their academic performance. Whereas, researchers
and theorists (Coldeway, 1986; Calvert, 1986; Garrison, 1987; Kumar, 2001) have
stressed the need for a comprehensive approach, taking into account all the experiences
of e-learners as well as the unique aspects of e-learning environment. In addition, it has
also been observed that little research has been devoted to exploring factors that predict
5

the academic performance of e-learners (Cookson, 1989) while those that even exist
concentrated largely on demographic correlates as a component in their studies (Kumar,
2001).
Several studies have been carried out on academic performance especially on
conventional students, but not much on e-learning students within the Kenyan
educational system. The need to sever this ground so as to extend the frontier of
knowledge in order to help improve the unimpressive e-learners’ academic performance
necessitates and serves as the motivating factor for undertaking the present piece of
research so as to fill the existing important research gap.
This study sought to establish whether the “Group Learning Sets” offer its beneficiaries
ability to develop the associated concepts; does e-learning help the students improve their
grades, skills, values, procedures and technology necessary to apply in their jobs. The
study endeavored to answer the following questions, what role does prior computer skills
play in improving student’s performance: In so doing, the study sought to measure the
ability of the students to use e-learning tools such as internet/intranet, computers, and
software for particular purposes. What is the role of personal characteristics on academic
performance? To measure personal characteristics the study sought to identify variables
such as gender, students with special needs, gifted students, and religion these helped the
researcher know such personal issues that may influence a student’s usage and
acceptance of the technology as may be informed by individual’s socialization. Lastly,
what is the impact of hours spent online/offline has on students?
6
1.3 Research Questions
i. To what extent do prior computer skills play in academic performance?
ii. To what extent do socio-demographic characteristics influence academic
achievement?
iii. To what extent does the level of engagement (hours online/offline) in the e-
learning process affect academic achievement?
1.4 Objectives of the Study
1.4.1 General Objective
The general objective of this study was to establish the impact of e-learning on academic
performance
1.4.2 Specific Objectives of the Study
i. To establish the role prior computer skills play academic performance.
ii. To determine the impact of socio-demographic characteristics on academic
achievement.
iii. To establish the impact of number of hours spent online/offline (Time
management) on academic achievement.
1.5 Justification of the Study
Web Based Training and its newer and more general synonymous term e-Learning are
two of today’s buzz-words in the academic world. Decision-makers associate with its
new ways of learning that are more cost efficient than traditional learning strategies and
which allow students to better control the process of learning because they can decide
7

when, where and how fast to learn.The emergence of e-leaning has tremendously
transformed information – handling and management in academic environments (Ani and
Ahiauzu, 2008). A number of e-learning initiatives have been put in place to assist in the
development training and use of electronic resources in a number of academic
institutions.
These initiatives notwithstanding, some inadequacies in the development provision and
utilization of electronic resources have been identified in a number of academic
institutions. A number of studies have been made with a view to proffering solutions to
problems encountered in the development of electronic information resources. However,
little or no efforts have been recorded in the identification of influence and impact of e-
learning on academic performance of student in higher learning institutions. As the use
of e-learning is becoming more and more widespread in higher education it has become
increasingly important to examine the impact that this teaching style has on student
performance. This study will therefore help add information on the role of e-learning on
academic performance.
1.6 Significance of the Study
The present study has great significance. First of all, the study findings provide an idea
about the e-learning aspects and academic performance in order to provide key
information to further research work in such areas. In the same way, the study provides
knowledge and guidelines to that may be of help to policymakers. The research is
8

therefore of importance for planners, and other social scientists. Finally, this study
provides an input to the students, teachers and researchers in the areas of e-learning.
Research works are embarked upon with a view to extending the frontier of knowledge.
The present study was therefore carried out with this same objective, especially in the
field of e-learning. It has therefore, contributed to the extension of the frontier of
knowledge in the following ways. First, the study has shown the predictive power of the
selected factors, especially socio-demographic factors, prior computer skills and time
management status in the determination of the academic performance.
1.7 Limitations of the Study
The present study reflects a number of limitations. Firstly, the student models of learning
were identified on the basis of a specific sample comprising those under e-learning study
model and those under the traditional study model. Secondly, the theoretical nature of
this study limits its direct relevance for the educational praxis. Therefore, it is hoped that
future research may additionally focus on how student cognitions about learning are
influenced in the context of everyday learning environments. The results could enable
educational practitioners to encourage the adoption of student learning models which
invoke a deep oriented and self-regulated study strategy.
This study did not consider all the aspects e-learning influences but instead was restricted
to those elements of e-learning that affect performance in one way or the other. The study
9

did not also consider all students studying through the e-learning mode but only focused
on the Kenyatta University students and specifically those who benefited from the
Computer Aid initiative.
10

CHAPTER TWO
LITERATURE REVIEW
2.1 Introduction
This chapter reviews various studies which have shown the inter-relationships among the
measures of e-learning inputs pertinent to academic achievement. A more specific model
will be developed for the present study.
2.2 The Role of E-Learning on Academic Performance
Attitudes concerning e-learning, echoed by scholarly and academic reviews, range from
neutral to positive. On one hand, it is noted that e-learning is at least as effective as
traditional instructional strategies (Rosenberg, Grad and Matear, 2003), and that there are
no major differences in academic performance between the more traditional and more
technology-oriented modes of instruction (Cavanaugh, 2001). On the other hand, many
reviews go further, reflecting a principally positive attitude towards the impact of e-
learning (Mayer, 2003). The current piece sought to demystify e-learning by
concentrating on how specific e-learning factors (socio-demographic characteristics,
hours spent on-line and prior computer skills) influence individual academic
performance.
There is a considerable body of evidence to suggest that different teaching delivery styles
can have different degrees of success; as measured in terms of academic results (Emerson
& Taylor, 2004). In relation to online teaching, some studies indicate that this medium of
delivery has a positive impact on performance, for example, Smith and Hardaker (2000).
11

Other studies however, find that greater online teaching has a negative impact on
performance (Johnson, 2005).
Benefits include offering a variety of new possibilities to learners (Breuleux, Laferrière,
& Lamon, 2002), in addition to having a positive effect on students’ achievement in
different subject matter areas (Chambers, 2003). Other benefits of electronic education
include increases in enrollment or time in school as education programs reach
underserved regions, broader educational opportunity for students who are unable to
attend traditional schools, access to resources and instructors not locally available, and
increases in student-teacher communication. According to Barker & Wendel (2001)
students in virtual schools showed greater improvement that their conventional school
counterparts in critical thinking, researching, using computers, learning independently,
problem-solving, creative thinking, decision-making, and time management. A study by
Calderoni (1998) revealed that academic advantages over traditional classroom
instruction were demonstrated by students in Mexico’s Telesecundaria program, who
were “substantially more likely than other groups to pass a final 9th grade examination”
administered by the state; by students taking a chemistry by satellite course (Dees 1994);
and by students learning reading and math via interactive radio instruction (Yasin &
Luberisse 1998).
Electronic education is not the most effective choice in all situations. Students may feel
isolated, parents may have concerns about children’s social development, students with
language difficulties may experience a disadvantage in a text-heavy online environment,
12

and subjects requiring physical demonstrations of skill such as music, physical education,
or foreign language may not be practical in a technology-mediated setting. Bond (2002)
found that distance between tutor and learner in an online instrumental music program
has negative effects on performance quality, student engagement, and development and
refinement of skills and knowledge. Virtual school students show less improvement than
those in conventional schools in listening and speaking skills (Barker & Wendel 2001).
Highly technical subjects have also proven to be difficult to teach well online. The
Alberta Online Consortium evaluated student performance on end-of-year exams among
virtual school students across the province, and found that virtual school student scores in
mathematics, and the sciences lagged significantly behind scores of non-virtual school
students (Schollie, 2001).
Kearsley (2000) notes that given instruction of equal quality, groups of students learning
online generally achieve at levels equal to their peers in classrooms. Equality between the
delivery systems has been well documented over decades for adult learners. Evidence to
date convincingly demonstrates that when used appropriately, electronically delivered
education—‘e-learning’— can improve how students learn, can improve what students
learn, and can deliver high-quality learning opportunities to all children” (NASBE, 2001).
A primary characteristic that sets successful distance learners apart from their classroom-
based counterparts is their autonomy (Keegan 1996) and greater student responsibility as
is noted by Wedemeyer (1981). A second characteristic that differentiates successful
13

distance learners from unsuccessful ones is an internal locus of control, leading them to
persist in the educational endeavor (Rotter 1989).
2.3 The Role of Prior Computer Skills on Performance in E-Learning Setup
Some learners are better prepared than others to use e-learning technologies to facilitate
their educational progress; individual “readiness” seems to be a crucial factor in
accounting for the success of e-learning applications in education. Looker and Thiessen
(2002), in their paper noted that digital divide for Canadian youth, remarked that access
to, and experience with, computer technology determines “computer competency”, and
that this competency is generally associated with urban residents of higher economic
status.
Levin and Arafeh (2002) remarked on the differences between students who are highly
gifted in the internet usage and those who have had little opportunity to develop their
experience with networking tools. Dewar and Whittington (2000) concluded that adult
learners’ learning styles (as indicated by Myers-Briggs personality types) can predict the
pattern of their participation in online courses.
It is interesting to note however, that a key learning-style related factor may in fact be the
student’s familiarity with the technology. A number of studies have shown that
computing experience is a strong predictor of attitudes towards, and also use of,
computers and the internet (Atkinson & Kydd, 1997). In effect, the student’s learning
style may adapt and improve as familiarity with the e-learning medium increases.
14
2.4 The Role of Socio-Demographic Characteristics on Academic Achievement
There have been numerous studies on the relationship between socio-demographic
characteristics and academic performance. Some studies focused on specific socio-
demographic Variables and e-learners’ academic performance, characteristics or areas
such as gender and learning styles (Blum, 1999; Shaw & Marlow, 1999; McLean &
Morrison, 2000), ethnicity and learning styles (Jaju, Kwak&Zinkham, 2002), academic
performance and learning styles in both Information Technology (IT) and non-
Information Technology (non-IT) subject areas and in distance and contact courses
(Aragon, Fowler, Allen, Armarego& Mackenzie, 2000; Papp, 2001; Johnson &Shaik,
2002; Neuhauser, 2002; Zywno&Waalen, 2002), level of educational attainment, number
of children in the family, full-time work experience, family income level (Abdul-
Rahaman, 1994; Parker, 1994; Whittigton, 1997), age, marital status, employment status
(Woodley & Parlett, 1983; Chacon-Duque,1985; Powell, Conway & Ross, 1990), number
of hour employed per week, distance traveled to study centre, learners’ previous
educational level (Wang & Newlin, 2002).
Studies above established divergent findings. For example, for first year programming
courses, Thomas, Ratcliffe, Woodbury and Jarman (2002) reported that there was a
relationship between student learning style and academic performance, while Byrne and
Lyons (2001) established that no such relationship exists. Also, Woodley and Parlett
(1983) found that previous educational level, gender, age and occupation were associated
with persistence and academic performance. Similarly, Powell et al. (1990) established
that marital status, gender and financial stability contributed significantly to distance
15

learners’ academic performance. Conversely, Chacon-Duque (1985), Wang and Newlin
(2002) and Ergul (2004) found that educational level, age, gender, employment status and
number of children in the family were not significant predictors of distance learners’
academic performance. Based on the findings from above studies on the relationship
between socio-demographic characteristics and academic performance, it appears the
issue remains inconclusive.
Cuneo, Campbell & Harnish (2002) list several individual characteristics that may
determine the outcomes of technological interventions: motivation, computer skills,
literacy skills, communication skills, and learning styles. Cuneo and Harnish (2002) point
out that “quasi-open computer-mediated environments are not safe places for students
unsure of their writing skills and knowledge, online learning might not be appropriate for
all students”. Looker and Thiessen (2002) in their survey of Canadian high school
students indicated that females demonstrated less interest (and less confidence) in
achieving computer competency. Bryson, Petrina and Braundy (2003) studied “gender-
differentiated participation” in British Columbia schools; they noted that the percentage
of girls enrolled in technology-intensive courses remains extremely low, while
performance data indicate that those female students who participate in these courses do
better, on average, than male students in these courses.
Li (2002) observed that, female students tend to initiate conversations, while male
students are more likely to enter the dialogue at later stages and respond to previous
discussions. Individual metacognitive factors are also implicated in student success as
16
Karsenti (2001) points to the relevance of self-direction and self-regulation in university
students, concluding, “The main difficulty encountered by students seemed to be their
lack of autonomy or the trouble they had in learning by themselves, in managing their
own learning” (p. 33).
2.5 Student Engagement (Hours Spent Online/Offline)
Research suggests that student academic performance may be affected by both
engagement effects and learning-style effects. Carini et al (2006) found that, although in
general, the relationship between engagement and performance is complex, engagement
is positively correlated with student performance. Their conclusion is supported by a
number of empirical studies: Rodgers and Ghosh (2001) identified that ‘effort’ (or
engagement) levels were highly significant in determining student examination
performance. Although, another study made in an e-learning context (Davies and Graff,
2005) found that online engagement had no statistically-significant impact on
examination performance. Additional studies in this area have examined the issue of what
determines the amount of time that a student spends on e-learning. Arbaugh (2000)
argues that this will depend on the student’s attitude to the perceived usefulness, and also
the ease of use, of this delivery medium. It is suggested that students who spend more
time on internet-based courses tend to be the ones who take more ownership of the
learning process, and as a consequence receive the greatest learning benefit (good
performance as measured by grades). From this it can be inferred that we might expect to
find a significant, and positive, relationship between the level of e-learning engagement
and academic performance.
17

The ability to effectively manage learning time is an important element in of electronic
learner success (Kearsley, 2000). Palloff and Pratt (1999) hinted that interacting in a
Web-based course can require two to three times the amount of time investment than in a
face-to-face course. Roblyer (1999) pointed that students who have difficulty managing
time are more likely to achieve less in a distance course or drop out altogether. Gibson
(1998) pointed out that a key construct relating to distance learners’ persistence is their
self-efficacy for learning at a distance and that personal perceptions of competence (self-
efficacy) are related to learners’ perceptions of their ability to manage time effectively.
Students who use their time efficiently are more likely to learn and/or perform better than
students who do not have good time management skills. Zimmerman and Risemberg,
(1997) opine that self-regulated learners know how to manage their time because they are
aware of deadlines and how long it will take to complete each assignment. They prioritize
learning tasks, evaluating more difficult from easier tasks in terms of the time required to
complete them. They are aware of the need to evaluate how their study time is spent and
to reprioritize as necessary.
The other key performance-influencing issue relates to differences in student learning
styles. These may result in differences in the effectiveness of e-learning delivery methods
for individual sub-groups within the student body. Within the learning-styles literature
the notion that different learners have different cognitive styles has been widely
examined (Klob, 2000). In addition to be general indication, there is a considerable
support in the literatures for the suggestion that there are identifiable variations in the
learning styles of sub-groups within the student population.
18

2.6 Theoretical Framework
The focus of this study is built upon the various learning styles theories of online
learning, and how learners gain knowledge differently. Facilitation theory and
constructivist theory are two popular learning theory concepts which are used as a
representation as a taxonomy for learning (Etmer & Newby, 1993). According Eccles
(1999) developing a system of best practices built around these learning theories can
assist teachers in encouraging improved student preparedness and instruction presented
within an online learning environment of higher education.
2.6.1 Constructivism Theory
Constructivism is the theory that people construct their own understanding and
knowledge of the world, through experiencing things and reflecting on those experiences.
When learners encounter something new, they reconcile it with previous knowledge and
experience. They may change what they believe, or they may discard the new
information as irrelevant. To be active creators of their knowledge however, they must be
able to ask questions, explore and assess what they know. In the classroom, the
constructivist view of learning means encouraging students to use active techniques such
as experiments and real-world problem solving using authentic data if possible, and to
create knowledge and reflect on their understanding.
Constructivism modifies the role of the teacher so that teachers help students to construct
knowledge rather than reproduce a series of facts. The constructivist teacher provides
19

tools such as problem-solving and inquiry-based learning activities like in e-learning
setup so that students can formulate and test their ideas, draw conclusions and inferences,
and convey their knowledge in a collaborative learning environment. The teacher must
understand the students' preexisting conceptions and guide the activities to address this
knowledge and then build on it. Constructivist teachers encourage students to assess how
the activity is helping them gain understanding. By questioning themselves and their
strategies, students become expert learners as they learn how to learn, with the use of
computers online and/or offline. The students then have the tools necessary to become
life-long learners.
The teaching-learning method in e-learning is assumed to be self-directed learning
(SDL), which is supported by the educational philosophy of constructivism. According to
constructivism theory, e-learning is an active information process because knowledge
generation is accomplished through individual experience, maturity and interaction with
one’s environment. Due to this point of view, the educational philosophy of
constructivism is distinguished from objectivism in that the learner is regarded as a
passive recipient of information (Rovai, 2004).
Learning performance in regards to e-learning is possibly lower than a crammed
educational style based on objectivist educational philosophy, with the exception of a
strategic approach relating to the efforts and studies for the pleasure of the self-learner.
Lee et al., (2007) point that the SDL teacher is available as an assistant and guide for
learning, not as a unilateral knowledge source and messenger.
20

Learners take the lead in self-regulated learning for the development of a total learning
process that involves problem perception, adoption, and assessment of alternatives (Lee,
2004). Learners play the same roles that the producers do by organizing or re-organizing
knowledge like a consumer, by selecting knowledge and using it practically (Thatcher&
Pamela, 2000).
E-learning must be considered as one of many SDL strategies. The reason is that an e-
learner attends a lecture only to register the time, place, subject, and to alter the order of
attending lectures. Proper monitoring of the learner is difficult in comparison with the
off-line education already being used, not only because the learning progress method of
evaluation is being altered, but because personal meetings with the teacher are also no
longer part of the process. Therefore, it is important to manage one’s ability to organize
self-learning time, process information, plan data, and control data.
2.6.2 Facilitation Theory (The Humanist Approach)
Learning theory developed by Carl Rogers. One of the basic premises of this theory is
that learning is possible because human beings have a "natural eagerness to learn" and
they are responsible for and at the center of the learning process (person-centered
learning). E-learning is possible only because individuals signed up in it are self-driven
and eager to learn despite their location in relation to learning institutions. The role of the
teacher is to act as a facilitator- no amount of effort on the part of the teacher can
guarantee success, unless the learner has a desire and predisposition to learn.
21

An interesting contribution of Rogers's Facilitation Theory is the notion that learning
involves changing one's self-concept. Such changes may involve discovering one's
strengths or weaknesses. Learners in the e-learning setup have to perceive the possibility
that there is in the e-learning system for knowledge acquisition. A freshly perceived self-
concept has a consolidating impact on learning in that it allows the learner to attack a
target skill with confidence or with an adjusted 'updated' approach.
Implicit in the non-direct facilitative approach is the assumption that learners can find the
information by themselves (teachers merely facilitate that process), an assumption which
downplays the role of information transmission and underestimates the contribution of
teaching. Such a teaching model is obviously an idealization which is rarely found in its
pure form in practice.
22

2.7 Conceptual Framework
Moderating Variables
Dependent Variable
Independent Variables Intervening Variables
Figure 2.1: Conceptual Framework
Source (Author 2012)
The above conceptual framework was used in this study, the independent variables are
prior computer skills, socio-demographic characteristics and hours spent online/offline
that may influence the academic performance of individual. Prior computer skills are
thought to make it easy for students to use computers and computer software that are
used to deliver academics; socio-demographic characteristics include elements such as
gender, number of children and marital status which play a role in academic performance,
does the number of children influence academic performance, how does the married
individuals academic performance compare to that of unmarried individuals.
Student – Teacher contact
Prior computer skills
Socio-demographic Characteristics
Hours spent online
Academic performance
Attitudes towards education
23

Academic performance is the dependent variable in this study, how does academic
performance vary based on the independent variables. Attitude which deals with the
overall perception of the learner about learning style and hence influencing performance
is the intervening variable. Regardless of the variance of the independent variables, the
intervening variable’s influence is constant. Teacher – student contact is the moderating
variable that provides the interaction effect where it moderates the relations between the
independent variables. Academic performance in an e-learning setup can be influenced
by varied variables either positively or negatively.
24
CHAPTER THREE
RESEARCH METHODOLOGY
3.1 Introduction
This chapter describes the methods that were used in the study. It explains the research
design, the study population, sampling method and procedures, data collection
procedures and instruments, data analysis, reporting and ethical issues.
3.2 Research Design
The research design was an analytical survey. Analytical surveys also referred to as
diagnostic studies attempt to describe and explain why certain situations exist. In this
approach two or more variables are usually examined to test research hypotheses. The
results allow researchers to examine the interrelationships among variables and to draw
explanatory inferences. In this study, the researcher sought to establish the relationship
between prior computer skills; socio-demographic characteristics; and level of student
engagement effect on academic attainment.
3.3 Unit of Analysis
According to Mugenda and Mugenda (2003) units of analysis are units that are designed
for purposes of aggregating their characteristics in order to describe some larger group or
abstract phenomenon. Nachmias and Nachmias (1996) describe the units of analysis as
the most elementary part of the phenomenon to be studied. To Singleton et.al (1988; 69)
they are “what or whom to be analyzed”. In this study, the unit of analysis was the
different categories discussed in this paper as the ‘study modes’ (e-learning and
conventional).
25

3.4 Unit of ObservationThe unit of observation in this study was the individual students whose performance was
aggregated to inform category performance.
3.5 Study Population
In this study, the population of interest is beneficiaries of the 1500 computers that were
provided by ComputerAid international. Each computer was to be used by five e-learning
students. The total population of the beneficiaries is (1500 * 5) 7500 students. An
equivalent population was targeted for students under the conventional learning mode so
as to avoid overrepresentation of one category. The total population in this study was thus
fifteen thousand, (7500 * 2 = 15000) being seven thousand five hundred on the e-learning
program and seven thousand five hundred on the conventional study mode. From the total
population, a sample of one hundred and fifty students’ constituting seventy five on e-
learning mode and seventy five on the conventional study mode was targeted. This is a
total sample population of 150 which is 1 percent of the total population. The sample 75
for each category was guided by Dr. John Curry Professor of Educational Research,
North Texas State University (now retired), who provided his research students (fall,
1984) with the "rule of thumb" on sampling (Gay, 1987) presented in the table 3.1 below.
The sample size was also deemed appropriate when it was noted that the beneficiaries of
the group learning sets are spread across the country, time and finances did not allow for
inclusion of a bigger number. On the same note, in the bid to have equal representation,
the number seventy five was settled for students under traditional learning mode.
26

Table: 3.1 Population sample sizeSize of population Sampling percent
0-100 100%
101-1,000 10%
1,001-5,000 5%
5,001-10,000 3%
10,000+ 1%
Source Gay (1987)
3.6 Sampling Method and Procedures
Through a systematic random sampling procedure where a neutral start point was
identified by the researcher where the first student was identified randomly, within the
study location. It was key to consider gender parity in the study, as such for those under
conventional study mode, if a male student was picked the next was to be a female
respondent. Identification of the starting point was done at the gate of Kenyatta
University, the data collection was done on one side of the road towards the
administration block, upon reaching the administration block, and the other side of the
road was taken towards the gate. After identification of the first respondent, five students
were past then the sixth was included in the study, if the sixth student was not of the
opposite gender, five more students were past till the opposite gender was found. The
process was repeated until seventy five respondents were interviewed.
27

To identify e-learning respondents, a list of students was obtained from the institution,
systematic random sampling was then used to select seventy five students. A starting
point was first randomly picked then every fifth name in the list was included in the
sample. Questionnaires were then sent online to the selected seventy five students.
3.7 Data Collection Procedures and Instruments
The main instrument of data collection in this study was questionnaires. The items in the
questionnaire were structured (closed ended) and unstructured (open ended). The
structured questions measured the subjective responses to clarify the objective responses
and at the same time, enhance formulation of recommendations of the study. The
researcher used trained research assistants to collect data.
3.7.1 Reliability
According to Devellis (1991), as cited by Mugenda, (2004) reliability is the proportion of
variance attributable to the time measurement of a variable and estimates the consistency
of such measurement over time from a research instrument. It is a measure of the degree
to which a research instrument would yield the same results or data after repeated trials.
In order to ensure reliability the researcher issued the questionnaires to the respondents,
collected them and checked on the responses. After two weeks the questionnaires were
re-tested by administering it at again to respondents with the same characteristics. This
ensured internal consistency of the questionnaire and affirmed the responses from the
selected sample.
28
3.7.2 Validity
Validity establishes the relationship between the data and the variable or construct of
interest. Its estimates how accurately the data obtained in a study represents a given
variable or construct in the study Mugenda, (2004). To ensure accuracy of the data the
researcher pre-tested the questionnaires and analysed the results and made corrections on
the questions that were not clear.
The questionnaires provide accurate data due to the process of pre-testing in the selected
sample to maintain validity. The researcher visited the sampled student’s to make them
aware of the need of the study. This ensures validity of the data collected.
3.8 Data Analysis and Reporting
According to Miles and Huberman (1994) data analysis is an iterative process. Data
analysis consists of three activities: Data reduction, Data display, and Conclusion
drawing/verification”.
Data reduction, this process is applied to qualitative data and focus remains on selection,
simplification and transformation of data. In this continuous process the data is organized
throughout the research to draw and finalize a conclusion (Miles and Huberman, 1994).
In this research, the data was reduced from critical elements in implementation of E-
learning to students’ academic performance.
29

In data display the data is displayed in an organized form or the data has to be put into an
order to easily draw the conclusion. Tables and graphs are used to indicate distinct
frequencies of various factors of E-learning implementation and academic performance.
3.9 Ethical Issues
Confidentiality: The participants were guaranteed that the identifying information will
not be made available to anyone who is not involved in the study and it will remain
confidential for the purposes it is intended for.
Permission: The researcher sought permission to carry out the research from the
University
Informed consent: The prospective research participants were fully informed about the
procedures involved in the research and were asked to give their consent to participate.
Anonymity: The participant remained anonymous throughout the study and even to the
researchers themselves to guarantee privacy.
30

CHAPTER FOUR
DATA PRESENTATION, ANALYSIS AND INTERPRETATION
4.1 IntroductionThis chapter presents the data analysis techniques and interpretation of the findings of the
impact of e-learning on academic performance. The finding was intended on answering
the study’s research objectives. Data composed was collated and reports were produced
in form of tables and figures and qualitative analysis done in prose.
4.2 Questionnaire Return RateThe study response rate was 67% as shown in table 4.1 below majority of the completely
filled questionnaires were by the students under the conventional study mode, only 42%
of the completely filled questionnaires were by students under e-learning mode.
Location Response Rate
Frequency Percent Valid Percent
E-learning students
58 38.0 58.0
Traditional Mode
Invalid
42
50
29.0
33.0
42.0
Total 150 100.0 100.0
31

4.3: Socio Demographic CharacteristicsThis section presents the socio-demographic information of the respondents presented in
bar graphs, charts and tables. The study found it crucial to ascertain the said information
since it was deemed that such information was a clear indicator of factors that may
influence one’s academic performance. The analysis relied on this information of the
respondents so as to categorize the different results according to their acquaintance and
responses.
4.3.1 Distribution by GenderThe study sought to establish the distribution by gender of the respondents in selection of
the sample. It was observed that majority (58%) of the respondents were male while 42%
of the sample were female. The findings shows that a majority of the respondents were
male (58 percent), this was interpreted to mean that more males than females are
admitted in higher learning institutions.
4.3.2 Marital StatusTable 4.1 depicts the findings on the marital status of the respondents that participated in
the study.
32

Table: 4.1Marital StatusMarital status Frequency Percent
Married 46 46.0
Widowed 3 3.0
Separated 4 4.0
Never married 47 47.0
Total 100 100.0
The study sought to establish the marital status of the respondents, the findings reveal
that most of the students (47%) had never been married and were in the conventional
learning system, 46 percent had been married and were in the e-learning study mode, 4
percent were separated, while 3 percent were widowed. The respondents who had never
married were mostly those under the conventional learning mode. The majority of those
married were under e-learning study mode. The findings revealed that marital status was
a big determinant on one’s choice of mode of study as it was found that the married
category mostly constituted those who were on the e-learning mode of study who by
extension had a family to attend to besides school.
4.3.3 Marital status versus academic performanceTable 4.2 is a presentation of the findings on the academic performance of the students
based on their marital status.
33

Table 4.2: Average score for college courses according to marital statusMarital status Average score for college courses Total
A B C N Percentage
Married 22 17 61 46 100
Never married
79 21 47 100
The study sought to compare the academic performance of married and unmarried
students table 4.2 shows that on average, more married students 22 percent scored A
while none of the unmarried students scored A, however, the unmarried students scored
more B’s than the married, 79 percent of the unmarried scored B compared to 17 percent
of the married students. More married students scored an average of C’s as compared to
the unmarried students who had only 21 percent scoring an average of C. The findings
can be deduced to mean that despite the married students having the majority scoring an
average of A, the unmarried students still performed better than the married students.
4.3.3 Family SizeFigure 4.1 depicts the findings on the family size of the respondents that participated in
the study
34

Figure: 4.1 Distribution by number of children
The respondents were asked to provide data on the number of children. The number of
children is a pointer to responsibility level that in the researchers view has a role on the
level of commitment to one’s education. Figure 4.1 reveal that, 19 percent of the
respondents had 1 – 2 children, 22 percent had 3 – 5 children, while the majority 58
percent had between 5 – 9 children. Number of children was found to influence the study
time of parents, the level of responsibility of those with more children is higher and hence
eats into the time of the students under e-learning program. It was of interest to note that
those with large families were on the e-learning study mode while those who were
unmarried mostly constituted students under the conventional study mode.
4.3.4 Students Average ScoresFigure 4.2 is a presentation of the findings on the average performance of the respondents
that participated in the study.
35
Figure: 4.2 Average score for college courses
The study sought to establish the average scores of the students, figure 4.2 is a
presentation on the students’ performance1, the average score for the pupils was
distributed as shown in the figure, of the A’s scored 83 percent was by those under
conventional study mode and 17 percent under e-learning system, 40 percent and 60
percent of the students who scored B were on e-learning and conventional study mode
respectively, for the C’s recorded 73 percent and 27 percent respectively was by students
on e-learning and conventional study modes respectively. From the figure above, it can
be deduced that the performance of students under the conventional study mode was
better than those under e-learning mode, this they (e-learning students) said was due to
the responsibilities they have making them not to fully concentrate on studies.
1 The scores are as stated by the respondents and were not confirmed by the examination department as such information could only be given to the students themselves
36

4.3.5 Online Study HoursThe study sought to establish the number of hours students spent studying online. Figure
4.3 depict the findings as revealed by the respondents that participated in this study.
Figure: 4.3 Hours dedicated for online studies per day
Data presented on Figure 4.3 shows that 34 percent and 10 percent of male and female
respectively constituted those who study for 1-2 hours. 14 percent and 50 percent of those
who study for between 3-5 hours were male and female respectively, 52 percent and 40
percent of male and female respectively indicated that they study for between 5 – 9 hours.
The findings reveal that male students on e-learning mode spent more hours studying a
day than their female counterparts. One female respondent had this to say “masomoni
mazuri, lakini kazi za nyumbani pia lazima tuyafanye, kwa hivyo inabidi tujipange”
meaning, in as much as studying is OK, we must also do household chores, we therefore
must manage out time well. The female graph is seen to rise towards 5 hours spent a day
in studies the falls drastically, this is explained by the number of duties women have to
attend to in a day limiting the number of hours they spend studying. The male graph on
the other hand shows a different behavior where towards 9 hours a day spent on studies
37
the graph rise meaning that the male have more hours of study as compared to their
female counterparts.
4.4: Study Hours Impact on Academic PerformanceThis section presents the impact of study hours on one’s academic performance
4.4.1 Study Hours in a DayFigure 4.5 depicts the findings on the number of hours students dedicated for their studies
per day.
Figure: 4.4 Study Hours in a Day
The study sought to establish the number of study hour’s students under e-learning
system and those in conventional study mode employ in a day. Most (44 percent) of
students in e-learning mode studied for between 1 and 2 hours a day, figure 4.4 reveal
that 38 percent and 26 percent of e-learning and conventional mode students respectively
spent between 3 and 5 hours a day studying. Of those who study for between 5 – 9 hours
a day, 18 percent and 74 percent were on e-learning and conventional study mode
38

respectively. The findings reveal that students under the conventional study mode spend
more hours a day studying than their counterparts on e-learning study mode. It can
therefore be deduced that students under conventional study mode are likely to perform
better than those under e-learning mode considering the time both sets dedicate to studies.
4.4.2 Impact of study hours on academic performanceFigure 4.5 is a presentation of the findings on the impact of the number of hours the
students spent studying on their performance.
Figure: 4.5 Impact of study hours on grade scored
The study sought to establish the impact of study hours in a day on academic
performance; Figure 4.5 reveal that those who spent between one and two hours
accounted for 17 percent, 18 percent and 18 percent, of the students scoring A’s, B’s and
C’s respectively. Those who spent between three and five hours accounted for 20, 58
percent of the students scoring B’s and C’s respectively. Those who spent between five
and nine hours accounted for 83 percent, 54 percent and 23 percent of the students
39

scoring A’s, B’s and C’s respectively. From the revelation, it can be deduced that the
more hours students spent studying the better their performance in academics regardless
of whether the students are under the conventional study mode of e-learning mode of
study.
4.4.3 Ease in Keeping Up with Reading Hours Required for Online CoursesFigure 4.6 depicts the findings on the respondents ease in keeping up with the reading
hours required for online hours.
Figure 4.6 Ease in keeping up with reading required for online courses
The study sought to establish whether the students in e-learning mode of study found it
easy studying online; Figure 4.6 reveal that 32 percent of the respondents indicated that
they found difficulty studying online, 16 percent were not sure, while 42 percent
indicated that they found no difficulty studying online, only10 percent of the students on
e-learning strongly agreed that studying online was easy to keep-up with. This can be
40

deduced to mean that the performance of e-learning students may be affected negatively
by the fact that not so many easily adhere to the study hours required by the program.
4.4.4 Ease in finding time to complete online coursesFigure 4.7 presents the findings of the respondents’ ability to easily find time to do their
studies
Figure: 4.7 Ease in finding time to complete online courses
The study sought to establish whether the students found time to do their studies online;
Figure 4.7 reveal that 58 percent of respondents reported that it was not easy finding time
for online studies, 4 percent were undecided while only 38 percent indicated that they
found time to study online. It can be deduced that not so many e-learning students find
study time; this may be reflected in their performance.
41

4.5: Impact of Prior Computer Skills on PerformanceThis section presents the impact of computer skills on academic performance of students
on e-learning mode of study.
4.5.1 Anxiety while using computers
Figure 4.8 is a presentation of the findings on whether students were anxious while using computers
Figure: 4.8 Anxiety while using computers
The study sought to establish whether the students were anxious while using computers,
Figure 4.8 reveal that 1 percent of the respondents indicated that they were somewhat
anxious, 10 percent of the respondents were found to be a little anxious, the majority 89
percent however indicated that they were never anxious while using computers. The
findings as indicated in the figure below reflect that majority of the students had prior
computer skills and hence did not exhibit any form of anxiety while using the computers.
42

Anxious students may not be comfortable using computers and hence are likely to
perform dismally.
4.5.2 Impact of Anxiety on Academic PerformanceFigure 4.9 shows the findings on whether anxiety while using computers had an impact
on the participants’ academic performance
Figure: 4.9 Impact of anxiety on academic performance
The study sought to establish the impact of anxiety while using computers on academic
performance. Figure 4.9 reveal that 100 percent of students who scored an average of A
in their courses indicated that they were never anxious while using computers, majority
(80 percent) that scored an average of B were never anxious, 18 percent who scored B
were a little anxious, majority (97 percent) who scored an average of C were somewhat
anxious. The result indicate that the level of anxiety in using computers among the
students on e-learning program influenced the overall performance of the students. It can
43
therefore be concluded that prior computer skills which reduces the level of anxiety is an
indicator of a student’s performance.
4.5.3 Dramatization of Computer Situation in MindFigure 4.10 is a presentation of the findings on whether the participants in this study
dramatized computer situations in their mind
Figure: 4.10 Dramatization of computer situation in mind
The study sought to establish whether students dramatized computer situation in their
mind even when not using computers. This was intended to know whether the students
had prior computer skill or not. Figure 4.10 reveal that 2 percent and 7 percent of the
respondents indicated they sometimes, and occasionally respectively dramatized
computer situations in their mind, 91 percent of the respondents never dramatized
44

computer situations in their mind, this indicate that the majority were comfortable with
computers reflecting that they had previously used computers.
4.5.4 Difficulty in Using ComputersFigure 4.11 is a presentation on the findings on whether the participants in this study had
difficulty in using computers
Figure: 4.11 Difficulty in using computers
In the bid to measure prior computer skills, the study sought to establish whether the
respondents had any difficulty in using computers; Figure 4.11 reveal that 2 percent of
the respondents indicated they had difficulty in using computers all the time, a similar
percentage indicated they sometime had difficulty in using computers. It was noted that
21 percent of the respondents indicated they had a little difficulty using computers. The
majority (75 percent) of the respondents as shown in the diagram above indicated that
they never experience any difficulty using computers.
45

4.5.5 Comparison between Difficulty in Using Computer and Average College ScoreFigure 4.12 is a presentation of the findings on the comparison between average
performance and difficulty in using computers
Figure: 4.1 Difficulty in using computer and average college score
The study sought to establish the impact of difficulty in using computers on average
college score. Figure 4.12 reveal that majority (83 percent) of students who scored an
aggregate of A in their studies never experienced difficulty in using computers, only 17
percent who scored A had difficulty in using computers. The majority (74 percent) of
those who scored B had no difficulty using computers, 22 percent who scored B
sometimes had difficulty using computers while 4 percent who scored B had difficulty
using computers. It was noted that 74 percent of those who scored C on average had no
difficulty using computers, 26 percent sometimes had difficulty using computers. It can
be deduced that the more the difficulty in using the computer the higher the chances of
46

performing poorly in academic performance. One is likely to have difficulty using
computers when they have no prior skills in computers. It can be concluded that prior
computer skill has a positive impact on academic performance for students on e-learning
program.
4.5.6 Action in Case of Computer ComplicationFigure 4.13 is a presentation of the findings on what the respondents’ do incase of
computer complication
Figure: 4.13 Action in case of computer complication
The study sought to establish the actions the students took in case of computer
breakdown, figure 4.13 above reveal that 38 percent, 37 percent, 22 percent and 3 percent
of the respondents indicated that incase of computer breakdown they would call a
technician to troubleshoot, try to troubleshoot before calling a technician, troubleshoot
47

themselves and stop using the computer respectively. This shows that about 50 percent
had skills of troubleshooting a strong indication of prior computer skills.
4.6 Inferential Analysis The section below presents coefficient of correlation, coefficient of determination,
ANOVA and regression coefficient. Coefficient of correlation shows the relationship
between the dependent variable and the independent variables, coefficient of
determination shows the contribution of independent variables to the dependent variable,
ANOVA tests the significance of the regression model while the regression coefficient
shows the effect of unit increase independent variable to the independent variable.
4.6.1 Coefficient of CorrelationTo compute the correlation (strength) between the study variables and their findings the
study used the Karl Pearson’s coefficient of correlation (r). The findings as shown in
Table 4.1 below revealed that there was a positive correlation between academic
performance and hours spent online as shown by a correlation figure of 0.557, even
though the correlation is positive, the relationship between academic performance and
hours spent online is not significant. It was also clear that there was a positive correlation
between academic performance and gender with a correlation figure of 0.512, even
though the correlation is positive, the relationship between academic performance and
gender is not significant. It was also revealed that there was a positive correlation
between academic performance and location of setting with a correlation figure of 0.52,
likewise even though the correlation is positive, the relationship between academic
performance and location setting is not significant. Finally, a positive correlation between
academic performance and subject with a correlation value of 0.538 was realized. Even
48
though the correlation is positive, the relationship between academic performance and
subject is not significant. This shows that there was a moderate correlation between
academic performance and hours spent online, gender, location setting and subject. The
lack of significance in the individual relationships could be due to interactive effects with
the other variables.
Table 4.3 Coefficient of Correlation
Aca
dem
ic
Perf
orm
ance
Hou
rs
spen
t
onlin
e
Gen
der
Loc
atio
n
sett
ing
Subj
ect
Academic Performance Pearson Correlation 1
Sig. (2-tailed)
Hours spent online Pearson Correlation 0.557 1
Sig. (2-tailed) 0.3079
Gender Pearson Correlation 0.512 .320 1
Sig. (2-tailed) 0.1855 0.0194
Location setting Pearson Correlation 0.520 0.1846 0.1107 1
Sig. (2-tailed) 0.0023 0.1857 0.4300
Subject Pearson Correlation 0.538 0.0072 0.2335 0.1027 1
Sig. (2-tailed) 0.0422 0.9591 0.0925 0.4642
4.6.2 Coefficient of Determination Coefficient of determination explains the extent to which changes in the dependent
variable can be explained by the change in the independent variables or the percentage of
49

variation in the dependent variable (academic performance) that is explained by all the
five independent variables (hours spent online, gender, location setting and subject).
From the findings, 54.5 percent academic performance is attributed to combination of the
four independent factors (hours spent online, gender, location setting and subject)
investigated in this study. A further 45.5 percent academic performance is attributed to
other factors not investigated in this study. Therefore, there is a dare need for further
research that should be conducted to investigate the other factors (45.5 percent) that
contribute to the academic performance.
Table 4.4 Model Summary Model R R Square Adjusted R
Square
Std. Error of
the Estimate
1 0.738 0.545 0.214 0.160
4.6.3 ANOVA In trying to establish significance of the model the study employed ANOVA. From table
4.3 the significance value is 0.009 which is less that 0.05 thus the model is statistically
significance in predicting how hours spent online, gender, location setting and subject
impact to academic performance. The F critical at 5 percent level of significance was
2.70. Since F calculated is greater than the F critical (value = 9.793), this shows that the
overall model was significant.
50

Table 4.5: ANOVA
Model Sum of Squares df Mean Square F Sig.
1 Regression 12.624 4 3.156 9.793 .009
Residual 30.616 95 .322
Total 43.240 99
a. Predictors: (Constant), Action in-case of computer complication, Difficulty in using computers,
Study hours in a day, Mode of study
b. Dependent Variable: Average score for college courses
4.6.4 Regression Coefficient Multiple regression analysis was conducted as to determine the relationship between
academic performance and the four variables. As per the SPSS generated table 4.4 the
equation
(Y = β0 + β1X1 + β2X2 + β3X3+ β4X4+ ε) becomes:
Y= 1.180+ 0.0498 + 0.017 X2+ 0.3209 X3+0.2527 X4
The regression equation above has established that taking all factors into account (hours
spent online, gender, location setting and subject) constant at zero, academic performance
will be 1.180. The findings presented also shows that taking all other independent
variables at zero, a unit increase in hours spent online will lead to a 0.0498 increase in
academic performance; a unit increase in gender will lead to a 0.017 increase in academic
performance; a unit increase in location setting will lead to a 0.3209 increase in academic
51

performance and a unit increase in subject will lead to a 0.2527 increase in academic
performance. This infers that location setting contribute most to academic performance
followed by subject then hours spent online while gender contributed the least to
academic performance.
Table 4.6: Regression CoefficientsUnstandardized Coefficients
Standardized Coefficients
t Sig.
B Std. Error
Beta
(Constant) 1.180 0.3303 0.5449 0.5881
Hours spent online 0.541 0.1530 0.0498 0.3731 0.0201
Gender 0.507 0.1658 0.0170 0.1210 0.0262
Location setting 0.518 0.1502 0.3209 2.4461 0.0252
Subject 0.528 0.1398 0.2527 1.9406 0.0223
52

CHAPTER FIVE
SUMMARY OF FINDINGS, CONCLUSIONS AND RECCOMENDATIONS
5.1 IntroductionThis chapter summarizes the whole research process. A brief summary of the whole study
is given. It also provides a summary of the main findings of the study, conclusions of the
study, recommendations and suggestions for further research.
5.2 Summary of Findings
The majority of the respondents in this study were male (52 percent), indicating that more
male than female are admitted in higher learning institutions. The findings of the study
show that majority of students (47 percent) have never been married and are in the
conventional learning system, on the other hand 46 percent of students on e-learning
program are married. The findings also show that 19 percent of the respondents had
between 1 – 2 children, 22 percent had between 3 – 5 children, while the majority 58
percent had between 5 – 9 children.
On comparison, students on conventional learning mode performed highly as compared
to those on e-learning, of the students who scored A’s, 83 percent were on the
conventional learning system, those on e-learning program was only 17 percent of the
total A’s scored. Conversely, majority of the students who scored C’s were those on e-
learning (74 percent) mode of study.
53

It was revealed that gender was a factor that influenced the number of hours the
respondents studied. Majority (52 percent) of those who studied for 5- 9 hours were male
while the majority (50 percent) of those who studied for 3 – 5 hours were female. It was
revealed that male who studied for 3 – 5 hours were only 14 percent of the population.
On comparing the study hours students under e-learning and those on–school program
spent studying per day, it was found that majority of 44 percent of the student on e-
learning mode studied for less than 2 hours a day while the majority (74 percent) of those
under the conventional learning program spent between 5 – 9 hours studying a day. It was
further revealed that study hours per day significantly influence the academic
performance of students, students who spent between 5 – 9 hours a day accounted for 83
percent of the total A’s scored.
To measure the impact of prior computer skills on academic performance, the study
sought to know whether the students were anxious while using computers, 1 percent of
the respondents indicated that they were somewhat anxious, 10 percent of the
respondents were found to be a little anxious, the majority 89 percent however indicated
that they were never anxious while using computers. As for the extent of anxiety, only 2
percent of the respondents indicated that they are somewhat anxious, however 10
respondents are a little anxious whereby out of this 10, 9 scored an average score of B
representing 9 percent of the total respondent who are a little anxious the remaining
respondents scored an average score of C, hence all the 12 respondents who scored an
average score of A are not anxious at all, and 40 and 37 respondents who are not anxious
54

at all scored an average score of B and C respectively. The findings can be deduced to
mean that the more anxious a student gets while using computers the higher the chances
of not performing well for the students on e-learning mode.
The study sought to know whether students dramatized computer situation in their mind
even when not using computers. This was intended to know whether the students had
prior computer skill or not. Two percent and 7 percent of the respondents indicated they
sometimes, and occasionally respectively dramatized computer situations in their mind,
91 percent of the respondents never dramatized computer situations in their mind, this
indicate that the majority were comfortable with computers reflecting that they had
previously used computers.
Further the study sought to know whether the respondents had any difficulty in using
computers, two percent of the respondents indicated they had difficulty in using
computers all the time, a similar percentage indicated they sometime had difficulty in
using computers. Twenty one percent of the respondents indicated that they had a little
difficulty using computers. The majority (75 percent) of the respondents indicated that
they never experience any difficulty using computers.
Majority of respondents never find it difficult using a computer giving a total count of 75
of the respondents which gives a percentage of 75 percent of the respondent, however
breaking this down to the average score, 37 percent respondents scored B’s 28 percent
scored C’s and 10 percent scored A’s. out of the total of 100 respondents, 21 responded
55

representing 21 percent of the total number of respondents found it a little difficult using
computers breaking this down to scores we find that 22 percent scored B’s 21 percent
scored C’s and 2 percent scored A’s.
5.3 ConclusionThis short study highlights the impact of electronic learning on academic performance of
students. Many students are not well prepared to take the challenge of studying through
e-learning, because of the unexpected complexities of the application of IT as a learning
tool that requires commitment as there is no strict rules on the learning times.
The perception is that the world has become smaller as a result of the immense progress
made in the field of information and communication technologies. IT is accessible to all
across the continents and the oceans through the satellites, cables, and other such devices
that have made man more independent and have increased his mobility by making
distances shorter and communication faster.
As the analysis of data gathered on a small sample of a hundred people, has shown that,
there are still many issues that need to be closely considered before we can safely state
that e-learning and other related learning methods have contributed to the enhancement of
the performance of students at the higher levels of our education system, irrespective of
individual differences due to heredity and/or environment. It can be confidently said that
there is still a long way to go before we can make the whole world harvest the benefits
from the progress of science and technology.
56

5.4 Recommendations for Further ReadingThis research elicited and examined a number of extreme points of views about the
impact of E-learning on academic achievement. Although it was discovered that certain
issues have not yet been properly addressed to E-Learning implementation processes, as
the prime focus of the research was on prior computer skills, number of hours individual
spend studying and socio-demographic characteristics. The following are the
recommendations of this study:
i. Critical factors such as institutional issue, management issue,
pedagogical factors, technological issue, interface design issue,
evaluation issue, and resource support issue and the factors within
each issue have not yet been investigated with detail coverage.
ii. The need to carry out detail research involving case studies based
on survey questionnaires involving various learning institutions
which will ultimately give a better understanding of impact of e-
learning aspects within implementation process.
57

REFERENCESAbdul-Rahman, Z. (1994). Factors related to completion of distance education courses in
the off-campus degree programme at the university saints of Malaysia. UMI (UMI No. 9425449).
Al-Ammari, j. And Hamad, S. (2009), “Factors Influencing The Adoption Of E-Learning At UOB”, University Of Bahrain.
Ani, Okon E. and Ahiauzu, B. (2008). Towards effective development of electronic information resources in Nigerian University Libraries. Library Management 29(6/7): 504 – 514.
Aragon, S. R., Johnson, S. D., & Shaik, N. (2002). The influence of learning style preferences on student success in online versus face-to-face environments. The American Journal of Distance Education, 16(4), 227-244.
Arbaugh, J. B. (2000). How Classroom Environment and Student Engagement Affect Learning in Internet-based MBA Courses. Business Communication Quarterly, 63(4), 9-26.
Atkinson, M. &Kydd, C. (1997). Individual characteristics associated with World Wide Web use: An empirical study of playfulness and motivation. The Data Base for Advances in Information Systems, 28(2), 53-62.
Barker, K., &Wendel, T. (2001). E-Learning: Studying Canada's Virtual Secondary Schools. Kelowna, BC: Society for the Advancement of Excellence in Education. Online athttp://www.excellenceineducation.ca/pdfs/006.pdf.
Blum, K. D. (1999). Gender differences in asynchronous learning in higher education: Learning styles, participation barriers and communication patterns. Journal of Asynchronous Learning Networks, 3(1).
Bond, A. (2002). Learning Music Online: An Accessible Program for Isolated Students. Kensington Park, SA: Australian National Training Authority. Online athttp://www.ncver.edu.au/research/proj/nr1013.pdf.
Boyd, D. (2004). The characteristics of successful on-line students. New Horizons in Adult Education, 18(2), 31-39.
Breuleux, A., Laferrière, T., &Lamon, M. (2002, May). Capacity building within and accross countries into the effective uses of ICTs. Paper presented at the 2002 Pan-Canadian Education Research Agenda Symposium, Montreal, QC. Retrieved from http://www.cesc.ca/pcera2002E.html
Bryson, M., Petrina, S., & Braundy, M. (2003). Conditions for success? Gender in technology-intensive courses in British Columbia secondary schools. Canadian Journal of Science, Mathematics and Technology Education,3(2), 185–193.
Calderoni, J. (1998). Telesecundaria: Using TV to Bring Education to Rural Mexico. Education and Technology Technical Notes Series: World Bank Human Development Network. http://wbln0018.worldbank.org/HDNet/HDdocs.nsf/C11FBFF6C1B77F9985256686006DC949/1635F1703FE053B385256754006D8C3F/$FILE/telesecundaria.pdf
Calvert, B. (1986). ‘Facilitating transfer of distance courses’. A paper presented at the 8th World Conference of International Council of Distance Education, Melbourne, Australia.
Carini, R.M., Kuh, J.D. & Klein, S.P. (2006). Student Engagement and Student Learning: Testing the Linkages. Research in Higher Education, 47, 1-32.
58

Cavanaugh, C. S. (2001). The effectiveness of interactive distance education technologies in K-12 learning: A meta-analysis. International Journal of Educational Telecommunications,7(1), 73–88.
Chacon-Duque, F. J. (1985). Building academic quality in distance higher education. Monograph in higher education evaluation and policy, Pennsylvanian PSU.
Chambers, E. A. (2003). Efficacy of educational technology in elementary and secondary classrooms: A meta-analysis of the research literature from 1992–2002. Ph.D. dissertation, Southern Illinois University at Carbondale. Retrieved November 8 2005, from ProQuest Digital Dissertations database. (Publication No. AAT 3065343).
Chimombo, J.P.G. (2005): Issues in basic education in developing countries: an exploration of policy options for improved delivery. CICE Hiroshima University, Journal of International Cooperation in Education, Vol. 8 (1), pp. 129-152.
Christmann, E. P., &Badgett, J. L. (2003). A meta-analitic comparison of the effects of computer-assisted instruction on elementary students’ academic achievment. Information Technology in Childhood Education Annual,15, 91–104.
Coldeway, D.O. (1982). Learner characteristics. I. Mugridge& D. Kaufman (Eds). Distance education in Canada. Pp. 81 – 93. London: Croom Helm.
Cookson, P. S. (1989). “Research on learners and learning in distance education”. A review of American journal of distance education, 3(2), Pp. 22-34.
Cuneo , C. J., &Harnish, D. (2002). The lost generation in e-learning: Deep and surface approaches to online learning [Report]. Hamilton, ON: McMaster University. (ERIC Document Reproduction Service No. ED466646).
Cuneo , C. J., Campbell, B., & Harnish, D. (2002, May). The integration and effectiveness of ICTs in Canadian postsecondary education. Paper presented at the 2002 Pan-Canadian Education Research Agenda Symposium, Montreal, QC.
Davies, D., & Graff, M. (2005). Performance in e-learning: online participation and student grades. British Journal of Education Technology, 36, 657-663.
Dees, S. (1994). An Investigation Of Distance Education Versus Traditional Course Delivery Using Comparisons Of Student Achievement Scores In Advanced Placement Chemistry And Perceptions Of Teachers And Students About Their Delivery System (Satellite Course). Northern Illinois University.
Dewar, T., & Whittington, D. (2000). Online learners and their learning strategies. Journal of Educational Computing Research, 23(4), 385–403.
Eccles, J. S. (1999). The development of children ages 6 to 14. The Future of Children:When School Is Out, (9), 30-44.
Emerson, T.L.N., & Taylor, B.A. (2004). Comparing Student Achievement across Experimental and Lecture-Orientated Sections of a Principles of Microeconomics Course. Southern Economics Journal, 70, 672-693.
Ergul, H. (2004). “Relationship between students characteristics and academic achievement in distance education and application to students of Anadolu University in Turkish Online Journal of Distance Education. 5(2)
Etmer, P., & Newby, T., (1993). Behaviorism, cognitivism, and constructivism: Comparing critical features from an instructional perspective. Performance Improvement Quarterly, 6(4), pp. 50-70. Evolution, Information Science Publishing.
59

Fisher, C. (2007), Researching and writing a dissertation for business students. 2nd ed. England: Pearson Education Limited Online Resource.
Fry, K., (2000), “Forum focus and Overview, The business of E-learning: Bringing your organization in the knowledge Economy”, Telcam Group, University of Technology, Sydney.
Garrison, D.R. (1987). “Researching dropout in distance education”. Distance education. 8(1). Pp. 95-101.
Garrison, R., & Anderson, T. (2003). E-learning in the 21st century: A framework for research and practice. London: Routledge Falmer.
Gibson, C. C. (1998). The distance learner’s academic self-concept. In C. C. Gibson (Ed.) Distance learners in higher education: institutional responses for quality outcomes (p. 65-76). Madison, WI.: Atwood Publishing.
Gulatee, Y., and Combes, B. (2007), “Technological barriers to successful E-learning in computer science”, School of computer and Information Science Edit Cowan University
Hawkins, R.: Ten Lessons for ICT and Education in the Developing World. In: Kirkman, G. et al. (Eds): The Global Information Technology Report 2001-2002: Readiness for the Networked World, Oxford Universitz Press, Oxford 2002, 38-43.
Hodgkinson-Williams, C.; Siebörger, I.; Terzoli, A. (2007): Enabling and constraining ICT practice in secondary schools: case studies in South Africa. International Journal of Knowledge and Learning, Vol.3 (2/3), pp. 171-190.
Jaju, A., Kwak, H., &Zinkham, G. M. (2002). Learning styles of undergraduate business students: A cross-cultural comparison between the US, India and Korea. Marketing Education Review 12(3), 49-60.
Johnson, G.M. (2005). Student Alienation, Academic Achievement, and WebCT use. Educational Technology and Society, 8, 179-189.
Karsenti, T. (2001). From blackboard to mouse pad: Training teachers for the new millennium. Education Canada,41(2), 32–35.
Kazmer, M. M. and Haythornthwaite, C. (2005), “Multiple perspectives on online learning”, ACM Press, 25(1), pp.7-11.
Kearsley, G. (2000). Online education: learning and teaching in cyberspace. Belmont, CA.: Wadsworth.
Keegan, D. (1996). Foundations of Distance Education. London: Routledge.Khan, B (2005), Managing E-learning Strategies: Design, Delivery, Implementation andKlob, D.A. (2000). Facilitator’s Guide to Learning. Boston: Hay/McBer Training
Resources Group.Kohn, T.; Maier, R.; Thalmann, S. (2008): Knowledge transfer with e-learning resources
to developing countries – barriers and adaptive solutions. In: Breitner, M.H. et al. (eds.): E-Learning. Springer, Heidelberg.
Koohang, A. & Harman, K. (2005). Open source: A metaphor for e-learning. Informing Science: The International Journal of an Emerging Transdiscipline, 8, 75-86. Available athttp://inform.nu/Articles/Vol8/v8p075-086Kooh.pdfMacDonald, C. J., Stodel, E., Thompson, T. L., Muirhead
Kumar, A. (2001). An investigation into the India open University distance learners’ academic self-concept, study habits and attitude toward distance education: A
60

case study at the IndraGhandi national open University in India. www.col.org/forum.PCFpapers/kumara.pdf.
L. R. Gay, Educational Research: Competencies for Analysis and Application, 3rd ed., (Columbus, Ohio: Merrill Publishing Company, 1987).
Learning Objects, 1, 197-216. Available at http://ijklo.org/Volume1/v1p197-216Recker.pdf
Lee, J. K., 2004. The effect of e-Learning environmental quality and self-efficacy on effectiveness of an e-Learning. Business Administration Doctoral Dissertation, Daegu University.
Lee, J. K., and Lee W. K., 2007. The relationship of e-Learner’s self-regulatory efficacy and perception of e-Learning environmental quality. Computers inHuman Behavior, Available online at www.sciencedirect.com.
Lee, Y- C. (2006), “An empirical investigation into factors influencing the adoption of an e-learning system”, Online Information Review, Vol. 30, No.5, pp. 517-541.
Levin, D., &Arafeh, S. (2002). The digital disconnect: The widening gap between Internet-savvy students and their schools [Report]. Washington, DC: Pew Internet & American Life Project. Retrieved September 6, 2005, from http://www.pewinternet.org
Li, Q. (2002). Gender and computer-mediated communication: An exploration of elementary students’ mathematics and science learning. Journal of Computers in Mathematics and Science Teaching,21(4), 341–359.
Lockwood, Fred and Gooley, Anne. (2001) Innovation in open and distance learning: Successful development of online and web-based learning. London: Kogan Page Ltd.
Lockwood, Fred and Gooley, Anne. (2001) Innovation in open and distance learning: Successful development of online and web-based learning. London: Kogan Page Ltd.
Looker, D., &Thiessen, V. (2002, May). The digital divide in Canadian schools: Factors affecting student access to and use of information technology. Paper presented at the 2002 Pan-Canadian Education Research Agenda Symposium, Montreal, QC.
Maier, R. (2007): Knowledge management systems. 3rd Edition, Springer, Berlin.No.8/9, pp. 506-516.Perth, Western Australia.
McLean, S., & Morrison, D. (2000). Sociodemographic characteristics of learners and participation in computer conferencing. Journal of Distance Education 15(2). Available online [HREF6].
Miles, M. B. &Huberman, A. M. (1994) Qualitative data analysis (2nd Ed) Thousand Oaks,CA: Sage.
Mugenda, O.M and Mugenda, A.G (2003) Research Methods-Quantitative and Qulitative. Acts Press.
Nachmias Chava Frankfort and Nachmias David (1996). Research Methods in Social Sciences. 5 th Edition . Arnold Publishers: London.
National Association of State Boards of Education. (2001). Any time, any place, any path, any pace: Taking the lead on e-learning policy. Alexandria, VA: author.
Neuhauser, C. (2002). Learning style and effectiveness of online and face-to-face instruction. The American Journal of Distance Education 16(2), 99-113.
61

Palloff, R. M., and Pratt, K. (1999). Building Learning Communities in Cyberspace: Effective strategies for the online classroom. San Francisco: Jossey-Bass.
Papp, R. (2001). Student learning styles and distance learning. Proceedings of the 16th Annual conference of the International Academy for Information Management – International Conference on Informatics Education & Research, New Orleans, Louisiana, USA, 14-20.
Powell, R, Conway, C., & Lynda, R. (1990). “Effects of students’ predisposing characteristics on students’ success.” Journal of Distance Education. 4.2. 26-39.
Recker, M., Dorward, J., Dawson, D., Mao, X., Liu, Y., Palmer, B., Halioris, S., & Park, J. (2005). Teaching, designing, and sharing: A context for learning objects. Interdisciplinary Journal of Knowledge and
Roblyer, M. D. (1999). Is Choice Important in Distance Learning? A study of student motives for taking Internet-based courses at the high school and community college levels. Journal of Research on Computing Education, 32(1), 157 – 171.
Rodgers, T., &Ghosh, D. (2001). Measuring the determinants of quality in UK higher education: A multinomial logit approach. Quality Assurance in Education, 9, 121-126.
Roffe, I., (2002), “E-learning: engagement, enhancement and execution”, Quality Assurance in Education, Vol.10, No.1, pp.40-50.
Rosenberg, H., Grad, H. A., & Matear, D. W. (2003). The effectiveness of computer-aid, self-instructional programs in dental education: A systematic review of the literature. Journal of Dental Education,67(4), 524–532.
Rotter, J. B. (1989). Internal versus external control of reinforcement: A case history of a variable. American Psychologist, 45,489-493.
Sambrook, S. (2003), “E-learning in Small Organizations.”Education + Training, Vol.45,
Schank, R.C., (2002), “Designing World Class E-Learning”, 1st ed., McGraw Hill, USA.Schollie, B. (2001). Student Achievement and Performance Levels in Online Education
Research Study. Edmonton, Alberta: Alberta Online Consortium.http://www.albertaonline.ab.ca/pdfs/AOCresearch_full_report
Shaw, G., & Marlow, N. (1999). The role of student learning styles, gender, attitudes and perceptions on information and communication technology assisted learning. Computers &Education, 33, 223-234.
Sheahan, J. (1987): Patterns of development in Latin America. Poverty, repression, and economic strategy. Princeton University Press, New Jersey.
Smith, D., & Hardaker, G. (2000). E-learning innovation through the implementation of an internet supported learning environment. Educational Technology and Society, 3, 1-16.
Stephenson, John, (2001). Teaching and learning online: Pedagogies for new technologies. London: Kogan Page Ltd.
Thatcher, J. B., and Pamela, L. P., 2002. An empirical examination of individual traits as antecedents to computer anxiety and computer self-efficacy. MIS Quarterly, Vol. 26.
Thomas, L., Ratcliffe, M., Woodbury, J., &Jarman, E. (2002). Learning styles and performance in the introductory programming sequence. SIGCSE Bulletin, 34(1), 33-37.
62
UN Human Rights (1948): Fiftieth anniversary of the universal declaration of human rights 1948-1998. Adopted and proclaimed by General Assembly resolution 217 A (III) of 10 December 1948, URL: http://www.un.org/Overview/rights.html.
Wang, A. Y. & Newlin, M. H. (2002). “Predictors of web student performance: the role of self-efficacy and reasons for taking online class. Computers in Human Behaviours, 8(2).151-163.
Wang, Y., Peng, H., Huang, R., Hou, Y., & Wang, J. (2008). Characteristics of distance learners: Research on relationships of learning motivation, learning strategy, self-efficacy, attribution and learning results. The Journal of Open and Distance Learning, 23(1), 17-28.
Wedemeyer, C.A. (1981). Learning at the back door: Reflections on non traditional learning in the lifespan. Madison: University of Wisconsin Press.
Wild, R.H., Griggs, K.A. and Downing, T, (2002), “A framework for e-learning as a tool for knowledge management”, Industrial Management & Data Systems, Vol.102, No.7, pp.371-380.
Woodley, A. & Parlett, M. (1983). “Students dropouts” in teaching at a distance, No.23, summer.
Yasin, K. &Luberisse, Y. (1997). Meeting the Needs of a New Democracy: Multichannel Learning and Interactive Radio Instruction in Haiti: A Case Study. Washington, DC: USAID. Online at http://ies.edc.org/pubs/book11.htm.
Zimmerman, B. J., and Risemberg, R. (1997). Self-regulatory dimensions of academic learning and motivation. In G. D. Phye (Ed.) Handbook of Academic Learning: Construction of knowledge (p. 105-125). San Diego, CA.: Academic Press.
Zywno, M. S., & Waalen, J.K. (2002). The effect of individual learning styles on student outcomes in technology-enabled education. Global Journal of Engineering Education, 6(1), 35- 44.
63

APPENDIX 1: QUESTIONNAIRE
Socio-Demographic Characteristics
1. What is your gender?
Female
Male
2. Which category below includes your age?
17 or younger
18-20
21-29
30-39
40-49
50-59
60 or older
3. Which of the following categories best describes your employment status?
Employed, working 1-39 hours per week
Employed, working 40 or more hours per week
Not employed, looking for work
Not employed, NOT looking for work
Retired
Disabled, not able to work
64

4. Marital status
Married
Widowed
Divorced
Separated
Never married
5. Do you have a family?
Yes
No
6. How many children do you have?
A. 1 - 2
B. 3 - 5
C. 5 - 9
D. 10 and above
7. Do you have difficulty understanding concepts?
A. Yes
B. No
8. Do you have any physical deformations that make it difficult to use computers?
Yes
No
65

9. What is your mode of study?
Online
On-Campus
10. What is your average score for your college courses?
A
B
C
D
E
11. It is easy for me to keep up with the reading required for my on-line courses
Strongly disagree
Disagree
Neither agree nor disagree
Agree
Strongly agree
Time Management
12. It is easy for me to find time to complete my on-line courses
Strongly disagree
Disagree
Neither agree nor disagree
Agree
66

Strongly agree
13. How many hours in a day do you do your studies on the computer?
A. 1 – 2 Hours
B. 3 - 5 Hours
C. 5 – 9 Hours
14. Do you study with your group members?
A. Yes
B. No
15. How many times in a week?
1 – 2 Times
3 - 5 Times
5 – 9 Times
16. Do you enjoy studying online?
Yes
No
Prior computer skills
17. Do you feel anxious when you think of computers?
67

Yes
No
18. If Yes, above, how anxious do you feel when you think about computers?
Extremely anxious
Very anxious
Somewhat anxious
A little
Not at All
19. Here, give your first, instinctive answer to the question:
Out of 10 how serious is your computer phobia?
9 or 10
7 or 8
5 or 6
3 or 4
1 or 2
20. Do you dramatize situations involving computers in your mind... Do you see pictures
or movies, or hear self-talk or other dialog in your mind?
All the time
Sometimes
A little
Never
68

21. Do you find difficulty using computers?
All the time
Sometimes
A little
Never
22. Does the use of computers scare you?
Yes,
Sometimes
A little
Never
23. When the computer develops complications what do you do?
I call a technician to troubleshoot it
I try troubleshooting before calling a technician
I troubleshoot it myself
I stop using it
24. It is easy for me to complete on-line courses with my level of computer skills
Strongly disagree
69

Disagree
Neither agree nor disagree
Agree
Strongly agree
70

APPENDIX 2: TIME FRAME
The time for data collection is based on the assumption that 100 respondents would be
conducted including the pre- testing group and that each would need half an hour and that
traveling and searching for them will take 1.5 hours. For 100 respondents this works to
200 hours which is equivalent to 25 days assuming an 8 hour working day or 4
respondents per day, thus the following table is a summary of the time frame.
Activity July Aug Sept Oct Nov
Proposal writing and defense
Data collection
Data sorting, analysis and compilation
Report writing and defense
Corrections
Preparation for graduation
71