Embed Size (px)
Citation preview

Electronic copy available at: http://ssrn.com/abstract=955041
The Impact of Corporate Social Responsibility on the Cost of Bank Loans
Allen Goss∗ and Gordon S. Roberts
This version: July 30, 2009
∗ Allen Goss is Assistant Professor of Finance, Ryerson University, email: [email protected] , 416 979-5000,
Ext. 2424. Gordon Roberts is CIBC Professor of Financial Services at the Schulich School of Business,
York University, email: [email protected] , 416 736-2100, Ext. 77953. The authors received
helpful comments from Mark Kamstra, Lawrence Kryzanowski, Moshe Milevsky, John Smithin and from
audiences at Ryerson University, Stirling University, the University of Arizona, University of Manitoba, the
Midwest Finance Association 2007 Meetings, the Eastern Finance Association 2007 Meetings, the Financial
Management Association 2007 Meetings, and the Financial Management Association 2009 European
Conference. Financial support for this research came from the Social Sciences and Humanities Research
Council of Canada.

Electronic copy available at: http://ssrn.com/abstract=955041
1
The Impact of Corporate Social Responsibility on the Cost of Bank Loans
This study examines the link between corporate social responsibility and bank debt. Our focus on banks exploits their specialized role as quasi-insider delegated monitors. We find that firms with the worst social responsibility scores pay up to 20 basis points more than the most responsible firms. However, we find that for the majority of firms, the impact of CSR is not economically important. The modest premiums associated with CSR suggest that banks do not regard corporate social responsibility as significantly value enhancing or risk reducing.
JEL Code: G21 Keywords: loan pricing, corporate social responsibility.

2
1. Introduction
How do financial markets view socially responsible companies? Among financial
economists, the accepted view of the firm has managers working to maximize the utility of
the shareholders. To the extent that the interests of other stakeholders are considered, the
goal must be shareholder wealth maximization. Classical finance theorists remain steadfast
in their belief that if corporate social responsibility (hereafter CSR) initiatives do not
maximize firm value, they represent a costly diversion of scarce firm resources. The
traditional shareholder view recognizes that the unfettered pursuit of profit may result in
negative externalities for other constituents, but holds that the burden of dealing with these
social issues is best left to governments, who have both the means and the jurisdiction to
deal with them.
However, the sovereignty of the shareholder view has come under attack from
management and strategy researchers who argue that the firm has multiple stakeholders,
including employees, suppliers, and the larger community in which it operates and that the
proper goal of management must be to meet the objectives of all stakeholder groups
simultaneously. According to advocates of the stakeholder view, corporate social
responsibility goes beyond simply staying within the rules of the game, and has been
defined as “actions that appear to further some social good, beyond the interest of the firm
and that which is required by law” (McWilliams and Segal (2001)). A recent survey by the
Center for Corporate Citizenship at Boston College finds the majority of U.S. business
executives sharing this view. They describe the role of management as balancing the goals
of investors, employees, consumers, communities and the environment. Recent work by
3
Faleye et. al. (2006) documents the impact of an additional stakeholder on corporate
behaviour in the United States. They find labor controlled firms deviate from strict
shareholder wealth maximization, investing less in long term assets and taking less risk.
Support for the stakeholder view is even stronger outside of the United States, with
employees being the stakeholder group most often given explicit consideration.
In an attempt to reconcile CSR with the shareholder view of the firm, stakeholder
theorists suggest that pursuing multiple objectives need not be detrimental to shareholder
interests. In fact, they argue that satisfying multiple constituencies may actually increase
financial performance (e.g., Clarkson (1995); Waddock and Graves (1997)). This argument
posits that companies paying attention to issues of sustainability and social responsibility
are more likely to perform well in all dimensions, including financial performance. If the
company strives to satisfy all stakeholders, the stakeholders will reciprocate by supporting
the firm. Employees will be more loyal. Outside stakeholders will be more supportive.
Ultimately (although perhaps not immediately) this is manifest in superior performance
(Bansal (2005)). A related argument is that socially responsible companies will be less
prone to extreme negative events. By including environmental, social and governance
considerations into business plans, firms reduce the risk of financial fallout that may
accompany lapses (Buysse and Verbeke (2003)).
The debate between the shareholder and stakeholder views revolves around whether
investments in CSR are value enhancing, or whether they are examples of agency conflicts
between managers and shareholders (Jensen and Meckling (1976)). This tension is
illustrated by a Financial Times article in January 2004 that criticized the chairman of

4
Royal Dutch Shell PLC, claiming that he “spent more time trying to convince
environmentalists of Shell's commitment to sustainable development than reassuring
investors that he was aware of the growing gap between Shell's performance and that of its
peers.”1 Barnea and Rubin (2005) suggest that CSR investments are motivated by the
desire of managers to burnish their reputations as responsible stewards of industry at the
expense of shareholders. This represents an agency cost of equity similar to the purchase of
unnecessary corporate jets (Yermack (2006)) or other excessive perquisite consumption.
This paper approaches the question from a fresh perspective. While the bulk of the
extant literature focuses on the link between CSR and the cost of equity, the studies that do
examine the link between CSR and credit risk use bond yields to measure the cost of debt.
In contrast, by studying private debt extended by banks, our study offers two innovations.
First, we examine the role of CSR in a channel of the debt market where there has been no
prior research. Second , our focus exploits the unique role of banks as “quasi-insiders” of
the firm, to explore whether banks discriminate between firms with low levels of CSR and
those with higher levels. The banking literature has long established that banks are
fundamentally different from other stakeholders. In their roles as delegated monitors
(Diamond (1984); Fama (1985)), banks are given access to information about the firm that
may not be available to outsiders. They use this information to make initial decisions about
the ability of the firm to honor its loan obligations and, after the loan agreement is struck,
1 “Unsure of Shell: shareholders call for change after 4bn barrels of oil and gas are cut from proved reserves,”
Financial Times of London. January 23, page 21.

5
to monitor the firm to ensure repayment2. Among the options available to banks to mitigate
risk are demands for security, shortened maturity, adding covenants or increasing the
spread charged on the loan to reflect the risk3. Because bank lenders are able to engage in
more detailed monitoring as well as to tailor loan terms, they may be more finely tuned to
any impact of CSR than are public lenders.
Of interest here is whether loan contract terms, and in particular, loan spreads are
influenced by the social performance of the firm. Consistent with the loan pricing
literature, our dependent variable is the loan spread over LIBOR on private bank debt. Our
proxy for CSR is the Kinder, Lydenberg and Domini & Co. (hereafter KLD) rankings for
U.S. firms. Notwithstanding the difficulties inherent in measuring corporate social
performance, KLD rankings are the most widely recognized and accepted measures of
firm-level corporate social responsibility. In examining loan spreads for evidence of a
“social responsibility” premium, we assume that banks have no social agenda to promote.
We take banks as being neutral, favoring neither the shareholder, nor the multiple
stakeholder view of the corporation. Instead, we assume that banks are interested solely in
the ability of the borrower to repay its loan obligations. If investments in CSR lead to
2 There is some support for the monitoring role of banks in the context of environmental issues. Aintablian et.
al. (2004) find higher positive abnormal returns when new bank loans are announced for firms with higher
potential for spills compared to those with more benign environmental profiles. While results are not
presented in that paper, one suspects that banks compensated for the risk inherent in lending to companies
with questionable environmental practices by charging higher yields.
3 Dennis, Nandy and Sharpe (2000) provide a thorough review of the determinants of loan contract terms.

6
lower risk and improved financial performance (as suggested by stakeholder theory), then
banks will provide more attractive loan terms to socially responsible corporations.
Alternatively, if socially responsible firms are at a disadvantage because they take on costs
that would otherwise be borne by outsiders and governments, there should be a positive
relationship between social responsibility and spreads.
Recognizing the potential for endogeneity to confound results, we use multiple
econometric methods, including both multivariate regressions and matched firms. We find
a statistically significant premium averaging between 5 and 11 basis points for firms with
below average environmental, social and governance records. The differential is
conditional on the current CSR score of the firm, with the firms having the lowest scores
being subject to the highest premiums. Matched firm analysis suggests that the maximum
benefit derived from improved CSR is 23 basis points. While our results are statistically
significant and robust to alternative specifications of risk, we conclude that CSR is a
second order determinant of yield spreads, and the modest premium offers little incentive
for firms to improve their CSR performance.
The balance of the paper is as follows. Section 2 provides a brief literature review.
Section 3 outlines the data and provides a discussion of the regression and the matching
firm results. Section 4 concludes.
2. Review of Existing Evidence
The link between financial performance and social performance has been examined
in both the management and the finance literatures. The bulk of the finance literature
views the question through the lens of socially responsible investing (SRI). Often used

7
interchangeably, SRI and CSR are related but subtly different concepts. CSR researchers
look for links between social performance and financial performance at the firm level. SRI
research focuses on the returns to investing in portfolios of companies that are identified as
socially responsible. With $2.71 trillion in assets under management, representing 11% of
the total U.S assets under management in 2007 according to the Social Investment Forum,
the SRI industry is sizeable and growing quickly.
The consensus view in the SRI literature is that there is no observed link between
CSR and equity returns. The finding of mixed results is supportive of the shareholder view.
There is no observed premium for social responsibility since any corporate actions
(regardless of the motivation) are immediately reflected in stock prices. Therefore, any
observed relationships between corporate social responsibility and financial performance
will disappear as soon as they are viewed on a risk-adjusted basis. It follows that any
attempt to impose “positive” screens (where only suitably identified “socially responsible”
companies are chosen) is a futile exercise. Further, opponents of SRI argue that portfolios
subjected to “negative” social responsibility screens will actually underperform, since the
investible universe is being artificially constrained and all risks are impounded in returns
before the screening takes place.
Earlier research by Malkiel (1991) is supportive of this view. He looked at return
performance of portfolios that boycotted companies doing business with South Africa and
found that the stocks that were removed outperformed the other holdings by an average of
3% per year over an 18-year period. It follows that those portfolios that did not invest in
South African businesses, underperformed those that did. The argument is a simple
application of the Markowitz (1952) model of portfolio choice. Restricting the investible

8
set must lead to lower risk adjusted returns. However, Milevsky et. al. (2006) present an
optimization algorithm and demonstrate that when passive index portfolios are
appropriately rebalanced, the penalty for imposing negative screens may be economically
insignificant.
Alternatively, stakeholder theorists point to research that finds ethically screened
portfolios actually outperform screened portfolios. Contrary to Malkiel’s evidence of
underperformance, Statman (2000) finds that the Domini Social Index4 outperforms the
S&P 500 over the 1990-1998 period. However, superior performance of socially
responsible portfolios is relatively rare. More often, the research finds neither return
outperformance nor underperformance for investors in screened portfolios. Examining
Canadian ethical mutual funds, Asmundson and Foerster (2001) find that relative to the
broader market, there is no return underperformance, and some weak evidence of lower
risk for screened funds. Statman (2006), Goldreyer and Diltz (1999), Bauer, et. al. (2005)
and Guerard (1997) provide similar evidence.
At the firm level, the argument against CSR is that engaging in such activity is
4 Created by the social research firm of KLD Research & Analytics, the Domini 400 Social Index is a market
capitalization-weighted common stock index. It monitors the performance of 400 U.S. corporations that pass
multiple, broad-based social screens. The Index consists of approximately 250 companies included in the
Standard & Poor's 500 Index, approximately 100 additional large companies not included in the S&P 500 but
providing industry representation, and approximately 50 additional companies with particularly strong social
characteristics.

9
costly, and ceteris paribus, those firms that choose to behave ethically will bear higher
costs, which will in turn result in lower performance levels. Generally, the extant research
on CSR and firm performance has been concentrated in the management and policy areas.
The first strand of this literature looks at short-term effects of unethical behavior. Standard
event study methodology is used to uncover abnormal returns in the period surrounding the
unethical behavior. An examination of the South African boycott during apartheid, by
Teoh et. al. (1999) is representative of this type of research. However, McWillams et. al.
(1999) suggest that that the potential for confounding events to contaminate results
compromises this line of attack.
The second strand looks at long term performance based on accounting or market-
based ratios. Both Margolis and Walsh (2001) and Orlitzky, et. al. (2003) provide thorough
reviews. Not unlike the SRI literature, results are mixed, with researchers documenting
positive (Orlitzky, et. al. (2003)), neutral (McWilliams and Siegel (1999)), and negative
relationships (Wright and Ferris (1997)) between CSR and financial performance. Of
particular relevance to this paper is the paucity of research on the CSR/performance link
from the perspective of debt. Of the 52 studies reviewed by Orlitzky et. al., none of them
examines the link between CSR and corporate debt. Of the 103 papers reviewed by
Margolis and Walsh (2001), none of them examines debt.
The lack of research in the debt area is somewhat surprising, given the size of the
corporate debt market relative to the equity market. According to Thomson Financial, the
worldwide syndicated loan market totaled $3.8 trillion U.S. dollars in 2004, while the size
of the equity markets was $845 billion. The few papers that do explore the link between
CSR and debt use corporate bonds as the vehicle for measuring the cost of debt. D’Antonio

10
et. al. (1997) explore the performance of socially screened bond mutual funds and find no
yield differences on a risk adjusted basis. Examining the link between environmental
performance and the cost of capital, Sharfman and Fernando (2008) find that firms with
good environmental performance face higher bond yields but also have higher leverage.
They interpret this as responsible firms having easier access to debt financing. Chen et. al.
(2007) report that unionized firms face lower costs of debt than non-unionized firms,
because unions mitigate the tendency for shareholders to expropriate bondholders.
A related and relatively recent line of research follows from the observation that
idiosyncratic risk may be priced in financial markets (Malkiel and Xu (1997), Fu (2009)).
If firms with strong environmental, social and governance records have lower idiosyncratic
risk, it will be reflected in price premiums. Using equally weighted portfolios of leading
and lagging firms, Lee and Faff (2009) show that the leading (high CSR) firms have lower
idiosyncratic risk and have lower returns than the laggards. Goss (2009) shows that firms
with poor corporate social performance are more likely to experience financial distress.
The focus on idiosyncratic risk is germane to this study since the risk of financial distress
impacts the ability of a firm to repay creditors.
The corporate debt market is an excellent arena in which to look for a link between
social performance and financial performance because of the unique intermediation role
played by banks. The primary advantage to using the debt market for the study derives
from its informational efficiency. For example, Altman et. al. (2004) find that syndicated
loan markets are more informationally efficient than bond markets, with the loan market
reflecting the probability of default before the bond markets. Allen et. al. (2004) find that
negative earnings announcements are anticipated by the loan market before they are
11
reflected in the equity market. Our hypothesis is that banks are uniquely suited to assess
the impact of CSR related investments, and their assessment will be manifest in the spreads
charged to their customers. Controlling for previously identified determinants of loan
spreads, we ask whether banks discriminate between firms with low levels of CSR and
those with higher levels. It is to that question that we now turn.
3. Empirical Framework and Results
3.1 Data Description and Univariate Analysis
Any study of the links between CSR and financial performance must begin with a
clear definition of both terms. Because we are interested in loans, our metric for financial
performance will be the interest charged on corporate loans, measured as the initial all-in-
drawn spread over the London InterBank Offer Rate, or LIBOR (hereafter referred to as
the spread). The spread is the amount the borrower pays in basis points over LIBOR for
each loan dollar drawn down. It includes the spread of the loan and any annual (or facility)
fee paid to the bank group.
More problematic is the quantification of social responsibility. On examining
previous studies, there appear to be several methods of defining socially responsible
business practices. Carroll (1991) introduces the Carroll Concern for Society Index, while
Aupperle (1991) suggests the use of aggregate measures of corporate principles and values.
The use of multiple measures gathered through surveys is a common method of
quantifying responsibility (e.g., Hansen and Wernerfelt (1989)). Published rankings (e.g.,
Waddock and Graves (1997)) are also common, with Fortune ethical rankings, the

12
Transparency International Corruption5 index and the Kinder, Lydenberg and Domini &
Co. rankings being among the more popular. While we acknowledge the difficulty inherent
in the measurement of CSR (e.g. Entine (2003)), we use the KLD rankings as our measure
of corporate social responsibility. The KLD data are widely accepted by practitioners and
academics as an objective measure of corporate social responsibility, being referenced in
over 40 peer reviewed articles. Sharfman (1996) provides a review of the validity of the
KLD measure and demonstrates convergence between KLD and other measures of social
performance. We use lagged KLD scores as the main explanatory variable in regressions
on yield spreads.
KLD ranks companies on 13 dimensions of CSR, using surveys, financial statement
information, reports from mainstream media, government documents and peer-reviewed
legal journals. The 13 dimensions are community, corporate governance, diversity,
employee relations, environment, human rights, product, alcohol, gambling, firearms,
military, tobacco and nuclear power. Companies may have strengths and concerns in the
first 7 dimensions, while the final 6 dimensions are purely exclusionary screens and
companies can only register concerns in those categories. For example, a company can
receive credit for a strong environmental policy at the same time a concern is registered for
its environmental record. We do not include the exclusionary concerns as part of the total
KLD score. The total of the strengths minus the concerns is the composite KLD score.
Loan information is collected from the Loan Pricing Corporation Dealscan
5 Lee and Ng (2002) find that Transparency International's ratings of national corruption have significant
power to explain price/book ratios for the 1995-1998 time period.

13
database. Rankings for social responsibility are available for approximately 650 companies
on the S&P 500 and the Domini 400 index from 1991 to 2006. Data for firms on the
Russell 1000 and DS 400 are available from 2001 to 2006. Firm level financial information
is gathered from Compustat, with institutional ownership data coming from the Thompson
CDA/Spectrum (13f) database. The only common element between the KLD, Dealscan,
Compustat and Thompson CDA/Spectrum (13f) data is the ticker. Therefore, the KLD data
are matched with the Dealscan loan data by ticker and name. There are 23,650
observations in the KLD data set, representing 4,586 unique firms. After matching with
Compustat, there are 22,660 observations covering 4,397 firms. There are 86,401 U.S. loan
facilities in the Dealscan database over the same period. Matching the KLD data with the
loan data yields a final data set of 8,525 observations. The final filter removes all financial
and insurance stocks, resulting in a final sample of 7,436 loans extended to 1,534 firms
over the period from 1991 to 2006.
A natural first test might be to regress spreads on KLD scores, but the KLD score
cannot be treated as a continuous variable. The ordinal nature of the KLD score provides
information about the relative social performance of firms, but not the magnitude of the
differences between firms with different scores. A score of +2 is better than a score of +1,
but we cannot infer that a score of +2 is twice as good as +1. Likewise, there is no reason
to expect that moving from a KLD score of 9 to 10 has the same impact as moving from
-10 to -9. Further, we note that composition of the KLD score has changed over the sample
period making inference from individual levels difficult. In order to increase the power of
our tests (without losing any of the data) we divide the sample in half, and label those
groups “High CSR” and “Low CSR”.

14
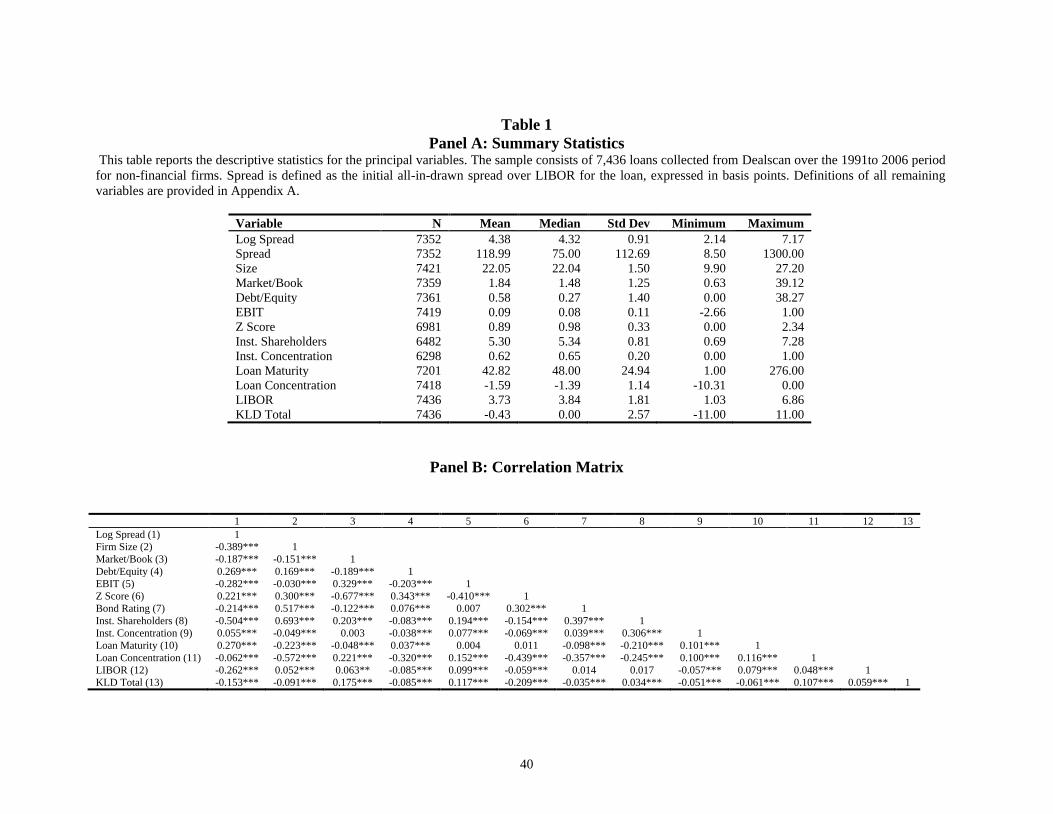
[Insert Table 1 Here]
Turning to the summary statistics in Panel A of Table 1 we see that loans in this
sample have average (mean) all-in drawn spreads of 118.99 basis points, consistent with
the spreads reported in similar studies in the banking literature (for example, Coleman,
Esho and Sharpe (2004) report average all in drawn spreads of 126.8 basis points). There is
also positive skewness in the data, since firms are unlikely to receive loans having spreads
less than LIBOR. This skewness is the motivation for the logarithmic transformation of the
dependent variable in the regressions that follow. The KLD scores range from -11 to +11
and the median score is zero. Occidental Petroleum, First Energy and Conoco Phillips are
among the worst CSR performers. Motorola, IBM, Procter and Gamble and Green
Mountain Coffee are among the firms with the highest levels of corporate social
responsibility in our sample. The correlations are reported in Panel B and none of the
variables display correlations high enough to cause concern in the regressions that follow.
[Insert Table 2 Here]
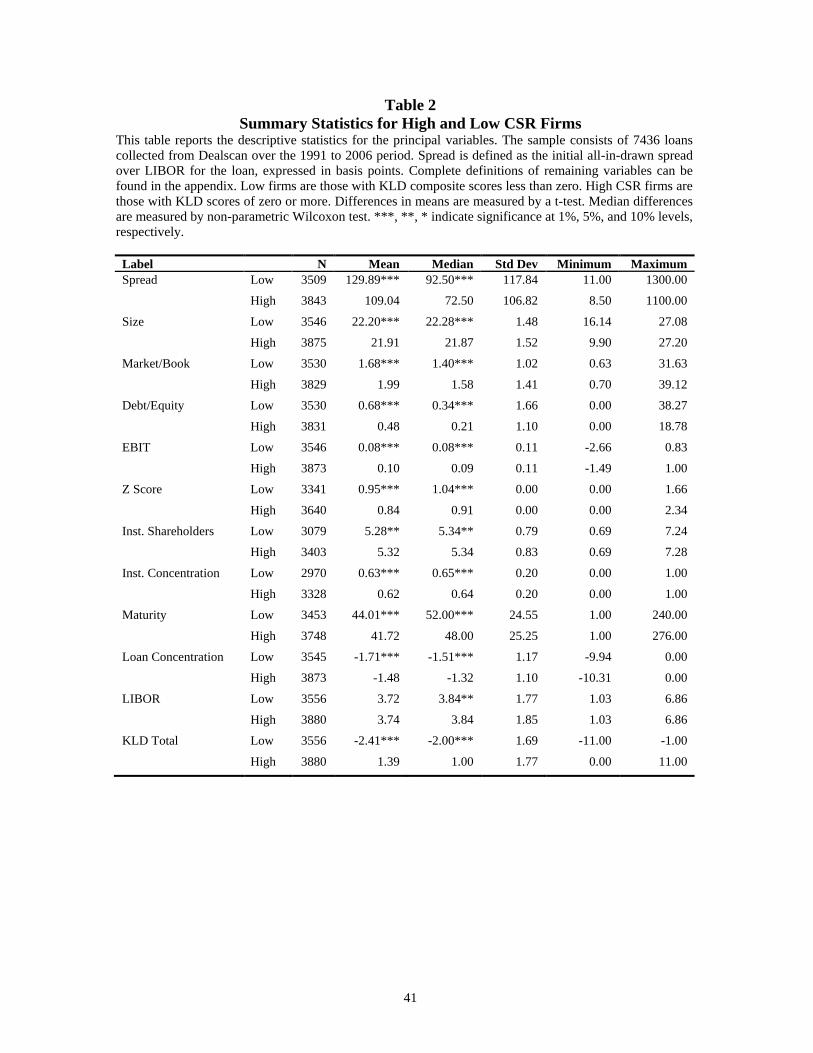
The comparison between the high and low CSR firms in Table 2 reveals a
statistically significant difference of 20.85 basis points between the spreads charged to low
CSR firms and those charged to high CSR firms. However, ascribing this difference to
corporate social performance in the firms would be premature. Industry effects are obvious
(for example, energy firms are overrepresented in the bottom of the distribution), and
several of the firm level characteristics that differ between the two groups also drive yield
spreads. Specifically, the high CSR group of companies has a higher market to book ratio
(1.99 vs. 1.68), lower market value of debt to equity (0.48 vs. 0.68) and lower probability
of distress (0.84% vs. 0.95%). The high CSR firms tend to be smaller than the low CSR
15
firms as measured by the logarithm of total assets (21.91 vs. 22.20). Turning to loan related
variables, high CSR firms take larger loans (as a percentage of total debt outstanding). This
finding lends support to the work of Sharfman and Fernando (2008), who find that firms
with better social performance have easier access to debt financing. Diamond (1991) posits
that firms borrow from banks to build reputations as good repayers. As the relationship
between the firm and the bank grows, the bank is willing to lend more funds. The stronger
banking relationships enjoyed by high CSR firms may allow them to get larger loans than
low CSR firms.
Finally, there are differences in ownership structure between the high and low firms
with the latter having fewer institutional shareholders. This result is intriguing, and it is
unclear whether the presence of institutional ownership motivates socially responsible
behavior, in the spirit of Gillan and Starks (2000), or whether responsible business
practices attract institutional investors. On a related note, the concentration of institutional
ownership, defined as the percentage of the average shares outstanding held by institutions
also differs between firms. High CSR firms have slightly lower concentration of
institutional ownership (62% vs. 63%), significant at the 1% level. Because many of these
characteristics are also known determinants of yield spreads, it points to the need for
multivariate analysis to correctly control for the observed variation between firms. We turn
to these results next.
3.2 Regression Design
The literature on the determinants of loan spreads is well developed, with the
majority of studies using a single equation regression approach (e.g., Berger and Udell

16
(1995); Guedes and Oppler (1996)). We follow in that tradition, but also run a system of
simultaneous equations, instrumental variable regressions and a Mahalanobis metric
matching algorithm to confirm our results. We control both firm and loan characteristics,
as both have been shown to be determinants of spreads. Lender characteristics are
considered in a robustness check. Because the KLD data are only available on US firms,
there is no need to control for country effects.
Firm controls include:
Size: Ln (Total Assets). Larger firms are better able to withstand negative shocks to cash
flow and are thus less likely to default. In addition, there are reputation effects that increase
with firm size (Diamond (1989), (1991)). Hence, larger firms are viewed as less risky by
banks and should enjoy lower yields on debt.
Market/Book: Depending on the context, M/B has been used as a control for risk, growth
opportunities and market mispricing. It is also included because of its relationship to CSR
(firms with high social responsibility ratings are generally found to have higher market-to-
book ratios).
Long-term Debt/Equity: It has been demonstrated both theoretically and empirically that
firms with higher leverage are expected to pay higher spreads.
Secured status: A dichotomous indicator variable equal to one if the loan is secured, zero
otherwise. Where available, the actual indicator is used. Where it is missing the predicted
value from a first stage logistic regression is substituted. Secured status is used as the
dependent variable in a logistic regression where all firm, loan, industry and year controls
are used. The predicted value from this regression is used when secured status is not
observed.
17
EBIT: We include earnings before interest and taxes scaled by total assets to control for the
possibility that any relationship between the spread and the KLD variable is actually being
driven by free cash flow in the firm. The temporal sequencing issue has been identified in
the CSR literature. It is not clear whether CSR leads to improved financial performance or
whether improved performance frees up funds that can be used on CSR related projects.
Because investments in CSR are largely discretionary, the “slack resources” theory
(McGuire et al. (1990)) argues that the initiation or cancellation of CSR related projects
depend on the availability of excess funds.
Z Score: Altman’s (1968) Z score is a measure of distress risk. We use updated
coefficients from Hillegeist et. al. (2004) and convert the raw Z score to a probability of
default so, contrary to the traditional interpretation, higher values represent a higher
probability of distress. It is included in the regressions to control for the possibility that
KLD scores are proxying general default risk.
Bond Rating: S&P long-term debt rating on the signing date, it is an omnibus indicator
capturing various risks. It is equal to 1 if the long-term debt of the firm is rated and equal
to zero if it is not. We expect that the absence of a rating will imply a higher spread.
Investment Grade: Conditional on the presence of a rating, we categorize debt as
investment grade if it has a rating higher than BB+. The variable is equal to unity if the
debt is of investment grade and we expect that investment grade debt will have lower
spreads.
Institutional Shareholders: Equal to the natural logarithm of (1+ the number of
institutional owners). Research by Barnea and Rubin (2005) suggests that investments in
CSR may be an agency conflict between managers who benefit from burnishing their
18
reputations as champions of social responsibility, and shareholders who bear the cost of the
investments. Bhojraj and Sengupta (2003) find that institutional ownership is negatively
associated with yields on public bonds. Roberts and Yuan (2009) document a negative
non-linear relationship between institutional ownership and loan yield spreads because of
the monitoring they provide.
Institutional Concentration: The ratio of shares held by institutions to the average shares
outstanding. The presence of blockholders may lead to agency costs, increasing spreads
(Roberts and Yuan (2009)).
Industry Dummies based on 2-digit SIC codes. Average CSR scores differ by industry in
our sample, with public administrative firms (SIC>90) having the lowest average KLD
scores. Following the U.S. Department of Labor, we control for differences across ten
industries. DiBartolomeo and Kurtz (1999) demonstrate the importance of controlling for
industry effects in studies of socially responsible investing.
In addition to firm characteristics driving loan costs, the features of the loan are
known to be determinants of its cost. Banks can trade off several loan features, including
maturity, security and commitment fees (in the case of revolving loans). We include the
following controls for loan characteristics:
Maturity: The duration of the loan, measured in months. There is mixed evidence on how
the maturity of the loan impacts the spread. The “trade-off” hypothesis suggests that banks
will charge higher spreads on loans with longer maturities, to cover the risk of lending over
longer periods. The “credit quality” hypothesis predicts a negative relationship because
high-risk lenders are crowded out of the long debt market. As a result, riskier borrowers
can only obtain shorter-maturity loans at higher yields (Dennis, Nandy and Sharpe (2000)

19
and Gottesman and Roberts (2004)).
Loan Concentration: Measured as the log of the package amount / (loan package amount +
total debt). Following Dennis, Nandy and Sharpe (2000) we use loan concentration as a
proxy for the strength of the relationship between the bank and the borrower. Berger and
Udell (1995) find evidence that stronger relationships lead to lower spreads.
Loan Type: Since costs vary depending on the type of loan negotiated, (Preece and
Mullineaux (1996)), we include dummies for revolvers, lines of credit, bridge loans and
miscellaneous other loans, with term loans being the omitted variable.
Loan Purpose: As above, the purpose of the loan affects its cost. We control for differing
loan purposes with dummies for working capital, acquisitions, backups, and miscellaneous
purposes. Corporate purpose is the omitted category.
Syndicate: A dummy variable equal to unity if the loan is syndicated. Esty (2001) and
Dennis and Mullineaux (2000) document fundamental differences between conventional
and syndicated loans, with syndicated loans having higher yields.
Finally, we include the 3-month US dollar LIBOR rate at the time of the loan as an
independent variable to control for prevailing macroeconomic conditions. Coupled with
the fact that the dependent variable is a spread over a floating rate, the addition of the
LIBOR variable should capture the effects of any intertemporal economic shocks.
Nonetheless, we also include (unreported) year dummies in the regression specifications.
All continuous control variables are winsorized at the 1% and 99% level to control for
outliers. Because we do not know the form of any potential heteroskedasticity ex ante, we
utilize the generalized method of moments for estimation of the regression equations. The
resulting t-statistics are robust to heteroskedasticity.
20
The general form of the regression equation is:
Ln(Spread) = f(firm characteristics, loan characteristics, KLD) (1)
3.3 Single Equation Results
The first regression (Model 1) in Table 3 uses sixteen dummies for the level of CSR
in a firm in addition to the industry, firm and loan controls described above. The extreme
positive and negative KLD classifications are aggregated to ensure that there are sufficient
observations in each classification. Specifically, all KLD scores equal to or greater than 8
are represented by a single indicator variable. Likewise, all scores equal to or less than –8
are aggregated. Despite the noise inherent in using indicators for each level of KLD, this
exploratory regression offers a useful first look at the data. The second specification
(Model 2) partitions the sample into two groups ― the aforementioned “Low CSR” and
“High CSR” firms. The third specification tests for bias by using just the observations
where secured status is observed.
[Insert Table 3 Here]
Because the dependent variable is log transformed, we apply Kennedy’s (1981)
adjustment to correctly interpret the coefficient on the independent variable.6 After
controlling for industry, firm and loan characteristics, the regression suggests that firms
with KLD scores of -8 or lower pay 24.2% more than firms with a KLD score of 0. Firms
with a KLD score of -7 pay 18.4% more. Both results are significant at the 1% level. As
the level of concern falls, as measured by the composite KLD score, the additional
6 The coefficient is exp(β-1/2(σ)2 )-1, where β is the regression coefficient and σ is the standard deviation. In
our case, exp(0.2195-1/2(.0741)2 )-1 = 0.242.

21
compensation demanded by banks falls, both in magnitude and statistical significance.
When the KLD score rises to 2, the additional spread demanded is indistinguishable from
zero.
When KLD scores reach +5 or +6 there is a statistically significant decrease in
spreads. Equally interesting is the behavior of the KLD coefficient when the KLD score is
greater than 7. These are the most socially responsible firms and, if the stakeholder view is
correct, should be rewarded with the lowest yield spread. Instead, the firms with the
highest KLD scores (KLD positive 8 or more) actually pay 27.1%, or 33 basis points more
than firms with neutral CSR records. Consistent with Barnea and Rubin (2005), this may
be evidence that lenders punish firms that squander resources on social responsibility when
those initiatives have negative net present values. One possible interpretation is that as
firms increase the number of stakeholders that they try to accommodate in their business
mission, they lose focus because the goals of competing stakeholders may not be perfectly
aligned. The ability of the firm to focus on multiple missions has been explored in a related
context by Dewatripont et. al. (1999). Their theoretical model predicts that firms with
“fuzzy” missions will have poor managerial incentives, impairing the effectiveness of the
organization.
On the other hand, there are only 47 firms with scores of 8 or higher and inferences
must be made with caution. We return to this question in the matched firm tests described
later in the paper. It is equally possible that this result is sample specific. Indeed, that is the
biggest drawback to using a specification where each KLD level has its own indicator. A
more reasonable alternative is to aggregate the levels and have one indicator for the top
half of the sample and another for the bottom half. In this specification (Model 2) firms in

22
the bottom half of the sample (KLD<0) pay 9% more than firms in the top half of the
sample. These regressions offer the first evidence that there is information embedded in the
extra-financial information contained in CSR rankings and that banks are able to assess the
value of CSR investments in mitigating risk. An approximation of the economic impact of
these effects is insightful. Interpreting these effects in the original units requires a
correction because the log transformed estimator consistently underestimates the mean.
After applying the bias correction following Miller (1984), the mean loan spread is 121
basis points. (exp(4.38+0.5x(0.91)2)=120.79 The economic impact implied in model 2 is
approximately 11 basis points.
Because the Dealscan database is missing secured status for 3,421 observations, an
(unreported) logistic regression is used to fit the missing data in estimating models 1 and 2.
An alternative specification uses only the observations where the secured status is known.
This lowers the sample size to 3,996. The goal is to ensure that the “errors-in-variables”
introduced by the fitting process is not biasing the regression coefficients. Model 3 shows
the regression results. As can be seen, the coefficient on the Low CSR Indicator retains
both its sign and significance.
3.4 Instrumental Variable Regressions
The preceding specifications suffer from potential endogeneity of the KLD score
with other determinants of yield spreads. It is possible that the variables that determine
loan spreads are also determining lagged KLD scores. If so, there will be correlation
between the coefficients of the explanatory variable and the error term leading to biased
estimates. In order to circumvent this problem, we run instrumental variable regressions.
23
Our first instruments are the states where the firms have head offices. Our motivation is
that regional differences in attitudes to CSR may be reflected by the actions of the firms.
The dependent variable is the Low CSR Indicator used in the preceding analysis. We run
the following logistic regression:
Low Prob = f (head office, political, lagged KLD) (2) High
The first model in Table 4 includes only the intercept and the (unreported) head
office indicators. The head office indicators are jointly significant. Continuing in a
geographic vein, we follow Rubin (2006) and add state voting records. Rubin finds that
companies with high CSR rankings tend to be located in states that vote Democratic in
presidential elections and low CSR firms tend to be in Republican states. To capture this
effect, Model 2 includes a variable that sums up the number of US presidential elections
won by Republicans in each state over nine elections cycles from 1972- 2004. The third
specification uses a measure of Republican strength in each state as calculated by the
Brookings Institute.7
[Insert Table 4 Here]
While all of the political and head office instruments are significant, they are too
weak by themselves to be used as instruments in an IV regression. Therefore we add
lagged KLD scores from three years before the initiation of the loan. Bansal (2005) argues
that the firm specific capabilities captured by CSR metrics take several years to acquire
and are more persistent than indicators of financial performance. It is unlikely that CSR
scores assigned to firms three years before the initiation of the loan are going to be 7 See: www.thegreenpapers.com/G04/President-Strength.phtml

24
influential in setting loan contract terms. Using 3-year lagged KLD scores alongside head
office and the Brookings political strength indicator yields an instrument that is powerful
enough to be used in place of the Low CSR Indicator. We label the instrument “Low CSR
(Predicted)” and insert it into our yield spread regression as the single explanatory for CSR
performance. Descriptive statistics for the instrument are reported in Panel B of Table 4.
The advantage of a two-step process is that the endogeneity of the KLD score and yield
spread is controlled and the resulting variable is a continuous probability instead of an
ordinal score. The cost of controlling the endogeneity in the foregoing is a significant loss
of data, since the firm needs to be in the data set for three years before the lagged KLD
observation can enter the regression.
[Insert Table 5 Here]
Table 5 shows the results of the spread regressions where the KLD variable is
endogenized. The first model estimates the full specification and can be directly compared
with Model 2-Table 3. All of the control variables have the expected signs. Larger firms,
those with higher M/B, lower leverage and higher profitability pay lower spreads. The
coefficient on CSR is positive and significant, confirming our result in Table 3. Firms with
a higher probability of low CSR scores pay higher spreads. Direct interpretation of the
coefficient is complicated by the scale of the independent variable and the logarithmic
transformation of the dependent variable. We overcome this by standardizing the
coefficient in the usual fashion, multiplying by the ratio of the standard deviation of the
coefficient to the dependent variable. This yields a standardized coefficient of 0.035. A one
standard deviation increase in the probability of having low CSR raises spreads by about
0.037 standard deviations. Since all of the reported standard deviations are log
25
transformed, they are also back transformed to original units8. Ultimately, the economic
impact is slightly lower at 5.5 bps., perhaps reflecting the increased noise in the
specification.
The next two models segment the sample by year, with Model 2 covering the period
from 1991- 2000 and the second model covering the period 2001-2006. The reasons are
twofold. First, we want to test whether the addition of Russell 1000 firms after 2001 is
impacting the data. Second we can explore whether there has been any change in bank
response to CSR over time. Our main result is robust to different time periods, remaining
positive and significant in both regressions. The Wald test of the CSR coefficients fails to
reject the hypothesis of equality under the null. There is no evidence that the magnitude of
the reported effect has changed. The other coefficient of note is the Z score, which is
significantly larger (at the 5% significance level) in the latter period. This evidence is
consistent with Berger and Bouwman (2008) who report that banks expand liquidity prior
to banking related crises such as the subprime crisis starting in 2007 but not before market
driven crises like the bursting of the tech bubble in 2000.
Model 4 examines an alternative to the bond rating as a control for firm level risk.
We use the bond rating indicator in all baseline regressions because it is available for all
observations. However, by using a single dichotomous variable we lose any information
about the quality of the bond rating. As a robustness test, we substitute an indicator for an
investment grade credit rating, conditional on the presence of a bond rating. Once again,
8 The standard deviation of the log transformed spread is computed as:
( )( ) ( )( )( )2log
2log 2exp1exp σµσσ +−=norm
where µ is the log transformed mean.

26
the coefficient on CSR remains significant and positive in this smaller subsample.
3.5. Endogeneity of Loan Contract Terms
One criticism of the preceding regressions could be that the endogeneity of maturity
and yield spread has not been adequately controlled. Dennis, Nandy and Sharpe (2000)
demonstrate how the failure to account for this can lead to improper inference. To verify
the results of the preceding regressions, we re-estimate the following system of equations
using three stage least squares. The results are presented in Table 6.
Ln(Spread) = f(maturity, firm characteristics, loan characteristics, KLD) (3)
Maturity = f(ln(Spread), firm characteristics, loan characteristics, KLD) (4)
[Insert Table 6 Here]
Compared to the results in Table 5, the coefficient on CSR has increased, suggesting
a penalty of 14.86% higher spreads, significant at the 1% level, for firms in the lower half
of the CSR spectrum. Turning to the maturity equation, the coefficient of CSR is not
significant. While we cannot draw any inferences from the CSR coefficient in the maturity
equation, the negative log spread coefficient on maturity and the negative maturity
coefficient of spread offer support to the “credit quality” hypothesis. Contrary to
explanations that appeal to the term structure, we find longer maturities leading to lower
spreads and higher spreads being associated with shorter maturities. A plausible
explanation is that low quality firms are “frozen out” of the short term market (Gottesman
and Roberts (2004)). The remaining coefficients in both equations have the expected signs.
3.6. Unobserved Heterogeneity of Lead Lenders
27
While the foregoing analysis has controlled for borrower and loan characteristics,
there exists the possibility that our results may be impacted by unobserved heterogeneity
among the lenders. Several recent papers on the determinants of loan contract terms have
controlled for lead lenders’ characteristics. Coleman, Esho and Sharpe (2006) demonstrate
that banks with better monitoring abilities are able to demand higher initial loan spreads.
They also find that high-risk banks charge higher yields, a result that is also reported by
Hubbard, Kuttner and Palia (2002), who note a negative association between the health of
the lender and the spread charged to the borrower. They find that capital-constrained banks
charge higher spreads, especially when the borrowers have higher levels of information
opacity.
Following the line of reasoning promoted by Coleman, Esho and Sharpe, (2006) our
results could be explained by bank monitoring. If the firms with the lowest KLD scores
also require the most monitoring, then the positive relationship between poor scores and
yields could be due to the superior monitoring abilities of the banks that hold those loans
and not due to the KLD score. We control for unobserved lender heterogeneity by adding
bank fixed effects to our model. The administration agent in each deal is identified as the
lead bank in the syndicate. We identify the ultimate parent of each lead bank, and include
indicator dummies in the regressions for all banks with more than ten loans.
[Insert Table 7 Here]
Table 7 reproduces the result of Model 1 in Table 5, and repeats the results after
controlling for bank fixed effects. Of primary interest is the Low CSR coefficient. It
remains unchanged, suggesting that bank effects are not responsible for the results we
report.

28
Recapping our results to this point, we find that CSR is recognized and priced by
banks in setting loan contract terms. The effect is statistically significant, but economically
modest, ranging from 5 to 11 basis points depending on the regression specification. Our
findings are robust to alternative specifications of risk, they hold over different sub-periods
and remain after controlling for industry, firm level, loan and lender characteristics. A
more direct test is possible. To confirm the regression results, we turn now to matched firm
tests of differences in yield spreads.
3.7. Matched Firms
An alternative to the regression approach is to use matched pairs to examine if there
is a yield differential between firms with high scores and those with low scores.
Traditionally, researchers attempt to isolate the variable of interest by matching firms
based on other characteristics that also drive the dependent variable. Following the work of
Fama and French (1993) matching is often done on the basis of size and book to market
ratio. Control firms are sorted into bins based on size and then further subdivided based on
their book-to-market ratio. Each firm in the treatment group is then matched to the firm (or
portfolio of firms) whose characteristics most closely match its own9. The difficulty with
this approach is that matching is restricted to the criteria selected and it is sensitive to the
selection of bin size. In order to minimize the likelihood of mismatched firms confounding
the results, we borrow from the biostatistics literature and utilize Rubin’s (1980) matching
algorithm based on minimization of the Mahalanobis distance between a set of covariates
that includes the propensity score. Our methodology is as follows: first we calculate the
propensity score for the entire sample. In the first model we use the Low CSR Indicator as
9 Barber and Lyon (1996) provide an econometric review.

29
the dependent variable of a logistic regression on all of the firm and loan covariates
identified in the preceding regression analysis including industry and year dummies. The
sample is then sorted by the Low CSR Indicator into treatment (=1) and control
groups(=0). The first treatment firm is randomly selected. All control firms whose
propensity score is within +/- 0.25 standard deviations of the treatment firm are considered
as potential matches. If no control firms fall within the propensity score range, the
treatment firm is discarded and does not become part of the final set. If only one control
firm falls within the callipers, it is selected and the pair of firms is added to the final set. If
more than one control firm is available, the Mahalanobis distance for the treatment firm
and each of the candidate controls is calculated. We calculate the distance along three
dimensions -- size, market to book ratio and propensity score, where each is scaled by its
variation. The two firms with the shortest distance are added to the final set. Matching is
done without replacement and continues until all treatment firms have been matched or
discarded. We expect the two sets of empirical distributions of yield spreads to be identical
under the null with respect to the mean
[Insert Table 8 Here]
The results of firm matching, presented in Table 8, confirm the main regression result
that firms with lower levels of CSR pay higher spreads. There are 3,556 potential treatment
firms with KLD scores less than 0. The control firms are those with KLD scores equal to
or greater than 0. The matching algorithm isolates these firms and successfully identifies
2,851 control firms that share the same firm and loan characteristics, but have higher KLD
scores. As can be seen, firms with lower KLD scores pay 7.4 basis points more than
matched firms [exp(4.4498+ ½(0.8732))-exp(4.3544+ ½(0.9122))]. The result is significant
30
at the 1% level. None of the other variates is significantly different from zero. Significance
is tested using t-tests for continuous variables and chi-test for categorical variables. While
the results are not shown, none of the year or industry controls are significant. This result
is qualitatively similar to the results of the regression analysis, falling between the 11 bps
in Table 3 and the 5.5 bps in Table 5.
A second model returns to our first regression and explores whether lenders penalize
firms with very high KLD scores. If so, it would be evidence supportive of Barnea and
Rubin’s (2005) conjecture that investments in CSR are agency costs, where managers
burnish their reputations at the expense of shareholders. The matching algorithm is able to
find 29 control firms with KLD scores (in the top 10% of CSR performance) that match
the treatment firms (in the top1%) across multiple dimensions, and the log spread is
considerably higher for the very highest scoring CSR firms (50 bps.). However, the result
is not statistically significant at traditional levels, so we are unable to comment on the
agency argument. There is too much variability in this small sample to make inferences
about the reaction of lenders to firms with very high levels of CSR. Whether agency costs
are present remains an area for future research.
Our final model attempts to quantify the impact of moving from very low levels of
CSR to very high levels of CSR. Model 3 displays results where control firms are in the
bottom decile and treatment firms are in the top decile, after excluding the top 1% of firms.
Note that this test reverses the treatments and controls relative to the preceding two
models. The matching algorithm demands more potential controls than treatments and the
exclusion of the suspicious top 1% of firms means the top decile has fewer firms than the
bottom decile. This test should yield the maximum benefit attributable to CSR. Our results
31
suggest that a firm in the bottom decile of CSR performance could lower its cost of
borrowing by 23 basis points by moving into the top decile. We view the modest 7 bps
premium for firms in the bottom half of the CSR distribution, and a total benefit of only 23
basis points as evidence that banks view CSR as a second order determinant of spreads.
4. Conclusion
The CSR phenomenon has firmly taken root across corporate America, if not within
the academic finance community. MBA candidates can now specialize in Corporate Social
Responsibility. Firm resources are employed to produce reports on CSR initiatives. Scarce
advertising dollars are spent trumpeting social records. And, while there is a growing body
of literature on corporate social responsibility, there has been little research on the effect of
CSR on the cost of debt financing.
To our knowledge, this paper is the first to examine the impact of social
responsibility on the cost of private debt financing. In doing so, we address the impact of
CSR in a previously unexplored channel of debt markets while exploiting the unique role
of banks as “quasi-insiders” of the firm. Because they have access to firm information
unavailable to outsiders, banks are in a position to judge whether the CSR related
investments of the firm lower risk or improve the financial position of the company. Their
determination is manifest in the loan contract terms offered to the firm. We provide
evidence that banks charge 5 to 11 basis points more for firms with below average
environmental, social and governance records. We confirm the robustness of our results
using two different econometric techniques, and we document the maximum penalty for
poor CSR performance to be 23 basis points, when firms in the top decile are compared to
firms in the bottom decile of CSR performance. Our results suggest that banks consider

32
CSR as, at best, of second-order importance in determining loan spreads. At a higher level,
we fail to uncover any strong support for the stakeholder view that investment in CSR
reduces firms’ risk and enhances financial performance.
Our findings suggest interesting avenues for future research. More work needs to be
done to understand how market participants react to firm-level corporate social
responsibility initiatives. This paper has demonstrated that lenders are providing modest
incentives for firms to correct the most egregious behavior by demanding higher yield
spreads from firms with the worst records in social responsibility. But if firms are being
punished for paying too much attention to stakeholder groups, it suggests that there is a
role for government in mitigating negative externalities, since rational firms will not
engage in socially responsible behaviors if they are punished by the market for doing so.
Indeed, the lack of very high KLD scores in our sample is consistent with the idea that
there may be a threshold beyond which further investments in CSR are evidence of value
destroying agency costs. Further research may help shed light on those aspects of CSR that
add value and those that do not.

33
Appendix A
Variable Definition Source Dependent Variable Log Spread Logarithm of Initial all-in-drawn spread over LIBOR Dealscan Loan Related Independent Variables Maturity Months to maturity on the loan Dealscan
Security Indicator variable. Equal to one if the loan is secured, zero otherwise. Where available, the actual indicator is used. Where it is missing the predicted value from a first stage logistic regression is substituted.
Dealscan and first stage logistic regression
Loan Concentration Log of (Loan package amount / (loan package amount + total debt)). Dealscan
Loan Type Dummies
Indicator variables for revolvers, lines of credit, bridge loans and miscellaneous. Term loans are the omitted variable. Dealscan
Loan Purpose Dummies
Indicator variables for working capital, acquisitions, backup loans, debt repayment and miscellaneous. Loans for “Corporate Purpose” are omitted. Dealscan
Syndicate Indicator variable for syndicated loans. Equal to one if the loan is syndicated and zero otherwise. Dealscan
LIBOR Three month US London Interbank Offer Rate at the end of the month of deal signing.
British Banker’s Association
Firm Related Independent Variables
Industry Dummies
There are 10 industry dummies based on 2-digit SIC codes. Agriculture (SIC<10); Mining (10-15); Construction (15-20); Manufacturing (20-40) Transportation, Commercial, Gas and Electricity (40-50); Wholesale (50-52); Retail (52-60); Financial (60-70); Services (70-90); Public Administrative (SIC>90). Agriculture is the omitted variable in all regressions.
Dealscan
Z Score Altman distress prediction score computed with updated coefficients following Hillegeist et. al (2004). Scores are reported as probabilities using logistic transformation.
Compustat
Market/Book A proxy for growth opportunities, measured as Market value of equity+book
value of debt/ Book value of Assets Compustat
Debt/Equity Book value of long term debt divided by market value of equity Compustat Size Logarithm of total assets Compustat
Bond Rating Borrower rating indicator variable. Equals unity if the long term debt of the borrower has an S&P rating. Compustat
Investment Grade Borrower rating indicator variable. Equals unity if S&P rating on the borrower’s long term debt rating on the signing date is higher than BB+. Compustat
EBIT Earnings before Interest and Taxes scaled by Total Assets Compustat
Inst. Shareholders Equal to the natural log of (1+ the number of institutional shareholders)
Thompson CDA/Spectrum (13f)
Inst. Concentration Equal to the ratio of institutional shares to total shares outstanding.
Thompson CDA/Spectrum (13f)
KLD Total Composite score is sum of strengths and weaknesses in 11 areas of environmental social and governance. Exclusionary screens are not included. KLD Analytics
CSR Instruments GOP Vote Percentage of nine presidential elections (1972-2004) won by Republican
candidate, by state. US Census

34
Brookings The degree of Republican sentiment in a US state, as measured by the Brookings Institute (www.thegreenpapers.com/G04/President-Strength.phtml) Brookings

35
References
Allen, L., Guo H., Weintrop, J. 2004. The Information Content of Quarterly Earnings in Syndicated Bank Loan Prices. Baruch College Working Paper. Altman, E. 1968. Financial Ratios, Discriminant Analysis and the Prediction of Corporate Bankruptcy. Journal of Finance 23, 589-609. _________, Gande, A., Saunders, A. 2006. The Informational Role of Bank Loan Ratings. Journal of Financial Research 29(4), 481-501. Aintablian, S., Roberts, G.S. 2000. A Note on Market Response to Loan Announcements in Canada. Journal of Banking and Finance 24, 381-393. Asmundson, P., Foerster, S.R. 2001. Socially Responsible Investing: Better for Your Soul or Your Bottom Line? Canadian Investment Review 14, 20-34. Aupperle, K., 1991. The Use of Forced-Choice Survey Procedures in Assessing Corporate Social Orientation. Research in corporate social performance and policy 12, 269-79. Bansal, P., 2005. Evolving sustainability: a longitudinal study of corporate sustainable development, Strategic Management Journal 26(3), 197-218. Barber, B., Lyon, R. 1997. Detecting Long Run Stock Returns: The Empirical Power and Specification of Test Statistics. Journal of Financial Economics 43, 341-372. Barnea, A., Rubin, A. 2005. Corporate Social Responsibility as a Conflict Between Owners. Simon Fraser University Working Paper. Bauer, R., Koedijk, Otten, R. 2005. International Evidence on Ethical Mutual Fund Performance and Investment Style, Journal of Banking and Finance 29, 1751-1767. Berger, A. N. and Bouwman, C.H. S 2008. Financial Crises and Bank Liquidity Creation, http://ssrn.com/abstract=1231562 Berger, A., Udell, G. 1995. Relationship Lending and Lines of Credit in Small Firm Finance, Journal of Business 68, 351-381. Bhojraj, S., Sengupta, P. 2003. Effect of Corporate Governance on Bond Ratings and Yields: The Role of Institutional Investors and Outside Directors. Journal of Business 76, 455-475. Buysse, K., Verbeke, A. 2003. Proactive environmental strategies: a stakeholder management perspective. Strategic Management Journal 24(5), 453- 470.
36
Carroll, A.B., 1991. Corporate Social Performance Measurement: A Commentary on Methods for Evaluating an Elusive Construct. Research in corporate social performance and policy 12, 385-401. Chen, H., Kacperczyk, M., Ortiz-Molina, H. 2007. Do Non-Financial Stakeholders Affect Agency Costs of Debt? Evidence from Unionized Workers. University of British Columbia Working Paper. Clarkson, M.B., 1995. A stakeholder framework for analyzing and evaluating corporate social performance. Academy of Management Review 20, 92-117. D’Antonio, L., Johnsen, T., Hutton, R.B. 1997. Expanding Socially Screened Portfolios: An Attribution Analysis of Bond Performance. Journal of Investing 6(4), 79-87. Coleman, A., Esho, N., Sharpe, I. 2006. Does Bank Monitoring Influence Loan Contract Terms? Journal of Financial Services Research 30(2), 177-198. Dennis, S., Mullineaux, D. 2000. Syndicated Loans. Journal of Financial Intermediation 9, 404-426. ________, Nandy, D., Sharpe, I. 2000. The Determinants of Contract Terms in Bank Revolving Credit Agreements. The Journal of Financial and Quantitative Analysis 35(1), 87-110. Dewatripont, M., Jewitt, I., Tirole, J. 1999. The Economics of Career Concerns, Part II: Application to Missions and Accountability of Government Agencies. The Review of Economic Studies 66(1), 199-217. Diamond, D.W., 1984. Financial Intermediation and Delegated Monitoring. Review of Economic Studies 51, 393-414. ____________, 1989. Reputation Acquisition in Debt Markets. Journal of Political Economy 97, 828-862. ____________, 1991. Monitoring and Reputation: The Choice Between Bank Loans and Directly Placed Debt. Journal of Political Economy 99, 689-721. DiBartolomeo, D., Kurtz, L. 1999. Managing Risk Exposures of Socially Screened Accounts. Northfield Working Paper.
Entine, J., 2003. The Myth of Social Investing. A Critique of its Practice and Consequence for Corporate Social Performance Research. Organization and Environment 16, 352-368
Esty, B.C., 2001. Structuring Loan Syndicates: A case study of the Hong Kong Disneyland Project Loan. Journal of Applied Corporate Finance 14(3), 80-95.

37
Faleye, O., Mehotra, V., Morck, R. 2006. When Labor Has a Voice in Corporate Governance. Journal of Financial and Quantitative Analysis 41, 489-510. Fama, E. 1985. What's Different About Banking? Journal of Monetary Economics 15, 29-39. _______, French, K., 1993. Common risk factors in the returns on stocks and bonds. Journal of Financial Economics 33, 3-56. Fu, F. 2009. Idiosyncratic Risk and the Cross Section of Expected Stock Returns. Journal of Financial Economics 91, 24-37. Gillan, S., Starks, L. 2000. Corporate governance proposals and shareholder activism: the role of institutional investors. Journal of Financial Economics 57, 275-305 Goldreyer, E.F., Diltz, J.D. 1999. The Performance of Socially Responsible Mutual Funds: Incorporating Sociopolitical Information in Portfolio Selection. Managerial Finance, 25(1), 23-36. Goss, A. 2009. Corporate Social Responsibility and Financial Distress. Proceedings of the Administrative Sciences Association of Canada. Gottesman, A.A., Roberts, G.S. 2004. Maturity and Corporate Loan Pricing. Financial Review 38, 55-77. Guedes, J., Opler, T. 1996. The Determinants of the Maturity of New Corporate Debt Issues. Journal of Finance 51, 1809-1833. Guerard J.B. 1997. Is There a Cost to Being Socially Responsible in Investing? Journal of Investing. Hansen G. S., Wernerfelt, B. 1989. Determinants of firm performance: The relative importance of economic and organizational factors. Strategic Management Journal 10, 399-411. Hillegeist, S., Keating, E., Cram, D., Lundstedt, K.2004. Assessing the Probability of Bankruptcy. Review of Accounting Studies, 9 (1) 5-34. Hubbard, R. G., Kuttner, K.N., Palia, D.N. 2004. Are there ‘bank effects’ in borrowers’ costs of funds? Evidence from a matched sample of borrowers and banks. Journal of Business 75(4) 559-581. Jensen, M., Meckling, W. 1976. Theory of the Firm: Managerial Behavior, Agency Costs and Ownership Structure. Journal of Financial Economics (3), 305-360.T

38
Kennedy, P. E. 1981. Estimation with correctly interpreted dummy variables in semilogarithmic equations. American Economic Review 71 , 801. Lee, C., Ng, D.T. 2002. Corruption and International Valuation: Does Virtue Pay? Cornell University Working Paper. Lee, D., Faff, R. 2009. Corporate sustainability performance and idiosyncratic risk: A global perspective. forthcoming in The Financial Review.
Malkiel, B. 1991. Socially Responsible Investing. speech to 1971 Endowment Conference, reprinted in Ellis ed., Classics II: Another Investor's Anthology, Homewood, Illinois: AIMR/BusinessOne Irwin.
_________, Xu, Y. 2001. Idiosyncratic Risk and Security Returns. University of Texas at Dallas Working Paper.
Margolis, J.D., Walsh, J.P. 2001 People and Profits? The search for a link between a company's social and financial performance. Mahwah, NJ: Erlbaum.
Markowitz, H.M. 1952. Portfolio Selection. Journal of Finance 7, 77-91. McGuire, J.B., Schneeweiss, T., Branch, B. 1990. Perceptions of Firm Quality: A Cause or Result of Firm Performance. Journal of Management, 16 (1) McWilliams, A., Siegel, D. 1999. Event Studies in Management Research: Theoretical and Empirical Issues. Academy of Management Journal. _________________________, 2001. Corporate social responsibility: A theory of the firm perspective. Academy of Management Review, 26(1), 117-27. Milevsky, M., Aziz, A., Goss, A., Comeault, J., Wheeler, D. 2006. Cleaning a Passive Index: How to Use Portfolio Optimization to Satisfy CSR Constraints. Journal of Portfolio Management. 32 (3), 110-120. Miller, D. 1984. Reducing Transformation Bias in Curve Fitting. The American Statistician 38 (2), 124-126.
Orlitzky, M., Schmidt, F., Rynes, S. 2003. Corporate social and financial performance: A meta-analysis. Organization Studies 24, 403-441.
Preece, D.C., Mullineaux, D.J. 1996. Monitoring, loan renegotiability, and firm value: The role of lending syndicates. Journal of Banking and Finance 20, 577-593.
Roberts, G.S., Yuan, E. 2009. Does Institutional Ownership Affect the Cost of Bank Borrowing? Journal of Economics and Business In press.
39
Rubin, A. 2006. Political Views and Corporate Decision-Making: the Case of Corporate Social Reponsibility. Simon Fraser University Working Paper.
Rubin, D.B. 1980. Bias Reduction using Mahalanobis matching metric. Biometrics, 36, 293-298 Sharfman, M. P., 1996. The Construct Validity of the Kinder, Lydenberg & Domini Social Performance Ratings Data. Journal of Business Ethics 15 (3) 287-296. ____________ , Fernando, C. 2008. Environmental Risk Management and the Cost of Capital. Strategic Management Journal 29. 569-592 Statman, M., 2000. Socially Responsible Mutual Funds. Financial Analysts Journal, May/June, 30-39. __________, 2006. Socially responsible indexes: Composition, performance and tracking error. Journal of Portfolio Management 32, 100-110. Teoh, S., Welch, I., Wazzan, C.P. 1999. The Effect of Socially Activist Investment Policies on the Financial Markets: Evidence from the South African Boycott. Journal of Business, 72(1) The State of Corporate Citizenship in the U.S.: Business Perspectives in 2005. The Center for Corporate Citizenship at Boston College 2005 (www.bcccc.net) Waddock, S., Graves, S., 1997. The corporate social performance-financial performance linkage. Strategic Management Journal 18 (4), 303-319. Wright, P., Ferris, S.P., 1997. Agency conflict and corporate strategy: The effect of divestment on corporate value. Strategic Management Journal, 18(1) 77-83. Yermack, D., 2006. Flights of fancy: Corporate jets, CEO perquisites, and inferior shareholder returns. Journal of Financial Economics 80, 211- 242.
40
Table 1 Panel A: Summary Statistics
This table reports the descriptive statistics for the principal variables. The sample consists of 7,436 loans collected from Dealscan over the 1991to 2006 period for non-financial firms. Spread is defined as the initial all-in-drawn spread over LIBOR for the loan, expressed in basis points. Definitions of all remaining variables are provided in Appendix A.
Variable N Mean Median Std Dev Minimum Maximum Log Spread 7352 4.38 4.32 0.91 2.14 7.17 Spread 7352 118.99 75.00 112.69 8.50 1300.00 Size 7421 22.05 22.04 1.50 9.90 27.20 Market/Book 7359 1.84 1.48 1.25 0.63 39.12 Debt/Equity 7361 0.58 0.27 1.40 0.00 38.27 EBIT 7419 0.09 0.08 0.11 -2.66 1.00 Z Score 6981 0.89 0.98 0.33 0.00 2.34 Inst. Shareholders 6482 5.30 5.34 0.81 0.69 7.28 Inst. Concentration 6298 0.62 0.65 0.20 0.00 1.00 Loan Maturity 7201 42.82 48.00 24.94 1.00 276.00 Loan Concentration 7418 -1.59 -1.39 1.14 -10.31 0.00 LIBOR 7436 3.73 3.84 1.81 1.03 6.86 KLD Total 7436 -0.43 0.00 2.57 -11.00 11.00
Panel B: Correlation Matrix
1 2 3 4 5 6 7 8 9 10 11 12 13 Log Spread (1) 1 Firm Size (2) -0.389*** 1 Market/Book (3) -0.187*** -0.151*** 1 Debt/Equity (4) 0.269*** 0.169*** -0.189*** 1 EBIT (5) -0.282*** -0.030*** 0.329*** -0.203*** 1 Z Score (6) 0.221*** 0.300*** -0.677*** 0.343*** -0.410*** 1 Bond Rating (7) -0.214*** 0.517*** -0.122*** 0.076*** 0.007 0.302*** 1 Inst. Shareholders (8) -0.504*** 0.693*** 0.203*** -0.083*** 0.194*** -0.154*** 0.397*** 1 Inst. Concentration (9) 0.055*** -0.049*** 0.003 -0.038*** 0.077*** -0.069*** 0.039*** 0.306*** 1 Loan Maturity (10) 0.270*** -0.223*** -0.048*** 0.037*** 0.004 0.011 -0.098*** -0.210*** 0.101*** 1 Loan Concentration (11) -0.062*** -0.572*** 0.221*** -0.320*** 0.152*** -0.439*** -0.357*** -0.245*** 0.100*** 0.116*** 1 LIBOR (12) -0.262*** 0.052*** 0.063** -0.085*** 0.099*** -0.059*** 0.014 0.017 -0.057*** 0.079*** 0.048*** 1 KLD Total (13) -0.153*** -0.091*** 0.175*** -0.085*** 0.117*** -0.209*** -0.035*** 0.034*** -0.051*** -0.061*** 0.107*** 0.059*** 1
41
Table 2 Summary Statistics for High and Low CSR Firms
This table reports the descriptive statistics for the principal variables. The sample consists of 7436 loans collected from Dealscan over the 1991 to 2006 period. Spread is defined as the initial all-in-drawn spread over LIBOR for the loan, expressed in basis points. Complete definitions of remaining variables can be found in the appendix. Low firms are those with KLD composite scores less than zero. High CSR firms are those with KLD scores of zero or more. Differences in means are measured by a t-test. Median differences are measured by non-parametric Wilcoxon test. ***, **, * indicate significance at 1%, 5%, and 10% levels, respectively. Label N Mean Median Std Dev Minimum Maximum Spread Low 3509 129.89*** 92.50*** 117.84 11.00 1300.00
High 3843 109.04 72.50 106.82 8.50 1100.00
Size Low 3546 22.20*** 22.28*** 1.48 16.14 27.08
High 3875 21.91 21.87 1.52 9.90 27.20
Market/Book Low 3530 1.68*** 1.40*** 1.02 0.63 31.63
High 3829 1.99 1.58 1.41 0.70 39.12
Debt/Equity Low 3530 0.68*** 0.34*** 1.66 0.00 38.27
High 3831 0.48 0.21 1.10 0.00 18.78
EBIT Low 3546 0.08*** 0.08*** 0.11 -2.66 0.83
High 3873 0.10 0.09 0.11 -1.49 1.00
Z Score Low 3341 0.95*** 1.04*** 0.00 0.00 1.66
High 3640 0.84 0.91 0.00 0.00 2.34
Inst. Shareholders Low 3079 5.28** 5.34** 0.79 0.69 7.24
High 3403 5.32 5.34 0.83 0.69 7.28
Inst. Concentration Low 2970 0.63*** 0.65*** 0.20 0.00 1.00
High 3328 0.62 0.64 0.20 0.00 1.00
Maturity Low 3453 44.01*** 52.00*** 24.55 1.00 240.00
High 3748 41.72 48.00 25.25 1.00 276.00
Loan Concentration Low 3545 -1.71*** -1.51*** 1.17 -9.94 0.00
High 3873 -1.48 -1.32 1.10 -10.31 0.00
LIBOR Low 3556 3.72 3.84** 1.77 1.03 6.86
High 3880 3.74 3.84 1.85 1.03 6.86
KLD Total Low 3556 -2.41*** -2.00*** 1.69 -11.00 -1.00
High 3880 1.39 1.00 1.77 0.00 11.00

42
Table 3 Regression of Spread against CSR
This table shows the coefficients from a regression of the log-spread on CSR and controls for borrower characteristics and loan features. The dependent variable is the natural logarithm of the all-in-drawn spread. Descriptions of the explanatory variables are provided in the appendix. Model 1 uses indicators for KLD levels with KLD=0 as the reference. Model 2 segments the sample into high and low CSR firms. Low firms are those with KLD composite scores less than zero. Firms with KLD scores of zero or more are the reference. Model 3 tests for bias due to the estimation of the secured variable by using only observations for which the secured status is observed. Estimation is done using the generalized method of moments. Robust standard errors are in parenthesis. ***, ** and * denote significance level at 1%, 5% and 10% levels respectively. Indicator variables for year, loan type, loan purpose and industry are included in all regressions but coefficients are not reported. Model 1 Model 2 Model 3 Intercept 8.4726 8.4314 7.9777 (0.2306)*** (0.2268)*** (0.2689)*** KLD negative 8 or less 0.2195 (0.0741)*** KLD negative 7 0.1710 (0.0640)*** KLD negative 6 0.0606 (0.0522) KLD negative 5 0.1657 (0.0425)*** KLD negative 4 0.0548 (0.0323)* KLD negative 3 0.1485 (0.0266)*** KLD negative 2 0.0821 (0.0208)*** KLD negative 1 0.0903 (0.0189)*** KLD positive 1 0.0542 (0.0215)** KLD positive 2 0.0353 (0.0276) KLD positive 3 -0.0282 (0.0316) KLD positive 4 -0.0368 (0.0390) KLD positive 5 -0.1057 (0.0505)** KLD positive 6 -0.2011 (0.0604)*** KLD positive 7 0.0843 (0.0982) KLD positive 8 or more 0.2474 (0.1222)** Low CSR Indicator 0.0866 0.0704 (0.0127)*** (0.0153)*** Firm Size -0.1519 -0.1486 -0.1431 (0.0078)*** (0.0076)*** (0.0095)*** Market/Book -0.0255 -0.0253 -0.0301 (0.0100)** (0.0100)** (0.0122)** Debt/Equity 0.1934 0.1944 0.1701 (0.0109)*** (0.0109)*** (0.0119)*** Secured (Fitted) 0.5805 0.5839 (0.0198)*** (0.0199)*** Secured (Actual) 0.7334 (0.0222)*** EBIT -0.8034 -0.7971 -0.6548 (0.0964)*** (0.0962)*** (0.1065)***

43
Model 1 Model 2 Model 3 Z Score 10.3139 10.6339 8.0556 (2.5098)*** (2.5057)*** (2.9236)*** Bond Rating -0.0568 -0.0625 -0.0477 (0.0179)*** (0.0178)*** (0.0207)** Inst. Shareholders -0.1083 -0.1071 -0.0538 (0.0099)*** (0.0100)*** (0.0131)*** Inst. Concentration 0.2153 0.2094 0.1131 (0.0324)*** (0.0326)*** (0.0384)*** Loan Maturity -0.0003 -0.0002 -0.0003 (0.0003) (0.0003) (0.0004) Loan Concentration -0.0951 -0.0953 -0.1188 (0.0102)*** (0.0102)*** (0.0125)*** Syndicate -0.0683 -0.0763 -0.0520 (0.0451) (0.0447)* (0.0709) LIBOR -0.0474
(0.0131)*** -0.0474
(0.0132)*** -0.0507
(0.0158)*** Controls Industry Loan Type and Purpose Year
Yes Yes Yes
Yes Yes Yes
Yes Yes Yes
Adjusted R2 0.675 0.673 0.705 Number of Obs 7352 7352 3996

44
Table 4 Panel A: First Stage Logistic Regression of Instrumental Variables
This table shows the coefficients from a first stage logistic regression of the the Low CSR Indicator against geographic, political and lagged CSR variables. Model 1 includes fifty state-level indicators (results not reported) for the 2006 head office location of each firm. Model 2 retains the head office indicators and adds “GOP Vote”, equal to the percentage of times a state voted for the Republican party in 9 presidential elections from 1972-2004. Model 3 retains the head office indicators and adds a Republican strength metric as compiled by the Brookings Institute. Model 4 adds composite KLD scores from 3 years prior to loan inception. Model 5 combines head office, Brookings and lagged KLD to form a new instrumental variable called “Low CSR (Predicted)”. Variable descriptions are in Appendix A. Standard errors are in parenthesis. ***, ** and * denote significance level at 1%, 5% and 10% levels respectively Model 1 Model 2 Model 3 Model 4 Model 5 Intercept -33.22 -22.529 -38.472 -1.272 2.822 (575.6) (290.1) (290.2) (1344) (1046.6) GOP Vote 1.699 (0.435)*** Brookings 0.646 -0.035 (0.1477)*** (0.2757)*** Lagged KLD Score -1.134 -1.130 (0.035)*** (0.036)*** Controls Head Office Yes Yes Yes Yes Yes AIC 10018 9878 9872 3751 3710 Number of Obs. 7436 7336 7336 4786 4715
Panel B: Descriptive Statistics for Instrumental Variable This table provides descriptive statistics for the IV regressor formed in Table 4-Panel A. It is labeled “ Low CSR (Predicted)” in the regressions that follow.
Mean 0.4920 Std. Dev 0.3540 Min 0.0000 25th% 0.1518 Median 0.4293 75th% 0.8515 Max 1.0000

45
Table 5 Regression of Log-Spread with Instrumental Variable
This table shows the coefficients from a regression of the log-spread on CSR and controls for borrower characteristics and loan features. The dependent variable is the natural logarithm of the all-in-drawn spread. Model 1 uses the CSR instrument formed in Table 4. Low CSR (Predicted) represents the probability of a firm being in the bottom half of firms in CSR performance. Models 2 and 3 segment the sample by year, with Model 2 covering 1991-2000 and Model 2 covering 2001-2006. Model 4 introduces “Investment Grade” as an alternative to “Bond Rating” as an alternative measure of risk. Estimation is done using the generalized method of moments. Robust standard errors are in parenthesis. ***, ** and * denote significance level at 1%, 5% and 10% levels respectively. Indicators for year, loan type, loan purpose and industry are included in all regressions but coefficients are not reported. Model 1 Model 2 Model 3 Model 4 Intercept 8.5323 7.3133 8.7848 7.7586 (0.3021)*** (0.4025)*** (0.3359)*** (0.2640)*** Low CSR (Predicted) 0.0939 0.1170 0.0809 0.1042 (0.0237)*** (0.0377)*** (0.0306)*** (0.0251)*** Firm Size -0.1437 -0.1321 -0.1585 -0.1209 (0.0100)*** (0.0169)*** (0.0134)*** (0.0109)*** Market/Book -0.0320 0.0172 -0.0738 -0.0391 (0.0140)** (0.0213) (0.0173)*** (0.0153)** Debt/Equity 0.1795 0.2457 0.1611 0.1112 (0.0128)*** (0.0273)*** (0.0152)*** (0.0141)*** Secured (Fitted) 0.6474 0.7188 0.5958 0.5726 (0.0283)*** (0.0541)*** (0.0326)*** (0.0391)*** EBIT -1.2216 -1.4278 -1.1380 -1.2210 (0.1403)*** (0.2407)*** (0.1671)*** (0.1589)*** Z Score 7.8183 1.9918 12.0338 4.8279 (3.2683)** (4.7883) (4.3506)*** (3.6956) Bond Rating -0.0834 -0.0985 -0.0713 (0.0268)*** (0.0471)** (0.0319)** Investment Grade -0.3697 (0.0378)*** Inst. Shareholders -0.1060 -0.1033 -0.1205 -0.1084 (0.0127)*** (0.0237)*** (0.0184)*** (0.0140)*** Inst. Concentration 0.2007 0.2457 0.1804 0.2449 (0.0451)*** (0.1108)** (0.0478)*** (0.0526)*** Loan Maturity 0.0003 -0.0015 0.0015 0.0000 (0.0004) (0.0007)** (0.0005)*** (0.0005) Loan Concentration -0.1155 -0.1086 -0.1214 -0.1421 (0.0120)*** (0.0184)*** (0.0163)*** (0.0131)*** Syndicate -0.0284 -0.0574 0.0265 -0.0851 (0.0748) (0.0843) (0.1913) (0.0827) LIBOR -0.0309 0.0342 -0.0980 -0.0197 (0.0170)* (0.0242) (0.0221)*** (0.0188) Controls Industry Yes Yes Yes Yes Loan Type and Purpose Yes Yes Yes Yes Year Yes Yes Yes Yes Adjusted R2 0.679 0.611 0.687 0.697 Number of Obs. 4644 1817 2827 3756
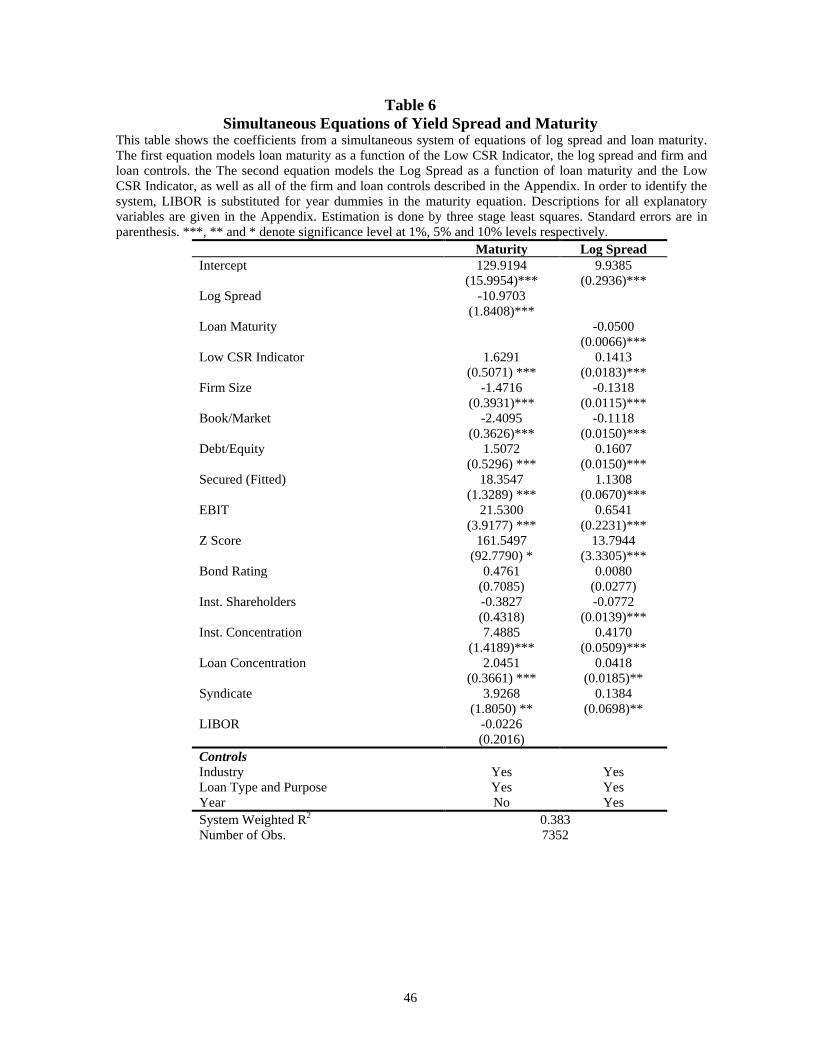
46
Table 6 Simultaneous Equations of Yield Spread and Maturity
This table shows the coefficients from a simultaneous system of equations of log spread and loan maturity. The first equation models loan maturity as a function of the Low CSR Indicator, the log spread and firm and loan controls. the The second equation models the Log Spread as a function of loan maturity and the Low CSR Indicator, as well as all of the firm and loan controls described in the Appendix. In order to identify the system, LIBOR is substituted for year dummies in the maturity equation. Descriptions for all explanatory variables are given in the Appendix. Estimation is done by three stage least squares. Standard errors are in parenthesis. ***, ** and * denote significance level at 1%, 5% and 10% levels respectively.
Maturity Log Spread Intercept 129.9194 9.9385 (15.9954)*** (0.2936)*** Log Spread -10.9703 (1.8408)*** Loan Maturity -0.0500 (0.0066)*** Low CSR Indicator 1.6291 0.1413 (0.5071) *** (0.0183)*** Firm Size -1.4716 -0.1318 (0.3931)*** (0.0115)*** Book/Market -2.4095 -0.1118 (0.3626)*** (0.0150)*** Debt/Equity 1.5072 0.1607 (0.5296) *** (0.0150)*** Secured (Fitted) 18.3547 1.1308 (1.3289) *** (0.0670)*** EBIT 21.5300 0.6541 (3.9177) *** (0.2231)*** Z Score 161.5497 13.7944 (92.7790) * (3.3305)*** Bond Rating 0.4761 0.0080 (0.7085) (0.0277) Inst. Shareholders -0.3827 -0.0772 (0.4318) (0.0139)*** Inst. Concentration 7.4885 0.4170 (1.4189)*** (0.0509)*** Loan Concentration 2.0451 0.0418 (0.3661) *** (0.0185)** Syndicate 3.9268 0.1384 (1.8050) ** (0.0698)** LIBOR -0.0226 (0.2016) Controls Industry Loan Type and Purpose Year
Yes Yes No
Yes Yes Yes
System Weighted R2 0.383 7352 Number of Obs.

47
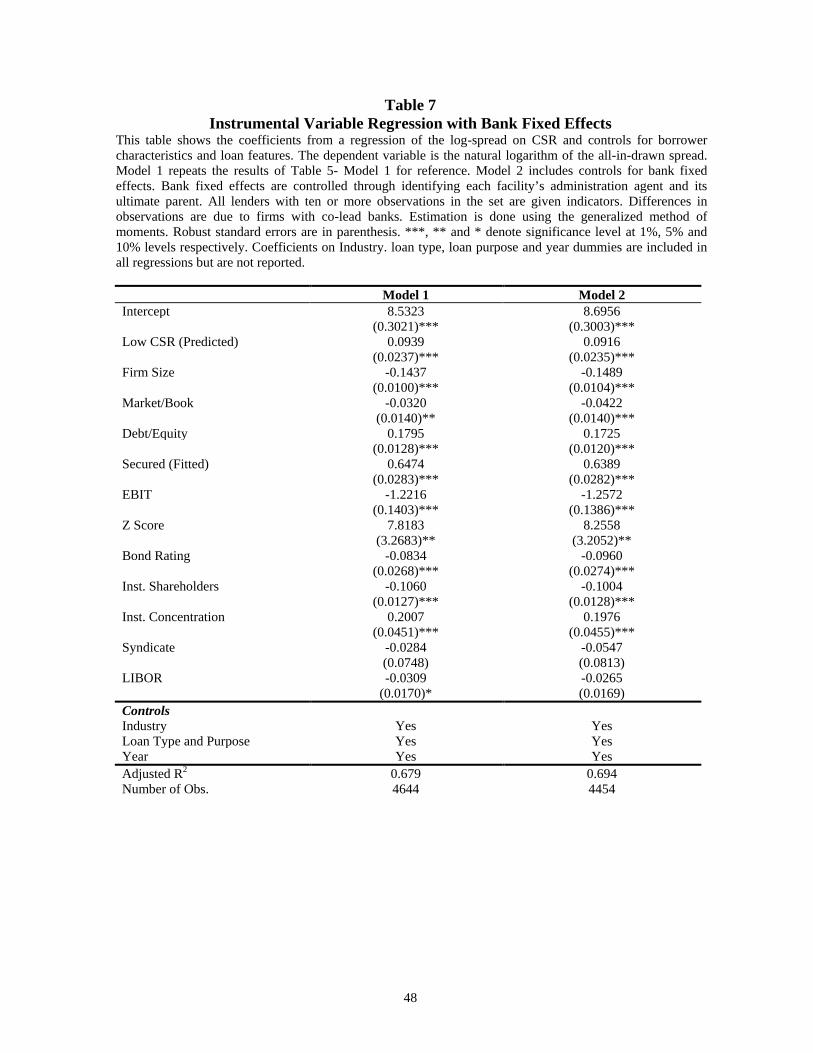
48
Table 7 Instrumental Variable Regression with Bank Fixed Effects
This table shows the coefficients from a regression of the log-spread on CSR and controls for borrower characteristics and loan features. The dependent variable is the natural logarithm of the all-in-drawn spread. Model 1 repeats the results of Table 5- Model 1 for reference. Model 2 includes controls for bank fixed effects. Bank fixed effects are controlled through identifying each facility’s administration agent and its ultimate parent. All lenders with ten or more observations in the set are given indicators. Differences in observations are due to firms with co-lead banks. Estimation is done using the generalized method of moments. Robust standard errors are in parenthesis. ***, ** and * denote significance level at 1%, 5% and 10% levels respectively. Coefficients on Industry. loan type, loan purpose and year dummies are included in all regressions but are not reported. Model 1 Model 2 Intercept 8.5323 8.6956 (0.3021)*** (0.3003)*** Low CSR (Predicted) 0.0939 0.0916 (0.0237)*** (0.0235)*** Firm Size -0.1437 -0.1489 (0.0100)*** (0.0104)*** Market/Book -0.0320 -0.0422 (0.0140)** (0.0140)*** Debt/Equity 0.1795 0.1725 (0.0128)*** (0.0120)*** Secured (Fitted) 0.6474 0.6389 (0.0283)*** (0.0282)*** EBIT -1.2216 -1.2572 (0.1403)*** (0.1386)*** Z Score 7.8183 8.2558 (3.2683)** (3.2052)** Bond Rating -0.0834 -0.0960 (0.0268)*** (0.0274)*** Inst. Shareholders -0.1060 -0.1004 (0.0127)*** (0.0128)*** Inst. Concentration 0.2007 0.1976 (0.0451)*** (0.0455)*** Syndicate -0.0284 -0.0547 (0.0748) (0.0813) LIBOR -0.0309 -0.0265 (0.0170)* (0.0169) Controls Industry Yes Yes Loan Type and Purpose Yes Yes Year Yes Yes Adjusted R2 0.679 0.694 Number of Obs. 4644 4454
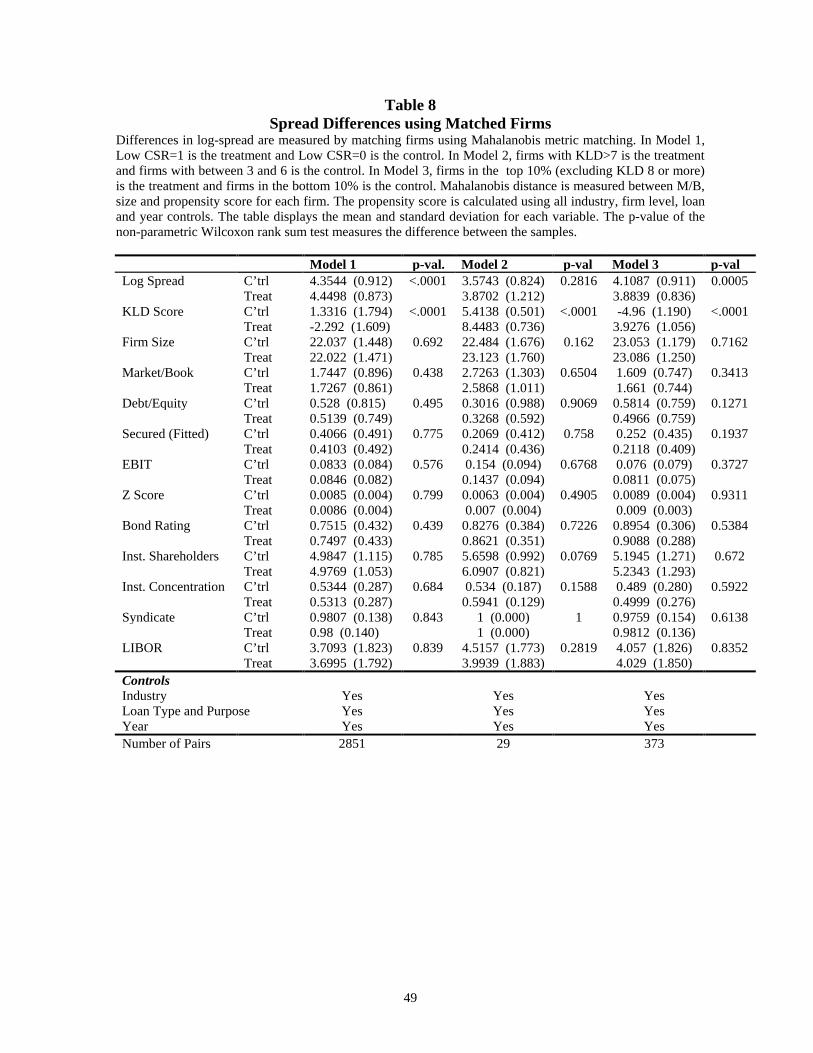
49
Table 8 Spread Differences using Matched Firms
Differences in log-spread are measured by matching firms using Mahalanobis metric matching. In Model 1, Low CSR=1 is the treatment and Low CSR=0 is the control. In Model 2, firms with KLD>7 is the treatment and firms with between 3 and 6 is the control. In Model 3, firms in the top 10% (excluding KLD 8 or more) is the treatment and firms in the bottom 10% is the control. Mahalanobis distance is measured between M/B, size and propensity score for each firm. The propensity score is calculated using all industry, firm level, loan and year controls. The table displays the mean and standard deviation for each variable. The p-value of the non-parametric Wilcoxon rank sum test measures the difference between the samples. Model 1 p-val. Model 2 p-val Model 3 p-val Log Spread C’trl 4.3544 (0.912) <.0001 3.5743 (0.824) 0.2816 4.1087 (0.911) 0.0005 Treat 4.4498 (0.873) 3.8702 (1.212) 3.8839 (0.836) KLD Score C’trl 1.3316 (1.794) <.0001 5.4138 (0.501) <.0001 -4.96 (1.190) <.0001 Treat -2.292 (1.609) 8.4483 (0.736) 3.9276 (1.056) Firm Size C’trl 22.037 (1.448) 0.692 22.484 (1.676) 0.162 23.053 (1.179) 0.7162 Treat 22.022 (1.471) 23.123 (1.760) 23.086 (1.250) Market/Book C’trl 1.7447 (0.896) 0.438 2.7263 (1.303) 0.6504 1.609 (0.747) 0.3413 Treat 1.7267 (0.861) 2.5868 (1.011) 1.661 (0.744) Debt/Equity C’trl 0.528 (0.815) 0.495 0.3016 (0.988) 0.9069 0.5814 (0.759) 0.1271 Treat 0.5139 (0.749) 0.3268 (0.592) 0.4966 (0.759) Secured (Fitted) C’trl 0.4066 (0.491) 0.775 0.2069 (0.412) 0.758 0.252 (0.435) 0.1937 Treat 0.4103 (0.492) 0.2414 (0.436) 0.2118 (0.409) EBIT C’trl 0.0833 (0.084) 0.576 0.154 (0.094) 0.6768 0.076 (0.079) 0.3727 Treat 0.0846 (0.082) 0.1437 (0.094) 0.0811 (0.075) Z Score C’trl 0.0085 (0.004) 0.799 0.0063 (0.004) 0.4905 0.0089 (0.004) 0.9311 Treat 0.0086 (0.004) 0.007 (0.004) 0.009 (0.003) Bond Rating C’trl 0.7515 (0.432) 0.439 0.8276 (0.384) 0.7226 0.8954 (0.306) 0.5384 Treat 0.7497 (0.433) 0.8621 (0.351) 0.9088 (0.288) Inst. Shareholders C’trl 4.9847 (1.115) 0.785 5.6598 (0.992) 0.0769 5.1945 (1.271) 0.672 Treat 4.9769 (1.053) 6.0907 (0.821) 5.2343 (1.293) Inst. Concentration C’trl 0.5344 (0.287) 0.684 0.534 (0.187) 0.1588 0.489 (0.280) 0.5922 Treat 0.5313 (0.287) 0.5941 (0.129) 0.4999 (0.276) Syndicate C’trl 0.9807 (0.138) 0.843 1 (0.000) 1 0.9759 (0.154) 0.6138 Treat 0.98 (0.140) 1 (0.000) 0.9812 (0.136) LIBOR C’trl 3.7093 (1.823) 0.839 4.5157 (1.773) 0.2819 4.057 (1.826) 0.8352 Treat 3.6995 (1.792) 3.9939 (1.883) 4.029 (1.850) Controls Industry Yes Yes Yes Loan Type and Purpose Yes Yes Yes Year Yes Yes Yes Number of Pairs 2851 29 373