Embed Size (px)
Citation preview
1
THE IMPACT OF CORPORATE SOCIAL RESPONSIBILITY (CSR) ON FINANCIAL
PERFORMANCE OF MULTI NATIONAL ENTERPRISES.
(A CASE STUDY OF CONSUMER AND INDUSTRIAL GOODS COMPANIES IN NIGERIA)
Masters thesis submitted in fulfillment of the requirement for the MSc. In International Business
Adedeji Erinle
National College of Ireland.
August, 2019.
2
ABSTRACT
This study will examine the influence of corporate social responsibility on listed consumer
and industrial goods companies in Nigeria economy. The ex-post facto (causal comparative
study) methodology will be employed, and the study will focus on listed companies on
Nigerian Stock Exchange (NSE). The study will adopt standardized simple and multiple
linear regressions (Ordinary Least Square-OLS) to analyse primary data via SPSS version 23.
The study involved time series and cross-sectional data (observational pooled data or panel
data). The researcher intends to employ the non-probability sampling technique and will
cover the business financial performance for the period of seven years, that is, 2012 to 2018,
panel data (secondary data) will be extracted from the audited annual reports and accounts of
the consumer and industrial goods companies. Therefore, the research will employ
standardized linear regression model for analyzing the data collected via audited financial
statements for the period concerned.

3
Submission of Thesis and Dissertation
National College of Ireland
Research Students Declaration Form
(Thesis/Author Declaration Form)
Name: Adedeji Erinle
Student Number: X17158885
Degree for which thesis is submitted: MSc. International Business
Material submitted for award
(a) I declare that the work has been composed by myself.
(b) I declare that all verbatim extracts contained in the thesis have been distinguished by
quotation marks and the sources of information specifically acknowledged.
(c) My thesis will be included in electronic format in the College Institutional Repository
TRAP (thesis reports and projects)
(d) Either *I declare that no material contained in the thesis has been used in any other
submission for an academic award.
Or *I declare that the following material contained in the thesis formed part of a submission
for the award of
________________________________________________________________
(State the award and the awarding body and list the material below)
Signature of research student: Adedeji Erinle
Date: 19/08/2019

4
Submission of Thesis to Norma Smurfit Library, National College of Ireland
Student name: Adedeji Erinle Student number: X17158885
School: Business Course: MSc. International Business
Degree to be awarded: MSc. International Business
Title of Thesis: The Impact of Corporate Social Responsibility (CSR) on Financial
Performance of Multi National Enterprises . (A Case Study of Consumer and Industrial
goods Companies in Nigeria)
One hard bound copy of your thesis will be lodged in the Norma Smurfit Library and will be
available for consultation. The electronic copy will be accessible in TRAP (http://trap.ncirl.ie/),
the National College of Ireland’s Institutional Repository. In accordance with normal academic
library practice all these lodged in the National College of Ireland Institutional Repository
(TRAP) are made available on open access.
I agree to a hard bound copy of my thesis being available for consultation in the library. I also
agree to an electronic copy of my thesis being made publicly available on the National College of
Ireland’s Institutional Repository TRAP.
Signature of Candidate: Adedeji Erinle
For completion by the School:
The aforementioned thesis was received by________________________Date:_______________
This signed form must be appended to all hard bound and electronic copies of your thesis
submitted to your school.

5
Acknowledgement
I wish to express my foremost and Sincere Gratitude to God Almighty who has been the
source of my Inspiration all through the time spent at the College.
I also express my gratitude to my supervisor; James O’Connor for the guidance and time he
provided in the course of completing this research project especially during the analysis of
the questionnaire items for the study.
I am also thankful to my Parents; Otunba Mr. and Mrs. Erinle who their prayers, support has
kept me so far, My siblings; Babajide and Gbenga Erinle for their support and words of
Encouragement
I also want to thank all the lecturers of International Business department for the knowledge
impacted in me during my time at the College which had helped me in writing this Research
Work.
My last appreciation goes to the good friends around me who have supported me throughout
this Journey. I say Thank you to you all
Adedeji Erinle

6
Dedication
I hereby Dedicate this Research Work to the Most High God whom i return all Glory back to
for his Mercy ,Grace,Wisdom, Knowlege and Understanding bestowed upon me throughout
my time in the College and to my Unborn Kids.

7
Table of Contents Page no.
Abstract…………………………………………………………………………………………..2
Declaration……………………………………………………………………………………….3
Submission Form…………………………………………………………………………….......4
Acknowledgement……………………………………………………………………………….5
Dedication………………………………………………………………………………………..6
1.1 Introduction/ Background of the study…………………………………………………….....8
1.2. Statement of the research problem………………………………………………………….10
1.3. Research questions ……………………………………………………………………….....11
1.4. Research Objectives ………………………………………………………………………..11
1.5. Research hypothesis…………………………………………………………………….…...12
1.6. Significance of the study………………………………………………………………….....12
1.7. Scope of the study……………………………………………………………………………13
2.0. Literature review …………………………………………………………….………………14
2.1. Conceptual framework ……………………………………………………………….……..14
2.1.1. Introduction ……………………………………………………………………………….14
2.1.2. Corporate Social Responsibility………………………………………………………16
2.1.3. Association between CSR and Multinational Enterprises in Nigeria …………….…..18
2.1.4. Concept of Corporate Social Performance …………………….…………………….21
2.1.5 Concept of Corporate Social Responsiveness ………………………………………..23
2.2. Theoretical Review …………………………………………………………………….24
2.2.1. Stakeholder Theory ……………………………………………………………………25
2.2.2. Profit and Value Maximization Approaches ………………………………………………….26
2.2.3. Sustainable Development Approach ……………………………………………….................27
2.2.4. Ethical Approach ……………………………………………………………………………...28
2.3. Empirical Review …………………………………………………………………….................29
2.4. Research Gap ………………………………………………………………………………….…38
3.0. Introduction……………………………………………………………………………………...39
3.1. Research Design………………………………………………………………………………....39
3.2. Population……………………………………………………………………………………..…39
3.3. Sample Size And Technique........................................................................................................39
3.4. Reliability And Validity Instrument............................................................................................40
3.5. Method of Data Analysis.............................................................................................................40
3.6. Decision Rule...............................................................................................................................40
3.7. Model Specification and Variables Measurement .......................................................................41
3.8. Ethical Considerations..................................................................................................................42
3.9. Limitations....................................................................................................................................42
4.1. Answers To Research Questions In Relation To Proposal...........................................................43
4.2. Test Of Hypotheses Of Secondary Data In Relation To Proposal................................................44
4.3. Answer To Research Question In Relation To Questionnaire......................................................47
4.4. Analysis Of Questionnaire............................................................................................................48
4.5. Test Of Hypotheses Of Primary Data............................................................................................62
4.6. Discussion Of Findings..................................................................................................................63
5.1. Summary Of Findings....................................................................................................................65
5.2 Conclusion......................................................................................................................................66
5.3 Recommendation.............................................................................................................................67
5.4 Suggestion for Further Research.....................................................................................................67
References……………………………………………………………………………………………..68
Appendix…………………………………………..................................................................................................72

8
CHAPTER ONE
INTRODUCTION
The author will clarify in this chapter why the subject has been selected and how corporate
social responsibility affects or influences the financial performance of companies. The author
will give context and overview of the suggested studies.
1.1 Background to the study
Challenges facing businesses in Nigeria within today’s complex and competitive
environment are products of economic and non-economic related forces. Thus, in order to
survive and prosper within the business environment, corporations must plan their operations
in a manner that will balance the demand among the legal, economic, philanthropic, social
and ethical aspects. Interested parties believe that corporations are responsible to them in one
way or the other. As such, they try to assess how well enterprises have performed these
perceived responsibilities. For instance, stockholders concentrate on the extent to which their
expectation is met by referring to different financial indices such as performance of
companies, , return on investment, earnings per share and market prices of shares. While the
community focuses on socially responsible activities through certain measures e.g.
environment restoration, provision of social amenities, the government monitors firms’
compliance with relevant legislations (Rabi’u, Asma’u, & Musa 2016).
From the global perspective, the financial scandals and unethical practices of top
corporations such as Enron, WorldCom Parmalat and Nike along with climates change
provide alternative dimension to CSR as the most imperative challenge among the divergent
millennium challenges. CSR is linked with civil society and modern political theory and it
involves taking action which reduce the extent of eternalized cost or avoid distributional
conflicts. According to (Muhammad, Ejaz, Javeria, & Mumhza, 2014)“CSR is defined as
achieving commercial success in ways that honor ethical value and respect people,
communities and the natural environment or as a concept whereby company integrate social
9
and environmental concerns in their business operation and in their interaction with their
shareholders on voluntary basis” The virtue matrix framework was developed by Roger in
2002, this represents how business corporations socially are responsible for their behaviours
and business practices. This framework indicates that CSR has become centre awareness
(Rogers, 2002 in Muhammad, Ejaz, Javeria, & Mumhza, 2014). The motive of companies is
not only to cover the financial outcome but they have also focused on broader set of societal
expectation. The world study indicates that 76 percent of managing executives believe that
CSR contributes favourably to the value of long-term shareholders, and 55 percent agree that
sustainability helps create solid reputation for their businesses. (McKinsey, 2010 ; Prahalad &
Hamel, 1994 as quoted in Muhammad, Ejaz, Javeria, & Mumhza, 2014) stated that the basic
objective of CSR is to maintain company activities in order to generate shared value for
company and society. Corporate social responsibility has thus become one of our time's
major company procedures. CSR is also a company method that adds to sustainable
development by presenting all stakeholders with financial, environmental and social
advantages (Bushra & Rabia, 2017).
An underlying premise in the theory of finance is the maximization of the resources of
shareholders on their behalf by managers and executives. But CSR is a phenomenon that
incorporates corporate or business enterprises ' ethical, environmental, and social duties.
Organizations play a key role in engaging with CSR. The notion of corporate social
responsibility has progressed exponentially in recent decades. CSR is not a fresh thing of
interest for the business world. But corporate social responsibility is important because its
influence all facets of organizational operations. CSR is multi-dimensional concepts with
many practices so the notion of corporate social responsibility is linked to a business model
that adds to sustainable development by providing economic, social and environmental
advantages to all stakeholders (Rabia & Bushra, 2017)
10
CSR activities are one of the foreseeable parts of the organization now-a-days. Most
of the prominent organization carries out CSR operations for society's sake or as part of their
responsibility and accountability. Most organizations have embraced corporate social
responsibility without substantial increase in industries performance or government rebate
inform of tax reduction (tax savings) (Samira, Noor, & Masudul 2018). Hence, the study
sought to find out the effect of CSR on organisational financial performance.
In view of the challenges and significance of CSR in the Nigerian consumer and
industrial goods companies which has resulted to substantial amount in CRS expenditures in
the last decades, it is imperative to establish the influence of CSR on corporation’s financial
performance. “What effect does CSR costs have on organizational financial performance in
Nigeria” Also, “what influence does CSR expenditure have on business tax-income ratio in
Nigeria”
1.2 Statement of the Research Problem
Despite the existence of some literature on the effect of corporate social responsibility
on environmental, social and economic dimensions, there is an important gap in how
corporate social responsibility improves financial performance in the consumer and industrial
products industries in regards to tax-income ratio; owing to the absence of documented proof
of the advantages research focus was therefore to investigate CSR’s influence on firms’
financial performance based on selected consumer and industrial goods companies as we
investigate whether firms realize any benefits from government rebate. It also aims to figure
out government's policies on Corporate Social Responsibility operations since CSR has been
used by corporations as allowable expenses to reduce tax liability
This study aims to answer the following questions, what influence does CSR implementation
had on organizational financial performance in Nigeria? This question is important because it
has theoretical and pragmatic significance in CSR application in modern business practices
and literature.
11
1.3 Research Questions
The broad research questions are; “What is the influence of CSR on consumer and industrial
goods companies financial performance? Conversely, this study intends to adopt simple and
multiple linear regression models (ordinary least square-OLS) in carrying out this research
and thus specific research questions are;
1. To what extent does socio-economic welfare cost affect tax-income of listed
consumer and industrial goods companies in the Nigeria?
2. To what extent does educational and health donation cost affect gross-profit margin of
listed consumer and industrial goods companies in the Nigeria?
3. To what extent do CSR surrogates affect return on investment (ROI) of listed
consumer and industrial goods companies in the Nigeria?
4. To what extent is the difference in respondents’ mean/median perceptions of CSR
surrogates influence on listed consumer and industrial goods companies in Nigeria.
1.4 Research Objectives
The main objective of this study is to determine the influence of CSR on consumer and
industrial goods companies financial performance. The specific objectives include:
1. To determine the effect of socio-economic welfare cost on tax-income of listed
consumer and industrial goods companies in the Nigeria.
2. To ascertain educational and health donation cost effect on gross-profit margin of
listed consumer and industrial goods companies in the Nigeria.
3. To evaluate CSR surrogates effect on return on investment (ROI) of listed consumer
and industrial goods companies in the Nigeria.
4. To determine the extent in the difference in respondents’ mean/median perceptions of
CSR surrogates influence on listed consumer and industrial goods companies in
Nigeria.
12
1.5 Research Hypotheses
Hypothesis-1
H0: The effect of socio-economic welfare cost on tax-income of listed consumer and
industrial goods companies in the Nigeria is not significant.
H1: The effect of socio-economic welfare cost on tax-income of listed consumer and
industrial goods companies in the Nigeria is significant.
Hypothesis-2
H0: Educational and health donation cost does not significantly affect gross-profit margin of
listed consumer and industrial goods companies in the Nigeria.
H1: Educational and health donation cost does significantly affect gross-profit margin of
listed consumer and industrial goods companies in the Nigeria.
Hypothesis-3
H0: The effect of CSR surrogates on return on investment (ROI) of listed consumer and
industrial goods companies in the Nigeria is not significant.
H1: The effect of CSR surrogates on return on asset (ROI) of listed consumer and industrial
goods companies in the Nigeria is significant.
Hypothesis-4
H0: The difference in respondents’ mean/median perceptions of CSR surrogates influence on
listed consumer and industrial goods companies in Nigeria is not significant.
H1: The difference in respondents’ mean/median perceptions of CSR surrogates influence on
listed consumer and industrial goods companies in Nigeria is significant.
1.6 Significance of the Study
This research work will serve as a guide for stakeholders to have detailed overview of CSR of
Consumer and Industrial goods companies in Nigeria as how it affects their profitability.
13
In addition, they will understand the impact of Corporate Social Responsibility, its relevance
in Nigeria and how the practice of CSR in Nigeria affects the financial performance of those
consumer and industrial goods companies.
Finally, this study seeks to add immensely to existing literature and international journals in
the international business discipline.
1.7 Scope of the study
The scope of study consists of 36 consumer and industrial goods companies listed on the
Nigerian Stock Exchange (NSE)
The area of the study is the 36 states and capital Nigeria and the time frame for this
study is between October 2018 and August 2019.

14
CHAPTER TWO
LITERATURE REVIEW
2.1 CONCEPTUAL FRAMEWORK
2.1.1 INTRODUCTION
Evaluation of interrelated literatures in any study is indispensable in good judgment that it
allows for a level for reviewing the pool of knowledge and evidence appropriate for further
study.There are conflicting pools of research on the effect of CSR on the financial results of
firms and organizations. Some studies support the notion that CSR have significant impact on
business financial performance, opposite views subsists that different studies, finds that CSR
has no significant impact on financial performance of organizations.
There is no doubt that the world is witnessing a real change in public expectations about the
roles of organizations in the society. While economic growth, wealth creation, and
employment are organizations contributions to the society, organizations are also assigned
other roles and non-economic significance that might not have been expected before. It is
expected that business will offer solutions to several of the major environmental and social
challenges of the twenty-first century, such as accessibility to water, global warming, climate
change, and affordable health care (Blowfield & Murray, 2014) CSR is a social phenomenon;
it does not exist independently from the systemic context of the organization. It then becomes
important to recognize the organizational environment of CSR when evaluating corporate
social activities and their impact on organizations and stakeholders. There are two main
sources of variation in CSR-related institutions. In a national context, the first is the
evolution or change of views on CSR over time. CSR's impact on MNE's is often observed
indirectly based on the feedback of firms ' stakeholders and the public (Barnett, 2007; Wang,
Choi, & Li, 2008), unlike other firms ' operational or investment activities that have direct
effects on firm operational efficiency and results.

15
Since the 1950s, the issue of Corporate Social Responsibility (CSR) has been discussed.
(Secchi, 2007) and (Lee, 2008) have shown in their analysis that the CSR concept perspective
and activity has been modified. CSR has been studied by various scholars around the world
but there has not been any consensus definition of the term. (Mahajan , 2011) in his research
opined that organizations today have a preconceived notion that viable business performance
and shareholder value cannot be achieved through optimizing short-term profitability alone,
but through market-oriented yet responsible behavior. Organizations are more aware that
they can make a significant contribution to sustainable development by coordinating their
activities to boost economic growth and productivity while ensuring prevention of
environmental degradation and promotion of responsibility and accountability, including
protecting the interests of consumers. Corporate Social Responsibility is the ongoing
engagement of organizations to carry out business activities with an ethical behavior and to
make a significant contribution to economic development while improving the quality of its
stakeholders. Corporate social responsibility (CSR) identifies the organization's responsibility
to preserve and promote social welfare by producing sustainable benefits for stakeholders
now and in the future.
In contemporary literature, the nexus between CSR and business performance has been
critically examined and developed. The connection between CSR and financial performance
of the organization can be neutral, positive or negative, yet there is no unanimity among
scholars. The CSR literature contains three schools of thought. First thought found positive
effect or association between CSR and financial performance of orgaizations (Govindarajan
& Amilan, 2013; Jie & Hasan, 2016; Samira, Noor & Masudul, 2018; Yusoff & Adamu,
2016) and recommended investment in CSR activities as CSR enhances the value of
enterprises. The second set recorded a negative impact or connection between CSR and
corporate financial performance and embraced the concept of optimizing corporate profit
through the use of their resources. They are not in favor of CSR resource investment

16
(Babalola, 2012; Hirigoyen & Poulain-Rehm, 2014; Samira, Noor & Masudul, 2018; Singh,
2014). The third school of thought determined neutral effect or connection between CSR and
financial performance of business, documented a miscellaneous relationship and suggested
consideration of many other complexities that could prevent researchers from reaching a
secure conclusion (Samira, Noor & Masudul, 2018).
The study will focus on Return on Investment (ROI), Tax-Income (TI) and Gross Profit
Margin (GPM) ratios. This review of literature will help the study analyze numerous relevant
works critically and identify areas for any further research. There are clear gaps in the
literature as to why the consumer and industrial goods companies listed in Nigeria have not
benefited significantly from CSR practices.
2.1.2 CORPORATE SOCIAL RESPONSIBILITY
Businesses reaffirm their principles and values through corporate social responsibility in their
procedures and activities and also in their relationship with various social entities. CSR is
usually charitable in nature and relates to operations that go beyond mere enforcement of the
legislation. Enterprises' social and environmental responsibility may represent changing
societal standards. For instance, the actions which businesses believe comfortable procedures
in the present may be unacceptable in the future. Moreover, the priority given to the social
and economic needs of distinct social agents involved in the operations of a certain business
can sometimes act as a counter against each other or compete against each other.
"Corporate Social Responsibility (CSR) is fundamentally a concept wherein the businesses
willingly undertake to contribute to a cleaner ecosystem and a better society. It presumes the
company has not only financial and legal obligations, but also other social
responsibilities" (Carroll, 1979).
According to (Holme and Walt, 2001) CSR is the ongoing dedication of enterprises to be
ethical and add to economic growth while increasing the standard of lives of the total
workforce, their family and the local community as well as the society at large.

17
The Corporate Social Responsibility (CSR) idea recognizes that Multi National Enterprises
(MNE’s) have a responsibility to take into account the desires of customers, employees,
shareholders, communities and the ecological "footprint" in all facets of their activities.
CSR in large organizations presents a number of difficulties including; the need to identify
their responsibilities in comparison to the responsibilities of the public sector, determine the
magnitude of their responsibilities in the supply chain and to anticipate and prepare for the
implications of their business decisions, particularly in the event of use of natural resources.
The overall view that, above and beyond the idea of the desire to enhance corporate profit,
organizations play an essential part in addressing societal issues is what crosses a range of
meanings of CSR. CSR in itself is developed by the private industry and enhances the
strategies and the work of government. It promotes closer relationships between MNE's and
the communities in which they operate in. However, it is difficult for many corporate
executives to recognize where their duties begin and end in terms of development of
infrastructure, increasing economic advantages, and accessing critical services that will
improve the quality of life, education, reduce poverty and ensure environmental
sustainability. (Jenkins, 2004).
It could be argued that participation in CSR or charitable operations enhances the reputation
of a company among its diverse audiences, including clients, staff, distributors, community,
and organizations, particularly those who monitor and report on corporate donations.
There are various CSR activities and programs that can be carried out by organizations in
Nigeria before they could be termed as “socially responsible”. They could be in the form of
socio-economic costs or educational and health donations. These activities and programs
range among the following; giving educational scholarship to the indigenes of the community
of which they operate in, awarding contracts to the indigenes of the community they operate
in, donations to science related and sporting activities nationally and internationally,
providing a good welfare package for their employees, funding research projects,

18
construction of capital projects such as roads, hospitals, schools, and providing healthcare
and making efforts to protect the environment in which they operate etc.
2.1.3 ASSOCIATION BETWEEN CSR AND MULTINATIONAL ENTERPRISES IN
NIGERIA
The primary purpose of business is to make profit. The main objective of profit making has
often been considered as portraying a lack of consideration for all other objectives of an
organization. (Dewit & Meyer, 2010) indicated that the company goal of maximizing revenue
is susceptible to an economic rationale instead of the moral rationale for all of the company
activities. But, businesses today realize that they would need to become socially responsible
in order to maintain profitability in an ever-evolving environment setting. Thus, the
assumption that business corporations should represent the interests of all other stakeholders
as well as make profit for shareholders has eventually resulted in the concept of Corporate
Social Responsibility (CSR). Currently, organizations are under steady scrutiny from multiple
stakeholders, such as demand from staff to acknowledge certain workers' interests in the
workplace, customer requests that companies withhold price rises and create healthy goods,
and also society and economic conditions that do not affect local public safety (McWilliams
and Siegel, 2001).
The practice of Corporate Social Responsibility (CSR) has become more global, followed by
issues about the nature of CSR in emerging nations such as Nigeria. However, many public
institutions are yet to fully embrace the principles of CSR. According to (Orojo, 1992),
current Nigerian organizations as a socio-economic production and an exchange institution
emerged in the context of colonial imperialism and thus developed over time in the context of
modernization and contact with the developed world. In 1960, Nigeria got its independence
from the UK. The economic system was largely revolved around agriculture prior to contact
with the west. Over the years, the economic system has evolved and so have the business
practices. There has been involvement of various MNE’s and large indigenous firms which

19
have followed the best practices of CSR used to run business globally. Therefore, the
activities of these firms are visible due to their global reach. As such, there is a higher
incentive through CSR to protect their brands and investments. Consumers in emerging
countries such as Nigeria are reluctant to sacrifice comfort and pay possibly greater rates to
safeguard the ecosystem because they lack expertise to create educated choices on the
acquisition, use and disposal of their products; pollution control; preservation of electricity
and natural assets and safety of customers and employees (Preston and Post, 1975).
Accordingly, MNE's work on the principle of maximizing the beneficial effects of their
operations on community as the adverse impact of these operations is minimized (Farrell and
Fraedrich, 1997). (Amaeshi, Adi, Ogbechie & Amao, 2006) research on CSR in Nigeria
indicates that Nigerian organizations are engaged in one activity of CSR or the other
According to (Amaeshi, 2006), CSR in Nigeria is intended to address the strange social,
financial and weak political structure. In building CSR in Nigeria, MNE's are faced with
unique socio-economic development challenges such as poverty alleviation, provision of
healthcare services, infrastructural developments such as highways, energy and education.
The CSR obligations of MNE's in more developed countries are not similar to that of
Nigeria. These difficulties and challenges do not represent expectations or standards of
MNE’s in more developed countries. Their CSR is primarily concerned with consumer
protection, reasonable trade prices, green market advancement, reduction of environmental
degradation, socially responsible investment and financial reporting. It is worrying that, even
in significant markets such as Nigeria, the problems of creation of jobs and the availability of
fundamental facilities have not corresponded to the alleged growth in GDP. It is obvious that
the task is still beyond government alone because it is incapable of promoting development in
the educational, environmental and financial sectors. Therefore, the involvement of MNE’s to
support the government through CSR activities is needed.

20
MNE's now dominate important industries of the Nigerian economic system including
manufacturing, building, and petrochemical products, as well as telecommunications. Nigeria
is the leading manufacturer of crude oil in Africa, the fifth biggest manufacturer in the OPEC
and the eighth biggest exporter of crude oil on earth. Nigeria today earns more than 95% of
its revenue from petroleum and gas export which represents more than 40% of its GDP.
Requirements for compulsory disclosure pose a key approach for promoting CSR by
legislation. The increased discussions on CSR since the 1990s have resulted in a broader
spectrum of disclosures beyond that of the company's financial position. Disclosures are
progressively evolving even if slowly to represent these changes in operations of MNE's.
MNE’s globally are trying to cope with a new role to address the needs of the present
generation without jeopardizing future generations' capacity to satisfy their own needs.
Organizations are relied on to assume responsibility for how societies and the natural
environment are affected by their operations. They are also asked to assert the integration of
social and environmental considerations in corporate activities and stakeholder interactions
(Van Marrewijk & Verre, 2003). A MNE cannot ignore the environmental issues in the
society in which it operates. Consequently, the effect of corporate social responsibility on the
profitability of organizations in Nigeria needs to be examined.
Hamilton et al. (1993) opined that if a reasonably large group of investors underestimate
(overestimate) the possibility that adverse events connected to CSR issues may affect
businesses that do not adhere with the concepts of CSR, then their stocks will yield lower
(higher) risk-adjusted returns than socially responsible stocks.
There are some recognized CSR problems around the globe, such as Human Rights,
Employee Rights, Environmental Protection, Community Engagement, and Supplier
Relations, national variations also exist in terms of priorities and comprehension. The motive
of CSR in Nigeria arises from public organizational weakness, unlike in the United States and
Europe, where public pressure on MNCs forms CSR activities (Phillips, 2006). Similarly,
21
Amaeshi et al. (2006) asserted that the Nigerian view of CSR differed markedly from that of
the West.
2.1.4 CONCEPT OF CORPORATE SOCIAL PERFORMANCE
(Wartick and Cochran,1985) defined CSP as “a business organization’s configuration of
principles of social responsibility, process of social responsiveness, and policies, programs,
and observable outcomes as they related to the firm’s societal relationships”. There has
been a long-standing discussion on the relationship between CSR and financial performance.
In many CSR-related literature, corporate social performance (CSP) has been discussed as an
operational concept that measures the results of CSR-related activities. CSP can be viewed
as the measurable results of CSR. According to (Lee, 2008), the connection between CSR
and financial performance became blurred as the subject of CSR shifted from tackling the
social obligations of highly responsible firms to its pressures on stakeholders. Authors in the
field of corporate social performance admit that theories on this topic have little practical
significance and prove inadequate in putting forward business rationales for corporate
projects that focus on social and environmental issues (e.g. Gioia, 1999 ; Wood, 2000).
(Friedman, 1970) said the ultimate responsibility of directors was to serve the interests of its
shareholders. Their primary duty is "to conduct the business in conformance with their
[owners ' i.e shareholders] desire to make as much money as possible. Directors as well as
managers are the shareholders ' employees. He therefore concentrated on a very
fundamentally different aspect of corporate and managerial responsibility. Freeman (1994)
was of a different opinion and argued that in order to achieve business legitimacy, social
performance is needed. Directors have a duty of care towards all stakeholders and not only
towards shareholders.
The remark made by Freeman envisaged later research into the link between social
responsibility and financial performance and hinted at a long-term positive correlation
between the two. The central idea in stakeholder theory is that an organization's success
22
depends on how well the organization is able to manage its relationships with key groups,
such as funders and shareholders, but also customers, employees, and even communities or
societies.
(Barnett and Salomon, 2006) in their literature were of the opinion that increasing numbers
of investors look at the financial performance in the portfolio of an organization, and also
how these organizations fulfill their social responsibilities. If society can determine that
organizations are ultimately responsible to its stakeholders, we also expect organizations to
be held accountable for their social performance. Since the characteristics and preferences of
stakeholders can change very quickly in different contexts and times, (Griffin 2000) noted
that prioritizing CSP categories can become a herculean task. Brower and Mahajan (2013)
pointed out three possible reasons for the phenomenon of stakeholders expressing their
expectations of a superior CSP. Firstly, organizations use enhanced CSP as a promotional
tool to improve their relationships with stakeholders (Hoeffler et al., 2010). Secondly,
successes related to CSP may reflect whether businesses serve the interests of its stakeholders
(Ruf et al., 2001). Thirdly, consistent CSP helps organizations align its similar interests with
that of its external stakeholders. According to (Brower & Mahajan, 2013; Ferrell et al., 2010)
once these rare, valuable relationships become inimitable and non-substituteable, they can by
extension, generate competitive advantage from a resource-based perspective.
Measuring CSP has proved to be a herculean task since it reflects a broad spectrum of
economic, social and environmental impacts caused by business activities and therefore
requires multiple parameters to cover its full scope (Gond and Crane 2009, Rowley and
Berman 2000). Corporate Social Performance is a means of enforcing and implementing CSR
(Maron, 2006). CSR is not a variable and cannot be measured. On the other hand, CSP could
be difficult to measure but can be transformed into measurable variables.
According to (Yang et al. 2009), a positive correlation between CSP and CSR suggests that
CSR engagement would increase competitiveness costs and reduce stakeholder hidden costs
23
as good relationships with employees, suppliers and customers are essential for sustainability.
Bowman and Haire (1975) emphasised that CSR is a symbol of goodwill. Therefore, "when
a company increases its costs by improving CSP to enhance competitive advantages, such
social responsibility activities can improve the reputation of the company, and in turn, it can
improve long-term financial performance by sacrificing the short-term CFP" (Yang et al.
2009). The negative correlation between CSP and CSR implies that the practice of CSR will
introduce competitive disadvantages to the business (Aupperle et al. 1985) as the significant
costs may necessitate other methods or need to shoulder other costs and thereby leads to
increased costs due to CSR activities which will result in little gain if measured in economic
interests (Yang et al. 2009). (De Bakker et al., 2005) are of the opinion that the CSR and CSP
literature is inconclusive ,as is the CSP-CFP relationship literature. This link has been
thoroughly researched, but the results are not consistent
Consideration of the financial implications of CSR requires careful scrutiny of variations in
the measurement of CSP and CFP as they can influence the results of the research (Orlitzky
et al., 2003; Wu, 2006). Brown (1998) takes that view and argues that inconsistency in CSP
measurement causes problems in analyzing the relationship between CSP and CSR. It is
therefore important to consider the parameters used In measuring profitability.
2.1.5 CONCEPT OF CORPORATE SOCIAL RESPONSIVENESS
Taking into account the extent of corporate social action (no action–reaction–proaction) and
how MNE's relate to various social responsibilities, a whole scope of corporate responses
should be highlighted. Over the course of time, this corporate social responsiveness has
evolved in line with the pressure that society tends to put on the business and its relationship
with society.
(Carroll, 1979) is of the view that unlike corporate social responsibility, “corporate social
responsiveness is focused only on managerial processes of social response: planning and
social forecasting, social response organizing, social activity control, social decision-making

24
and corporate social policy”. Responsibility and responsiveness can be seen as a balance in
the sense that the public's expectations of business corporate social responsibilities can shape
or trigger responsiveness of the stakeholders. If MNE's serve just the short-term goals
of shareholder by maximizing profit and do so in such a way that other stakeholders interests
are jeopardized, this can adversely affect the business by attacking its credibility or
reputation. It may be ascertained that the primary responsibility of companies is to create
wealth for their shareholders in standard business practices. However, the emergence of CSR
and associated activities that adds another dimension for companies to do well financially,
they must also be good, ethically.
Corporate Social Responsiveness is characterized by a deep concern for the balance of profits
and ethics, also taking into account other stakeholders and not the shareholders only. In this
stage of corporate moral development, a company's management understands the value of not
acting on a legal basis alone, although its approach to ethics is quite cynical, based on the
profits that ethics can bring. More externally oriented codes of ethics reflect a concern for
other stakeholders. The organization identifies, continues to follow and attempts to keep the
best practices up-to-date; these practices are generally industry standards or standardized sets
of social and environmental risks, such as the Global Reporting Initiative. These practices
generally represent a challenge for operational management.
2.2 THEORETICAL REVIEW
The theories under review can be explained from two perspectives, that is, positivist or
normative approach; they are profit-value-maximization, stakeholders, managerial
discretionary, sustainable development and ethical perspectives; the positivist approach
focused on what motivates, while normative focused on what should motivate business
enterprises to pursue corporate social responsibility. They form the theoretical basis of this
study, they shall be analytically discoursed.

25
Researchers have been scrutinizing and categorizing theories of CSR for about three decades.
The classification of this research might well translate into a positivist and normative
strategy. Nevertheless, renewed concerns are needed to comprehend fresh trends owing to the
changing significance of CSR, despite the countless researchers who have started to evaluate
the subject in latest years. The function proves challenging because variability stems from
multidisciplinary complexity as there are differing theories and techniques The classification
criteria is to acknowledge the function that are conferred on organizations by theorists.
Premised on the above, two types of approaches were embraced with distinct colors or views.
They are the positivist and normative models.
2.2.1 STAKEHOLDER THEORY
Stakeholders are those that have a ‘stake’ in a business. They include those who are directly
or indirectly affected by the decisions taken by the managers in their day to day running of a
business enterprise. Stakeholders can be grouped into two groups: the primary stakeholders
and the secondary stakeholders. The primary stakeholders are ‘the shareholders’ that have a
direct interest in the business having contributed their resources. They therefore expect the
directors to run the business in such a way as to ensure that they get maximum return on their
investment. The secondary stakeholders are others which include but not limited to
employees, customers, suppliers, the community and all other entities that have both direct
and indirect interest in the operations of a company.
The stakeholder concept of CSR was popularized by Edward Freeman. His book titled
Strategic Management; A Stakeholder Approach viewed CSR from a management
perspective. It listed groups to which a business should cater for by attempting to “put a face”
on them. According to Anyakudo (2016), the approach is limited in its view as it limits the
scope of CSR by providing specific names and groups which a business should engage with.
Specific businesses would collectively be most appropriate to tackle matters arising in their
26
industry, subject to a highly interactive social environment, thus the grouping is hardly
required except in company-specific CSR programs or in fashioning industry.
This theory states that in as much as the purpose of a firm is to maximize profit in collective
terms, profit must be defined not just in monetary terms but as human welfare. This implies
that managers are charged not only with representing the interests of the owners of the
business (the shareholders) but more importantly with a greater social task of balancing and
coordinating the interests of other stakeholders, and ensuring maximal benefits over medium
and long term. This implies that the interest of every party whose lives is directly or
indirectly affected by the activities of a business should be met and well balanced by the
directors in the course of ensuring that the business makes maximum profit. For instance,
they should ensure that customers purchase quality goods; creditors should be paid as at when
due; the environment should be friendly and free from hazards, and so on.
The relevance of this theory to this study is that; for firms to thrive and achieve their primary
aim of making profit, it is necessary that needs of all stakeholders are met to ensure a positive
financial performance in both medium and long terms.
2.2.2 PROFIT AND VALUE MAXIMIZATION APPROACHES
The primary aim of every business is to make profit. Except for humanitarian organisations,
profit motive drives every business, because shareholders expect return on their investment
and for a business to achieve this, profit must be made.
This theory states that managers should ensure that company’s resources should be targeted
towards carrying out socially responsible activities that would increase profits as long as it is
in line with the rules of competition.
Ditlev-Simonsen, & Midttun, 2011; Jensen, 2001 stated that modern approach to CSR
follows a financial perspective that takes an easier approach to CSR. This is done by shifting

27
the focus from short-term profit to long-term value-maximization. In this stretched viewpoint,
which is called “enlightened value-maximization”; stakeholder theory is based on
maximization of the long-run value of the corporation as the criterion for making the requisite
tradeoffs among its stakeholders. As a positive theory, profit-maximization as focused on in
classical economic theory leaves little room for CSR in business operations. Long-term value
focused finance theory allows some room for stakeholder dialogue as a business driver, but
only to the extent that it can prove its case in long-term value creation. As normative theories,
both approaches argue that profit- or value-maximizing business strategies follow from
rational economic behaviour and should be encouraged as a means to maximise societal
welfare.
2.2.3 SUSTAINABLE DEVELOPMENT APPROACH
The UN World Environment and Development Commission claimed that many of the
industrialized countries ' development activities were not able to be maintained at the current
rate or level and suggested they shifted focus to more sustainable activities that will improve
economic growth and at the same time being socially responsible to the environment.
Elkington provided a view of manufacturing industry focus conversion from a solely
economic perspective to a wider social perspective. (Ditlev-Simonsen & Midttun, 2011;
Elkington, 2001) were of the opinion that there is a fundamental change in the penetration of
company approach as a significant theme; sustainability is also brought up more in a sensible
and realistic way in this theory.
Elkington argues that viable capitalism needs to tackle profoundly modern opinions of what
social capital, economic fairness, and business ethics and morality are all about. As a
positivist approach, the sustainability view on CSR suggests that a significant driver of
CSR is the quest for viable company designs. As a normative approach, the perspective of
sustainable growth can be seen as prescribing the need to create environmentally and socially

28
viable types of manufactured products and services as key engines for effective company
growth.
2.2.4 ETHICAL APPROACH
There are separate features in the ideas of CSR and business ethics. They are frequently used
synonymously, though. The word business ethics" is designed as "a mixture of two very
familiar phrases, namely business and ethics but there are companies that are sadly not ethical
in their CSR projects. Genuine CSR means that companies completely take on environmental
and social issues.
Researches have revealed that an ethical theory can motivate CSR. The moral approach's
theoretical premise varies and includes duty-ethical, virtue-ethical and consequence-ethical
aspects, all of which are component of business ethics. This strategy brings moral
insights into financial (economics) problems that were fundamental to classical philosophers.
The significant point from a virtue-ethical point of view is the focus on the actual activity not
the effects of that particular activity.
Based on the duty-ethical perspective, actions have moral value only when we perform our
responsibilities. Over and above anyone else, Immanuel Kant, the spokesperson for duty
ethics created a concept to ascertain what our responsibility is, known as the categorical
imperative: "Act only on that standard whereby you can simultaneously let it become a moral
rule (Ditlev-Simonsen & Midttun, 2011; Gregor, 1991; Hursthouse, 1999; Stratton-Lake,
2000; Wenstøp, 2005).
As a positivist theory, the ethical strategy implies that the commitment of companies to CSR
is morally directed and refers to an ethical reasoning for "the correct thing to do".
Nevertheless, as a normative theory, the ethical strategy implies that this is what should help
inspire CSR participation in a company.
29
These two views enable researchers to comprehend the major distinctions between the
different CSR theories. The goal is to rank the theories and create a map to make group
peculiarities accessible. This enables us to gain a stronger knowledge of corporate-society
relationships and to improve both theoretical and practical trends.
Study has not provided evidence on the corporate social responsibility effect on government
rebate such as tax holiday or tax reduction of listed consumer and industrial goods
companies’ financial performance that includes tax-income ratio. Despite several literatures
on the effect of CSR on environmental, social and economic dimensions, there is an
important difference in how CSR improves Nigeria consumer and industrial goods sectors
financial performance in regards to tax-income ratio; due to lack of documented evidence of
the benefits hence the study focus was to investigate CSR’s influence on firms’ financial
performance based on selected consumer and industrial goods companies as we investigate
whether firms realize any benefits from government rebate. It also seeks to find out the
policies set by the government concerning the CSR activities since CSR has been used by
corporations as allowable expenses to reduce tax liability. The findings will be vital in given
insight towards which CSR activities are the most effective, in terms of their effect on the
bottom line of the companies engaging in them. This insight would enable them regulate the
balance between these motivations, maximization of the social good that can be drawn from
these CSR activities and profitability. The aforementioned has attracted the need to explore
how corporate social responsibility expenditures impact on the financial performance of
listed consumer and industrial goods companies in Nigeria.
2.3 EMPIRICAL REVIEW
This section provides a review of Corporate Social Responsibility and financial performance
empirical research. As noted previously, methodological variations as discovered in the
literature are accountable for differential results and findings. The priority will be on the
research and the methodologies used in specific.

30
Several researches on the connection between Corporate Social Responsibility and Corporate
Financial Performance have been performed and can be ranked into three main areas: those
indicating a positive correlation between CSR and financial performance, those indicating a
negative relationship between CSR and financial, and lastly those who indicate a non-
existence of relationship between CSR and financial performance.
(Annis Hammond and John W. Slocum ,1996) found that CSR can enhance corporate
reputation and reduce the financial risk implying that such organisations are less likely to go
bankrupt than those not involved in CSR.
According to (Henderson, 2001) CSR has an adverse effect on profitability. His work has
challenged corporate social responsibility. The notion of CSR is adversely affected, as CSR
adoption raises the likelihood of cost increases and performance impairment.
(O'Neill, Saunders and Der-winski McCarthy, 1989) in their work researched the relationship
between corporate social responsibility and profitability in which CSR activities showed no
effect on profitability (neutral).
(Grigoris, George, Eleni and Xanthi, 2016), in their work titled “The Impact of CSR on the
Financial Performance of United States (US) Companies”. The study initially employed all
companies listed on Standard & Poor’s 500 Index focusing on large sized companies; final
sample consisted of 104 US Companies from Nine Industries for a period of five years (2009-
2013). While the dependent variable was Return on Assets (ROA) only, the independent
variable consisted of only ESG disclosure score; while the control variables were: Board size,
CEO duality, Women on Board and Executive compensation, as the impact of these
independent variables was carried out in terms of involvement in socially responsible
initiatives and not on outcome. Secondary source of data collection was employed and
Pearson’s correlation was used to analyze the data collected. Results revealed the following:
• The determinants explained 65% of the variance in ROA
• ESGDS is significantly positive on ROA at the 1% level

31
• CEO duality and Executive Compensation are significantly positive to ROA at 5%
and 10% levels
• Women on Board is significantly negative to ROA at the 10% level
The study concluded that the commitment on social responsibility rewards companies by
higher levels of financial performance and recommended that longer period be incorporated
in order to validate the positive relationship between CSR and financial performance.
In the case of developed countries, most studies analyzing the connection between CSR and
business performance are conducted and very few studies have been conducted in the case of
developing or emerging nations. CSR is understood as a philanthropic, public-related or
marketing activity in developing or emerging nations
Nigeria is a developing country and it is included in the Secondary Emerging Market
category. This study therefore seeks to identify existing CSR procedures and empirically
investigate the relationship between CSR and performance of consumer and industrial goods
companies listed on the Nigerian Stock Exchange (NSE) carrying out such operations
(Muhammed and Jamilu Madaki, 2017) in their work titled “Corporate Social Responsibility
disclosure and financial performance of listed consumer goods companies in Nigeria”.
Secondary source of data was employed from the annual reports and accounts of ten (10)
consumer goods companies listed on Nigeria Stock Exchange from 2005 to 2014. Seven (7)
variables were used to represent financial performance namely: ROA, ROE, Leverage, EPS,
Tobin’s Q, Firm Size and the Age of the firm: while CSR disclosure index was used to
represent CSR disclosure.
Using descriptive statistics, ordinary least square and generalized least square to analyze and
test the hypothesis; the study revealed the following:
• There exists an average disclosure index of about 79.63%. This implies that there is a
high level of disclosure by consumer goods companies in Nigeria with a minimum
level of disclosure and maximum level of 42.11% and 94.74% respectively.

32
• There is no significant dispersion among selected companies and their Return on
Assets with a standard deviation of 0.1425
• With respect to Return on Equity, results showed that the average profit earned by the
company is 35.96% of the total equity. Also, there is a negative but statistically
insignificant relationship between ROE and CSR.
• There exists a positive but insignificant relationship between leverage and CSR at 5%
level with a mean of 1.8084%
• Tobin’s Q is positive and significantly related to CSR at 5% level with a mean and
standard deviation of 79% and 0.9351 respectively.
• EPS, Firm size and age of the firm are positively associated to CSR and statistically at
5% level.
The study recommended that a good relationship should exist between consumer goods
companies and their host communities, as well as the level of CSR activities should be
increased.
(Bala and Abdulrazaq, 2018) in their study “Financial performance and Corporate Social
Responsibility of some selected banks in Nigeria” sought to examine the effect of the
independent variables (ROA, EPS, ROE) on the dependent variable (CSR) with Bank size,
Liquidity and Firm Age as control variables. Sample size comprises of 7 out of 15 barriers
listed on the Nigerian Stock Exchange for a period of 6 years. Using multiple regression
model and STATA software version 12 for data analysis, the study revealed the following;
• The level of CSR by the selected samples for the period was 80%, with minimum
value of 74.5 and maximum value of 80%.
• CSR differs from banks to banks
33
• ROA was about 4.4% of the CSR disclosure by the banks for the period of study.
Also, there exists a positive and significant effect between ROA and CSR of the
selected banks.
• EPS showed a minimum of –0.15k and maximum EPS earned was N52.2 with a
standard deviation of 0.0806 implying that there is no significant variation in EPS of
the banks.
• ROCE showed a mean score of 0.02% standard deviation score of 0.0009 implying
that there exist a significant relationship and effect between ROCE and CSR of the
selected sample size for the period under review.
• Bank size, liquidity and firm age slowed significant relationship with CSR.
• For firm age, the minimum score in 5 years and 42 years as the maximum implying an
average of 24 years.
The study recommended that managers should ensure that the wealth of the Banks be
utilized in consistence with the principles of reasonable improvement that agrees with the
idea of social responsibility.
(L.Ojo, 2016) in his work effects of “Corporate Social Responsibility on Corporate Financial
Performance of quoted pharmaceutical firms in Nigeria” examined the effect of CSR proxies
(community development expenditure, environmental expenditure & employee relation
expenditure) on Return on Assets. The sample size consisted of all the eleven firms that are
quoted on the floor of the Nigerian Stock Exchange (NSE) over a ten year period and data
was analyzed using panel regression with the aid of e-view. The results of the research
revealed the following:
• That the expenditure on community development has no significant financial
performance of pharmaceutical industry in Nigeria which implies that there are other
factors other than community development expenditure. T-statistics showed a value of
1.496.

34
• Results showed that expenditure on the environment has a significant positive effect;
with a coefficient value of 1.018 and T-statistics of 6.925
• Finally, for every unit increase in the value of employee relation expenditure, there is
an equal unit decrease on the firms’ performance. Employee Relation Expenditure has
a significant negative effect on firms’ performance with a co-efficient of-1.4398 and
T-statistics of -7.527.
The study recommended that a well-structured CSR should be in place in companies and that
members of the board at their AGM should take up the responsibility. Also, companies
should ensure that CSR is inbuilt into their policy statement and backed up with a proper
budget in order to improve the community where they operate.
(Iftekhar, Nada, Liu, Haizhi, 2016) in their study carried out on 5,516 companies, not
excluding 986 U.S. manufacturing firms from 1992 to 2009 sought to investigate if Corporate
social performance (CSP) is positively related to firm total factor productivity (TFP) and if
the relationship between corporate social performance and financial performance is mediated
by firm total factor productivity. Secondary method of data collection was employed and data
were analyzed using regression analysis. Findings discovered that:
• there is a significantly positive relationship between CSP and TFP
• there is a significant direct effect of CSP on TFP (p<0.01) and a significant mediated
main effect of CSP.
• There is a significant correlation between CSP and TFP as well as a significant partial
mediation effect of TFP on CSP-CFP relationship
In conclusion, (Iftekhar, Nada, Liu, Haizhi, 2016) argued that by forging strong relationships
with key stakeholders through participation in social issues, a firm can develop productive
intangibles such as technological innovations, organizational legitimacy, better access to
resources, and human capital, all of which help firms to efficiently utilize the assets, obtain

35
competitive advantages over rivals and create shareholder value. CSR activities have
instrumental value in helping firms to accumulate productive intangibles as reflected by TFP.
(Bikon. Et al, 2017) in their study sought to examine the impact of CSR on the financial
performance of Thirty-six manufacturing and production companies listed on London Stock
Exchange over a six year period. Eight subsectors were considered and CSR constituents
included: Corporate giving, Employee safety, Greenhouse gas emission reduction and waste
reduction; financial performance was proxies were on Assets (ROA) and Return on Equity
(ROE). Secondary method of data collection was employed, while data analyses were carried
out using E-views software. Results showed that:
• Corporate giving has a negative insignificant impact on ROA and ROE, therefore no
statistical significant impact on financial performance
• Employee safety and waste reduction has a positive insignificant impact on ROE and
ROA.
• Greenhouse gas emission reduction has a significant but negative significant impact
on ROA
The study recommended that future research study should use long-term financial
performance indicators.
(Mubeen and Arooj, 2014) in their work sought to find out the impact of corporate social
responsibility on firms financial performance and shareholders wealth in Nigeria. Ten firms
rated as highly corporate social responsible and ten non corporate social responsible firms
were selected for the study; financial performance measures were ROA and ROE while
shareholders wealth measures included EPS and stock
price.Research findings show the significant positive relationship between corporate social re
sponsibility and the financial performance of the firm’s and the wealth of shareholders. The
study recommended that
36
for companies in today's competitive environment to achieve maximum financial
performance, corporate social responsible activities should be encouraged.
(Ibrahim & Garba, 2015) assessed Corporate Social Responsibility and Financial
Performance in the Nigerian Construction Industry. The study adopted an ex-post facto and
survey designs, generated data from questionnaire administered using a five point Likert
Scale as well as the annual reports and accounts of sampled construction companies.
Analyses were carried out using multiple regression analysis and chi-square test. Findings
revealed that non-CSR activities have a greater impact than CSR activities on the financial
performance of Nigerian companies in the construction industry. The study therefore
recommended that non-CSR activities should be encouraged as it is very important in
ensuring that firms in the construction industry achieve their objective.
In their research, (Uwaloma and Egbide, 2012) used samples of 41 companies listed on the
Nigerian stock exchange for 2008. Multiple regression analysis was used to analyze the
data.The article found that there was an important adverse connection between the financial
leverage of companies and the amount spent on corporate social responsibility.
(Ojo, 2010) research used information from 40 Nigerian stock exchange-listed limited
liability companies. Data gathered were analyzed using correlation regression and variance
analysis (ANOVA) The research showed that companies examined contributed infinitesimal
amounts of their gross income to social responsibility. In this instance CSR had an adverse
relationship with financial performance.
(Amidu et al, 2017) in their study titled ‘The Impact of Corporate Social Responsibility
Disclosure on Financial Performance of Firms in Africa’, measured the effect of CSR proxies
on Financial performance proxies; return on assets (ROA) for short-term, and return on
equity (ROE) for long-term .The study adopted annual panel data set for 158 firms grouped
into six industries in six African countries over the period 2005-2015.Multiple linear
regression analysis was used to carry out the

37
analysis.Findings revealed that, unlike sales and manufacturing, health and pharmacy and oth
er industriesCSRdisc has a negative impact on corporate financial performance in the short ru
n (ROA) for the mining, investment and transport industries.
This means that in these industries, no economic benefit is generated by CSR in the short
term.With regards to financial performance in the long term (ROE), results suggested positive
but no significant economic benefits for companies. Furthermore, the study suggested that
there are other factors that impacts on the financial performance of firms in Africa other than
their CSR practices. The study recommended that firms should continue to give priority to
the disclosure of CSR given the numerous benefits.
(Sukanya et al, 2015) in their study, ‘The Impact of Corporate Social Responsibility on
Firms’ Financial Performance in South Africa’ investigated the impact of CSR on Corporate
Financial Performance (CFP) of selected firms for the period of 2004 to 2013 in South
Africa. Three financial ratios (ROA, ROE and EPS) were used to analyze the financial
performance of firms in relation to their social responsibility measures. Secondary method of
data collection was adopted and data was analyzed using regression analysis. The results
showed that CSR and ROA are negatively correlated; however EPS increases by 973.5138
for every one-unit increase in CSP, ceteris paribus. Also, there are mixed results between
CSR and CFP in various industries over the long term. The study concluded that
no significant differences in financial performance resulted from CSR activities.
(Johansson et al, 2015) in their work ‘The relationship between CSR and financial
performance’ tested the association between CSR proxy and financial performance namely:
its accounting based financial performance (represented by ROA) and its market based
financial performance (represented by Tobin’s Q). The study adopted a sample of 167
Swedish companies for a three year period and utilized quantitative and deductive approaches
in gathering statistical data from publicly traded companies on Stockholm OMX stock
exchange . Secondary data analysis was used in the collection of data, a co relational research

38
design and a longitudinal research strategy. Also a simple linear regression model in the
program SPSS was used in order to examine the relationship between CSR and the two
dependent financial variables. Findings discovered that there exist no positive linear
relationship between a company’s financial performance in both proxies and its level of CSR
activities. In summary, there are greater factors that impacts on the financial performance
greater than CSR.
(Muhammad et al, 2017) in their study investigated the impact of Corporate Social
Responsibility on the Financial Performance of Banks in Asian Countries. Using secondary
source of data collection generated from the annual returns of the selected banks for a period
of five years (2010-2015) as well as regression and correlation for data analysis. The results
showed that CSR has a positive and significant impact on the financial performance
indicators (ROA, ROE and EPS). Also a positive correlation exists between CSR and CFP.
2.4 RESEARCH GAP
As summarized above, various studies have been carried out on the impact and relationship
between corporate social responsibility and financial performance on various firms that exist
in different industries. These studies have also been carried out in various countries across the
globe. In most of the previous studies undertaken on the topic, the proxies for financial
performance has been ROA, ROE, P/E EPS; no study has sought to really examine the effect
on other key financial performance indicators of companies such as Gross Profit Margin
(GPM), Taxable Income (TI) and Return on Investment (ROI). Previous studies have also
acknowledged that their studies should serve as a bench mark for further studies as no one
research work is all encompassing and only limited to the scope of the study.
It is on this basis that the researcher then seeks to evaluate the extent to which CSR
surrogates have impacted on the financial performance of selected consumer and industrial
goods companies in Nigeria.

39
CHAPTER THREE
RESEARCH METHODOLOGY 3.0. INTRODUCTION
This section examines the research design, population, sample and sampling techniques,
research instrument, data analysis, model specification, reliability and validity of instruments
and ethics and limitation of study.
3.1. RESEARCH DESIGN
The study seeks to adopt the mixed research design. Mixed research design is a methodology
for conducting research that involves collecting, analysing and integrating quantitative (e.g.,
experiments, surveys) and qualitative (e.g., focus groups, interviews) research (Creswell &
Plano Clark, 2011).Since primary data will be obtained from questionnaires and secondary
data will be collected from audited annual accounts and reports of the Nigeria listed
consumer and industrial goods companies; in order to see the cause and effect of CSR on the
financial performance indices. Therefore, in this study, the researcher seeks to collect both
primary and secondary data from listed multi-national consumer and industrial goods
companies that are on Nigeria Stock Exchange (NSE).
3.2. POPULATION
The population of the study will be 21 consumer goods companies and 15 industrial goods
companies, making a total of 36 companies that are listed on consumer and industrial goods
sectors of Nigeria Stock Exchange (NSE).
3.3. SAMPLE SIZE AND TECHNIQUE
The study will use non-probability sampling technique, preferably judgmental sampling
technique or method will be adopted, that is, first-twenty high capitalized companies will be
selected from the 36 companies. The audited annual financial statements of the selected
companies will be used to generate the CSR and financial data needed for the study. The
40
research will also adopt the sampling method of Tabachnick and Fidell (2007) in determining
our sample size (n), that is, number of observations, that is, n ≥ 50 + 8m = 50 +8(2) = 66,
that is, our sample size (that is, pooled regression observations) should not be less than 66. In
order to have a good regression analysis result or good fit. M represents number of regressors
in the model.
3.4. RELIABILITY AND VALIDITY INSTRUMENT
The instrument is valid and reliable since they have been signed by the management of the
consumer and industrial goods companies, approved by the security and exchange
commission, and other scholars have used the annual audited financial statements to carry out
related or similar study, therefore the instrument is deemed to be valid.
3.5. METHOD OF DATA ANALYSIS
The study will adopt standardized simple and multiple linear regressions (Ordinary
Least Square-OLS) to analyse data via SPSS version 23. The study involved time series and
cross-sectional data (observational pooled data or panel data). Our theoretical expectation
(Aprior) that is, β1 to βn ≥ 0 and we will make sure that data conform to the standardized
linear regression assumptions that is, linearity, homoscedasticity, normality and independence
of data; tolerance value should not be less than 0.10 (10%), variance inflationary factor (VIF)
should not be greater than 10, otherwise possible multicolinearity; Durbin Watson statistics
should be within the range of 1-3, (Gujarati, Porter & Gunasekar, 2012; Kothari, & Gaurav,
2014; Tabachnick & Fidell, 2007).
3.6. DECISION RULE
The decision will be based on 5% level of significant. Accept null hypothesis (H0) if
probability value (i.e. P-value or Sig.) calculated is greater than or equals to (≥) stated 5%

41
level of significance (α); otherwise, reject and accept alternate hypothesis (Ha), if p-value or
sig calculated is less than 5% level of significance (Osisioma, Egbunike & Jesuwunmi, 2015).
3.7. MODEL SPECIFICATION AND VARIABLES MEASUREMENT
Financial Performance (FP) =ƒ (Corporate Social Responsibility-CSR)
Financial Performance is a function of Corporate Social Responsibility-CSR
Introduce the surrogates (i.e. proxy variables)
FP-( GPMit ROAit, TIit) = ƒ (CSR-SOCEWit, GDCit EDUHCit)…..eqn.1
Financial performance is proxy by TI, GPM, ROI while corporate social responsibility is
proxy by SOCEW, EDUHC, GDC
TIit = Ϫ0 + β1SOCEWit …………………………..….eqn.2
GPMit = Ϫ1 + β2EDUHit ……………………………..eqn.3
ROAit = Ϫ2 + β3SOCEWit + β4EDUHit …+ β5GDCit…..eqn.4
Note: equation2 to 5 are deterministic or mathematical models;
Introduce the stochastic random variable (error term) into the model.
TIit = Ϫ0 + β1SOCEWit + Ԑit ………………………………….eqn.5
GPMit = Ϫ1 + β2EDUHit + Ԑit…………………………………eqn.6
ROAit = Ϫ2 + β3SOCEWit + β4EDUHit …+ β5GDCit+ Ԑit………eqn.7
Note: equation2 to 4 are deterministic or mathematical models; equations 5 to 7 are simple
and multiple linear regression models or econometric models, that is eqn-5 is simple
regression model while eqn6 and 7 are multiple regression models.
Table3.9: Variables measurement and nomenclature
S/N Names & Codes Measurement Variable type
1 Financial Performance-
FP
FP=ROI, GPM, TI Latent-Endogenous
2 Return on investment –
ROI
ROI = Earnings before Interest Tax Depreciation
Amortization(EBITDA) ÷ [Total Assets − current
liability OR share capital + long-term liability ]
Observed/measured
endogenous
3 Gross profit margin –
GPM GPM= [Gross profit ÷ total revenue (income)] *100 Observed
endogenous
4 Tax –Income=TI TI= [Tax liability ÷ total revenue (income)] *100 Observed/ explained
5 Corporate Social
Responsibility-CSR CSR=SOCEW, GDC, EDUHC Latent/hidden
exogenous
6 Socio-economic cost-
SOCEW
SOCEW= Socio-economic cost; cost of providing road,
pipe-borne water and capital expenditure. Amount is
derived from the audited annual financial statement.
Observed/measured
exogenous

42
7 Educational and Health
cost-EDUHC
EDUHC= Educational and Health cost; amount incurred
on providing health and education to the host
community. Amount is derived from the audited annual
financial statement.
Observed exogenous
8 General Donations Cost-
GDC
GDC= amount giving to the host community in kind
which cannot be classified into the aforementioned.
Amount is derived from the audited annual financial
statement.
Observed exogenous
9 β1-5 Regression coefficient Parameter
10 Ϫ0-2 (Gandia) Intercept /constant term Parameter
11 Ɛ Error term or stochastic random variable Parameter
12 Ƒ Functional notation Parameter
13 I Individual firms Parameter
14 T Time/ year Parameter
Source: Researcher’s literature review, 2019.
3.8. ETHICAL CONSIDERATIONS
There is no vulnerability in this study. The researcher does not and will not intend to expose
any firm or individual to danger. And the research will maintain the integrity and
confidentiality of data or information.
3.9. LIMITATION
The result will be limited to study population or sample studied any addition or
extension of time or sample size may give or cause variation in result and
generalization is limited to Nigeria listed companies in the related sectors.

43
CHAPTER FOUR
DATA PRESENTATION, ANALYSIS AND DISCUSSION OF FINDINGS
4.1 ANSWERS TO RESEARCH QUESTIONS IN RELATION TO PROPOSAL
i. To what extent does socio-economic welfare cost affect tax-income of listed
consumer and industrial goods companies in the Nigeria?
Table-1: Simple Linear Regression Model Statistics Summary of Socio-economic Welfare
Donation Prediction on Listed Nigerian Companies Tax-Income from 2012-2018.
Multiple R 0.152009176
R Square 0.02310679
Adjusted R Square 0.016679861
Standard Error 0.045283215
Observations 154
Source: Researcher’s Computation via Microsoft Excel, 2010
The simple linear regression model statistics summary of socio-economic welfare donation
prediction on listed Nigerian companies’ tax-income from 2012-2018 is presented in Table-1. The
simple linear model result in Table-1 is performed by taking Tax-income as explained
variable (dependent variable-DV) and socio-economic welfare as predictor (i.e. independent
variable-IV). The model summary result shows that the dependent variable is explained by
the predictors in the model with R2 of .023 (2.3%). However, the unexplained variation in the
model prediction, that is, error term (Ԑ) had captured .977 or 97.7% variations.
ii. To what extent does educational and health donation cost affect gross-profit
margin of listed consumer and industrial goods companies in the Nigeria?
Table-2: Simple Linear Regression Model Statistics Summary of Educational and Health
Donation Prediction on Listed Nigerian Companies Gross Profit Margin (GPM) from 2012-2018.
Multiple R 0.43665107
R Square 0.190664157
Adjusted R Square 0.185339579
Standard Error 0.131522753
Observations 154
Source: Researcher’s Computation via Microsoft Excel, 2010
The simple linear regression model statistics summary of educational and health
donation cost prediction on listed Nigerian companies’ gross-profit margin (GPM) from 2012-2018
is presented in Table-2. The simple linear model result in Table-2 is performed by taking
Tax-income as explained variable (dependent variable-DV) and socio-economic welfare as
predictor (i.e. independent variable-IV). The model summary result shows that the dependent
variable is explained by the predictors in the model with R2 of .191 (19.1%). Conversely, the
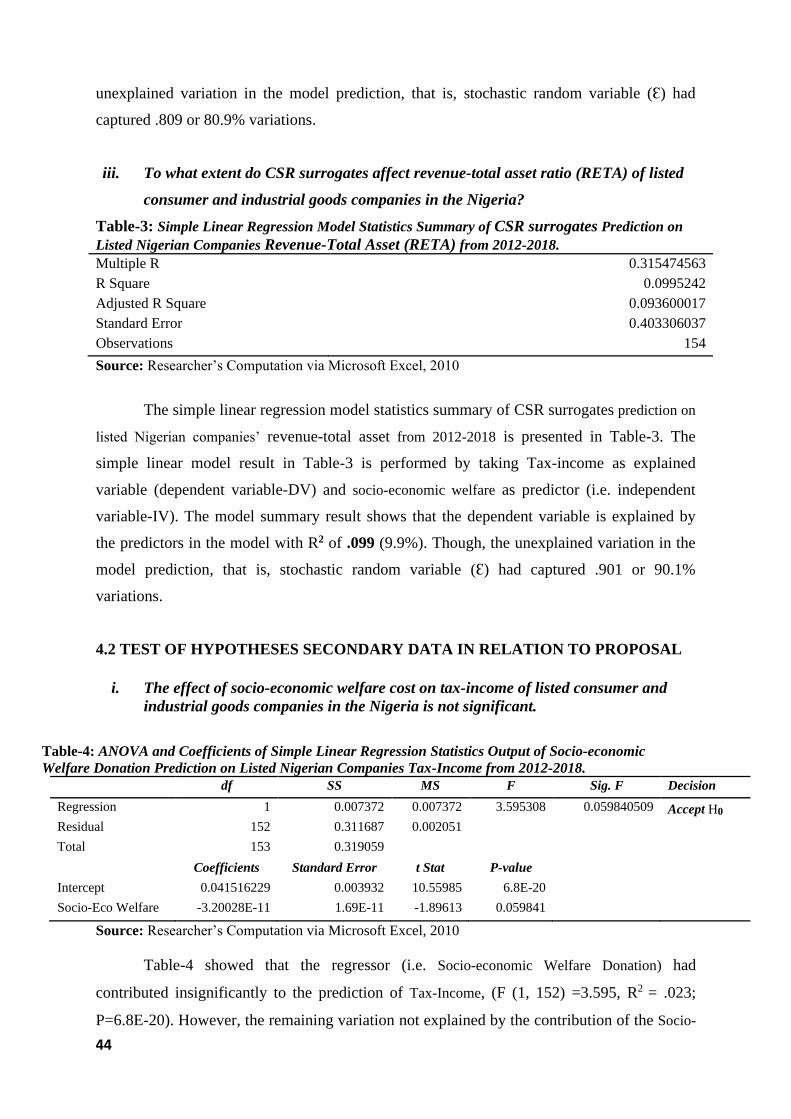
44
unexplained variation in the model prediction, that is, stochastic random variable (Ԑ) had
captured .809 or 80.9% variations.
iii. To what extent do CSR surrogates affect revenue-total asset ratio (RETA) of listed
consumer and industrial goods companies in the Nigeria?
Table-3: Simple Linear Regression Model Statistics Summary of CSR surrogates Prediction on
Listed Nigerian Companies Revenue-Total Asset (RETA) from 2012-2018.
Multiple R 0.315474563
R Square 0.0995242
Adjusted R Square 0.093600017
Standard Error 0.403306037
Observations 154
Source: Researcher’s Computation via Microsoft Excel, 2010
The simple linear regression model statistics summary of CSR surrogates prediction on
listed Nigerian companies’ revenue-total asset from 2012-2018 is presented in Table-3. The
simple linear model result in Table-3 is performed by taking Tax-income as explained
variable (dependent variable-DV) and socio-economic welfare as predictor (i.e. independent
variable-IV). The model summary result shows that the dependent variable is explained by
the predictors in the model with R2 of .099 (9.9%). Though, the unexplained variation in the
model prediction, that is, stochastic random variable (Ԑ) had captured .901 or 90.1%
variations.
4.2 TEST OF HYPOTHESES SECONDARY DATA IN RELATION TO PROPOSAL
i. The effect of socio-economic welfare cost on tax-income of listed consumer and
industrial goods companies in the Nigeria is not significant.
Table-4: ANOVA and Coefficients of Simple Linear Regression Statistics Output of Socio-economic
Welfare Donation Prediction on Listed Nigerian Companies Tax-Income from 2012-2018.
df SS MS F Sig. F Decision
Regression 1 0.007372 0.007372 3.595308 0.059840509 Accept H0
Residual 152 0.311687 0.002051
Total 153 0.319059
Coefficients Standard Error t Stat P-value
Intercept 0.041516229 0.003932 10.55985 6.8E-20
Socio-Eco Welfare -3.20028E-11 1.69E-11 -1.89613 0.059841
Source: Researcher’s Computation via Microsoft Excel, 2010
Table-4 showed that the regressor (i.e. Socio-economic Welfare Donation) had
contributed insignificantly to the prediction of Tax-Income, (F (1, 152) =3.595, R2 = .023;
P=6.8E-20). However, the remaining variation not explained by the contribution of the Socio-
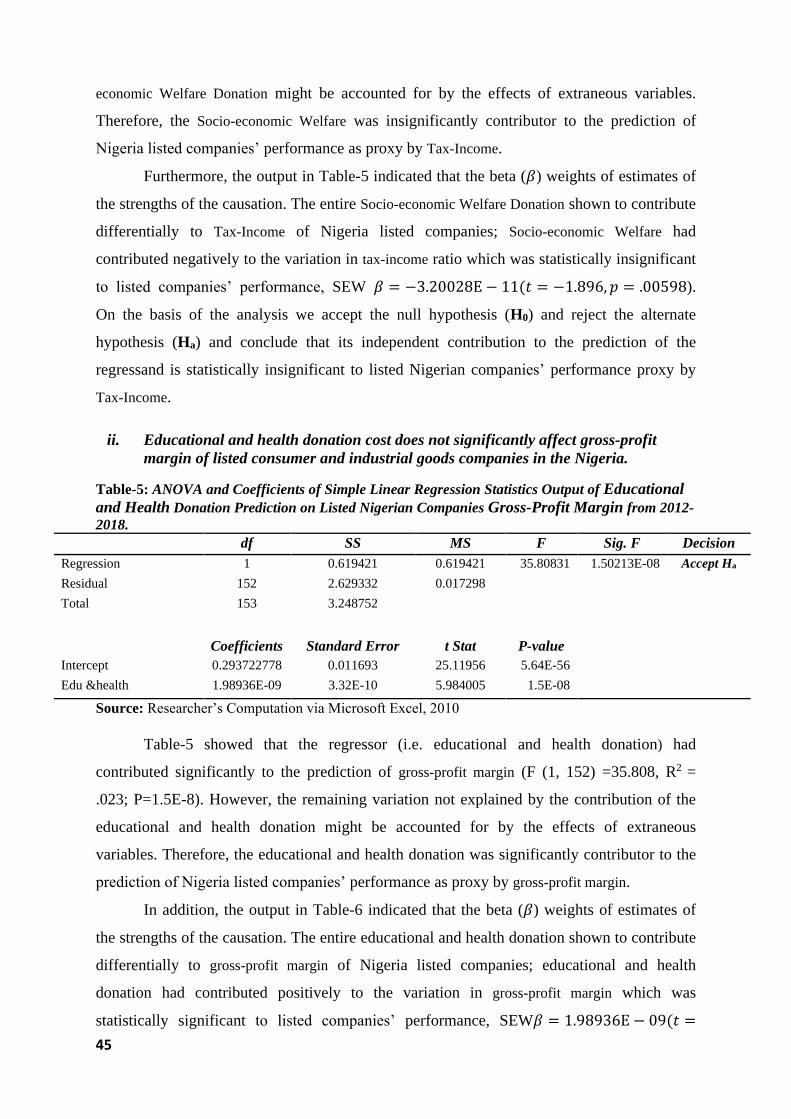
45
economic Welfare Donation might be accounted for by the effects of extraneous variables.
Therefore, the Socio-economic Welfare was insignificantly contributor to the prediction of
Nigeria listed companies’ performance as proxy by Tax-Income.
Furthermore, the output in Table-5 indicated that the beta (𝛽) weights of estimates of
the strengths of the causation. The entire Socio-economic Welfare Donation shown to contribute
differentially to Tax-Income of Nigeria listed companies; Socio-economic Welfare had
contributed negatively to the variation in tax-income ratio which was statistically insignificant
to listed companies’ performance, SEW 𝛽 = −3.20028E − 11(𝑡 = −1.896, 𝑝 = .00598).
On the basis of the analysis we accept the null hypothesis (H0) and reject the alternate
hypothesis (Ha) and conclude that its independent contribution to the prediction of the
regressand is statistically insignificant to listed Nigerian companies’ performance proxy by
Tax-Income.
ii. Educational and health donation cost does not significantly affect gross-profit
margin of listed consumer and industrial goods companies in the Nigeria.
Table-5: ANOVA and Coefficients of Simple Linear Regression Statistics Output of Educational
and Health Donation Prediction on Listed Nigerian Companies Gross-Profit Margin from 2012-
2018.
df SS MS F Sig. F Decision
Regression 1 0.619421 0.619421 35.80831 1.50213E-08 Accept Ha
Residual 152 2.629332 0.017298
Total 153 3.248752
Coefficients Standard Error t Stat P-value
Intercept 0.293722778 0.011693 25.11956 5.64E-56
Edu &health 1.98936E-09 3.32E-10 5.984005 1.5E-08
Source: Researcher’s Computation via Microsoft Excel, 2010
Table-5 showed that the regressor (i.e. educational and health donation) had
contributed significantly to the prediction of gross-profit margin (F (1, 152) =35.808, R2 =
.023; P=1.5E-8). However, the remaining variation not explained by the contribution of the
educational and health donation might be accounted for by the effects of extraneous
variables. Therefore, the educational and health donation was significantly contributor to the
prediction of Nigeria listed companies’ performance as proxy by gross-profit margin.
In addition, the output in Table-6 indicated that the beta (𝛽) weights of estimates of
the strengths of the causation. The entire educational and health donation shown to contribute
differentially to gross-profit margin of Nigeria listed companies; educational and health
donation had contributed positively to the variation in gross-profit margin which was
statistically significant to listed companies’ performance, SEW𝛽 = 1.98936E − 09(𝑡 =

46
5.984005, 𝑝 = 1.5E − 08). On the basis of the analysis we the reject null hypothesis (H0)
and accept the alternate hypothesis (Ha) and conclude that its independent contribution to the
prediction of the explained variable is statistically significant to listed industrial and
consumer goods Nigerian companies’ performance surrogated by gross-profit margin.
iii. The effect of CSR surrogates on revenue-total asset ratio (RETA) of listed
consumer and industrial goods companies in the Nigeria is not significant.
Table-6: ANOVA and Coefficients of Simple Linear Regression Statistics Output of CSR
surrogates Prediction on Listed Nigerian Companies Revenue-Total Asset ratio (RETA) from
2012-2018.
Df SS MS F Sig. F Decision
Regression 1 2.732559852 2.732559852 16.79965012 6.73958E-05 Accept Ha
Residual 152 24.72367547 0.16265576
Total 153 27.45623532
Coefficients Standard Error t Stat P-value
Intercept 0.954734002 0.035346001 27.01108994 6.76585E-60
CSR(Don) -5.61739E-10 1.37052E-10 -4.098737625 6.73958E-05
Source: Researcher’s Computation via Microsoft Excel, 2010
Table-6 showed that the regressor (i.e. CSR surrogates) had contributed significantly
to the prediction of revenue-total asset (F (1, 152) =16.8, R2 = .0995; P=6.73958E-05).
However, the remaining variation not explained by the contribution of the CSR surrogates
might be accounted for by the effects of extraneous variables. Therefore, the CSR surrogates
was significantly contributor to the prediction of Nigeria listed companies’ performance as
surrogated by revenue-total asset.
In addition, the output in Table-7 indicated that the beta (𝛽) weights of estimates of
the strengths of the causation. The entire CSR surrogates shown to contribute differentially to
revenue-total asset of Nigeria listed companies; CSR surrogates had contributed negatively to
the variation in revenue-total asset which was statistically significant to listed companies’
performance, SEW𝛽 = −5.61739E − 10(𝑡 = −4.098737625, 𝑝 = 6.73958E − 05). On the
basis of the analysis we reject the null hypothesis (H0) and accept the alternate hypothesis
(Ha) and conclude that its contribution to the prediction of the explained variable is
statistically significant to listed industrial and consumer goods Nigerian companies’
performance surrogated by revenue-total asset.
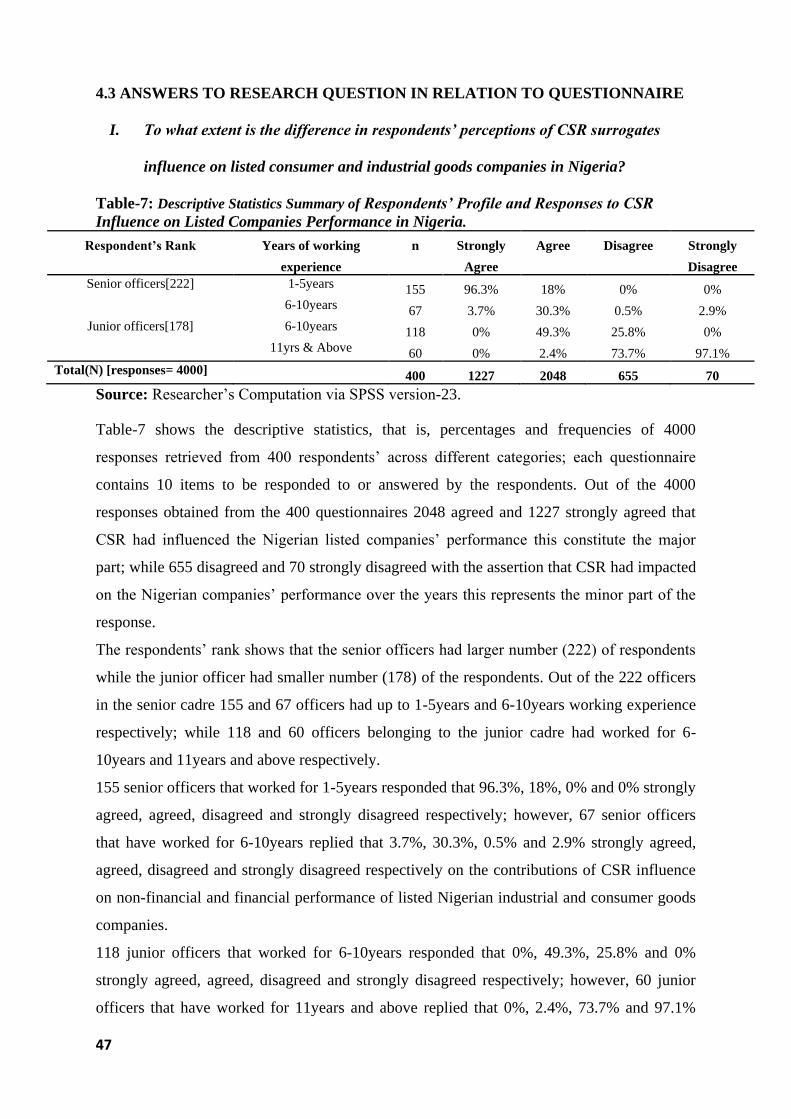
47
4.3 ANSWERS TO RESEARCH QUESTION IN RELATION TO QUESTIONNAIRE
I. To what extent is the difference in respondents’ perceptions of CSR surrogates
influence on listed consumer and industrial goods companies in Nigeria?
Table-7: Descriptive Statistics Summary of Respondents’ Profile and Responses to CSR
Influence on Listed Companies Performance in Nigeria.
Respondent’s Rank Years of working
experience
n Strongly
Agree
Agree Disagree Strongly
Disagree
Senior officers[222] 1-5years 155 96.3% 18% 0% 0%
6-10years 67 3.7% 30.3% 0.5% 2.9%
Junior officers[178] 6-10years 118 0% 49.3% 25.8% 0%
11yrs & Above 60 0% 2.4% 73.7% 97.1%
Total(N) [responses= 4000] 400 1227 2048 655 70
Source: Researcher’s Computation via SPSS version-23.
Table-7 shows the descriptive statistics, that is, percentages and frequencies of 4000
responses retrieved from 400 respondents’ across different categories; each questionnaire
contains 10 items to be responded to or answered by the respondents. Out of the 4000
responses obtained from the 400 questionnaires 2048 agreed and 1227 strongly agreed that
CSR had influenced the Nigerian listed companies’ performance this constitute the major
part; while 655 disagreed and 70 strongly disagreed with the assertion that CSR had impacted
on the Nigerian companies’ performance over the years this represents the minor part of the
response.
The respondents’ rank shows that the senior officers had larger number (222) of respondents
while the junior officer had smaller number (178) of the respondents. Out of the 222 officers
in the senior cadre 155 and 67 officers had up to 1-5years and 6-10years working experience
respectively; while 118 and 60 officers belonging to the junior cadre had worked for 6-
10years and 11years and above respectively.
155 senior officers that worked for 1-5years responded that 96.3%, 18%, 0% and 0% strongly
agreed, agreed, disagreed and strongly disagreed respectively; however, 67 senior officers
that have worked for 6-10years replied that 3.7%, 30.3%, 0.5% and 2.9% strongly agreed,
agreed, disagreed and strongly disagreed respectively on the contributions of CSR influence
on non-financial and financial performance of listed Nigerian industrial and consumer goods
companies.
118 junior officers that worked for 6-10years responded that 0%, 49.3%, 25.8% and 0%
strongly agreed, agreed, disagreed and strongly disagreed respectively; however, 60 junior
officers that have worked for 11years and above replied that 0%, 2.4%, 73.7% and 97.1%

48
strongly agreed, agreed, disagreed and strongly disagreed respectively on the contributions of
CSR influence on non-financial and financial performance of listed Nigerian industrial and
consumer goods companies. This had been illustrated or depicted with the aid of 3-dimension
simple bar-chart in Figure-1. Can we conclude that there is difference in the responses of the
senior and junior cadres officers across the different categories. This leads us to test of
hypothesis.
Figure-1: 3-Dimension Simple Bar-charts of Respondents’ Profiles and Responses to
Corporate Social Responsibility (CSR) Influence on Listed Companies Performance in
Nigeria
Source: Researcher’s Design via Microsoft Excel, 2010.
4.4. ANALYSIS OF QUESTIONNAIRE
QUESTION 1
Table-8: Provision of local staff for residents of host community will help organizations balance
the demand between the legal, social and ethical aspects of CSR.
Options/Responses Frequency Percent (%)
strongly disagree 6 1.5
Disagree 24 6.0
Senior officers[1-5yrs] [222]
Senior officers [6-10yrs]
Junior officers[6-10yrs][178]
Junior officers[11yrs & Above]Total(N) [responses= 4000]
0
500
1000
1500
2000
2500 Senior officers[1-5yrs] [222]
Senior officers [6-10yrs]
Junior officers[6-10yrs][178]
Junior officers[11yrs & Above]
Total(N) [responses= 4000]

49
Agree 208 52.0
strongly agree 162 40.5
Total 400 100.0
Source: Researcher’s Computation via Microsoft Excel, 2010
ANALYSIS OF QUESTION 1
Table-8 shows the descriptive statistics, that is, percentages and frequencies of 400
respondents across different categories; Out of the 400 responses, 162 (40.5%) strongly
agreed and 208 (52%) agreed that provision of local stalls for residents of host community had
helped organizations to balance the demand between the legal, social and ethical aspects of CSR;
while 24 (6%) disagreed and 6 (1.5%) strongly disagreed with the assertion that provision of
local stalls for residents of host community had helped organizations to balance the demand between
the legal, social and ethical aspects of CSR; this represents the minor part of the responses. This
had been illustrated or depicted with the aid of 3-dimension simple bar-chart in Figure-1. Can
we conclude that there is difference in the responses across the different categories? This will
leads us to test of hypothesis.
Figure-2: 3-Dimension Simple Bar-charts of Provision of local staffs for residents of host
community will help organizations balance the demand between the legal, social and ethical
aspects of CSR.
Source: Researcher’s Design via Microsoft Excel, 2010.
0
50
100
150
200
250
300
350
400
stronglydisagree
disagree agree stronglyagree
Total
Frequency
Percent (%)

50
QUESTION 2
Table-9: Provision of pipe-borne water for residents of host community will help organizations
gain tax incentives from the government.
Options/Responses Frequency Percent (%)
strongly disagree 4 1.0
disagree 87 21.8
Agree 207 51.8
strongly agree 102 25.5
Total 400 100.0
Source: Researcher’s Computation via Microsoft Excel, 2010
ANALYSIS OF QUESTION 2
Table-9 shows the descriptive statistics, that is, percentages and frequencies of 400
respondents across different categories; Out of the 400 responses, 102 (25.5%) strongly
agreed and 207 (52%) agreed that provision of pipe-borne water for residents of host community
had helped organizations gain tax incentives from the government.; while 87 (21.8%) disagreed
and 4 (1%) strongly disagreed with the assertion that provision of pipe-borne water for residents
of host community had helped organizations gain tax incentives from the government; in summary
the responses indicated that the respondents concurred with the assertion. The 3-dimension
simple bar-chart in Figure-2 gives full details. Can we infer that there is difference in the
responses across the different categories? This will prompts us to test of hypothesis.
Figure-2: 3-Dimension Simple Bar-charts of Provision of pipe-borne water for residents of host
community will help organizations gain tax incentives from the government.

51
Source: Researcher’s Design via Microsoft Excel, 2010.
QUESTION 3
Table-10: Environmental preservation and restoration (preventing oil spillage) will reduce
the demand of the host community and therefore lead to organizational survival.
Options / Responses Frequency Percent (%)
strongly disagree 12 3.0
disagree 82 20.5
Agree 214 53.5
strongly agree 92 23.0
Total 400 100.0
Source: Researcher’s Computation via Microsoft Excel, 2010
ANALYSIS OF QUESTION 3
Table-10 shows the descriptive statistics, that is, percentages and frequencies of 400
respondents across different categories; Out of the 400 responses, 92 (23%) strongly agreed
and 214 (53.5%) agreed that environmental preservation and restoration (preventing oil
spillage) will reduce the demand of the host community and therefore lead to organizational
survival; while 82 (20.5%) disagreed and 12 (3%) strongly disagreed with the assertion that
0
50
100
150
200
250
300
350
400
stronglydisagree
disagree agree stronglyagree
Total
Frequency
Percent (%)

52
environmental preservation and restoration (preventing oil spillage) will reduce the demand
of the host community and therefore lead to organizational survival; this represents the
minority part of the responses. This had been depicted with the aid of 3-dimension simple
bar-chart in Figure-3. Can we conclude that there is difference in the responses across the
different categories? This will leads us to test of hypothesis.
Figure-3: 3-Dimension Simple Bar-charts of Respondents’ Responses to Environmental
preservation and restoration (preventing oil spillage) will reduce the demand of the host
community and therefore lead to organizational survival.
Source: Researcher’s Design via Microsoft Excel, 2010.
QUESTION 4
Table-11: The motive of companies is not to achieve financial objectives alone but other non-
financial objectives (employee & customer satisfaction) of the company.
Options/ Responses Frequency Percent (%)
strongly disagree 14 3.5
Disagree 76 19.0
Agree 117 29.3
strongly agree 193 48.3
0
50
100
150
200
250
300
350
400
stronglydisagree
disagree agree stronglyagree
Total
Frequency
Percent (%)

53
Total 400 100.0
Source: Researcher’s Computation via Microsoft Excel, 2010
ANALYSIS OF QUESTION 4
Table-11 shows the descriptive statistics, that is, percentages and frequencies of 400
respondents across different categories; Out of the 400 responses, 162 (40.5%) strongly
agreed and 208 (52%) agreed that provision of local stalls for residents of host community had
helped organizations to balance the demand between the legal, social and ethical aspects of CSR;
while 24 (6%) disagreed and 6 (1.5%) strongly disagreed with the assertion that provision of
local stalls for residents of host community had not helped organizations to balance the demand
between the legal, social and ethical aspects of CSR; this represents the minor part of the
responses. This had been illustrated or depicted with the aid of 3-dimension simple bar-chart
in Figure-4. Can we conclude that there is difference in the responses across the different
categories? This will leads us to test of hypothesis.
Figure-4: 3-Dimension Simple Bar-charts of Respondents’ Responses to The motive of
companies are not to achieve financial objectives alone but other non-financial objectives
(employee & customer satisfaction) of the company.
Source: Researcher’s Design via Microsoft Excel, 2010.
0
50
100
150
200
250
300
350
400
stronglydisagree
disagree agree stronglyagree
Total
Frequency
Percent (%)

54
QUESTION 5
Table-12: Provision of public goods (street light, parks) will help organizations balance the demand
between the economic and government’s policy.
Options /Responses Frequency Percent (%)
strongly disagree 8 2.0
disagree 62 15.5
Agree 241 60.3
strongly agree 89 22.3
Total 400 100.0
Source: Researcher’s Computation via Microsoft Excel, 2010
ANALYSIS OF QUESTION 5
Table-12 shows the descriptive statistics, that is, percentages and frequencies of 400
respondents across different categories; Out of the 400 responses, 89 (22.3%) strongly agreed
and 241 (60.3%) agreed that Provision of public goods (street light, parks) will help organizations
balance the demand between the economic and government’s policy while 62 (15.5%) disagreed
and 8 (2%) strongly disagreed with the assertion that Provision of public goods (street light,
parks) will help organizations balance the demand between the economic and government’s policy;
this represents the minor part of the respondents. This had been illustrated with the aid of 3-
dimension simple bar-chart in Figure-5. Can we conclude that there is difference in the
responses across the different categories? This will leads us to test of hypothesis.
Figure-5: 3-Dimension Simple Bar-charts of Respondents’ Responses to Corporate
Provision of public goods (street light, parks) will help organizations balance the demand between
the economic and government’s policy.
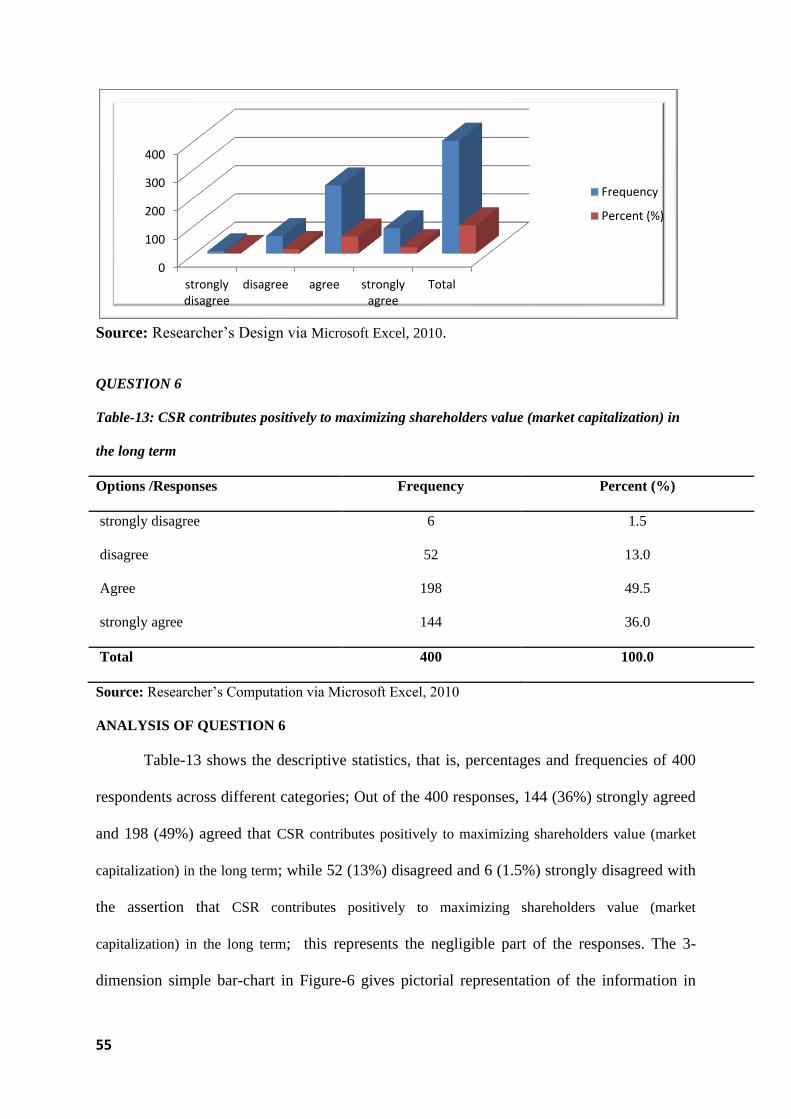
55
Source: Researcher’s Design via Microsoft Excel, 2010.
QUESTION 6
Table-13: CSR contributes positively to maximizing shareholders value (market capitalization) in
the long term
Options /Responses Frequency Percent (%)
strongly disagree 6 1.5
disagree 52 13.0
Agree 198 49.5
strongly agree 144 36.0
Total 400 100.0
Source: Researcher’s Computation via Microsoft Excel, 2010
ANALYSIS OF QUESTION 6
Table-13 shows the descriptive statistics, that is, percentages and frequencies of 400
respondents across different categories; Out of the 400 responses, 144 (36%) strongly agreed
and 198 (49%) agreed that CSR contributes positively to maximizing shareholders value (market
capitalization) in the long term; while 52 (13%) disagreed and 6 (1.5%) strongly disagreed with
the assertion that CSR contributes positively to maximizing shareholders value (market
capitalization) in the long term; this represents the negligible part of the responses. The 3-
dimension simple bar-chart in Figure-6 gives pictorial representation of the information in
0
100
200
300
400
stronglydisagree
disagree agree stronglyagree
Total
Frequency
Percent (%)

56
Table-6. Can we conclude that there is difference in the responses across the different
categories. This will leads us to test of hypothesis.
Figure-6: 3-Dimension Simple Bar-charts of Respondents’ Responses to Corporate Social
Responsibility (CSR) Influence on Listed Companies Performance in Nigeria.
Source: Researcher’s Design via Microsoft Excel, 2010.
QUESTION 7
Table-14: Sustainability helps their companies build strong reputation (goodwill)
Options / Responses Frequency Percent (%)
strongly disagree 0 0
Disagree 43 10.8
Agree 231 57.8
strongly agree 126 31.5
Total 400 100.0
Source: Researcher’s Computation via Microsoft Excel, 2010
ANALYSIS OF QUESTION 7
0
100
200
300
400
stronglydisagree
disagree agree stronglyagree
Total
Frequency
Percent (%)

57
Table-14 shows the descriptive statistics, that is, percentages and frequencies of 400
respondents across different categories; Out of the 400 responses, 126 (31.5%) strongly
agreed and 231 (57.8%) agreed that sustainability helps their companies build strong reputation
(goodwill); while 43 (10.8%) disagreed and 0 (0%) strongly disagreed with the statement that
sustainability helps their companies build strong reputation (goodwill); this represents the minor
part of the responses. This had been illustrated or depicted with the aid of 3-dimension simple
bar-chart in Figure-7. Can we conclude that there is difference in the responses across the
different categories? This will lead us to test of hypothesis.
Figure-7: 3-Dimension Simple Bar-charts of Respondents’ Responses to Sustainability helps
their companies build strong reputation (goodwill).
Source: Researcher’s Design via Microsoft Excel, 2010.
QUESTION 8
Table-15: Satisfaction of broader set of societal expectation (corporate honesty and integrity) will
maximise shareholders’ wealth
Options / Responses Frequency Percent (%)
strongly disagree 4 1.0
Disagree 72 18.0
Agree 196 49.0
strongly agree 128 32.0
0
200
400
Frequency
Percent (%)
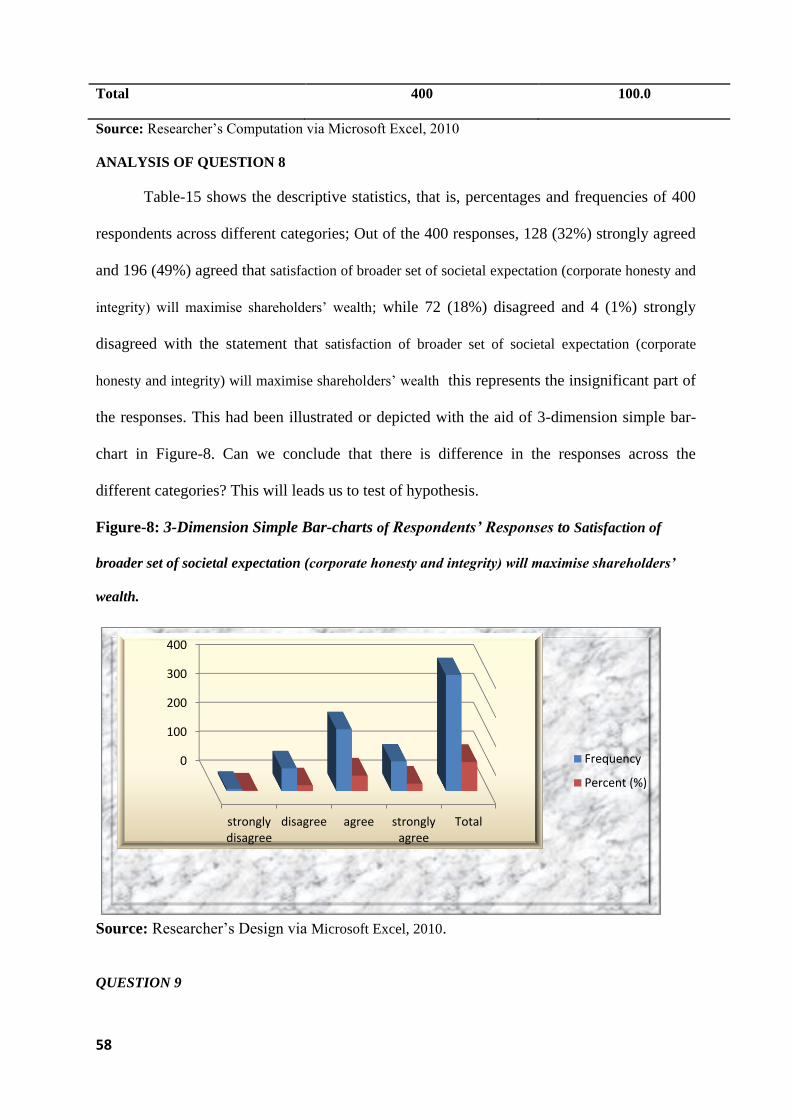
58
Total 400 100.0
Source: Researcher’s Computation via Microsoft Excel, 2010
ANALYSIS OF QUESTION 8
Table-15 shows the descriptive statistics, that is, percentages and frequencies of 400
respondents across different categories; Out of the 400 responses, 128 (32%) strongly agreed
and 196 (49%) agreed that satisfaction of broader set of societal expectation (corporate honesty and
integrity) will maximise shareholders’ wealth; while 72 (18%) disagreed and 4 (1%) strongly
disagreed with the statement that satisfaction of broader set of societal expectation (corporate
honesty and integrity) will maximise shareholders’ wealth this represents the insignificant part of
the responses. This had been illustrated or depicted with the aid of 3-dimension simple bar-
chart in Figure-8. Can we conclude that there is difference in the responses across the
different categories? This will leads us to test of hypothesis.
Figure-8: 3-Dimension Simple Bar-charts of Respondents’ Responses to Satisfaction of
broader set of societal expectation (corporate honesty and integrity) will maximise shareholders’
wealth.
Source: Researcher’s Design via Microsoft Excel, 2010.
QUESTION 9
0
100
200
300
400
stronglydisagree
disagree agree stronglyagree
Total
Frequency
Percent (%)

59
Table-16: Investment in and reduction in green-house emission will increase the firm’s market
share
Options /Responses Frequency Percent (%)
strongly disagree 7 1.8
Disagree 78 19.5
Agree 213 53.3
strongly agree 102 25.5
Total 400 100.0
Source: Researcher’s Computation via Microsoft Excel, 2010
ANALYSIS OF QUESTION 9
Table-16 shows the descriptive statistics, that is, percentages and frequencies of 400
respondents across different categories; Out of the 400 responses, 102 (25.5%) strongly
agreed and 213 (53.3%) agreed that investment in and reduction in green-house emission will
increase the firm’s market share; while 78 (19.5%) disagreed and 7 (1.8%) strongly disagreed
with the assertion that investment in and reduction in green-house emission will increase the
firm’s market share; this represents the inconsequential part of the responses. This had been
illustrated or depicted with the aid of 3-dimension simple bar-chart in Figure-9. Can we
conclude that there is difference in the responses across the different categories? This will
leads us to test of hypothesis.
Figure-9: 3-Dimension Simple Bar-charts of Respondents’ Responses to Investment in and
reduction in green-house emission will increase the firm’s market share.
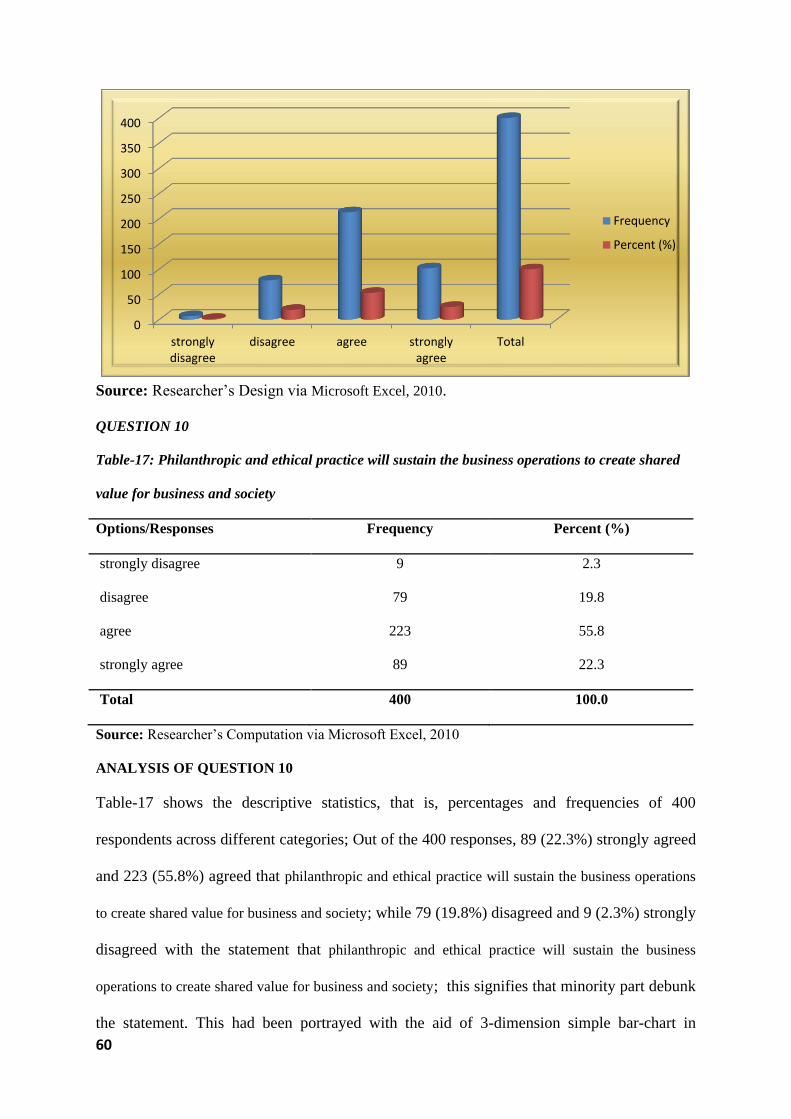
60
Source: Researcher’s Design via Microsoft Excel, 2010.
QUESTION 10
Table-17: Philanthropic and ethical practice will sustain the business operations to create shared
value for business and society
Options/Responses Frequency Percent (%)
strongly disagree 9 2.3
disagree 79 19.8
agree 223 55.8
strongly agree 89 22.3
Total 400 100.0
Source: Researcher’s Computation via Microsoft Excel, 2010
ANALYSIS OF QUESTION 10
Table-17 shows the descriptive statistics, that is, percentages and frequencies of 400
respondents across different categories; Out of the 400 responses, 89 (22.3%) strongly agreed
and 223 (55.8%) agreed that philanthropic and ethical practice will sustain the business operations
to create shared value for business and society; while 79 (19.8%) disagreed and 9 (2.3%) strongly
disagreed with the statement that philanthropic and ethical practice will sustain the business
operations to create shared value for business and society; this signifies that minority part debunk
the statement. This had been portrayed with the aid of 3-dimension simple bar-chart in
0
50
100
150
200
250
300
350
400
stronglydisagree
disagree agree stronglyagree
Total
Frequency
Percent (%)

61
Figure-10. Can we conclude that there is difference in the responses across the different
categories? This will leads us to test of hypothesis.
Figure-10: 3-Dimension Simple Bar-charts of Respondents’ Responses to Philanthropic and
ethical practice will sustain the business operations to create shared value for business and society.
Source: Researcher’s Design via Microsoft Excel, 2010.
Table-18: Descriptive Statistics Summary of Respondents’ Mean Ranks Responses to CSR
Influence on Listed Companies Performance in Nigeria.
0
50
100
150
200
250
300
350
400
stronglydisagree
disagree agree stronglyagree
Total
Frequency
Percent (%)
S/N Descriptions of Responses Mean Rank
S1
Provision of local stalls for residents of host community will help organizations balance the
demand between the legal, social and ethical aspects of CSR.
6.53
S2
Provision of pipe-borne water for residents of host community will help organizations gain
tax incentives from the government.
5.05
S3
Environmental preservation and restoration (preventing oil spillage) will reduce the demand
of the host community and therefore lead to organizational survival.
4.78
S4
The motive of companies is not to achieve financial objectives alone but other non-financial
objectives(employee & customer satisfaction) of the company also
6.07
S5
Provision of public goods (street light, parks) will help organizations balance the demand
between the economic and government’s policy.
5.10
S6 CSR contributes positively to maximizing shareholders value (market capitalization) in the 5.96
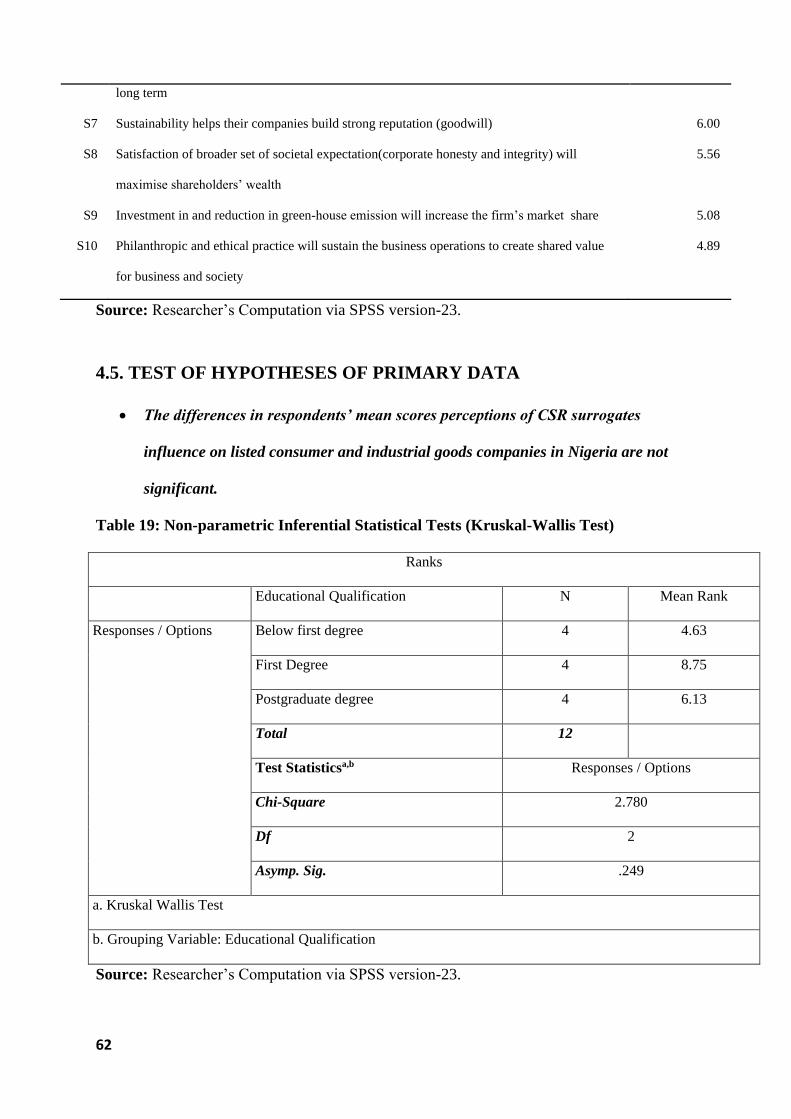
62
Source: Researcher’s Computation via SPSS version-23.
4.5. TEST OF HYPOTHESES OF PRIMARY DATA
• The differences in respondents’ mean scores perceptions of CSR surrogates
influence on listed consumer and industrial goods companies in Nigeria are not
significant.
Table 19: Non-parametric Inferential Statistical Tests (Kruskal-Wallis Test)
Ranks
Educational Qualification N Mean Rank
Responses / Options Below first degree 4 4.63
First Degree 4 8.75
Postgraduate degree 4 6.13
Total 12
Test Statisticsa,b Responses / Options
Chi-Square 2.780
Df 2
Asymp. Sig. .249
a. Kruskal Wallis Test
b. Grouping Variable: Educational Qualification
Source: Researcher’s Computation via SPSS version-23.
long term
S7 Sustainability helps their companies build strong reputation (goodwill) 6.00
S8
Satisfaction of broader set of societal expectation(corporate honesty and integrity) will
maximise shareholders’ wealth
5.56
S9 Investment in and reduction in green-house emission will increase the firm’s market share 5.08
S10
Philanthropic and ethical practice will sustain the business operations to create shared value
for business and society
4.89

63
Table-19 shows a Kruskal-Wallis H inferential statistic test, the test showed that there
was no statistically significant difference in mean ranks perceptions of CSR surrogates
influence on listed consumer and industrial goods companies performance in Nigeria across
different respondents’ groups, χ2(2) = 2.780, p = .249, with a mean rank perceptions score of
4.63 for Below First Degree, 8.75 for First Degree and 6.13 for Postgraduate Degree.
Therefore, we accept the null hypothesis (H0) and reject the alternate hypothesis (Ha) and
conclude that the difference in respondents’ scores perceptions of CSR surrogates influence
on listed consumer and industrial goods companies in Nigeria is not significant.
4.6 DISCUSSION OF FINDINGS
The outcome of model shows that there an insignificant relationship existing between social
economic welfare donation and the tax income of the companies for the period under study,
as shown in Table 18. This finding is consistent with the findings of Ojo (2010), as the study
also revealed that CSR proxy had an adverse relationship with gross profit margin. Also
(Amidu et al, 2017) study discovered that in the short run,
CSRdisc has a negative impact on corporate financial performance for few industries;
implying that no economic benefit is generated by CSR in the short term. Sukanya et al,
(2015) discovered that CSR and ROA as negatively correlated.
Hypothesis two revealed that educational and health donation cost had contributed positively
to the variation in gross-profit margin which was statistically significant to listed companies’
performance, as evidenced in Table 19. This is in line with the study conducted by Xiping et
al,(2014), as results revealed that all levels of CSR activities showed a significant relationship
with corporate financial productivity. The studies of Muhammad et al, (2017); Ibrahim &
Garba, (2015) also revealed that CSR has a positive impact and relationship on ROA, ROE
and EPS, therefore there exists a positive correlation between CSR and CFP.

64
In hypothesis three, the alternate hypothesis was accepted (Ha) and the null hypothesis
rejected as analyses showed that the contribution of CSR surrogates on revenue-total asset
ratio (RETA) is statistically significant to listed industrial and consumer goods Nigerian
companies. This is in tandem to the discovery of Bala and Abdulrazaq, (2018), as their
findings revealed that Bank size, Liquidity and Firm Age have a positive and significant
effect and relationship with ROA and ROCE; however, no significant variation was seen
between CSR and EPS.
Finally, as shown in Table 19, the difference in respondents’ scores perceptions of CSR
surrogates influence on listed consumer and industrial goods companies in Nigeria is not
significant, as there exist no statistically significant difference in mean ranks perceptions of
CSR surrogates influence on the sample size of the study. Bikon. Et al, (2017) discovered in
their study that corporate giving has a negative and insignificant effect and relationship with
financial performance. Also, green house emission showed a positive but statistical
insignificant impact on ROA.

65
CHAPTER FIVE
SUMMARY OF FINDINGS, CONCLUSION AND RECOMMENDATION
5.1 SUMMARY OF FINDINGS
This research was carried out to ascertain the Impact of Corporate Social Responsibility
(CSR) on Financial Performance of selected consumer and Industrial goods Companies in
Nigeria.
From the study, it was specifically revealed that;
1. The regression results showed that Socio-economic Welfare Donation had
contributed insignificantly to the prediction of Tax-Income, (F (1, 152) =3.595, R2=
.023; P=6.8E-20), Table 4 showed the nature of the negative statistically insignificant
impact as SEW=-3.20028E-11(t=-1.896,p=.00598). These values are lower when
compared with alpha level (level of significance for the statistic) 0.05. Hence, Ho is
accepted. It therefore found that the effect of socio-economic welfare cost on tax-
income of listed consumer and industrial goods companies in the Nigeria is not
significant at 5% level of significance.
2. The regression results showed that educational and health donation had contributed
significantly to the prediction of gross-profit margin (F (1, 152) =35.808, R2= .023;
P=1.5E-8, Table 5 shows that P = 1.50>0.05. These values are greater when compared
with alpha level (level of significance for the statistic) 0.05. Hence, Ha is accepted.
Therefore the study found that educational and health donation has a positive and
statistically significant effect on GPM of listed consumer and industrial goods
companies in the Nigeria at 5% level of significance.
3. The regression results from Table 6 showed that CSR surrogates had contributed
significantly to the prediction of revenue-total asset (F (1, 152) =16.8, R2= .0995;
P=6.73958E-05). Also, it had contributed negatively to the variation in revenue-total
asset which was statistically significant to listed companies’ performance, SEW=-

66
5.61739E-10(t=-4.098737625,p=6.73958E-05). Therefore, the study rejects the null
hypothesis (H0) and accepts the alternate hypothesis (Ha) and concludes that CSR
surrogates have a negative and statistically significant effect on the financial
performance of listed consumer and industrial goods companies in the Nigeria.
4. The results from Table-19 showing Kruskal-Wallis H inferential statistic test
revealed that there was no statistically significant difference in mean ranks
perceptions of CSR surrogates influence on companies performance across different
respondents’ groups, χ2(2) = 2.780, p = .249, with a mean rank perceptions score of
4.63 for Below First Degree, 8.75 for First Degree and 6.13 for Postgraduate Degree.
The study therefore accept the null hypothesis (H0) and reject the alternate hypothesis
(Ha) and conclude that the difference in respondents’ scores perceptions of CSR
surrogates influence on listed consumer and industrial goods companies in Nigeria is
not significant.
5.2 CONCLUSION
The importance of Companies engaging in corporate social activities cannot be overstressed,
as they ought to give back to the society that ensures that their operations thrive in the
environment in which the company is situated. CSR activities cum costs includes, but not
limited to the variables used in this study, therefore companies should study the society and
decide on the most appropriate social responsible activities to incur taking into account its
operations too. This study was carried out to determine the Impact of Corporate Social
Responsibility (CSR) on Financial Performance of selected Consumer and Industrial goods
Companies in Nigeria.The results of the study also support both theoretical and empirical
evidence of prior studies that showed significant effect of CSR on the financial performance
of Companies in Nigeria and in other Countries.

67
5.3 RECOMMENDATION
1. Companies should engage in socially responsible activities, as it serves as a means of
giving back to the society for providing a conducive environment for their business
operations. It should be form part of their mission statement and backed up by proper
budgeting.
2. Companies should ensure that socially responsible activities that have an impact on
their financial performance be continued and those that impacts negatively or have no
impact at all be stopped.
3. To ensure that a good relationship exist between companies and their host
communities, CSR should be carried out yearly.
4. It is pertinent that standards to measure the level of CSR disclosure and performance
be developed by policy makers.
5.4 SUGGESTION FOR FURTHER RESEARCH
This study has provided empirical evidence on the Impact of Corporate Social Responsibility
(CSR) on Financial Performance of selected consumer and Industrial goods Companies in
Nigeria. It is, therefore suggested that further research on the impact of other corporate social
responsible activities on the financial performance of companies be carried out. Also,
researchers can carry out this same study on other sectors of the Nigerian economy.

68
REFERENCES
Adeniyi, A. A. (2011).An insight into: Management accounting (5th ed.). 13/15 Alafia Street, Mushin,
Lagos: El-TODA Venture Limited.
Amaeshi, K, Adi, B, Ogbechie, C & Amao, O. (2006) ”Corporate Social Responsibility in
Nigeria: Western Mimicry or Indigenous Influences?”. No. 39-2006, ICCSR Research Paper
Series –ISSN 1479 – 5124, The University of Nottingham, pp. 4,17, 25.
Amaeshi, K.M., Adi, A.B.C., Ogbechie, C. and Amao, O.O. (2006), “Corporate Social
Responsibility in Nigeria western mimicry of Indigenous Influences”, Journal of Corporate
Citizenship, Vol. 24, pp. 83-99
Aupperle, K. E., Carroll, A. B. & Hatfield, J. D. (1985). “An empirical examination of
the relationship between Corporate social Responsibility and Profitability”
Amidu P. Mansaray1*, Liu Yuanyuan2, Sesay Brima,’ (2017) The Impact of Corporate Social
Responsibility Disclosure on Financial Performance of Firms in Africa’. International Journal
of Economics and Financial Issues
Babalola, Y. A. (2012).The impact of corporate social responsibility on firms’ profitability in
Nigeria. European Journal of Economics, Finance and Administrative Sciences, 45, 39-50
Bhattacharya, C. B., Sen, S. & Korschun, D. (2008). Using corporate social responsibility to
win the war for talent. MIT Sloan Management Review, Rwprint 49215, 37-44.
Blowfield, M., & Murray, M. A. (2014). Corporate responsibility. Oxford: Oxford University
Press.
Bowman, E. H. & Haire, M. (1975). “A strategic posture toward corporate social
responsibility”, California Management Review, 18(2), 49-58.
Brower, J., & Mahajan, V. (2013). Driven to be good: A stakeholder theory perspective on
the drivers of corporate social performance. Journal of Business Ethics, 117(2), 313-
331.
Burton, B. K. & Goldsby, M. (2009). Corporate social responsibility orientation, goals, and
behavior: A study of small business owners. Business & Society,48(1), 88-104.
Bushra, K. & Rabia, T. (2017).Corporate social responsibility impact on financial
performance of Islamic and conventional banks: Evidence from Asian countries.
Research Journal of Finance and Accounting, 8(7),20-28
Carroll, Archie B., A Three-Dimensional Conceptual Model of Corporate Performance, The
Academy of Management Review, Vol. 4, No. 4, pg. 497 – 505, Academy of Management,
New York, USA, 1979
Ditlev-Simonsen, C. & Midttun, A. (2011).What motivates managers to pursue corporate
social responsibility (CSR) Corporate Social Responsibility and Environmental
Management,18, 25–38.doi: 10.1002/csr.237

69
Doh, J. P. & Guay, T. R. (2006).Corporate social responsibility, public policy, and NGO
activism in Europe and the United States: An institutional-stakeholder perspective. Journal of
Management Studies: 47-73.
Elkington, J. (2001). The Chrysalis Economy. Capstone Publishing Ltd., Oxford, UK.
Emery, F. E. & Trist, E. L. (1965). The causual texture of organizational environments.
Human Relations,18(1),21-32.
Freeman, R. E. (1984). Stakeholder management: Framework and philosophy. Pitman,
Mansfield, MA.
Freeman, R. E.: 1994, ‘The Politics of Stakeholder Theory: Some Future Directions’,
Business Ethics Quarterly 4(4), 409–421.
Friedman, M.: 1970, ‘The Social Responsibility of Business is to Increase Its Profits’, New
York Times, 13 September 1970, pp. 122–126
Gioia, D. A.: 1999, ‘Practicability, Paradigms, and Problems in Stakeholder Theorizing’,
Academy of Management Review 24(2), 228–232.
Govindarajan, V. L. & Amilan, S. (2013), An influence of CSR initiatives with financial
performance: Evidence from petrogas products industry in India. Academicia: An
International Multidisciplinary Research Journal, 3(8), 1-27.
Gujarati D. N., Porter C. D., & Gunasekar, S. (2012). Basic Econometrics (5th ed.). New
Delhi, Tata McGraw-Hill Education Private Limited.
Hirigoyen, G. & Poulain-Rehm, T. (2014), Relationships between corporate social
responsibility and financial performance: What is the causality? Journal of Business &
Management, 4(1), 18-43.
Hoeffler, S., Bloom, P. N., & Keller, K. L. (2010). Understanding stakeholder responses to
corporate citizenship initiatives: Managerial guidelines and research directions.
Journal of Public Policy & Marketing, 29(1), 78-88.
Ibrahim Magaji Barde, and Garba Tela Corporate Social Responsibility and Financial
Performance in the Nigerian Construction Industry. International Conference on Humanities,
Literature and Management (ICHLM'15) Jan. 9-10, 2015 Dubai (UAE).
Jenkins, R., 2004. Globalization, corporate social responsibility and poverty. International
Affairs, 81(3): 525–540.
Jensen, M. C. (2001).Value maximization, stakeholder theory, and the corporate objective
function.
European Financial Management, 7(3), 297-317.
Jie, C. T. & Hasan, N. A. M. (2016), Determinants of corporate social responsibility (CSR)
and intrinsic job motivation: A case of Malaysian banking company. Malaysian
Journal of Social Sciences and Humanities, 1 (2), 25-35.
70
L. Preston and J. Post (eds.), Private Management and Public Policy-Englewood Cliffs,
(1975), New Jersey Prentice Hall.
Lee, M. P. (2008). Review of the theories of corporate social responsibility: Its evolutionary
path and the road ahead. International Journal of Management Reviews, 10,1, 53-73.
Mahajan, P. (May, 2011). Corporate Social Responsibility: A new wave of corporate
governance
Maron, I. Y.: 2006, ‘Toward a Unified Theory of the CSP– CFP Link’, Journal of Business
Ethics 67(2), 191–200.
McWilliams, A., and Siegel, D. (2001). Corporate social responsibility: a theory of the firm
perspective, Academy of Management Review. Vol. 26 (1), pp. 117-127.
Mishra, S. & Suar D., (2010).Does corporate social responsibility influence firm performance
of Indian companies Journal of Business Ethics, 95: 571–601.
Morsing, M. & Schultz, M. 2006. 'Corporate social responsibility communication:
stakeholder information, response and involvement strategies.' Business Ethics: A European
Review, 15:4, 323-38.
Mubeen Mujahid, Arooj Abdullah ‘Impact of Corporate Social Responsibility on Firms
Financial Performance and Shareholders wealth’. European Journal of Business and
Management ISSN 2222-1905 (Paper) ISSN 2222-2839 (Online) Vol.6, No.31, 2014
Muhammad, A. A., Ejaz, A., Javeria, T., & Mumhza, S. (2014).The effect of corporate social
responsibility on the firm’s financial performance. (Unpublished master’s
dissertation), Department of Finance, Master of Business Administration, University
of Gujrat, Pakistan
O.C. Ferrell and J. Fraedrich, Business Ethics: Ethical Decision Making, (1997).
Osisioma, B.C., Egbunike, P. A. & Jesuwunmi, C.A. (2015). Investigating the impact of
corporate governance on banks’ performance in Nigeria: A field experiment. International
Journal of Economics and Business Administration,1(2),98-112
Pandey, I. M. (2010). Financial management (10th ed.). New Delhi, India: VIKAS Publishing
House PVT Ltd.
Rabi’u, S., J., Asma’u, Y.D. & Musa M. B. (2016).Corporate social responsibility and
financialperformance of quoted deposit money banks in Nigeria. Research Journal of
Finance and Accounting, 7(13), 39-48
Robins, F. (2008). Why corporate social responsibility should be popularised but not
imposed. Corporate Governance,8(3), 330 - 41.
Ruf, B. M., Muralidhar, K., Brown, R. M., Janney, J. J., & Paul, K. (2001). An empirical
investigation of the relationship between change in corporate social performance and
financial performance: A stakeholder theory perspective. Journal of Business Ethics,
32(2), 143-156

71
Samira, I. R., Noor, N. B. & Masudul, Md. H. (2018).Impact of CSR on firm’s financial
performance: A study on some selected agribusiness industries of Bangladesh. American
Journal of Economics, Finance and Management, 4(3), 74-85
Sawar A, Islam Z, Hassan I; (2012) ‘Corporate Social Responsibility and Financial
Performance Linkage: Evidence from the Banking Sector of Bangladesh’. Journal of
Organizational Management
Sebastian Johansson, Anton Karlsson, Christian Hagberg (2015) The relationship between
CSR and financial performance -A quantitative study examining Swedish publicly traded
companies
Secchi, D. (2007). Utilitarian, managerial and relational theories of corporate social
responsibility. International Journal of Management Reviews, 9, 4, 347-373
Sukanya Chetty1, Rebekah Naidoo1, Yudhvir Seetharam (2015),’ The Impact of Corporate
Social Responsibility on Firms’ Financial Performance in South Africa’. University of the
Witwatersrand - School of Economic and Business Sciences, South Africa
Tabachnick, B. G. & Fidell, L. S. (2007). Using multivariate statistics (5th ed.). Boston, MA:
Allyn and Bacon.
Umoren, Adebimpe Otu, Isiavwe-Ogbari, Mercy Ejovwokeoghene, Atolagbe Tolulope
Morenike. Corporate Social Responsibility and Firm Performance: a study of listed firms in
nigeria. A paper to be presented at ICAN 2nd Annual International Academic Conference on
Accounting and Finance, at Lagos Airport Hotel, Ikeja on 18th to 20th May, 2016
Wang, H., Choi, J., & Li, J. 2008. Too little or too much? Untangling the relationship
between corporate philanthropy and firm financial performance. Organization Science, 19:
143–159.
Wartick, S. L., & Cochran, P. L. (1985). The evolution of the corporate social performance
model. Academy of Management Review, 10(4), 758-769.
Wenstøp, F. (2005). Mindsets, rationality and emotion in multi-criteria decision analysis.
Journal of Multi-Criteria Decision Analysis,13(4), 161-72.
Wood, D.: 2000, ‘Theory and Integrity in Business and Society’, Business and Society 39(4),
359–378.
Xiping Pan, Jinghua Sha, Hongliang Zhang, and Wenlan Ke (2014) Relationship between
Corporate Social Responsibility and Financial Performance in the Mineral Industry: Evidence
from Chinese Mineral Firms. ISSN 2071-1050
Yang, Fu-Ju, Lin, Ching-Wen & Chang, Yung-Ning (2009). “The linkage between
corporate social performance and corporate financial performance”, African Journal of
Business Management, 4(4), 406-413.
Yusoff, W. F. W. & Adamu, M. S. (2016).The relationship between corporate social
responsibility and financial performance: Evidence from Malaysia. International
Business Management, 10(4), 345-351

72
APPENDIX I
APPENDIX I
LETTER OF TRANSMITTAL
National College of Ireland, College of Business, MSCIB.
National College of Ireland
IFSC, Mayor Street. Dublin
Ireland,
5th July, 2019.
REQUEST FOR COMPLETION OF QUESTIONNAIRE
Dear Respondent
I am a Master of Science (M.Sc.) International Business of the College of Business,
National College of Ireland and conducting a research on The Impact of Corporate Social
Responsibility (CSR) on Financial Performance of Multi National Enterprises. Since your
organization has fallen within the study sample and because you have the required
information, you are being requested to answer the items of this questionnaire.
Before end, the researcher wishes to thank you for the data you provide and for the
time consumed in the process of questionnaire answering. Be assured of your anonymity as
the information you offer will be treated in strict confidence and used for this academic
purpose only.
Yours faithfully,
Adedeji Erinle

73
Appendix-II
QUESTIONNAIRE
SECTION A: Personal Information 1. Respondent’s rank: Senior officer Junior officer
2. Years of working experience:
1-5 6-10 11 & above
3. Educational Qualification: Below first degree First Degree Postgraduate degree
4. Business Activities: Manufacturing Non-manufacturing
Section B: The Impact of Corporate Social Responsibility (CSR) on Financial Performance of
Multi-National Enterprises
Key: SA = strongly agree; A = Agree; D = Disagree; SD = strongly disagree B The statement relate CSR and Nigerian listed companies’ financial
performance
SA
4
A
3
D
2
SD
1
1. Provision of local staffs for residents of host community will help
organizations balance the demand between the legal, social and ethical
aspects of CSR.
2. Provision of pipe-borne water for residents of host community will help
organizations gain tax incentives from the government.
3. Environmental preservation and restoration (preventing oil spillage) will
reduce the demand of the host community and therefore lead to
organizational survival.
4. The motive of companies is not to achieve financial objectives alone but
other non-financial objectives(employee & customer satisfaction) of the
company also
5. Provision of public goods (street light, parks) will help organizations
balance the demand between the economic and government’s policy.
6. CSR contributes positively to maximizing shareholders value (market
capitalization) in the long term
7. Sustainability helps their companies build strong reputation (goodwill)
8. Satisfaction of broader set of societal expectation(corporate honesty and
integrity) will maximise shareholders’ wealth
9. Investment in and reduction in green-house emission will increase the firm’s
market share
10. Philanthropic and ethical practice will sustain the business operations to
create shared value for business and society

74
APPENDIX
NPar Tests (Kruskal-Wallis Test)
Ranks
Educational Qualification N Mean Rank
Responses / Options Below first degree 4 4.63
First Degree 4 8.75
Postgraduate degree 4 6.13
Total 12
Test Statisticsa,b Responses / Options
Chi-Square 2.780
Df 2
Asymp. Sig. .249
a. Kruskal Wallis Test
b. Grouping Variable: Educational Qualification

75
Report
Respondent’s rank Years of working experience Strongly Agree Agree Disagree Strongly
Disagree
Senior officer
1-5years N 155 155 155 155
Sum 1182.00 368.00 .00 .00
% of Total Sum 96.3% 18.0% 0.0% 0.0%
Mean 7.6258 2.3742 .0000 .0000
6-10years N 67 67 67 67
Sum 45.00 620.00 3.00 2.00
% of Total Sum 3.7% 30.3% 0.5% 2.9%
Mean .6716 9.2537 .0448 .0299
Total N 222 222 222 222
Sum 1227.00 988.00 3.00 2.00
% of Total Sum 100.0% 48.2% 0.5% 2.9%
Mean 5.5270 4.4505 .0135 .0090
Junior officer 6-10years N 118 118 118 118
Sum .00 1011.00 169.00 .00
% of Total Sum 0.0% 49.4% 25.8% 0.0%
Mean .0000 8.5678 1.4322 .0000
11yrs & Above N 60 60 60 60
Sum .00 49.00 483.00 68.00
% of Total Sum 0.0% 2.4% 73.7% 97.1%
Mean .0000 .8167 8.0500 1.1333
Total N 178 178 178 178
Sum .00 1060.00 652.00 68.00
% of Total Sum 0.0% 51.8% 99.5% 97.1%
Mean .0000 5.9551 3.6629 .3820
Total N 400 400 400 400
Sum 1227.00 2048.00 655.00 70.00
% of Total Sum 100.0% 100.0% 100.0% 100.0%
Mean 3.0675 5.1200 1.6375 .1750
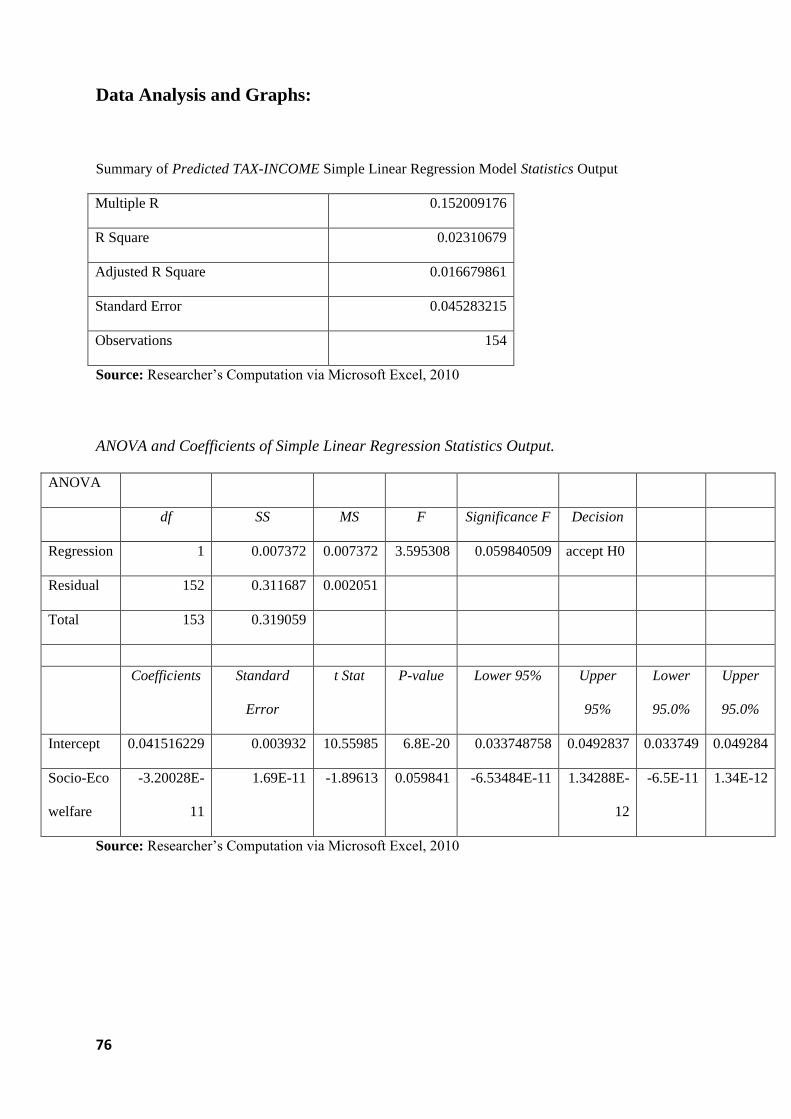
76
Data Analysis and Graphs:
Summary of Predicted TAX-INCOME Simple Linear Regression Model Statistics Output
Multiple R 0.152009176
R Square 0.02310679
Adjusted R Square 0.016679861
Standard Error 0.045283215
Observations 154
Source: Researcher’s Computation via Microsoft Excel, 2010
ANOVA and Coefficients of Simple Linear Regression Statistics Output.
ANOVA
df SS MS F Significance F Decision
Regression 1 0.007372 0.007372 3.595308 0.059840509 accept H0
Residual 152 0.311687 0.002051
Total 153 0.319059
Coefficients Standard
Error
t Stat P-value Lower 95% Upper
95%
Lower
95.0%
Upper
95.0%
Intercept 0.041516229 0.003932 10.55985 6.8E-20 0.033748758 0.0492837 0.033749 0.049284
Socio-Eco
welfare
-3.20028E-
11
1.69E-11 -1.89613 0.059841 -6.53484E-11 1.34288E-
12
-6.5E-11 1.34E-12
Source: Researcher’s Computation via Microsoft Excel, 2010

77
Summary of GPM Simple Linear Regression Model Statistics Output
Multiple R 0.43665107
R Square 0.190664157
Adjusted R Square 0.185339579
Standard Error 0.131522753
Observations 154
Source: Researcher’s Computation via Microsoft Excel, 2010
ANOVA and Coefficients of GPM Simple Linear Regression Statistics Output. ANOVA
df SS MS F Significance
F
Decision
-0.1
0
0.1
0.2
0.3
0.4
0 1E+09 2E+09
Re
sid
ual
s
SoE-welfare
SoE-welfare Residual Plot
-0.10000
0.00000
0.10000
0.20000
0.30000
0.40000
0 2E+09
TAX
-IN
CO
ME
SoE-welfare
SoE-welfare Line Fit Plot
TAX-INCOME
Predicted TAX-INCOME
-0.1
0
0.1
0.2
0.3
0.4
0 1E+09 2E+09
Re
sid
ual
s
SoE-welfare
SoE-welfare Residual Plot

78
Regression 1 0.619421 0.619421 35.80831 1.50213E-08 Accept Ha
Residual 152 2.629332 0.017298
Total 153 3.248752
Coefficients Standard
Error
t Stat P-value Lower 95% Upper 95% Lower
95.0%
Upper
95.0%
Intercept 0.293722778 0.011693 25.11956 5.64E-56 0.270621004 0.316824552 0.270621 0.316825
Edu
&health
1.98936E-09 3.32E-10 5.984005 1.5E-08 1.33255E-09 2.64617E-09 1.33E-09 2.65E-09
Source: Researcher’s Computation via Microsoft Excel, 2010
-0.4
-0.2
0
0.2
0.4
0 100000000 200000000 300000000Re
sid
ual
s
Edu&health
Edu&health Residual Plot
0.000
0.200
0.400
0.600
0.800
0 200000000 400000000
GP
M
Edu&health
Edu&health Line Fit Plot
GPM
Predicted GPM
0
0.2
0.4
0.6
0.8
0 20 40 60 80 100 120
GP
M
Sample Percentile
Normal Probability Plot

79
Summary of RETA Simple Linear Regression Statistics Model Output
Multiple R 0.315474563
R Square 0.0995242
Adjusted R Square 0.093600017
Standard Error 0.403306037
Observations 154
Source: Researcher’s Computation via Microsoft Excel, 2010
ANOVA and Coefficients of RETA Simple Linear Regression Statistics Output. ANOVA
df SS MS F Significance
F
Decision
Regression 1 2.732559852 2.732559852 16.79965012 6.73958E-05 accept Ha
Residual 152 24.72367547 0.16265576
Total 153 27.45623532
Coefficients Standard
Error
t Stat P-value Lower 95% Upper 95% Lower
95.0%
Upper
95.0%
Intercept 0.954734002 0.035346001 27.01108994 6.76585E-60 0.884901123 1.02456688 0.884901123 1.02456688
CSR(Don) -5.61739E-
10
1.37052E-10 -
4.098737625
6.73958E-05 -8.32512E-
10
-2.90967E-
10
-8.32512E-
10
-2.90967E-
10
Source: Researcher’s Computation via Microsoft Excel, 2010
0.0000
1.0000
2.0000
3.0000
0 1E+09 2E+09
RET
A
CSR(Donations)
CSR(Donations) Line Fit Plot
RETA
Predicted RETA
-1
0
1
2
0 1E+09 2E+09
Re
sid
ual
s
CSR(Donations)
CSR(Donations) Residual Plot

80
Summary of Income-Tax Simple Linear Regression Statistics Model Output
Multiple R 0.169503229
R Square 0.028731345
Adjusted R Square 0.022341419
Standard Error 0.045152666
Observations 154
Source: Researcher’s Computation via Microsoft Excel, 2010
0
1
2
3
0 20 40 60 80 100 120
RET
A
Sample Percentile
Normal Probability Plot

81
ANOVA and Coefficients of Income-Tax Simple Linear Regression Statistics Output. ANOVA
df SS MS F Significance
F
Decision
Regression 1 0.009166994 0.009166994 4.496350589 0.035590611 accept Ha
Residual 152 0.309892007 0.002038763
Total 153 0.319059001
Coefficients Standard
Error
t Stat P-value Lower 95% Upper 95% Lower
95.0%
Upper
95.0%
Intercept 0.042040698 0.003957209 10.62382651 4.59172E-20 0.034222465 0.049858931 0.034222 0.049859
CSR(Don) -3.2536E-11 1.53438E-11 -
2.120459995
0.035590611 -6.28507E-11 -2.22126E-
12
-6.3E-11 -2.2E-12
Source: Researcher’s Computation via Microsoft Excel, 2010
-0.1
0
0.1
0.2
0.3
0.4
0 1E+09 2E+09
Re
sid
ual
s
CSR(Donations)
CSR(Donations) Residual Plot
-0.10000
0.00000
0.10000
0.20000
0.30000
0.40000
0 2E+09
TAX
-IN
CO
ME
CSR(Donations)
CSR(Donations) Line Fit Plot
TAX-INCOME
Predicted TAX-INCOME
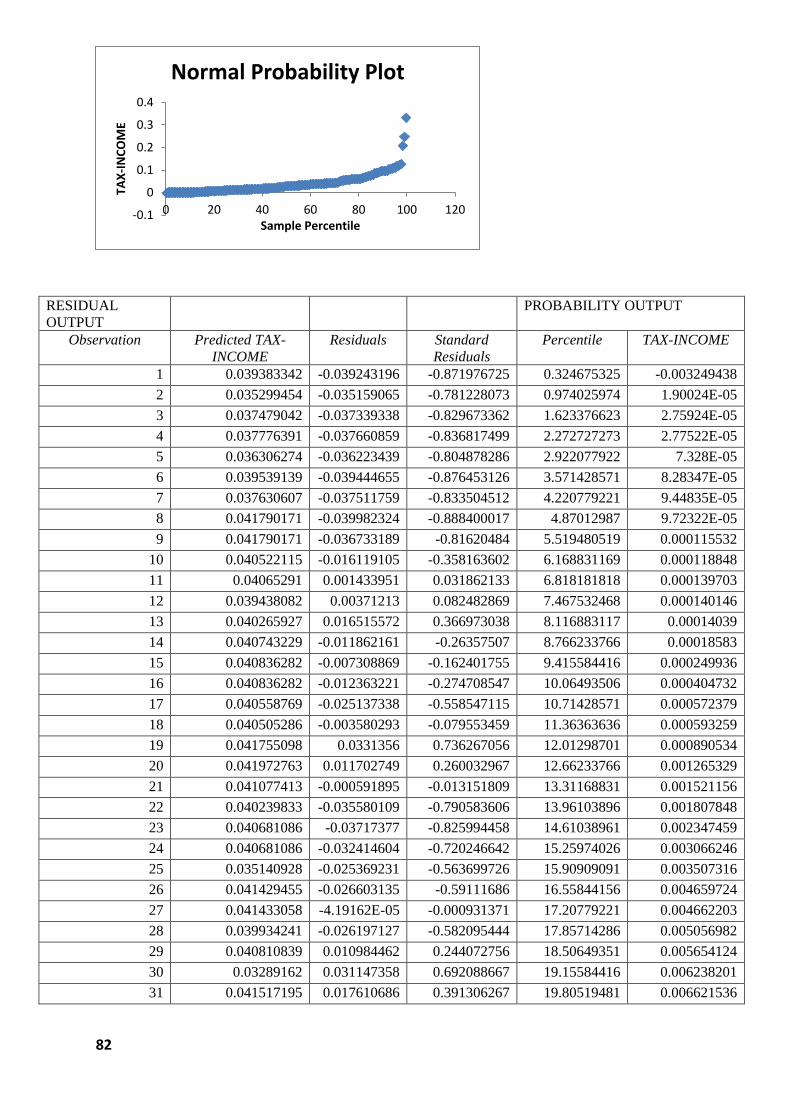
82
RESIDUAL
OUTPUT
PROBABILITY OUTPUT
Observation Predicted TAX-
INCOME
Residuals Standard
Residuals
Percentile TAX-INCOME
1 0.039383342 -0.039243196 -0.871976725 0.324675325 -0.003249438
2 0.035299454 -0.035159065 -0.781228073 0.974025974 1.90024E-05
3 0.037479042 -0.037339338 -0.829673362 1.623376623 2.75924E-05
4 0.037776391 -0.037660859 -0.836817499 2.272727273 2.77522E-05
5 0.036306274 -0.036223439 -0.804878286 2.922077922 7.328E-05
6 0.039539139 -0.039444655 -0.876453126 3.571428571 8.28347E-05
7 0.037630607 -0.037511759 -0.833504512 4.220779221 9.44835E-05
8 0.041790171 -0.039982324 -0.888400017 4.87012987 9.72322E-05
9 0.041790171 -0.036733189 -0.81620484 5.519480519 0.000115532
10 0.040522115 -0.016119105 -0.358163602 6.168831169 0.000118848
11 0.04065291 0.001433951 0.031862133 6.818181818 0.000139703
12 0.039438082 0.00371213 0.082482869 7.467532468 0.000140146
13 0.040265927 0.016515572 0.366973038 8.116883117 0.00014039
14 0.040743229 -0.011862161 -0.26357507 8.766233766 0.00018583
15 0.040836282 -0.007308869 -0.162401755 9.415584416 0.000249936
16 0.040836282 -0.012363221 -0.274708547 10.06493506 0.000404732
17 0.040558769 -0.025137338 -0.558547115 10.71428571 0.000572379
18 0.040505286 -0.003580293 -0.079553459 11.36363636 0.000593259
19 0.041755098 0.0331356 0.736267056 12.01298701 0.000890534
20 0.041972763 0.011702749 0.260032967 12.66233766 0.001265329
21 0.041077413 -0.000591895 -0.013151809 13.31168831 0.001521156
22 0.040239833 -0.035580109 -0.790583606 13.96103896 0.001807848
23 0.040681086 -0.03717377 -0.825994458 14.61038961 0.002347459
24 0.040681086 -0.032414604 -0.720246642 15.25974026 0.003066246
25 0.035140928 -0.025369231 -0.563699726 15.90909091 0.003507316
26 0.041429455 -0.026603135 -0.59111686 16.55844156 0.004659724
27 0.041433058 -4.19162E-05 -0.000931371 17.20779221 0.004662203
28 0.039934241 -0.026197127 -0.582095444 17.85714286 0.005056982
29 0.040810839 0.010984462 0.244072756 18.50649351 0.005654124
30 0.03289162 0.031147358 0.692088667 19.15584416 0.006238201
31 0.041517195 0.017610686 0.391306267 19.80519481 0.006621536
-0.1
0
0.1
0.2
0.3
0.4
0 20 40 60 80 100 120
TAX
-IN
CO
ME
Sample Percentile
Normal Probability Plot

83
32 0.04195874 0.012841722 0.285340751 20.45454545 0.007302928
33 0.04195874 -0.002768346 -0.061512151 21.1038961 0.008017339
34 0.030827408 0.055283635 1.228392403 21.75324675 0.008144938
35 0.038327424 0.020849919 0.463281449 22.4025974 0.008266482
36 0.037488918 0.013218558 0.293713967 23.05194805 0.008272368
37 0.041669593 0.000344128 0.007646473 23.7012987 0.008385329
38 0.041669593 -0.022365206 -0.496950843 24.35064935 0.008833653
39 0.039828741 -0.014509693 -0.322402751 25 0.008888367
40 0.039828741 -0.043078179 -0.957189361 25.64935065 0.009771697
41 0.041657587 0.016979807 0.377288253 26.2987013 0.010079527
42 0.040357196 -0.006695391 -0.148770381 26.94805195 0.010189553
43 0.041058112 -0.023288042 -0.517456099 27.5974026 0.01020186
44 0.041058112 -0.028226267 -0.627182562 28.24675325 0.010902925
45 0.040690456 -0.02904987 -0.64548286 28.8961039 0.011600743
46 0.04154459 0.165421817 3.67564293 29.54545455 0.011640586
47 0.041792774 -0.031713247 -0.704662634 30.19480519 0.011676278
48 0.041520123 -0.038453877 -0.85443821 30.84415584 0.011705895
49 0.041277361 0.002448419 0.054403427 31.49350649 0.011798112
50 0.041983174 -0.039635715 -0.880698429 32.14285714 0.012831845
51 0.04196492 -0.023095902 -0.513186768 32.79220779 0.013179156
52 0.041979946 -0.028472109 -0.632645132 33.44155844 0.013381452
53 0.041976081 -0.028594629 -0.635367496 34.09090909 0.013507837
54 0.04200756 -0.027358587 -0.607902875 34.74025974 0.013560767
55 0.042004109 -0.034701181 -0.771053977 35.38961039 0.013737113
56 0.041985965 -0.030309687 -0.67347578 36.03896104 0.014196016
57 0.040283757 0.054394377 1.208633243 36.68831169 0.014648973
58 0.040283757 0.083258806 1.849995656 37.33766234 0.014826319
59 0.040283757 0.047655191 1.058889747 37.98701299 0.015242194
60 0.040283757 0.01608334 0.357368922 38.63636364 0.015421431
61 0.04195874 0.018240282 0.405295783 39.28571429 0.016316407
62 0.030827408 0.063979907 1.421621994 39.93506494 0.017085948
63 0.038986862 0.047268651 1.050300891 40.58441558 0.01777007
64 0.040810839 -0.010461668 -0.232456377 41.23376623 0.017920325
65 0.03289162 0.035480046 0.788360211 41.88311688 0.01831579
66 0.041517195 0.01827935 0.406163869 42.53246753 0.018350453
67 0.04195874 -0.033941401 -0.754171812 43.18181818 0.018869018
68 0.04195874 -0.035720539 -0.793703937 43.83116883 0.019304387
69 0.030827408 0.029150828 0.647726142 44.48051948 0.02053458
70 0.038327424 0.000464436 0.010319683 45.12987013 0.021009758
71 0.041951834 0.023249602 0.516601961 45.77922078 0.021157682
72 0.041767333 -0.002666982 -0.059259861 46.42857143 0.022429499
73 0.041824456 -0.033679517 -0.748352798 47.07792208 0.023016407
74 0.041824456 -0.026582262 -0.590653061 47.72727273 0.02440301
75 0.041852003 -0.032963636 -0.732446054 48.37662338 0.025319049
76 0.041790284 -0.040269128 -0.894772755 49.02597403 0.025826425
77 0.041835061 -0.018818654 -0.418147095 49.67532468 0.027661727

84
78 0.042001655 0.289684938 6.436747045 50.32467532 0.028363473
79 0.041991894 0.205362756 4.563123392 50.97402597 0.028444713
80 0.041982134 0.054082436 1.20170196 51.62337662 0.028473061
81 0.041978229 -0.003987113 -0.088592935 52.27272727 0.028881069
82 0.042001655 -0.014339928 -0.318630605 52.92207792 0.030131498
83 0.041962612 -0.024042287 -0.534215286 53.57142857 0.030349171
84 0.041986363 0.084460134 1.876688928 54.22077922 0.030645763
85 -0.006334016 0.006361768 0.141357348 54.87012987 0.030877031
86 -0.006334016 0.006361609 0.141353798 55.51948052 0.03145233
87 0.033564138 -0.033490858 -0.744160819 56.16883117 0.032582641
88 0.033564138 -0.033545135 -0.745366858 56.81818182 0.032782995
89 0.008850832 -0.008600896 -0.191110348 57.46753247 0.032949998
90 0.008850832 -0.008665001 -0.192534765 58.11688312 0.033229515
91 0.012026984 -0.011929752 -0.265076941 58.76623377 0.033527413
92 0.035091018 0.060710924 1.348985781 59.41558442 0.033661805
93 0.040815962 -0.029017849 -0.644771373 60.06493506 0.036781368
94 0.02238099 0.015341264 0.340880123 60.71428571 0.036924993
95 0.02238099 -0.011478065 -0.255040535 61.36363636 0.037722255
96 0.02238099 -0.012179131 -0.27061809 62.01298701 0.037836693
97 0.02238099 0.010569007 0.234841431 62.66233766 0.037991116
98 0.027571824 0.005657692 0.125712889 63.31168831 0.038540836
99 0.041817664 -0.000951088 -0.021133005 63.96103896 0.03879186
100 0.041817664 -0.000958983 -0.021308425 64.61038961 0.039100351
101 0.041673042 0.01546902 0.34371883 65.25974026 0.039190394
102 0.041705578 0.028729589 0.63836629 65.90909091 0.040354977
103 0.041705578 0.032457418 0.721197978 66.55844156 0.040485518
104 0.041691327 0.036717479 0.815855755 67.20779221 0.040858681
105 0.041735142 0.018577239 0.412782904 67.85714286 0.040866576
106 0.041783754 0.062516108 1.389096645 68.50649351 0.041391142
107 0.041779564 0.066389745 1.475168152 69.15584416 0.042013722
108 0.041848856 0.069736603 1.549534743 69.80519481 0.042086861
109 0.042016296 0.075664955 1.681261653 70.45454545 0.043150212
110 0.041965575 0.059805136 1.328859335 71.1038961 0.04372578
111 0.041965575 0.0540403 1.200765725 71.75324675 0.045579334
112 0.04189327 0.064692141 1.437447709 72.4025974 0.050707476
113 0.041860092 -0.021325512 -0.473849018 73.05194805 0.051795301
114 0.041860092 -0.001505115 -0.033443375 73.7012987 0.053675512
115 0.041860092 -0.016033667 -0.356265189 74.35064935 0.054800462
116 0.041967984 -0.019538485 -0.434141601 75 0.056367097
117 0.041967984 -0.011090952 -0.246438959 75.64935065 0.056781499
118 0.041599023 -0.010953259 -0.243379446 76.2987013 0.057142062
119 0.041852544 -0.013407832 -0.297919598 76.94805195 0.058637395
120 0.042002273 -0.009219278 -0.204850697 77.5974026 0.059127881
121 0.042024788 -0.02493884 -0.554136525 78.24675325 0.059177343
122 0.041995083 -0.041104548 -0.91333565 78.8961039 0.059796545
123 0.041996514 -0.040731186 -0.905039595 79.54545455 0.059978236
124 0.042017598 -0.041612866 -0.924630376 80.19480519 0.060199023

85
125 0.042017598 -0.041445219 -0.920905289 80.84415584 0.060312382
126 0.042008976 -0.033175323 -0.737149689 81.49350649 0.064038977
127 0.03448253 -0.024292977 -0.53978557 82.14285714 0.065201436
128 0.03448253 -0.020286515 -0.450762696 82.79220779 0.068371665
129 0.035577788 -0.019261381 -0.427984408 83.44155844 0.070435167
130 0.03448253 -0.022776635 -0.506092719 84.09090909 0.074162996
131 0.041903787 -0.041310528 -0.917912469 84.74025974 0.074890698
132 0.04187522 -0.013511748 -0.300228595 85.38961039 0.077721867
133 0.037134064 -0.023573297 -0.523794409 86.03896104 0.078408806
134 0.041772179 -0.004990811 -0.110894926 86.68831169 0.086111044
135 0.041968794 -0.010516464 -0.233673931 87.33766234 0.086255513
136 0.041976602 -0.009393962 -0.208732139 87.98701299 0.087938948
137 0.042027904 0.035693963 0.793113423 88.63636364 0.090268526
138 0.042010314 -0.023659861 -0.525717835 89.28571429 0.094678134
139 0.041994515 -0.011863017 -0.263594093 89.93506494 0.094807316
140 0.041958385 -0.004121692 -0.09158325 90.58441558 0.095801942
141 0.041783754 -0.020626072 -0.458307603 91.23376623 0.096005876
142 0.041783754 -0.023467964 -0.521453927 91.88311688 0.096064569
143 0.04200813 -0.020998372 -0.46658004 92.53246753 0.101770712
144 0.041985582 0.048282944 1.072838293 93.18181818 0.104299863
145 0.041985582 -
0.037323379
-0.829318752 93.83116883 0.106585412
146 0.04200813 0.076053914 1.68990425 94.48051948 0.108169309
147 0.041925822 0.003653512 0.08118037 95.12987013 0.111585459
148 0.041779174 -0.03612505 -0.8026921 95.77922078 0.117681252
149 0.041779174 -
0.033506806
-0.744515183 96.42857143 0.118062044
150 0.041765932 -
0.033380603
-0.741710968 97.07792208 0.123542563
151 0.041808424 -
0.035186888
-0.781846298 97.72727273 0.126446497
152 0.041607189 -
0.030006446
-0.666737819 98.37662338 0.206966407
153 0.041681989 -
0.003141153
-0.069795863 99.02597403 0.247354651
154 0.041736981 -
0.028557824
-0.634549705 99.67532468 0.331686593

86

87

88