Embed Size (px)
Citation preview

James Madison UniversityJMU Scholarly Commons
Dissertations The Graduate School
Fall 2015
The impact of college leadership experiences onlong term well-beingKevin MeaneyJames Madison University
Follow this and additional works at: https://commons.lib.jmu.edu/diss201019Part of the Leadership Studies Commons
This Dissertation is brought to you for free and open access by the The Graduate School at JMU Scholarly Commons. It has been accepted for inclusionin Dissertations by an authorized administrator of JMU Scholarly Commons. For more information, please contact [email protected].
Recommended CitationMeaney, Kevin, "The impact of college leadership experiences on long term well-being" (2015). Dissertations. 39.https://commons.lib.jmu.edu/diss201019/39

The Impact of College Leadership Experiences on Long Term Well-Being
Kevin Meaney
A dissertation submitted to the Graduate Faculty of
JAMES MADISON UNIVERSITY
In
Partial Fulfillment of the Requirements
for the degree of
Doctor of Philosophy
School of Strategic Leadership Studies
November 2015
FACULTY COMMITTEE:
Committee Chair : T. Dary Erwin, Ph.D.
Committee Members/ Readers:
Karen Ford, D.S.W.
Keston Fulcher, Ph.D.

ii
Table of Contents
List of Tables ................................................................................................................................. iii
Abstract .......................................................................................................................................... iv
Introduction ..................................................................................................................................... 1
Review of the Literature ................................................................................................................. 6
Outcomes of College ................................................................................................................... 6
Well-Being .................................................................................................................................. 8
Impact of College Leadership Experiences ............................................................................... 13
Research Methods ......................................................................................................................... 18
Purpose ...................................................................................................................................... 18
Participants ................................................................................................................................ 18
Instruments ................................................................................................................................ 21
The Satisfaction With Life Scale ........................................................................................... 21
The Work and Meaning Inventory ........................................................................................ 22
The Meaning in Life Questionnaire ....................................................................................... 23
The Sources of Meaning, Meaning in Life Questionnaire .................................................... 24
Research Design ........................................................................................................................ 25
Hypotheses ................................................................................................................................ 26
Results ........................................................................................................................................... 30
Results of Hypotheses ............................................................................................................... 42
Discussion ..................................................................................................................................... 45
Conclusions ............................................................................................................................... 45
Suggestions for Further Research ............................................................................................. 49
Appendix A - The Satisfaction With Life Scale ........................................................................... 52
Appendix B - The Meaning in Life Questionnaire ....................................................................... 53
Appendix C - The Work and Meaning Inventory (WAMI) .......................................................... 54
Appendix D - Sources of Meaning - Meaning in Life: (SoMe) .................................................... 55
References ..................................................................................................................................... 56

iii
List of Tables
Table 1. Significant ANOVA Planned Contrasts ........................................................................ 26
Table 2. Group Means.................................................................................................................. 32
Table 3. SWLS – Scale Reliability .............................................................................................. 33
Table 4. SoMe: Meaningfulness Subscale – Scale Reliability .................................................... 33
Table 5. MLQ – Scale Reliability .............................................................................................. 344
Table 6. WAMI: Positive Meaning Subscale – Scale Reliability .............................................. 344
Table 7. WAMI: Meaning-Making through Work Subscale – Scale Reliability ...................... 355
Table 8. WAMI: Greater Good Motivations Subscale – Scale Reliability ................................ 355
Table 9. Levene’s Test Results .................................................................................................. 366
Table 10. Multivariate Statistics ................................................................................................ 377
Table 11. SWLS - ANOVA Statistics........................................................................................ 377
Table 12. SoMe - ANOVA Statistics ......................................................................................... 377
Table 13. MLQ - ANOVA Statistics ......................................................................................... 377
Table 14. WAMI: Positive Meaning Subscale - ANOVA Statistics ......................................... 388
Table 15. WAMI: Meaning-Making through Work Subscale - ANOVA Statistics .................. 388
Table 16. WAMI: Greater Good Motivations Subscale - ANOVA Statistics ........................... 388
Table 17. ANOVA Planned Contrasts Coefficients .................................................................. 400
Table 18. WAMI: Positive Meaning Subscale - Planned Contrasts Results ............................. 400
Table 19. WAMI: Meaning-Making through Work - Planned Contrasts Results ..................... 411

iv
Abstract
In an era when the debate surrounding the value of a college education seems
solely focused on the earning power of graduates, colleges and universities must make a
concerted effort to include additional outcomes in the discussion. One area of promise is
the examination of the impact of various college experiences on long term well-being.
Using a multiple analysis of variance, this study explored the influence of collegiate
leadership experiences on long term well-being and meaningful work. Results revealed
that students engaged in activities with focused leadership development reported higher
levels of positive meaning in their work and higher levels of meaning making through
work than those with no leadership experience as well as those who held positional
leadership roles without a focus on leadership development. Further, it was colleges
provided this experience equally well through both paid and unpaid positions. Further
research is necessary to better understand any additional post-collegiate experience that
may have affected the results of the study.

1
Introduction
How do we measure the long term impact of college on graduates? Some would
argue that it is purely through financial attainment and career achievement. But, are there
not other long term outcomes that are just as important? Do we not expect colleges to
produce engaged individuals, thoughtful leaders and global citizens? And should
graduates not expect to view the world differently and more openly after being exposed
to new thoughts, ideas and people? As post-college salaries struggle to keep pace with
tuition, institutions must do a better job of celebrating other important outcomes of the
college experience; outcomes that benefit society as well as the individual graduate.
Over the past several decades the United States has seen a dramatic increase in the
cost to attend college. Since 1985 tuition expenses have increased 538 percent compared
with a 286 percent jump in medical costs and a 121 percent gain in the consumer price
index (Bloomberg, 2013). While the reasons behind these increases are many (drastic
reductions in state support, rising costs for services, etc.), the increased burden on
families has resulted in a spotlight being placed on colleges and the benefits of higher
education. Much of that discussion has revolved around the earning power of recent
college graduates and the impact of student loan debt on their ability to be successful.
All of the involved parties are interested in the ability of graduates to secure jobs that
allow them to manage their college debt and provide for their families. And the federal
government has continued its drumbeat for a ratings system to help families determine
how successful schools are in metrics like labor market success and loan repayment
performance. The pressure to produce successful graduates has never been greater.

2
However, measuring success in purely financial terms paints an incomplete
picture of the benefits of a college education. In fact, colleges and students tout many
other outcomes as equally important and worthy of note and, historically, society has
embraced these outcomes as well. College students are expected to increase their
academic knowledge and skills, develop themselves personally and expand their
understanding of both the local and global community in which they live. An
undergraduate education can and should help students develop ethically and discern a
sense of purpose in life (Colby, Ehrlich, Beaumont, & Stephens, 2003; Sullivan & Rosin,
2008).
Many students seek careers that are meaningful to them and offer a sense of
purpose in their lives. They are willing to sacrifice earnings to achieve these outcomes
(Zukin & Szeltner, 2012). Fostering a desire to engage in public service, developing
leadership skills and the ability to work successfully in group setting are also goals
embedded in the mission statements of many universities. These outcomes however
cannot be measured by looking at salary data or socioeconomic standing alone.
One way to examine these areas is by assessing the well-being of college
graduates. Well-being refers to both a subjective self-appraisal of one’s current
emotional condition as well as whether one has achieved a sense of purpose in life and
career (Diener, Suh, Lucas, & Smith, 1999; Ryff & Keyes, 1995). Well-being is the
combination of all the things that are important to an individual and how they perceive
their life experiences. It is a combination of many life areas and is not confined to just
wealth or physical health but instead refers to the interaction between career fulfillment,
strong social relationships, community involvement and access to resources as well as

3
general health and wealth. If colleges are truly developing the whole person and not just
preparing them for specific careers, we should see a positive impact on the long term
well-being of graduates.
Recently, the Gallup organization and Purdue University revealed the results of
their inaugural Gallup-Purdue Index (Gallup-Purdue, 2014). The Index was designed to
assess college graduate well-being and determine what impact, if any, the college
experience has on long term well-being. The Index involved interviewing more than
30,000 college graduates in an attempt to measure whether they have "great jobs," and if
they are thriving in their overall well-being. The questions used for the Index were based
on a 5 factor model of well-being developed by Gallup:
Purpose Well-Being: Liking what one does each day and being motivated to
achieve one’s goals.
Social Well-Being: Having strong and supportive relationships and love in one’s
life.
Financial Well-Being: Effectively managing one’s economic life to reduce stress
and increase security.
Community Well-Being: The sense of engagement one has with the areas where
one lives, liking where one lives, and feeling safe and having pride in one’s
community.
Physical Well-Being: Having good health and enough energy to get things done
on a daily basis.

4
So, does college really impact long-term well-being? The results from the initial
Gallup-Purdue Index seem to say “yes”. The results indicated that colleges could have an
impact but only if graduates engaged in specific experiences during their years of
attendance. Significant engagement with a faculty member or mentor, participation in a
semester long project and having an internship connected to classroom learning were all
related to greater job engagement and well-being after graduation. Similarly, significant
participation in extracurricular activities also produced a positive effect. Graduates who
were more heavily involved during their college years made up 20% of the respondents
and were 1.4 times more likely to be thriving in all areas of well-being. These same
graduates were also 1.8 times more likely to be engaged at work than other graduates.
The impact of extracurricular activities is particularly intriguing because benefits
from involvement in non-classroom based activities would seem to indicate value in the
entirety of the collegiate experience and not just the purely academic aspects.
Extracurricular activities are often pointed to as integral to the college experience and
help differentiate 4-year residential institutions from online and for-profit operations.
College have long seen the value of extracurricular activities in helping students feel
connected to the institution and students have the opportunity to participate in many
different types of clubs and organizations. Options range from social organizations to
sports clubs to groups based on a common faith or ethnicity.
Leadership development programs are one type of extracurricular experience that
have received more attention recently. Colleges have placed a high value on these
programs and at last count over 1500 formal leadership programs existed (Owen, 2012).
Unlike clubs designed to foster a connection during the undergraduate years, leadership

5
programs have an additional goal of developing future leaders. The literature regarding
these programs tells us that the effects are long lasting and life changing. We also know
that these programs include outcomes related to improving civic engagement,
strengthening personal connections with the community and other leaders as well helping
participants find meaning in their work and purpose in life. These are all concepts
closely related to well-being and individuals who flourish in these areas tend to report
greater happiness and satisfaction with their lives and careers.
If colleges are interested in focusing on well-being as a valued outcome for
graduates, examining the impact of leadership programs on well-being seems like a
potentially fruitful endeavor. The idea that these programs might also contribute to the
long term well-being of graduates should be particularly exciting to colleges.
Demonstrating that they produce highly qualified leaders in a variety of fields who also
lead more personally fulfilling lives would be a tremendous feather in their cap. It would
also bolster the argument that the value of the college experience cannot be measured by
salary alone.

6
Review of the Literature
Outcomes of College
The belief that college and the college experience are related to well-being has
become more popular recently, however the idea that college means more than preparing
for career or financial security is not new by any means. Over the past century many
researchers have attempted to measure the impact of college on graduates beyond
vocational or purely academic measures. While it is impossible to cover all of the
previous literature here, several important works have attempted to synthesize this
research through the decades.
C. Robert Pace, whose study of the impact of the college experience began in the
1930s, found that college graduates as a group, tend to possess more knowledge about
public affairs, humanities, and popular culture than those who did not attend college
(Pace, 1979). In addition he found that college graduates are more likely to participate in
a variety of civic activities and believe that college contributed directly to the
development of their interpersonal skills and personal values.
In the early 1960s James Trent and Leland Medsker studied the lives of 10,000
high school graduates. Some chose to attend college while others went directly into the
work force. They found that college graduates showed greater gains in personal
autonomy, openness to diversity, critical thinking skills and seemed to be more flexible
and tolerant in their attitudes (Trent & Medsker, 1968).
Originally published in 1977, Howard Bowen’s Investment in Learning
constructed a framework of higher education goals related to outcomes for individual
students. These goals included both academic and non-academic outcomes such as

7
personal self-discovery, psychological well-being, future orientation, personal
adaptability, leadership development and citizenship. He concluded that college “helps
students a great deal in finding their personal identity and in making lifetime choices
congruent with this identity. It increases moderately their psychological well-being as
well as their understanding, human sympathy, and tolerance toward ethnic and national
groups and toward people who hold differing opinions" (Bowen, 1996, p. 433). It also
"greatly enhances the practical competence of its students as citizens, workers, family
members, and consumers," in addition to influencing, in positive ways, "their leisure
activities, their health, and their general ability to cope with life's problems" (Bowen, p.
434).
Alexander Astin's seminal work in this area was also published in 1977. In Four
Critical Years (1977), Astin analyzed data gathered through the Cooperative Institutional
Research Program (CIRP), surveying some 200,000 students from 300 colleges across
the nation. In analyzing the affective outcomes of college he found that students develop
a more positive self-image, become more socially active and show increases in desire to
develop a meaningful philosophy of life (Astin, 1977). Astin also proposes several
general conclusions that point to the importance of a traditional college experience. Most
relevant to the purposes of this study is the ideas that the student’s involvement with
peers during their time in college is the most significant influence on the growth and
development of their personal values and beliefs.
Perhaps most recognizable among the works in this area has been the efforts of
Pascarella and Terenzini (2005). In an attempt to produce the most comprehensive
review on the question of college impact, they examined thousands of empirical studies
8
completed over a period of fifty years and considered outcomes in ten specific areas,
including changes of identity and self-concept, changes in relating to others, impact on
personal attitudes and values and quality of life after college. Some of their findings
include:
College positively impacts belief in oneself and as well as one’s leadership
abilities.
College graduates report a greater sense of openness to those different
from themselves and a better understanding of others.
College increases a students' freedom from the influences of others.
College graduates experience an increase in the maturity of their
interpersonal relationships.
These collective works clearly establish the benefits of a college education
beyond the improvement of one’s income or career related prospects. However, the
specific connection between college and well-being is under-studied. Rarely do these
researchers use the term “well-being” nor do they reference well-being theories or
constructs. However a closer examination of the well-being literature may reveal a
stronger relationship than first realized and may help us understand the interest Gallup
and Purdue have in exploring this potential connection.
Well-Being
Traditionally, researchers have distinguished between two types of well-being:
hedonic and eudaimonic (Ryan & Deci, 2001; Waterman, Schwartz, & Conti, 2008).

9
Hedonic psychology has to do with the study of what makes experiences and life pleasant
and unpleasant. This form of well-being is typically defined as having positive emotions,
being satisfied with one’s life, and the happiness that can be derived from attainment of
goals or valued outcomes in various life endeavors (Diener, Suh, Lucas, & Smith, 1999).
Compared to hedonic happiness, eudaimonic happiness is a deeper, more multi-
dimensional construct. Eudaimonic theories distinguish happiness from well-being and
advance the idea that the achievement of pleasure does not always equate to greater well-
being.
Hedonic psychology defines well-being in terms of pleasure, or the lack thereof,
and focuses on the maximization of human happiness and how we can accurately
measure this construct. The predominant avenue for assessment is the examination of
Subjective Well-Being (SWB) (Diener, et al., 1999). SWB emerged as a research area in
an attempt to find useful indicators of quality of life. Researchers quickly came to
understand that although people live in objectively defined worlds, it is how they
subjectively define their lives that has a greater impact on their perception of their own
happiness and well-being (Keyes, Shmotkin & Ryff, 2002). SWB is comprised of two
components: life satisfaction and happiness. Life satisfaction reflects an individual’s
perceived distance from their aspirations and is a long-term assessment of one’s life.
Happiness results from a balance between positive affect and negative affect and is a
reflection of pleasant and unpleasant affects in one’s immediate experience (Keye’s, et
al., 2002). This consistent presence and interrelatedness of life satisfaction, positive
affect, and negative affect has been repeatedly confirmed in numerous studies (Lucas,
Diener, & Suh, 1996).

10
It should be noted that some researchers view Life Satisfaction as a third measure
of well-being, separate from eudaimonic and hedonic happiness. As a component of
subjective well-being (SWB), life satisfaction is related to, but partially independent of,
the affective aspects of SWB (Lucas et al., 1996). At its heart, life satisfaction represents
an evaluative judgment that can be influenced by several subjective life domains. The
chosen domains can vary based on current life circumstances, age, perceived importance,
etc. (Schimmack, Diener, & Oishi, 2002). More importantly, while it was previously
thought that changes in life satisfaction could only have a temporary effect on overall
SWB, recent research has demonstrated that certain influences on life satisfaction can
actually have long-term effects (Lucas, Clark, Georgellis, & Diener, 2003).
Unlike hedonic psychology, eudaimonic theories distinguish happiness from well-
being and advance the idea that the achievement of pleasure does not always equate to
greater well-being. Eudaimonic psychologists are concerned with an individual’s
Psychological Well-Being (PWB) and whether they are living their lives to the fullest.
Are they experiencing personal growth and have a purpose in life? Do they maintain
meaningful interpersonal relationships and attempt to exert control over their
environment? These researchers propose that eudaimonia occurs when people’s life
activities connect regularly with deeply held values and they feel fully engaged by these
activities.
Whereas SWB views well-being in terms of satisfaction and happiness, PWB
relies on personal development and life challenges. Ryff’s (1989) multidimensional
model of PWB is considered a seminal work in this area and includes six core
psychological dimensions. Each dimension of PWB involves different challenges

11
individuals encounter as they strive to function positively (Ryff, 1989; Ryff & Keyes,
1995). Self-acceptance denotes an attempt to feel good about oneself even when aware of
one’s personal shortcomings. Positive relations with others speaks to efforts to build
close and trusting interpersonal relationships. Environmental mastery involves attempts
to create a personal environment that meets personal needs. Autonomy involves efforts to
establish a sense of individuality through personal authority. Personal growth denotes
efforts to make the most of one’s talents and abilities. And, finally, purpose in life refers
to efforts by an individual to find meaning in their life’s path.
In developing measures of well-being researchers have faced challenges in
mitigating the impact of mood and context. For instance, Schwarz and Clore (1983) were
able to influence respondents’ answers to a life satisfaction survey by putting them in a
good mood or a bad mood. Subjects asked to relive a negative memory or asked to
respond on a rainy day reported lower satisfaction than subjects asked to relive a happy
memory or contacted on a sunny day. Schwarz, Strack, Kommer and Wagner (1987) also
demonstrated that results are highly context dependent and show small test-retest
correlations even with short intervals. Subjects contacted immediately after a World Cup
soccer game responded differently to a life satisfaction questionnaire depending on how
they felt about their team’s performance. More recently, Eid and Diener (2004) used a
structural model, and found that anywhere from 4% to 25% of the variance in various
measures were accounted for by context difference.
Some researchers have criticized meaning in life instruments because they believe
they are unclear as to what construct they are attempting to measure. For example, in
examining the Purpose in Life Questionnaire (PIL) Steger, Frazier, Oishi and Kaler

12
(2006) found “…disconcertingly high correlations observed between the PIL and
negative affect (–.78; Zika & Chamberlain, 1987), positive affect (.78; Zika &
Chamberlain, 1992), and life satisfaction (.71; Chamberlain & Zika, 1988b).” Similarly,
Debats, van der Lubbe and Wezeman (1993) found high correlations with measures of
depression and anxiety. However, Diener, Inglehart and Tay (2012) point out that “many
concepts in the behavioral sciences do correlate with each other, and it makes conceptual
sense that they do so”. Also, Lucas, Diener and Suh (1996) found that longitudinal
studies showed better discriminant validity from related concepts such as positive and
negative affect. So while results may be harder to separate in the short term, longer term
studies appear to do a better job of isolating the construct. Additionally, it appears that
some factors that can confound meaning in life findings can be effectively controlled.
For instance, in the same study in which they demonstrated the impact of context
difference, Eid and Diener (2004) were also able to control for it. Afterwards, they
estimated that the stability for life satisfaction was actually closer to .90.
At this point it should be clear that while researchers interested in college
outcomes did not make specific mention of well-being constructs or theories we can see
that many of the outcomes used in both fields overlap. Life satisfaction which reflects an
individual’s perceived distance from their aspirations and is a long-term assessment of
one’s life is related to Astin’s findings regarding personal life philosophy and Bowen’s
“future orientation”. Development of personal values and beliefs measured by Pace and
personal autonomy measured by Trent and Medsker are outcomes intimately associated
with Psychological Well-Being. Throughout these studies, results support that college
graduates are more satisfied, more engaged, have a clear sense of self and life purpose

13
and are more open to new ideas and individuals different from themselves. It is clear that
college has a positive impact on the well-being of its graduates. But, can the same be
said for collegiate leadership experiences? Is there reason to believe that these
experiences have long-term effects and is there a connection between these experiences
and increased well-being?
Impact of College Leadership Experiences
Colleges use student clubs and organizations to attract prospective student interest
in their institution as well as to help new students become more engaged with the
university community. These experiences are also intended to provide critical
educational and developmental benefits for students, including boosting their teamwork
and organizational skills, their openness to diversity and their leadership abilities. Many
admissions events and new student orientation programs will include a student group fair
where prospective and new students have an opportunity to meet current students and
explore the many ways to become more involved. While some of these organizations are
social in nature many are also designed to help students develop their leadership skills
over the course of their involvement with the group.
Research suggests that all college students can develop stronger leadership skills
by being involved in leadership positions and campus organizations (Kezar & Moriarty,
2000). Through these programs students report gaining and improving their skills in
communication, problem-solving, strategic visioning and conflict resolution. These skills
support their academic endeavors as well as in their professional careers after college
(Zimmerman-Oster & Burkhardt, 1999). They also develop competencies in knowledge

14
creation and are able to promote the sharing of ideas. These skills are hallmarks of
individualized and group leadership development (Locke, 2001). Researchers have also
discovered a positive relationship between student involvement in learning communities
and organizations and academic performance, retention and degree completion (Kuh,
Cruce, Shoup, Kinzie, & Gonyea, 2008).
Participation in organizational leadership experiences also provides students with
the opportunity to compare themselves to their peers in terms of leadership abilities and
often has a positive effect on their self-esteem. Komives, Lucas, and McMahon (1998)
found that being an officer in a collegiate organization was one of the strongest predictors
of an undergraduate’s positive self-rating on leadership ability. Additionally, many
leadership experiences encourage participants to engage with the community and use
what they have learned to work on solutions to community problems (Azzam & Riggio,
2001). This engagement process helps establish social and professional connections
between the students and the community.
The longer term impact of these experiences has also been documented. In a
2001 study, Cress, Astin, Zimmerman-Oster and Burkhardt looked at the impact of
participation in student leadership and education programs four years after graduation.
Ten institutions were selected, each with dedicated leadership programs that focused on
one or more of the following: curriculum revision/development, community service
opportunities, mentoring for formal student leadership development, individual
leadership improvement and collaborative/group leadership activities.
The 10 institutions selected participated in the College Student Survey.
Researchers administered 20 supplemental questions to students at each of the

15
institutions. While caution should be taken in over generalizing the results of the study
due to the self-reported nature of the data, the supplemental questions attempted to assess
changes experienced by students over the course of their college career in three specific
developmental areas:
- Leadership Understanding: Ability to recognize and understand leadership
theories and interest in developing leadership in others.
- Leadership Skills: Proficiency in various leadership skills including dealing
with complexity, ambiguity and uncertainty.
- Personal and Societal Values: Clarity of personal values, a set of personal
ethics and a commitment to civic responsibility.
The researchers also used the standard CSS questions to look at two additional
areas of leadership development:
- Civic Responsibility: Engagement in local community and willingness to help
others.
- Multicultural Awareness: Familiarity with and acceptance of others from
diverse backgrounds.
They determined that participating in these leadership programs produced
graduates who scored significantly higher on all of these measures than those who did not
participate. Further, the most impactful experiences were found to be those that provided

16
opportunities for service to the community, experiential activities and group or
collaborative projects.
Two longer term studies also found similar results. College leadership
organizations often attract (indeed, these organizations often seek out) a diverse group of
students for membership. A 2011 study found that interacting with group members from
diverse backgrounds during these leadership experiences can have positive long term
effects (Bowman, Brandenberger, Hill & Lapsley, 2011). These diversity experiences
were found to have a positive, indirect effect on personal growth, purpose in life and
volunteer work over a decade after graduation. Personal growth was defined as an
individual sense of development, growth, and change and was measured using Ryff’s
(1989) psychological well-being scale. Purpose in life was measured through scales
developed by Damon and colleagues based on their model of purpose development. This
model included four stages (a) searching for purpose, (b) having an identified purpose,
(c) being engaged in one’s purpose, and (d) incorporating this purpose as a central part of
one’s identity.
A related longitudinal study examined the impact of volunteering and service
learning 13 years after graduation. Also using Ryff’s (1989) psychological well-being
scale, Bowman, Brandenberger, Lapsley Hill & Quaranto (2010) examined the impact of
these types of experience on purpose in life (having a sense of direction and working
toward that goal), and environmental mastery (control over one’s life and events). They
also used the Satisfaction With Life Scale (Diener, Emmons, Larsen, & Griffin, 1985) to
assess life satisfaction. Results showed that both types of experiences have positive,
indirect effects on all three of these variables. In particular these collegiate activities are

17
associated with volunteering as an adult and prosocial orientation which are both
positively associated with well-being.
Research in this area has effectively demonstrated that leadership experiences in
college can have long-lasting effects on graduates in a number of areas. What it also
seems to show us is that there is a connection between these leadership experiences and
long-term well-being. As several of the studies concluded, graduates with these types of
experiences demonstrate higher levels of personal growth, purpose in life (Bowman, et
al., 2011), personal and societal values (Cress, et al. 2001) and experience a positive
effect on their self-esteem (Komives, et al., 1998) as well as a strengthening of their
interpersonal relationships (Zimmerman-Oster & Burkhardt, 1999). These are all
outcomes used to measure Psychological and Subjective Well-Being and they all seem to
be influenced in a positive way when students become leaders during their college years.
The goal of this study is to determine whether we can measure this impact and whether
the type of leadership experience, or lack thereof, influences its magnitude.

18
Research Methods
Purpose
The purpose of this study is to examine whether college student leaders
experience a greater sense of long term well-being, either hedonic or eudemonic, than
their non-leader colleagues and whether the type of leadership experience impacts the
level of well-being. Involvement in leadership activities during college can help develop
important skills and attitudes that are connected to both subjective (SWB) and
psychological well-being (PWB). For PWB, this includes helping graduates find a
purpose in life, experience a sense of environmental mastery, and greater life satisfaction
(Bowman, et al., 2010). And, for SWB this includes satisfaction with career choice and a
greater sense of civic responsibility and personal values (Cress, et al., 2001). Does the
development of these skills and attitudes during college impact a graduate’s overall well-
being? And, are the effects still present some ten years after graduation?
Participants
This study employed an electronic survey which was sent to three groups of
graduates from a mid-size public university. All respondents have been alumni for at
least ten years, having graduated from the institution between the years 1994 to 2004.
The first group of respondents were identified as “Employed Student Leaders”. These
graduates were all previously employed as Resident Advisors (RAs) for at least one year
during their attendance at the institution. RAs receive extensive leadership, crisis
management and conflict resolution training during their employment. They participated
in leadership and RA related activities on a daily basis and were required to live on-

19
campus. RAs also received a small stipend each semester as compensation for their
efforts. The total number of Employed Student Leaders contacted was 250.
The second group contacted were classified as “Volunteer Student Leaders” and
will be comprised of graduates with experience in one of three on-campus student
leadership groups: The University Program Board (UPB), Outriggers, and Make Your
Mark On Madison (MYMOM). While other groups exist that provide for leadership
experiences at this university, these three were selected because of their focus on
developing leaders and leadership skills specifically. They are charged with helping
undergraduates develop their leadership skills through a variety of activities. These range
from creating and managing campus wide programming to working with other student
groups to help them develop individualized leadership development programs. They also
work with one on one with younger students and help them develop their leadership
abilities. UPB’s mission statement reflects the focus on leadership and service that these
clubs all share:
“…the University Program Board strives to enhance the overall university
experience by providing a variety of creative, educational and entertaining programs that
appeal to diverse audiences. We actively seek and encourage input while dedicating and
challenging ourselves to incorporate the needs and desires of the university community.”
Volunteer Student Leaders participated in leadership activities on at least a
weekly basis and received no compensation for their activities. MYMOM members
began their experience with a weekend retreat and then met for two hours each week for

20
ten weeks in the fall semester. The first hour of each meeting was dedicated to a formal
leadership training program with the second hour serving as time to work with the new
material in small facilitated groups. Outriggers members go through an intense training
program where the students learn to help other student groups diagnose internal group
disfunction or help them reenergize a group that has become complacent. Their training
involves learning how to facilitate interactive, team-oriented workshops for other
organizations and helping them troubleshoot problems commonly found in student
organizations (complacency, disorganization, poor communication skills, etc.)
University Program Board. The total number of Volunteer Student Leaders contacted
was 250.
The strength and length of the development of the Volunteer Student Leaders
group was less than that of the Employed Student Leaders. While RAs received feedback
on an almost daily basis for the entire academic year and engaged in an intense 2-week
training program just prior to the start of school, Volunteer Student Leaders received
weekly feedback and had training programs that lasted a day or two. The total number of
Volunteer Student Leaders contacted was 250.
The final group was classified as “Non-Leaders”. A random sample of graduates
from 1994-2004 were selected and verified as not being listed as a member of one of the
three leadership programs noted previously nor employed as Resident Assistants at any
time during their collegiate career. Additionally, this group was asked via the electronic
survey to verify that they did not have a significant student leadership experience during
their undergraduate career. The total number of Non-Leaders contacted was 250.

21
All respondents were asked to confirm their status as either an Employed Student
Leader, a Volunteer Student Leader or a Non-Leader. Additionally, each respondent was
asked if they had any other formal leadership experience during their undergraduate
years. Responses to this question combined with each respondents original group
membership would determine how many categories would make up the independent
variable.
Instruments
The Satisfaction With Life Scale
The Satisfaction With Life Scale (Diener, Emmons, Larsen, & Griffin, 1985)
assesses an individual’s global life satisfaction which is a measure closely associated with
Subjective Well-Being. The SWLS is a five-item scale that requires respondents to rate
their level of agreement with positive statements about their life. An example: “In most
ways my life is close to my ideal”. The scale uses a seven level rating system ranging
from 1 (Strongly Disagree) to 7 (Strongly Agree).
The SWLS was developed to be effective in the assessment of a variety of people
from different backgrounds and of different ages. Confirmatory factor analysis of data
collected through the administration of the SWLS has consistently resulted in a single
factor solution although the fifth item almost always shows lower factor loadings than the
first four (Senecal, Nouwen, & White, 2000). However, the fifth item is still highly
correlated with the others and useful to researchers. Coefficient alpha for the SWLS has
been shown to be consistent and sufficient. In their original study, Diener et al., (1985)
reported an alpha of .87 while a more recent study by Adler and Fagley (2005) had the

22
same finding. Similarly, test-retest reliability examples have included alphas of .82 in
1985 and .80 as recently as 2006 (Steger, Frazier, & Oishi).
Diener et al. (1985) also presented data from two student samples which
demonstrated the scale’s validity through its convergence with results from other
measures. This included correlations between the SWLS and the Fordyce Happiness
Scale (Fordyce, 1977), the Gurin Scale (Gurin, Veroff, & Felld, 1960) and the Delighted-
Terrible Scale (Andrews & Whitney, 1976). A subsequent paper by Pavot, Diener,
Colvin, and Sandvik (1991) further validated the SWLS when they demonstrated high
inter correlation with the Life Satisfaction Index-A (Neugarten et al., 1961) and the
Philadelphia Geriatric Center Morale Scalle (Lawton, 1975) in one study and the Fordyce
Scale again, in another.
The Work and Meaning Inventory
A relatively new scale, the Work and Meaning Inventory (WAMI) (Steger, Dik &
Duffy, 2012) is a ten item measure with scores ranging from 1 (absolutely untrue) to 5
(absolutely true), which is aimed at understanding the construct of Meaningful Work. The
WAMI survey consists of three subscales: Positive Meaning (items 1, 4, 5, & 8),
Meaning-Making through Work (items 2, 7, & 9), and Greater Good Motivations (items
3, 6, & 10). Positive Meaning attempts to measure the degree to which people find their
work to hold personal meaning, significance, or purpose. Meaning-Making through Work
measures how much respondents rely on their work to help them to make sense of their
life experiences. The Greater Good Motivations scale measures the degree to which
people see that their work benefits others or society.

23
The scores for the Positive Meaning and Meaning-Making through Work
subscales are computed by simply adding up the responses to the appropriate items listed
above. The score for the Greater Good Motivations subscale is calculated by subtracting
the response to item 3 from item 6 and then adding this difference to the responses to
items 6 and 10. Steger et al.’s (2012) early research found no differences based on
gender, race or ethnicity. Subscale scores were internally consistent during their initial
testing with coefficients of .89, .82, and .83 respectively. The scales can also be added
together for an overall Meaningful Work score which reflects the depth to which people
experience their work as something they are personally invested in and is a source of
flourishing in their lives. Internal consistency for the overall scale was high at .93. High
correlation with similar scales also demonstrated the WAMI’s validity. These includes
dimensions of the Brief Calling scale (r = .51) and several subscales having to do with
finding positive meaning through work (r = .67) (Dik, Eldridge, Steger, & Duffy, 2012).
The Meaning in Life Questionnaire
The Meaning in Life Questionnaire (Steger et al., 2006) is comprised of two
subscales that assess Psychological Well-Being. The first five items assess the presence
of meaning in the life of the respondent while the second five items assess the search for
meaning in life. Items completed using a seven point scale from 1 (Absolutely True) to 7
(Absolutely Untrue). Construct validity for the MLQ included correlating initial results
with the Purpose in Life Test (Crumbaugh & Maholick, 1964) and the Life Regard Index
(Battista & Almond, 1973). Correlations were all statistically significant and ranged
from .58 to .74.

24
Confirmatory factor analysis by Steger et al. has shown consistent loadings of five
items on each of two factors. Their alpha coefficient for the Presence subscale was .86
while the alpha for the Search subscale was .87. A recent study by Schulenberg, Strack
and Buchanan (2011) documented six administrations of the MLQ (including their own)
since 2007 that resulted in alphas for the Presence subscale ranging from .81 to .93 and
alphas for the Search subscale ranging from .88 to .93 (Duffy & Raque-Bogdan, 2010;
Kashdan & Breen, 2007; Park, Park, & Peterson, 2010; Schulenberg, Schnetzer, &
Buchanan, 2011; Whittington & Scher, 2010). MLQ scores have also demonstrated
sufficient test-retest reliability both in the short term as well as for periods exceeding 1-
year. (Dik, Sargent, & Steger, 2008; Steger & Kashdan, 2007).
The Sources of Meaning, Meaning in Life Questionnaire
The Sources of Meaning, Meaning in Life Questionnaire (SoMe) is a 151-item
scale which measures 26 sources of meaning as well as degrees of experienced
meaningfulness (Schnell & Becker, 2006). For this study only the five item
meaningfulness subscale was used to further assess Psychological Well-Being. The
meaningfulness scale measures the degree of subjectively experienced meaningfulness.
Meaningfulness is defined as “a fundamental sense of meaning, based on an appraisal of
one’s life as coherent, significant, directed, and belonging” (Schnell, 2009). Subscale
items contain complementary facets of experiences of meaningfulness and read as
follows:
• I lead a fulfilled life.

25
• I think that there is meaning in what I do.
• I have a goal in life.
• I feel I belong to something bigger than myself.
• I think my life has a deeper meaning.
Based on Schnell’s (2009) research the meaningfulness subscale demonstrated an
internal consistency of .74 as well as high short-term stability with an average 2-month
test-retest coefficient of .81 for the scale. The stability of the subscale remained
acceptable even after six months with an alpha of .72.
Research Design
A multivariate analysis of variance (MANOVA) will be calculated to study
possible average differences among the groups of an independent variables on six
dependent variables. Specifically, the groups of the independent variable are: Employed
Student Leaders (EMP LDR), Employed Student Leaders with Other Experience (EMP
LDR w/OTHER), Volunteer Student Leaders (VOL LDR), Volunteer Student Leaders
with Other Experience (VOL LDR w/OTHER), Other Leaders (OTHER LDR) and Non-
Leaders (NON-LEADER). The dependent variables include two indications of
psychological well-being through the measurement of meaning in life (the SoMe & the
MLQ), one measure of subjective well-being via the SWLS and a meaningful work scale
(WAMI) that will be analyzed via its three subscales: Positive Meaning, Meaning-
Making through Work and Greater Good Motivations.

26
A significant MANOVA and follow up ANOVAs will be followed up with
planned contrasts designed to examine the six hypotheses presented in the next section.
The planned contrasts can be found in Table 1.
Table 1
Significant ANOVA Planned Contrasts
Contrast # Contrast Group 1 Contrast Group 2
1 EMP LDR and VOL LDR NON-LEADER
2 EMP LDR w/OTHER and VOL LDR w/OTHER NON-LEADER
3 EMP LDR and VOL LDR OTHER LDR
4 EMP LDR VOL LDR
5 EMP LDR EMP LDR w/OTHER
6 VOL LDR VOL LDR w/OTHER
Hypotheses
Previous research looking at the long-term impact of collegiate experiences has
shown that longer term experiences that are more developmental in nature have more of
an impact than shorter experience or experiences that simply put students in a leadership
position (Cress, et al., 2001; Bowman, et al., 2010; Bowman, et al., 2011). This study
will attempt to determine whether leadership experiences have an impact on long-term
well-being and whether the type, length and depth of the experiences matters. The
dependent variables have been selected to represent long-term high frequency
feedback/intense training and development experiences (EMP LDR and EMP LDR
w/OTHER), shorter term, less frequent feedback, lower intensity training and
development experiences (VOL LDR and VOL LDR w/OTHER) and experiences that
have little to no development or training (OTHER LDR and NON-LEADER).

27
In order to explore these potential differences this study will examines six hypotheses:
H1: When compared to Non-Leaders, Employed Student Leaders and Volunteer
Student Leaders will report significantly higher average levels of:
Satisfaction with life (SWLS)
Meaningfulness and purpose in their lives (MLQ and SoMe)
Meaningful work (Positive Meaning, Meaning-Making through Work and
Greater Good Motivations subscales of the WAMI).
H2: When compared to Non-Leaders, Employed Student Leaders with Other Experience
and Volunteer Student Leaders with Other Experience will report significantly higher
average levels of:
Satisfaction with life (SWLS)
Meaningfulness and purpose in their lives (MLQ and SoMe)
Meaningful work (Positive Meaning, Meaning-Making through Work and
Greater Good Motivations subscales of the WAMI).
H3: When compared to Other Leaders, Employed Student Leaders and Volunteer Student
Leaders will report significantly higher average levels of:
Satisfaction with life (SWLS)
Meaningfulness and purpose in their lives (MLQ and SoMe)
Meaningful work (Positive Meaning, Meaning-Making through Work and
Greater Good Motivations subscales of the WAMI).
28
H4: When compared to Volunteer Student Leaders, Employed Student Leaders will
report significantly higher average levels of:
Satisfaction with life (SWLS)
Meaningfulness and purpose in their lives (MLQ and SoMe)
Meaningful (Positive Meaning, Meaning-Making through Work and
Greater Good Motivations subscales of the WAMI).
H5: When comparing Employed Student Leaders and Employed Student Leaders with
Other Experience, no average differences will be found for:
Satisfaction with life (SWLS)
Meaningfulness and purpose in their lives (MLQ and SoMe)
Meaningful work (Positive Meaning, Meaning-Making through Work and
Greater Good Motivations subscales of the WAMI).
H6: When comparing Volunteer Student Leaders and Volunteer Student Leaders with
Other Experience, no average differences will be found for:
Satisfaction with life (SWLS)
Meaningfulness and purpose in their lives (MLQ and SoMe)
Meaningful work (Positive Meaning, Meaning-Making through Work and
Greater Good Motivations subscales of the WAMI).

29
Figure 1: Flowchart of research design and planned statistical analyses.
MANOVA
• 6 IVs: EMP LDR, EMP LDR w/OTHER, VOL LDR, VOL LDR w/OTHER, OTHER LDR, NON-LEADER
• 6 DVs: SWLS, MLQ, SoME, 3 WAMI Subscales
ANOVAs
• If the MANOVA is significant, follow-up ANOVAs will be condcted to determine which of the individual scales are significant.
Planned Contrasts
•Six planned contrasts (see Table 1) designed to examine the six hypotheses will be performed as post-hoc testing on the statistically significant ANOVAs.

30
Results
This study used a between subjects multivariate analysis of variance to study
possible average differences among six leadership groups of former college students on
the six dependent variables of SWLS, SoMe, MLQ, WAMI – Positive Meaning, WAMI
- Meaning-Making through Work and WAMI - Greater Good Motivations. Results were
calculated using SPSS statistical analysis software. In addition to confirming their status
as a former Employed Student Leader, a Volunteer Student Leader or a Non-Leader,
respondents were asked to list any other clubs or organizations in which they previously
held leadership positions to determine if other leadership experience might impact the
results. Composite scores using each author’s instructions were then calculated for each
scale for use during the analysis.
Assumptions of the Study
Like all similar projects, there are assumptions and limitations to this study. First,
while the sample size is adequate for the purposes of this study, the representativeness of
the sample is limited. One should be cautious when attempting to generalize the results
to the population at large as additional studies at other institutions are necessary before
any firm conclusions can be drawn. Second, even a statistically significant finding linking
a particular leadership activity to a higher average score on one of the scales will not
prove a causal relationship due to the self-reported nature of the data.
In order to secure responses from the relevant leadership groups (Resident
Advisors, Outriggers, MyMom and UPB) alumni email addresses were acquired from
those organizations while email addresses for non-leaders came from a random sample of

31
former students. While there is no way to determine why some alumni chose to respond
and others did not, using email addresses provided by the organizations could introduce
selection bias. It is possible that alumni with more positive memories of their experience
in those organizations may have been more likely to keep their contact information up to
date and may have been more likely to respond. Also, it was not possible to control
which participants were included in each group. Students self-selected their groups
during their undergraduate years making it impossible to randomly select group
members.
Finally, this study targeted former students who have not attended JMU as
undergraduates for at least 10 years. The hope was to reach alumni more established in
their lives and careers than more recent graduates. However, the gap between their date
of last attendance and this study also leaves open the possibility that they may have had
other life experiences that would impact their responses and the results of this study.
Respondents
The total number of completed surveys was ninety. Thirty respondents from the
Employed Student Leaders group, thirty one from the Volunteer Student Leaders group
and twenty nine from the Non-Leaders group (see Table 1). Also, forty seven
respondents indicated they had served in a leadership role in another organization during
their undergraduate years. These forty seven respondents were spread out through the
original three groups so the one independent variable was divided into six categories
representing each of the unique leadership groups: Employed Student Leader (EMP
LDR), Employed Student Leader with Other Experience (EMP LDR w/OTHER),
32
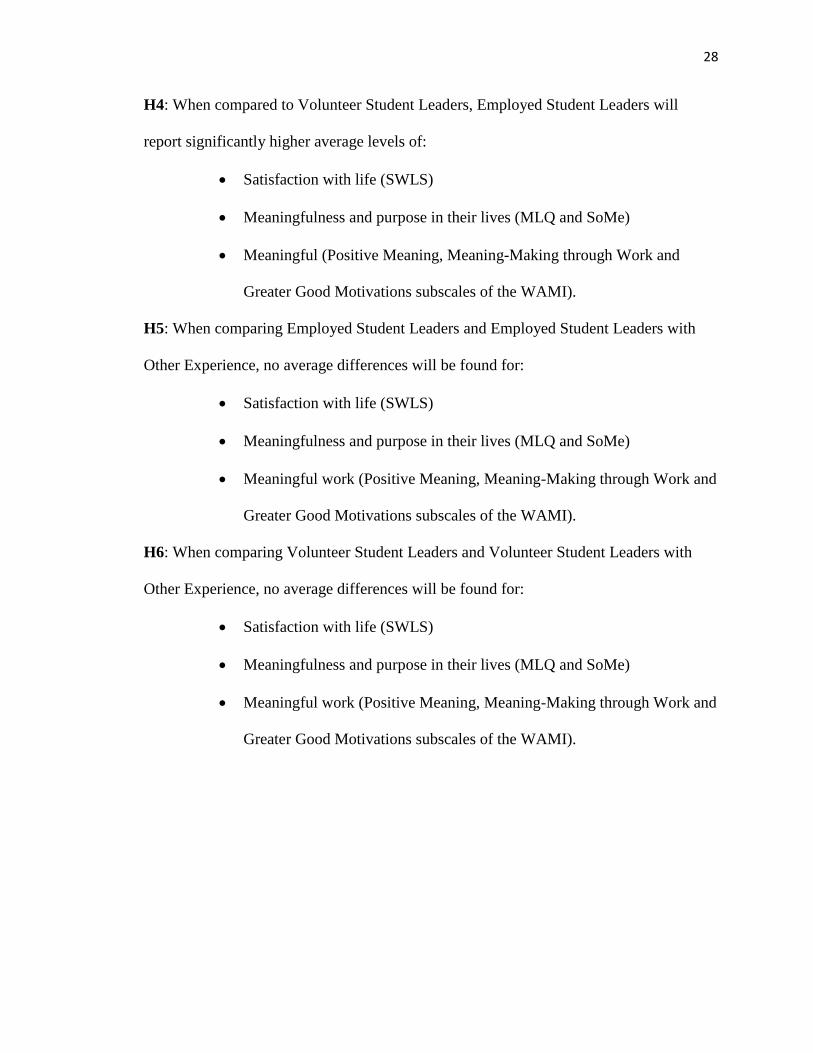
Volunteer Student Leader (VOL LDR), Volunteer Student Leader with Other Experience
(VOL LDR w/OTHER), Other Student Leader (OTHER LDR) and Non-Leader (NON-
LEADER).
Table 2
Group Means
LeaderGroup SWLS SoMe MLQ
WAMI –
Positive
Meaning
WAMI-
Meaning
Making
WAMI –
Greater
Good N
EMP LDR 9.80 15.73 29.00 13.13 9.73 9.80 15
EMP LDR w/OTHER 9.73 15.20 29.80 13.93 9.86 10.26 15
VOL LDR 12.10 15.80 26.70 13.10 8.90 9.50 10
VOL LDR w/OTHER 9.81 15.91 29.24 13.38 10.00 10.04 21
OTHER LDR 8.00 16.82 28.91 12.55 9.00 10.00 11
NON-LEADER 10.39 14.94 28.06 10.94 8.16 8.78 18
Total 9.94 15.67 28.73 12.81 9.32 9.72 90
Reliability
Using SPSS, reliability was calculated using Cronbach’s alpha coefficient of
internal consistency for each dependent variable scale. All six scales (SWLS, SoMe,
MLQ, WAMI – Positive Meaning, WAMI - Meaning-Making through Work and WAMI
- Greater Good Motivations) produced alpha scores higher than .60 making them
acceptable for research purposes (see Tables 2-7). Thus it was concluded that that each
scale has reasonable internal consistency. Because all three WAMI subscales produced
acceptable alpha coefficients it was decided to use them in the analysis instead of the
overall WAMI. Using the subscales will allow for greater detail in the examination of

33
any significant findings and will better distinguish which areas of meaningful work have
been influenced.
Table 3
SWLS – Scale Reliability
Reliability Statistics
Cronbach’s Alpha .87
N of Items 5
Item-Total Statistics
Item-Total
Correlation
In most ways my life is close to my ideal. .69
The conditions of my life are excellent. .74
I am satisfied with my life. .79
So far I have gotten the important things I want in life. .71
If I could live my life over, I would change almost nothing. .54
Table 4
SoMe: Meaningfulness Subscale – Scale Reliability
Reliability Statistics
Cronbach’s Alpha .86
N of Items 5
Item-Total Statistics
Item-Total
Correlation
I lead a fulfilled life. .47
I think there is meaning in what I do. .81
I have a task in life. .73
I feel part of a bigger whole. .76
I think my life has a deeper meaning. .63

34
Table 5
MLQ – Scale Reliability
Reliability Statistics
Cronbach’s Alpha .67
N of Items 10
Item-Total Statistics
Item-Total
Correlation
I understand my life’s meaning. .31
I am looking for something that makes my life feel meaningful. .26
I am always looking to find my life’s purpose. .52
My life has a clear sense of purpose. .37
I have a good sense of what makes my life meaningful. .25
I have discovered a satisfying life purpose. .35
I am always searching for something that makes my life feel significant. .44
I am seeking a purpose or mission for my life. .43
My life has no clear purpose (R). .22
I am searching for meaning in my life. .15
Table 6
WAMI: Positive Meaning Subscale – Scale Reliability
Reliability Statistics
Cronbach’s Alpha .81
N of Items 4
Item-Total Statistics
Item-Total
Correlation
I have found a meaningful career .58
I understand how my work contributes to my life’s meaning. .69
I have a good sense of what makes my job meaningful. .62
I have discovered work that has a satisfying purpose. .62

35
Table 7
WAMI: Meaning-Making through Work Subscale – Scale Reliability
Reliability Statistics
Cronbach’s Alpha .64
N of Items 3
Item-Total Statistics
Item-Total
Correlation
I view my work as contributing to my personal growth. .35
My work helps me better understand myself. .52
My work helps me make sense of the world around me. .49
Table 8
WAMI: Greater Good Motivations Subscale – Scale Reliability
Reliability Statistics
Cronbach’s Alpha .79
N of Items 3
Item-Total Statistics
Item-Total
Correlation
My work really makes no difference to the world (R). .57
I know my work makes a positive difference in the world. .73
The work I do serves a greater purpose. .63

36
MANOVA Assumptions
Homogeneity of variance and covariance
The assumption of the equality of variance between groups was tested using
Levene’s test. The six scales of interest all produced non-statistically significant results
indicating they satisfied this assumption (see Table 8). Additionally, the assumption of
homogeneity of covariance was also satisfied with Box’s M non-statistically significant at
the p < .001 level, M = 178.055, F = 1.347, p = .011 (Tabachnick and Fidell, p. 252,
2007). Due to the unequal group sizes in the sample, Pillai’s Trace was selected to be
used when interpreting MANOVA results in this study (Field, p. 605, 2009). Finally, the
smallest number of cases in any group is 10 participants which exceeds the total number
of dependent variables (6) so the sample size requirement for MANOVA has also been
satisfied.
Table 9
Levene’s Test Results
Scale F df1 df2 Sig.
SWLS 1.851 5 84 .112
SoMe 1.348 5 84 .252
MLQ 1.909 5 84 .101
WAMI – Positive Meaning 1.302 5 84 .271
WAMI – Meaning-Making through Work .154 5 84 .978
WAMI – Greater Good Motivations .447 5 84 .814
Multivariate Analysis
A between subjects multivariate analysis of variance was performed to study
possible differences among the six leader groups of Employed Student Leader, Employed

37
Student Leader with Other Experience, Volunteer Student Leader, Volunteer Student
Leader with Other Experience, Other Student Leader and Non-Leader on the six
dependent variables of SWLS, SoMe, MLQ, WAMI – Positive Meaning, WAMI –
Meaning-Making through Work, WAMI – Greater Good Motivations.
Table 10
Multivariate Statistics
Independent Variable Pillai’s Trace F Sig.
LeaderGroup .496 1.52 .040*
* - significant at p < .05 level
Table 11
SWLS - ANOVA Statistics
Level Independent Variable Sum of Squares df Mean Square F Sig.
Main LeaderGroup 92.97 5 18.60 2.15 .067
Table 12
SoMe - ANOVA Statistics
Level Independent Variable Sum of Squares df Mean Square F Sig.
Main LeaderGroup 28.68 5 5.74 .77 .572
Table 13
MLQ - ANOVA Statistics
Level Independent Variable Sum of Squares df Mean Square F Sig.
Main LeaderGroup 73.44 5 14.69 1.15 .343

38
Table 14
WAMI: Positive Meaning Subscale - ANOVA Statistics
Level Independent Variable Sum of Squares df Mean Square F Sig.
Main LeaderGroup 91.60 5 18.32 3.56 .006*
* - significant at p < .01 level
Table 15
WAMI: Meaning-Making through Work Subscale - ANOVA Statistics
Level Independent Variable Sum of Squares Df Mean Square F Sig.
Main LeaderGroup 43.59 5 8.72 2.40 .044*
* - significant at p < .05 level
Table 16
WAMI: Greater Good Motivations Subscale - ANOVA Statistics
Level Independent Variable Sum of Squares df Mean Square F Sig.
Main LeaderGroup 24.16 5 4.83 1.26 .289
The MANOVA results was statistically significant and so follow up ANOVAs
were performed (Field, p. 605, 2009) which indicated statistical significance for the
independent variable on two of the WAMI subscales: Positive Meaning and Meaning
Making through work. Planned contrasts based on the six hypotheses were performed to
determine differences between the groups in the independent variable (see Table 16). In
the first planned contrast, the Employed Student Leader and Volunteer Student Leader
groups were compared to the Non-Leader group. On average these two groups scored
higher than the Non-Leader group on the Positive Meaning subscale, t(84) = 3.07, p =

39
.003 but not on the Meaning-Making through Work subscale, t(84) = 1.93, p = .057.
Effect size for this comparison was moderate with r = .38. It should also be noted that
statistical power is limited for this comparison due to the modest sample size (N = 43). A
post hoc power analysis revealed that an n of approximately 58 would be needed to
obtain statistical power at the recommended .80 level (Cohen, 1988).
In the second planned contrast the Employed Student Leader with Other
Experience and the Volunteer Student Leader with Other Experience groups were also
compared to the Non-Leader group. On average the two leader groups reported greater
Positive Meaning and Meaning-Making through Work than the Non-Leader group, t(84)
= 4.123, p = .001 and t(84) = 3.191, p = .002. The effect size for both comparisons was
large with r = .44 on the Meaning-Making through Work subscale and r = .51 on the
Positive Meaning subscale. Both of these comparisons surpassed the recommended
statistical power level of .80.
Because the comparison were non-orthogonal, Bonferroni post hoc tests were
performed to control for Type 1 errors. Post hoc testing confirmed that Employed
Student Leader and Volunteer Student Leader groups reported significantly higher levels
Positive Meaning through work when compared with Non-Leaders (p < .05). Post hoc
testing also confirmed that Employed Student Leader with Other Experience and the
Volunteer Student Leader with Other Experience reported higher levels of Positive
Meaning and Meaning-Making through Work than Non-Leaders (p < .05).
There were no significant differences found for any of the other four planned
contrasts (see Tables 17 and 18). The third contrast compared Employed Student Leaders
and Volunteer Student Leaders to Other Leaders. The fourth contrast compared

40
Employed Student Leaders to Volunteer Student Leaders. The fifth contrast compared
Employed Student Leaders to Employed Student Leaders with Other Experience and the
sixth contrast compared Volunteer Student Leaders to Volunteer Student Leaders with
Other Experience.
Table 17
ANOVA Planned Contrasts Coefficients
Contrast # EMP LDR
EMP LDR
w/OTHER VOL LDR
VOL LDR
w/OTHER
OTHER
LDR
NON-
LEADER
1 1 0 1 0 0 -2
2 0 1 0 1 0 -2
3 1 0 1 0 -2 0
4 1 0 -1 0 0 0
5 1 -1 0 0 0 0
6 0 0 1 -1 0 0
Table 18
WAMI: Positive Meaning Subscale - Planned Contrasts Results
Contrast # Contrast Group 1 Contrast Group 2 t Df Sig.
1 EMP LDR and VOL LDR NON-LEADER 3.07 84 .003*
2 EMP LDR w/OTHER and
VOL LDR w/OTHER
NON-LEADER 4.12 84 .000**
3 EMP LDR and VOL LDR OTHER LDR .69 84 .491
4 EMP LDR VOL LDR .04 84 .971
5 EMP LDR EMP LDR w/OTHER -.97 84 .337
6 VOL LDR VOL LDR w/OTHER -.32 84 .748
* - significant at p < .01 level
** - significant at p < .001 level

41
Table 19
WAMI: Meaning-Making through Work - Planned Contrasts Results
Contrast # Contrast Group 1 Contrast Group 2 t df Sig.
1 EMP LDR and VOL LDR NON-LEADER 1.93 84 .057
2 EMP LDR w/OTHER and
VOL LDR w/OTHER
NON-LEADER 3.19 84 .002*
3 EMP LDR and VOL LDR OTHER LDR .46 84 .650
4 EMP LDR VOL LDR 1.07 84 .288
5 EMP LDR EMP LDR w/OTHER -.191 84 .849
6 VOL LDR VOL LDR w/OTHER -1.50 84 .137
* - significant at p < .01 level

42
Results of Hypotheses
H1: When compared to Non-Leaders, Employed Student Leaders and Volunteer
Student Leaders will report significantly higher average levels of:
Satisfaction with life (SWLS)
Meaningfulness and purpose in their lives (MLQ and SoMe)
Meaningful work (Positive Meaning, Meaning-Making through Work and
Greater Good Motivations subscales of the WAMI).
H2: When compared to Non-Leaders, Employed Student Leaders with Other Experience
and Volunteer Student Leaders with Other Experience will report significantly higher
levels of:
Satisfaction with life (SWLS)
Meaningfulness and purpose in their lives (MLQ and SoMe)
Meaningful work (Positive Meaning, Meaning-Making through Work and
Greater Good Motivations subscales of the WAMI).
Findings: Partial support was found for Hypothesis 1 and Hypothesis 2. While no
difference was found in the areas of satisfaction with life and meaningfulness and
purpose in life, support was found for a significant difference in the area of meaningful
work amongst the Employed Student Leader and Volunteer Student Leader groups when
compared to Non-Leaders. Specifically, Employed Student Leaders and Volunteer
Student Leaders, on average, reported higher levels of positive meaning in their work
than Non-Leaders. Similarly, for Hypothesis 2, Employed Student Leaders with Other

43
Experience and Volunteer Student Leaders with Other Experience, on average, reported
higher levels of positive meaning in their work and higher levels of meaning-making
through work.
H3: When compared to Other Leaders, Employed Student Leaders and Volunteer Student
Leaders will report significantly higher average levels of:
Satisfaction with life (SWLS)
Meaningfulness and purpose in their lives (MLQ and SoMe)
Meaningful work (Positive Meaning, Meaning-Making through Work and
Greater Good Motivations subscales of the WAMI).
H4: When compared to Volunteer Student Leaders, Employed Student Leaders will
report significantly higher average levels of:
Satisfaction with life (SWLS)
Meaningfulness and purpose in their lives (MLQ and SoMe)
Meaningful (Positive Meaning, Meaning-Making through Work and
Greater Good Motivations subscales of the WAMI).
Findings: No support was found for Hypothesis 3 and Hypothesis 4. Employed Student
Leaders and Volunteer Student Leaders did not report higher levels of satisfaction or
meaningfulness in any area when compared to Other Leaders nor did Employed Student
Leaders when compared to Volunteer Student Leaders.

44
H5: When comparing Employed Student Leaders and Employed Student Leaders with
Other Experience, no average difference will be found for:
Satisfaction with life (SWLS)
Meaningfulness and purpose in their lives (MLQ and SoMe)
Meaningful work (Positive Meaning, Meaning-Making through Work and
Greater Good Motivations subscales of the WAMI).
H6: When comparing Volunteer Student Leaders and Volunteer Student Leaders with
Other Experience, no average differences will be found for:
Satisfaction with life (SWLS)
Meaningfulness and purpose in their lives (MLQ and SoMe)
Meaningful work (Positive Meaning, Meaning-Making through Work and
Greater Good Motivations subscales of the WAMI).
Findings: Hypothesis 5 and Hypothesis 6 were both fully supported. No statistically
significant difference was found on any of the scales when comparing the Employed
Student Leaders to the Employed Student Leaders with Other Experience and no
difference was found when comparing the Volunteer Student Leaders to the Volunteer
Student Leaders with Other Experience.

45
Discussion
Conclusions
The purpose of this study was to better understand the impact college leadership
development might have on long term well-being and meaningful work of graduates. A
range of alumni were surveyed including those involved in paid leadership positions,
unpaid leadership positions, and those with no reported leadership experiences while as
undergraduates. It was hypothesized that specific types of experiences that involved
focused leadership development (and not just occupying a leadership position) would
lead to long lasting effects of personal well-being and meaning.
Results demonstrated that the main impact of these experiences appears to be in
the area of meaningful work. Alumni who previously served as Employed Student
Leaders or Volunteer Student Leaders reported higher levels of positive meaning at work.
The Positive Meaning subscale of the WAMI is intended to measure the degree to which
people find their work to hold personal meaning, significance, or purpose. The same is
true for the Employed Student Leaders with Other Experience and the Volunteer Student
Leaders with Other Experience. Additionally, these two groups also reported higher
levels of meaning-making through work. The Meaning-Making through Work subscale
is intended to measure how much respondents rely on their work to help them to make
sense of their life experiences.
These are important findings for higher education. The implication is that there is
a link between targeted leadership development and finding ones work to be more than a
job but rather a significant and purposeful part of their lives. In an era where the cost of
college attendance is being scrutinized and the value of out-of-classroom experiences is

46
being questioned and many attendees want to see a direct connection between their
degree and their career aspirations, this appears to help demonstrate the value of
continuing to fund these types of extracurricular experiences. Perhaps, most importantly,
the impact appears to be connected to the professional arena, meaning these collegiate
experiences could help colleges make the connection between out-of-classroom
experiences and greater career satisfaction.
These findings should also be of interest to the employers of recent college
graduates. As Gallup found, employees who are engaged at work are both more loyal
and more productive (Gallup-Purdue, 2014). Gallup defined workplace engagement as
being emotionally and intellectually connected to their organization because they enjoyed
and found value in their work. Based on this definition, Gallup’s work place engagement
is strongly connected to positive meaning and meaning-making through work. Most
employers already look for co-curricular collegiate involvement and leadership when
they hire new employees just out of college. The results of this study, which indicate that
students engaged in leadership development activities as undergraduates are more likely
to have higher levels of well-being later in life, should help employers better focus their
review of this involvement. Savvy employers should look for more developmental
leadership experiences, knowing that these applicants are more likely to be fully engaged
at work and more positive members of their team.
Interestingly, there appeared to be no similar benefit when we examined Other
Leaders. The Other Leaders group consisted of alumni who self-reported that they had
held a leadership position in a campus group other than a directed institutional leadership
program like UPB, MyMom or Outriggers. Other Leaders also never worked as Resident

47
Advisors. Unlike the Employed Student Leaders and Volunteer Student Leaders, alumni
in the Other Leaders group served as executive officers but did not receive the same
intensive leadership development training and guidance. The only area in which other
leadership experience had an effect was on the Meaning-Making through Work subscale
and only when combined with experience as an Employed Student Leader or a Volunteer
Student Leader. This is also an important finding. The implication here is that while
leadership experience itself has some benefit, the greater value can be found in
experiences that actually provide for leadership development and have a more formal
development structure.
The results of the final two contrasts seem to support this conclusion. No
difference was found when comparing the Employed Student Leaders to Employed
Student Leaders with Other Experience nor when comparing Volunteer Student Leaders
to Volunteer Student Leaders with Other Experience. Being a leader in another
organization did not have an additive effect in the area of meaningful work. While
previous research has demonstrated the long term benefits of any leadership experience
on other areas of well-being, it does not appear that this is true when examining the
impact on meaningful work. A deeper and more developmental experience appears to be
required rather than simply occupying a leadership position.
This important finding should have an impact on the way colleges prioritize their
out-of-classroom opportunities. When given the choice, they should be focusing on
programs that offer leadership development and not just leadership experience.
Structured training programs coordinated by members of the Student Affairs field should
be more prevalent. Whether they are full-fledged leadership development programs like

48
the ones used in this study or simply requiring more of the elected student leaders of the
various clubs and organizations already on campus, focused development is the key.
Students need to be trained in how to be leaders. They must be challenged and given
goals to achieve as well as provided with mentoring and leadership education throughout
their experience. They need to be taught how to handle adversity as a leader and how to
pass this knowledge on to others. These types of programs provides greater benefit to the
institution in the present as well as to the student both now and in the future. Further, by
providing more structure to their leadership offerings, colleges can demonstrate to
employers that the experiences listed on the resumés of recent graduates are of high
quality and indicative of real leadership potential.
However, it is also unclear why no difference was found in levels of satisfaction
and meaningfulness in contrast three, which compared Employed Student Leaders and
Volunteer Student Leaders to Other Leaders. One possibility is that while the Employed
Student Leaders and the Volunteer Student Leaders were ready for deeper leadership
development experiences during their undergraduate years, the Other Leaders were only
beginning the exploration of their leadership potential during that time period but have
since had additional experiences that impacted the results of this study. Another
possibility is that other leadership experiences do have a small impact on meaningful
work but the limitations of this study are preventing them from being detected.
Finally, the absence of a difference between the Employed Student Leader group
and the Volunteer group is also good news for colleges generally, as well as residential
life programs specifically. The finding that paid and unpaid positions do not produce
significantly different levels of positive meaning and meaning-making through work

49
indicates that providing these opportunities for students is not necessarily tied to being
able to pay them. This is important from a funding perspective as it is obviously more
cost effective for a university to create volunteer opportunities for students than to find
funding for paid positions. That being said, paid student positions are still necessary in
several areas at most universities, residence life often being one of the most popular
examples.
For residence life programs there is an opportunity to enhance their recruitment
efforts with this information. RA positions can often be somewhat unattractive to
students because they usually require a more significant time commitment than many
other leadership positions and RAs are sometime forced to hold their peers accountable
for policy violations. Many programs try to entice students to apply for RA positions by
highlighting not just the salary but other transferable skills and career benefits.
Connecting the RA position to greater workplace wellness seems like an excellent way to
entice higher caliber candidates to apply for these positions. Residence Life programs
can also make use of this information when they advocate for additional funding for new
positions. Colleges and universities are not just allocating salary money but are also
funding opportunities that provide a unique and valuable out-of-classroom experience
that impacts long term well-being. In an era where funding is becoming more scarce,
being a able to demonstrate the multiple benefits of a position is a valuable tool in the
fight for more resources.
Suggestions for Further Research
The idea of connecting the collegiate experience to long term well-being and
meaningful work is one that is growing in popularity and importance. As traditional

50
colleges and universities attempt to maintain their status in both the collegiate market
place as well as society at large, college administrators must be able to demonstrate the
value of the total college experience extends beyond simply earning a degree. This study
of out-of-class experiences is just one attempt at trying to demonstrate that value.
While the results of this study are encouraging, caution must be taken before
attempting to generalize the results. The size of the sample and the fact that only one
institution was involved allows only for the belief that thee appears to be some
connection between collegiate leadership development and well-being. A similar study
with a larger sample size using multiple institutions is necessary before more ambitious
conclusions can be made.
Also, as mentioned in the Limitations section above, it is not known what other
leadership experiences these alumni may have had since graduation. It is possible that
other experiences, provided by their employers for instance, have impacted their lives
similarly. Additional study needs to be done to determine whether these benefits are
unique to experiences during the developmental college years or whether they can be
experienced at other points in time.
This study did not attempt to control for a variety of socio-economic factors. It
would be of great value to know whether students of a particular gender, ethnicity or
economic background experienced greater benefits from these programs and why that
might be the case. As colleges and universities continue to refine their recruitment and
marketing techniques, understanding which programs most directly benefit which
students would be an invaluable tool. This would not only allow schools to better market

51
themselves but would also allow them to develop programs that most effectively address
the needs of their students.
Studies similar to this one are an important part of the future of higher education.
Colleges must continue to grow the breadth of research that connects their efforts to
general well-being and meaningful work. The federal government has already shown
that it is ready to step in and provide data on what it deems to be college “success”.
Many of these metrics (starting salary, student loan debt, etc.) are useful but misleading
when viewed alone. If colleges do not provide context for these measurements and data
of their own regarding the importance of a full college experience, students and their
families will be forced to make their decisions based on incomplete data. More
importantly, without evidence to demonstrate the worth of programs like MyMOM, UPB
and Outriggers, policy makers looking to reduce the cost of higher education for their
constituents will focus on those programs as unnecessary and ripe for discontinuation. It
is through studies like this one that higher education can be demonstrate that the value of
a full college education extends beyond the numbers on a paycheck and has long lasting
effects on a graduate’s personal well-being.

52
Appendix A - The Satisfaction With Life Scale
Below are five statements that you may agree or disagree with. Using the 1 - 7
scale below, indicate your agreement with each item by placing the appropriate number
on the line preceding that item. Please be open and honest in your responding.
7 - Strongly agree
6 - Agree
5 - Slightly agree
4 - Neither agree nor disagree
3 - Slightly disagree
2 - Disagree
1 - Strongly disagree
____ In most ways my life is close to my ideal.
____ The conditions of my life are excellent.
____ I am satisfied with my life.
____ So far I have gotten the important things I want in life.
____ If I could live my life over, I would change almost nothing.
Scoring:
31 - 35 Extremely satisfied
26 - 30 Satisfied
21 - 25 Slightly satisfied
20 Neutral
15 - 19 Slightly dissatisfied
10 - 14 Dissatisfied
5 - 9 Extremely dissatisfied

53
Appendix B - The Meaning in Life Questionnaire
Please take a moment to think about what makes your life and existence feel
important and significant to you. Please respond to the following statements as truthfully
and accurately as you can, and also please remember that these are very subjective
questions and that there are no right or wrong answers. Please answer according to the
scale below:
Absolutely
Untrue
Mostly
Untrue
Somewhat
Untrue
Can’t Say
True or
False
Somewhat
True
Mostly
True
Absolutely
True
1 2 3 4 5 6 7
1. I understand my life’s meaning.
2. I am looking for something that makes my life feel meaningful.
3. I am always looking to find my life’s purpose.
4. My life has a clear sense of purpose.
5. I have a good sense of what makes my life meaningful.
6. I have discovered a satisfying life purpose.
7. I am always searching for something that makes my life feel significant.
8. I am seeking a purpose or mission for my life.
9. My life has no clear purpose.
10. I am searching for meaning in my life.
Scoring:
Item 9 is reverse scored.
Items 1, 4, 5, 6, & 9 make up the Presence of Meaning subscale
Items 2, 3, 7, 8, & 10 make up the Search for Meaning subscale
Scoring is kept continuous.
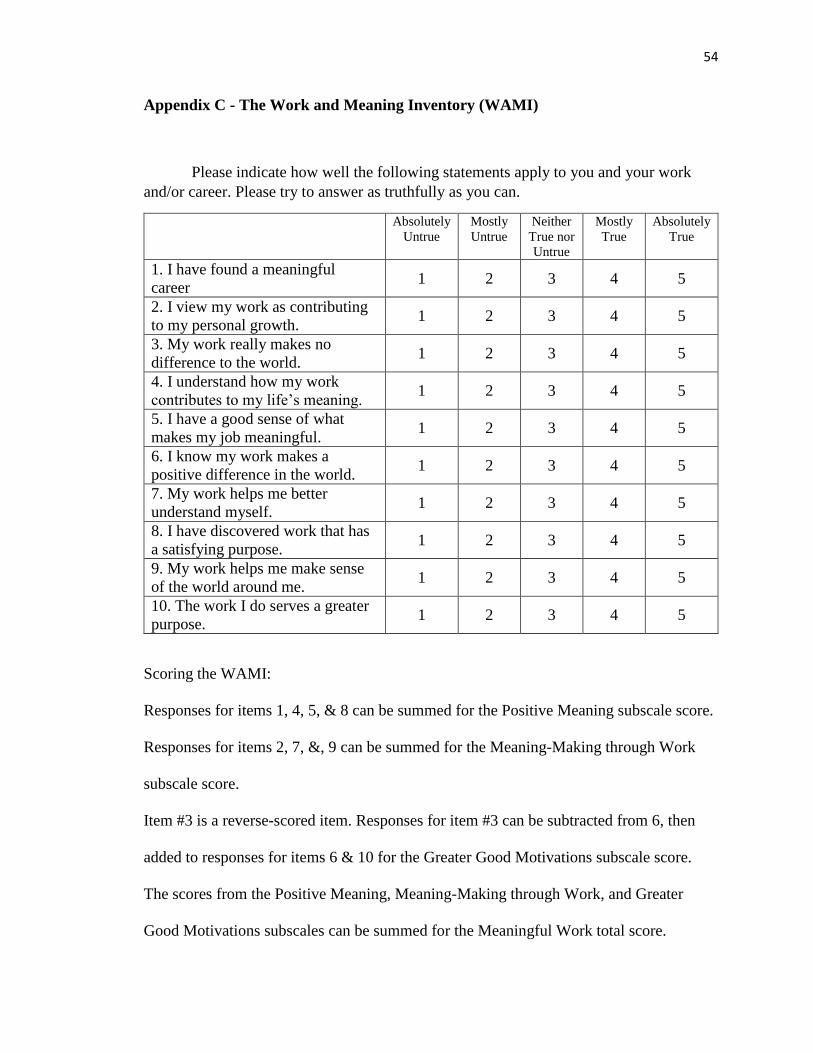
54
Appendix C - The Work and Meaning Inventory (WAMI)
Please indicate how well the following statements apply to you and your work
and/or career. Please try to answer as truthfully as you can.
Absolutely
Untrue
Mostly
Untrue
Neither
True nor
Untrue
Mostly
True
Absolutely
True
1. 1. I have found a meaningful
career 1 2 3 4 5
2. I view my work as contributing
to my personal growth. 1 2 3 4 5
3. My work really makes no
difference to the world. 1 2 3 4 5
4. I understand how my work
contributes to my life’s meaning. 1 2 3 4 5
5. I have a good sense of what
makes my job meaningful. 1 2 3 4 5
6. I know my work makes a
positive difference in the world. 1 2 3 4 5
7. My work helps me better
understand myself. 1 2 3 4 5
8. I have discovered work that has
a satisfying purpose. 1 2 3 4 5
9. My work helps me make sense
of the world around me. 1 2 3 4 5
10. The work I do serves a greater
purpose. 1 2 3 4 5
Scoring the WAMI:
Responses for items 1, 4, 5, & 8 can be summed for the Positive Meaning subscale score.
Responses for items 2, 7, &, 9 can be summed for the Meaning-Making through Work
subscale score.
Item #3 is a reverse-scored item. Responses for item #3 can be subtracted from 6, then
added to responses for items 6 & 10 for the Greater Good Motivations subscale score.
The scores from the Positive Meaning, Meaning-Making through Work, and Greater
Good Motivations subscales can be summed for the Meaningful Work total score.
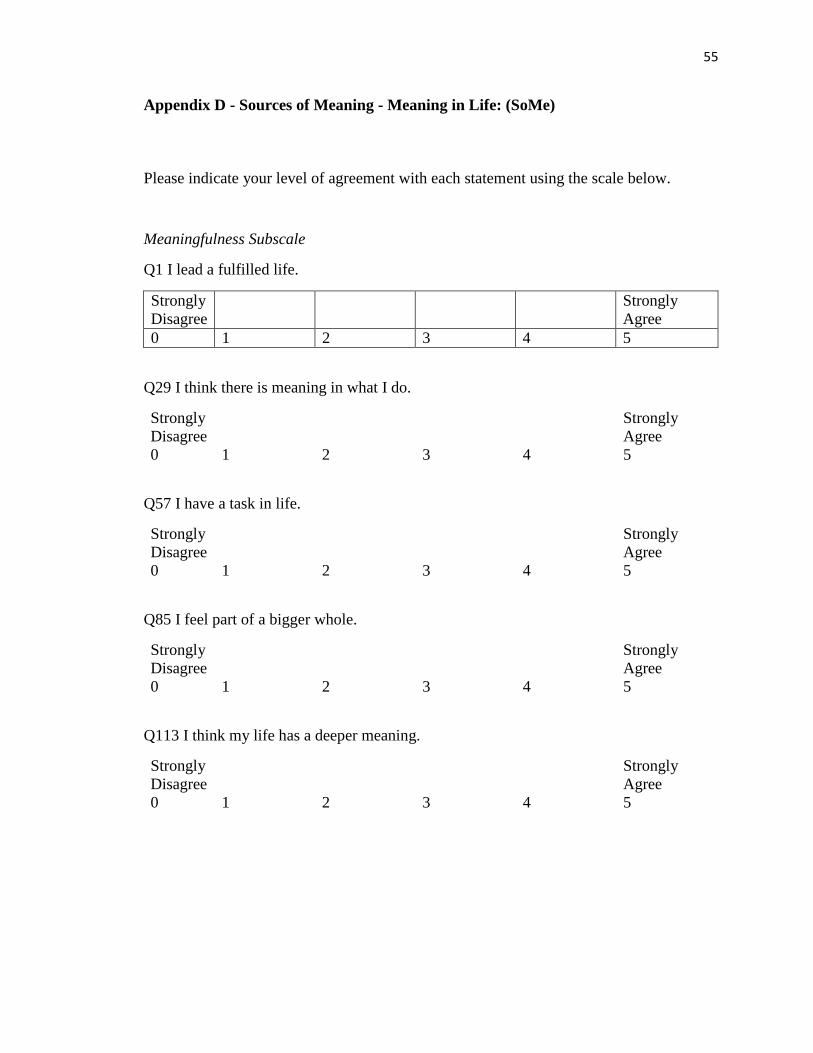
55
Appendix D - Sources of Meaning - Meaning in Life: (SoMe)
Please indicate your level of agreement with each statement using the scale below.
Meaningfulness Subscale
Q1 I lead a fulfilled life.
Strongly
Disagree
Strongly
Agree
0 1 2 3 4 5
Q29 I think there is meaning in what I do.
Strongly
Disagree
Strongly
Agree
0 1 2 3 4 5
Q57 I have a task in life.
Strongly
Disagree
Strongly
Agree
0 1 2 3 4 5
Q85 I feel part of a bigger whole.
Strongly
Disagree
Strongly
Agree
0 1 2 3 4 5
Q113 I think my life has a deeper meaning.
Strongly
Disagree
Strongly
Agree
0 1 2 3 4 5

56
References
Adler, M. G., & Fagley, N. S. (2005). Appreciation: Individual differences in finding
value and meaning as a unique predictor of Subjective Well-Being. Journal Of
Personality, 73(1), 79.
Andrews, M. F., & Whitney, B. S. (1976). Social indicators of well-being. New York,
NY: Plenum Press,
Astin, A. W. (1977). Four critical years. San Francisco, CA: Jossey-Bass.
Azzam, T., & Riggio, R. E. (2003). Community based civic leadership programs: A
descriptive investigation. Journal of Leadership & Organizational Studies, 10(1),
55-68.
Battista, J., & Almond, R. (1973). The development of meaning in life. Psychiatry, 36(4),
409-427.
Bowman, N. A., Brandenberger, J. W., Hill, P. L., & Lapsley, D. K. (2011). The long-
term effects of college diversity experiences: Well-being and social concerns 13
years after graduation. Journal Of College Student Development, 52(6), 729-739.
Bowman, N., Brandenberger, J., Lapsley, D., Hill, P., & Quaranto, J. (2010). Serving in
college, flourishing in adulthood: Does community engagement during the college
years predict adult well-being? Applied Psychology: Health & Well-Being, 2(1),
14-34.
Colby, A., Ehrlich, T., Beaumont, E., & Stephens, J., (2003). Educating undergraduates
for responsible citizenship. Change, 35(6), 40-48.
Cress, C. M., Astin, H. S., Zimmerman-Oster, K., & Burkhardt, J. C. (2001).

57
Developmental outcomes of college students' involvement in leadership activities.
Journal Of College Student Development, 42(1), 15-27.
Crumbaugh, J. C., & Maholick, L. T. (1964). An experimental study in existentialism:
The psychometric approach to Frankl’s concept of Noogenic Neurosis. Journal Of
Clinical Psychology, 202, 1-207.
Debats, D. L., van der Lubbe, P. M., & Wezeman, F. R. (1993). On the psychometric
properties of the life regard index (LRI): A measure of meaningful life. An
evaluation in three independent samples based on the Dutch version. Personality
And Individual Differences, 14, 337-345.
Diener, E., Emmons, R. A., Larsen, R. J., & Griffin, S. (1985). The Satisfaction With
Life Scale. Journal Of Personality Assessment, 49(1), 71-75.
Diener, E., Inglehart, R., & Tay, L. (2013). Theory and validity of life satisfaction scales.
Social Indicators Research, 112(3), 497-527.
Diener, E., Suh, E. M., Lucas, R. E., & Smith, H. L. (1999). Subjective Well-Being:
Three decades of progress. Psychological Bulletin, 125(2), 276-302.
Dik, B. J., Eldridge, B. M., Steger, M. F., & Duffy, R. D. (2012). Development and
validation of the Calling and Vocation Questionnaire (CVQ) and Brief Calling
Scale (BCS). Journal Of Career Assessment, 20(3), 242-263
Dik, B. J., Sargent, A. M., & Steger, M. F. (2008). Career development strivings:
Assessing goals and motivation in career decision-making and planning. Journal
Of Career Development, 35(1), 23-41.
Duffy, R. D., & Raque-Bogdan, T. L. (2010). The motivation to serve others: Exploring
relations to career development. Journal Of Career Assessment, 18(3), 250-265.
58
Eid, M., & Diener, E. (2004). Global judgments of subjective well-being: Situational
variability and long-term stability. Social Indicators Research, (3), 245.
Field, A. P. (2009). Discovering statistics using SPSS: (and sex, drugs and rock 'n' roll).
Thousand Oaks, CA.: Sage Publications.
Fordyce, M. W. (1977). Development of a program to increase personal happiness.
Journal of Counseling Psychology, 24, 511-520.
Gurin, G., Veroff, J., & Feld, S. (1960). Americans view their mental health: A
nationwide interview survey. New York, NY: Basic Bks.
Kashdan, T. B., & Breen, W. E. (2007). Materialism and diminished well-being:
Experiential avoidance as a mediating mechanism. Journal Of Social & Clinical
Psychology, 26(5), 521-539.
Keyes, C. M., Shmotkin, D., & Ryff, C. D. (2002). Optimizing well-being: The
empirical encounter of two traditions. Journal Of Personality & Social
Psychology, 82(6), 1007.
Kezar, A., & Moriarty, D. (2000). Expanding our understanding of student leadership
development: a study exploring gender and ethnic identity. Journal Of College
Student Development, 41(1), 55-69.
Komives, S. R., Lucas, N., & McMahon, T. R. (1998). Exploring leadership: For
college students who want to make a difference. San Francisco, CA: Jossey-Bass
Kuh, G. D., Cruce, T. M., Shoup, R., Kinzie, J., & Gonyea, R. M. (2008). Unmasking the
effects of student engagement on first-year college grades and persistence.
Journal Of Higher Education, 79(5), 540-563.
Lawton, M. P. (1975). The Philadelphia Geriatric Center Morale Scale: a revision.
59
Journal Of Gerontology, 30(1), 85-89.
Locke, E. A. (2001). Motivation by goal setting. In R. T. Golembiewski (Ed.), Handbook
of organizational behavior (Second ed., Vol. 87, pp. 43-56). New York, NY:
Marcel Dekker. Retrieved from
http://books.google.com/books?hl=en&lr=&id=g5pD9ciNvA0C&oi=fnd&pg=PR
5&dq=golembiewski+ed+handbook+of+organizational+behavior+community&ot
s=uUQInCxJxq&sig=H74WiFTbX0oOuoNO5FTwrmh6eVw#v=onepage&q=gol
embiewski%20ed%20handbook%20of%20organizational%20behavior%20comm
unity&f=false
Lucas, R. E., Clark, A. E., Georgellis, Y., & Diener, E. (2003). Reexamining adaptation
and the set point model of happiness: Reactions to changes in marital status.
Journal Of Personality And Social Psychology, 84(3), 527-539
Lucas, R. E., Diener, E., & Suh, E. (1996). Discriminant validity of well-being
measures. Journal Of Personality & Social Psychology, 71, 616-628.
Neugarten, B. L., Havighurst, R. J., & Tobin, S. S. (1961). The measurement of life
satisfaction. Journal Of Gerontology, 16, 134-143.
Owen, J. E. (2012). Findings from the multi-institutional study of leadership institutional
survey: a national report. College Park, MD: National Clearinghouse for
Leadership Programs.
Pace, C. R. (1979). Measuring outcomes of college: fifty years of findings and
recommendations for the future. San Francisco, CA: Jossey-Bass.
Park, N., Park, M., & Peterson, C. (2010). When is the search for meaning related to
life satisfaction? Applied Psychology: Health & Well-Being, 2(1), 1.
60
Pascarella, E. T., & Terenzini, P. T. (2005). How college affects students: a third decade
of research. San Francisco, CA: Jossey-Bass.
Pavot, W., Diener, E., Colvin, C. R., & Sandvik, E. (1991). Further validation of the
Satisfaction With Life Scale: Evidence for the cross-method convergence of well-
being measures. Journal Of Personality Assessment, 57(1), 149-161
Ryan, R., & Deci, E., (2001). On happiness and human potentials: A review of
research on hedonic and eudaimonic well-being. Annual Review Of Psychology,
52, 141-166.
Ryff, C. (1989). Beyond Ponce de Leon and life satisfaction: New directions in
quest of successful ageing. International Journal Of Behavioral Development,
12(1), 35-55.
Ryff, C., & Keyes, C. (1995). The structure of Psychological Well-Being revisited.
Journal Of Personality And Social Psychology, 69(4), 719-727.
Schimmack, U., Diener, E., & Oishi, S. (2002). Life-satisfaction is a momentary
judgment and a stable personality characteristic: The use of chronically accessible
and stable sources. Journal Of Personality, 70(3), 345-384.
Schnell, T. (2009). The Sources of Meaning and Meaning in Life Questionnaire (SoMe):
Relations to demographics and well-being. Journal Of Positive Psychology, 4(6),
483.
Schnell, T., & Becker, P. (2006). Personality and meaning in life. Personality &
Individual Differences, 41(1), 117-129.
Schulenberg, S., Schnetzer, L., & Buchanan, E. (2011). The Purpose in Life Test-Short

61
Form: Development and psychometric support. Journal Of Happiness Studies,
12(5), 861-876.
Schulenberg, S., Strack, K., & Buchanan, E. (2011). The Meaning In Life Questionnaire:
Psychometric properties with individuals with serious mental illness in an
inpatient setting. Journal Of Clinical Psychology, 67(12), 1210-1219.
Schwarz, N., & Clore, G. L. (1983). Mood, misattribution, and judgments of well-being:
informative and directive functions of affective states. Journal Of Personality &
Social Psychology, 45. 512-523.
Schwarz, N., Strack, F., Kommer, D., & Wagner, D. (1987). Soccer, rooms, and the
quality of your life: Mood effects on judgments of satisfaction with life in general
and with specific domains. European Journal Of Social Psychology, 17(1), 69-79.
Senécal, C., Nouwen, A., & White, D. (2000). Motivation and dietary self-care in
adults with Diabetes: Are self-efficacy and autonomous sef-regulation
complementary or competing constructs? Health Psychology, 19(5), 452-457.
Steger, M. F., Dik, B. J., & Duffy, R. D. (2012). Measuring meaningful work: The Work
and Meaning Inventory (WAMI). Journal Of Career Assessment, 20(3), 322-337.
Steger, M. F., Frazier, P., & Oishi, S. (2006). The Meaning in Life Questionnaire:
Assessing the presence of and search for meaning in life. Journal Of Counseling
Psychology, 53(1), 80-93.
Steger, M. F., & Kashdan, T. B. (2007). Stability and specificity of meaning in Life
and life satisfaction over one year. Journal Of Happiness Studies, 8(2), 161-179.
Sullivan, W. M., & Rosin, M. S. (2008). A life on the mind for practice: Bridging
liberal and professional education. Change, 40(2), 44-47.

62
Tabachnick, B. G., & Fidell, L. S. (2006). Using Multivariate Statistics, 5th edition.
Boston: Pearson.
The 2014 Gallup-Purdue Index Report. (2014). Retrieved from
http://products.gallup.com/168857/gallup-purdue-index-inaugural-national-
report.aspx.
Trent, J. W., & Medsker, L. L. (1968). Beyond high school; a psychosociological study of
10,000 high school graduates. San Francisco, CA, Jossey-Bass, 1968.
Waterman, A. S., Schwartz, S. J., & Conti, R. (2008). The implications of two
conceptions of happiness (hedonic enjoyment and eudaimonia) for the
understanding of intrinsic motivation. Journal Of Happiness Studies, 9(1), 41-79.
Whittington, B. L., & Scher, S. J. (2010). Prayer and Subjective Well-Being: An
examination of six different types of prayer. International Journal For The
Psychology Of Religion, 20(1), 59-68.
Zimmerman-Oster, K., & Burkhardt, J. C. (1999). Leadership in the making: A
comprehensive examination of the impact of leadership development programs on
students. Journal Of Leadership & Organizational Studies, 6(3/4), 50.
Zukin, C., & Szeltner, M. (2012). Talent Report: What Workers Want in 2012. Retrieved
from the Net Impact website October 2, 2014:
https://netimpact.org/docs/publications-docs/talent-report-what-workers-want-in-
2012-full-report.