Embed Size (px)
Citation preview

The Impact of China-Africa Trade Relations:
Case Study of Cameroon
By
Sunday Aninpah Khan, Francis Menjo Baye and Godwill K. Tange Department of Economics and Management
University of Yaoundé II, Cameroon
P.O. Box 30726 Yaoundé
E-mail: [email protected], [email protected] and [email protected]
In-Depth Country Case Study on China-Africa Trade Relations
Final Report submitted to the African Economic Research Consortium (AERC)
October 2009
Formatted: Left: 1", Right: 1", Header distance from edge: 0.49", Footer distance from edge: 0.49"
1
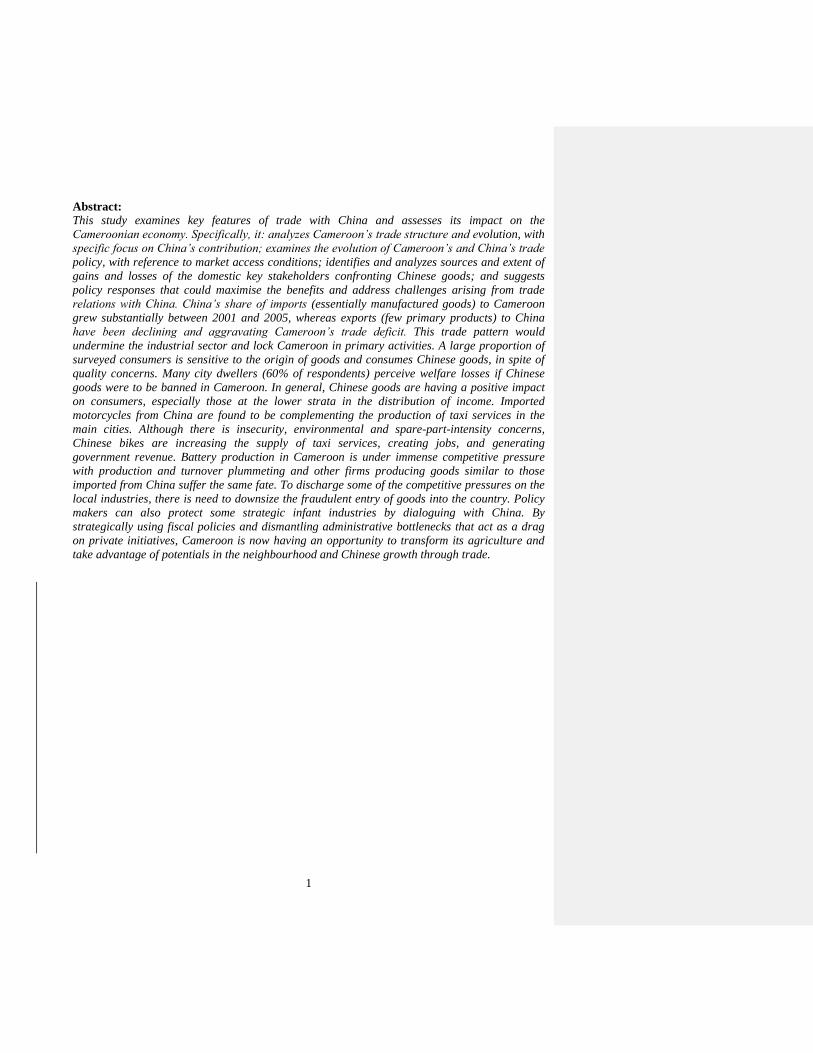
Abstract:
This study examines key features of trade with China and assesses its impact on the
Cameroonian economy. Specifically, it: analyzes Cameroon’s trade structure and evolution, with
specific focus on China’s contribution; examines the evolution of Cameroon’s and China’s trade
policy, with reference to market access conditions; identifies and analyzes sources and extent of
gains and losses of the domestic key stakeholders confronting Chinese goods; and suggests
policy responses that could maximise the benefits and address challenges arising from trade
relations with China. China’s share of imports (essentially manufactured goods) to Cameroon
grew substantially between 2001 and 2005, whereas exports (few primary products) to China
have been declining and aggravating Cameroon’s trade deficit. This trade pattern would
undermine the industrial sector and lock Cameroon in primary activities. A large proportion of
surveyed consumers is sensitive to the origin of goods and consumes Chinese goods, in spite of
quality concerns. Many city dwellers (60% of respondents) perceive welfare losses if Chinese
goods were to be banned in Cameroon. In general, Chinese goods are having a positive impact
on consumers, especially those at the lower strata in the distribution of income. Imported
motorcycles from China are found to be complementing the production of taxi services in the
main cities. Although there is insecurity, environmental and spare-part-intensity concerns,
Chinese bikes are increasing the supply of taxi services, creating jobs, and generating
government revenue. Battery production in Cameroon is under immense competitive pressure
with production and turnover plummeting and other firms producing goods similar to those
imported from China suffer the same fate. To discharge some of the competitive pressures on the
local industries, there is need to downsize the fraudulent entry of goods into the country. Policy
makers can also protect some strategic infant industries by dialoguing with China. By
strategically using fiscal policies and dismantling administrative bottlenecks that act as a drag
on private initiatives, Cameroon is now having an opportunity to transform its agriculture and
take advantage of potentials in the neighbourhood and Chinese growth through trade.
2
1. Introduction
Statement of the Problem
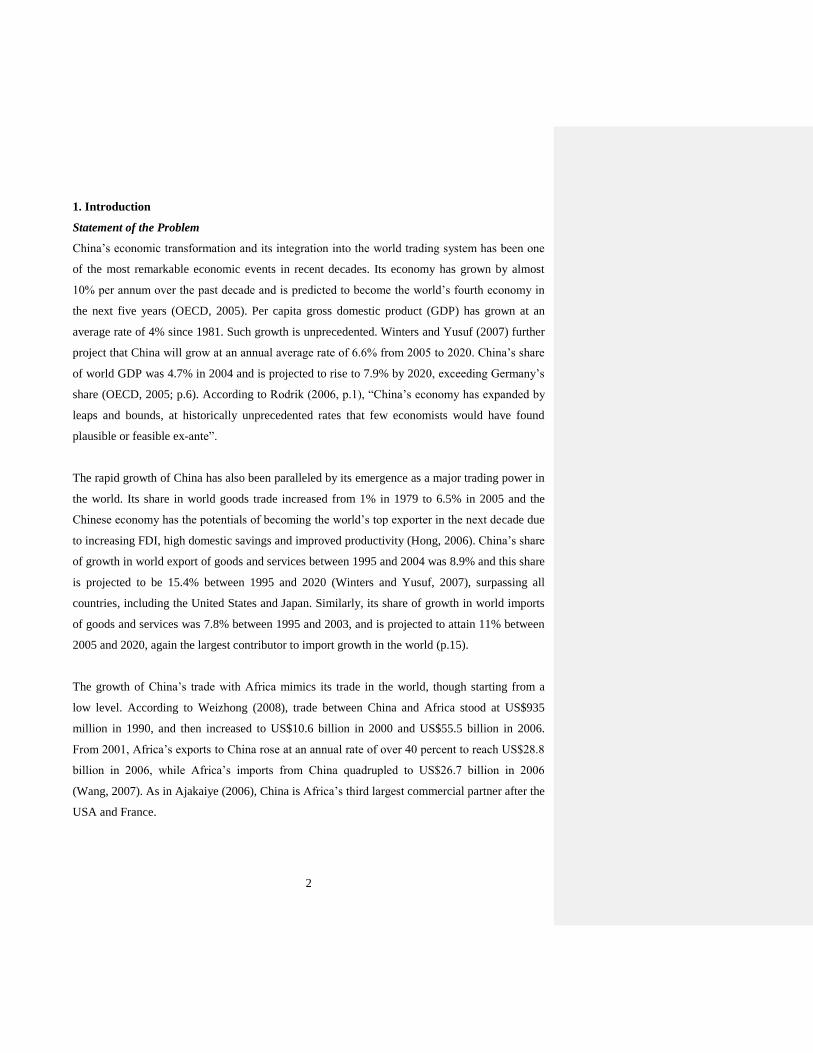
China’s economic transformation and its integration into the world trading system has been one
of the most remarkable economic events in recent decades. Its economy has grown by almost
10% per annum over the past decade and is predicted to become the world’s fourth economy in
the next five years (OECD, 2005). Per capita gross domestic product (GDP) has grown at an
average rate of 4% since 1981. Such growth is unprecedented. Winters and Yusuf (2007) further
project that China will grow at an annual average rate of 6.6% from 2005 to 2020. China’s share
of world GDP was 4.7% in 2004 and is projected to rise to 7.9% by 2020, exceeding Germany’s
share (OECD, 2005; p.6). According to Rodrik (2006, p.1), “China’s economy has expanded by
leaps and bounds, at historically unprecedented rates that few economists would have found
plausible or feasible ex-ante”.
The rapid growth of China has also been paralleled by its emergence as a major trading power in
the world. Its share in world goods trade increased from 1% in 1979 to 6.5% in 2005 and the
Chinese economy has the potentials of becoming the world’s top exporter in the next decade due
to increasing FDI, high domestic savings and improved productivity (Hong, 2006). China’s share
of growth in world export of goods and services between 1995 and 2004 was 8.9% and this share
is projected to be 15.4% between 1995 and 2020 (Winters and Yusuf, 2007), surpassing all
countries, including the United States and Japan. Similarly, its share of growth in world imports
of goods and services was 7.8% between 1995 and 2003, and is projected to attain 11% between
2005 and 2020, again the largest contributor to import growth in the world (p.15).
The growth of China’s trade with Africa mimics its trade in the world, though starting from a
low level. According to Weizhong (2008), trade between China and Africa stood at US$935
million in 1990, and then increased to US$10.6 billion in 2000 and US$55.5 billion in 2006.
From 2001, Africa’s exports to China rose at an annual rate of over 40 percent to reach US$28.8
billion in 2006, while Africa’s imports from China quadrupled to US$26.7 billion in 2006
(Wang, 2007). As in Ajakaiye (2006), China is Africa’s third largest commercial partner after the
USA and France.

3
Apart from the rising volume of trade between China and Africa, the composition of the trade is
also a matter of concern. Africa exports mainly minerals and raw materials to China, and imports
essentially manufactured products. The perpetuation of this trade pattern raises questions about
Africa’s industrialisation prospects and development as a whole. Kaplinsky and Morris (2007)
provide evidence of the negative impact of China on Sub-Saharan Africa in the global garments
and textile industries. Ajakaiye (2006, p.8) equally notes that “instead of Sino-African trade
partnership lending assistance to the transformation and development process in Africa, it will
actually truncate it”. This notwithstanding, there is potential positive impact on Africa’s terms of
trade, if the prices of its exports rise, while those of its imports fall (Goldstein et al., 2006). A
related question is how Africa can change this trade pattern and access the Chinese market with
manufactured and non-traditional exports. In this regard, it would seem that while trying to
mitigate the impact of Chinese imports, efforts should be made to diversify the composition of
Africa’s exports to China.
As part of its trade policy towards Africa, the Chinese government in January 2005 implemented
the Special Preferential Tariff Treatment (SPTT), removing tariffs from some 190 items from 25
of the least developed countries in Africa. In November 2006, it augmented the number of tariff
items affected by SPTT to over 440 (Ajakaiye, 2006 and Wang, 2007). This is intended to
increase the range of Africa’s exports to China and address the negative trade balance with a
number of countries. The extent to which this will translate into narrowing the trade gap between
China and Cameroon is yet to be captured.
After independence, Cameroon pursued a policy of import-substitution through the promotion of
the competitiveness of local industries and the processing of local raw materials, with the hope of
fostering the growth and development of the country. The state consequently set up huge agro-
industrial complexes and also encouraged and supported the creation of small- and medium-sized
enterprises owned by locals in a strategy that had been described as the domestication of
enterprises by the political entrepreneurs. This was accompanied by a trade policy characterised
by both tariff and non-tariff barriers, aimed at establishing a national industrial base. The tax
structure comprised about 20 different taxes, which were selectively applied with some as high
as 120%. Quantitative restriction of imports was rife.

4
With the structural adjustment programme in 1988, the import substitution policy was abandoned
and the trade regime was subsequently liberalised. The state withdrew from direct participation
in economic activity, like creating and running enterprises. Most of its loss-making parastatals
have been liquidated or privatised. Its role is now limited essentially to creating an appropriate
environment for private sector investment, both local and foreign. Tariffs have been reduced,
quantitative restrictions are limited and most of the exemptions accorded manufacturing firms
have almost all been abandoned. Nowadays therefore, Cameroon does not have any official
policy to protect local industries against cheap Chinese imports. Both countries are members of
the WTO, which works against trade protection and Cameroon is constrained by it sub-regional
obligations from negotiating unilateral trade deals with China. It will be interesting therefore to
know how Cameroon will deal with the influx of cheap imports from China and the threat to its
industrialisation effort.
China’s trade pattern with Cameroon is similar to that with some African countries. Khan and
Baye1 (2008) carried out a scoping study on the economic relations between China and
Cameroon, focusing not only on trade, but also on the aid and investment channels. As concerns
trade relations with China, they observed a rapid increase in the volume of trade over the past
few years, largely due to a surge in imports from China, as exports to China are on the decline.
Exports to China are highly concentrated in primary products (essentially cotton and wood in
various forms), while imports are largely diversified manufactured products comprising
machinery, electrical equipment, garments, textiles, light industry products, metals, etc.
Under this circumstances and considering the relative comparative advantages of both countries,
it would seem futile at this stage of Cameroon’s development to nurse the ambition of competing
vigorously with China to gain market shares in manufactured goods either domestically, sub-
regionally or in China. It would, however, be more feasible if Cameroon were to modernize its
agriculture in order to substantially scale down imports of primary commodities like cereals from
Asia generally and compete with other countries to gain market shares in China, whose
1 The study by Khan and Baye (2008) on Cameroon was part of a multi-country scoping study initiated by the
AERC to assess the level of economic relationship between China and Africa

5
industries are very thirsty for want of raw materials. With the attainment of the completion point
of the HIPC initiative and the growing demand for raw materials by China, Cameroon has another
golden opportunity to transform its agriculture and rural areas, which are forerunners to
modernisation, an opportunity that was first missed during the peak of oil production in Cameroon.
As will be argued later, the process of reaping the benefits and checking losses emanating from
trade relations with China may as well lie in the modernization of Cameroon’s agriculture.
The scoping study on China-Cameroon economic relations by Khan and Baye (2008) did not
provide an adequate impact assessment, as the level of interaction with relevant stakeholders was
shallow and unsystematic. What is the size, composition and evolution of this trade relationship
with China? How has it been impacting on the different stakeholders in Cameroon? How does it
fit within Cameroon’s industrial/trade policy or development strategy as a whole? These are
some of the issues begging for answers in our present endeavour, which in addition to revisiting
the structure and impact of trade flows between China and Cameroon, also involves
questionnaire-based impact analysis and in-depth case studies of relevant stakeholders in order to
assess their perceptions on the impact of Cameroon’s trade with China.
Objectives
The main objective of this study is to examine the key features of trade with China and assess its
impact on the Cameroonian economy. The specific objectives are:
To analyze Cameroon’s economic structure and performance, paying particular attention to
the role of trade with China.
To analyze Cameroon’s trade (export and imports) structure and evolution, by key sectors,
with specific focus on China’s contribution;
To examine the evolution of Cameroon’s and China’s trade policy, with reference to any
bilateral and/or regional trade arrangements fostering market access conditions in both
countries;
To analyze Cameroon’s relative gains and losses generated by trade (exports and imports)
with China, paying particular attention to the sources (i.e. volume and price changes) and the
sector distribution of these gains and losses.

6
To identify and analyze sources and extent of gains and losses of the domestic key
stakeholders (consumers, importers, producers and exporters) confronting Chinese goods;
To identify and analyze opportunities derivable by Cameroon and challenges from its trading
relationship with China;
To articulate and analyze policy responses which could enable the country maximize the
benefits derivable and minimize the losses arising from its trading relationship with China.
The rest of the paper is organized as follows:
Section 2: Background of the Study:
2.1 Cameroon’s economic structure and performance
2.2 China-Cameroon trade relations
2.2.1 Exports from China,
2.2.2 Imports from China
2.3 Trade policy stance of Cameroon and China
2.3.1 Cameroon’s trade policy
2.3.2 China’s trade policy
2.3.3 Bilateral and/or regional trade arrangements
Section 3: Literature Review
Section 4: Theoretical framework and Methodology
Section 5: Empirical Analysis
5.1 Impact of trade with China
5.1.1 Trade balance with China
5.1.2. Impact of exports of primary commodities to China
5.2 Impact on consumers of Chinese imported goods
5.3 Impact on firms using cheap Chinese goods as inputs
5.4 Impact on firms facing competition from cheap Chinese goods
5.5 Net impact
Section 6: Conclusion.
2. Background
2.1. Cameroon’s Economic Structure and Performance
Cameroon is a country with enormous diversity and potentials - abound in natural resources and
a diversified commodity-based economy. These diversities present potential opportunities and
accounted for much of the impressive growth rate of the economy up to the mid 1980s -
registering average growth rates of about 7% over a decade before 1986 (Government of
Cameroon, 2003). However, since 1986 the economic performance of the country started
experiencing a slowdown and major macroeconomic indicators declined severely. The causes of

7
this worsening economic situation, attributable to both internal and external factors, have been
well documented (Government of Cameroon, 2003; Baye, 2006).
The dismal economic situation pushed the government of Cameroon in September 1988, to adopt
the IMF/World Bank Supported Structural Adjustment Programme. This programme was first
tailored towards expenditure-reducing measures (Baye, 2006), with a view to remedying the
inadequate public finance situation. The effect on the economy of government austerity measures
including a reduced public sector was not enough to reverse the declining trend as economic
indicators continued to deteriorate. The consequences of these measures were far reaching and
deteriorated the standards of living of households in the lower half of the distribution of well-
being.
The government of Cameroon in January 1994, faced with budgetary short-falls, balance of
payments problems and eroding living conditions of the citizenry had no choice than to join the
other CFA member countries to implement a 50% CFA Franc devaluation, which had both
expenditure-reducing and expenditure-switching potentials2. Subsequent to the 1994 devaluation
of the CFA franc and the satisfactory implementation of the first three-year (1997-2000)
economic and financial programme supported by the IMF and World Bank, Cameroon improved
its macroeconomic stability and realised sustained economic growth of 4.5% in the period 1996-
2001. After fulfilling conditions imposed by the donor community, the country was admitted into
the decision point of the HIPC initiative in 2000, reached completion point in April 2006 after
successfully accomplishing triggers embodied in the HIPC process and is now benefiting
substantially from debt relief.
The incidence of monetary poverty declined by 13.1 percentage points - retreating from 53.3% in
1996 to 40.2% in 2001 according to estimates of the National Institute of Statistics (2002). Yet, it
is apparent that social conditions deteriorated considerably during the period of crisis and
economic recovery has done little so far to improve them. In particular, the provision of basic
social services was severely affected by the government's financial difficulties during those
2 This measure was aimed at switching the economy from non-tradable goods to tradable goods, increasing
exportation of local goods and increasing the competitiveness of the industrial sector.
8
years. The persistence of poverty and social problems, particularly amidst growth is well
documented in the 2003 PRSP.
The slowdown in the growth rate of the GDP, dwindling oil production and eroding market
shares of Cameroonian exports imply that the economy is underperforming than envisioned in
the 2003 PRSP. These outcomes are preoccupying the Cameroonian authorities, especially in this
age of increased competition and globalisation, as well as the emergence of China in the global
economic architecture. In order to regain the path of sustainable growth in the order projected in
the PRSP and enhanced competitiveness after an economic crisis and slow recovery, it is
necessary for the government to play a more pro-active role in fine-tuning its trade relations and
seeking for more market outlets.
Subsequent to the 1994 devaluation of the CFA franc, real growth rate of the GDP climbed to
about 5% and maintained up to 1998, then stagnated on downward trend to 2002, and declined
steadily to register 3.5% in 2004 and 2.8% in 2005. Per capita growth rate collapsed to zero in
2005, implying a less than satisfactory effort in terms of poverty reduction. The observed real
growth path of the GDP has not only deviated progressively from the desired trajectory defined
in the PRSP from 2003, but is situated in the lowest levels in the post devaluation period. The oil
sector appears to have been contributing significantly since 1999 to this poor performance
notwithstanding the recent world market price hikes. The declining but positive growth rates
since 1999 is thanks to the non-oil sector. The modest performance of the non-oil sector,
however, masks contrasting performances of the different sectors and sub-sectors (Table 2.1).
The growth rate of the primary sector has been stagnating in a downward trend since 2000 to
attain 4.2% and 3.9% in 2004 and 2005, respectively. While food crops, industrial and traditional
exports and livestock supported the growth of the primary sector, horticulture and forestry
exploitation registered a growth rate of 15.8% in 2004 and underperformed in 2005 before
climbing to 7.5% in 2006. These are indications that there is space for improvement, but as
argued later, this may remain a Herculean task if the neglected issue of agricultural transformation
is not explicitly taken on board and adequately addressed.

9
The 2003 PRSP of the Government of Cameroon provides a good diagnostics of the constraints
plaguing agriculture and rural development in Cameroon, but fails to outline concrete interventions
to alleviate the constraints. It reduces agricultural development mainly to providing small farmers
with rudimentary implements to improve their productivity. It ignores conditions for agricultural
transformation that entails large-scale modern farms as pre-conditions for take-off, which will
allow smallholder initiatives to flourish on the fringes. In line with ongoing efforts geared at
gathering material to inform the revision and the fine-tuning of the 2003 PRSP – it is necessary to
explicitly outline practical conditions for agricultural transformation within the context of the new
policies for growth and poverty alleviation if authorities were to capitalize the fall-outs of the HIPC
process and lay the foundation of optimizing its trade relations with China.
Table 2.1: Ventilation of GDP by Sector
1999 2000 2001 2002 2003 2004 2005 2006
Primary Sector 6.4 3.6 3.7 3.7 3.7 4.2 3.9 4
Food Crops 10.4 3.5 4.6 5 3.5 4.7 4.3 4.2
Agricultural Export Crops -5.6 0.8 -2 2.8 2.5 -6 5.1 1.5
Livestock 5.8 5 8.6 2.6 2.7 3 3 3
Fisheries 12.2 3 12.7 2.9 3 2 2 2
Horticulture and Forest exploitation
-8.2 5 -9.3 -4.5 9.4 15.8 2.1 7.5
Secondary Sector 3.3 4.3 1 0.8 0.8 0.5 -0.9 4.1
Extractive Industries -6.5 -0.2 -3.9 -4.3 -4.4 -9.4 -8.7 6.2
- Hydrocarbons -6.7 -2 -4 -4.4 -4.5 -9.4 -8.7 6.2
Food Industries 13.4 5 2.7 4 3.3 0 -4.7 1.3
Other Manufacturing Industries 10.1 4.5 3.8 2.4 2 5.6 4.4 3.9
Electricity, Gas and Water 2 5 1.2 -4.6 8 6.4 2.5 3
Construction and Public Works 7.7 5.7 3.9 5.7 5 9 6.2 6.6
Tertiary Sector 6.4 4.4 8.5 7.3 7.3 5.4 4.8 4.6
Commerce. restaurants & hotels 6.5 4.5 13 7.4 9.6 6.5 4.9 5
Transports, Ports, Communications
13.6 4.5 7.4 11.2 8.7 5.7 5.8 4
Banks and Financial Institutions -4.4 3.9 3.8 3.9 2.7 3.8 4.7 4.7
Other Tradable Services 13 6.4 4.7 7.2 4 4.3 5.3 5.3
SIFIM (serv. d'intermé. indirect. Mesurés)
8.1 10 14.2 3.4 3.7 3 2.5 2.2
Non-tradable Services of the PA 0.9 3 5.4 4.7 4.2 3.5 2.8 2.9

10
Other Non-tradable Services -6.4 3.3 1.8 4.4 7.2 7.2 5.2 6
GDP 4.3 4.5 4.5 4 4.1 3.5 2.8 4.3
Source : MINEFI/ Direction des Affaires Economiques
The secondary sector accounted substantially in holding down the real growth rate of the GDP,
the extractive industry being the principal culprit. The performance of food industries has been
disappointing since 2004, engendered by low investment and poor infrastructural development,
while construction and public works, as well as energy resources, which are the main factors of
production, appear as the main vectors of growth in the secondary sector (Table 2.1). In recent
years, the tertiary sector has been the focal growth enhancing vector, with the performance of
trade and tourism sub-sectors, transport and communications, and other non-tradable services the
main driving forces (Table 2.1). Consumption captures the bulk of aggregate demand, with trade
balance contributing only marginally. Investigating how trading with China can influence trade
balance for Cameroon is, therefore an important research issue to address.
The rate of investment in Cameroon is generally below 20% of the GDP. Such a rate of
investment is insufficient to stimulate the pattern of growth in the order of above 7% required to
reducing poverty by 50% in 2015 relative to the level in 1996. The East Asian countries that
have succeeded in significantly reducing poverty have registered rates of investment in excess of
30%. The growth rate of investment in Cameroon has been less than satisfactory and volatile in
recent years.
2.2. China-Cameroon Trade Relations3
Cameroon has been trading with China even before the establishment of diplomatic relations in
1971. The value of trade leaped to more than US$170 million in 2000, up from only about
US$85 million in 1999. According to the Chinese ambassador to Cameroon4, trade between the
two countries stood at US$340 million from January to November 2006, representing an increase
of 101% compared to the same period in 2005 (Cameroon Tribune, 30 January 2007). In this
3 The exchange rate used to convert trade data to US$ is taken from WEO database of the IMF for the respective
years. 4 Interviewed on the eve of the arrival of the Chinese leader’s first ever visit to Cameroon

11
section, we describe the nature and extent of trade links between Cameroon and China,
comparatively with other major trading partners.
2.2.1. Exports to China
Cameroon’s exports to China were relatively low prior to 1999, but shot up by more than 170%
within a year to stand at more than US$123 million in 2000. Exports to China then represented
almost 7% of total exports from Cameroon, up from barely 2.7% in 1999. China was ranked 6th
among Cameroon’s export destinations in 2000. This was however going to be the peak of
Cameroon’s exports to China, as they took a downward trend from then onward. By 2005,
exports to China declined to barely US$69 million, representing only 2.5% of Cameroon’s total
exports. China fell to the 8th position among Cameroon’s export partners. Therefore, while
Cameroon’s exports to the world increased from US$1791 million in 2000 to US$2806 million
in 2005, exports to China were on a steady decline as shown in Table 2.2.
Table 2.2: Exports to China, Share and Rank among Major Export Destinations (million
US$) Year China World China’s Share (%) China’s Rank
1999 45.3 1674.6 2.7 6
2000 122.8 1790.6 6.9 5
2001 101.7 1724.1 5.9 6
2002 77.8 1799.0 4.3 6
2003 98.0 2241.4 4.4 6
2004 62.8 2380.3 2.6 8
2005 68.9 2806.3 2.5 8
Source: INS (2004) and INS (2006)
An examination of the structure of Cameroon’s exports to China indicate that they are limited to
a few raw materials as depicted in Table 2.2 and Table A2 in the Appendix. These include crude
oil, wood and cotton. However the export of crude oil, which represented an average of more
than 50% of export income from China, ended in 2003. This might be attributed to declining oil
production in Cameroon that made the quantity available to the Chinese too small to be
transported economically to China. Most of Cameroon’s oil is exported following long-term
agreements. The Chinese then decided to turn to other countries where they can have oil in
12
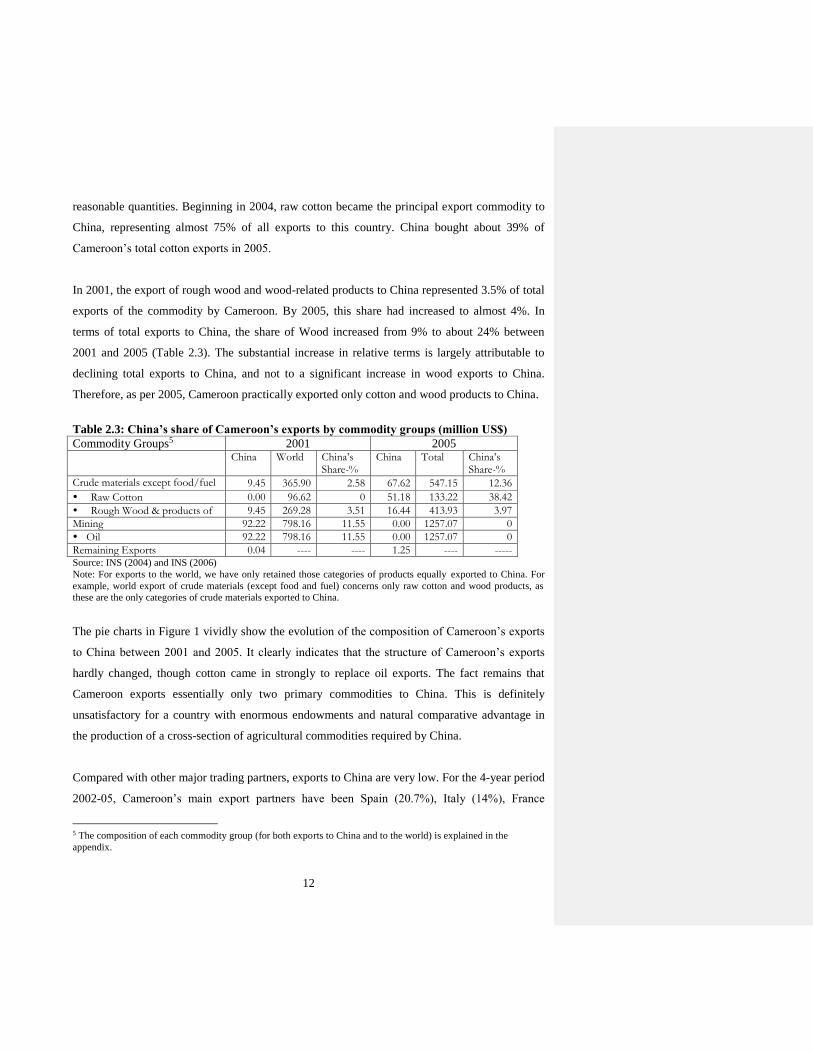
reasonable quantities. Beginning in 2004, raw cotton became the principal export commodity to
China, representing almost 75% of all exports to this country. China bought about 39% of
Cameroon’s total cotton exports in 2005.
In 2001, the export of rough wood and wood-related products to China represented 3.5% of total
exports of the commodity by Cameroon. By 2005, this share had increased to almost 4%. In
terms of total exports to China, the share of Wood increased from 9% to about 24% between
2001 and 2005 (Table 2.3). The substantial increase in relative terms is largely attributable to
declining total exports to China, and not to a significant increase in wood exports to China.
Therefore, as per 2005, Cameroon practically exported only cotton and wood products to China.
Table 2.3: China’s share of Cameroon’s exports by commodity groups (million US$)
Commodity Groups5 2001 2005 China World China’s
Share-% China Total China’s
Share-%
Crude materials except food/fuel 9.45 365.90 2.58 67.62 547.15 12.36
Raw Cotton 0.00 96.62 0 51.18 133.22 38.42
Rough Wood & products of 9.45 269.28 3.51 16.44 413.93 3.97
Mining 92.22 798.16 11.55 0.00 1257.07 0
Oil 92.22 798.16 11.55 0.00 1257.07 0
Remaining Exports 0.04 ---- ---- 1.25 ---- ----- Source: INS (2004) and INS (2006)
Note: For exports to the world, we have only retained those categories of products equally exported to China. For
example, world export of crude materials (except food and fuel) concerns only raw cotton and wood products, as
these are the only categories of crude materials exported to China.
The pie charts in Figure 1 vividly show the evolution of the composition of Cameroon’s exports
to China between 2001 and 2005. It clearly indicates that the structure of Cameroon’s exports
hardly changed, though cotton came in strongly to replace oil exports. The fact remains that
Cameroon exports essentially only two primary commodities to China. This is definitely
unsatisfactory for a country with enormous endowments and natural comparative advantage in
the production of a cross-section of agricultural commodities required by China.
Compared with other major trading partners, exports to China are very low. For the 4-year period
2002-05, Cameroon’s main export partners have been Spain (20.7%), Italy (14%), France
5 The composition of each commodity group (for both exports to China and to the world) is explained in the
appendix.

13
(12.8%), Holland (10%) and USA (7.1%). Over the same period, exports to China averaged only
3.5% annually. More than two-thirds of Cameroon’s exports are to the EU, while less than 10%
goes to East Asia; and this share is on a downward trend.
Such export performance is rather disappointing, as the indication is that Cameroon is not yet
reaping much from the huge demand for raw materials by China. However, it also represents
opportunities for increasing exports to China. First, by increasing wood and cotton exports, and
then exploring the possibility of diversifying exports to other raw materials produced in
Cameroon like cocoa, coffee, Banana, etc and for which the enormous potentials widely remain
untapped because of lack of agricultural intensification. Presently, Cameroon is not exporting
some of the commodities on high demand like crude oil, non-petroleum minerals and metals to
China. An invitation from the president of Cameroon, as mentioned earlier, for China to invest in
mineral exploration might be the required move in this direction.
Figure 1: Composition of Cameroon’s Exports to China in 2001 and 2005
2001
91%
0% 9% 0%
Crude Oil
Raw Cotton
Wood and Related Products
Remaining Products
2005
0%
74%
24%2%
Crude Oil
Raw Cotton
Wood and Related Products
Remaining Products

14
2.2.2. Imports from China
Imports from China have been on a steady rise. In 2005, Cameroon imported goods from China
worth more than US$144 million, up from barely US$39 million in 1999. China’s share of total
imports to Cameroon consequently moved from just 2.8% to 5% and China became Cameroon’s
third source of imports after France and Nigeria6, up from the 9th position in 1999 (see Table
2.4). While Cameroon’s total imports increased by 110% between 1999 and 2005, imports from
China increased by 270%.
Table 2.4: Share of Imports from China, and Rank among Major Import Sources
(million US$) Year China World China’s Share (%) China’s Rank
1999 38.9 1378.5 2.8 9
2000 47.8 1598.6 3.0 8
2001 49.3 1824.8 2.7 8
2002 66.5 1859.4 3.6 7
2003 86.7 2154.7 4.0 5
2004 110.7 2585.3 4.3 7
2005 144.1 2898.0 5.0 3
Source: INS (2004) and INS (2006)
While exports to China are concentrated on essentially two commodities, imports from China
cover a wide range of products. Before 2003, cereals (and especially rice) were the main import
commodities, taking almost 50% of all imports. However, cereal imports from China started
declining as Cameroon diversified her import sources to countries like Thailand, India and
France. By 2005, cereal imports from China had dropped to barely US$0.01 million, down from
almost US$35 million in 2002. Thailand has become the main source of cereals with US$57
million in 2005, and France with US$15.2 million and India with US$9.5 million. The share of
food imports (essentially cereal) from China consequently declined from 18% in 2001 to less
than 2% in 2005 (Table 2.5). Cameroon has commendable potential in developing and
intensifying the production of high quality rice domestically if the sub-sector is modernized.
6 Imports from Nigeria are essentially hydrocarbons – 99.7% of imports in 2005

15
Such a move can register substantial savings in foreign exchange earnings and even make
Cameroon an important source of high quality rice to the sub-regional markets and Nigeria.
With the far-reaching decline in the import of cereals, imports from China are now largely made
up of manufactured goods. This commodity group (other manufactured products) represented
53% of all imports from China in 2005, and about 36% of that category of imports from the
world, up from 8% in 2001 (Table 2.5). Another commodity group with significant increase of
imports from China is machinery, transport and other equipment. In 2001, only 1.3% of total
imports of this commodity group were imported from China, but by 2005, this had risen to
almost 8%. As a share of imports from China, the machinery, transport and other equipment
group increased from 13% to 31% between 2001 and 2005. Most of these commodities were
hitherto imported from Western countries, and especially Europe. Table A2 in the appendix
provides more details on imports from China and indicates that most of the commodities
witnessed an increase of more than 75% between 2001 and 2005.
Table 2.5: China’s share of Imports to Cameroon by Commodity Groups (million US$) Commodity Groups7 2001 2005
China World China’s Share-%
China World China’s Share-%
1 Food (especially Cereals) 23.9 131.9 18.08 4.9 278.1 1.76
2 Plastic and Rubber Materials 2.2 74.4 2.89 12.9 116.9 11.04
3 Chemical products 0.9 80.1 1.10 5.5 122.4 4.50
4 Machinery, transport and other equipment
6.5 505.0 1.29 44.6 561.5 7.95
5 Other manufactured products 15.9 193.3 8.22 76.2 214.9 35.45 Source: INS (2004) and INS (2006)
Note: For world imports, we have only retained those categories of products equally imported from China. For
example, those categories of chemical products not imported from China are not included in chemical product
imports from the world. Details are provided in Table A3 in the appendix.
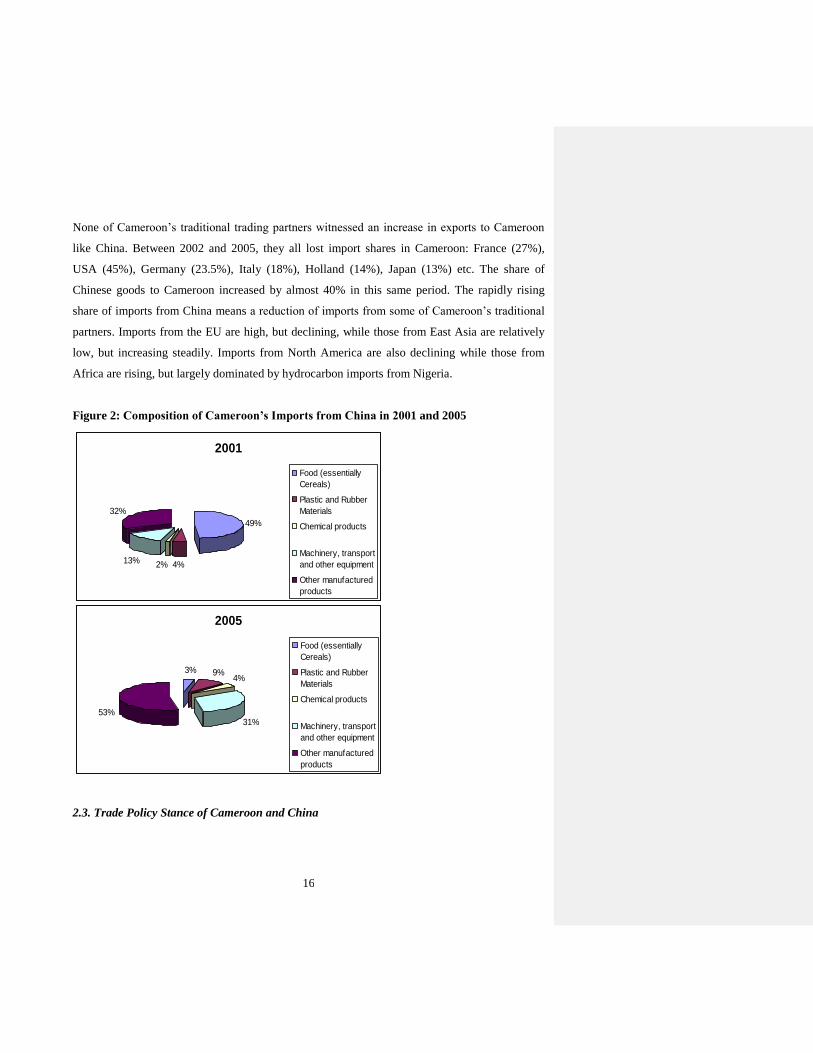
To better appreciate the evolution of the structure of imports, we use pie charts to illustrate the
commodity groups in 2001 and in 2005 (Figure 2). Significant changes are recorded for the pies
for cereals, machinery, transport and other equipment, and other manufactured products as
already indicated above. This is evidence of the increasing diversification of imports from China,
especially as each of these commodity groups is an aggregation of several other products.
7 The composition of each commodity group (for both imports to China and to the world) is explained in the
appendix.
16
None of Cameroon’s traditional trading partners witnessed an increase in exports to Cameroon
like China. Between 2002 and 2005, they all lost import shares in Cameroon: France (27%),
USA (45%), Germany (23.5%), Italy (18%), Holland (14%), Japan (13%) etc. The share of
Chinese goods to Cameroon increased by almost 40% in this same period. The rapidly rising
share of imports from China means a reduction of imports from some of Cameroon’s traditional
partners. Imports from the EU are high, but declining, while those from East Asia are relatively
low, but increasing steadily. Imports from North America are also declining while those from
Africa are rising, but largely dominated by hydrocarbon imports from Nigeria.
Figure 2: Composition of Cameroon’s Imports from China in 2001 and 2005
2.3. Trade Policy Stance of Cameroon and China
2001
49%
4%2%13%
32%
Food (essentially
Cereals)
Plastic and Rubber
Materials
Chemical products
Machinery, transport
and other equipment
Other manufactured
products
2005
3% 9%4%
31%53%
Food (essentially
Cereals)
Plastic and Rubber
Materials
Chemical products
Machinery, transport
and other equipment
Other manufactured
products
17
2.3.1. Cameroon’s Trade Policy
Cameroon adopted an import-substitution policy (protectionist trade regime) - restrictive tariff
and non-tariff barriers - to shield the local industry, including state-owned enterprises upon
gaining independence. The adoption of the structural adjustment programme from 1988 saw
some significant changes in the trade policy regime, as Cameroon began opening its international
trade system. These changes were part of a larger market-oriented economic reform programme
aimed at reversing a prolonged economic crisis. The changes included the introduction of new
customs and fiscal regimes in 1994, which led to the elimination of quantitative restrictions,
import licenses, tariff exemptions and special customs and fiscal regimes.
Cameroon's trade policy is influenced by its membership of the Central African Economic and
Monetary Union (CEMAC8). One of the objectives of the Community is to establish a unified
market allowing for open trade and capital flows between member States and a Common
External Tariff (CET) with third countries, while trade inside the Community is duty free since
1998. The CET has four rates: 5% (for essential goods); 10% (for raw materials and capital
goods); 20% (for intermediate goods); and 30% (for consumer goods). Notwithstanding, trade
between Cameroon and its CEMAC partners is relatively low compared with main trading
partners in Europe and more recently with Asian countries, especially China. CEMAC
membership implies that Cameroon may not be able to take a unilateral decision concerning its
trade relations with China.
Concerning export trade, Cameroon has liberalized the policy regime over the past years. Export
licences nowadays apply only to "sensitive" goods (e.g. gold and diamonds); while coffee and
cocoa require an export certificate to ensure quality. All export taxes, except those levied on
timber, have been removed. Timber exports are also subjected to quotas. Cameroon does not
grant any specific assistance to exporters other than tax incentives, which are provided to
promote industrial development, encourage exports, raise value added, and create employment.
These incentives are contingent upon export performance and in certain instances, on the use of
domestic inputs.
8 CEMAC is a French acronym for Communauté Économique et Monétaire de l'Afrique Centrale, which also
includes the Central African Republic, Chad, Equatorial Guinea, Gabon and the Republic of Congo.

18
If negotiations on a comprehensive Economic Partnership Agreement (EPA) are not concluded,
the process of regional integration in CEMAC might be under threat, as Cameroon upon signing
an interim EPA with the EU may subsequently dismantle tariff barriers (i.e. the CET) on EU
imports, while other CEMAC members continue to impose them. It is important to recall that in
December 2004, CEMAC members signed a trade agreement with Sao Tome and Principe, and
together they form the regional configuration negotiating an EPA with the European Union. If an
EPA is signed with the EU, the competitive pressure on the local industry, which is already
under stress from Asian goods and especially those from China, will increase. Goods from non-
EU members would also face more competition from EU goods if they enter Cameroon duty-
free. Chinese goods might be able to withstand such competition, but what of -made-in-
Cameroon goods?
Cameroon’s trade policy objectives however continue to be oriented towards a more open trade
regime and increased market access for its exports. The Government sees trade liberalisation as
integral to its efforts to modernize the economy.
2.3.2. China’s Trade Policy9
China does not have any specific trade policy arrangement regarding its trade interactions with
Cameroon. We therefore examine China’s trade policy with the rest of the world, with some
emphasis on policy towards Africa and analyse its implications on trade with Cameroon.
The overall aim of China's trade policy is to accelerate the opening of its economy to the outside
world, to introduce foreign technology and know-how and develop foreign trade. China also
aims to further strengthen the multilateral trading system; while at the same time, it has been
intensifying its pursuit of bilateral/regional free-trade agreements with some of its trading
partners. China provides at least MFN treatment for all WTO Members except El Salvador and
some territories of EC Member States.
9 This section is written thanks to China’s Trade Policy Review published by the WTO Secretariat
19
China’s main laws covering international trade include the Foreign Trade Law, the Customs
Law, and the Regulations on import and Export Tariffs, which contain the tariff schedules, as
well as laws and regulation relating to standards, sanitary and phytosanitary (SPS), anti-
dumping, countervailing and safeguard measures, and intellectual property rights. According to
WTO, China has, by and large, continued to liberalize its trade and trade-related policies
gradually since its 2006 Trade Policy Review. Nonetheless, trade and trade-related measures,
both at the border and internally, are still used as instruments of industrial policy. The tariff
remains one of China’s main trade policy instruments.
Through Memoranda of Understanding (MOU), China has limited (for a specified period) the
growth rates of its textiles and clothing exports to the European Communities, the United States,
and even to South Africa. The aim of signing the MOU with South Africa was to enable South
Africa to impose unilateral import restrictions on 31 textiles and apparel products originating in
China between 2007 and 2008. This indicates that despite membership of the WTO, countries
can through dialogue with China restrict the amount of Chinese imports into their countries.
Such an example might be worth emulating by some African countries suffering from the fierce
competition of Chinese goods.
The Chinese Government believes that the multilateral trading system plays an irreplaceable role
in maintaining world economic stability and promoting global trade liberalization. Therefore, as
a top priority in its trade policy, China has committed to pushing forward the Doha Round
negotiations under Doha Development Agenda and played a constructive role. China has
submitted a large number of proposals on agriculture, services, rules, trade facilitation etc, which
contributed to the development objectives of the negotiations.
While multilateral trading system remains the priority, China believes that regional trade
arrangements established on the basis of openness and non-discrimination can play a
supplementary role to the multilateral trading system. Guided by this principle, China has
concluded bilateral and regional trade arrangement negotiations with a number of trading
partners. To date, a total of 12 regional trade arrangements involving 29 countries and regions
have been signed by China or still in the process of negotiations.

20
The Forum on China-Africa cooperation (FOCAC) has been a platform on which China and
African countries hold collective dialogue as a new mechanism to promote South-South
cooperation. The FOCAC Beijing Summit and the 3rd Ministerial Conference were held from 3-5
November 2006, in Beijing China and 48 African countries attended the Summit and the
Ministerial Conference. The Forum adopted the Declaration of the Beijing Summit of FOCAC
and the Beijing Action Plan (2007-2009). China announced eight new measures for Sino-African
cooperation including those on duty-free market access and debt relief programmes for African
LDCs.
To promote exports of the least-developed countries to China, by the end of 2007, the Chinese
Government had granted duty-free treatment to 41 least-developed countries having diplomatic
relations with China for most of the products they have the ability to export, accounting for
97.9% of their total export volume to Chine in 2007.
Cameroon’s membership of CEMAC and the WTO constrain her ability to take unilateral trade
policy decisions. The eventual signing of EPA might even complicate issues further. There is
potentially enormous competitive risk for the local industry and the ability of government to
assist through trade policy might be very limited. However, Cameroon can cease other
opportunities presented to increase her exports to countries like China and benefit from duty-free
advantages offered. Dialogue with China through memoranda can also allow the local industry
some breathing space.
2.3.3. Bilateral and/or Regional Trade Arrangements
Cameroon’s trade policy is largely influenced by her membership in the CEMAC sub-region,
which makes it difficult for her to negotiate any specific formal trade arrangement with China.
Moreover, Cameroon’s membership in the CEMAC sub-region entails some monetary and
exchange rate arrangements. The CEMAC zone is governed by a number of principles, namely
(1) the use of the same currency among member countries and hence, a common foreign
exchange policy with the rest of the world, (2) pooling of the zone’s reserves, (3) full
convertibility of the CFAF to the Euro (€ 1 = CFAF 655.957) through the operations account

21
kept at the French Treasury, and (4) a loan facility for each member of not more than 20% of her
previous year’s tax revenue from the regional Central Bank BEAC
As a group, CEMAC countries appear to have benefited from the discipline imposed by the need
for co-ordinating monetary policies; however, this imposes constraints to individual member
countries. Some policies such as monetary growth and nominal exchange rate changes must be
co-ordinated. Although this facilitates the control of inflation in the region, it might be at the cost
of output and employment objectives pursued by the individual governments. This puts a greater
burden on other policy instruments for maintaining balance of payments (BOP) equilibrium,
particularly on fiscal and wage policies.
A set of convergence criteria (inflation and budget targets, for example) have been defined by the
sub-regional authorities as a prelude for the efficient functioning of the sub-region and these
criteria have to be respected by each member country. This situation further constraints the
effective use by Cameroon of any of her policies in enhancing the gains of or minimizing losses
arising from her trade relations with China. This implies that Cameroon cannot unilaterally
manipulate its exchange rate to scale down its trade deficit with China.
Notwithstanding the above, the authorities have continually been searching for ways and means
in which they could embark on bilateral trade arrangements (even in a seemingly informal
manner) with China in order to derive certain advantages from the trade relations. If the other
countries of the CEMAC sub-region were to unilaterally craft trade deals with China, the
situation might go a long way to weaken the regional integration process and negatively affect
the trade relations between the countries of the sub-region, which is already at a very low level
(less than 5 percent). This situation could be avoided if the countries could negotiate with China
as a block. This would give the countries more weight on the negotiating table and enable them
derive more benefits out of their negotiations with China and also consolidate regional
integration.
3. Literature Review

22
A large part of the literature holds that trade is important for growth. Such an observation derives
from studies concluding that outward-oriented economies consistently have higher growth rates
than inward-oriented economies. This neoclassical view has been supported by the phenomenal
growth and industrialisation records of Asian countries like Hong Kong, Singapore, Korea and
Taiwan, and latter Malaysia and Thailand. These countries are often compared with those in
Latin America and Africa who pursued the import-substitution strategy. Over the last 30 years,
these Asian countries approximately doubled their standards of living every ten years (Giles and
Williams 2000). China and India are the latest to join this group and thus lend more support to
the argument that openness to trade leads to more rapid growth. Some authors like Krueger
(1995) identify trade policy as the crucial element of economic policy. The World Bank (1993)
considers the experiences of these Asian countries as a model for development.
The literature outlines a number of channels through which more trade openness can impact
positively on the economy. First, an expansion in trade (especially exports) may promote
specialization in the production of export products, which in turn may boost the productivity
level and may cause the general level of skills to rise. This may then lead to a reallocation of
resources from the (relatively) inefficient non-trade sector to the higher productive export sector.
The productivity change may lead to output growth. An outward oriented trade policy may also
give access to advanced technologies, learning by doing, and better management practices that
may result in further efficiency gains in the overall traded-goods sector. The larger international
market permits economies of scale to be realized in the export sector. Lastly, a larger export
sector would make available more of the resources necessary to import in a more timely fashion
both physical and human capital, including advanced technologies in production and
management, and for training higher quality labour (Giles and Williams, 2000; Ben-David and
Loewy, 1998; Fosu, 1990; etc).
Some authors have however been expressing worries about the exaggerated enthusiasm for trade
liberalisation. In this direction Rodrik (1999, p.25) observes that “just as the advantages of
import-substitution policies were overstated in an earlier era, today the benefits of openness are
oversold …”. The interventionist policies of East Asian governments (through human capital
development, technology and industrial policies) are often cited as being instrumental in forging

23
the comparative advantage enjoyed by these countries (Wade 1990; Amsden 1989; etc). Their
rapid growth cannot therefore be attributed solely to their openness to trade. Governments in
many developing countries do advocate for some level of protection (even temporary) for local
firms, so as to allow them time to raise their productivity to levels compatible with international
competition.
According to Yanikkaya (2003), despite the wide consensus about the positive association
between trade flows and growth, the literature on the effects of trade restrictions on growth has
reported mixed results. Another strand of the literature stresses the possibility of reverse
causation between trade and growth i.e., instead of trade policy leading to growth, growth can
also cause trade. A study by Jung and Marshall (1985) find inconclusive evidence on the
direction of causality, while Harrison (1996) finds that openness and growth Granger-cause each
other.
A consensus on trade and growth linkages should allow developing countries to formulate trade
policies that could raise growth and foster development. If more trade is seen to promote growth,
then the barriers which restrict imports and reduce the externality effects of exporting should be
reduced. If on the contrary, growth is sourced largely internally, then trade liberalization should
be checked and programs for human and physical capital investment and increased research and
development promoted (Wälde and Wood, 2004).
It is within the context of a choice between inward-orientation and outward-orientation that we
examine the nature of trade between Cameroon and China and the potential impact on the local
economy. The only attempt at examine the implication of trading with China for the economy of
Cameroon is the scoping study by Khan and Baye (2008), which form the basis of the present
study.
4. Theoretical Framework and Methodology
The analytical approach adopted in this study on the impact of trade relations between China and
Cameroon is derived from the framework papers and scoping studies especially those by
Kaplinsky (2007) and Khan and Baye (2008), respectively. This framework identifies the various

24
channels of impact of exports to China and imports from China on specific stakeholders in
Cameroon. It enables us to sort out opportunities from threats, and identify winners and losers
from increased trade between Cameroon and China. Different stakeholders in the same country
may be affected differently, and it is even possible for a stakeholder to be both a gainer and a
loser. Gainer or loser groups can either be consumers, workers, local firms and the government.
The likely impacts of trade with China are synthesised in Table 4.1 and can be classified into
complementary or competitive, which could be direct as well as indirect impacts10.
Table 4.1: Synthetic View of Impact of Trade relations between Cameroon and China
Complementary Competitive
Cheaper (but questionable quality)
consumption goods and welfare
implications
Cheaper intermediary and capital
goods for industry
Increased government revenue
from import duties and from
royalties and export taxes
Increased export income and more
jobs to farmers/exporters and
exporting sectors
Displacement of potential/existing
local producers, leading to
deindustrialisation and hindering
economic diversification
Wages and jobs threatened by cheap
imports
Locking Cameroon in the production
of primary commodities
Source: Adapted from Kaplinsky (2007) and Khan and Baye (2008)
To implement this framework, appeal is made to a range of methods to assess the impact of
China-Cameroon trade through the various channels. This enables us identify the key trade
(export and import) stakeholders, and assess their perceptions of gains or losses and the sources
of such gains and losses. The procedure for assessing the impact of given stakeholders is
presented in the next section just before each impact assessment. Each starts with a presentation
of the nature of data used for the analysis.
10 However, this study will focus only on the direct impact of trade with China (as per terms of reference). The
indirect impact does not result from direct interaction with China, but from China’s dominant role in world trade,
challenging the ‘small country’ assumption of trade theory.

25
In particular, with regards to macro and sector specific trade impacts, use is made of trend
analysis of exports and imports, and their rankings and balances, as well as welfare implications
of major commodities exported to China in terms of benefits or losses to producers, local
governments and communities, and the country at large. In the case of consumers of made-in-
China goods, a well-structured questionnaire-based survey was conducted to tease out the
various impacts both positive and negative on capital city dwellers. In-depth case studies were
used to assess the complementary impacts on economic agents of Chinese imports used as input
in the production processes of local producers, as well as impacts on producers who are
confronting stiff competition from made-in-China goods.
In the next section, we analyze the macroeconomic and sector impacts of trading with China
before attempting an assessment of the impact of trade with China on some stakeholders in
Cameroon: consumers of made in China goods; producers using Chinese imports in their
production process, and those producers facing stiff competition from Chinese products.
5. Empirical Analysis
5.1. Impact of Trade with China
5.1.1. Trade Balance with China
Trade between the two countries in the past consisted mainly in Cameroon exporting raw
materials to China with little imports from China. Cameroon therefore, enjoyed a favourable
trade balance with China until a few years ago. Indeed, Cameroon’s exports to China peaked in
2000 and started a downward trend in 2001, while imports from China on the contrary have been
on a steady rise. Cameroon’s trade surplus with China has consequently been declining since
2001 and turned negative by 2004 (see Figure 3 and Table 5.1).
Export and import shares (Tables 5.1) confirm the increasing trend of Cameroon imports from
China and declining trend of exports to China. In 2000, exports to China represented 6.9% of
total exports from Cameroon, and by 2005, exports to China were only 2.5% of total exports. On
the contrary, the share of imports from China in total imports has been on the rise. From 3% in

26
2000, it reached 5% in 2005. In terms of ranking sources of Cameroon’s imports, China moved
rapidly from the 9th position in 1999 to secure the 3rd position by 2005. With regards to
Cameroon’s export destinations, China retreated from the 5th to the 8th position between 2000
and 2005.
Figure 3: Cameroon's Trade Balance with China
-40000
-20000
0
20000
40000
60000
80000
1998 1999 2000 2001 2002 2003 2004 2005
Exports
Imports
Trade Bal
President Biya raised the issue of the worsening trade balance in a speech to the visiting Chinese
president in January 2007. He said, “We wish to benefit from export quotas for some of our
products like coffee, cotton, cocoa, banana, just to name a few; so as to re-equilibrate as much as
possible, the trade balance between our two countries”11.
Table 5.1: Trade balance with China (value in million US$)
Year Export Imports Trade Balance
Value China’s Share (%)
Rang Value China’s Share (%)
Rang Value
1999 45.3 2.7 6 38.9 2.8 9 6.4
2000 122.8 6.9 5 47.8 3.0 8 75.0
2001 101.7 5.9 6 49.3 2.7 8 52.4
2002 77.8 4.3 6 66.5 3.6 7 11.3
2003 98.0 4.4 6 86.7 4.0 5 11.4
2004 62.8 2.6 8 110.7 4.3 7 -47.9
2005 68.9 2.5 8 144.1 5.0 3 -75.2
11 Our translation from French of the President’s speech made during the visit of the Chinese President, and
published in Cameroon Tribune (2 February 2007, p.3).

27
Source: INS (2004) and INS (2006)
The trade deficit with China is contributing significantly to Cameroon’s overall trade deficit over
the past few years. However, Cameroon’s overall negative trade balance cannot be attributed
solely to China, as the balance with France, Germany, and Japan has been negative for several
years now. Cameroon has a consistent trade surplus with other EU countries like Spain, Italy and
Holland. The deficit with France has been declining, while that with China is on the rise, and a
reflection of the widening trade deficit with East Asian countries.
The de facto picture could be worst, if we factor-in the observation that some made-in-China
goods are imported from third countries. An example is the rising imports from the United Arab
Emirates (Dubai). Imports from this country rose from about US$1.5 million in 2000 to more
than US$12.4 million in 2005. It should be noted that Cameroon exports virtually nothing to the
United Arab Emirates. Goods labelled as made-in-China are also imported from Nigeria.
The risk of this growing pattern of trade between China and Cameroon (i.e. exporting only
primary and importing manufactured products) is that it can lock the Cameroonian economy in
the primary sector. The cheap imports help to destroy the industrial sector while the primary
sector is expanding thanks to the rising demand from China. If this is not checked, the prospects
of industrialisation will be destroyed and the economy will be locked in the production of
primary products.
Concentrating in the production of non-oil primary products is, however, not necessarily welfare
constraining. Efficient production of these commodities can indeed spur growth and the eventual
development of the industrial sector. Moreover, no country in the world endowed with agricultural
potentials appears to have ever developed or modernised without structurally transforming its
agriculture to reach the takeoff point (Nissanke and Thorbecke, 2005). This study recognizes that
rationalization of the process of reaping benefits and checking losses emanating from trade
relations with China lies with agricultural modernization.

28
5.1.2. Impact on exports of primary commodities to China
Trade with China can equally impact Cameroon through its exports. As indicated above,
Cameroon now exports mainly only two commodities to China: cotton12 and wood. Beginning in
2004, raw cotton became the principal export commodity to China, representing almost 75% of
all exports to this country, while wood and derived products represented 23%. Both cotton and
wood exports impact development and income distribution within a country, but differently.
Revenue from wood is concentrated in a few firms, and the wood industry employs fewer people
than the cotton industry. Cotton production is the responsibility of the smaller and generally
poorer farmers, and enhanced returns to this commodity are likely to make a large and direct
positive impact on poverty alleviation (Sandrey, 2007).
Although forest exploitation and timber exports are concentrated among a few firms, the impact
on well-being can be widespread. For instance, the 1994 forestry law incorporated the principle
of derivation and instituted an annual forestry royalty (which is an area tax paid by logging
companies), distributed in the order of 10%, 40%, and 50%, to the village communities adjacent
to the exploited area, the local councils where logging is taking place, and the State, respectively
(Brown et al. 2003). The falling demand for timber products following the slowdown of
economic activities in importing countries may affect the payment of these royalties, which have
become a major source of revenues for developmental projects in logging localities. It is
frequently reported in local news papers that wood truckers are constantly sent on forced leave
following the slowdown in export activities. The domestic consumers of possessed wood are
however benefiting lower domestic prices for timber products and business among the vendors
and numerous middlemen is buoyant.
In 2005, Cameroon exported only about 4 percent of its wood products to China, though the
trend is on the increase. Wood products accounted for 20 per cent of export earnings in 2008, in
12 Given that cotton is grown in the northern part of the country – about 700km from Yaoundé, we could not
implement a survey. Preliminary investigations through some contacts in Garoua also revealed that panel
discussions will not produce good results. The few cotton farmers contacted could not even say to which country
cotton was exported. The country of destination is of no interest to them, as far as welfare impact is concerned. They
know only SODECOTON which buys the cotton from them. Including them in a PGD as earlier proposed will not
produce any useful information. Our discussion in this section therefore relies only on secondary data.

29
second place after oil. Output fell to an estimated 2,009,482 cubic metres sawn in 2008, down
from 2,082,336 cubic metres in 2007, mainly due to a drop in the number of active forestry
concessions (down from 77 to 69). Exports might decline further in the coming years following
the global crisis and especially the recession affecting the worldwide housing sector.
For cotton, its cultivation in Cameroon is overseen by a government parastatal –
SODECOTON13 which provides seeds and other inputs to the farmers and consequently buys all
the output at pre-determined prices. The international price of cotton (Cameroon’s main export to
China) has been falling and SODECOTON has consequently been paying lower farm gate prices
to cotton growers. According to Sandrey (2007, p.9), over a 10 year period, the average import
price of cotton into China from Africa has steadily declined from $2.03/kg in 1995 to $1.27/kg in
2005. The massive cotton imports by China are not having a positive impact on prices14 for
cotton growers in Cameroon; even though China is importing a significant share of their output
(almost 40 percent in 2005).
To add to the declining international prices (blamed at least in part, on cotton subsidies in the
USA), cotton production has been declining over the past few years. From 306 000 tonnes in
2005, it fell to 208,000 tonnes in 2006 and then to only 110 000 tonnes in 2008 (AfDB/OECD,
2009). The decline was due to a drop in cotton fibre prices, which pushed down the producer
price of cottonseed, as well as to the steep rise in fertiliser prices. All these contribute to make
the farmer worse off, despite increasing exports to China. For Cameroon to be truly competitive
in the volatile commodity market it should be able to produce cost effectively.
Although the attainment of the HIPC completion point is far from being a panacea, it situates the
Cameroonian economy in this era of growing Chinese economy at cross-roads, especially as all
sectors suffered from economic crisis and austerity measures. It is, however, fairly well-known
that helping all sectors to grow at the same time is costly and thus impracticable for a country
like Cameroon because of budgetary constraints. Since sectors are generally linked with each
other, increases in demand (both intermediate and final) in some sectors can benefit other sectors
13 French acronym for Cotton Development Company. 14 A recent WTO ruling has decreed that the United States is operating support regimes to its producers that are in
violation of global trading rules, and that these violations are depressing the price for African exports (discussed in
Sandrey, 2007; p.9)

30
as well. Hence, to stimulate output growth and take advantage of the growing Chinese market, it
could be sufficient for the government to push or support just an “optimal mix” of strategically
selected agricultural sub-sectors, which in turn will help other sectors to grow.
5.2. Impact on Consumers of Chinese imported goods
The goal here is to elicit information with regards to the welfare impact on consumers of goods
imported from China and their perceptions of the long-term demand for made in China goods if
domestic incomes were to change. The survey on consumers was conducted in Yaoundé in the
Month of August 2009 by six enumerators15- each covering one of the six sub-Divisions that
make up the Capital City Area. Of an estimated population of 2 million inhabitants, we targeted
600 consumers – 100 from each sub-division. At the end, 562 consumers were administered the
questionnaire, which was a well-structured instrument with closed-ended questions, some
requiring ‘yes’ or ‘no’ and others requiring the eliciting of tendencies under given conditions.
The non-response rate of questions was quite minimal, spanning 0.4-1.2 %. The non-responses
are generally attributable to negligence of some enumerators, for example, failure to identify the
gender of three respondents during the survey.
The questionnaire captured a range of variables, in particular, the socioeconomic characteristics
of respondents, notably gender, age groups, income/expenditure ranges, level of education and
sector of employment. Knowledge of Chinese goods – identification and consumption of goods
from China, and sensitivity as to the origin of goods during purchase were also assessed.
Perceptions on the price, quality and the evolution of likeness for made in China goods compared
to goods from elsewhere were captured in the questionnaire. The effect of a hypothetical ban of
Chinese goods on consumers’ welfare was also addressed. Finally, the questionnaire interrogated
whether or not, the ongoing international financial and economic crises is having an effect on
consumers and the potential impact on consumers’ demand for Chinese goods relative to goods
from elsewhere.
Table 5.2: Socioeconomic Status of Respondents Variable All Male Female
Obs. % Obs. % Obs. %
15 Six PhD students in the Faculty of Economics and management helped the administration of the questionnaires.

31
Gender Identified 562 100 348 61,9 211 37,5
Unidentified 3 ,5
Age group (years)
<25 121 21,5 74 21.26 46 21.8
[25-40[ 338 60,1 214 61.49 124 58.77
[40-60[ 87 15,5 49 14.08 36 17.06
≥60 12 2,1 8 2.3 4 1.9
Unidentified 4 ,7 3 .86 1 0.47
Income/Exp. group (000 CFA F)
<29 133 23,7 80 22.99 53 25.12
[29-50[ 193 34,3 113 32.47 78 36.97
[50-150[ 138 24,6 91 26.15 46 21.8
[150-300[ 72 12,8 45 12.93 27 12.8
≥300 19 3,4 13 3.74 6 2.84
Unidentified 7 1,2 6 1.72 1 0.47
Level of education
Illiterate 12 2,1 7 2.01 5 2.37
Primary 82 14,6 49 14.08 33 15.64
Secondary 240 42,7 148 42.53 89 42.18
Tertiary 224 39,9 143 41.09 81 38.39
Unidentified 4 ,7 1 0.29 3 1.42
Sector of employment
Public 71 12,6 50 14.37 21 9.95
Private formal 106 18,9 76 21.84 30 14.22
Private informal 125 22,2 73 20.98 50 23.7
Self-employment 125 22,2 75 21.55 50 23.7
Others 128 22,8 69 19.83 58 27.49
Unidentified 7 1,2 5 1.44 2 0.95
Total per variable 562 100,0 348 61,9 211 37,5
Source: Compile by authors from administered questionnaires
Of the 562 respondents, about 38% were female; about 60% were in the active age group - 25 to
40 years old and more than 84% had at least a secondary school education level (Table 5.2).
Table 5.2 also indicates that respondents were somehow evenly spread over the entire
income/expenditure distribution, as well as over all the identified sectors of employment.
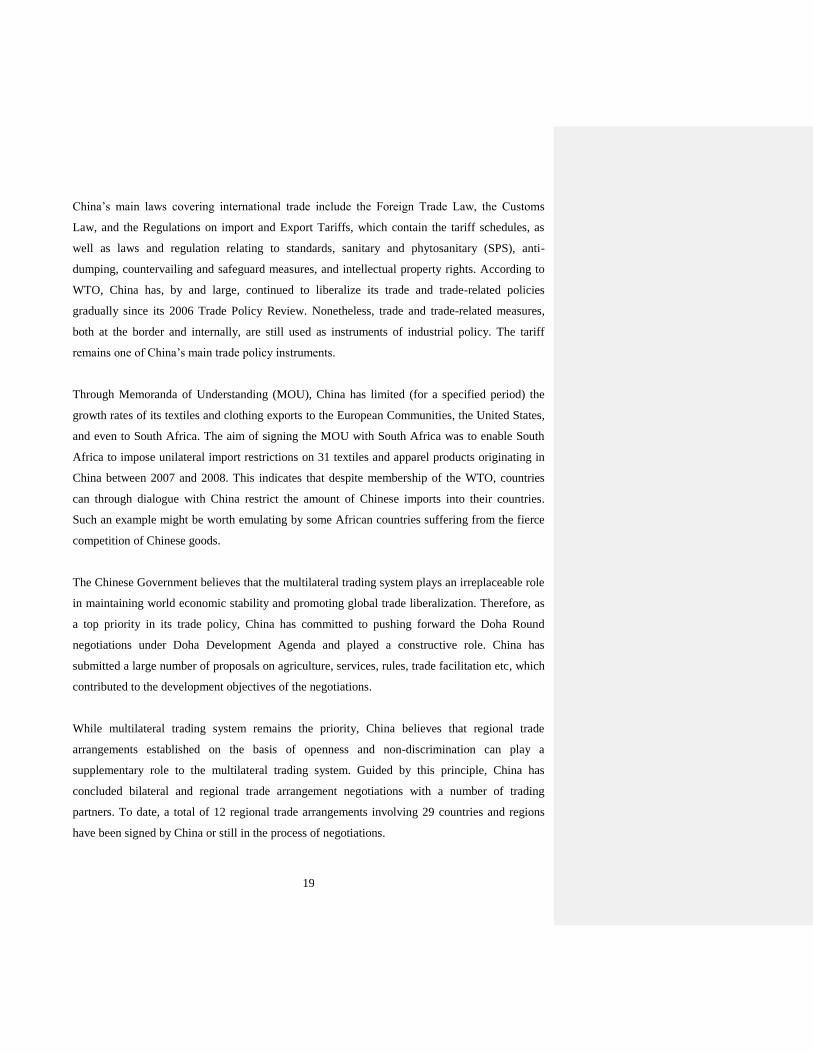
As in Table 5.3, about 496 (88%) of consumers believe they can identify made-in-China goods.
Of these about 310 (89%) males and 183 (87) females can identify. A slightly lower number of
respondents 449 (80) can identify made-in-Cameroon goods – 291 (83%) males and 155 (73%)
females. Up to 409 (73%) consumers are sensitive as to the origin of the goods they purchase –
258 (47%) males and 150 (71%) females. An overwhelming majority of those interviewed – 502
(89%) consume Chinese goods – 316 (91%) males and 184 (87%) females. Of the few who
indicated that they do not consume made-in-china goods, the main reason given across genders
was poor quality (Table 5.3).
Table 5.3: Knowledge of Chinese Goods
32
Variable All Male Female
Obs. % Obs. % Obs. %
Can identify made-in-China Yes 496 88,3 310 89.08 183 86.73
No 66 11,7 38 10.92 28 13.27
Can identify made-in-Cameroon Yes 449 79,9 291 83.62 155 73.46
No 113 20,1 57 16.38 56 26.54
Sensitivity to origin of goods Yes 409 72,8 258 74.14 150 71.09
No 144 25,6 85 24.43 57 27.01
Unidentified 9 1,6 5 1.44 4 1.9
Consumption of Chinese goods Yes 503 89,5 316 90.8 184 87.2
No 59 10,5 32 9.2 27 12.8
Total per variable 562 100,0 348 100 211 100
If no: Reasons for non-consumption
High prices 1 ,2 0 0 1 0.47
Poor quality 53 9,4 29 8.33 24 11.37
Scarcity 2 ,4 1 0.29 1 0.47
Unidentified 3 ,6 2 0.58 1 0.47
Source: Compile by authors from administered questionnaires
A large majority of respondents (535 consumers or 95%) believe that Chinese goods are
generally cheaper than made-in-Cameroon goods. Almost the entire sample of consumers
indicated that goods from Europe and North American are generally more expensive than
Chinese goods (Table 5.4, Panel A). While about 496 (88%) think that made-in-Cameroon goods
are at least of medium quality, about 530(94%) of respondents believe that made-in-China goods
are generally of medium to low quality. These quality perceptions are shared equally among men
and women. Nearly all consumers acknowledged the high quality of goods coming from Europe
and North America (Table 5.4, Panel B). Since exposure to Chinese goods about 75% of the
consumers have at least maintain their preferences for made-in-China goods. A slightly higher
proportion of women (26%) than men (23%) have actually scaled down their preferences for
Chinese goods since their first exposure (Table 5.4, Panel C).
Panel C of Table 5.4 equally shows that if income were to double, up to about 240 (43%)
consumers out of the 562 would actually downsize their demand for Chinese goods. While over
50% of the women share this view, only about 39% of the men do. In the contrary, if incomes
were to be slashed, a sizable number of consumers (264(47%)) would maintain their likeness for
made-in-China goods, while about 176(31%) would actually increase their preference. While the
same proportion of men and women will maintain their preference for Chinese goods in the face
of getting poorer, a slightly higher proportion of men than women have the propensity to
increase their preferences. Slightly over 55% of our sample and sub-samples share the view that

33
the presence of Chinese goods has reduced demand for second hand goods from Europe.
However, up to 44% of respondents will still cling on to second hand goods from Europe on the
basis of durability. Second hand goods from Europe sometimes turn to be more expensive than
similar made-in-China goods, and about 43% of consumers will prefer Chinese goods on the
grounds of newness and relative cheapness compared to second hand goods from Europe. As
shown in Panel D of Table 5.4, if an embargo were to be slammed on imports from China, a
majority of consumers (60%) believe their welfare would be affected negatively. A higher
proportion of men (64%) reveal adverse effects on welfare than women (55%).
Table 5.4: Price, Quality and Preferences for Chinese goods Variable All Male Female
Obs. % Obs. % Obs. %
Price comparisons with Chinese goods (Panel A)
Chinese goods are cheaper than made-in-Cameroon
Yes 535 95,2 334 95.98 198 93.84
No 26 4,6 14 4.02 12 5.69
Chinese goods are cheaper than made-in-Europe or USA
Yes 553 98,4 344 98.85 206 97.63
No 8 1,4 4 1.15 4 1.9
Quality comparisons with Chinese goods (Panel B)
Quality of Made-in-Cameroon goods is usually
High 128 22,8 77 22.13 51 24.17
Medium 368 65,5 229 65.8 137 64.93
Low 63 11,2 42 12.07 20 9.48
Quality of Made-in-china goods is usually
High 32 5,7 24 6.9 8 3.79
Medium 302 53,7 192 55.17 107 50.71
Low 228 40,6 132 37.93 96 45.5
Quality of Made-in-Europe/USA goods is usually
High 486 86,5 300 86.21 183 86.73
Medium 45 8,0 31 8.91 14 6.64
Low 2 ,4 2 0.57 0 0 Unidentified 29 5.2 15 4.31 14 6.64
Evolution of Preferences for Chinese goods (Panel C)
Since exposure to Chinese goods your demand has
Increased 191 34,0 121 34.77 67 31.75
Unchanged 228 40,6 143 41.09 85 40.28
Decreased 133 23,7 79 22.7 54 25.59 Unidentified 10 1.8 5 1.44 5 2.37
If income doubles demand for Chinese goods will
Increase 116 20,6 86 24.71 29 13.74
Unchanged 197 35,1 125 35.92 70 33.18
Decreased 240 42,7 134 38.51 106 50.24 Unidentified 9 1.6 3 0.86 6 2.84
If poorer demand for Chinese goods will
Increase 176 31,3 114 32.76 62 29.38
Unchanged 264 47,0 162 46.55 99 46.92
Decrease 118 21,0 71 20.4 47 22.27 Unidentified 4 0.7 1 0.29 3 1.42
Presence of Chinese goods has reduced Demand for second hand goods from Europe
Yes 314 55,9 194 55.75 118 55.92
No 248 44,1
154 44.25 93 44.08
If yes: What is responsible for this Price (P) 243 43,2 149 42.82 92 43.6

34
change Quality (Q) 16 2,8 9 2.59 7 3.32 Availability (A) 42 7,5 26 7.47 16 7.58
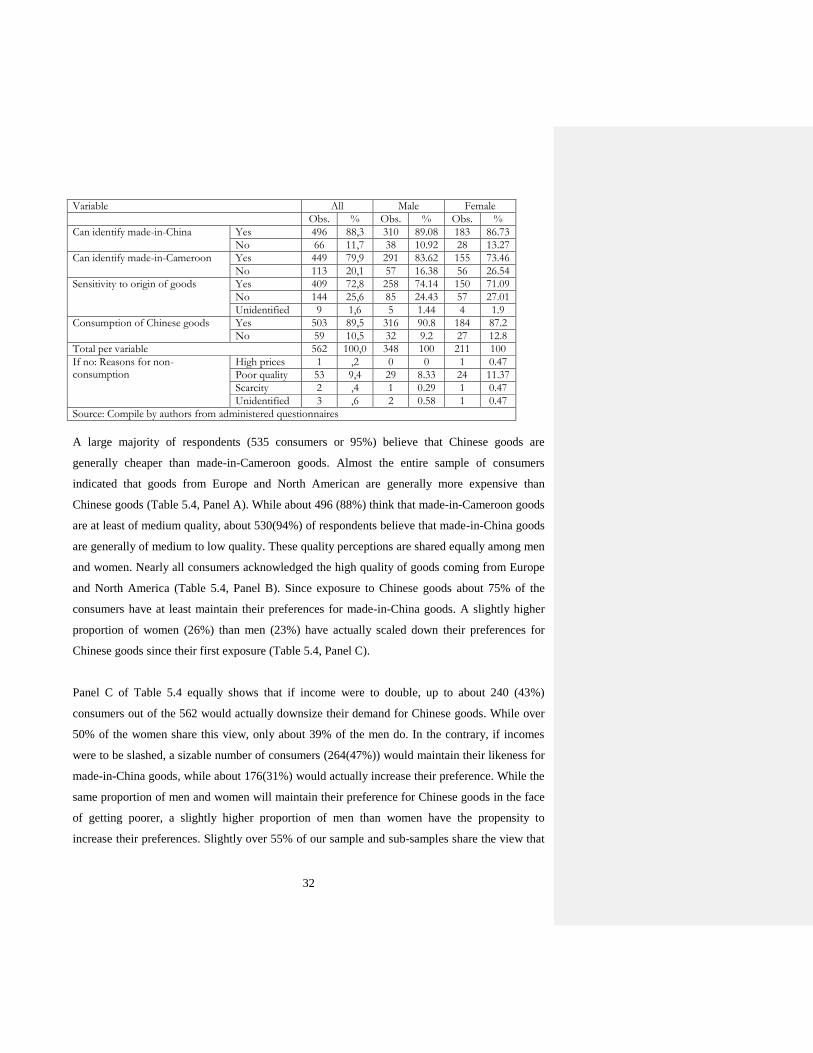
P & A 7 1,2 5 1.44 2 0.95
P & Q 3 ,5 3 0.86 92 43.6
Effect of a hypothetical ban of Chinese goods (Panel D)
An embargo on imports from China will affect welfare negatively
yes 341 60,7 223 64.08 116 54.98
No 219 39,0 125 35.92 93 44.08
Unidentified 2 ,4 - - 2 0.95
Total per variable 562 100,0 348 100 211 100
Source: Compile by authors from administered questionnaires
Table 5.5 indicates that of the 562 consumers interviewed only about 86 (15%) felt that their
well-being is negatively impacted by the ongoing world financial and economic crisis – 58(17%)
men and 28(13%) women fall under this category. Of the 86 consumers who are affected, 35
increase demand for made-in-China goods, while 17 decrease. Up to 55 indicate that they have
reduced their demand for goods imported from Europe and North America, while only 7 have
increased. In the case of made-in-Cameroon goods 38 have scaled down demand, while about 15
have actually increased their demand.
Table 5.5: Impact of Ongoing Economic Crisis on consumers Variable All Male Female
Obs. % Obs. % Obs. %
Any negative effects on well-being?
Yes 86 15,3 58 16.67 28 13.27
No 476 84,7 290 83.33 183 86.73
Total per variable 562 100,0 348 100 211 100
If yes: Effect on your demand for:
goods made-in-Cameroon Increased 15 2,7 9 2.59 6 2.84
Unchanged 33 5,9 24 6.9 9 4.27
Decreased 38 6,8 25 7.18 13 6.16
goods made-in-Europe/USA Increased 7 1,2 5 1.44 2 0.95
Unchanged 22 3,9 14 4.02 8 3.79
Decreased 55 9,8 38 10.92 17 8.06
unidentified 2 ,2
goods made-in-China Increased 35 6,2 24 6.9 11 5.21
Unchanged 34 6,0 23 6.61 11 5.21
Decreased 17 3,0 11 3.16 6 2.84
Second-hand goods Increased 29 5,2 20 5.75 9 4.27
Unchanged 36 6,4 23 6.61 13 6.16
Decreased 21 3,7 15 4.31 6 2.84
Total per variable 86 15.3 58 16.67 28 13.27
Source: Compile by authors from administered questionnaires

35
Constructing two-way tables of some variables with socioeconomic characteristics of consumers
to depict pair-wise tendencies, it emerges from cell percentages that:
- Younger persons are more sensitive to the origin of goods than older ones. In the same
manner, a higher proportion of younger persons consume made-in-china goods relative to
older persons.
- Those at the lower strata of income distribution consume made-in-China goods more than
those at the upper strata.
- More educated respondents are more apt at identifying Chinese goods than the less educated.
In the same way, sensitivity to the origin of goods increases with the level of education.
- Informal sector workers tend to have a higher propensity to identify Chinese goods than
formal sector workers. The tendency of paying attention to the origin of goods is not
dissimilar by sector of employment of consumers. However, more informal sector workers
consume made-in-china goods than those working in the formal sector.
- Younger consumers and those at the lower end of income distribution would appear to suffer
losses in welfare from a hypothetical government ban than older and less poor consumers.
The implication of results of the consumer survey is that of those interviewed younger persons
were also those who were more educated, employed mainly in the informal sector, found in the
lower strata of income distribution and consume the low priced and poor quality made-in-China
goods more than other group of households. As indicated, if incomes were to rise substantially,
this group of consumers may still have to maintain or even increase their demand for Chinese
goods, while better-off households scale down their demand. Chinese goods may, therefore be
perceived differently by the poor and non-poor. The less well-off appear to regard made-in-
China goods as normal goods, whereas the non-poor may be regarding them as inferior or giffen
goods.
5.3. Impact on Firms using cheap Chinese goods as inputs
To assess the complementary impact on firms using cheap Chinese goods in their production
process, we have used the results of a survey conducted in 2007 on motorcycle taxis in the town
of Yaoundé by Sama16 (2007). The objective of the study was not to evaluate the impact of trade
16 Sama (2007) conducted the survey for his end of course memoir for DESS in Transport Economics

36
with China, but to assess the impact of motorcycle taxis (commonly called Okada or Ben-skin)
on the inhabitants of Yaoundé. The use of motorcycles for taxi started timidly in 1991 in
Cameroon. Its emergence was favoured by a number of conditions: the political upheavals of the
1990s (marked ghost town operations with limited or no vehicle circulation); the poor state of
secondary roads in cities unfit for vehicle circulation; the collapse of the public urban transport
company (SOTUC); the high unemployment rate; etc.
Today in Yaoundé and other towns and villages in Cameroon, the motorcycle business is
flourishing, at least in terms of their numbers. Motorcycle taxis generally operate on secondary
roads within the city of Yaoundé and in the outskirts leading to surrounding villages. They ply
difficult paths, transporting people from one neighbourhood to the other and from inaccessible
areas to paved roads. Cameroon imports motorcycles from China, Europe and Japan, but all the
bikes used for taxi are from China. Bikes from elsewhere are too expensive to be used for the
motorcycle taxi business. As Table 5.6 indicates, most Chinese motorcycles are a third (or less)
cheaper than bikes from Japan. However, despite the price competitiveness of made-in-China
bites relative to Japanese bikes, they are spare-part intensive as well. Although it could be argued
that the spare parts intensity of Chinese bikes is simply because they are over-used as taxis, it
was acknowledged by motor bike repairers that components of Chinese bikes are general less
durable compared with made-in-Japan bikes.
Table 5.6: Prices of Motorcycles in Yaoundé (US dollars), as of April 2007
Country Made-in-Japan Made-in-China
Trade Mark Yamaha 100 Yamaha 125 Kawasaki Kimco 125 Kimco 150 Quinqui
Price 2608 3130 2712 866 939 709
Source: Sama (2007)
NB: We used an exchange rate CFAF479.27 per US$ in 2007, from the World Development Indicators
Sama (2007) administered 700 questionnaires to bike drivers in Yaoundé in April 2007 (details
in Sama, 2007). More than 71 percent of the drivers were aged 27 years or less, and 30 were
aged between 37 and 42 years. These included both literates (including university graduates) and
illiterates, and also some who have lost their jobs in the private sector. His study identified both
positive and negative impacts of the motorcycle taxi in Yaoundé. The first to benefit from this

37
activity are the motorcycle drivers who have found a job. Their daily revenue averages about
US$9.4 and after giving the contractual US$5.2 to the bike owner, they are left with US$4.2. Part
of this is spent for minor repairs and the remainder is their remuneration. One of the survey
questions sort to know their savings habits and the results showed that they saved on average
more than US$62.6 a month. This amount is more than the minimum monthly wage in
Cameroon which is below US$60. Motorcycle drivers are able to make a living out of this
activity.
Among those also benefiting from this activity are the bike owners/proprietors. Of the bike
drivers surveyed, only 20 percent were owners and the rest working as employees. The bike
drivers bring in a contracted average daily (except on Sundays) income of about US$5.2. The
daily income varies depending on the state of the bike, the area of operation, etc. If the average
cost of a Chinese bike is US$850 and the daily income of US$5, then a bike is expected to repay
its cost within 6 months. The working life of a bike taxi varies between one and two years. This
simple analysis shows that the bike taxi business is lucrative to the proprietors.
Though focus was on bike drivers, Sama (2007) also interviewed 30 bike repairers. Their daily
income varied between US$4.2 and US$10.4. Assuming a working month of 26 days (excluding
Sundays) and a daily income of only US$4.2/day, bike repairers earn almost double the monthly
minimum wage. Their numbers have been increasing rapidly to catch with the density of bikes in
town, including those that are not used as taxis.
The government and municipal authorities are also benefiting from the use of Chinese imported
motorcycles as taxi in the city of Yaoundé. Table 5.7 presents the various requirements for the
operation of a motorcycle taxi in Yaoundé. Apart from the insurance payments, all the other
payments are made either to the national or local government administrations. Motorcycle
drivers are also expected to obtain a driving permit from the government. With the estimated
more than one thousand motorcycle taxis in Yaoundé and more than ten thousand in the whole
country, the government is benefiting from this activity, which functions largely thanks to cheap
motorcycles imported from China.
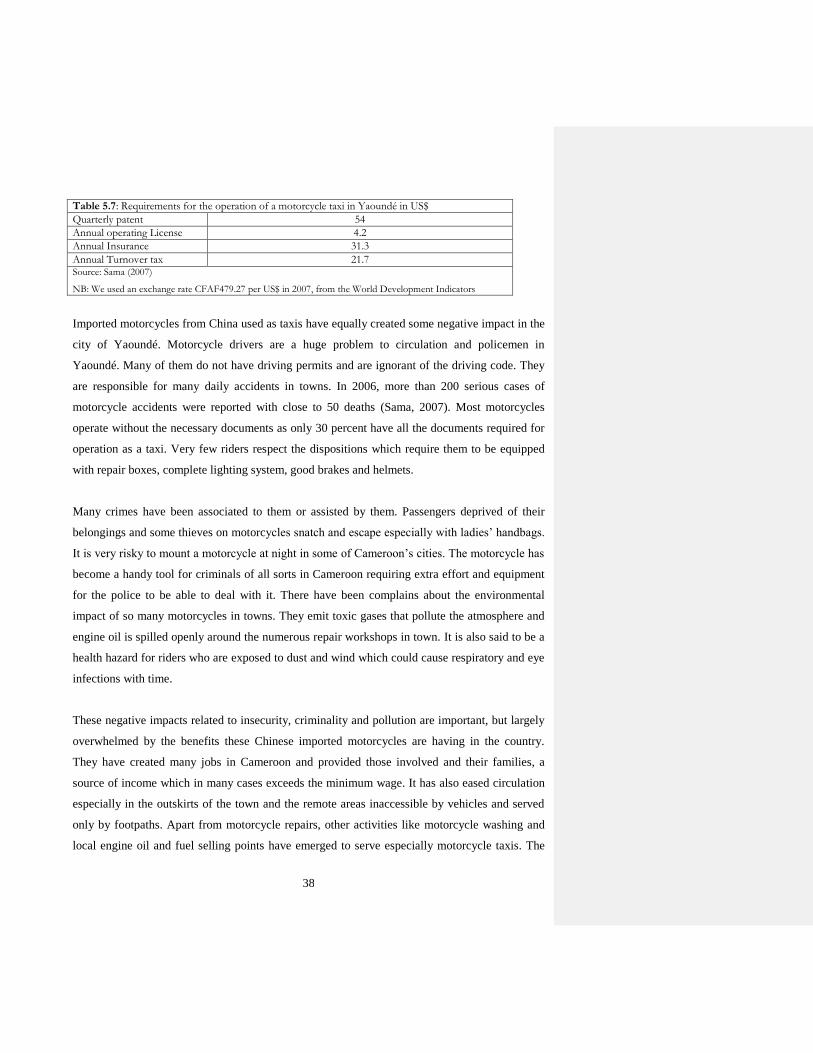
38
Table 5.7: Requirements for the operation of a motorcycle taxi in Yaoundé in US$
Quarterly patent 54
Annual operating License 4.2
Annual Insurance 31.3
Annual Turnover tax 21.7 Source: Sama (2007)
NB: We used an exchange rate CFAF479.27 per US$ in 2007, from the World Development Indicators
Imported motorcycles from China used as taxis have equally created some negative impact in the
city of Yaoundé. Motorcycle drivers are a huge problem to circulation and policemen in
Yaoundé. Many of them do not have driving permits and are ignorant of the driving code. They
are responsible for many daily accidents in towns. In 2006, more than 200 serious cases of
motorcycle accidents were reported with close to 50 deaths (Sama, 2007). Most motorcycles
operate without the necessary documents as only 30 percent have all the documents required for
operation as a taxi. Very few riders respect the dispositions which require them to be equipped
with repair boxes, complete lighting system, good brakes and helmets.
Many crimes have been associated to them or assisted by them. Passengers deprived of their
belongings and some thieves on motorcycles snatch and escape especially with ladies’ handbags.
It is very risky to mount a motorcycle at night in some of Cameroon’s cities. The motorcycle has
become a handy tool for criminals of all sorts in Cameroon requiring extra effort and equipment
for the police to be able to deal with it. There have been complains about the environmental
impact of so many motorcycles in towns. They emit toxic gases that pollute the atmosphere and
engine oil is spilled openly around the numerous repair workshops in town. It is also said to be a
health hazard for riders who are exposed to dust and wind which could cause respiratory and eye
infections with time.
These negative impacts related to insecurity, criminality and pollution are important, but largely
overwhelmed by the benefits these Chinese imported motorcycles are having in the country.
They have created many jobs in Cameroon and provided those involved and their families, a
source of income which in many cases exceeds the minimum wage. It has also eased circulation
especially in the outskirts of the town and the remote areas inaccessible by vehicles and served
only by footpaths. Apart from motorcycle repairs, other activities like motorcycle washing and
local engine oil and fuel selling points have emerged to serve especially motorcycle taxis. The
39
motorcycle taxi business, although also operating in rural areas, has engendered an influx of
young men from rural areas to the main urban centres to take up jobs as bike drivers.
The demand for made-in-China bikes in Cameroon is derived from the collapse of the urban
public transportation services in the 1990s as government was implementing expenditure-
reducing measures as required within the SAP. To scale down imports of Chinese bikes used as
taxis, there is an urgent need to enhance the recent efforts at reinstating subsidized urban
transport systems in the main cities and even extending them to secondary cities.
5.4. Impact on Firms facing competition from Chinese imported goods
This section assesses the impact of Chinese imports on local producers who are directly facing
competition from Chinese goods, i.e. they are producing and marketing same goods as those
imported from China. Cameroon has the most developed manufacturing sector within the Central
African sub-region, and exports a reasonable quantity of manufactured goods to countries like
Gabon, Chad, Congo, etc; but also to other African countries like Côte d’Ivoire and Togo. The
share of industrial products in total exports stood at 26.5% in 2002, down from 30.7% in 2001
(NIS, 2004). It is in this sector that China is likely to pose a serious competitive challenge to
Cameroon; especially as concerns those commodities equally produced and exported or
consumed locally by Cameroon.
To better appreciate the competitive impact of Chinese exports, we examine the evolution of
Cameroon’s exports to the Central African sub-region (a traditional market for Cameroon’s
manufactured exports).
Table 5.8: Evolution of Cameroon’s Exports to the Central African Sub-Region (Million US$)
Central African Sub-region 2001 2002 2003 2004 2005
Congo Republic 18.58 21.22 20.34 22.49 21.01
Gabon 15.44 18.66 42.81 37.70 28.54
Equatorial Guinea 9.86 9.88 30.38 29.74 18.15
Central African Republic 5.13 14.22 13.05 11.35 11.39
Chad 11.44 38.77 45.64 27.63 26.36
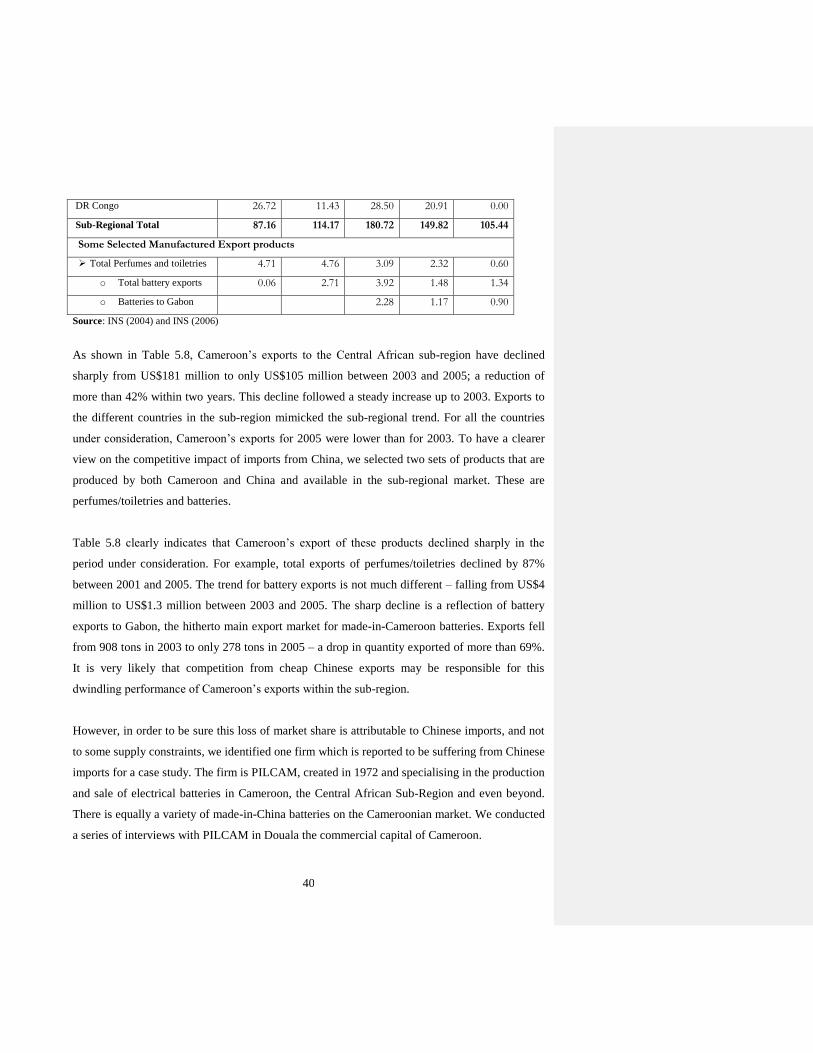
40
DR Congo 26.72 11.43 28.50 20.91 0.00
Sub-Regional Total 87.16 114.17 180.72 149.82 105.44
Some Selected Manufactured Export products
Total Perfumes and toiletries 4.71 4.76 3.09 2.32 0.60
o Total battery exports 0.06 2.71 3.92 1.48 1.34
o Batteries to Gabon 2.28 1.17 0.90
Source: INS (2004) and INS (2006)
As shown in Table 5.8, Cameroon’s exports to the Central African sub-region have declined
sharply from US$181 million to only US$105 million between 2003 and 2005; a reduction of
more than 42% within two years. This decline followed a steady increase up to 2003. Exports to
the different countries in the sub-region mimicked the sub-regional trend. For all the countries
under consideration, Cameroon’s exports for 2005 were lower than for 2003. To have a clearer
view on the competitive impact of imports from China, we selected two sets of products that are
produced by both Cameroon and China and available in the sub-regional market. These are
perfumes/toiletries and batteries.
Table 5.8 clearly indicates that Cameroon’s export of these products declined sharply in the
period under consideration. For example, total exports of perfumes/toiletries declined by 87%
between 2001 and 2005. The trend for battery exports is not much different – falling from US$4
million to US$1.3 million between 2003 and 2005. The sharp decline is a reflection of battery
exports to Gabon, the hitherto main export market for made-in-Cameroon batteries. Exports fell
from 908 tons in 2003 to only 278 tons in 2005 – a drop in quantity exported of more than 69%.
It is very likely that competition from cheap Chinese exports may be responsible for this
dwindling performance of Cameroon’s exports within the sub-region.
However, in order to be sure this loss of market share is attributable to Chinese imports, and not
to some supply constraints, we identified one firm which is reported to be suffering from Chinese
imports for a case study. The firm is PILCAM, created in 1972 and specialising in the production
and sale of electrical batteries in Cameroon, the Central African Sub-Region and even beyond.
There is equally a variety of made-in-China batteries on the Cameroonian market. We conducted
a series of interviews with PILCAM in Douala the commercial capital of Cameroon.

41
The management of PILCAM was very categorical about the origin of their problems. We did
not need to mention China. Even though there are also European batteries on the market, their
loss of market share was entirely blamed on Chinese batteries. They were quick to indicate the
price and quality differences between their batteries and those of China. In Cameroon, a pack of
4 size AA batteries made by PILCAM (Hellesens) cost US$0.67, while those imported from
China (Royal)17 sales at just US$0.2218 i.e. almost 67% less despite incurring additional costs
like custom duty, insurance, transport costs, etc. to arrive Cameroon. The price differential
should be much larger in third markets, as batteries from Cameroon will have to incur additional
costs to enter those markets. This is a very likely explanation for the falling domestic turnover
and exports (see Table 5.8 for battery exports).
The next question is: why are Chinese batteries cheaper than those of PILCAM despite the costs
involved in importing those batteries to Cameroon? The management of PILCAM provided a
number of reasons. The first had to do with the quality of Chinese batteries. Table 5.9 indicates
the quality differences between similar Chinese and PILCAM batteries.
Table 5.9: Quality difference between Cameroonian- and Chinese–made batteries
Types of Batteries
Battery
Quality
R20 R6 R3
Cameroon China Cameroon China Cameroon China
Lifespan 350min 220min 34h 14h 32h 12h
Voltage 1.68 1.55 1.69 1.56 1.69 1.56
Source: Interview conducted by authors at PILCAM’s head office in Douala
In terms of three classes of batteries, Table 5.9 indicates that both the lifespan and voltage of
made-in China batteries is generally lower than those made-in Cameroon. Related to the issue of
quality is that of the ignorance of the consumers. PILCAM regrets that consumers are not aware
of the quality difference between the batteries, and are attracted by the lower prices of Chinese
17 Hellesens batteries are produced in Cameroon by PILCAM, while Royal batteries are produced by the China
Royal Battery Company Ltd. There are about four other brands of China-made batteries selling in Cameroon. 18 We have used an exchange rate of US$1=CFAF447.81 i.e. the average exchange rate for 2008 from the World
Development Indicators database

42
batteries. They equally indicated that in spite of the lower quality, the cheapness of Chinese
batteries is largely attributable to the observation that these products are smuggled into
Cameroon. A large proportion of Chinese batteries enter Cameroon without paying custom
duties and those who market them do not pay local taxes. They refer to the competition as
‘unfair’. If these issues were dealt with, Chinese batteries will become expensive and PILCAM
will be able to compete effectively, they claimed.
What have therefore been the Consequences of the competition from Chinese batteries on
PILCAM? Its turnover has plummeted. Between 2005 and 2008, sales dwindled by more than 82
percent i.e. from US$9.6 million in 2005 to below US$6.3 million in 2008 (Table 5.10). Exports
have equally dropped drastically as indicated above in Table 5.8.
Table 5.10: Turnover of PILCAM for recent years
2005 2006 2007 2008
CFA Francs 5,064,367,212 5,524,700,689 3,853,404,254 2,780,036,193
Exchange rate 527.47 522.89 479.27 447.81
US Dollars 9,601,276 10,565,701 8,040,207 6,208,137
Source: Turnover provided to authors by PILCAM.The exchange rate is taken from the World
Development Indicators database
A firm facing declining sales will certainly cut down its level of production, and consequently,
its rate of factor-utilisation. Though PILCAM refused to provide quantitative information on the
level of output and size of workforce, their response from qualitative questions clearly show that
output has fallen and workers have been laid off. It cannot be otherwise, given that the company
has lost about 82 percents of its turnover in the last four years. They refused to comment on the
evolution of average salary paid to staff.
How has PILCAM been surviving or what is their coping strategy? They outlined a number of
measures they have taken to remain in business despite the Chinese onslaught: 1) product
diversification by producing low cost batteries (certainly low quality batteries too); 2) reducing
their profit margin so that customers buy at reduced prices; 3) communicate on the superior
quality of their products; and 4) withdrawal of expired batteries at no cost to the
wholesalers/retailer.

43
What does PILCAM expect from the government in order to improve its competitive position?
They listed a number of wishes: 1) More rigorous control of imported goods by custom officials
and stringent checks on smuggled goods by the Ministry of Trade; 2) sensitisation of the
population by government on the quality of goods consumed in the country; and 3) rigorous
taxation of products imported from China and elsewhere.
PILCAM is a company in real difficulty. Their prospects are not really bright, though their
declared intention is to expand the scale of activities. One interesting issue is that PILCAM is not
calling on the government to ban the importation of batteries; they are asking for a fairer
playground. They need some radical changes to remain competitive in the battery market in
Cameroon. This is even more the case with the impending signing of EPA by Cameroon, which
will make EU batteries equally very competitive. Perhaps, the battle for the Cameroonian and
sub-regional market will be between Chinese batteries and made-in-EU batteries.
If we could draw any inference from the PILCAM case study, then the manufacturing sector in
Cameroon is losing out from the competition with Chinese imports. Firms in Cameroon are not
only losing market at home, but also in their backyard. The population at large might also be
feeling the effects as these firms are either dismissing workers or slashing their wages.
5.5. Net Impact
The limited scope of this study does not permit us to provide the net impact of trade with China.
The many stakeholders are affected differently and to varying degrees, making it impossible to
make an overall assessment on the country as a whole. Consumers benefit from cheap
consumption goods, local firms using cheap Chinese imports as inputs also gain, export firms
create jobs, but those facing competition from made-in-China products are losing out. The
government is gaining from tariff revenue, export royalties, which contribute positively to its
fiscal balance, as well as its current account balance. On the other hand, the government is losing
as firms produce less, lay off workers, implying less income and business tax revenues, and a
large educated jobless population constitutes a political risk to the government. The proliferation

44
of the motorcycle is also having a toll on insecurity, crime, rural exodus and environmental
pollution.
6. Conclusion
China has become an important player in the global economy and is impacting almost every
country in the world. Cameroon has maintained steady diplomatic ties with China since 1971,
after severing links with Taiwan. Economic interactions are evolving rapidly, and providing
Cameroon with alternative sources of finance and helping to diversify its market outlets. These
interactions are engendering both winners and losers among the relevant stakeholders in
Cameroon. The implication is for authorities to device means of enhancing the gains while
addressing the losses, rather than relying on the rhetoric of win-win partnership and reciprocal
benefits frequently proclaimed by the Chinese leadership.
Trade with China has increased considerably over the past few years. This has however been due
to a surge in imports from China, while exports are declining. Cameroon has been running a
large trade deficit with China; the 5th largest after Nigeria, France, Japan and Germany. Imports
from China are providing cheap and diverse consumption and capital goods, though issues of
quality abound. Exports to China are limited to a few primary products, essentially cotton and
wood products. Imports on the other hand are made up of a large variety of essentially
manufactured goods. This raises the risk of undermining the industrial sector and locking
Cameroon in primary activities.
The European Union remains Cameroon’s major trading partner, supplying on average about
45% of its imports and buying about 67% of its exports. However, China’s share of the
Cameroonian market has been increasing rapidly in the last few years at the expense of European
countries, especially France and Germany. China’s share of imports increased from 2.7 to 5%
between 2001 and 2005, while that of France declined from 24.1% to 17.7 % during the same
period. China then moved from the 7th to become Cameroon’s 3rd import source. Exports to
China have however been evolving in the opposite direction, consequently aggravating the trade
deficit between the two countries.
45
An assessment of the impact of trade with China has revealed both winning and losing
stakeholders in Cameroon. As concerns the welfare impact on consumers, many Cameroonians
are sensitive to the origin of goods they consume and a large proportion of them consume
Chinese goods, though acknowledging that they are of lower quality compared to Cameroonian
or European/US goods. Many city dwellers (60% of respondents) agree that they will lose if
Chinese goods cease to exist in Cameroon. Therefore, Chinese goods are having a positive
impact on consumers, especially those at the lower strata in the distribution of income.
Chinese imported motorcycles are substantially complementing the production of taxi services in
all towns in Cameroon. This has led to an increase in the supply of taxi services, the creation of
many jobs, many out of poverty, and increased government revenue; though there are concerns
related to criminality and environmental issues. Our case study indicates that the battery factory
is under immense competitive pressure with turnover plummeting. The likelihood is that other
firms producing goods similar to those imported from China are facing a similar situation.
There is need for Cameroon to sort out ways of increasing and diversifying exports to China,
especially for commodities like banana, coffee, cocoa, etc. Processed cotton could also be
included in the list because it would benefit from duty-free access, though this requires very cost-
effective processing methods. This is because raw cotton is highly protected in the Chinese
market. To release some of the competitive pressures on the local industry, measures need to be
taken to effectively downsize the fraudulent entry of Chinese goods into the country so as to
compete fairly with local firms. The government could also protect some strategic sectors
through dialoguing with China for voluntary restriction of some exports. Cameroon may not
negotiate any unilateral trade arrangements with China given her obligations as member of the
CEMAC sub-region.
As indicated, no country in the world appears to have developed or modernised its economy
sustainably without structurally transforming its agriculture to reach the takeoff point, as the way
ahead. We believe that Cameroon now has an opportunity to transform its agriculture and take
advantage of Chinese growth through trade. To transform the agricultural sector in this context,

46
there is a need to specify sub-sectors that will receive a continuing gross flow of resources –
sizable pieces of land for large-scale production, inputs, research and credit – combined with
appropriate institutions and incentive packages to increase this sector’s productivity and potential
to subsequently generate a net surplus. Short-circuiting this structural transformation process for
industrial promotion has typically led to failure and disappointment, thus, not a viable route for
Cameroon to follow in order to maximize net benefits offered by China-Cameroon trade
relations.
A strategic approach to exploit the benefits and dampen the losses with China-Cameroon trade
relations requires a more long-term vision of upgrading Cameroon’s comparative advantages
towards higher value activities by climbing the technology ladder step by step (mass production
of agricultural products, transformation of industry, and up to high tech goods) through learning
and adoption of best practices, while relying on her most abundant factors in each development
phase. This vision could be galvanized by strategically using fiscal policies and dismantling
administrative bottlenecks that act as a drag on private initiatives.
References
African Development Bank and OECD (2009) “Africa Economic Outlook”
http://www.africaneconomicoutlook.org/en/countries/central-africa/cameroon/. Assessed
on June 16, 2009
Ajakaiye, O. (2006) “China and Africa – Opportunities and Challenges”. A Presentation at the
African Union Task Force on Strategic Partnership Between Africa and the Emerging
Countries of the South, Addis Ababa, Ethiopia, 11–13 September
Amsden A. H. (1989) Asia’s Next Giant: South Korea and Late Industrialization. Oxford
University Press: New York.
Baye, Francis M. (2006) ‘Growth, Redistribution and Poverty Changes in Cameroon: A Shapley
Decomposition Analysis, Journal of African Economies, Vol. 15, No. 4, pp. 543-570.
Ben-David, D. and M. B. Loewy (1998) ‘Free-trade, growth, and convergence’. Journal of
Economic Growth, 3: 143–70.
Brown, D., Vabi, M. B. and Nkwinkwa, R. (2003) Community Forestry as Entry Point for
Governance Reforms in the Forestry Sector in the Central African Sub-region: The Case
of the Republic of Cameroon, Paper prepare for the XII World Forestry Congress to be
held in Quebec City, Canada, September 2003.
Cameroon Tribune No 8781/4980 of Friday, February 2, 2007.
Fosu, A. (1990). “Exports and Economic Growth: The African Case”. World Development,
18(6): 831-835,
47
Giles, J. A. and C. L. Williams (2000) “Export-led Growth: A Survey of the Empirical Literature
and some Non-Causality Results. Part 1”. The Journal of International Trade and
Economic Development, 9(3): 261–337
Goldstein, A., N. Pinaud and H. Reisen (2006) “The Rise of China and India: What's in it for
Africa?” OECD Policy Insights No 19
Harrison A (1996) “Openness and growth: A time-series, cross-country analysis for developing
countries”. Journal of Development Economics, 48: 419–447
Hong, K. J. (2006) “Impact of China on Economies in East Asian Region” A Framework Paper
for AERC Project on “The Impact of Asian Drivers on Sub-Saharan Africa”.
Jung S. W. and P. J. Marshall (1985) “Exports, growth and causality in developing countries”.
Journal of Development Economics, 18: 1–12
Kaplinsky, R. (2007) “The Impact of China and India on the Sub-Saharan Africa: A
Methodological Framework”. A Framework Paper for AERC Project: “The Impact of Asian
Drivers on Sub-Saharan Africa”.
Kaplinsky, R. and M. Morris (2007) “Do the Asian Drivers Undermine Export-oriented
Industrialization in SSA?” World Development, doi:10.1016/j.worlddev.2007.06.007
Khan, S. A. and F. M. Baye (2008) “China-Africa Economic Relations: The case of Cameroon”.
Scoping Study for the AERC project,: “The Impact of Asian Drivers on Sub-Saharan
Africa”. Paper No. SSC_16 http://www.aercafrica.org/publications/category.asp
Krueger, A. O. (1995) Trade Policies and Developing Nations. Washington, DC: Brookings
Institution.
Minson, Adam (2008) “China’s Preferential Trade Policy for Africa” China in Africa, No. 1,
(February). South African Institute of International Affairs (SAIIA)
Nissanke, M., Thorbecke, E. (2005): “Channels and Policy Debate in the Globalisation-
Inequality_Poverty Nexus”, Discussion Paper No.2005/08, WIDER, Helsinki.
Rodrik, D. (1999). The New Global Economy and Developing Countries: Making Openness
Work. Washington, DC: Overseas Development Council
Rodrik, D. (2006) “What’s so Special about China’s Exports?” Faculty Research Working
Papers Series No. RWP06-001. John F Kennedy School of Management, Harvard
University
Sama, Johanes (2007). “The Socio-Economic Impact of Motorcycle Taxis in the Yaoundé
Municipality”. DESS Memoire in Transport Economics, Faculty of Economics and
Management, University of Yaoundé II
Sandrey, Ron (2007) “The African Merchandise Trading Relationship with China” Inside AISA,
Number 3 and 4, October/December.
Wade R. (1990) Governing the Market: Economic Theory and the Role of Government in East
Asian Industrialization. Princeton University Press: Princeton, New Jersey
Wälde, K. and C. Wood (2004) “The Empirics of Trade and Growth: Where are the Policy
Recommendations? International Economics and Economic Policy, 1:275–292
Wang, J. (2007) “What Drives China’s Growing Role in Africa?” IMF Working Paper No.
WP/07/211
Weizhong, X. (2008) “Sino-African Relations: New Transformations and Challenges” in Gerrero
and Manji (eds) China’s New Role in Africa and the South. Cape Town and Bangkok:
Fahamu and Focus on the Global South

48
Winters, L. A. and S. Yusuf (2007) “Introduction” in Winters and Yusuf (eds) Dancing with
Giants: China, India, and the Global Economy. Washington, DC and Singapore: World
Bank and the Institute of Policy Studies
World Bank (1993) The East Asian Miracle: Public Policy and Economic Growth. New York:
Oxford University Press.
Yanikkaya, H. (2003) “Trade Openness and Economic Growth: A Cross-Country Empirical
Investigation”. Journal of Development Economics, 72: 57– 89.
Appendix
Table A1: Evolution of the Composition of Exports to China (Million US$)
SITC Codes Description 2000 2001 2002 2003 2004 2005
333 Crude oil 105.75 92.22 57.37 58.33 0.00 0.00
263 Raw cotton 0.00 0.00 0.09 21.08 40.64 51.18
247 Rough wood 14.21 5.37 11.02 6.19 6.51 10.39
248 Simply worked wood 2.76 3.85 8.67 11.73 14.23 4.75
246 Wood chips and waste 0.07 0.23 0.63 0.61 0.52 1.31
Other exports 0.00 0.04 0.04 0.07 0.85 1.25
Total 122.79 101.71 77.82 98.02 62.75 68.87
Source: INS (2004) and INS (2006)
Table A2: Evolution of the Composition of Imports from China (Million US$)
SITC Code Description 2000 2001 2002 2003 2004 2005
04 Cereals 22.41 23.85 33.96 25.41 19.37 0.01
851 Footwear and accessories 2.10 2.04 2.28 9.73 18.64 16.19
73/74/75/76 Machines, electrical and mechanical components
4.42 4.33 7.26 11.66 17.07 25.46
78/72 Road vehicles; tractors 0.64 0.66 1.29 3.44 6.81 13.14
666 Ceramic products 1.21 2.18 2.50 4.06 6.91 10.43
69 Manufactures of metals 1.62 1.34 1.93 2.83 3.97 6.75
893 Plastic materials 0.81 1.25 1.48 2.12 2.84 6.70
Fish and shell fish 0.00 0.02 0.23 0.62 0.31 4.89
62 Rubber 0.89 0.90 1.06 2.03 3.53 6.20
83/611 Travel goods, leather articles etc
1.63 1.62 1.41 2.74 3.40 6.05
266/267 Synthetic or artificial fibres 0.91 1.25 0.56 1.14 2.51 4.41
872 Medical equipments etc. 0.65 0.69 1.31 1.45 1.88 3.58
54 Pharmaceutical products 0.71 0.62 0.96 1.01 1.14 3.10
846 Clothing accessories 0.31 1.27 0.46 1.03 1.84 3.03
881/884 Photographic apparatus and optical goods, etc
1.31 0.80 0.00 1.97 2.01 2.43
59 Diverse chemical products 0.16 0.26 0.51 1.18 1.34 2.41
654 Other textiles and confectionaries
0.56 0.41 0.80 1.40 1.59 2.07
899 Other Imports 7.49 5.74 8.54 12.84 15.52 27.26
Total 47.82 49.27 66.53 86.65 110.69 144.11
Source: INS (2004) and INS (2006)
The composition of each of the Export commodity groups as presented on Table 3
49
1. Crude Materials: raw cotton, rough wood, simply worked wood, and wood chips and waste
2. Mining: Crude oil
The composition of each of the import commodity groups as presented on Table 5 1. Food: Cereals and fish and shellfish
2. Plastic and rubber materials: plastic Materials and Rubber
3. Chemical products: pharmaceutical Products and diverse chemical Products
4. Machinery, transport and other equipment: machines and electrical devices, machines and mechanical
devices, road vehicles and tractors, medical equipments, and photographic apparatus and optical
goods
5. Other manufactured goods: ceramic products, manufactures of metals, travel goods, leather articles,
synthetic or artificial fibres, clothing accessories, footwear and accessories, other textiles and
confectionaries, and other imports