Embed Size (px)
Citation preview

The Impact of Centralized Pain on Acute and Chronic
Post-surgical Pain Chad M. Brummett, M.D.Associate ProfessorDirector, Clinical Anesthesia ResearchDirector, Pain ResearchDepartment of AnesthesiologyDivision of Pain MedicineUniversity of Michigan Medical SchoolEmail: [email protected]: @drchadbhttp://medicine.umich.edu/dept/pain-researchwww.michigan-OPEN.org

Funding and Disclosures• Funding
– NIAMS/NIH: R01 AR060392; P50 AR070600– NIDA/NIH: R01 DA038261; R01 DA042859 – Michigan Department of Health and Human Services– SAMHSA– Michigan Genomics Initiative– Department of Anesthesiology– Neuros Medical, Inc
• Disclosures– Patent for the use of peripheral perineural dexmedetomidine alone and
in combination with local anesthetics. Application number 12/791,506; Issue Date 4/2/13; Patent Number 8410140
– Consultant- Recro Pharma


Projected Rates of Primary Arthroplasty
Kurtz S. et.al. J Bone Joint Surg 2007:89:780-785

There is substantial discordance between the degree of OA on radiograph and reported pain
http://radforjieun.blogspot.com/2012/03/kellgren-lawrence-kl-score.html; Last accessed 10/30/13
Grade 1 Grade 2 Grade 3 Grade 4
Creamer P, Hochberg MC. Br J Rheumatol 1997;36

http://radforjieun.blogspot.com/2012/03/kellgren-lawrence-kl-score.html; Last accessed 10/30/13
Grade 1 Grade 2 Grade 3 Grade 4
Creamer P, Hochberg MC. Br J Rheumatol 1997;36
Only ~50% of people with
Grade 3-4 OA reported pain

http://radforjieun.blogspot.com/2012/03/kellgren-lawrence-kl-score.html; Last accessed 10/30/13
Grade 1 Grade 2 Grade 3 Grade 4
Creamer P, Hochberg MC. Br J Rheumatol 1997;36
~10% of patients with no OA on radiographs report
pain

Persistent Pain After Knee and Hip Arthroplasty is Common
Wylde V et al, Pain 2011, 152: 566-572
32% 17%

Predictors of poor TKA & THA outcomes
9
Adjusted OR 1.3Adjusted OR 2.3-3.5
Adjusted OR 7-8.5 Adjusted OR 11.8-14.8
Depression Pain Problems in 1-2 Locations
Pain Problems in 3-4 Locations Pain Problems in ≥ 5 Locations
Wylde V, Pain 2011


Paradigm Shift in Fibromyalgia
Anterior Posterior
■ Discrete illness■ Focal areas of
tenderness■ Psychologic
and behavioralfactors nearlyalways present and negative
■ Chronic widespread pain
■ Tenderness in ≥11 of 18 tender points
American College of Rheumatology (ACR) Criteria
■ Final common pathway
■ Part of a larger continuum
■ Many somatic symptoms, diffuse tenderness
■ Psychologic and behavioral factors play roles in some individuals
From Dr. Daniel Clauw- With permission

Differentiating pain that is more centralized could provide a mechanistic rationale for interventions
CentralizedPain
PeripheralPain

Differentiating pain that is more centralized could provide a mechanistic rationale for interventions
CentralizedPain
Cohen SP, Raja SN. Anesthesiology 2007
PeripheralPain

“Fibromyalgia-ness”
Clauw DJ. JAMA 2014;311(5)Wolfe F, Clauw DJ, et al. J Rheum 2011;38
Brummett CM et al. Pain 2016, 157(6)
Symptom Severity Index(0-12)
CNS derived symptoms that accompany centralized pain
Widespread Pain Index(0-19)
Measures the numberof areas of chronic pain
Total fibromyalgia survey score combines the two and ranges from 0-31

Hypothesis #1: Higher fibromyalgia survey scores would independently predict increased opioid consumption in the acute postoperative period following TKA and THA.

Distribution of fibromyalgia survey scores in TKA/THA cohort

Fibromyalgia Survey Score
Low Moderate High

Higher FM scores was associated with a worse preoperative pain phenotype
Brummett CM et al. Anesthesiology 2013;119(6)
LOW MODERATE HIGH p-valuen = 170 n = 199 n = 147
Fibromyaglia Survey Score 0-4 5-8 9-31
Preoperative Pain PhenotypeSurgical Site Pain Severity (0-10) 4.28 (2.21) 4.72 (1.94) 5.61 (2.05) <0.00001Overall Body Pain Severity (0-10) 4.12 (2.06) 4.74 (1.83) 5.73 (1.96) <0.00001Duration of pain in surgical site (days) 1593 (1790) 1692 (2380) 1529 (1711) 0.76Neuropathic Pain ([-1]-[+38]) 7.74 (5.05) 8.98 (5.66) 12.6 (6.74) <0.00001Depressive Symptoms (0-21) 3.06 (2.22) 4.43 (2.62) 7.2 (3.89) <0.00001Anxiety Symptoms (0-21) 3.89 (2.81) 5.44 (3.1) 7.71 (4.19) <0.00001Catastrophizing (0-36) 2.52 (3.49) 4.15 (4.55) 9.11 (7.59) <0.00001Positive Affect (0-18) 1.96 (1.93) 3.17 (2.49) 5.62 (3.62) <0.00001
Medical PhenotypeBMI (kg/m2) 30.1 (10.8) 31.3 (5.72) 30.6 (6.2) 0.3ASA Status
ASA 1 5.4 4.0 4.2 0.3ASA 2 61.7 63.1 52.8ASA 3 32.3 32.8 43.0ASA 4 0.6 0.0 0.0
Preop home opioid use (% on opioids) 10 23.1 38.1 <0.00001Home opioid dose (24-hr OME) 1.19 (5.01) 6.69 (19.7) 27.2 (74.6) <0.00001

Brummett CM et al. Anesthesiology 2013;119(6)
LOW MODERATE HIGH p-valuen = 170 n = 199 n = 147
Fibromyaglia Survey Score 0-4 5-8 9-31
Duration of postoperative admission (days) 2.89 (0.95) 2.99 (0.89) 3.14 (0.983) 0.066PACU Opioid Consumption (OMEs) 30.6 (22.4) 31.1 (25.3) 46.8 (63.4) 0.0034Total Post-operative Opioid Consumption (OMEs) 175 (129) 221 (188) 381 (515) <0.00001
Opioid Consumption and Duration of Inpatient Admission by Tertile

Multivariate Model of Opioid Consumption
Estimate Std. Error t value Pr(>|t|)(Intercept) 393.17 71.29 5.51 <0.00001Age (Years) -6.86 0.99 -6.90 <0.00001Preoperative opioid use (OMEs) 3.30 0.26 12.51 <0.00001Anesthesia- GA+Block -78.61 52.53 -1.50 0.14Anesthesia- GA+Neuraxial -55.51 32.34 -1.72 0.087Anesthesia- Neuraxial -71.72 24.18 -2.97 0.0032TKA (vs. THA) 78.94 22.58 3.50 0.00051Length of postoperative stay (Days) 64.85 11.88 5.46 <0.00001Fibromyalgia survey score 9.09 2.57 3.54 0.00044
Brummett CM, et al. Anesthesiology 2013;119(6)

Multivariate Model of Opioid Consumption
Estimate Std. Error t value Pr(>|t|)(Intercept) 312.82 54.23 5.77 <0.00001Age (Years) -4.53 0.77 -5.91 <0.00001Anesthesia- GA+Block -32.03 40.04 -0.80 0.42Anesthesia- GA+Neuraxial 3.37 23.69 0.14 0.89Anesthesia- Neuraxial -50.32 17.63 -2.85 0.0046TKA (vs. THA) 76.94 16.60 4.64 <0.00001Length of postoperative stay (Days) 37.17 8.64 4.30 0.00002Fibromyalgia survey score 7.49 2.06 3.63 0.00033
Patients using opioids preoperatively excluded from the model
Brummett CM, et al. Anesthesiology 2013;119(6)

Multivariate Model of Opioid Consumption
Estimate Std. Error t value Pr(>|t|)(Intercept) 312.82 54.23 5.77 <0.00001Age (Years) -4.53 0.77 -5.91 <0.00001Anesthesia- GA+Block -32.03 40.04 -0.80 0.42Anesthesia- GA+Neuraxial 3.37 23.69 0.14 0.89Anesthesia- Neuraxial -50.32 17.63 -2.85 0.0046TKA (vs. THA) 76.94 16.60 4.64 <0.00001Length of postoperative stay (Days) 37.17 8.64 4.30 0.00002Fibromyalgia survey score 7.49 2.06 3.63 0.00033
Possible explanations:• Increased pain• Decreased responsiveness to opioids• Combination of both
Brummett CM, et al. Anesthesiology 2013;119(6)

The fibromyalgia survey score was also independently associated with increased opioid consumption after hysterectomy
Janda et al. Anesthesiology 2015; 122(5)

+
■ Substance P
■ Glutamate and EAA
■ Serotonin (5HT2a, 3a)
■ Nerve growth factor
■ Descending anti-nociceptive pathways
■ Norepinephrine-serotonin (5HT1a,b), dopamine
■ Opioids
■ GABA
■ Cannabanoids
Facilitation Inhibition
Many neurotransmitters influence CNS pain processing
and other co-morbid symptoms
From Dr. Daniel Clauw- With permission

Binding Potential (BP)
Occupancy and number of µ-opioid receptors influences BP
endogenous opioidscarfentanil
µ-opioid receptor
BP
Increased Release of Endogenous Opioids
Zubieta et al. Science 2001
BP
From Richard Harris, PhD- With permission

Fibromyalgia Patients Have Reduced MOR BP
*corrected Harris et al. JNeurosci 2007

Possible Explanations
endogenous opioidscarfentanil
µ-opioid receptor
Increased Release of Endogenous Opioids
Increased Pain
Increased PainI. Fewer ReceptorsII.
BP
BP
Baraniuk et al. BMC Musc Dis 2004From Richard Harris, PhD- With permission

Our new study will assess preop functional connectivity (fMRI), mu-opioid binding availability (PET) and CSF endogenous opioids prior to TKA
to assess centralized pain mechanisms
fMRI PETCSF
NIDA/NIH: R01 DA038261

Hypothesis #2: Higher fibromyalgia survey scores would independently predict less change in pain and lower patient global impression of change 6 months after TKA and THA.

Covariates Included in Modeling 6-Month Outcomes
Demographics• Age• Sex• Ethnicity• Race
Pain Phenotype• Fibromyalgia score• Overall body pain• Surgical site pain• Neuropathic pain
score• Depression• Anxiety• Catastrophizing• WOMAC pain,
stiffness, functionBrummett CM et al. Unpublished data
PMH• Preop opioids• BMI• ASA status
Clinical Care• Surgery (Knee
vs Hip)• Primary
anesthetic

The fibromyalgia survey score independently predicted poorer long term knee/hip pain
outcomes (WOMAC)
Variable Estimate SE P
(Intercept) −1.46 0.46 0.0015
Fibromyalgia survey score −0.25 0.044 <0.00001
Baseline WOMAC pain 0.92 0.042 <0.00001
THA (vs. TKA) 1.96 0.27 <0.00001
Brummett et al. Arthritis & Rheumatology, 67: 1386–1394. 2015

FM also predictive of less change in overall body pain
Brummett et al. Arthritis & Rheumatology 2015, 67

Patient A Patient B Patient C

80mg more OME during first 48
be an adjusted 5 times less likely to


Can we differentiate different forms of centralized pain?
“Top Down”Functional Somatic
Syndromes
“Bottom Up”Central Sensitization

Brummett CM et al. Pain 2016, 157(6)
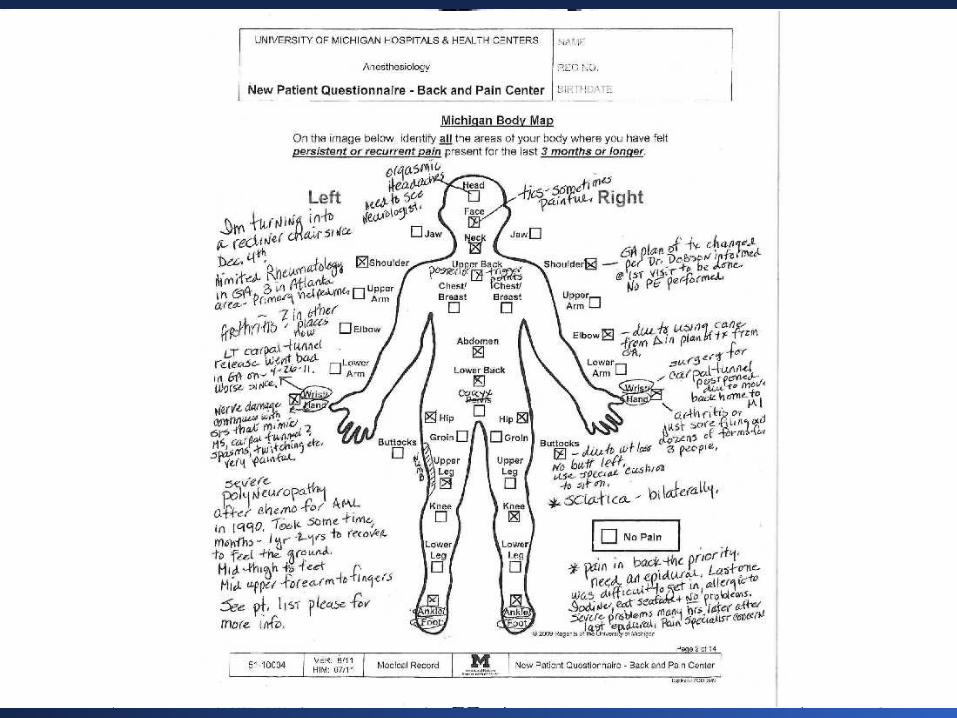
Validation of a body map to assess widespread pain

Electronic Version of the Michigan Body Map (MBM)
Assessing pain severity together with widespread pain

GWAS of 2011 Fibromyalgia Survey Score does not reveal any significant associations
Brummett CM et al., unpublished dataData from the Michigan Genomics Initiative, www.michigangenomics.org
n = 26,749

Heritability of the fibromyalgia survey score much higher in younger patients (<50)
Age Category
FM-Heritability(
%)
SE(%)
SampleSize
FM-Heritability(%)
SE(%) Sample Size
FM-Heritability (%)
SE (%) Sample Size
<=30 24.1 22.4 277322.9 13.3 5693
23.5 7.9 1020130 to 40 19.8 20.1 2920
40 to 50 13.4 15.1 450813.0 8.0 10091
50 to 60 9.1 11.3 6486
8.6 5.3 1580460 to 70 7.5 11.5 62477.3 8.1 9318
70 to 80 4.5 18.1 3071
Brummett CM et al., unpublished dataData from the Michigan Genomics Initiative, www.michigangenomics.org

Need to broaden our phenotyping and sensory testing
49
Childhood traumaNon-Noxious Stimuli

Possible candidate for TKA
Proceed with intervention
Obtain additional information or consider other therapies
High fibromyalgiascore
Low fibromyalgiascore

■ Pharmacological therapies to improve
symptoms
■ Increased Distress■ Decreased activity■ Isolation■ Poor sleep■ Maladaptive illness behaviors
■ Nociceptive processes (damage or inflammation of tissues)
■ Disordered sensory processing
Clauw and Crofford. Best Pract Res Clin Rheumatol. 2003;17
Symptoms of Pain, Fatigue, etc.
Functional Consequences of Symptoms
Dually FocusedTreatment
■ Nonpharmacological therapies to address dysfunction

80mg more OME during first 48
be an adjusted 5 times less likely to

Phenotype-Medical history-Medications-Questionnaires

Thanks to Team Pain!
54

Thank You and “Go Blue”
55