Embed Size (px)
Citation preview

The Impact of Centralization, Corruption and
Institutional Quality on Procurement Prices: An
Application to Pharmaceutical Purchasing in Italy
Simona Baldi
Davide Vannoni
No. 379
December 2014
www.carloalberto.org/research/working-papers
© 2014 by Simona Baldi and Davide Vannoni. Any opinions expressed here are those of the authorsand not those of the Collegio Carlo Alberto.
ISSN 2279-9362

1
The Impact of Centralization, Corruption and Instit utional Quality on Procurement Prices:
An Application to Pharmaceutical Purchasing in Italy
Simona Baldia
(ART- Transport Regulation Authority)
Davide Vannonib
(University of Torino and Collegio Carlo Alberto)
Abstract
This paper deals with the open issue about the choice between a centralized versus a decentralized public procurement strategy. Using a unique dataset on tender prices of selected drugs for hospital usage awarded by a sample of 52 Italian local health service providers (ASLs) between 2009 and 2012, we test which procurement system (centralized, decentralized or hybrid) performs better. Controlling for several covariates, we always find that centralized and hybrid procurers pay lower prices as compared to decentralized units. Moreover, our results show that in areas in which corruption is higher or, more generally, institutional quality is lower, the effect of centralization in negotiating lower prices is much stronger, with savings that can reach also 50 percent of the price paid by ASLs that procure on their own.
Keywords: public procurement, centralization, decentralization, pharmaceutical spending.
JEL codes: H57, H83, L33
a The opinions expressed are those of the author and do not commit the Transport Regulation Authority (ART) or the Italian Authority for the Supervision of Public Contracts (AVCP), where part of this work was conducted. Special thanks go to Filippo Romano and Alberto Zaino from AVPC for making the drugs data available and to Mariangela Focacci from Farmaindustria for data on DSO.
b Corresponding Author: Department of Economics, Mathematics and Statistics, Corso Unione Sovietica 218 bis, 10134 Torino, Italy. Phone: +39-011-6706083. [email protected]

2
1. Introduction
The Organization for Economic Co-operation and Development defines public procurement “as
the purchasing, hiring or obtaining by any other contractual means of goods, construction works
and services by the public sector” (OECD, 2000). Public procurement represents a considerable
part of national GDP: a recent study reports that it accounts for 12.8% of GDP (and 29% of total
general government expenditure) on average across OECD countries, ranging from 12% in Greece
to 45% in the Netherlands (OECD, 2013).
Moreover, since it involves the use of public funds, the procurement activity has become a
crucial policy issue in the recent period of financial crisis. In fact, due to current lack of economic
resources, there is a consistent pressure on the public agenda of many governments to reform the
public procurement sector, in order to have a more efficient and more effective system, so as to
save public funds. One way to achieve this goal is to implement the most suitable procurement
organizational structure. To that respect, an important strategy is the choice between a centralized
and a decentralized system. In the case of centralization, there is a central body who is in charge of
handling the purchasing activity (select contractors, negotiate prices and conditions, make
purchasing decision) for end-users (i.e. local units), who are just required to send their requests to
it. Conversely, in a decentralized system, local units procure on their own. Several countries are
experiencing reforms in this area (sometimes involving sudden changes in procurement practices),
in an attempt to find the most suitable system.
The economic literature is more and more interested in this topic. Some scholars describe the
features of the two systems and try to provide empirical evidence on their impact on several
dimensions of public procurement (costs, purchasing prices, corruption practices, collusion
practices, and so on). Some of them observe that, even if most governments have a centralized
structure for public purchases, there is a trend toward decentralization in an attempt to make local
units more responsible. Dimitri et al. (2006a) claim that there is a clear trend towards centralization
in Europe, United States and Southern America. It is difficult to assess which framework is
prevalent, at least because governments change frequently the system and sometimes the reforms
are conflicting. It is also demanding because of the peculiarities of each procurement system. Some
authors debate on these features and on the factors at work when one or the other system is adopted.
For example, a fully decentralized purchasing process, where procurement is managed at the local
level, is usually criticized on the ground that it can be associated with fragmentation, inefficiency
and poor transparency. On the other hand, a fully centralized system could suffer from a lack of

3
flexibility, which is required when goods and services to be procured are complex and involve,
other than cost considerations, quality and value aspects, too. As a result of this, assessing which
system is preferable is not an easy task: many economic variables act simultaneously on the
procurement system and could interact in contrasting ways.
This paper contributes to the above literature by testing which procurement system performs
better using data relative to tender prices of selected drugs for hospital usage awarded by a sample
of 52 Italian local public procurers between 2009 and 2012. Controlling for several covariates, we
always find that centralized and hybrid systems (i.e. consortia of local health service providers) pay
lower prices as compared to decentralized purchasing bodies. The average cost saving is greater
than 20% for centralized agencies and around 8% for hybrid procurers, but it increases up to 50% in
areas characterized by high levels of corruption or, more generally, by low levels of institutional
quality.
The remainder of the paper is organized as follows. In Section 2 we provide a critical overview
of the literature dealing with the centralization/decentralization choice, and we highlight the
relevant issues and trade-offs. Section 3 focuses on the Italian context, and describes the activities
of the central agency and of the regional purchasing bodies. Section 4 deals with public
procurement in the Italian pharmaceutical sector and describes our dataset on the procurement of
drugs for hospital usage. Section 5 presents our empirical strategy and shows our main findings on
the performances, in terms of purchasing prices, of the three different procurement systems which
are used to buy pharmaceutical products. Section 6 concludes.
2. Centralization versus decentralization
While it was traditionally considered as an operational routine, nowadays the purchasing phase
has become a crucial activity for both the public and the private sector. Cousins and Spekman
(2003) assess that the manufacturing sector spends more than 65% in purchasing goods and
services. Therefore, private managers, public managers and policy makers have put more and more
attention on this practice. During the 90’s, many big companies went through important
reorganizations of their activities, including purchasing, and adopted different combinations of
centralized and decentralized procurement. Some of them, as Motorola, General Electric, United
Technologies and Fiat, decentralized this function, while some others, such as Honda and General
Motors, centralized it. These experiences in the private sector have stimulated further research

4
aimed at finding which process appears to be the most suitable, especially in relation to different
contexts, costs and products. Munson (2007) makes a comparative analysis of seven cost categories
and proposes the most suitable allocation of different products among three different centralized
purchasing schemes: centralized purchasing, decentralized purchasing and centralized pricing with
decentralized purchasing. Numerical experimentation suggests that often the best scenario is a
combination of the three systems. Some scholars examine the purchasing cooperation between
independent firms. For example, according to Tella and Virolainen (2005): “consortium purchasing
is horizontal cooperation between independent organizations that pool their purchases in order to
achieve various benefits”. Using data on Finnish machine manufacturing industry, they find that the
main motivations for the establishment of purchasing consortia are to save on costs and to collect
information on supply markets. It is straightforward to notice that advantages deriving from
belonging to a consortium could be very close to the advantages of using a centralized structure.
The above studies focusing on the private sector are important because they provide useful
frameworks and benchmarks to be applied to the public sector, too. However, it is necessary to take
into account that the two systems differ at least in terms of performance measures and organization
goals, and they differently react to the lack of resources (Reed et al., 2005). For example, the private
sector reacts by increasing competition and shake-out, while the public sector reacts by raising
inter-organizational cooperation through centralization in order to lower duplications or through
purchasing by consortia.1
Johnson et al. (2003), using survey data from 267 governmental purchasing groups in cities and
counties in the United States, find that 51% of the respondents deal with centralized procurement,
47% with hybrid models, while only 2% manage decentralized purchases. On the other hand, in the
private sector, 27% of the respondents have a centralized procurement activity, 51% use a hybrid
organization and 22% have a decentralized structure dedicated for buying. The two sectors have
only one feature in common: about half of the respondents use a hybrid model, which can be a
fruitful way to merge the advantages of centralized and decentralized systems.
Since there are different definitions and different degrees of centralization/decentralization
(Karjalainen, 2011), we choose to adopt the one suggested by Dimitri et al. (2006b, page 48):
1 Johnson et al. (2003) identify other motivations than the lack of resources behind the creation of consortia in public
sector, namely “opportunities to reduce staff, product and service standardization, improved supplier management capabilities, specialization of staff, customer service, higher profile of consortium members, expanded role of purchasing, and transition of products through volume categories”. They also describe some negative implications of aggregating purchases, which are classified in the following categories: complexity, uncertainty, coordination costs, free riding governance, declining cost savings, standardization and compliance.

5
“procurement is fully centralized when all the relevant decisions (what, how and when) to purchase
products, whether by competitive tendering procedures or by negotiations, are in the hands of a
company headquarters or a central public unit dedicated to buying products to satisfy the needs of
the company or public offices. Furthermore, the contract conditions for the products acquired are
the same throughout a firm’s local branches or local public administrations.” On the other hand,
“procurement is decentralized when divisions or local administrations are delegated the power to
decide how, what and when to procure”. “In between full centralization and full delegation there is
a wide range of intermediate procurement models where central and local purchasing share the
power on purchasing decisions”, that are classified as hybrid procurement systems.
As discussed above, some scholars list the advantages and disadvantages of the two opposite
systems (Thai, 2009; Tella and Virolainen, 2005; Albano and Sparro, 2010). Briefly, the main
arguments in favor of centralization are: savings due to bundling quantities, to minimization of
duplications, to the reduction of the number of transactions between suppliers and buyers, the
improvement of bargaining power, the enforcement of the negotiation position, the possibility to
hire more experienced and skilled managers, to reach higher product and service quality, to reduce
supply risks and legal costs for litigations, to have better access to resources and markets. On the
contrary, the literature stresses the following disadvantages of recurring to a central agency: higher
coordination costs and set-up costs, impossibility to satisfy unique requirements and meet different
realities, loss of relationship with local suppliers, possible withdrawn of small suppliers, potential
lock-in phenomena, inefficient engagement of central unit in operational planning process, complex
coordination process, possibly unsatisfactory schedule for single unit needs, higher costs of
maintenance of the central agency. Hereafter, we will discuss in more detail the advantages and
disadvantages which are mostly relevant for our analysis.
2.1. Scale economies, process economies and information and learning economies
The main motivation to organize procurement in a centralized or decentralized way is the
possibility to gain considerable cost reductions. One way to achieve this target is to bundle
purchasing volumes with one single central buyer in order to obtain quantity discounts. It is
straightforward that economies of scale can be easily reached if products are highly standardized.
Indeed, on the supply side, standardized products allow firms to lower unit costs and, on demand
side, they permit to pool the requests, to raise the volumes, and to use such leverage to negotiate
lower prices. Therefore, the success of the centralization strategy is inherently linked to the product

6
characteristics: the more similar products are, the easier aggregation is. It is the case, for example,
for IT equipments, paper, stationery, fuel, coupon for meals, credit cards, electric power.
Conversely, when products are peculiar and\or single units have specific needs, it is difficult to use
a centralized framework. In all possible intermediate cases, centralization might lead to costs
savings but it also faces several disadvantages. Synchronization of centralized purchasing may be
an issue because the timing schedule of central purchase cannot correspond to the timing schedule
of the single units. Some local units may need to change their requests in order to make them
compatible with central agency’s requirements. In this case, the staffs of the local units may be
forced to spend time and resources in order to be able to use the product acquired by the central
agency on their behalf.
Economies of process relate to benefits derived from establishing a common way of working and
exchanging best-practice purchasing procedures. In this sense, centralization allows to lower
administrative costs such as tender advertisements in official journals and litigation costs. In
particular, centralization may reduce litigation costs for, at least, three reasons: first, the number of
tenders is lower (i.e. the number of possible critical cases reduces as well); second, by using
standardized procedures, the probability of making mistakes (such as wrong or incomplete
information processing) is lower as it is lower the room available for discretionary valuation or for
petition from the side of bidders; third, in case of controversies, litigations are concentrated just in
one Court instead of being scattered across several local Courts. Organization expenses can be
reduced by using a centralized purchasing unit because the staff employed in a local unit can be
released from the purchase activity and shifted to other local core tasks. This applies also for all
items required for purchasing, such as software, stationary, documents and, last but not least, for the
time spent for preparing all tender procedures and for the day-to-day management of the contract.
Finally, since tender procedures managed by the central unit are quite standard, time spent to
prepare a single process should be lower as compared to that spent in a decentralized organization.
The same applies for the probability to make material errors. Centralized procedures should be
standardized also because they have to be used by all different local agencies (as it is the case of
software to gather requests). However, these procedures could be tight or burdensome for the local
staff. Similarly to the achievement of economies of scale, economies of process are hard to be
achieved in case of not standardized requests. The central unit cannot gain benefits if there is high
heterogeneity of products\requests. In such circumstances, it might not even handle to manage the
purchase at all.

7
Economies of information and learning relate to sharing information and knowledge across
different sites and locations. Dimitri et al. (2006a) argue that centralization allows to exploit
economies of information because a central agency can concentrate specialists in different relevant
areas (e.g. legal experts and market analysts). High-skill personnel means savings in terms of time
spent in preparing documents and in designing the procedures. Workers in a centralized department
can work together, share information and end up with best practices easier as compared to
situations in which they are scattered across different units. Moreover, central agencies are better
equipped to hire legal experts and high-skill personnel, while it is difficult for local units to have
enough budget, since purchasing is not considered as a core business activity, but rather a back-up
activity. As in the other two previous cases, economies of information cannot be reached in the
presence of peculiar products or very specific unit needs. In these cases, decentralization works
better than centralization. In fact, a local unit can better formalize the peculiar requests, while the
time and the resources spent in processing information to send to the central unity could be too big
(or it could be too difficult for the central agency to process those data).
From our discussion of possible synergies, it appears evident that estimations of savings due to
centralization are not easy to find in the literature. Besides, it is often the case that information
about prices before bundling the requests is not available (this happens, for instance, when the
products purchased are not strictly comparable). Karjalainen (2011), focusing on Finnish
government data, estimates the potential price savings by comparing the prices paid by the
centralized agency to the market prices for two selected products. She finds savings of around 8%
for toner cartridges and of around 37% for specific flights tickets (with very flexible contracts and
cancellation terms). She also attempts to compute economies of process using time spent on the
tendering both for the decentralized model and the centralized model and estimating the relative
costs. Bandiera et al. (2009) provide an important comparison between centralized and
decentralized procurement, finding that a central agency can produce considerable cost savings.
Using Italian data on a set of 21 standardized items (such as paper, printers, gasoline, laptops, lunch
vouchers), they estimate that public bodies that buy through CONSIP, the national procurement
agency, save on average 28% of the purchase price. They also assert that a central agency reduces
litigation and administrative costs, even if they are not able to precisely quantify them.

8
2.2. Corruption and favoritism
Many papers deal with favoritism and corruption. According to Lengwiler and Wolfstetter
(2006, page 2) “corruption means that the person who runs the auction, the auctioneer, twists the
auction rules in favor of some bidder(s) in exchange for bribes”. The authors review different kinds
of corruption that have been observed in procurement auctions and discuss some tools which could
be useful to fight corruption (i.e., the choice of the auction format, or the use of secure electronic
bidding systems). Burguet and Che (2004) investigate how corruption affects the allocation of the
contracts and its distributional implications. They also investigate the selection rules to prevent its
adverse effect considering an endogenous assignment of favors through corruptive competition.
The centralization/decentralization choice clearly affects the extent to which corruption and
favoritism are plaguing the procurement process. One could argue that, moving the procurement
process away from local administrators, would make it less sensitive to pressures from local firms
to obtain rents. The larger the size of the tender, the higher transparency is, and centralization
makes a given amount of procurement more visible, leaving less opportunity for corruption. As to
favoritism, if on the one hand local units have more information about local suppliers, which can be
seen as a positive factor, on the other hand such a proximity could favor the chances for local
bidding activity. To that respect, Vagstad (2000) shows how a decentralized organization could be
better considering quality because of the importance of local information. However, she also points
out that a local unit may favor local firms over foreign ones, which could cause inefficiencies.
Dimitri et al. (2006b) provide a numerical example of how favoritism can negatively impact price
and quality.
The above cited paper by Bandiera et al. (2009), beyond presenting evidence in support of a
centralized system, is important because it introduces the distinction between active and passive
waste, where the former could be represented by corruption in procurement while the latter relates
to inefficiency, i.e. to waste that does not procure a benefit for the buyer (for example the inability
to lower costs because of low skilled employees). Comparing purchasing prices obtained by local
units to the ones obtained by the central agency, they find robust evidence that the second type of
waste counts much more (83% of total waste) than the waste due to corruptive practices. However,
as argued by Piga (2011), inefficiency, incompetence and corruption feed on each other and
sometimes the distinction between these concepts is artificial.
Even if a decentralized procurement can be more subject to bribes and corruption, it is not fair
to assess that centralized organizations are corruption free. However, a centralized system could

9
help in limiting favoritism for at least two reasons. First, the central body is used to deal with large
amounts of money. Usually, the higher is the value of the purchase, the higher is the publicity
required for the advertisement: this is the case for EU countries, where the Directive 2004/17 and
2004/18 set thresholds above which it is required to advertise at national level or at European level.
Secondly, especially due to standardized purchasing items and procedures, a central agency is more
able to use open procedures which may reduce discretion from actors involved in the process.
In the empirical analysis presented in section 5, we will test the effects of both centralization and
corruption on purchasing prices. In particular, we will include as explanatory variables some
measures of corruption and, more in general, of institutional quality which are prevailing in the area
in which the public procurer operates. In fact, several authors have argued that differences in
institutional quality (i.e. social capital, rule of law, regulatory quality, etc.) across different regions
of a country affect a wide range of economic outcomes, including the performance of the public
sector (Nifo and Vecchione, 2013).
3. The Italian context
3.1 The national purchasing body: CONSIP
Italy has its central agency, named CONSIP, which is a private company completely held by the
Ministry of Economy and Finance and whose operations are financed by a government budget
through a three-year framework agreement, which is partly incentivized. CONSIP was founded in
1997, initially to manage the information technology change in the former Ministry of Treasury.
Subsequently, two years later, CONSIP was designed as the structure designed to buy goods and
services for the Public Administration in order to rationalize the public expenditure through
standardized purchase orders. In 2001 and 20022 the role of CONSIP was reinforced, as it became
mandatory for all central administrations to use the framework contracts subscribed by CONSIP,
while it remained as an option for other public administrations. Nevertheless, since 2002, if a local
administration decides to follow its own procedure for purchasing a specific good, even in the case
of the existence of a framework for that good already signed by CONSIP, it is compulsory to use
the prices negotiated by CONSIP as a starting point for its procurements. In 2003, laws3 weakened
CONSIP’s role by limiting its purchasing area and the compulsory requirement for the central
administration. However, just one year later, its functions were again extended. In fact, starting
2 Laws n. 388, December 23rd, 2000, and n. 448, December 28th, 2001. 3 Decree n. 143, June 24th, 2003, Law n. 326, November 24th, 2003, and Law n. 350, December 24th, 2003.

10
from 2003, new rules4 modified the compulsory requirements for public administrations as well as
the range of CONSIP’s functions: essentially, CONSIP’s agreements are mandatory for State
administrations, while all the other public entities are required to use CONSIP prices and quality
requirements as a benchmark for their own tenders.
The last main government intervention on centralized procurement is the “spending review”
decree (D.L. 95/2012, then turned into law n. 135 of August 7th, 2012), an urgent measure which
intended to rationalize public expenditure. To achieve this goal, the Italian Government places its
trust in centralized procurement and in information and communication technologies (ICTs) as
peculiar tools to diminish the costs for the procurement process. In fact, CONSIP’s own research
evaluates that, by aggregating demand from different public administrations, it is possible to save
15-20% of purchasing costs without reducing quality standards. The decree implements the use of
internet platforms and forces central administrations and municipalities to use them for purchases
valued less than the European threshold. It enlarges the number of entities that are obliged to use
CONSIP contract frameworks and imposes their use for products such as fuel, electricity,
telecommunication services. Moreover, the spending review decree introduces strong penalties for
public administrators who sign public contacts in violation of the obligation of recurring to the
centralized procurer. This violation implies a disciplinary offence and an administrative
responsibility for the signer, and entails the nullity for that contract.5
3.2 The Regional Purchasing Bodies
Italian Regions have the possibility to set up their own centralized purchasing bodies, which act
on behalf of regional or local authorities. In 2001, the Ministry of Economy was given the task of
improving the aggregation of local purchasing bodies as Provinces, Municipalities, ASLs (i.e.
Aziende Sanitarie Locali, that is local health authorities), and Universities, and different laws were
introduced or modified to implement the use of regional purchasing bodies.6 In particular, Law
266/2005 introduced the possibility for local units such as municipalities, provinces, consortia and
“comunità montane”, to group together and act as central purchasing bodies that sign framework
agreements for their group members. Law 296/2006 introduced the so called “sistema a rete”, a
4 Law July 30th, 2004, Law n. 266, December 23rd, 2005, Law n. 244, December 24th, 2007, Decree n. 112, June 25th, 2008, Law n. 191, December 23rd, 2009. 5 The spending review decree introduces also some specific rules for health procurers which will be described in section 4. 6 In Italy, a province is and administrative division of intermediate level between a municipality and a region, similar to a county. A province is composed of many municipalities, and usually several provinces form a region.

11
network which can be used by regional central bodies and CONSIP in order to capitalize the
different experiences, harmonize functions and tools, give evidence on best practices and
incentivize a national e-procurement system. This ambitious project encountered some problems in
its implementation, as observed by AVCP’s Census.7 The Authority monitored the activity of the
Central Purchasing Bodies (CPBs) for the period 2007-2008, finding that in 2008 they were
handling procedures for 9.7 billion euro (87% of which were in the health sector and concentrated
in Northern Italy). In any case, the Census noticed many differences among the central bodies
regarding the coverage in terms of users, the economic values and the functions involved. While
reinforcing the role of CONSIP, the spending review decree has also redefined the role of the
regional purchasing units. In fact, CPBs have to consider CONSIP’s frameworks for price and
quality benchmarks but they are free to contract without being subject to the limitation imposed by
the decree to all the other administrations. Furthermore, the limitations do not cover all the
contracts signed by a single administration if the contract belongs to a regional framework. Finally,
to facilitate demand aggregation, municipalities with less than 5000 inhabitants can opt between the
introduction of a central purchasing unit and the use of the e-platform available from CONSIP or
from their regional purchasing unit.
As will be explained in the next section, our dataset refers to pharmaceutical items which are
purchased directly by the local health authority (the ASL), by a consortium of ASLs, or by the
regional purchasing body. Therefore, our maximum level of centralization is not the national
agency, CONSIP, which is instead the object of analysis of the study by Bandiera et al. (2009).
4. The Italian public procurement of pharmaceuticals
The health sector represents a consistent part of GDP: the OECD average is 9.3%, ranging from
5.9% in Estonia to 17.7% in the United States, and the public component is higher than the private
one almost everywhere. On average, OECD governments cover 72.2% of the total health
expenditure, even if there are significant differences across countries8. From a public expenditure
perspective, the health sector is a challenge, given the current economic crisis and the consequent
pressure on national public debts.
7 AVCP is the Italian Authority for the Supervision of Public Contracts. 8 Chile, Mexico and the United States cover less than half of total expenditure, while in the Netherlands, in Denmark, in
Norway, in the Czech Republic and in the Luxembourg the public sector’s share is higher than 84%.

12
The public procurement for the health sector varies across countries and has been largely
studied in the academic literature. For example, Sorenson and Kanavos (2011) discuss the
procurement of selected medical devices in England, France, Germany, Spain and Italy,
highlighting that there has been a movement towards more centralized procurement with the
introduction of purchasing groups or consortiums. In a similar vein, Nollet and Beaulieu (2003)
analyze the benefits of establishing purchasing groups by interviewing 73 individuals working in
the health sector (as purchasers, suppliers, hospital CEOs, etc.) and coming from different countries
(United States, Canada, France and Belgium).
Some data for the Italian context are provided by Calabrese et al. (2010), Vellez (2011), and by
France et al. (2005). The Italian public health sector is clearly an interesting case, because both
centralized and decentralized systems coexist. As highlighted by Calabrese et al. (2010, p. 3): “Italy
– as many others European countries – has been experimenting with a new idea of public
purchasing that allows public administration to purchase goods using alternative methods and
practices in every stage of the purchasing process such as on-line purchasing, purchasing group,
purchasing consortia and centralized purchase systems”.
Briefly, the National Health System (NHS) is managed by both central and regional
governments. While the central government is responsible for the general organization of the NHS
and for the essential levels of care to be granted to all citizens, the Italian regions have the exclusive
responsibility for the organization and administration of regional budget allocation and control. At
the lowest level, the local health authorities (ASLs, i.e. Aziende Sanitarie Locali) are in charge of
coordinating and providing primary medical services (primary care, ambulatory specialist medicine,
residential care) and secondary care (for acute and rehabilitation patients) for each regional area,
through a network of hospitals and health care centers. While some single ASLs carry out public
procurement on their own (i.e. following a decentralized system), some regions have introduced a
centralized system, where procurement has been delegated to a central body (Centrale di Acquisto
Regionale or Centrale di Committenza Regionale). In general, if a central unit is constituted, the
ASLs located in the regional area have to procure through it.9 Finally, ASLs could also group
together and designate one who is in charge of buying for the whole group. The latter procurement
strategy could be considered as a hybrid model. In principle, hybrid systems could match the
advantages of the other two systems: by exploiting the benefits of demand aggregation, ASLs that
9 ASLs can procure otherwise (on their own or grouping with other ASLs) if the good they need is not in the list of the
goods acquired by the regional agency.

13
group purchases can bring cost savings (as in a centralized system), while at the same time they can
have a better knowledge of the needs of procurers and of the reference market (as in a decentralized
system). In fact, in our sample, a hybrid model is just a “larger” ASL, endowed with all specific
expertise of employees in the health structure. Moreover, while a centralized system implies extra
management costs (for example, the structural costs of the new body appointed to pull the
decentralized needs), the hybrid system requires only networking costs. On the other hand, in areas
plagued by corruption or endowed with low levels of institutional quality, a centralized system may
be better equipped to pursue efficiency goals, since a central structure can be more sheltered from
the conditions of operating in a weak institutional environment.
4.1. Data
As detailed above, the Italian health procurement system presents three types of procurement
organizations: a centralized system (Centrali di Committenza Regionale), a decentralized model
(single ASL), and a hybrid (group of ASLs) system. We investigate which type of procurement
organization performs better using a unique dataset on drugs for hospital usage purchased by single
ASLs, groups of ASLs and central (i.e. regional) units between 2009 and 2012. These data were
collected from AVCP in April 2012 in order to compute the “reference prices”10 for goods acquired
by public health purchasers. This special commitment was assigned to AVCP by the “spending
review” Decree. The object of this decree, that has partially reformed the health sector
procurement, was to rationalize the public health expenditure through the introduction of
benchmark prices. Namely, if the price paid by a public health contractor for item A exceeds 20%
of the reference price computed by AVCP, then the public procurer has to renegotiate with A’s
seller that price in order to bring it back to the required threshold (i.e., reference price for item A
plus 20%)11 or, even better, below it.
AVCP, in collaboration with AGENAS12, has firstly collected data on prices paid by public
administrations for five health products which have been selected for their impact on the national
health expenditure: drugs for hospital usage, medical devices, food service, cleaning service and
10 For more details on the reference prices see AVCP’s “Annual Relation 2012” at: http://www.avcp.it/portal/rest/jcr/repository/collaboration/Digital%20Assets/pdf/Relazione_2012.pdf (AVCP, 2013). 11 To be more precise, the Spending Review Decree has just introduced the reference prices, while the Spending Review Decree 2 (Decree 95/2012) modified the former by making them “mandatory”. 12 AGENAS is the National Agency for Regional Health Services, and provides technical and operational support for government health policies shared between the central government and the regions.

14
laundry service.13 Regardless of the motivation behind the introduction of the reference prices and
their effective application14, this data collection represents an opportunity to study how prices vary
across the different regions of the country. Most importantly, for the topic of this paper, it is a
unique occasion to investigate if and how prices differ among the three procurement organizational
structures of interest.
Thanks to AVCP, we have been given the possibility to analyze drugs’ prices. Previously,
Vellez (2011) analyzed data on Italian healthcare service providers in order to assess which
procurement procedures (negotiations or auctions) are leading to lower prices. She used data on a
broad set of healthcare products including pharmaceutical drugs but also medical and treatment
devices which are extremely heterogeneous (for example, in terms of quality, there are differences
in duration, installation and assistance requirements, depreciation rate); these data were collected by
the Observatory of Prices and Technology over a rather long period of time (1994-2003) and were
relative to 937 procurement contracts for medical technology products signed by 37 local health
units (ASLs and AOs)15. The main result coming from the estimations was that auctions were not
yielding lower prices as compared to negotiations.
Differently from Vellez (2011), our dataset is limited to drugs’ prices. However, the data appear
to be particularly interesting for at least three reasons. First, drugs’ expenditure is a considerable
part of the entire health spending. In particular, in 2010, the Italian pharmaceutical expenditure
counted for the 1.24% of GDP, and the public sector financed about 75% of the total drugs’
purchase. Second, AVCP data are relative to a short period of time (2009-2012); this is an
important aspect, since prices could strongly vary across time, especially for drugs which are
covered by patents16. Third, AVCP gathered data regarding the procurement of the active principles
in pharmaceutical products, rather than the final specific drug; this allows to compare highly
standardized items. This means that we can observe and examine procurers’ performance relating to
almost identical items. We believe that these last two points constitute the major strengths of our
analysis.
13 Later on, two categories have been added to the list: cloakroom service and stationary. 14 AVCP faced the resistance of some pharmaceutical companies who have undertaken legal actions in order to block the publication of these prices. 15 Their sample includes two types of hospitals: those directly managed by the local health unit (ASLs), and other major hospitals that have been hived off from the local health unit and transformed into independent enterprises called “Aziende Ospedaliere” (AOs). 16 We have controlled our data for this issue. For all items, there is no significant correlation between price and time.

15
In 2012, AVCP interviewed 52 procurement agencies. The latter have been selected mainly
taking into consideration the coverage index (i.e. the ratio between the number of drugs advertised
in tenders by a specific agency and the total amount of drugs tendered in the region in which it is
located). Data on drugs refer to 43 selected active principles (classified according to the Anatomical
Therapeutic Chemical or ATC system). They are characterized by a specific dosage and a specific
shape. This implies that for each ATC principle there could be several items (i.e. ATC x DOSAGE
x SHAPE). In our data, 43 ATCs turn into 141 items. In the interviews, the 52 agencies have been
asked to report the last paid price and purchased quantity of these 141 items. We restrict the dataset
by dropping items with less than 10 observations and, keeping in mind the aim of our analysis, by
dropping items that are bought using a procurement model which cannot be classified in one of our
three categories (i.e., centralized, decentralized, or hybrid)17. Our final dataset contains 52
procurers, 116 items and 2343 observations.
5. Empirical strategy and results
The above data represent a unique opportunity to study the performance, in terms of paid price, of
different procurement systems. Indeed, we know if the procurer has purchased for itself
(decentralized system), for other selected units (hybrid system), or for all the units located in the
regional territory (centralized system). Table 1 shows that the decentralized system has been
preferred by 34 procurers (who bought on aggregate 920 items), while the other ASLs have chosen
to aggregate purchases so as to form 10 centralized bodies (who bought 670 items) and 8 hybrid
units (who bought 753 items). Table 2 presents the descriptive statistics of the variables included in
the analysis.
In order to understand if there is any significant difference in paid prices among the three
structures we estimate the following BASELINE econometric models (which include also drugs,
years as well as geographical areas dummies):
Ln PRICEijrt = α + β1 CENTRijt + β2 HYBRIDijt (1)
Ln PRICEijrt = α + β1 CENTRijt + β2 HYBRIDijt + β3 INSTQUALr (2)
Ln PRICEijrt = α + β1 CENTRijt + β2 HYBRIDijt + β4 CORRUPTr (3)
17 This happens just for two items.

16
where the index i indicates the procurer, j the item procured, r the area (province or region), and
t the year. CENTR is a dummy that identifies centralized procurers, HYBRID is a dummy for hybrid
procurer, while the reference category is the decentralized agency. INSTQUAL is an index which
summarizes the institutional quality in the province (or in the region, in the case of centralization)
in which the procurer is located. This index, which has been introduced by Nifo and Vecchione
(2013), summarizes five different dimensions of quality such as: voice and accountability (citizens’
participation to public elections, number of associations and social cooperatives), government
effectiveness (endowment of social and economic structures and quality of public polices in areas
such as health, waste management, environment protection), regulatory quality (the ability of local
administrators to promote and protect business activity), rule of law (crime levels, shadow
economy, magistrate productivity, trial times), corruption (crimes against the public
administration).18
Table 3 presents the results of the estimates of the BASELINE models. Regional dummies
show that procurers set in the central and southern parts of Italy perform worse than procurers
operating in the north-west, and year dummies indicate a declining trend in paid prices across time.
In column (1) only the CENTR and HYBRID dummies are included as regressors, while in
columns (2) and (4) we add INSTQUAL and CORRUPT. Our variables of interest are always
significant across all specifications. The coefficients indicate that centralized and hybrid systems
perform better (in terms of awarded prices) compared to decentralized system. On average, the
centralized (hybrid) procurer pays about 22%-25% (7%-8%) less than the decentralized agency.
The presence of a high institutional quality (column 2) or of a low corruption level (column 4) in
the area in which the agency operates is associated with lower drugs prices, too. Column 3 (5)
evaluates the joint impact of centralization and institutional quality (corruption) on purchasing
prices by adding two interacting terms INSTQUALxCENTR and INSTQUALxHYBRID
(CORRUPTxCENTR and CORRUPTxHYBRID, respectively).19 The positive and significant
coefficients on the interacted variables clearly indicate that the benefits of both CENTR and
HYBRID are reduced in correspondence of high institutional quality levels (low corruption
18 See Nifo and Vecchione (2013) for a detailed description of the elementary indexes use to build up the INSTQUAL variable, which ranges between zero and one. 19 We run also regressions in which, instead of the composite index INSTQUAL, separate measures for voice and accountability, regulatory quality, rule of law and government effectiveness were introduced. Results confirm that each component of institutional quality has the effect of reducing pharmaceutical prices. Moreover, the interacted terms with the two centralization dummies confirm that both strategies are less effective in correspondence of high levels of institutional quality.

17
levels).20 To elaborate more on this, we report the impact using a centralized or a hybrid system for
different levels of institutional quality and corruption in figures 1 and 2. Figure 1 shows that, at
very low levels of institutional quality, centralized and hybrid systems have a similar impact, since
they both imply savings of around 40% with respect to a decentralized system. As far as the
institutional quality increases, the savings reduce, at a faster rate for a hybrid system. For a local
health unit located in a province endowed with very high institutional quality, the benefits of
regional centralization are about 10%, while recurring to a hybrid system would imply an increase
in drugs’ purchasing price. In a similar vein, Figure 2 shows that for very high corruption levels, the
two systems have a similar positive impact (a 50% price rebate), while for very low corruption
levels, only centralization is effective in reducing purchasing prices.21
Such figures seem quite reasonable, with price reductions similar to the ones found by Bandiera
et al. (2009) for goods and services procured through the Italian central agency, CONSIP. In a
recent paper, Kastanioti et al. (2013) found that the establishment in 2008 of the Health
Procurement Committee in Greece had the effect of unifying tenders, and prices reduced overall by
10%. Moreover, framework agreement tenders for selected medical devices (prostheses,
pacemakers, dialysis systems, lenses) and e-auctions for 32 active substances resulted in an
abatement of purchasing prices of the order of 30%-75% and 57%, respectively.
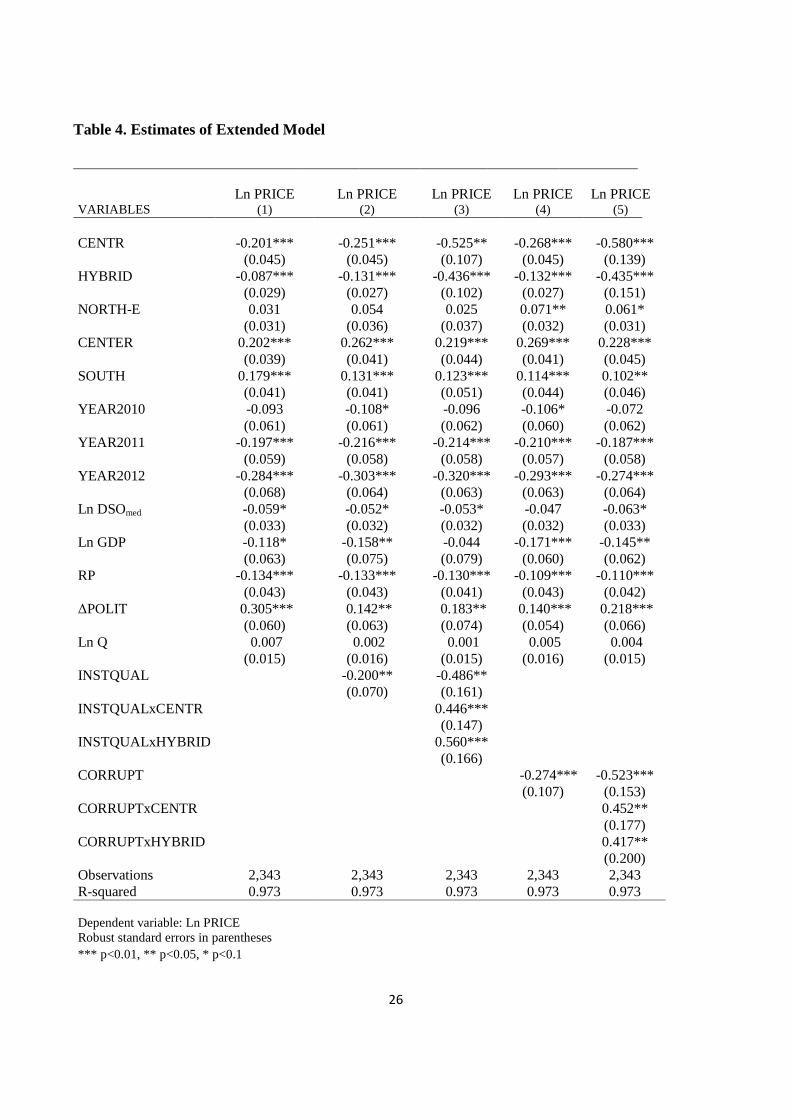
In order to check for the robustness of our results, we have enriched our specifications by
adding further control variables. Model (1) reads now as follows (and the same applies for models
(2) and (3)):
Ln PRICEijrt = α + β1 CENTRijt + β2 HYBRID ijt + β5 ln Qrt + β6 DSOit + β7 POLITrt
+β8 ln GDPrt + β9 RPrt (1’)
In particular, paid price could be correlated with quantity. The AVCP survey contains also
information about this dimension but, unfortunately, only few procurers have reported quantity
20
In order to be comparable to the other measures of institutional quality, the corruption index is constructed in such a way that a value of zero corresponds to maximum corruption, while one identifies minimum corruption. 21
The corruption measure computed by Nifo and Vecchione (2013) is a weighted average of three indices: the number of crimes committed against the public administration, the number of city councils dismissed over “mafia infiltration”, and the Golden and Picci (2004) index, which compares the value of public infrastructure with the costs borne by the government to build it. By running regressions in which we included only the Golden-Picci index or the index based on the number of crimes, as alternative measures of corruption (see Abrate et al. 2014, for more details), we obtained very similar results.

18
data. Some respondents22 refer that they have faced some difficulties in reporting this information
because sometimes they did not know it or because they just knew the required quantity reported on
the tender documents, which often did not match with the purchased quantity. Moreover, most of
them asserted that they could not observe any relationship between quantity and prices. Some of
them suggested that prices could be more correlated with the time of payment rather than with
quantity. For instance, if the procurer usually pays in due time, then the seller is more prone to offer
a lower price. For these reasons, instead of reported quantity, we use the number of residents of
reference area as a proxy of potential users of the hospital services (Q). Since it is hard to
disentangle the potential users of single health structures, we use population in the province in the
case of single ASLs23 and regional population in case of both group of ASLs24 and centralized
structures25. Following what respondents have noticed, we control for payment delays. For drug
payment delay we refer to DSO index (days sales outstanding) computed by Assofarmaco –
Confindustria. Then, we use DSOdrug that is the number of delay days (yearly average) for drugs
payments. Considering that the price offered by drugs sellers in auction in t could be more
correlated with payment delay in time t-1 rather than in t, we compute a second variable, that is
DSOdrugL1, i.e. the lagged DSOdrug. Unfortunately, Assofarmaco computes only payment delays at
the regional level. Since Dirindin et al. (2012) find significant interregional differences in terms of
payment delay, we use also a DSO measure for medical devices that is computed at single procurer
unit level (DSOmed). Unfortunately, we have DSO for medical devices only for 2013.
RP is a dummy for a region where a repayment plan applies. A repayment plan is a special
program for regions which exhibit a large deficit for health expenditure.26 Since the health budget is
mainly managed at regional level, we check if different government coalitions have different
attitude toward health expenditure. In particular, we include the following political regional
variables: POLIT, which is equal to 1 if there is a right-wing government coalition, and ∆POLIT,
which is a dummy equal to 1 if a majority change (from right to left or vice-versa) took place in the
previous twelve months. Finally, ln GDP is the provincial log natural per capita value added, and
22 After the submission of the questionnaire, the interviewed procurers were called back to confirm the outlier data. Actually, most of them were interviewed again. 23
This could be a good proxy considering that AVCP has selected the most important procurers for each region in terms of coverage index. This implies that the single ASL considered should be the most important at least at province level. 24 In the case of a group of ASLs, we are probably overestimating the potential users (since they are more than the number of residents in the province where that procurer unit is located, but lower than the residents in the region), but unfortunately we have no information on the number of ASLs which form each group. 25 This is not true for Tuscany, where there are three central agencies covering three large areas. In this case we use the sum of the number of inhabitants of the provinces covered by each agency.
26 The Italian regions most involved in the program are: Lazio, Abruzzo, Campania, Molise, Calabria.

19
takes into account the differences in income among Italian provinces. Indeed, richer areas may have
more financial resources available and higher level of expertise, which could turn into better
procurement activity and more convenient purchasing prices.
Table 3 reports our main results. All specifications contain drugs, years and areas dummies. The
estimates show that the previous results, as far as the impact of HYBRID, CENTR, INSTQUAL
and CORRUPT are concerned, are robust to the inclusion of new controls. In particular,
centralization implies a reduction of purchasing prices of 20%, while for the hybrid procurer there
is a discount of 9%. The estimates of columns (3) and (5) confirm that the benefits of centralization
reduce as far as corruption increases and the institutional quality reduces. Figure 3 and Figure 4
exhibit a similar pattern to Figures 1 and 2, with the only exception that the centralized system
seems to perform better than the hybrid one also for very low levels of institutional quality/very
high levels of corruption. Ln GDP is negative and significant suggesting that procurers set in richer
provinces perform better that the others. The dummy for repayment plans is negative and
significant, as expected. Conversely, the coefficient relative to our proxy for quantity (i.e. residents
in the area of interest for the procurer) is not significantly different from zero. Even if it could seem
a puzzling result, it is in line with the observations reported by some workers we interviewed.27
Contrary to the results of Vellez (2011), who found that payment delay was directly discouraging
participation and indirectly increasing prices, and to what some respondents were expecting, the
signs of the coefficient of days of outstanding payments index is negative (the longer is the delay,
the lower is the paid price).28 Finally, ∆POLIT exhibits a positive and significant coefficient,
suggesting that procurers settled in areas in which there has been a majority change in the previous
year are paying drugs at higher prices.29
5. Conclusion
Choosing between a centralized and a decentralized procurement policy is not an easy task.
Many factors have to be taken into account, and it is difficult to ascertain a priori which is the best
procurement system. This paper contributes to the literature by using as performance indicator the
27
In a similar vein, Vellez (2011) found for her sample of medical technologies that size was not associated to lower purchasing prices. 28
Results of regressions in which DSOdrugL1 or DSOdrug are alternatively tested are similar and available from authors upon request. 29
However, Table 1 highlights that a majority change occurred only for 4% of observations, so we cannot put too much emphasis to this somewhat puzzling result. POLIT does not seem to have a discernible impact in all specifications. Results are available upon request.
20
prices of selected drugs for hospital usage awarded by a sample of 52 Italian public procurers
(ASLs) between 2009 and 2012. We group the ASLs into three categories: decentralized, centralized
and hybrid procurers. This latter category refers to a model where some decentralized units group
together and designate one ASL who procures for the whole group.
Our regressions show that, controlling for several covariates, centralized and hybrid systems
always perform better with respect to decentralized systems. In particular, in our favorite
specification, the hybrid agency pays about 8% less and the centralized agency pays about 20% less
than decentralized procurer. The average cost savings inflate up to 40%-50% for areas which are
highly plagued by corruption or, more generally, which are characterized by low levels of
institutional quality.
Overall, our results show that regional centralization and, to a lesser extent, the establishment of
purchasing consortia among ASLs, could be effective ways to reduce the prices at which
pharmaceutical products, which are rather standardized items, are bought. Figures 2 and 4 show
that this is particularly true for regions in which there are high corruption levels. On the contrary,
according to our estimates, if corruption is very low, the benefits from recurring to a centralized
system reduce from 50%-60% to 12%-15%, while the advantages of using a hybrid system
disappear. From a policy standpoint, therefore, our findings are supportive of the view that
centralization, other than allowing the exploitation of scale economies, could be also a good
strategy to shelter ASLs from corruption practices.
References
Abrate G., Erbetta F., Fraquelli G., Vannoni D. (2014), The Costs of Corruption in the Italian Solid Waste Industry, Industrial and Corporate Change, DOI: doi:10.1093/icc/dtu014
Albano, G.L., Sparro, M. (2010), Flexible Strategies for Centralized Public Procurement, Review of Economics and Institutions, 1 (2), Article 4, 1-32.
AVCP - Italian Authority for the Supervision of Public Contracts (2013), Annual Report for 2012.
Bandiera, O., Prat, A. and Valletti, T. (2009), Active and Passive Waste in Government Spending: Evidence from a Policy Experiment, The American Economic Review, 99(4), 1278-1308. Burguet R., Che Y-K (2004), Competitive Procurement with Corruption, Rand Journal of Economics, 35, 1, 50-68.
Calabrese, C., Delbufalo, E., Fiorani, G., Frey, M., Meneguzzo, M. (2010), Centralization and Networking in Italian NHS, European Benchmarking and Performance Evaluation.

21
Cousins, P. and Spekman, R. (2003), Strategic Supply and the Management of Inter and Intra Organizational Relationships, Journal of Purchasing & Supply Management, 9, 19–29.
Dimitri N., Dini, F. and Piga, G. (2006a), When Procurement Should be Centralized?, in Dimitri N., Piga G. and Spagnolo G. (eds.), Handbook of Procurement, Cambridge University Press, Cambridge, N.Y.. Dimitri N., Piga, G. and Spagnolo, G. (eds.) (2006b), Handbook of Procurement, Cambridge University Press, Cambridge, New York. Dirindin, N., Piacenza, M., Sorrenti, G., and Turati, G. (2014), I Tempi di Pagamento della Pubblica Amministrazione. Il Caso della Sanità, Politiche Sanitarie, 15, 3, 115-132.
France, G., Taroni, F. and Donatini, A. (2005), The Italian Health-Care System, Health Economics, 14: S187-S202.
Golden, M.A., Picci, L., (2005), Proposal for a New Measure of Corruption, Illustrated with Italian Data, Economics and Politics 17 (1): 37-75.
Johnson, P., Leenders, M., McCue, C. (2003), A Comparison of Purchasing's Organizational Roles and Responsibilities in the Public and Private Sector, Journal of Public Procurement, 3 (1), 57–74.
Karjalainen K. (2011), Estimating the Cost Effects of Purchasing Centralization—Empirical Evidence from Framework Agreements in the Public Sector, Journal of Purchasing and Supply Management, 17, 2, 87-97.
Kastanioti, C., Kontodimopoulos N., Stasinopoulos D., Kapetaneas N., Polyzos N. (2013), Public Procurement of Health Technologies in Greece in an Era of Economic Crisis, Health Policy, 109, 7-13.
Lengwiler, Y., Wolfstetter, E. G. (2006), Corruption in Procurement Auctions, Discussion Paper SFB/TR 15, Humboldt University.
Munson, C.L., (2007), The Appeal of Partially Centralized Purchasing Policies, International Journal of Procurement Management, 1 (1/2), 117–143.
Nifo A., Vecchione G. (2014), Do Institutions Play a Role in Skilled Migration?, Regional Studies, 48:10, 1628-1649
Nollet, J., Beaulieu, M., (2003), The Development of Group Purchasing: An Empirical Study in the Health Care Sector, Journal of Purchasing and Supply Management, 9 (1), 3–10.
OECD (2000), Centralized and Decentralized Public Procurement, Sigma Papers, No. 29, OECD Publishing.
OECD (2013), Government at a Glance 2013: Procurement Data, OECD Publishing, DOI:10.1787/gov_glance-2013-en.
Piga G. (2011), A fighting chance against corruption in public procurement, in Rose-Ackerman S., Soreide T. (eds) International Handbook of the Economics of Corruption, Volume II, ch. 5, 141-175, Edward Elgar, Cheltenham, UK.

22
Reed, T.S., Bowman, D.E. and Knipper, M.E. (2005), The Challenge of Bringing Industry Best Practices to Public Procurement: Strategic Sourcing and Commodity Councils, in Thai, K.V., Araujo, A., Carter, R.Y., Callander, G., Rabkin, D., Grimm, R., Jensen, K.R.E., Lloyd, R.E., McCue, C.P. and Telgen J. (Eds.) Challenges in Public Procurement: An International Perspective, Boca Raton, Florida: PrAcademic Press.
Sorenson, C., Kanavos P. (2011), Medical Technology Procurement in Europe: A Cross-Country Comparison of Current Practice and Policy, Health Policy, 100, 43-50.
Tella, E., Virolainen, V., (2005), Motives behind purchasing consortia, International Journal of Production Economics, 93–94, 161–168.
Thai, K.V. (2009), International Public Procurement: Concepts and Practices, in Thai, K. V. International Handbook of Public Procurement, ch. 1, 1-24. CRC Press, Boca Raton, Florida.
Vagstad, S. (2000), Centralized vs. Decentralized Procurement: Does Dispersed Information Call for Decentralized Decision-Making?, International Journal of Industrial Organization, 18, 949–963.
Vellez, M. (2011), Auctions versus Negotiation: Evidence from Public Procurement in the Italian Healthcare Sector, CEIS Research Paper Series, 9, 4, No. 191, Rome.

23
Table 1. The Three Purchasing Systems
Number of procurers
Number of Items Acquired
Decentralized 34 920 Centralized 10 670 Hybrid 8 753 Total 52 2343
Table 2. Descriptive Statistics
Variable Description Mean St.dev. Min Max Nobs
Baseline Model
PRICE Price paid per item (euro) 131.263 284.029 0.003 1534.250 2343 Ln PRICE Log of price paid per item 2.492 2.724 -5.878 7.336 2343 DECENTR Decentralized procurer 0.398 0.490 0 1 2343 CENTR Centralized procurer 0.284 0.451 0 1 2343 HYBRID Hybrid procurer 0.318 0.466 0 1 2343 INSTQUAL Institutional Quality Index of province/regiona 0.634 0.214 0 1 2343 CORRUPT Corruption Index of province/regiona 0.766 0.161 0 1 2343 NORTH-W Dummy for North-West regions 0.278 0.448 0 1 2343 NORTH-E Dummy for North-East regions 0.123 0.329 0 1 2343 CENTER Dummy for Central regions 0.216 0.412 0 1 2343 SOUTH Dummy for Southern regions and Islands 0.382 0.486 0 1 2343 YEAR2009 Dummy for 2009 0.032 0.175 0 1 2343 YEAR2010 Dummy for 2010 0.256 0.437 0 1 2343 YEAR2011 Dummy for 2011 0.510 0.500 0 1 2343 YEAR2012 Dummy for 2012 0.202 0.402 0 1 2343
Ln DSOmed
Extended Model Log of Payment delay of procurer (n. of days): mean value 2013 5.264 0.577 4.402 7.262 2343
POLIT Right-wing regional coalition 0.394 0.489 0 1 2343 ∆POLIT Change of majority in the previous 12 months 0.043 0.203 0 1 2343 RP Dummy for regions involved in repayment plans 0.099 0.299 0 1 2343 GDP Per capita GDP of province/region (euro) 23845 6476.917 13122 43688 2343 Ln GDP Log of per capita GDP 10.043 0.272 9.482 10.685 2343 Ln Q Log of inhabitants in the province/region 14.488 1.085 11.749 16.088 2343
aSource: Nifo and Vecchione (2013)

24
Table 3. Estimates of Baseline Model
VARIABLES Ln PRICE
(1) Ln PRICE
(2) Ln PRICE
(3) Ln PRICE
(4) Ln PRICE
(5)
CENTR -0.230*** -0.217*** -0.402*** -0.250*** -0.506*** (0.030) (0.030) (0.079) (0.031) (0.121)
HYBRID -0.072*** -0.081*** -0.432*** -0.079*** -0.516*** (0.024) (0.024) (0.095) (0.024) (0.141)
NORTH-E 0.030 0.003 0.003 0.044 0.046 (0.031) (0.032) (0.033) (0.031) (0.030) CENTER 0.206*** 0.228*** 0.204*** 0.235*** 0.208*** (0.037) (0.038) (0.040) (0.039) (0.040) SOUTH 0.178*** 0.068 0.066 0.100*** 0.089**
(0.023) (0.041) (0.048) (0.033) (0.035) YEAR2010 -0.094 -0.137** -0.105* -0.113* -0.072
(0.059) (0.060) (0.061) (0.059) (0.060) YEAR2011 -0.213*** -0.246*** -0.235*** -0.218*** -0.192***
(0.058) (0.058) (0.058) (0.057) (0.057) YEAR2012 -0.334*** -0.358*** -0.355*** -0.328*** -0.306***
(0.063) (0.063) (0.063) (0.063) (0.063) INSTQUAL -0.312*** -0.566***
(0.095) (0.131) INSTQUALxCENTR 0.313***
(0.119) INSTQUALxHYBRID 0.617***
(0.153) CORRUPT -0.325*** -0.632***
(0.102) (0.153) CORRUPTxCENTR 0.348**
(0.153) CORRUPTxHYBRID 0.588***
(0.183) Observations 2,343 2,343 2,343 2,343 2,343 R-squared 0.973 0.973 0.973 0.973 0.973 Dependent variable: Ln PRICE Robust standard errors in parentheses
*** p<0.01, ** p<0.05, * p<0.1

25
Figure 1. Effect of Centralization and Institutional Quality on Pharmaceutical Prices
Figure 2. Effect of Centralization and Corruption on Pharmaceutical Prices
26
Table 4. Estimates of Extended Model
VARIABLES Ln PRICE
(1) Ln PRICE
(2) Ln PRICE
(3) Ln PRICE
(4) Ln PRICE
(5)
CENTR -0.201*** -0.251*** -0.525** -0.268*** -0.580*** (0.045) (0.045) (0.107) (0.045) (0.139)
HYBRID -0.087*** -0.131*** -0.436*** -0.132*** -0.435*** (0.029) (0.027) (0.102) (0.027) (0.151)
NORTH-E 0.031 0.054 0.025 0.071** 0.061* (0.031) (0.036) (0.037) (0.032) (0.031) CENTER 0.202*** 0.262*** 0.219*** 0.269*** 0.228*** (0.039) (0.041) (0.044) (0.041) (0.045) SOUTH 0.179*** 0.131*** 0.123*** 0.114*** 0.102**
(0.041) (0.041) (0.051) (0.044) (0.046) YEAR2010 -0.093 -0.108* -0.096 -0.106* -0.072
(0.061) (0.061) (0.062) (0.060) (0.062) YEAR2011 -0.197*** -0.216*** -0.214*** -0.210*** -0.187***
(0.059) (0.058) (0.058) (0.057) (0.058) YEAR2012 -0.284*** -0.303*** -0.320*** -0.293*** -0.274***
(0.068) (0.064) (0.063) (0.063) (0.064) Ln DSOmed -0.059* -0.052* -0.053* -0.047 -0.063*
(0.033) (0.032) (0.032) (0.032) (0.033) Ln GDP -0.118* -0.158** -0.044 -0.171*** -0.145**
(0.063) (0.075) (0.079) (0.060) (0.062) RP -0.134*** -0.133*** -0.130*** -0.109*** -0.110***
(0.043) (0.043) (0.041) (0.043) (0.042) ∆POLIT 0.305*** 0.142** 0.183** 0.140*** 0.218***
(0.060) (0.063) (0.074) (0.054) (0.066) Ln Q 0.007 0.002 0.001 0.005 0.004
(0.015) (0.016) (0.015) (0.016) (0.015) INSTQUAL -0.200** -0.486**
(0.070) (0.161) INSTQUALxCENTR 0.446***
(0.147) INSTQUALxHYBRID 0.560***
(0.166) CORRUPT -0.274*** -0.523***
(0.107) (0.153) CORRUPTxCENTR 0.452**
(0.177) CORRUPTxHYBRID 0.417**
(0.200) Observations 2,343 2,343 2,343 2,343 2,343 R-squared 0.973 0.973 0.973 0.973 0.973 Dependent variable: Ln PRICE Robust standard errors in parentheses
*** p<0.01, ** p<0.05, * p<0.1

27
Figure 3. Effect of Centralization and Institutional Quality – Extended Model
Figure 4. Effect of Centralization and Corruption – Extended Model