Embed Size (px)
Citation preview

The Impact of Broadband in Schools
Jean Underwood
Nottingham Trent University

The Project TeamsThe Project Teams
Alison Ault Nottingham Trent University
Phil Banyard Nottingham Trent University
Karen Bird Manchester Metropolitan University
Gayle Dillon Nottingham Trent University
Chris Durbin Staffordshire LEA Advisory
Derrick Golland Staffordshire LEA Advisory
Mary Hayes Nottingham Trent University
Ian Selwood Birmingham University Bridget Somekh Manchester Metropolitan University
Peter Twining The Open University
Jean Underwood Nottingham Trent University
Derek Woodrow Manchester Metropolitan University

Why Broadband Technology?Why Broadband Technology?
The belief in the significance of this technology for the economic health of the country is widely held across the developed world.
Hence, the Broadband Stakeholder Group’s (BSG, 2001) recommendations to government on the roll-out of the technology to schools were readily received and resulted in a policy to deliver broadband connectivity to all points of learning by 2006.

A Novel Situation: From Innovators to Majority in One Leap?
The process of embedding broadband connectivity is of particular interest because both society and the education system are learning to deal with this innovation in parallel.
Success hinges on meeting real needs
Success hinges on those ‘Wow’ moments (Crabtree & Roberts, 2003)

Potential Benefits of BroadbandPotential Benefits of Broadband
Enhancing the learning experience
Enhancing inter-institutional collaboration
Allowing new innovative learning to take place
Improving efficiencies in existing educational provision
Widening access(Broadband Stakeholder Group 2003)

Two ProjectsTwo Projects
2003-04 The Broadband Pilot Project
Best case scenarios
(5 months)
2004-05 The Impact of Broadband in Schools Broadband in typical schools.
(6 months)

Overview Study 1 Best Case Scenarios
The Schools 37 schools
o Primary, Middle, Secondaryo 8 English RBCs o Varied ICT resourceso 76% < 10 children per computero Broadband
2Mbps to 110Mbps

Data Collection ComponentsData Collection Components
School Background SurveyInterviews headteacher phone interview teacher facilitatorTeachers classroom observation portfolio of practice log sheetsMeasures of Performance benchmarking of institutions against themselves using
national metrics.

Overview Study 2: A Range of ‘Typical’ Schools
Three Strands of Research: Strand 1 was a baseline activity survey,
addressing the link between level of broadband activity and a range of nationally accessible performance data
Strand 2 was a baseline usage survey to identify inter-school and intra-school comparisons of broadband on indicators of school performance
Strand 3 was an in-depth field evaluation with a selection of schools from strands 1 and 2 using structured interviews, classroom observations and portfolios of work

Strand 1:Baseline Activity Survey
“(that it can) increase the quality of service through fast access to a range of digital learning materials”
Purpose: To investigate the link between broadband activity and a range of nationally accessible performance data.
Sample: All primary and secondary schools in 5 LEAs drawn from 4 RBCs covering rural and urban localities (excluding special schools).
Method: Quantitative analyses of national and regionally held data.
Levels of Connectivity
What is an adequate level of connectivity?
Adequate for whom and for what?
How important is the interplay between level of
connectivity and caching?
Are schools operating within the threshold of
comfort?

Table 2.1: Distribution of Sample Schools by RBC, LEA and Age Phase.
RBC LEA Primary Secondary
RBC 1 LEA 1 42 11
RBC 2 LEA 2 364 103
LEA 3 27 15RBC 3
LEA 4 83 54
RBC 4 LEA 5 76 18
TOTAL 592 201
Method: Quantitative analyses of national and regionally held data.

Figure 3.1: Level of Connectivity by RBC and Age Phase
0%
10%
20%
30%
40%
50%
60%
70%
80%
90%
100%
RBC 1 RBC 2 RBC 3 RBC 4 RBC 1 RBC 2 RBC 3 RBC 4
Primary Secondary
10 mbps +
>2 < 10 mbps
2mbps
< 2mbps

Figure 3.2: Mean Percentage Usage of Available Bandwidth by Age Phase
(355 schools across 4 LEAS)
0
20
40
60
80
100
120
1-20% 21-40% 41-60% 61-80% 81-100%
Percentage Usage
Nu
mb
er
of
Sch
ools
Primary
Secondary
Threshold of comfort
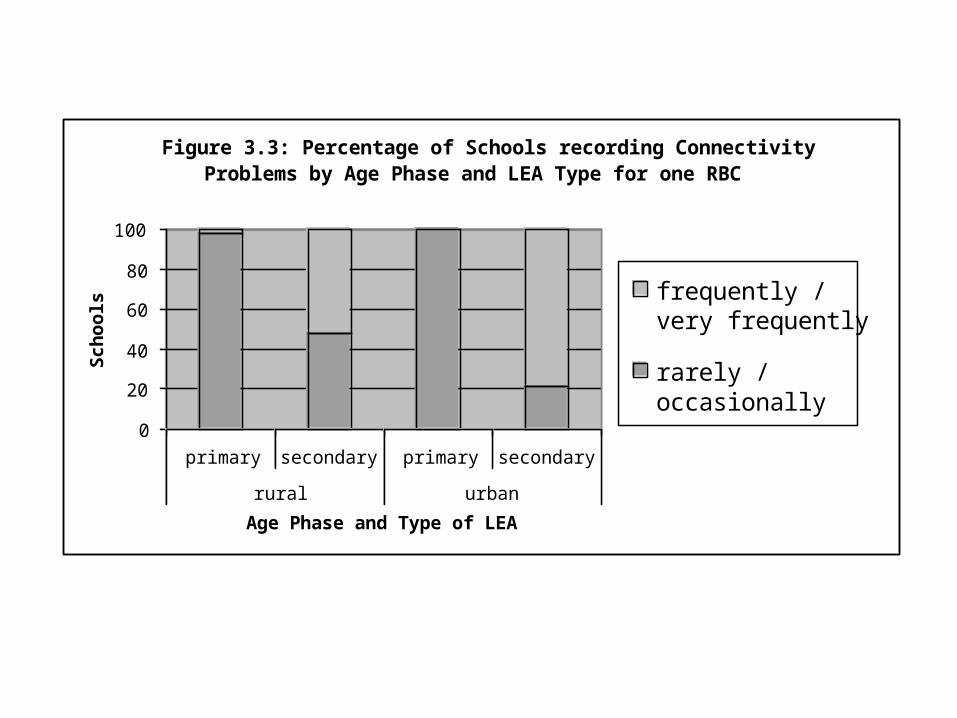
Figure 3.3: Percentage of Schools recording Connectivity Problems by Age Phase and LEA Type for one RBC
0
20
40
60
80
100
primary secondary primary secondary
rural urban
Age Phase and Type of LEA
Sch
ools frequently /
very frequently
rarely /occasionally

Figure 3.4: Level of Usage by Level of Connectivity
0102030405060708090
100
11-20% 31-40% 51-60% 71-80% 91-100%
Level of Usage
Nu
mb
er
of
Sch
ools
2mbps
5mbps
10mbps
80mbps

Measurable Impacts
Confined to secondary assessments of performance, a picture of high demand and increasing educational gains emerges for secondary schools
Lack of measurable effects at primary schools may be a result of:
Focus - younger children are learning technological or general cognitive skills not domain specific
Newness of the technology in many primary schools.
Failure of the SATS etc to tap into learning
Failure of the technology to deliver
The primary schools that tested the limits of provision were too few to establish the impact on wider performance.

Strand 2:Baseline Usage Survey
To address the extent to which broadband is meeting the four key aims, using staff and pupil perceptions and attitudes, and performance indicators:
1. “Increase the quality of service through fast access to a range of digital learning materials”
2. “Increase opportunities for, and quality of, online communication and e-collaboration”
3. “Significantly enhance the educational value of the materials delivered online by developing richer and more interactive content”
4. “Reduce teachers’ administrative burden & support Professional Development”

Strand 2:Baseline Usage Survey
Table 2.2: Distribution of Sample Schools by Level of Connectivity, Age Phase and Location.
Primary
Secondary Rural Urban
Rural Urban Low Connectivity
With some features of Bb <2 Mbps
1 7 1 4
Mid-Connectivity 2 to 8 Mbps
16 12 5 12
High Connectivity > 8 Mbps
10 3 6
17 29 9 22 NB: 10 schools were aware that they had been upgraded to broadband but were unable to specify the level of connectivity they were operating at.

Table 3.2.1 The Sample by Questionnaire Respondent and Function Sample Group of respondents Number of complete
questionnaires Key Stage Two Pupils 1000 Key Stage Three Pupils 240
Pupils
Key Stage Four Pupils 165 Para-professional staff (teaching assistants, admin staff, technicians)
86 Staff
Teaching staff 274 TOTAL 1765

Figure 3.5 - Broadband Use as a Percentage of Actual Use, by Age Phase - pilot study
0%10%20%30%40%50%60%70%80%90%
100%
primary secondary
Phase of Education
Perc
en
tag
e o
f A
ctu
al
Use
professional development
administration
teaching
preparation
Figure 3.6: Broadband Use as a Percentage of Actual Use, by Age Phase - 2005 study
0%10%20%30%40%50%60%70%80%90%
100%
primary secondary
Age Phase
Per
cent
age
of A
ctua
l Use professional development
administration
teaching
preparation

Figure 3.7 - Broadband Use as a Percentage of Total Possible Use, by Age Phase - pilot study
0%10%20%30%40%50%60%70%80%90%
100%
primary secondary
Phase of Education
Perc
enta
ge o
f Pos
sibl
e U
sage not used
professionaldevelopmentadministration
teaching
preparation
Figure 3.8: Broadband Use as a Percentage of Total Possible Use, by Age Phase - 2005 study
0%10%20%30%40%50%60%70%80%90%
100%
primary secondary
Age Phase
Per
cent
age
of P
ossi
ble
Usa
ge
not used
professional development
administration
teaching
preparation

Strand 3: Field Evaluation
To address the extent to which broadband is meeting key aim three, using in-depth case studies:
“(that it can) significantly enhance the educational value of the materials delivered online by developing richer and more interactive content”
This is a rerun of the Pilot Project across a range of schools which are not self-selecting best case scenarios.

Strand 3: Field Evaluation
Sample: 27 schools Spread across age phase, urban/rural location and level
of connectivityMethod:
In-depth case studies Classroom observations Portfolios of best practice Baseline data on broadband at the school
provided by teacher facilitator Weekly records of broadband based activity over
a one month periodImpact on schools:
Teacher facilitator funded for two further days

Impact on Usage
The reliability and speed of broadband is the key to many of the changes noted here.
Reliability, especially in the standard whole class situation, has widened and deepened the use of ICT in schools.
Increased confidence has led to a commensurate increase in ICT skills.

New Modes of Working
Online assessment is seen as fundamental to teaching and learning. All pupils have an Individual Education Plan and off site access to the school network means pupils continue their work at home.
Whilst other schools have this facility, this school has no timetabled lessons as such, whereby home access to learning materials is pivotal to the success of individual learning environments.
Despite the high level of ICT knowledge required for this method of teaching and learning, there are no specific ICT lessons. ICT is
simply used as a tool across the curriculum. Rural primary school, 2 Mbps

Reaching Out
E-Mentoring to ease transition and to inculcate responsibility for others. (DfES - Every Child Matters)
E-mentoring, pairing year six pupils about to start secondary school with year 7 pupils, is being used to reduce problems or concerns when transferring from primary to secondary school. The provision of an online virtual tour of the new school, and the opportunity to participate in an online forum are used to ease the transition process.
Underwood & Dillon (2005) have shown just how significant such provision is for vulnerable groups.
Urban primary school, 512 kbps

Issues
Learning Issues Assessment Technology inversion Making more from less Responsible use of information
Continuing Professional Development Staff training Strange understandings Widening access Teaching / technology balance
Resource Issues Costs of the technology Resource sharing Technical support Security
Technical Issues Filtering and blocking

Infrastructure Implications
While a number of schools are operating within the Threshold of Comfort, many secondary and some primary schools are beginning to stretch the resource available to them.
The issue of what constitutes high connectivity, is a key question.
While the new technology tools offer great potential they should not be viewed as a replacement but rather a facilitating agent for good teaching.
Pilot compared to the later study shows and increased understanding of the potential of broadband as teachers extend the range of activities they undertake which are supported by the technology.

Infrastructure Implications
There is a lack of community use of school ICT resources which relates to:
problems of home access for about half of all school children and their parents.
restricted school opening hours - Are we pumping a lot of money into an underused resource?
development of community resources in say libraries, that schools have priority access to during term time.
need to open up the schools as a number in our sample have chosen unilaterally to do.

Costs of the Technology
Finding ways that work
One primary school has trialled and rejected e-beams, which they had hoped would be a cheaper way of having interactive whiteboards.
Whilst they appreciate they did not utilise a number of the functionalities of this technology, they felt the e-beams were not particularly successful when used with children (moving near or bumping into the projector, or teachers’ hands getting in the way of the signal from the board pen to the e-beam).
The cheaper option was in the end not the best and they have now invested in promethean boards in every classroom, but this shows the school and staff are keen to try to push their use of ICT forwards.
Rural primary school, 2 Mbps

Sharing the Burden
Some schools are able to have successful ICT / broadband provisions without having much technical expertise within the staff.
At one rural primary school better co-operation between schools in the area has helped to resolve technical issues by the sharing of technical support and expertise.
However, on site technical support tends to be a feature of schools actively exploring the opportunities provided by broadband.
One technically advanced school pointed out that even in well-endowed areas such as the Y&H RBC (mean connectivity = 10 Mbps), if several schools instigate resource hungry activities then other schools will lose capacity. This RBC is projected to move to a 100 Mbps level of connectivity soon.

Firewalls and Filtering
For most schools these are synonymous
In the Pilot Study there was considerable concern at what schools called filtering (often firewall protection, inhibiting activities such as videoconferencing)
This concern has lessened in the second study BUT innovative schools have had time to work round problems less innovative usage by some schools meant fewer
schools had faced this problem
Many schools are keen to be in charge of the level of filtering within their domain

Firewalls and Filtering
Two schools within 20 miles of each other and within the same RBC illustrate radically different approaches to policing the Internet.
Cultivation of the aware citizen
Policing the internet
Summary
The reliability and speed of broadband is the key to change. Reliability, especially in the standard whole class situation, has widened and deepened the use of ICT in schools.
While a number of schools are operating within the Threshold of Comfort, many secondary and some primary schools are beginning to stretch the resource available to them.
As more innovative uses of the technology become the norm rather than the prerogative of a few, this problem will increase.

Summary
The issue of what constitutes high connectivity
remains with us.
Enhancement or extension of activities?