Embed Size (px)
Citation preview

Financial Decisions, Winter 2011, Article 2
1
The Impact of Bonus Depreciation on Project Decision Making
Gregory A. Kuhlemeyer* and John M. Wachowicz, Jr.**
*Carroll University **The University of Tennessee
Abstract This paper develops an Excel model – useful to students, academics, and business professionals – that values the impact of government driven increases in temporary first-year depreciation allowances, known as "bonus depreciation." Bonus depreciation is a temporary measure that has been used as a tool to stimulate economic activity by directly affecting the profitability and payback of a project and thereby impacting the investment decision of managers. We develop an evaluation technique, using net present value (NPV), that integrates the effects of bonus depreciation in a flexible model that can be used to determine the ultimate change on a project's base NPV.
JEL codes: A22, A23, G30, G31
Keywords: bonus depreciation, simulation, Excel

Financial Decisions, Winter 2011, Article 2
2
The Impact of Bonus Depreciation on Project Decision Making
1. Introduction During the last ten years our Federal government has been implementing stimulus plans during weak economic times that have included "bonus depreciation". Bonus depreciation allows businesses to write off for Federal tax purposes a greater proportion of the initial cost of an asset in the first year than has normally been allowed. The intent is to spur capital purchases today by making these assets profitable, or more profitable, so that new purchases are accelerated rather than delayed. Increased capital expenditures today help to stimulate the economy. The government has been using “temporary” bonus depreciation provisions so frequently, in a variety of scenarios, that it is important for government policy makers, business managers, academics, and students to understand how bonus depreciation works and the benefits in increased company value that it provides. This paper fulfills a need for a tool that will allow anyone to quickly analyze the impact of bonus depreciation (or a change in bonus depreciation) on the net present value (NPV) of a new capital asset purchase. Academics have the additional responsibility to effectively train current and future business leaders in how the change in depreciation should impact decision making on the project level. We include a flexible Excel model to allow all user groups to benefit.
2. Background
On March 9, 2002 President Bush signed an economic stimulus bill – Job Creation and Worker Assistance Act of 2002 (JCWAA) – into law with a retroactive bonus depreciation provision to the 2001 tax year. Businesses were allowed to take an additional first-year depreciation deduction equal to 30% of the original “adjusted (depreciable) basis” – usually the fully installed cost – of qualified property. In addition, businesses were entitled to “normal” first-year Modified Accelerated Cost Recovery System (MACRS) depreciation. However, the depreciable basis of the property and the regular depreciation allowances were adjusted to reflect the additional first-year depreciation deduction. The 30% bonus first-year depreciation applied to assets placed into service after September 10, 2001 and prior to September 11, 2004.1
In May 2003 another stimulus bill – Jobs and Growth Tax Reconciliation Act of 2003 (JGTRRA) – became law. One provision of this law both increased and extended the bonus depreciation available under the earlier stimulus package. Thus, the bonus depreciation increased from 30% to 1 Refer to section 101 in http://frwebgate.access.gpo.gov/cgi‐bin/getdoc.cgi?dbname=107_cong_public_laws&docid=f:publ147.107.pdf as of June 9, 2010.

Financial Decisions, Winter 2011, Article 2
3
50% and was applied to qualified assets acquired or constructed after May 5, 2003 and before January 1, 2005.
Bonus depreciation of 50% was brought back into the tax code via the Economic Stimulus Act (ESA) of 2008 and renewed via the American Recovery and Reinvestment Act of 2009 (ARRA) for the 2008 and 2009 tax years to help create jobs and push the economy forward.2 The 2009 law also extends, through 2010, bonus depreciation for property with a recovery period of 10 years or longer, for transportation property, and for certain aircraft.
In addition, over the last decade there have been special bonus depreciation allowances for a variety of unique situations. Faussett (2009) describes numerous cases involving business property getting special treatment. For example, New York Liberty Zone property had 30% first-year bonus depreciation for assets placed in service after September 10, 2001 through 2009. To assist victims of Hurricanes Katrina, Wilma, and Rita, Gulf Opportunity Zone property was allowed 50% bonus depreciation for qualified assets placed in service from August 28, 2005 to the end of 2007. And the Emergency Economic Stabilization Act of 2008 provides similar depreciation relief for business assets acquired in a federally declared disaster area in which the disaster occurred after 2007 and before 2010 (and later extended through all of 2010). In short, during every year since 2001 the Federal government has had some form of first-year bonus depreciation in the tax code to entice business investment broadly or to specific regions or situations. In 2010 there was significant pressure being placed on Congress to broadly extend bonus depreciation and President Obama signed the Tax Relief, Unemployment Insurance Reauthorization and Job Creation Act of 2010 on December 17, 2010. This act provided for 100% bonus depreciation for capital investments placed in service after September 8, 2010 through December 31, 2011 which is then reduced to 50% bonus depreciation for assets placed in service during the 2012 calendar year. This followed the Small Business Jobs Act of 2010 which extended Section 179 expensing and 50% bonus depreciation for assets purchased in 2010 to benefit eligible small businesses. In effect, the Act the President signed on December 17, 2010 is a temporary application of the most extreme form of bonus depreciation – i.e., 100% bonus depreciation.3
2 Refer to http://thomas.loc.gov/cgi‐bin/query/F?c110:4:./temp/~c110i5fiNq:e16675: http://www.gpo.gov/fdsys/pkg/PLAW‐110publ185/html/PLAW‐110publ185.htm and http://www.gpo.gov/fdsys/pkg/PLAW‐111publ5/html/PLAW‐111publ5.htm for changes to code. 3 Refer to http://thomas.loc.gov/cgi‐bin/bdquery/z?d111:H.R.4853: for the Tax Relief legislation and http://thomas.loc.gov/cgi‐bin/bdquery/z?d111:H.R.5297: for the Small Business legislation.

Financial Decisions, Winter 2011, Article 2
4
EXAMPLE: Modified Accelerated Cost Recovery (MACRS) depreciation with 50% bonus depreciation and assuming the normal half-year convention – i.e., the IRS tax code generally calls for a half-year of depreciation in the year an asset is acquired, regardless of the date of purchase.
On August 8, 2010, a calendar-year reporting business bought and placed in service a $100,000 ten-year property class piece of equipment. The business may claim a first-year (2010) depreciation allowance of $55,000 – i.e., a $50,000 bonus depreciation ($100,000 times 50%) plus a $5,000 normal first-year MACRS depreciation calculated on the new adjusted basis ([$100,000 minus $50,000] times 10%). In the second year (2011), the MACRS depreciation would be $9,000 ([$100,000 minus $50,000] times 18%). And so on.
A number of recent studies have looked at alternative ways of stimulating the economy. For example, Robbins and Robbins (2001) looked at a variety of proposals involving tax relief for businesses that might have a positive effect on promoting economic growth. They found depreciation reform (through accelerating depreciation) to be the second most effective method, next to capital gain tax rate reductions, of generating GDP growth. Depreciation reform was found to be especially powerful because in order to receive this tax benefit a business must purchase an asset, which constitutes new investment. Moreover, accelerating depreciation (as through bonus depreciation) does not cost the government that much because total depreciation does not change. The government will eventually get all of the same tax dollars but the timing is simply deferred.
Seto (2010) argued that bonus depreciation provisions in stimulus packages simply encourage businesses to reallocate funds from labor to capital and contribute to jobless recoveries. Other economists have argued that bonus depreciation tax breaks to business allow companies to keep people on the employment rolls who might otherwise have become unemployed. And, had these people become unemployed, government costs in many areas, including unemployment payments, would have increased. In short, some argue that the economy could have gotten much worse without this benefit, but it is difficult to test this perception of an unknown future result. While arguments about the size and direction of any stimulus effects on the economy due to bonus depreciation are likely to continue, the cash-flow benefits to individual businesses due to accelerating tax depreciation are not so controversial. Profitable businesses have long recognized the benefits of MACRS over straight-line depreciation for tax purposes. MACRS depreciation benefits profitable firms by accelerating the quantity of depreciation expense without impacting

Financial Decisions, Winter 2011, Article 2
5
actual cash outflows. These additional expenses lead to a reduced tax load in the early years of a project followed by fewer expenses and greater tax loads in later years.
One of the few studies of bonus depreciation with an individual firm viewpoint was done by Hartman (2002). He examined the 30% bonus depreciation provision in the Job Creation and Worker Assistance Act of 2002. In his paper, Hartman derived “new” depreciation tables by adjusting the “normal” MACRS depreciation percentages to reflect 30% bonus depreciation. The resulting “effective” MACRS percentages were higher in the first year and then less in subsequent years than under “normal” MACRS. Thus, firms purchasing new equipment would get a greater tax-shield benefit in the form of lower corporate taxes paid in year one. However, they would pay more in taxes, relative to “normal” MACRS, for all remaining depreciation periods.
The total depreciation for a $100,000 piece of equipment, for example, is still $100,000 – with or without bonus depreciation. However, because of the time value of money, it is generally preferable to record a dollar of depreciation today (and get the associated tax savings) than to take a dollar of depreciation in the future.
Hartman then went on to illustrate the bonus depreciation impact on capital investment decisions. He calculated the net present value of benefits to bonus depreciation as the difference in present worth of an investment’s after-tax cash flows using “effective” MACRS depreciation percentages minus the present worth of the investment using “normal” MACRS depreciation percentages. Assuming a constant 35% marginal tax rate, he concluded that the tax law depreciation change could have a significant positive effect on a project’s present worth, depending on the interest rate selected for discounting. The greatest benefit, he noted, is received for assets categorized in the longer-lived asset classes.
Watts and Farewell (2008) conduct an NPV analysis of the impact of 50% bonus depreciation on projects under rigid scenarios by reviewing the financial impact given: a) an incremental change in the discount rate; and b) IRS property classification. The authors define the impact on projects in two ways. First, and the method that we also use in this paper, is the change in NPV due to taking bonus depreciation divided by the asset’s (fully-installed) cost (i.e., the initial depreciable basis of the asset). The second method calls for relating the change in NPV due to taking bonus depreciation to what the authors call the “asset’s after-tax cost.” They calculate an asset’s after-tax cost by subtracting the present value of any tax savings due to taking regular MACRS depreciation from the asset’s fully-installed cost. This second method has less intuitive

Financial Decisions, Winter 2011, Article 2
6
appeal, and essentially artificially inflates the percentage impact, with longer property classes having much greater relative impacts.
The authors provide two sets of results in a series of tables – one table for each property class with discount rates varied by whole percent between 3 and 15 percent, and for only three discrete tax rates (15, 25, and 35 percent). One would, therefore, have to interpolate to get approximate results for any discount rate or tax rate different from those shown in the tables. We extend their work by creating a flexible model that is more useful to practitioners and instructors than a limiting table of values. Our model allows for easy changes to be made in the bonus depreciation rate (i.e., not just for 50%), tax rate, discount rate, and property class. It is important to note that this model can effectively handle the extreme case of 100% bonus depreciation. In fact, it is this extreme case that will be in effect for the period of September 8, 2010 through the end of 2011.
The states, for state income tax purposes, have not broadly allowed the equivalent additional bonus depreciation deduction as depicted in the Federal guidelines. And, many states have changed their handling of bonus depreciation over the years. Faussett (2010) indicates that only 13 states generally allow the additional first-year depreciation deduction for property placed in service in 2009 (and certain property placed in service in 2010). A handful of other states have some form of allowance of the deduction. Companies subject to state income taxes in states that have “decoupled,” or disassociated from bonus depreciation, benefit less, tax-wise, than would otherwise be the case.
3. Model
The versatile Excel model developed here allows faculty to introduce the concept of bonus depreciation, provide a value-maximizing comparison decision, and enhance Excel modeling skills among students. The model also can be used by practitioners to evaluate the impact of bonus depreciation on the NPV of their specific project under a variety of firm-specific conditions, as well as to train employees on this unique skill set embedded within the tax code. We will discuss the underlying model in this section followed by more in-depth discussions of its use and application.
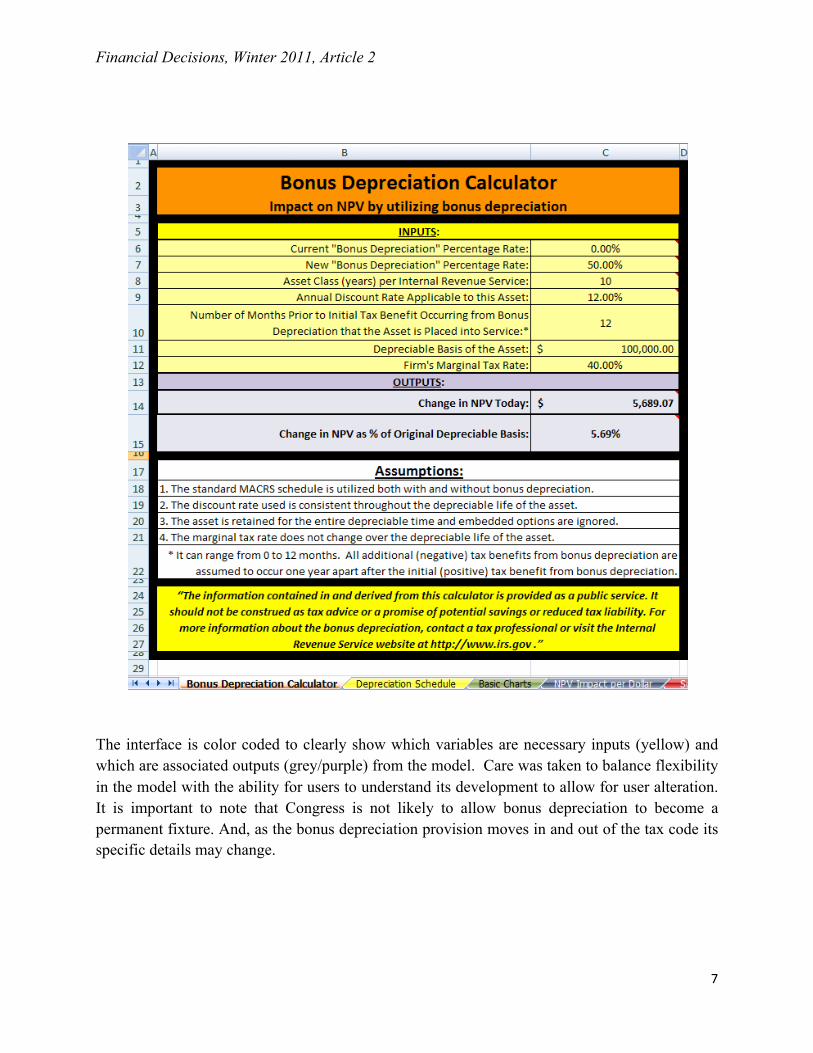
The interface of the model is the first tab titled 'Bonus Depreciation Calculator' as seen:
Financial Decisions, Winter 2011, Article 2
7
The interface is color coded to clearly show which variables are necessary inputs (yellow) and which are associated outputs (grey/purple) from the model. Care was taken to balance flexibility in the model with the ability for users to understand its development to allow for user alteration. It is important to note that Congress is not likely to allow bonus depreciation to become a permanent fixture. And, as the bonus depreciation provision moves in and out of the tax code its specific details may change.

Financial Decisions, Winter 2011, Article 2
8
The first key inputs to the system call for identifying any “new” bonus depreciation allowed and any bonus depreciation (if any) “currently” allowed in the tax code. We have set this example to show that the firm is considering the impact of a newly enacted 50% level of bonus depreciation relative to a situation in which there is no bonus depreciation (a common situation in the past decade). There are no limits on these cells, so it is possible to create a comparable situation where the asset can be expensed completely the first year.
Bonus depreciation has historically been applied along with the Modified Accelerated Cost Recovery System (MACRS) framework and we will assume that the most recent asset classes apply. The user must identify which class their particular asset will fall into based on current tax codes. The impact on the NPV can be dramatic based on the appropriate asset class as you can see in the two- and three-dimensional tables and graphs that follow. Next, the user should select the most appropriate discount rate for the project or situation under consideration. For illustrative purposes we have used both a 10-year asset class and a 12% annual discount rate. We make a simplifying assumption that the firm will generate tax benefits one year after project acceptance. The purpose of this input is to provide an appropriate discounting of all cash flows throughout the asset life.
The final two inputs, depreciable basis and marginal tax rate, also play critical roles in the development of the NPV impact. The depreciable basis should be the asset’s fully installed cost, per current practice and code; that is, the beginning value that will be depreciated over the life of the asset class. Note that adjustments to the IRS tax code over time could allow the expensing of some portion of the asset in the first year which would reduce the depreciable basis. Small businesses currently have the ability to fully expense some assets. It is generally advantageous for profitable firms to maximize all expensing allowances if it is currently advantageous for them to employ bonus depreciation. The marginal tax rate should be the tax rate on the last dollar of taxable income to the organization. These inputs are combined and the 'Depreciation Schedule' worksheet tab is utilized as the foundation for conducting some of the core calculations behind the scenes.
Together these inputs will drive the model to reveal the impact of taking bonus depreciation on the original NPV of the project. We are clearly ignoring all other cash flows and impacts in this model and focusing on the singular decision of utilizing bonus depreciation or not. Our example shows that the firm would see an increase in the NPV of the project of $5,689 or 5.7% of the original depreciable basis.4 A project that was already profitable will become more profitable by 4 Eschenbach and Lavelle (2001) and Loraas and Mueller (2008) show and discuss the basic mechanics of calculating MACRS depreciation using VDB and other Excel‐based functions. The appendix goes through the
Financial Decisions, Winter 2011, Article 2
9
the amount of the NPV while a project that was rejected due to a negative NPV may now be profitable because of bonus depreciation. In both situations, bonus depreciation increases the likelihood of projects being undertaken by a firm with limited capital or investment opportunities. This is the center point of why Congress provides bonus depreciation – getting firms to make investments in assets in the near term to improve economic activity.
4. Teaching and Training Usage
One of the more challenging issues in training students is getting them to understand how government can dramatically impact the decisions that businesses make day to day and year to year. In the business world today students need the ability to hit the ground running and business modeling is a necessary skill to help them move the organization forward with the best possible decisions. This ability is especially critical in smaller businesses where employees wear multiple hats and are less specialized than in larger institutions. In these organizations the employee needs to be able to see a problem, pick the right tool, analyze, evaluate, and then make a decision.
Instructors can utilize this Excel spreadsheet to help students apply the right tool, analyze and evaluate, and make a decision. One of the authors has successfully used this tool in an introductory class for this purpose. In many classrooms students are taught the NPV method and how cash flows impact the decision making process. The most advanced cognitive learning levels are analyzing, evaluating and creating. To help reach this higher-order learning, students start with the basic Excel model and then must evaluate the impact of a governmental change to allow bonus depreciation.5 As a first step, students begin with a known problem that is tied to calculating the NPV of a specific cash flow problem that results in a negative NPV. They are then asked to interpret how they would handle this problem from an analysis, evaluation and decision making (creating decisions) criteria. Next, a specific scenario is introduced, such as the base case, that impacts the analysis through decision making portions of the process. Note that all other sheets and cells are protected from students making accidental changes that would create erroneous outputs. Students are then asked to reevaluate and discuss how this governmental change would impact behaviors of firms given their recommendations. In this process students are asked to complete a chart to learn about the impact of changes to the tax mechanics of our particular usage, which includes bonus depreciation, and an example. An editable Excel file is available upon request from the authors. 5 We refer to the well‐known Bloom's Taxonomy (Bloom, 1956) and apply the revised Bloom's Taxonomy (Anderson and Krathwohl, 2001) where we advance students beyond the basic levels of remembering, understanding and basic applying with this exercise into the more advanced learning levels of analyzing, evaluating and creating.

Financial Decisions, Winter 2011, Article 2
10
rate, asset class, bonus depreciation rate and discount rate. Students can then be asked to create a basic chart, refer to the 'Basic Charts' tab, as follows:
Finally, students are asked to think about how the Federal government could use bonus depreciation to impact business behaviors in situations where there has been a natural disaster and if it is “fair” to those not living in the specific disaster region. Student dialogue in class has led to students having a much better grasp of the impact of legislation on business decisions and how important it is for business and government to work together.
This model can also be applied to more advanced courses in business and finance where students can use the base model to learn how core modeling is conducted and then can be asked to model different scenarios. For example, what if the government allows a certain portion of capital to be expensed in the first year before bonus depreciation is applied? Will this increase or decrease NPV? Who benefits the most and why? The reformulation of the model starts a new stream of knowledge and comprehension that advances to the higher order evaluation process. In addition, this approach is a great jumping off point for discussions of real options in the introductory corporate finance course due to the non-negative nature of bonus depreciation. Finally, students can be provided with examples in an advanced finance course that will enable them to create a surface plot to evaluate the impact of a governmental change and then engage in higher order evaluation discussions of the impact to their specific firm. Two-dimensional and three-dimensional evaluation examples for the base case can be seen in the 'NPV Impact per Dollar' tab and might look as follows:

Financial Decisions, Winter 2011, Article 2
11
One can also review the above data chart impact in a graphical format. Many learners, both academic and practitioner, can understand the impact of bonus depreciation more readily in this manner. The impact of the above chart can be reviewed in the tab 'Surface Plot of Bonus Benefits' and seen below.

Financial Decisions, Winter 2011, Article 2
12
The three-dimensional graph clearly reveals some interesting aspects to bonus depreciation: 1) the higher the discount rate, the higher the bonus depreciation NPV benefit; and 2) the longer the asset class category life, the larger the NPV benefit. In addition, if the marginal tax rate used in the example was moved up (down), the entire surface of the graph would move up (down). In short, the higher the marginal tax rate, the higher the bonus depreciation NPV benefit.
Similar to the discussion above, this model is a great way for practitioners to train or explain to others in their organization the value of bonus depreciation. It is especially useful in the small and medium size organizations where the controller and treasury functions are often being handled by less than a handful of individuals. The necessary cross-disciplinary nature of the work requires individuals to quickly evaluate the bonus depreciation situation and make appropriate recommendations without necessarily being an expert in areas including tax code, capital budgeting or real option analysis. In addition, the general nature of the model is generic enough to be easily changed for the specific needs of the organization.

Financial Decisions, Winter 2011, Article 2
13
To that end, total expensing of plant and equipment is essentially the most extreme possibility. The model in this paper will easily and accurately address this situation by inserting 100% as the bonus depreciation percentage. Finally, students, academics, business practitioners, and even government officials can use the model to study, compare, and contrast the benefits of bonus depreciation relative to simple MACRS and/or other forms of bonus depreciation.
5. The Bottom Line
In current and future situations involving a struggling U.S. economy and/or when regional disasters occur, it is likely that Federal legislators will continue to call on bonus depreciation to drive investment and rebuilding. It is not likely, however, that Congress will permanently change the depreciation model due to the need to be able to have tools at their disposal to move the economy. As such, current and future managers will need to be trained to understand bonus depreciation’s variable impact on capital budgeting decisions.
We have developed and presented a model that provides flexibility to address a plethora of changes in depreciation rates and policy changes to the existing Modified Accelerated Cost Recovery System (MACRS). It is important that the end user clearly understand the limitations of the model as well as the regulations so that the Excel model can be easily adjusted for current and future needs. We have found that the 50% bonus depreciation can have a substantial impact on the decision criteria for project selection. For example, consider the decision of whether to purchase a large and costly, new piece of equipment that falls into the 20-year asset class for tax depreciation purposes. Assuming a 12% discount rate and a 40% marginal tax bracket, the presence of 50% bonus depreciation along with MACRS, relative to MACRS alone, increases the NPV of the asset by 10.04% (see earlier Table) of the investment’s original depreciable basis (cost). Therefore, an asset that had a profitability index (i.e., present value to cost) above 0.9 but below 1.0 prior to bonus depreciation consideration/implementation will now be acceptable. This “enhanced” investment, that would not have otherwise been made, will now support economic growth in the country.
Appendix: The Mechanics of Bonus Depreciation Using VDB Inputs into our original sample example are as follows:

Financial Decisions, Winter 2011, Article 2
14
In this case we are comparing between a situation where standard 10-year MACRS applies and one in which a bonus 50% depreciation is allowed in the first year. Let us start by examining how the percentage of the new depreciation schedule is calculated.
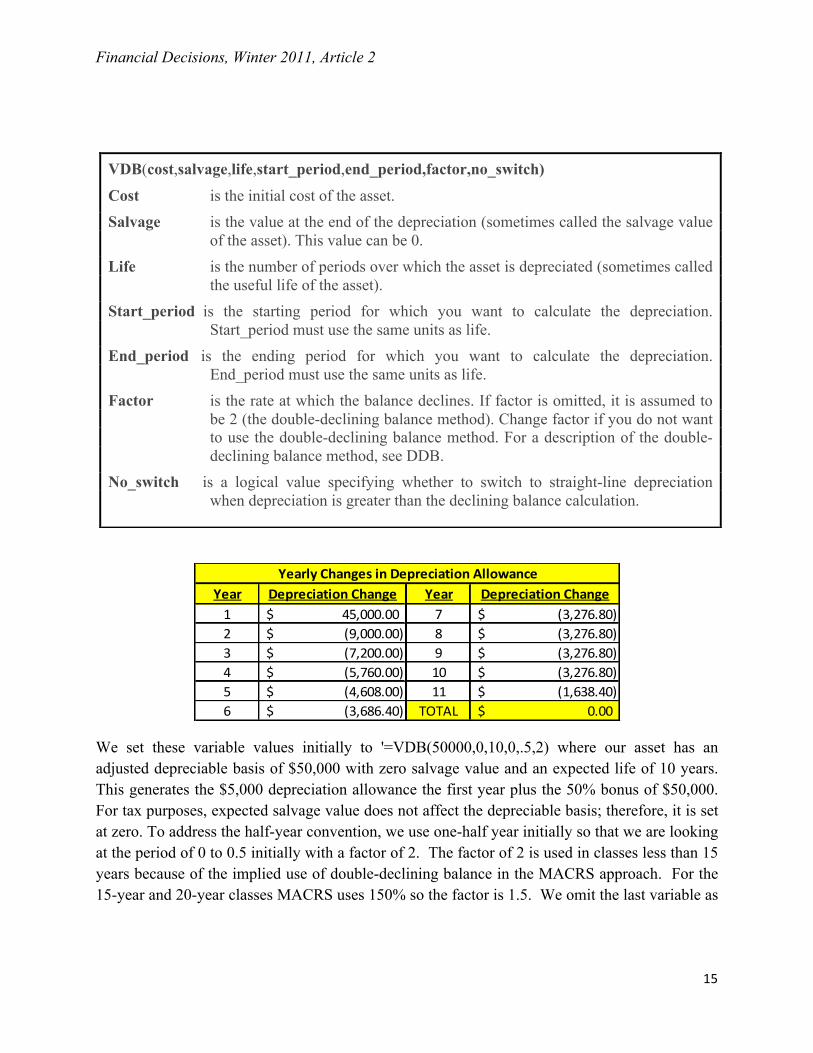
We start by employing the variable declining balance (VDB) function in Excel. This function is defined by Microsoft as:
The variable function allows us to set the model up in a very general approach to provide the greatest latitude in scenarios and training. In our original example, the depreciable basis of the purchased asset is $100,000 with bonus depreciation of 50% allowed. This means that $50,000 ($100,000 times 50%) is allowed for bonus depreciation plus the amount of depreciation based on the traditional MACRS calculation - but with the depreciable basis adjusted downward by the $50,000 bonus amount. Thus, the remaining $50,000 will be depreciated utilizing the regular 10-year property class MACRS percentages. For example, in year one there would be an additional $5,000 ($50,000 times 10%) of MACRS depreciation. This represents a total first-year deduction of $55,000 of depreciation instead of $10,000 based on the traditional $100,000 over the 10-year MACRS class without bonus depreciation. This means that the project will generate an additional $45,000 in first year tax depreciation, but the project will generate less depreciation in the remaining years. The reductions, relative to regular MACRS without bonus depreciation, would be $9,000, $7,200, and so forth as listed below.
Financial Decisions, Winter 2011, Article 2
15
We set these variable values initially to '=VDB(50000,0,10,0,.5,2) where our asset has an adjusted depreciable basis of $50,000 with zero salvage value and an expected life of 10 years. This generates the $5,000 depreciation allowance the first year plus the 50% bonus of $50,000. For tax purposes, expected salvage value does not affect the depreciable basis; therefore, it is set at zero. To address the half-year convention, we use one-half year initially so that we are looking at the period of 0 to 0.5 initially with a factor of 2. The factor of 2 is used in classes less than 15 years because of the implied use of double-declining balance in the MACRS approach. For the 15-year and 20-year classes MACRS uses 150% so the factor is 1.5. We omit the last variable as
Year Depreciation Change Year Depreciation Change1 45,000.00$ 7 (3,276.80)$ 2 (9,000.00)$ 8 (3,276.80)$ 3 (7,200.00)$ 9 (3,276.80)$ 4 (5,760.00)$ 10 (3,276.80)$ 5 (4,608.00)$ 11 (1,638.40)$ 6 (3,686.40)$ TOTAL 0.00$
Yearly Changes in Depreciation Allowance
VDB(cost,salvage,life,start_period,end_period,factor,no_switch) Cost is the initial cost of the asset. Salvage is the value at the end of the depreciation (sometimes called the salvage value
of the asset). This value can be 0. Life is the number of periods over which the asset is depreciated (sometimes called
the useful life of the asset). Start_period is the starting period for which you want to calculate the depreciation.
Start_period must use the same units as life. End_period is the ending period for which you want to calculate the depreciation.
End_period must use the same units as life. Factor is the rate at which the balance declines. If factor is omitted, it is assumed to
be 2 (the double-declining balance method). Change factor if you do not want to use the double-declining balance method. For a description of the double-declining balance method, see DDB.
No_switch is a logical value specifying whether to switch to straight-line depreciation when depreciation is greater than the declining balance calculation.

Financial Decisions, Winter 2011, Article 2
16
the default for VDB is to allow the function to switch to straight-line depreciation once it would generate a higher depreciation allowance. It is important to note that during the subsequent tax periods the periods would cover actual time of 0.5 to 1.5 (Year 2), 1.5 to 2.5 (Year 3), … , 9.5 to 10 (Year 11) – for a total of 11 periods. The first and last periods – under the MACRS half-year convention – represent half-years, so a total life of 10 years is reached.
To extrapolate further on the individual calculations. Under the non-bonus calculations we would use the full $100,000 basis for each period in the calculations. The formula '=VDB(100000,0,10,0,.5,2) generates an initial depreciation charge of $10,000 in period 1. We then increment the start and end periods inputs to 0.5 and 1.5 respectively using '=VDB(100000,0,10,.5,1.5,2) in period 2 to generate an $18,000 depreciation charge. We continue incrementing the starting and ending periods in the model to generate the subsequent period depreciation values. This generates $14,400, $11,520, $9,216, etc., in depreciation charges for periods 3, 4, 5 and so forth.
We will utilize the same general method for bonus depreciation except the depreciable basis is adjusted to $50,000 (50% of the original $100,000 basis). The formula '=VDB(50000,0,10,0,.5,2) now generates an initial depreciation charge of only $5,000 in period 1, but we simply add the bonus depreciation charge of $50,000 only in period 1 for a total of $55,000 in first year depreciation. We then continue to calculate the depreciation charges for the subsequent periods as before without adding the one-time $50,000 bonus depreciation '=VDB(100000,0,10,start,end,2). For the second and third periods this generates only $9,000and $7,200 respectively.
The net effect in the first period is an additional depreciation charge of $45,000 ($55,000 less $10,000), a net reduction of $9,000 in charges in year 2, and a reduction of $7,200 in year 3. We continue adjusting for each subsequent period and the net sum effect will be no difference in the total depreciation allowed. We can generate these values using a general model in Excel as follows:
=($H$28*'Bonus Depreciation Calculator'!$C$11+(VDB('Bonus Depreciation Calculator'!$C$11*(1-$H$28),0,F$4,MAX(0,$B5-1.5),MIN($B5-0.5,F$4),2))-((VDB('Bonus Depreciation Calculator'!$C$11,0,F$4,MAX(0,$B5-1.5),MIN($B5-0.5,F$4),2))))
In this case, the additional cells and their meaning can be defined as:
Financial Decisions, Winter 2011, Article 2
17
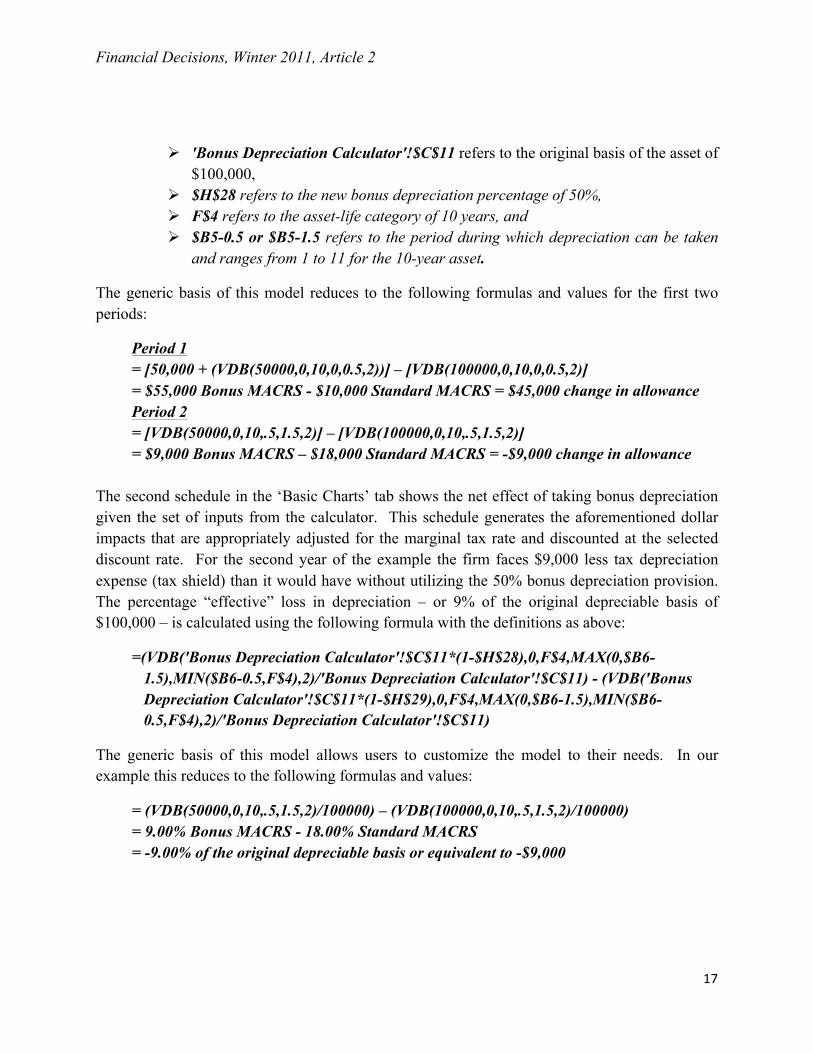
'Bonus Depreciation Calculator'!$C$11 refers to the original basis of the asset of $100,000,
$H$28 refers to the new bonus depreciation percentage of 50%, F$4 refers to the asset-life category of 10 years, and $B5-0.5 or $B5-1.5 refers to the period during which depreciation can be taken
and ranges from 1 to 11 for the 10-year asset.
The generic basis of this model reduces to the following formulas and values for the first two periods:
Period 1 = [50,000 + (VDB(50000,0,10,0,0.5,2))] – [VDB(100000,0,10,0,0.5,2)] = $55,000 Bonus MACRS - $10,000 Standard MACRS = $45,000 change in allowance Period 2 = [VDB(50000,0,10,.5,1.5,2)] – [VDB(100000,0,10,.5,1.5,2)] = $9,000 Bonus MACRS – $18,000 Standard MACRS = -$9,000 change in allowance
The second schedule in the ‘Basic Charts’ tab shows the net effect of taking bonus depreciation given the set of inputs from the calculator. This schedule generates the aforementioned dollar impacts that are appropriately adjusted for the marginal tax rate and discounted at the selected discount rate. For the second year of the example the firm faces $9,000 less tax depreciation expense (tax shield) than it would have without utilizing the 50% bonus depreciation provision. The percentage “effective” loss in depreciation – or 9% of the original depreciable basis of $100,000 – is calculated using the following formula with the definitions as above:
=(VDB('Bonus Depreciation Calculator'!$C$11*(1-$H$28),0,F$4,MAX(0,$B6-1.5),MIN($B6-0.5,F$4),2)/'Bonus Depreciation Calculator'!$C$11) - (VDB('Bonus Depreciation Calculator'!$C$11*(1-$H$29),0,F$4,MAX(0,$B6-1.5),MIN($B6-0.5,F$4),2)/'Bonus Depreciation Calculator'!$C$11)
The generic basis of this model allows users to customize the model to their needs. In our example this reduces to the following formulas and values:
= (VDB(50000,0,10,.5,1.5,2)/100000) – (VDB(100000,0,10,.5,1.5,2)/100000) = 9.00% Bonus MACRS - 18.00% Standard MACRS = -9.00% of the original depreciable basis or equivalent to -$9,000

Financial Decisions, Winter 2011, Article 2
18
Calculation of the Present Value of the Benefit of Bonus Depreciation:
The tax-shield benefit of depreciation, TD, is calculated by the marginal tax rate, T, multiplied by the depreciation charge, D. In this example the depreciation charges above are multiplied by the marginal rate of 40%. We then discount each cash flow at 12% for the associated periods to generate the total present value of $5,689.07. The Year 6 tax-shield benefit is -$3,686.40 x 0.40 = -$1,474.56 (Note: this is a negative benefit because with bonus depreciation the firm’s depreciation tax shield is smaller by $3,686.40 in Year 6 than would be the case under regular MACRS depreciation.) We then discount this reduction in the tax-shield benefit at 12% for 6 years = -$1,474.56 / (1.12) 6 = -$747.06. All years are discounted similarly and summed to generate the total present value. The schedule below shows the individual annual calculations and summation:
All potential scenarios are calculated in a similar manner depending on the variables input into the calculator.

Financial Decisions, Winter 2011, Article 2
19
6. References
Anderson, Lorin W., and David R. Krathwohl (Eds.), 2001. A Taxonomy for Learning, Teaching and Assessing: A Revision of Bloom's Taxonomy of Educational Objectives: Complete Edition, New York: Longman.
Bloom, Benjamin S. (Ed.), 1956. Taxonomy of Educational Objectives, Handbook 1: Cognitive Domain, New York: Longman.
DepreciationBonus.Org, Associated Equipment Distributors, Inc. http://depreciationbonus.org/.
“Estimated Revenue Effects of The Budget provisions Contained in H.R.5140.” Prepared by the Staff of the Joint Committee on Taxation (January 28, 2008). Retrieved May 24, 2010 from http://www.house.gov/jct/x-6-08.pdf.
Eschenbach, Ted G., and Jerome P. Lavelle, 2001, MACRS Depreciation with a Spreadsheet Function: A Teaching and Practice Note, The Engineering Economist, Vol. 46, No. 2, 153-161.
"Extension of Bonus Depreciation", Tax Policy Center, Urban Institute and Brookings Institution, February 10, 2009. Retrieved May 24, 2010 from http://www.taxpolicycenter.org/taxtopics/senate_bonus_depreciation.cfm.
Faussett, Nancy (March 30, 2009). “Bonus Depreciation.” Retrieved May 24, 2010 from http://www.bnasoftware.com/News_Articles/Articles/Bonus_Depreciation.asp.
Faussett, Nancy (April 2, 2010). “State Conformity with Federal Depreciation Rules.” Retrieved May 24, 2010 from http://www.bnasoftware.com/News_Articles/Articles/State_Conformity_with_Federal_Depreciation_Rules.asp.
Hartman, Joseph C., 2002, Technical Note – New Depreciation Rules from the Job Creation and Worker Assistance Act of 2002 and their Impact on Capital Investment, The Engineering Economist, Vol. 47, No. 3, 354-367.
“H.R. 4853 [111th]: Tax Relief, Unemployment Insurance Reauthorization, and Job Creation Act of 2010,” December 17, 2010. Retrieved December 28, 2010 from http://thomas.loc.gov/cgi-bin/bdquery/z?d111:H.R.4853:.
“H.R. 5140 [110th]: Economic Stimulus Act of 2008,” February 8, 2008. Retrieved May 24, 2010 from http://www.govtrack.us/congress/billtext.xpd?bill=h110-5140.
“H.R. 5297 [111th]: Small Business Jobs Act of 2010,” September 27, 2010. Retrieved December 28, 2010 from http://thomas.loc.gov/cgi-bin/bdquery/z?d111:H.R.5297:.

Financial Decisions, Winter 2011, Article 2
20
“Technical Explanation of the Revenue Provisions of H.R. 5140, the ‘Economic Stimulus Act of 2008’ as passed by the House of Representatives and the Senate on February 7, 2008.” Prepared by the Staff of the Joint Committee on Taxation (February 8, 2008). Retrieved May 24, 2010 from http://www.house.gov/jct/x-16-08.pdf.
Johnson, Nicholas, 2008, New Federal Law Could Worsen State Budget Problems, Center on Budget and Policy Priorities, February 28, 1-6.
Huang, Chye-Ching, and Chad Stone, 2008, Bonus Depreciation Tax Cut Unlikely To Provide Effective Economic Stimulus, Center on Budget and Policy Priorities, September 10. Retrieved July 16, 2010 from http://www.cbpp.org/cms/index.cfm?fa=view&id=579
Knittel, Matthew, 2007, Corporate Response to Accelerated Tax Depreciation: Bonus Depreciation for Tax Years 2002-2004, Office of Tax Analysis, US Department of Treasury, OTA Working Paper 98, May. Retrieved May 25, 2010 from http://www.treas.gov/offices/tax-policy/library/ota98.pdf
Leone, Marie, CFO.com, 1/25/10, Study: Bonus Depreciation Boosts Cash Flows, http://www.cfo.com/article.cfm/13479177
Loraas, Tina M., and Jennifer M. Mueller, 2008, Good Spreadsheet Practice Pays Off, The CPA Journal, May, 66-68.
Robbins, Aldona, and Gary Robbins, 2001, What’s the Most Potent Way to Stimulate the Economy?, Institute for Policy Innovation Issue Brief, October 10. Retrieved July 16, 2010 from http://ipi.org/IPI%5CIPIPublications.nsf/PublicationLookupFullText/CF8A52ECDCAF9A2986256AE1007BCF7D
Rummell, Nicholad, 2008, Depreciation fix may not be bonus over the long run, Financial Week, February 28. Retrieved July 16, 2010 from http://www.financialweek.com/apps/pbcs.dll/article?AID=/20080225/REG/532969381
Seto, Theodore P., 2010, The Problem with Bonus Depreciation, Tax Notes, February 12, 782-783.
Watts, Michael M., and Stephanie Farewell, 2008, Measuring the Incentive in 50 Percent Bonus Depreciation, Tax Notes, Vol. 120, No. 7, August 18.
Zion, David, and Amit Varshney, 2008, Bonus Depreciation Boost, Credit Suisse Equity Research, January 29, 1-16.


![1 1 Title of Your Presentation – 08.20.08 [ Title of Presentation] ROI-Leasing-Bonus Depreciation](https://img.dokumen.tips/doc/110x75/55166a985503469d698b5530/1-1-title-of-your-presentation-082008-title-of-presentation-roi-leasing-bonus-depreciation.jpg)


