Embed Size (px)
Citation preview

The Idea of “East Asian Economic Community”
from Business Perspective
APEC OFFICIAL SYMPOSIUMSeptember 27, 2006
Kakutaro KitashiroChairman, KEIZAI DOYUKAI
(Japan Association for Corporate Executives)Chairman of the Board, IBM Japan Ltd.

AGENDA
Growing East Asia and Challenges
The Principles of East Asian Community
Recommendations to Realize the East Asian
Community
Growing East Asia and Challenges

GDP Growth Rate Projection for 2015
Japan US EU China
India
ASEAN4
NIEs
World Bank(2006) 1.7 3.6 2.0 6.1 5.5 6.1 6.1
IEA(2004) 1.9 2.3 2.1 5.0 4.7 3.8 3.8Japanese Gov.
(2004) 1.5 3.1 1.8 6.9 4.1 3.1 4.1
Average 1.7 3.0 2.0 6.0 4.8 4.3 4.7The source : 2006 White Paper on International Economy and Trade
Annual Average GDP Growth Rate Projection for 2015
0.01.02.03.04.05.06.07.0
J apan US EU China India ASEAN4 NIEs
%

GDP Growth in East Asia
East Asia : (ASEAN10+Japan,China,Korea)1980 2005 2015
(Forecast)
East Asia’s share in global GDP *2
16.3% 20.2% 27.0% *3
East Asia’s share in global export *4
14.1% 26.6% -
East Asia’s share in World Investment *5
6.8% 21.2% (36.3 times in monetary terms)
*2 Calculation is based on the IMF World Economic Outlook Database.*3 METI, Trade and Industry 2006 White Paper on Internal Economy and Trade 2006,Figure 2-1-1.*4 *5 Prepared by the Mitsui Global Strategic Studies Institute(UNCTAD World Investment Report 2005)
0.0
10.0
20.0
30.0
40.0
50.0
60.0
70.0
80.0
1980 1982 1984 1986 1988 1990 1992 1994 1996 1998 2000 2002
East Asia EU15
EU25 NAFTA
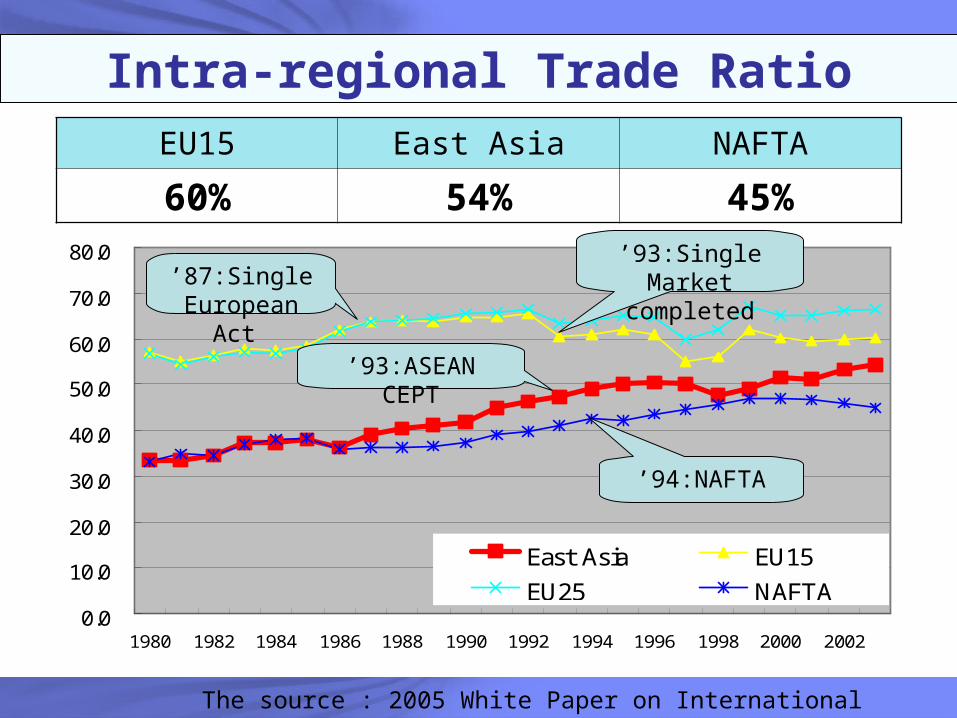
Intra-regional Trade RatioEU15 East Asia NAFTA
60% 54% 45%
’87:Single European Act
’94:NAFTA
’93:ASEAN CEPT
The source : 2005 White Paper on International Economy and Trade
’93:Single Market completed

Japanese Trade Dependency on East Asia
1998 2005 Increase (of which Chinese contribution)
Share of Japan’s exports to East Asia
34.0% 47.9% +13.9% (+8.2%)
Share of Japan’s imports from East Asia
35.6% 44.7% +9.1% (+4.8%)
*7 Compiled by Mitsui Global Strategic Studies Institute based on data from IMF Direction of Trade Statistics, CD-ROM July 2006, and ADB Key Indicators of Developing Asia and Pacific Countries.

GDP per Capita1990 2005
Japan 24,724 dollars 35,787 dollars
Singapore 12,219 dollars 26,835 dollars
Brunei 15,049 dollars** 17,632 dollars
South Korea 5,893 dollars 16,422 dollars
Malaysia 2,432 dollars 5,040 dollars
Thailand 1,528 dollars 2,577 dollars
China 342 dollars 1,703 dollars
Indonesia 628 dollars 1,259 dollars
Philippines 725 dollars 1,159 dollars
Vietnam 97 dollars 612 dollars
Laos 210 dollars 463 dollars
Cambodia 106 dollars 375 dollars
Myanmar 68 dollars 97 dollars*8 Sources: “Global Economic Trends” edited by the Cabinet Office, Office of the Director General of Policy Coordination, and IMF World Economic Outlook.** Based on the figure as of 1992 for Brunei.

The World Competitiveness Factors Ranking
Economy Country Ranking
Government
Efficiency
Business Efficiency
Infrastructure
Efficiency
Hong Kong 2 1 1 16
Singapore 3 2 7 5
Japan 17 31 23 2
Taiwan 18 24 14 20
China Mainland 19 17 30 37
Malaysia 23 20 20 31
Thailand 32 21 28 48
Korea 38 47 45 24
Philippines 49 45 44 56
Indonesia 60 51 57 61
Source: IMD WORLD COMPETITIVENESS YEARBOOK 2006

Tariff Comparison
The source : 2006 White Paper on International Economy and Trade
0.05.0
10.015.020.025.030.035.040.045.0
All Products Agricultural products Non-Agricultural products

TariffCuts40%
Effect on Trade Promotion
Estimated Effect of
Trade Facilitation Measures
56%
$148B
The source : 2006 White Paper on International Economy and Trade
$191B
Streamlining of port operations
29%
*1 : Enhance the transparency of customs clearance formalities
Custom clearance Process
17%
Transparency*110%
The risk of political instability
4%

The Principles of East Asian Community

ブルネイ ベトナム ラオス ミャンマーカンボジア
インドネシアマレーシア フィリピン シンガポールタイ
日 本 中 国 韓 国
豪州 NZUS
インド
Russia
Bangladesh Sri Lanka
UK France Germany CanadaEU
Pakistan
North Korea Mongolia
PNG
ReCAAP
the Bali Regional Ministerial
Meeting on Counter-Terrorism The Chiang Mai Initiative , The Asian Bond Market Initiative
ARF
The Bali Process
The East Asian summit
Japan, China and Korea
Cooperation
ASEAN The Asian Bond Fund
ASEAN + 3
Various Functional and Regional Cooperation
The Source : The Ministry of Foreign Affairs of Japan, Asian and Oceanian Affairs Bureau
JapanChinaKorea
IndonesiaMalaysia
PhilippinesSingaporeThailand
BruneiVietnam
LaosMyanmarCambodia
India
Aus. NZ

Approach to the East Asian Community
Road map for the realization of a “ community” Share the common goal One step at a time
Building equal partnerships
Expansion centering on the ASEAN
Realization of an open community
Creation of a disparity correction mechanism within East Asian region

Objective and Basic Principles
Objective Co-prosperity and co-existence within the
East Asian region
Basic Principles DemocracyMarket economyBasic human rights

Basic Rules of the East Asian Community
Mutual cooperation
Non-intervention in other countries’ internal affairs
Peaceful resolution of disputes
Renunciation of the use of military force
Correction of regional disparities
Equal partnerships

Recommendations to Realize the East Asian Community

Recommendations to Japanese Gov. Early realization of heads of state summits
between Japan and China/South Korea
Open the market for agricultural products, etc. for the facilitation of intra-regional FTAs/EPAs
Establish an East Asian Regional Development Fund
Launch a Council on the Promotion of the East Asian Community

Innovation for Sustainable Growth in Asia
Workforce Training Public expenditure on education
Promote Market Economy Maximize FDI through deregulation
ODA and East Asian Regional Development Fund
Commercial system within the region
Corporate Social Responsibility in the local communities
Key to Innovation
Talent
Investment
Infrastructure
Council on Competitiveness,Innovate America (2004)
Talent
Investment
Infrastructure

Conclusion
Japan: Four Recommendations
East Asia: Innovation for Sustainable Growth
Co-prosperity and Co-existence within the East Asian region

Thank you

Back up chart

FDI to East Asia
Foreign Direct Investment
2004 2005Growth
Rate Contribution Share
East Asia Japan 7,809 3,223 △ 58.7 △ 0.6 0.3
China 54,936 79,127 44.0 3.1 8.2
NIES 60,000 61,952 3.3 0.2 6.4
Korea 9,246 4,339 △ 53.1 △ 0.6 0.4
Taiwan 1,898 1,625 △ 14.4 △ 0.0 0.2
Hong Kong 34,036 35,905 5.5 0.2 3.7
Singapore 14,820 20,083 35.5 0.7 2.1
ASEAN4 7,749 11,374 46.8 0.5 1.2
Thailand 1,414 4,008 183.4 0.3 0.4
Malaysia 4,624 3,976 △ 14.0 △ 0.1 0.4
Indonesia 1,023 2,258 120.8 0.2 0.2
Philippines 688 1,132 64.5 0.1 0.1
World Total 782,839 964,744 23.2 23.2 100.0The source : JETRO White Paper on International Trade and Foreign Direct Investment 2006