Embed Size (px)
Citation preview

THE IMPACT OF PRICES AND REGULATIONS ON THE DEMAND FOR ADDICTIVE “BADS”:
A CASE ANALYSIS OF CIGARETTE CONSUMPTION AND
ITS LESSONS FOR THE DRUG LEGALIZATION DEBATE.
A Thesis
submitted to the Faculty of the
Graduate School of Arts and Sciences
of Georgetown University
in partial fulfillment of the requirements for the
degree of
Master of Public Policy
in Public Policy
By
Diego P. Gorgal, B.A.
Washington, D.C.
April 10, 2015

ii
Copyright 2015 by Diego P. Gorgal
All Rights Reserved

iii
THE IMPACT OF PRICES AND REGULATIONS ON THE DEMAND FOR ADDICTIVE “BADS”:
A CASE ANALYSIS OF CIGARETTE CONSUMPTION AND
ITS LESSONS FOR THE DRUG LEGALIZATION DEBATE.
Diego P. Gorgal, B.A.
Thesis Advisor: William Encinosa, Ph.D.
ABSTRACT
Since the release of the 1964 Surgeon General’s Report on Smoking and Health, US public
attitudes and policy towards tobacco products have dramatically changed. Since 1980,
cigarette consumption per capita has constantly decreased, whereas prices—mostly due to
large increments in tobacco taxes—have been steadily rising. Consequently, a significant
body of research has argued that the higher tobacco taxes, along with the regulations
restricting tobacco access, advertising, and use adopted in the 1990s and 2000s, explain the
surprising shift in tobacco consumption in the U.S. Using the CDC’s Behavioral Risk Factor
Surveillance Survey as the primary dataset, this study examines the impact of (higher) prices
and (tougher) regulations on smoking prevalence, intensity, and cessation rates in the U.S.
between 1993 and 2010. The analysis employs linear probability and negative binominal
count models, with State and years fixed effects. It results in three key findings: (1) price-
elasticity estimates of -0.061 for the probability of being smoker (smoking prevalence); 0.107
for the probability of being a casual versus a regular smoker and -0.08 for the number of
cigarettes smoked daily (both measures of smoking intensity); 0.074 for the probability of
attempting to quit (smoking cessation); (2) the overwhelmingly majority of regulation
responsiveness estimates are not statistically significant; and (3) estimates for the effects of
tobacco treatment and prevention programs are also statistically insignificant. While
statistically significant, the price elasticity estimates are much smaller than most of the
studies published in the 1990s and 2000s. Although many methodological aspects of this
iv
study require improvements before embracing conclusive implications, these findings may
shed some light on the drug legalization debate. While anti-prohibition advocates claim that
a legalized drug demand might be controlled through taxes and regulations, this study’s
findings call that view into question. If taxes and regulations do not have either economically
or statistically significant impact on the prevalence, intensity, and cessation of an addictive
“bad” consumption, as seems to be the case for cigarette consumption, as shown here, the
idea of drug legalization requires further research before considering it in the policy realm.

v
To my grandmother, wherever she is.
Acknowledgements
I want to express my gratitude to professors Micah Jensen, Andrew Zeitlin, Adam Thomas,
John Bailey, David Konisky, Nora Gordan, Bradley Holst, Stephen Mastrofski, and
Richard Baum, all faculty who have shaped, in different senses, my ideas on this topic since
the beginning of the program.
In addition, I would especially like to thank William Encinosa and Jeffrey Mayer because
without their guidance this work could have not been done.
Finally, I sincerely want to highlight and appreciate the support given by Natalia
Hassassian in all these years. All errors are my own.
vi
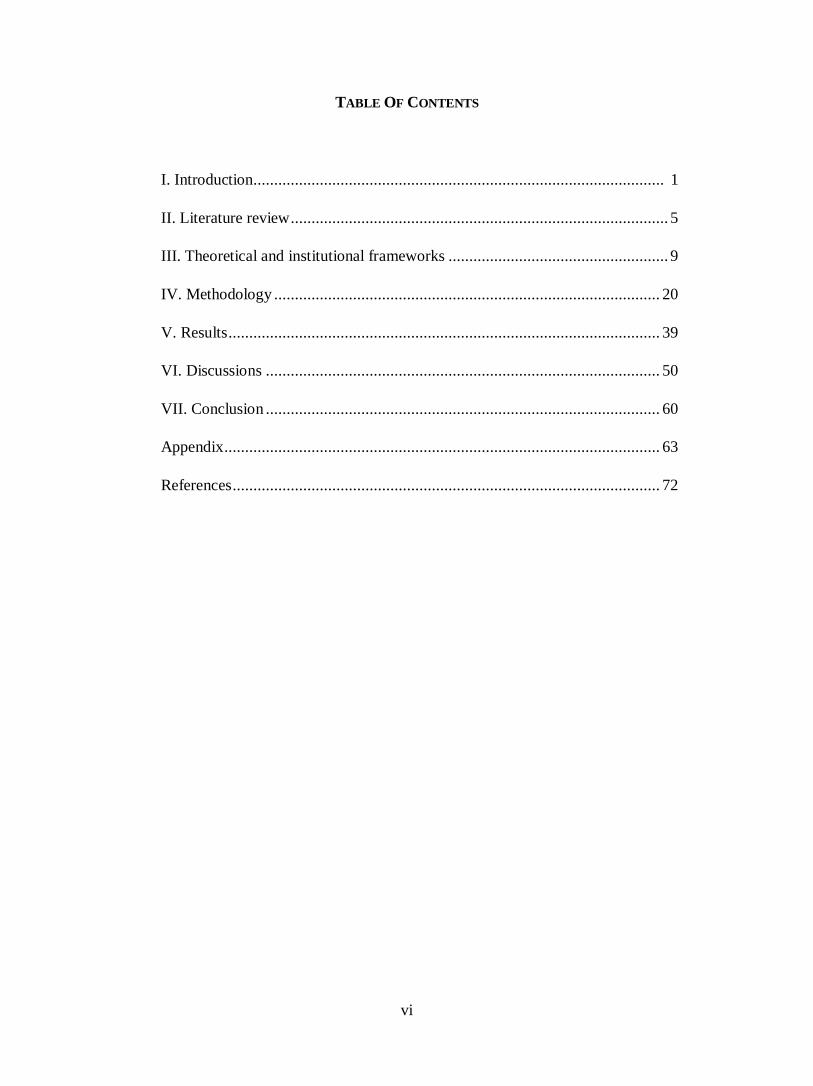
TABLE OF CONTENTS
I. Introduction................................................................................................... 1
II. Literature review ........................................................................................... 5
III. Theoretical and institutional frameworks ..................................................... 9
IV. Methodology ............................................................................................. 20
V. Results ........................................................................................................ 39
VI. Discussions ............................................................................................... 50
VII. Conclusion ............................................................................................... 60
Appendix ......................................................................................................... 63
References ....................................................................................................... 72

vii
LIST OF TABLES
Table no. 1: Sources of national survey data on tobacco use, United States .............................. 63
Table no. 2: Categories, values, and statistics for “Smoker” .................................................... 24
Table no. 3: Categories, values, and statistics for “Smokinginten” .......................................... 25
Table no. 4: Categories, values, and statistics for “Smokenum” .............................................. 25
Table no. 5: Categories, values, and statistics for “Stopsmk” .................................................. 26
Table no. 6: Statistics for “CigPrice” ...................................................................................... 27
Table no. 7a: Categories, values, and statistics for “Air_Restaur,” “Air_Bar,”
and “Air_Malls” ..................................................................................................................... 28
Table no. 7b: Categories, values, and statistics for “Air_Priv,” “Air_Pt,”
and “Air_Gov” ....................................................................................................................... 28
Table no. 8: Categories, values, and statistics for “salesreg” ................................................... 29
Table no. 9: Categories, values, and statistics for “advreg” ..................................................... 30
Table no. 10: Categories, values, and statistics for “TreatCov” ............................................... 30
Table no. 11: Statistics for “fund” .......................................................................................... 31
Table no. 12: Categories, values, and statistics for “a_ageg5yr” .............................................. 31
Table no. 13: Categories, values, and statistics for “male” ...................................................... 31
Table no. 14: Categories, values, and statistics for “race3” ..................................................... 32
Table no. 15: Categories, values, and statistics for “income3” ................................................ 32
Table no. 16: Categories, values, and statistics for “educa” ..................................................... 33
Table no. 17: Categories, values, and statistics for “employ” .................................................. 33
Table no. 18: Categories, values, and statistics for “marital” ................................................... 33
Table no. 19: Estimates of the Effects of Prices and Regulations on the Propensity
of Being Smoker ..................................................................................................................... 68

viii
Table no. 20: Estimates of the Effects of Prices and Regulations on the Propensity
of Being Casual Smoker .......................................................................................................... 69
Table no. 21: Estimates of the Effects of Prices and Regulations on the Number of Cigarettes
Smoked in the past 30 days ..................................................................................................... 70
Table no. no. 22: Estimates of the Effects of Prices and Regulations on the Propensity
to Quit .................................................................................................................................... 71
LIST OF GRAPHS
Graph no. 1: U.S. Cigarette Consumption Per Capita and Federal and State Cigarette Taxes,
1964 to 2012 ............................................................................................................................. 2
Graph no. 2: U.S. Cigarette Consumption Per Capita and Federal and State Cigarette Taxes,
1954 to 2012 ............................................................................................................................. 2
Graph no. 3: Percentage of Smoker Among National Population Aged 18 and Older, by year .. 63
Graph no. 4: Percentage of Casual Smokers Among Smokers, by year .................................... 64
Graph no. 5: Average Number of Cigarettes Now Smoked, by year ......................................... 64
Graph no. 6: Percentage of Smoker Who Attempted to Quit in the Past Year, by year .............. 65
Graph no. 7: Weighted Average of a Package of Cigarette Prices, by State and year ................ 66
Graph no. 8: Frequency distribution of ‘Smokenum” .............................................................. 67
LIST OF FIGURES
Figure no. 1: Theoretical model............................................................................................... 20

1
I. Introduction
Since the Surgeon General’s report on smoking and health was released in 1964, a growing
wave of academic, social, and policy interest has focused on tobacco control policies at the
federal, state, and local levels. Grounded on public health-related concerns, a well-
established set of policy tools—such as taxation, regulations, and prevention and treatment
programs—has played an increasing role in shaping either the supply or the demand for
cigarettes.
The dramatic decline of tobacco use in the U.S. during the past 30 years has brought
optimistic expectations about the effectiveness of these policy tools. It is widely believed that
increasing tobacco prices by higher taxes and/or other policies, restricting conditions for
supplying, accessing, and consuming tobacco products, and investing in treatment and
prevention programs have helped to reduce tobacco use, encourage cessation, and decrease
exposure to secondhand smoke among nonsmokers (USDHHS, 2000).
As Graph no. 1 shows, over the past 30 years, the shift in cigarette demand has been
tremendous. Since 1980, cigarette consumption per capita in the U.S. has continuously
decreased. In 1980, people in the U.S. consumed 2,752 cigarettes per capita, in 2012 they
consumed only 920. At the same time, the tax burden on tobacco was steadily increasing.
Only considering federal and states taxes, the nationally averaged tax burden on a cigarette
package grew from 21 cents in 1980 to $2.50 in 2012. Indeed, the scatterplot depicted in
Graph no. 2 seems to make a good case for the idea of a strong inverse correlation between
cigarette taxes and consumption.

2
Graph no. 1: U.S. Cigarette Consumption Per Capita and Federal and State Cigarette
Taxes, 1964 to 2012
Source: Author’s calculations based on data from Orzechowski and Walker (2012)
Graph no. 2: U.S. Cigarette Consumption Per Capita and Federal and State Cigarette
Taxes, 1954 to 2012
Source: Author’s calculations based on data from Orzechowski and Walker (2012)
0
50
100
150
200
250
300
0
500
1000
1500
2000
2500
3000
3500
19
64
19
66
19
68
19
70
19
72
19
74
19
76
19
78
1980
19
82
19
84
19
86
19
88
1990
19
92
19
94
19
96
19
98
20
00
20
02
20
04
20
06
20
08
20
10
2012
Fed
eral
an
d s
tate
tax
es, i
n c
ents
Cig
aret
tes
per
cap
ita
CIGARETTES PER CAPITA State and Federal Cigarette Taxes Per Package (in cents)
1000
1500
2000
2500
3000
CIG
AR
ET
TE
S P
ER
CA
PIT
A
0 50 100 150 200 250State and Federal Cigarette Taxes Per Package (in cents)

3
This fact has given rise to sophisticated academic work aimed to, first, identify the factors
explaining change, and second, assess the relative impact of each of those factors on the
tobacco demand. In a sense, the U.S. has been a sort of “open-ceiling laboratory” to test the
impact of the abovementioned set of policy tools on demand for tobacco.
Yet, academic interest is not limit to tobacco use. In the past decades, a significant body of
research has focused on the consumption of certain goods that are addictive (meaning that an
increase in past consumption of the good leads to an increase in current consumption) and
whose consumption harms the consumer as well as other people. These kinds of goods are
called addictive “bads.”
What makes these “bads” a subject of interest in the policy realm is not the addictive property,
but the harms associated with their consumption. While not every addictive product harms
the user and others (e.g. consider “workaholics”), some of them—such as cigarettes, alcohol,
cocaine, marijuana, and heroin—can harm the consumer as well as other people. Hence,
government intervention is grounded on the existence of external costs that harm other people
and ignore the internal costs of harm to consumers. Both kinds of costs reduce a person’s
ability to do valuable acts or reach valuable states of being and, depending on the harmfulness
of the “bad”, they could turn into a serious threat to each person’s freedom and to the
collection of functionings he or she can achieve.1
Due to several factors, many governments—including the US government—have chosen to
legalize and regulate some addictive “bads,” like cigarettes and alcohol, and to control their
demand by taxes, regulations, and treatment and prevention interventions, while they outlaw
1 Similar to smoking and alcoholism, the U.S. National Institute of Drug Abuse characterizes drug addiction as a chronic illness that typically involves a complex interaction of biological processes, psychological stressors, and social and environmental factors. Accordingly, drug use is itself a life-time process and drug dependence must be regarded as a chronic relapsing condition.
4
other “bads,” such as marijuana, cocaine, heroin, ecstasy, and methamphetamine, and control
their demand through enforcement and punishment, as well as treatment and prevention
interventions.
The outcome of the prohibition regime are twofold. First, it raises the price of the addictive
“bads.” The full price of these illegal “bads” is comprised of not only their monetary price
but also their indirect costs, like the conditions under which a “bad” can be purchased and
used (i.e. the travel and waiting time required to get the “bad”, the expected risk associated
with possession or consumption of the “bad”, and the perception of the adverse health effects
of consuming the “bad”). Second, it generates a huge illegal market, which brings important
social harms (e.g., crime and violence), and large costs associated with enforcing
prohibitionist laws and punishing their violation (e.g., incarceration).
In this context, most anti-prohibition advocates claim that drug legalization would diminish
the harms and costs associated with the supply of illegal “bads” (e.g., the black market and
its violence, and law enforcement and incarceration costs), while enhancing the ability to
control the harms associated with the consumption of addictive “bads” through prices and
regulations. The critical assumption of this claim is that addictive “bads” are sensitive to
price and regulations. Yet, are they?
This study addresses the question of the impact of (higher) prices and (tougher) regulations
on demand for addictive “bads,” considering the case of the demand for cigarettes in the U.S.
in the 1993-2010 period. Taking advantage of the available data on tobacco policies and the
cigarette demand, the underlying idea is that the cigarette case can be used to make an

5
informed guess about the impact of those policy tools (taxes and regulations) on the demand
for addictive “bads.”2
The following sections of the study are organized as follows: section II presents a literature
review on cigarette demand, especially focused on works that have estimated the price and
regulation responses of smokers. Section III develops theoretical and institutional
frameworks to identify and illuminate the factors involved in the decision to smoke. This is
a critical piece for guiding the construction of the methodology employed for identifying and
measuring the impact of the policy tools of interest (taxes and regulations) on smoking.
Section IV presents the datasets used in this study, defines the unit of analysis, explains the
empirical strategy, describes the variables employed, and specifies the quantitative analysis
model. Section V shows the results obtained and analyzes their statistical and
economy/policy significance. Section VI discusses methodological concerns involved in the
estimations, pointing out various aspects that might be jeopardizing the conclusiveness of the
results. The section also discusses the policy implications of my findings for tobacco control
policy, as well as the lessons that might be drawn for the drug legalization debate. Finally,
section VII presents the study’s conclusions.
II. Literature review
Traditionally, economic as well as political viewpoints, prices have been considered one of
the most important factors for explaining the demand for cigarettes. Particularly, taxation has
2 In this line of reasoning, Reuter (2013:49) explains “Marijuana appears to provide the closest parallel to the potential black market for cigarettes. It is a very lightly processed, naturally occurring weed, readily grown in many countries and ecological settings….Though it has much more substantial psychoactive effects than tobacco, no matter how the latter is manipulated, the effects are much less severe than those of cocaine, heroin or methamphetamine.”

6
received huge attention as a policy tool oriented to increase prices and thus, shape individual
behavior toward cigarette consumption. Most scholars and policymakers believe that raising
tobacco taxes reduces cigarette consumption. The political rationale for increasing tobacco
taxes relies on the argument that higher taxes will reduce smoking and improve public health.
The Surgeon General’s reports (USDHHS 2000, 2012) concluded that increments in cigarette
prices, including those resulting from higher taxes, reduce the initiation, prevalence, and
intensity of smoking among people. Similarly, Grossman (2004) suggests that changes in
price can explain a good portion of smoking prevalence, arguing that the 70% increase in the
real price of cigarettes since 1997 explains almost all of the 12 percentage point reduction in
the cigarette smoking participation rate since that year.
In addition to the Surgeon General’s reports, Chaloupka and Warner (2000) is another well-
known comprehensive review of the sophisticated body of research about the effects of price
increases on the cigarette consumption. The authors show that most of the aggregated studies,
using either time-series or pooled cross-sectional time series data, have produced estimates
for the price elasticity of cigarette demand falling in a relatively narrow range, centered at -
0.4. Some other studies, however, have generated estimates falling in a wider range of -0.14
to -1.12.
Chaloupka and Warner also found the same pattern in studies that have used data on
individuals taken from large-scale surveys. In general, in these studies, the estimated price
elasticities of demand are comparable to those estimated using aggregate data. Yet, the range
of estimates is not as narrow as in the aggregate studies.
One of the important findings in all of these studies is that the price responsiveness of tobacco
demand is not constant across different groups. Examining the effects of price on cigarette
smoking, Lewit and his colleagues (Lewit et al., 1981; Lewit and Coate, 1982) found an

7
inverse relationship between (the absolute value of) price elasticity and age, estimating a total
price elasticity of demand for 20 through 25 year-olds more than double that of persons 26
and older. Since then, other studies have supported the idea that the price elasticity of
cigarette demand is inversely related to age (USDHHS, 2012).
Additionally, Chaloupka (1990) estimates cigarette demand equations separately for men and
women, finding that men are responsive to changes in the price of cigarettes, whereas women
are virtually unresponsive to price changes. Chaloupka and Wechsler (1990) estimate that
college students are quite sensitive to the price of cigarettes, which in turn reduces smoking
participation rates among them. Chaloupka and Liccardo Pacula (1998) find that gender and
race are relevant factors in understanding the price elasticity of tobacco. And Gruber (2000)
finds that the most important policy determinant of youth smoking is price. In sum, there is
a differential impact of taxation on the tobacco demand across age, race, gender,
socioeconomic status, and/or educational level.
Furthermore, it should be also considered that the price responsiveness of tobacco demand is
not constant over time. Wasserman et al. (1991) show that price elasticities for adults varied
substantially between 1970 and 1985, moving from 0.06 to -0.17 in that period. Moreover,
since the current burden of tobacco taxes is heavy and current tobacco demand comprises
people with strong preferences for smoking, the previous price-elasticity estimates may not
reflect current conditions. However, it is a reasonable assumption that taxation has a
diminishing marginal rate of impact.
All in all, whereas there is a strong consensus that increasing prices has a significant impact
on youth smoking rates, the findings in adult smoking are less clear. The literature about
“…the adult smoking participation price elasticities ranged from -0.74 to 0.06 while price
elasticities of adult smoking intensity ranged from -0.28 to 0.01” (Callison and Kaestner,

8
2012:5), and these elasticities may vary over time. Given these facts, it is important to revisit
the impact of taxation on the tobacco demand.
While price elasticity has received most of the attention, factors other than prices or taxation
also shape tobacco demand, such as sales regulations and consumption restrictions. In the
past decades, anti-smoking programs have been widely adopted at all levels of government.
For instance, the federal government has banned advertising on television, and the FDA
restricted advertising aimed at teenagers. State and local governments have adopted laws
restricting smoking in public places.
Chaloupka and Warner (1999) also review the literature on economic analysis of other
tobacco control policies, such as advertising restrictions, clean air policies, and sales
regulations. For instance, no consensus has emerged from the variety of econometric studies
analyzing the impact of cigarette advertising on cigarette demand. In the opposite viewpoint,
Andrews and Franke (1991:96) concluded “that there is a significant relationship between
advertising and cigarette consumption across studies, independent of study design factors.
However, the estimated magnitude of this relationship varies depending on several study
design factors.”
In addition, the econometric analyses of anti-smoking publicity and paid counter-advertising
reviewed by Chaloupka and Warner (1999) found that generally, but not universally, these
campaigns have significantly reduced cigarette smoking. They also reported that, in general,
most of the studies about restrictions on smoking in public places and private workplaces
have found that those restrictions have reduced both smoking prevalence and intensity among
smokers.
In this line of working, this study aims to revisit the topic of adult smoking, test the robustness
of the main findings on it, and make a judgement whether our knowledge about the impact

9
of some policy levers such as taxes and regulations may shed some light on the drug
legalization debate.
III. Theoretical and institutional frameworks
The first step for estimating the impact of prices and regulations on the cigarette demand
requires understanding and outlining the process determining the decision to smoke.
Therefore, in this section, I will develop conceptual and institutional frameworks oriented to
identifying the factors affecting cigarette demand.
Some years ago, cigarette smoking and other addictive behaviors were viewed as irrational
and, therefore, not suitable for conventional economic analysis (Elster, 1979). However,
during the past decades a growing number of studies of cigarette demand began to address
the addictive nature of cigarette smoking, developing different economic models of
addiction, usually named imperfectly rational models of addictive behavior, models of
myopic addictive behavior, and models of rational addictive behavior (Chaloupka and
Warner, 1999).
I will skip the debate about which model more accurately reflects the decision making
process for smoking. Yet, based on many assumptions and findings of these three models, I
will use a comprehensive approach to tobacco consumption grounded on the Aristotelian
notion of human beings as entities with a free and self-determined will, which is defined by
not only their own rational intelligence, but also their senses and biology.
Applied to the subject of this study, that approach advances the idea that individual behavior
is driven by personal will, which could be affected by the addictive power of nicotine.
However, this will occurs in a larger and more complex context, such as social settings

10
(family, community, and general culture), economic and physical environments, as well as,
benefits and costs and incentives and restrictions delivered by public policies, among other
factors (Green and Richard 1993). In other words, I propose the simple idea that an
individual’s will, personal characteristics, and context matter.
Because of the addictive drug (nicotine) found in cigarettes, the demand for cigarettes is
represented by a particular downward-sloping curve. The biology of addiction makes past
consumption decisions an important factor explaining current choices, which in turn gives
cigarette demand a particular price-elasticity function.
Yet, following the simple idea I proposed, the price affecting the decision on smoking
includes, as in any other good, not only the monetary price but also the conditions for
purchasing the good, which means the time and other costs associated with buying and using
that product should be controlled. If an individual is just a purely rational decision maker,
cigarette prices and health costs associated with cigarette consumption should be the factors
explaining the entire decision making process of smoking. Since that assumption does not
hold in this study, other factors than cigarette prices should be controlled.
In this line of reasoning, many econometric analyses have expanded the scope of the classic
price-elasticity studies on the impact of taxation on cigarette demand to account for the wide
set of policy interventions and regulations implemented on sales and consumption, and
intended to modify the access and usage of cigarettes as well as the motivations involved in
smoking.
In the policy realm, U.S. federal, state, and local governments have been increasingly
developing policies to control smoking. These polices have used specific taxation,
regulations, as well as prevention and treatment programs as tools to shape the supply and/or
the demand for cigarettes. Some have tried to modify either prices and/or conditions of

11
supply, while others aimed to limit the access and consumption of tobacco products, or the
quantities supplied. In any case, the aims have been to prevent tobacco use, encourage ces-
sation, and reduce exposure to secondhand smoke among nonsmokers, all grounded in
health-related concerns.
In sum, policy interventions oriented to increase the monetary price (taxation; litigations;
price floor programs, quotas, and trade policy) and policy regulations meant to either modify
conditions of access and usage (product regulations; clean air policies; sales regulations;
treatment and prevention programs;) or to reduce the motivation (advertising and
promotions), have tried to affect the supply and demand of cigarettes.
3.1 Taxation as a policy tool to control the demand of cigarettes
By and large, policymakers believe that increasing tobacco prices will reduce tobacco use. A
variety of factors can affect the retail prices of cigarettes. But one of the most important
policy-related determinants of prices are taxes on tobacco products.
In the United States, the federal government, all 50 states, the District of Columbia, and many
local governments have been taxing tobacco products in several ways. Basically, the most
common taxation across the states are the excise, or per unit, taxes imposed on cigarettes and
the ad valorem general sales tax applied to cigarettes and other tobacco products.3
The policy rationale is that a growth in cigarette and other tobacco taxes results in higher
prices for these products, which in turn leads to reductions in cigarette smoking by deterring
smoking initiation among adolescent and youth, fostering smoking cessation among adults,
and reducing the intensity of consumption (average number of cigarettes smoked) among
3 Ad valorem taxes are a fixed percentage of the price and thereby increase or decrease as price changes. Excise taxes, on the other hand, do not change over time with prices.

12
continuing smokers. Since it is argued that all of these outcomes would lead to relevant
improvements in health, increasing in cigarette excise taxes is widely seen as an effective
policy tool in improving health.
The tax burden on tobacco in particular has been sharply increasing in the past two decades
in the United States. Inflation-adjusted retail price of cigarettes increased by over 70% from
1997 to 2002, due to two federal tax increases (from $0.24 to $0.34 in 2000 and from $0.34
to $0.39 per pack in 2002) and various increases in state excise taxes in the same period.
In parallel, between 1998 and 2003, wholesale prices for cigarettes increased 122% (Capehart
2004), largely as a result of the expenses for individual state tobacco settlements and
expenses related to the Master Settlement Agreement (MSA).4 Recently, the growth in the
inflation-adjusted retail price of cigarettes has been due to another federal tax increase (from
$0.39 to $1.01 per pack in 2009) and numerous increases in state and local taxes.5
The general sales tax is also a common way to tax tobacco products. In 2013, 45 states and
the District of Columbia imposed general sales taxes on cigarettes, adding between $0.14 and
$0.43 to the price of a pack.
In addition to federal and state taxes, hundreds of local governments impose taxes on
cigarettes, but the rates are generally relatively small compared with state taxes.
Nevertheless, in recent years, several cities and counties have implemented large increases.
4 The first lawsuits against the tobacco industry to recover health care expenditures for treating tobacco-related diseases of Medicaid recipients were brought by Mississippi, Minnesota, Florida, and Texas. In this case, the tobacco industry agreed to pay a total of $35.3 billion over a 25-year period (Miura et al. 2006). Soon, a large Medicaid reimbursement lawsuit was presented seeking a comprehensive settlement agreement. On November 23, 1998, the four largest tobacco companies entered into the Master Settlement Agreement (MSA) with the remaining 46 states and 5 territories. Due to that agreement, the tobacco industry makes annual payments to the states for a 25-year period. (National Association of Attorneys General 2012). 5 Since January 1, 2002, 47 states, the District of Columbia, and several U.S. territories have increased their cigarette excise taxes a total of 105 times.
13
These included New York City, which in 2002 increased its tax on cigarettes from $0.08 per
pack to $1.50 per pack and the city of Chicago, which also raised taxes on cigarettes.
According to the International Agency for Research on Cancer (IARC) Handbooks of Cancer
Prevention in Tobacco Control (IARC, 2011), and Chaloupka and colleagues (2011),
conventional wisdom suggests that increases in cigarette prices can lead to reductions in
cigarette smoking, measured by the number of smokers (prevalence) and/or by the average
number of cigarettes smoked by smokers (intensity). Also, these reductions are notably
higher among youth and young adults (USDHHS, 2012) and among lower income
populations (IARC, 2011).
3.2 Regulations as a policy tool to control the demand of cigarettes
Along with taxation, a variety of other policy interventions have aimed to shape the demand
for tobacco products. Some policies have tried to control access to tobacco products, such as
sales prohibitions to minors, in order to delay or prevent the initiation of smoking, or sales
restrictions on vending machines. Others have attempted to control the usage of tobacco
products, such as the clean air policies, aimed to reduce the exposure of nonsmokers to
environmental tobacco smoke while increasing the restrictions imposed on smoker who still
choose to smoke.
Another set of policies have sought to affect the motivations of people to smoke, by imposing
restrictions on advertising and promotion activities, which were considered as a powerful
force for maintaining tobacco consumption, or establishing product regulations on issues
related to manufacturing, packaging, and distributing that can influence people’s decision to
smoke.

14
Finally, personal and collective litigations have brought provisions that restrict marketing
practices, which in turn could affect the demand for tobacco products.
3.2.1 Advertising and Promotion
The 2012 Surgeon General’s report concluded that there is a causal relationship between
advertising and promotional efforts and the initiation age and progression of tobacco use.
Advertising and promotional activities are marketing tools and strategies commonly used to
influence consumer preference, increasing sales and market share, and attracting new
consumers. After the automobile industry, the tobacco industry is the industry that markets
its products most heavily. Therefore, the potential influence of cigarette advertising and
promotion on smoking prevalence has been a subject of concern and debate for almost 30
years.6
As a result of the Master Settlement Agreement (MSA), the tobacco industry was subject to
the following marketing restrictions: i) no brand name sponsorship of concerts, team sporting
events, or events with a significant youth audience; ii) no sponsorship of events in which paid
participants are underage; iii) no use of tobacco brand names in stadiums and arenas; iv) bans
use of cartoon characters in tobacco advertising, packaging, and promotions; v) no payments
to promote tobacco products in entertainment settings, such as movies; vi) no distribution on
sale of merchandise with brand name tobacco logos; vii) no transit and outdoor advertising,
6 According to the Federal Trade Commission (2013), advertising and promotional activities include: newspaper and magazine advertising; outdoor billboards; audio-visual or video advertising on any medium of electronic communication; advertising on or within private or public vehicles and all advertisements placed at, on or within any bus stop, taxi stand, transportation waiting area, train station, airport, or any other transportation facility; point-of-sale advertisements; price discounts paid to cigarette retailers or wholesalers; promotional allowances; sampling; direct mail advertising; public entertainment events; coupons; sponsorships; endorsements, testimonials, and product placement; internet and telephone advertising; social media marketing.

15
including billboards; viii) tobacco billboards and transit ads to be removed; and ix) at industry
expense, states could substitute advertising discouraging youth smoking.
3.2.2 Product Regulations
On public health care grounds, some policies were implemented to regulate either the
contents of tobacco products (cigarette smoke contains approximately 4,000 chemicals), or
the packaging, as a venue for consumer information and education. Along this line,
government regulations have included using product packaging to convey health messages
(warning labels on packages), and requirement that cigarette advertising disclose levels of
“tar” and nicotine. The current federal laws preempt, in part, further actions by states and
municipalities imposing other labeling regulations on cigarettes.
3.2.3 Clean Air policies
Clean Air policies, also known as “smoking-free” policies, have been implemented by state
and local governments and meant as a key component of a comprehensive tobacco control
strategy (USDHHS, 2012).
Although the primary purpose has been to protect nonsmokers from secondhand exposure, it
is believed that due to restrictions on where people can smoke, cigarette use has been made
less socially acceptable and less convenient, and thus, have encouraged cessation or, at least,
a reduction in smoking intensity (Gilpin 2004; Bauer 2005; Alesci et al. 2003; Eisenberg and
Forster 2003). In addition, the 2006 Surgeon General’s report concluded that restrictions on
smoking in worksites or public sites lead to less smoking, measured by either smoking
prevalence or intensity.
The growth of laws regulating smoking in public locations has been a clear measure of the
lower social acceptability of smoking. While in 1964 there were no laws regulating smoking

16
in public locations, when evidence regarding the health consequences of exposure to
secondhand smoke appeared, a strong non-smokers’ rights movement emerged, motivating
policies limiting where people could smoke. ANRF (2013) estimated that in 2013,
comprehensive local and/or state laws on clean indoor air covered 49% of the U.S. popula-
tion, by restricting or banning smoking in specified locations, such as workplaces, public
places, restaurants, bars and casinos, schools, day care centers, and health care facilities.
However, while progress has been made since the release of the 1986 Surgeon General’s
report on the health consequences of secondhand smoke (USDHHS, 1986), wide geographic,
occupational, and demographic disparities remain across the U.S. It is estimated that only
about 30% of residents in the U.S. lives under state or local laws that completely ban smoking
in worksites, restaurants, and bars (CDC 2008b, 2010).
3.2.4 Sales regulations to minors and general population
Even though the present study is on the impact of prices and regulations on the adult demand
for cigarettes, I consider that those regulations that were effective in reducing youth smoking
would influence adult prevalence rates in the following years. In other words, if a regulation
prevents an adolescent from smoking today, there will be one adult less in the adult smoking
prevalence calculation in two years.
Unlike other fields, minors’ access to tobacco products has been an area of regulation
relatively free from conflicts. The primary regulatory goal has been to reduce the sale of
tobacco products to minors. In order to achieve this, regulations have attempted to restrict
distribution by requiring licensure of tobacco retailers, regulate sales by banning cigarette
vending machines, enforcing minimum age laws, and establishing civil penalties (CDC
2007a; USDHHS 2012).

17
Additionally, the MSA has been a major source of regulations. It mandated: i) no free samples
except in an enclosed area where the operator ensures that no underage persons are present;
ii) no gifts to youths in exchange for buying tobacco products; iii) no gifts through the mail
without proof of age; and iii) no sale, manufacture, or distribution of cigarettes in packages
of fewer than 20.
3.3 Prevention and treatment programs as tools to reduce the demand of
cigarettes
Based on the idea that individual behavioral choices occur in a complex context, the variety
of tobacco cessation and prevention programs in place should be controlled in any
econometric analysis.
In this field, there are two common approaches. First, clinical programs designated to provide
medical treatment for smokers. Second, educational programs aimed to reduce tobacco use
or help people to quit as well as to prevent the initiation of smoking.
3.3.1 Clinical Approaches for Tobacco Cessation
Recently, policy changes have focused on expanding the coverage of tobacco cessation
treatment, financing some cessation medications like nicotine gum and the nicotine patch. In
2011, 68.9% of adult smokers wanted to stop smoking, and 42.7% had made a quit attempt
in the past year. Therefore, as long as states expand the coverage of these treatments, the
motivation for smoking should be negatively affected.
The CDC’s Best Practices 2007 strongly recommended that state action on tobacco use
treatment should include, among other things, expanding services available through
population-based counseling and treatment programs (e.g. cessation quitlines), and covering
treatment and medication for tobacco use under both public and private insurance. The 2010

18
Patient Protection and Affordable Care Act also encourages these policies (Koh and Sebelius,
2010).
3.3.2 Educational Approaches for Tobacco Prevention and Cessation
Educational approaches have long been used in tobacco control to prevent initiation of
tobacco use among youth and young adults, and to promote quitting among adults and youth
(USDHHS, 2000). These kinds of programs received important attention during the 90s and
are typically placed at the state level (CDC, 2007).
All 50 states and the District of Columbia currently have state tobacco control programs.
CDC (2007) claims that states that have made larger investments in comprehensive tobacco
control programs have seen significant declines in cigarette sales, and in the prevalence of
smoking among adults and youth.
3.4 Regulations as a policy tool to control the supply of cigarettes
Although this study is focused on policy interventions affecting the demand for cigarettes,
some factors shaping the supply affect retail prices of cigarettes, which in turn influence
demand.
These factors include particularly either policy interventions oriented to reduce the supply of
tobacco in order to raise tobacco prices (e.g., tobacco price support programs and restrictions
on trade in tobacco and tobacco products), or instrument that address inherent characteristics
of tobacco markets, such as market power and collusive behavior among firms.7
7 The concentration of production among relatively few firms in the cigarette industry has implications for
cigarette pricing, marketing, product development, and other activities. Due to many factors, since the
1980s, the competition within the tobacco industry has decreased, which in turn, should have magnified the
impact that higher cigarette taxes and stronger smoking reduction policies would have on demand.

19
3.4.1 US tobacco support program and quotas
Aimed at stabilizing the price and quantity of tobacco produced, the federal program for
tobacco price supports guarantees floor market prices and establishes marketing quotas. This
combination of regulations on the supply side aims to keep the U.S. tobacco market price
artificially high and above the government support price. That is why these interventions
should also be controlled in this study.
However, tobacco costs are a relatively small component of cigarette prices and it is believed
that the principal beneficiaries of this program are not only the farmers but also the owners
of the tobacco allotments
3.4.2 Trade policy
Policy regulations affecting trade should also be taken into account because they can
influence the supply of tobacco and, thus, can have important effects on tobacco use. Because
U.S. cigarette firms took advantage of the huge growth of world tobacco consumption that
has occurred in the past 30 years, 30 percent of all cigarettes produced in the United States
are exported. While in the 1960s cigarette exports were $24.3 billion per year, in 1996 they
were $250 billion. As a result, the growing international demand contributed to keep
domestic cigarette prices higher than they would be in perfect market competition with a
declining demand.
Summing up, figure no. 1 is a schematic of the factors and relations affecting smoking.
Figure no. 1: Theoretical model

20
IV. Methodology
4.1 Data sources
Four major national surveillance systems evaluate U.S. smoking patterns (see Table no. 1 in
Appendix): the Youth Risk Behavior Surveillance System (YRBSS), the National Survey on
Drug Use and Health (NSDUH), the National Health Interview Survey (NHIS), and the
Behavioral Risk Factor Surveillance (BRFS).
The primary dataset for this study is based upon the Behavioral Risk Factor Surveillance
Survey. This survey was initiated in 1984 by the Centers for Disease Control and Prevention
(CDC) to measure state-specific data on behavioral risk factors linked to chronic diseases,
injuries, and preventable infectious diseases for the non-institutionalized adult population (18
years of age and older) residing in the US. Today, all 50 states, the District of Columbia,
Puerto Rico, and Guam conduct this survey annually. In 2011, more than 500,000 interviews
were conducted by these entities.

21
The study also uses the Tax Burden on Tobacco 2012 Report (Orzechowski and Walker,
2012) for information about cigarettes prices—the key independent variable in my model—
and taxes in each of the states, by year. The 2012 report is the 63rd version of the annual
compendium on tobacco revenue and industry statistics and it is recognized as the definitive
source for tobacco prices and tax information.
In addition, a tertiary source of data, the study uses the State Tobacco Activities Tracking
and Evaluation (STATE) System in order to get information about clean air and sales
regulation policies. The STATE System is an interactive application that houses and displays
current and historical state-level data on tobacco use prevention and control. The STATE
System was developed by the Centers for Disease Control and Prevention in the Office on
Smoking and Health (OSH), National Center for Chronic Disease Prevention and Health
Promotion, and is publicly accessible on line.
4.2 Unit of analysis
Although most of the studies of demand for cigarettes have used aggregate data, the present
uses individual-level data in order to overcome problems inherent in the use of aggregate-
level data.
In effect, varieties of difficulties are encountered when using time series data to estimate
demand for cigarettes. First, in a time-series approach, estimated coefficients of elasticities
are sensitive to the inclusion or exclusion of control variables. Second, a serious problem can
also result from the possibility of high correlations among many of the key factors affecting
smoking, which can generate unstable estimates in the parameters. However, excluding those
factors could produce omitted variable bias problems in the estimation of the impact of the
included variables on the outcome of interest. Third, a time series approach is inclined to

22
provide estimates of the short-run responses of demand to changes in independent variables
rather than long-run responses (Chaloupka and Warner, 1999).
The use of (state) cross-sectional data over time also brings some problems. The most
important one is that when this approach uses data on state taxes paid for cigarette sales, these
data may not accurately reflect average cigarette smoking within the states, due to smuggling
and black market phenomena. Therefore, these sales data are likely to overstate consumption
in low-tax states and understate consumption in high-tax states.
Another problem when using aggregate data, both in time-series and pooled cross-sectional
approaches, derives from the fact that cigarette prices are determined by the interaction of
supply and demand. Ignoring this issue would lead to biased estimates of the price elasticity
of demand.
Finally, studies employing aggregate data generally estimate the effects of prices and other
factors on aggregate or per capita estimates of cigarette consumption. In doing so, they cannot
provide information on the effects of prices and other policies on key outcomes of interest
for policymakers, such as smoking prevalence, initiation, cessation, or quantity and type of
cigarette smoked.
Using individual-level data—typically self-reported measures of smoking prevalence and
average cigarette consumption—from different surveys to estimate price elasticities of
cigarette demand helps to overcome these problems. First, because an individual smoker’s
decisions are too small to affect the market price of cigarettes, the potential simultaneity bias
that appears when using aggregated data is avoided. Second, the use of individual-level data
allows analysis to distinguish between the effects of key factors on two important and
different outcome of interests: whether to smoke or not (smoking prevalence) and how many
cigarettes to smoke (smoking intensity). Third, individual-level data allow us to evaluate the

23
effects of key factors on the attempts made for smoking cessation, beyond whether these
attempts were successful or not. Finally, this level of data analysis allows analysis to
differentiate the differential price and regulations responsiveness of various socioeconomic
and demographic groups.
However, the use of individual-level data is not free from other problems. Individual-level
data may present ecological bias when omitted variables affecting tobacco use are correlated
with the factors controlled in the model. The most important factor which is commonly
omitted is unobserved attitudes against, or risk perception, associated with smoking, which
might affect both cigarette consumption and the impact of prices and regulations on that
consumption.
Furthermore, individual-level data might have reporting biases. However, works using
individual-level data have commonly assumed that underreporting of true consumption is
randomly and proportionally produced. If this assumption holds, price and regulation
responsiveness estimates will not be systematically biased.
Finally, when using individual-level data, it is still important to control for smuggling and
price avoidance behaviors such as cross-border shopping in response to interstate price
differentials.
4.3 The dataset
4.3.1 Dependent variables
The study has three outcomes of interest and, thus, it uses three different dependent variables
for measuring those outcomes: the number of people smoking (smoking prevalence), the
number of cigarettes smoked by smokers (smoking intensity), and the attempt to quit
(smoking cessation).

24
While the way to describe the prevalence of cigarette smoking is being a current smoker,
“current smoker” is defined in different ways.8 BRFS measures smoking status by asking
whether the respondent now smokes cigarettes every day, now smokes some days, is a former
smoker or never has been a smoker. For this study, I transform this variable into a dummy
variable—“Smoker”—equal to 1 if the respondent now smokes either every day or
sometimes, and equal to 0 if now he or she has stopped smoking or has never been a smoker.
The “smoker” variable has the following categories, values, and statistics (for distribution by
year, see Graph no. 3 in Appendix):
Table no. 2: Categories, values, and statistics for “Smoker”
Value Description Freq. Percent Cum.
0 Now, does not smoke at all 2,853,521 79.97 79.97
1 Smoke every or some days 714,859 20.03 100.00
Total 3,568,380 100.00
The same problem arises in defining smoking intensity.9 In this case, BRFS asks if the
respondent now smokes cigarettes every day, some days, or not at all. In this study, I use this
answer to create a dummy variable—“Smokinginten”—equal to 1 if the respondent currently
smokes sometimes (casual smoker), and equal to 0 if the respondent smokes now every day
(regular smoker). This way of measuring intensity has pros and cons. While it allows
reducing underreporting bias, it produces a less precise measure for evaluating the impact of
the key independent variables.
8 For instance, NHIS defines current smoking among adults as having smoked at least 100 cigarettes during one’s lifetime and smoking every day or some days. NSDUH and YRBSS define current smoking as smoking on at least 1 cigarette a day during the 30 days before the survey. 9 For instance, NSDUH defines daily cigarette smoking as smoking on all 30 days of the previous month, whereas casual smoking is defined as smoking in the past 30 days, but not daily, among current smokers.

25
The “smokinginten” variable has the following categories, values, and statistics (for
distribution by year, see Graph no. 4 in Appendix):
Table no. 3: Categories, values, and statistics for “Smokinginten”
Value Description Freq. Percent Cum.
0 Regular: respondent smoke every day 606,709 75.59 75.59
1 Casual smoker: respondent smokes some days 195,913 24.41 100.00
Total 802,622 100.00
This study also uses the variable “Smokenum” for measuring the number of cigarettes that a
current smoker consumes per day. BRFS generates this variable by asking about how many
cigarettes a day the respondent now smokes on the average. As a result, the inverse pros and
cons of the former variable appear in this way of measuring smoking intensity. While this
alternative is more precise in measuring the impact of prices and regulations on the intensity
of consumption, the potential bias associated with self-report arises.
Due to these pros and cons, this study presents two different measures of the outcome of
interest: the propensity for being a casual versus a regular smoker (“Smokinginten”) and the
number of cigarettes smoked in the past 30 days (“Smokenum”).
The “Smokenum” variable has the following categories, values, and statistics (for
distribution by year, see Graph no. 5 in Appendix):
Table no. 4: Categories, values, and statistics for “Smokenum”
Variable Obs Mean. Std. Dev. Min. Max
smokenum 183,292 19.35397 12.25124 1 99
Finally, for estimating the impact of key independent variables on smoking cessation, this
study uses the binary variable “Stopsmk,” equal to 1 if, during the past 12 months, the

26
respondent has stopped smoking for one day or longer because he or she was trying to quit
smoking, and 0 otherwise.
The “Stopsmk” variable has the following categories, values, and statistics (for distribution
by year, see Graph no. 6 in Appendix):
Table no. 5: Categories, values, and statistics for “Stopsmk”
Value Description Freq. Percent Cum.
0 No, during the past 12 months, the respondent has
not tried to stop smoking 349,747 46.80 46.80
1 Yes, during the past 12 months, the respondent
has stopped smoking for one day or longer
because he or she was trying to quit smoking
397,616
53.20
100.00
Total 747,363 100.00
4.3.2 Key independent variable I: Prices
The first key independent variable—“CIGPRICE”—is the weighted average retail price per
package of 20 cigarettes (full-priced brands) measured in cents at a specific time, November
1st of each year, and in each of the states and the District of Columbia. These prices include
federal and state excise taxes but do not include municipal cigarette taxes and the sales taxes.
Unlike most of the studies in this field that have used cigarette taxes as the key independent
variable, I use the weighted average price of a cigarette package for an important reason: this
measure reflects not only the cigarette tax policy but also all other policies affecting the
cigarette price, such as the US Tobacco Support Program, quotas, and US trade policy
affecting cigarette prices. Additionally, it allows measuring the interaction of all these
policies with the oligopolistic structure of the industry and its consequence on cigarette
prices.
Therefore, by using this key independent variable, the model estimates the price
responsiveness of demand, rather than the effects of taxation on the outcomes of interest.

27
However, given the fact that, on average, federal and state excise taxes account for 44.3
percent of the retail price of cigarettes, most of that responsiveness will be due to cigarette
tax policy. But I will control the rest of the factors affecting prices.
The “CigPrice” variable has the following statistics (for distribution by year and state, see
Graph no. 7 in Appendix):
Table no. 6: Statistics for “CigPrice”
Variable Obs Mean. Std. Dev. Min. Max
CigPrice 3,638,542 432.9853 143.256 142.4 1006.1
4.3.3 Key independent variables II: Regulations
U.S. clean air policies are measured by the following set of ordinal variables:
- “air_bar”: regulations for smoking in stand-alone establishments that primarily serve
alcohol for consumption on the premises;
- “air_restau”: regulations for smoking in establishments that serve food for
consumption on the premises. Restaurants include patron areas, bar areas, and
employee areas;
- “air_mall”: regulations for smoking in retail or professional establishments connected
by public walkways or hall areas where goods and services are sold to the public;
- “air_gov”: regulations for smoking in work areas that are owned, leased, or operated
by the state;
- “air_priv”: regulations for smoking in private places of work other than a building
leased, owned, or operated by the state;

28
- “air_pt”: regulations for smoking in public conveyance, including aircraft, buses,
passenger cars, subways, trains, transit vehicles, any other vessels or vehicles used
by the public, or in a station or terminal for operating those.
All these variables measure state legislation on this subject and do not capture either local or
federal rules restricting smoking. Time fixed effects control all federal regulations on this
subject that were in place during the period of analysis.
The clean air policy variables have the following categories, values, and statistics:
Table no. 7a: Categories, values, and statistics for “Air_Restaur,” “Air_Bar,” and
“Air_Malls”
Value
Category
Air_Restau Air_Bar Air_Malls
Freq. Percent Cum. Freq. Percent Cum. Freq. Percent Cum.
0
No smoking
restrictions 1,107,647 31.18 31.18 2,600,366 72.18 72.18 2,131,169 59.44 59.44
1
Designated smoking areas
required or allowed
1,303,226 36.68 67.86 194,774 5.41 77.59 467,931 13.05 72.49
2
Designated smoking areas
allowed if separately ventilated
181,413 5.11 72.97 127,357 3.54 81.12 159,347 4.44 76.94
3
Smoke-free: no smoking allowed
at all 960,369 27.03 100.00 680,109 18.88 100.00 826,833 23.06 100.00
Total
3,552,655 100.00 3,602,606 100.00 3,585,280 100.00
Table no. 7b: Categories, values, and statistics for “Air_Priv,” “Air_Pt,” and
“Air_Gov”
Value
Category
Air_Priv Air_Pt Air_Gov
Freq. Percent Cum. Freq. Percent Cum. Freq. Percent Cum.
0 No smoking restrictions
1,489,213 41.76 41.76 632,734 17.88 17.88 460,631 12.87 12.87
1
Designated smoking areas
required or allowed
961,440 26.96 68.73 1,027,634 29.05 46.93 1,316,854 36.78 49.64
2
Designated smoking areas
allowed if separately ventilated
169,375 4.75 73.48 126,476 3.57 50.51 258,717 7.23 56.87

29
3
Smoke-free: no smoking allowed
at all
945,783 26.52 100.0
0 1,751,044 49.49 100.00 1,544,295 43.13 100.00
Total
3,565,811 100.00 3,537,888 100.00 3,580,497 100.00
The regulations for restricting the access to cigarettes are measured by the binary variable
“salesreg”, equal to 1 if the state has a provision in the statutes clearly stating that any person
engaged in the business of selling tobacco products over-the-counter directly to a consumer
or through vending machines must obtain a license or permit prior to conducting business,
and 0 otherwise. Time fixed effects control all federal regulations on this subject that were
in place in the period of analysis.
The “salesreg” variable have the following categories, values, and statistics:
Table no. 8: Categories, values, and statistics for “salesreg”
Value Description Freq. Percent Cum.
0 Retail License is not required 1,092,039 30.84 30.84
1 Retail License is required 2,449,079 69.16 100.00
Total 3,541,118 100.00
The regulations for restricting the cigarette advertising and promotion activities are measured
by the binary variable “advreg”, equal to 1 if the state has any legislative provision restricting
the advertising of tobacco products (the restrictions may include limitations on billboards, on
proximity to schools and churches, and on advertising on public transportation), and 0
otherwise. The variable only capture state regulations on this issue; thus, it does not measure
local restrictions. Time fixed effects control all federal regulations on this subject that were
in place in the period of analysis. The “advreg” variable has the following categories, values,
and statistics:
Table no. 9: Categories, values, and statistics for “advreg”

30
Value Description Freq. Percent Cum.
0 The law does not state that there are restrictions
related to the advertising of tobacco products
2,355,279 65.38 65.38
1 The law states that there are restrictions related to
the advertising of tobacco products
1,247,327 34.62 100.00
Total 3,602,606 100.00
4.3.4 Key independent variables III: Treatment and Prevention Programs
Treatment and prevention programs designated to reduce smoking prevalence and intensity
or promote smoking cessation, are measured by two variables: “TreatCov” and “fund.”
“TreatCov” is an ordinal variable that measures the scope of the Medicaid Coverage of
Medication for Cessation Treatments. This variable has the following categories, values, and
statistics:
Table no. 10: Categories, values, and statistics for “TreatCov”
Value Description Freq. Percent Cum.
0 No full access coverage 1,164,808 32.33 32.33
1
Coverage to 1 medication (among Nicotine patch, Nicotine gum, Nicotine nasal spray, Nicotine inhaler, Bupropion)
160,391 4.45 36.78
2
Coverage to 2 medications (among Nicotine patch, Nicotine gum, Nicotine nasal spray, Nicotine inhaler, Bupropion)
107,441 2.98 39.77
3
Coverage to 3 medications (among Nicotine patch, Nicotine gum, Nicotine nasal spray, Nicotine inhaler, Bupropion)
600,288 16.66 56.43
4
Coverage to 4 medications (among Nicotine patch, Nicotine gum, Nicotine nasal spray, Nicotine inhaler, Bupropion)
134,944 3.75 60.18
5
Coverage to 5 or more medications (among Nicotine patch, Nicotine gum, Nicotine nasal spray, Nicotine inhaler, Bupropion)
1,434,734 39.82 100.00
TOTAL 3,602,606 100.00
“Fund” is a continuous variable measuring the total funds in US dollars per capita, allocated
for tobacco control programs annually. Per capita data were calculated by dividing total
tobacco control funds by U.S. census population estimates for corresponding years. This
variable has the following statistics:
Table no. 11: Statistics for “fund”

31
Variable Obs Mean. Std. Dev. Min. Max
fund 3,602,606 2.738191 2.833707 0 15.32
4.3.5 Control variables
The set of control variables are the following:
- “a_ageg5yr” is an ordinal variable comprised of fourteen-level age categories. The
categories, values, and statistics are the following:
Table no. 12: Categories, values, and statistics for “a_ageg5yr”
Value Value Label Freq. Percent Cum.
1 Age 18 to 24 195,324 5.27 5.27
2 Age 25 to 29 233,632 6.30 11.56
3 Age 30 to 34 295,154 7.96 19.52
4 Age 35 to 39 343,490 9.26 28.78
5 Age 40 to 44 365,812 9.86 38.64
6 Age 45 to 49 382,172 10.30 48.94
7 Age 50 to 54 385,057 10.38 59.32
8 Age 55 to 59 354,606 9.56 68.88
9 Age 60 to 64 310,465 8.37 77.25
10 Age 65 to 69 265,599 7.16 84.41
11 Age 70 to 74 217,887 5.87 90.28
12 Age 75 to 79 173,269 4.67 94.95
13 Age 80 or older 187,319 5.05 100.00
TOTAL 3,709,786 100.00
- “male” is a binary variable that indicates sex of the respondent, equal to 1 if the
respondent is a man, and 0 otherwise.
Table no. 13: Categories, values, and statistics for “male”
Value Description Freq. Percent Cum.
0 Women 2,214,506 59.69 59.69
1 Men 1,495,280 40.31 100.00
Total 3,709,786 100.00

32
- “race3” is a categorical variable grouping the race-ethnicity of respondents. The
categories and values are the following:
Table no. 14: Categories, values, and statistics for “race3”
Value Value Label Freq. Percent Cum.
1 White only, non-Hispanic 2,945,064 79.41 79.41
2 Black only, non-Hispanic 297,995 8.03 87.44
3 Asian only, non-Hispanic 83,015 2.24 89.68
4 Native Hawaiian or other Pacific Islander only, Non-Hispanic 11,915 0.32 90.00
5 American Indian or Alaskan Native only, Non-Hispanic 59,948 1.62 91.62
6 Other race only, non-Hispanic 33,098 0.89 92.51
7 Multiracial, non-Hispanic 59,669 1.61 94.12
8 Hispanic 218,093 5.88 100.00
3,708,797 100.00
- “income3” is an ordinal variable measuring the respondent’s income level. The
categories and values are the following:
Table no. 15: Categories, values, and statistics for “income3”
Value Value Label Freq. Percent Cum.
1 Less than $10,000 231,945 6.30 6.30
2 Less than $15,000 ($10,000 to less than $15,000) 235,503 6.40 12.69
3 Less than $20,000 ($15,000 to less than $20,000) 306,130 8.31 21.01
4 Less than $25,000 ($20,000 to less than $25,000) 376,869 10.23 31.24
5 Less than $35,000 ($25,000 to less than $35,000) 519,405 14.10 45.34
6 Less than $50,000 ($35,000 to less than $50,000) 626,133 17.00 62.35
7 Less than $75,000 ($50,000 to less than $75,000) 606,092 16.46 78.81
8 $75,000 or more 780,478 21.19 100.00
TOTAL 3,682,555 100.00
- “educa” is an ordinal variable that measures educational level by asking what is the
highest grade or year of school the respondent completed. The categories and values
are the following:
Table no. 16: Categories, values, and statistics for “educa”

33
Value Value Label Freq. Percent Cum.
1 Never attended school or only kindergarten 5,860 0.16 0.16
2 Grades 1 through 8 (Elementary) 122,341 3.30 3.46
3 Grades 9 through 11 (Some high school) 243,874 6.58 10.03
4 Grade 12 or GED (High school graduate) 1,127,460 30.40 40.43
5 College 1 year to 3 years (Some college or technical school) 1,009,062 27.21 67.64
6 College 4 years or more (College graduate) 1,200,172 32.36 100.00
TOTAL 3,708,769 100.00
- “employ” is a categorical variable that measures the respondent’s current
employment status. The categories and values are the following:
Table no. 17: Categories, values, and statistics for “employ”
Value Value Label Freq. Percent Cum.
1 Employed for wages 1,874,117 50.54 50.54
2 Self-employed 333,676 9.00 59.53
3 Out of work for more than 1 year 67,493 1.82 61.35
4 Out of work for less that 1 year 92,345 2.49 63.84
5 A homemaker 272,337 7.34 71.19
6 A student 78,405 2.11 73.30
7 Retired 787,964 21.25 94.55
8 Unable to work 202,183 5.45 100.00
TOTAL 3,708,520 100.00
- “marital” is a categorical variable that measures the respondent’s current marital
status. The categories and values are the following:
Table no. 18: Categories, values, and statistics for “marital”
Value Label Value Freq. Percent Cum.
Married 1 2,067,251 55.73 55.73
Divorced 2 537,214 14.48 70.22
Widowed 3 410,678 11.07 81.29
Separated 4 90,158 2.43 83.72
Never married 5 511,748 13.80 97.52
A member of an
unmarried couple
6 92,090 2.48 100.00
TOTAL 3,709,139 100.00

34
4.4 Empirical strategy and models
4.4.1 Empirical strategy
The strategy for identification of the impact of prices and regulations on the three outcomes
of interest—smoking prevalence, smoking intensity, and smoking cessation—is based on the
analysis of a pooled cross-sectional time series (1993-2010) dataset, using State (states) and
time (years) fixed effects.
This strategy allows the study to take advantage of the described characteristics of the dataset.
This dataset presents: i) a sharp variation in the outcomes of interest—smoking prevalence
and smoking intensity—over the time period of analysis and across the states; ii) a wide range
of cigarette retail prices by state, which also changed differentially during the period of
analysis; iii) a deep variation, across the states and over time, of the other factors (regulations
and interventions) affecting the outcomes of interest; iv) cross-sectional and time variations
of the control variables. Given these dataset features, the pooled cross-sectional time series
strategy is best for identification of causality between price and regulations and smoking.
Additionally, this strategy allows us to control unobserved variables the differ from one state
to other (e.g., attitudes towards tobacco use), but do not change over time, and factors that
vary over time (e.g., a variety of federal tobacco regulations), but do not vary across the
states. Controlling for these observed and unobserved variables will allow us to estimate
unbiased coefficients of the independent variables.
4.4.2 Models
The study specifies the following models for estimating the coefficient of the impact of prices
and regulations on the outcomes of interest in Stata13.
- Model for smoking prevalence

35
For calculating the impact on the prevalence rate, the study uses a linear probability model
(LPM) with State (states) and time (years) fixed effects. The specification of the model is
the following:
(1) P(Smoker=1)ijt = βo + β1CigPrice-jt + β2X-ijt + β3Z-jt + β4W-jt + δ-j + γ-t
j=1,…., j (States);
t=1,….,t (1996-2010);
Y is the binary variable described in section 4.3.1, observed in state j at each t year;
CigPrice is the continues variable describe in section 4.3.2, observed in state j at each t year;
X is a vector of the demographic variables described in section 4.3.5, observed in state j at
each t year;
Z is the set of air clean policies as well as the regulations on sales and advertising, all
described in section 4.3.3, observed in state j at each t year;
W are the two variables measuring treatment and prevention programs described in section
4.3.4, observed in state j at each t year;
δ and γ are state and time fixed effects respectively.
- Model for smoking intensity I
For calculating the impact on the intensity rate, the study uses two different dependent
variables and two different models. The first dependent variable is “Smokinginten” and the
model is a LPM with State (states) and time (years) fixed effects. The specification of the
model is the following:
(2) P(Smokinginten=1)ijt = βo + β1CigPrice-jt + β2X-ijt + β3Z-jt + β4W-jt + δ-j + γ-t
j=1,…., j (States);

36
t=1,….,t (1998-2010);
Y is the binary variable described in section 4.3.1, observed in state j at each t year;
CigPrice is the continues variable describe in section 4.3.2, observed in state j at each t year;
X is a vector of the demographic variables described in section 4.3.5, observed in state j at
each t year;
Z is the set of air clean policies as well as the regulations on sales and advertising, all
described in section 4.3.3, observed in state j at each t year;
W are the two variables measuring treatment and prevention programs described in section
4.3.4, observed in state j at each t year;
δ and γ are state and time fixed effects respectively.
- Model for smoking intensity II
The second dependent variable used for measuring the outcome of interest is the continuous
“Smokenum.” This study uses two different models. The first one a LPM with State (states)
and time (years) fixed effects, which specification is the following:
(3) Smokenum-ijt = βo + β1CigPrice-jt + β2X-ijt + β3Z-jt + β4W-jt + δ-j + γ-t
j=1,…., j (States);
t=1,….,t (1993-2000);
Y is the continues variable described in section 4.3.1, observed in state j at each t year;
CigPrice is the continues variable describe in section 4.3.2, observed in state j at each t year;
X is a vector of the demographic variables described in section 4.3.5, observed in state j at
each t year;

37
Z is the set of air clean policies as well as the regulations on sales and advertising, all
described in section 4.3.3, observed in state j at each t year;
W are the two variables measuring treatment and prevention programs described in section
4.3.4, observed in state j at each t year;
δ and γ are state and time fixed effects respectively.
- Model for smoking intensity III
The study performs an alternative model for estimating the impact of prices and regulations
on “Smokenum.” This second model is a negative binominal count model (NBM), with State
(states) and time (years) fixed effects. Given the frequency distribution of “Smokenum” (see
Graph no. 8 in Appendix), the NBM is an accurate approach for modeling over-dispersion in
count data.10 The specification of the model is the following:
(4) NB~Smokenum-ijt = βo + β1CigPrice-jt + β2X-ijt + β3Z-jt + β4W-jt + δ-j + γ-t
j=1,…., j (States);
t=1,….,t (1993-2000);
Y is the continues variable described in section 4.3.1, observed in state j at each t year;
CigPrice is the continues variable describe in section 4.3.2, observed in state j at each t year;
X is a vector of the demographic variables described in section 4.3.5, observed in state j at
each t year;
Z is the set of air clean policies as well as the regulations on sales and advertising, all
described in section 4.3.3, observed in state j at each t year;
10 The NBM is a natural and more flexible extension of the Poisson that adds a multiplicative random to Poisson distribution to represent unobserved heterogeneity.
38
W are the two variables measuring treatment and prevention programs described in section
4.3.4, observed in state j at each t year;
δ and γ are state and time fixed effects respectively.
- Model for smoking cessation
Finally, for estimating the impact of the key independent variables on smoking cessation, the
study uses a LPM, with State (states) and time (years) fixed effects. The specification of the
model is the following:
(5) P(Stopsmk=1)ijt = βo + β1CigPrice-jt + β2X-ijt + β3Z-jt + β4W-jt + δ-j + γ-t
j=1,…., j (States);
t=1,….,t (1993-2010);
Y is the binary variable described in section 4.3.1, observed in state j at each t year;
CigPrice is the continues variable describe in section 4.3.2, observed in state j at each t year;
X is a vector of the demographic variables described in section 4.3.5, observed in state j at
each t year;
Z is the set of air clean policies as well as the regulations on sales and advertising, all
described in section 4.3.3, observed in state j at each t year;
W are the two variables measuring treatment and prevention programs described in section
4.3.4, observed in state j at each t year;
δ and γ are state and time fixed effects respectively.

39
V. Results
5.1 Smoking prevalence
5.1.1 Price responsiveness
Table no. 19 presents results for the full sample—persons aged above 18—and for different
subgroups. The LPM estimates related to the probability of being a smoker are listed in
columns 1 through 4. The estimates were obtained using a two way fixed effects model
controlling for state and year effects.
The estimate in column 1 shows that the linear impact of the weighted average of the cigarette
package price (CigPrice) is associated with a small decrease in the probability of being a
smoker: the marginal effect of a $1 increase in the price of a cigarette package is associated
with a -0.00003, or 0.3 percentage point reduction in the probability of being smoker.
The implied elasticity, shown in column 2, is -0.061. This coefficient means that a 10%
increase in the price of a cigarette package is associated with a 0.6% decrease in the
probability of being a smoker. The coefficient of semi-elasticity presented in column 4
indicates that a $1 increase in a cigarette package is associated with a 0.014% decrease in the
probability of being a smoker.
Controlling for age. When controlling for age, the price elasticity presented in column 2 of
people aged 25 to 29 is slightly smaller than the coefficient for the overall population: -0.045,
which means that, for this group, a 10% increase in the price of a cigarette package is
associated with a 0.45% reduction in the probability of being smoker. In the case of people
aged 70 to 74, the elasticity is -0.12, which means that a 10% increase in the price of a
cigarette package is associated with a 1.2% reduction in the probability of being smoker.
40
According to this model, the price elasticity for this group of people is around twice the
elasticity of the overall population.
Controlling for income. Another important control factor is income. The price elasticity
presented in column 2 for people with annual income of $10,000 to $15,000 is equal to the
elasticity shown for people aged 25 to 29 (-0.045), which means that a 10% increase in the
price of a cigarette package is associated with a 0.45% reduction in the probability of being
smoker. In the case of people reporting annual incomes above $75,000, the price elasticity is
-0.122, which shows that a 10% increase in the price of a cigarette package is associated with
a 1.22% reduction in the probability of being smoker. According to this model, the price
elasticity for this group of people is around twice the elasticity of the overall population.
Controlling for education. Finally, when estimating by educational level achieved, the price
elasticity of people with only elementary education is -0.058, which means that a 10%
increase in the price of a cigarette package is associated with a 0.58% reduction in the
probability of being smoker. In the case of people with the educational attainment of college
graduate or more, the price elasticity is -0.124, which means that a 10% increase in the price
of a cigarette package is associated with a 1.24% reduction in the probability of being smoker.
According to this model, the price elasticity for people with the highest educational level
achieved is around twice the elasticity of the overall population.
In sum, the price elasticity for smoking prevalence is quiet small, and age, income, and
education have a positive relation with the price of a cigarette package.
5.1.2 Regulations responsiveness
The impact of regulations on the probability of being a smoker is surprising. Although the
conventional wisdom suggests that regulations have played a key role in reducing cigarette

41
consumption, the results presented in column 4 indicate that all the semi-elasticity
estimations11 of the regulations and programs observed in this linear model, setting these
regulations at their highest value, do not have statistical significance. In other words, we
cannot reject the null hypothesis that establishing a smoking ban in those sites and adopting
sales and advertising regulations have not impact on the probability of being smoker.
Interestingly, establishing a smoking ban in restaurants and private worksites, and adopting
advertising and sales regulations would have a counter-intuitive impact on the probability of
being smoker. Adopting a smoking ban in restaurants and private worksite is associated with
0.008% and 0.028% increase in the probability of being smoker, respectively. In the same
sense, sales and advertising regulations have a semi-elasticity of 0.026 and 0.0026,
respectively.
Finally, the implementation of prevention and tobacco control programs at state levels would
not have any impact on the probability of being smoker. The margin and elasticity estimations
of “fund” have not statistical significance at conventional levels. That means that we cannot
reject the null hypothesis that increasing the per capita funds to control program has not
impact on the probability of being smoker.
Therefore, according to this linear model, different types of regulations and programs
implemented between 1996 and 2010 to control the demand for cigarettes have no impact on
the reduction of the probability of being smoker.
5.2 Smoking intensity #1: intensity propensity (Smokinginten)
5.2.1 Price responsiveness
11 They are calculated as the impact on the probability of being a smoker of a discrete change from 0 to the highest value of each variable.

42
The first approach used to estimate the impact of prices and regulations on smoking
intensity—the propensity of being a casual versus a daily smoker—was a linear model,
controlling for state and year effects. Table no. 20 presents results for the full sample—
persons aged above 18—and for different subgroups. The LPM estimates related to the
probability of being a smoker are listed in columns 1 through 4.
The estimate in column 1 shows that the linear impact of the weighted average of the cigarette
package price (CigPrice) is associated with a small decrease in the probability of being a
casual smoker: the marginal effect of a $1 increase in the price of a cigarette package is
associated with a -0.006, or 0.6 percentage point reduction in the probability of being a casual
smoker.
The implied elasticity, shown in column 2, is 0.107. This coefficient means that a 10%
increase in the price of a cigarette package is associated with a 1.07% increase in the
probability of being a casual smoker. The coefficient of semi-elasticity presented in column
4 indicates that a $1 increase in the price of a cigarette package is associated with a 0.02%
decrease in the probability of being a casual smoker.
Controlling for age. When controlling for age, the price elasticity presented in column 2 for
people aged 25 to 29 is slightly smaller than the coefficient for the overall population: 0.089,
which means that a 10% increase in the price of a cigarette package is associated with a
0.89% increase in the probability of being a casual smoker. In the case of people aged 70 to
74, the elasticity is 0.113, which means that a 10% increase in the price of a cigarette package
is associated with a 1.13% increase in the probability of being a casual smoker. According to
this model, the price elasticity for this group of people is close to that of the overall
population.

43
Controlling for income. Another important control factor is income. The price elasticity
presented in column 2 for people with annual income of $10,000 to $15,000 is 0.115, which
means that a 10% increase in the price of a cigarette package is associated with a 1.15 %
increase in the probability of being a casual smoker. In the case of people reporting annual
incomes above $75,000, the price elasticity is smaller, 0.089, which means that a 10%
increase in the price of a cigarette package is associated with a 0.89% increase in the
probability of being a casual smoker.
Controlling for education. Finally, when estimating by educational level achieved, the price
elasticity of people with only elementary education is 0.11, which means that a 10% increase
in the price of a cigarette package is associated with a 1.1% increase in the probability of
being a casual smoker. In the case of people with educational attainment of college graduate
or more, the price elasticity is 0.08, which means that a 10% increase in the price of a cigarette
package is associated with a 0.8% increase in the probability of being a casual smoker.
According to this model, the price elasticity for people with the highest educational level
achieved is slightly smaller than the elasticity for the overall population.
Comparing these estimates with the effect on smoking prevalence, the impact of a cigarette
price on the probability of being a casual smoker is higher than the impact on the probability
of being a smoker. That would suggest the increasing prices would have more impact on
smoking intensity than on smoking prevalence. Additionally, unlike prevalence, the price
elasticity estimates for different subgroups of age, income, and education are very close,
suggesting that the price responsiveness is very similar across social groups.
5.2.2 Regulations responsiveness
The impact of regulations on the probability of being a casual smoker is also surprising.
Although the conventional wisdom suggests that regulations have played a key role in
44
reducing cigarette consumption, the results presented in column 4 indicate that the entire set
of price semi-elasticity estimations for regulations, established at their highest levels,
observed in this linear model lacks statistical significance. Therefore, we cannot reject the
null hypothesis that the different types of regulations implemented to reduce the consumption
of cigarettes would not have impact on the reduction of the probability of being a casual
smoker, between 1998 and 2010.
Interestingly, regardless bars, governmental worksites, and public transportation, all
regulations establishing a smoking ban have a contra-intuitive impact on the probability of
being a casual smoker. Adopting a smoking ban in these places is associated with decrease
in the probability of being a casual smoker. The same relation is found in advertising and
sales regulations.
Finally, the implementation of prevention and tobacco control programs at state levels would
not have any impact on the probability of being smoker. The margin and elasticity estimations
of “fund” have not statistical significance at conventional levels. That means that we cannot
reject the null hypothesis that increasing the per capita funds to control program has not
impact on the probability of being a casual smoker.
Therefore, according to this linear model, different types of regulations and programs
implemented between 1998 and 2010 to control the demand of cigarette would not have
impact on the reduction of smoking intensity, measured by the propensity of being a casual
smoker among smokers.
5.3 Smoking intensity #2: number of cigarettes smoked (Smokenum)
5.3.1 Price responsiveness

45
An alternative approach used in this study to estimate the impact of prices and regulations on
smoking intensity is using a continuous variable to measure the average number of cigarettes
smoked per day, reported by each respondent in the survey.
Table no. 21 shows the results, for the full sample—persons aged above 18—and for different
subgroups, of the two models used for measuring the impact of prices and regulations on that
outcome of interest. Column 1 through 4 show the results of the LPM, whereas columns 5
through 8 present estimates of the NBM. Both models control state and years effects.
As it was supposed, most of the margin and elasticity estimates for the key independent and
control variables are not statistical significant in the LPM, whereas the NBM generates
estimates with statistical significance at conventional levels. Additionally, many coefficients
for regulations cannot be calculated under the LPM, while they are obtained in the NBM with
statistical significance at conventional levels. For these reasons, only the results of the NBM
are presented and analyzed below.
The estimate in column 5 shows that the increase of the weighted average price of cigarette
packages (CigPrice) is associated with a small reduction in the number of cigarettes smoked
per day. The marginal effect of a $1 increase in the price of a cigarette package is associated
with a coefficient of -0.0004.
The implied elasticity, shown in column 6, is -0.07. This coefficient means that a 10%
increase in the price of a cigarette package is associated with a 0.7% decrease in the number
of cigarettes smoked per day. The coefficient of semi-elasticity presented in column 7
indicates that a 10% increase in the price of a cigarette package is associated with a reduction
of 0.1 cigarette smoked per day.

46
Controlling for age. When controlling for age, the price elasticities presented in column 6
show that there is almost no difference between people aged 25 to 29 and people aged 70 to
74. While the first group has a price elasticity of -0.072, which means that a 10% in the price
of a cigarette package is associated with a 0.7% reduction in the number of cigarette smoked
per day, the second group has a price elasticity of 0.065.
Controlling for income. The same pattern appears when controlling for income. While the
price elasticity shown in column 6 for people with annual income of $10,000 to $15,000 is -
0.066, which means that a 10% increase in the price of a cigarette package is associated with
a 0.7% reduction in the number of cigarettes smoked per day, the price elasticity for people
reporting annual incomes above $75,000 is -0.07.
Controlling for education. Similarly, when estimating by educational level achieved, the
price elasticity of people with only elementary education is -0.061, which means that a 10%
increase in the price of a cigarette package is associated with a 0.61% reduction in the number
of cigarettes daily smoked, people with educational attainment of college graduate or more
have a price elasticity of -0.071.
5.3.2 Regulations responsiveness
The NBM returns more statistically significant coefficient for regulations than the LPM.
However, as shown in column 8, advertising regulations, with a semi-elasticity of -0.013,
and smoking bans in private worksites, with a semi-elasticity of -0.022, have a very small
but inverse relation with the number of cigarettes smoked per day. In the cases of
governmental worksites, malls, and public transportation, the smoking bans are associated
with an increase in the number of cigarettes smoked per day.
47
Finally, the implementation of prevention and tobacco control programs at state levels would
not have any impact on the number of cigarettes smoked in a month. Particularly, the margin
and elasticity estimations of “fund” have not statistical significance at conventional levels.
That means that we cannot reject the null hypothesis that increasing the per capita funds to
control program has no impact on the number of cigarettes smoked per day.
Accordingly, between 1993 and 2000, different types of regulations and programs
implemented at state level to control the demand for cigarette had very little impact, no
impact, and/or an unintended impact on the number of cigarettes smoked daily by a smoker.
Comparing these estimates with the effects on the propensity of being a casual or a daily
smoker, the price elasticity estimates are very close. Yet, three types of regulations would
play a statistically significant role on reducing the smoking intensity measured by the number
of cigarettes daily smoked, whereas no regulations play that role in regard to the propensity
of being a casual smoker.
5.4 Smoking cessation
5.4.1 Price responsiveness
The final approach for studying the effects of the key independent variables observed by this
study on smoking is considering the probability of having attempted to quit smoking in the
past 12 months as the dependent variable.
For addressing whether prices and regulations have played a role in promoting smoking
cessation, the study estimates a linear model, controlling for state and year effects, to
calculate the propensity of having attempted to quit in the past 12 months. Table no. 22
presents results for the full sample—persons aged above 18—and for different subgroups.
The LPM estimates related to that propensity are listed in columns 1 through 4.
48
The estimate in column 1 shows that an increase in the weighted average of the price of a
cigarette package (CigPrice) is associated with a small increase in the probability of having
attempted to quit smoking in the past 12 months: the marginal effect of a $1 increase in the
price of a cigarette package is associated with a -0.009, or 0.9 percentage points increase in
that probability.
The implied elasticity, shown in column 2, is 0.074. This means that a 10% increase in the
price of a cigarette package is associated with a 0.74% increase in the probability of having
attempted to quit smoking in the past year. The coefficient of semi-elasticity presented in
column 4 indicates that a $1 increase in the price of a cigarette package is associated with a
0.017% increase in the probability of having tried to quit smoking in the past year.
Controlling for age. When controlling for age, the price elasticity presented in column 2 for
people aged 25 to 29 is smaller than the coefficient for the overall population: 0.061, which
means that a 10% increase in the price of a cigarette package is associated with a 0.61%
increase in the probability of having attempted to quit smoking in the past 12 months. In the
case of people aged 70 to 74, the elasticity is 0.087, which means that a 10% increase in the
price of a cigarette package is associated with a 0.87% increase in the probability of having
attempted to quit smoking in the past year. According to this model, the impact of a price
increase on the probability of attempted cessation is slightly higher in elders than in young
people.
Controlling for income. Another important control factor is income. The price elasticity
presented in column 2 for people with annual income of $10,000 to $15,000 is 0.07, which
means that a 10% increase in the price of a cigarette package is associated with a 0.7 %
increase in the probability of having attempted to quit smoking in the past 12 months. In the
case of people reporting annual incomes above $75,000, the price elasticity is smaller, 0.082,

49
which means that a 10% increase in the price of a cigarette package is associated with a
0.82% increase in the probability of having attempted to quit smoking in the past year.
Therefore, the price responsiveness for cessation would be higher at higher incomes.
Controlling for education. Finally, when estimating by educational level achieved, the price
elasticity for people with only elementary education is 0.07, which means that a 10% increase
in the price of a cigarette package is associated with a 0.7% increase in the probability of
having attempted to quit smoking in the past 12 months. In the case of people with
educational attainment of college graduate or more, the price elasticity is 0.08, which means
that a 10% increase in the price of a cigarette package is associated with a 0.8% increase in
the probability of having attempted to quit smoking in the past year. According to this model,
the price elasticity for people with the highest educational level achieved is slightly higher
than for people with lower educational achievements.
Comparing these estimates with the effect on smoking intensity and cessation, all the
elasticity estimates fall very close. Additionally, the price elasticity estimates for attempted
cessation calculated at highest levels of age, income, and education are slightly higher than
those estimated at young, poor, and less educated people.
5.4.2 Regulations responsiveness
The impact of regulations on the probability of having attempted to quit smoking in the past
12 months is also surprising. Although conventional wisdom suggests that regulations as well
as treatment and prevention programs have played a key role in promoting smoking
cessation, the results presented in column 4 indicate that the entire set of coefficients
observed in this linear model for regulations and treatment and prevention programs, except
for air clean policies at private worksites and sales regulations, lacks statistical significance.
Therefore, we cannot reject the null hypothesis that the different types of regulations
50
implemented between 1993 and 2010 to control tobacco use and access had no impact on
smoking cessation in the past year.
Additionally, the adoption of prevention and tobacco control programs at state levels had no
impact on the probability of attempted cessation. Neither the full expansion of the Medicaid
coverage of medication for cessation nor the state prevention programs have margin and
elasticity estimates with statistical significance at conventional levels in this linear model.
Interestingly, the two variables with statistical significance show a counter-intuitive relation
with smoking cessation. The semi-elasticity presented in column 4 for Private Worksites is -
0.05, which means that a adopting a smoking ban at private worksites reduce the probability
of having attempted to quit smoking in the past 12 months by 0.05%. Furthermore, the semi-
elasticity presented in column 4 for Sales Regulations is -0.043, which means that a adopting
this kind of regulation reduces the probability of having attempted to quit smoking in the past
year by 0.04%.
VI. Discussions
The dataset used, strategies developed, models performed, and results achieved in this study
present some theoretical and methodological concerns as well as bringing up different issues
that call for policy attention.
6.1 Theoretical and methodological concerns
The findings of this study are subject to a theoretical concern on addiction and a variety of
methodological limitations that should be overcome before holding conclusive my findings
about the impact of prices and regulations on the demand of cigarettes. Specifically, there are

51
issues related to the way the dependent and key independent variables are modeled and
measured, and to the critical assumptions made for estimating the impact of prices and
regulations on smoking.
6.1.1 Theoretical concerns on addiction
The study approaches the demand of cigarettes—an addictive “bad”—from the perspective
of a conventional model of consumer behavior, which does not contemplate the addictive
and harmfulness properties of this good. In this sense, the study simply considers the outcome
of interest as a function of the product’s real price, regulations, and the control policies.
Yet, as Gruber and Koszegi (2002:9) pointed out, the
“…two most important aspects of the consumption of addictive goods are: first…the
instantaneous utility from consuming a good such as cigarettes depends in specific
ways on past consumption of the same good. The literature distinguishes two of these
effects: reinforcement and tolerance. Reinforcement means that having consumed a
cigarette in the past increases the “craving” for one today-it increases the marginal
utility of consumption. And tolerance refers to the notion that our body tends to “get
used to” drugs, and therefore it gets harder and harder over time to achieve the same
“high"-one needs to consume more and more of the good to reach the same level of
utility.”
This notion of addiction should be incorporated in the model for estimating the impact of
prices and regulations on the demand for cigarettes, in order to incorporate a function that
more accurately reflects the true smoking addiction.
6.1.2 Measuring issues
The key independent variable—CigPrice—does not reflect either additional taxes imposed
at local levels or sales taxes established at state levels, all of which differ from one
municipality to other and from one state to other. Therefore, these important variations across
cities, counties, and states, as well as over time, are not controlled in the models performed
in this study.

52
The clean air policy variables also present limitations. As explained in Section 4.1, the data
source is the “STATE System.” This database only captures information of state smoking
restrictions primarily adopted by legislation and executive orders. It does not have
information on state administrative laws, regulations, or implementation guidelines.
Additionally, the STATE System only collects state-level data, which means that, when no
preemptive legislation exists, all the local norms on smoking restrictions are missed.
Finally, for measuring purpose, the myriad of tobacco treatment and prevention programs
existing across states and over time were oversimplified in this study. The approaches offered
for reducing tobacco use differ substantially in their techniques, services, and in the metric
by which success can be measured. Neither “TreatCov,” which measures the Medicaid
coverage of cessation medication, nor “fund,” which measures the state expenditure per
capita in tobacco control programs, are accurate metrics for controlling the treatment and
prevention programs implemented in the states during the period of analysis.
6.1.3 Assumptions
Regarding the key independent variable—CigPrice—this study assumes that there are no tax
avoidance12 and evasion practices.13 However, many reports suggest that these practices, also
known as illicit trade or inter-state smuggling, occur frequently in areas with a wide range of
price disparities. It is estimated that as many as half of all smoker use at least one price-
minimization strategy when purchasing cigarettes. Additionally, the tobacco industry has
developed strategies to mitigate higher taxes, such as Web-based, mail-order, and store-based
12 Tax avoidance practices are comprised of individual cross-border, Internet, and untaxed purchases on tribal lands. 13 Tax evasion refers to illegal activities like organized smuggling, counterfeiting, and illegal manufacturing. In cities or states with the highest taxes, e.g., New York, around 40% of cigarettes consumed are purchased in a lower-tax jurisdiction (Merriman 2010).
53
discounting. Accordingly, the impact of CigPrice might be undermined by tax avoidance
and evasion practices that were not controlled in this study.
The present study also assumes that the way in which state smoking restrictions are
implemented or enforced in practice is the same across states and constant over time. In other
words, it is assumed the compliance is equal for each j State and t time. Common sense
suggests that this assumption is not valid.
Furthermore, this study makes the implicit assumption that no interaction between the
different key independent variables takes place in the real world. The model presents the
factors affecting the decision to smoke, or quit, as isolated from each other. However, there
is room to think that many of these factors might interact, increasing the impact on smoking.
For instance, it may be the case that adopting a smoking ban in all places at the same time—
bars, restaurants, private and governmental worksites, public transportation, and malls—has
a “premium” compared to softer scenarios. Additionally, we might also guess that
coordinating clean air policies with school and community-based prevention programs
promotes synergetic outcomes that fall beyond the sum of the individual programs.
Most importantly, this study assumes that the tobacco industry did not implemented any
strategy to overcome the difficulties posed by higher prices and restrictive-oriented smoking
policies. In fact, we should assume that different marketing and pricing strategies have taken
place, given the changes in the cigarette market in the past 30 years.
6.2 Policy discussion
Notwithstanding the limitations and caveats explained above, this study’s results suggest
some important policy implications for the attempt to control the demand for addictive “bads”
through policy tools such as taxation and regulation.

54
First, the evidence on the magnitude of the impact of those tools on the demand for cigarette
is not conclusive, especially for adult smokers. Conventional wisdom, mostly based on
studies made in the 1990s and 2000s, suggests that taxes and restriction of access and use
policies have indeed been successful in reducing the demand for cigarettes. For instance,
Chaloupka and Warner (1999), in one of the most important works reviewing the literature
on price and regulation responsiveness of cigarette demand, found that the literature suggests
price elasticities for smoking prevalence centered on -0.3 to -0.5 and for smoking intensity
centered around -0.25 to -0.15. However, more recent estimates using longitudinal data,
controlling for State and time fixed effects (as I did in this study), found even smaller
estimates on the order of -0.3 to -0.1. In this study, the price elasticity for smoking prevalence
was estimated at -0.06 and for smoking intensity was estimated at -0.07 (measuring the
dependent variable as the number of cigarettes smoked daily).
Therefore, while there is a strong consensus suggesting that teens tend to reduce consumption
when prices (taxes) increase and the price elasticity for adolescents is greater than that for
adults, evidence does not strongly support the notion that increasing tobacco prices or taxes
reduces adult smoking.
In fact, the present study’s findings are similar to those produced by Callison and Kaestner
(2012), who, using different strategies, found that tax elasticities with respect to smoking
participation and number of cigarettes were in the range of -0.02 to -0.05. As they explain,
“estimates indicate that, for adults, the association between cigarette taxes and either smoking
participation or smoking intensity is negative, small and not usually statistically significant.”
(Callison and Kaestner, 2012:16)
Accordingly, if adult smoking is largely unaffected by prices and taxes, this fact implies that
it will take very large price or tax increases to achieve a still small impact on smoking

55
prevalence, intensity, and cessation. For instance, according to Callison and Kaestner’s
findings, it would take a 100% increase in cigarette prices to reduce smoking prevalence by
6%. This course of action also raises the question of the regressive income effects of the
current tobacco tax burden.
Similarly, this study could not identify and isolate a causal relationship, with statistical and
economic significance at conventional levels, between restriction on tobacco use and access
as well as treatment and promotion programs and smoking reduction or cessation. Most of
those restrictive interventions were grounded on public health care.
Given that fact, and despite the significant body of literature on smoking reduction policies,
it seems that scholars and policymakers have little control over many of the factors that either
determine or influence smoking. This study’s results would lead us to hypothesize that other
factors than those observed in the specified models have played an important role in reducing
smoking prevalence during the period under analysis. Some hypothetical factors might be
the shifting public image of tobacco use, public attitudes towards tobacco products and/or
social awareness about the health implications of smoking. As scientific knowledge about
the harms associated to smoking has advanced, attitudes toward tobacco use have changed
from accepting to increasingly no tolerating. Although these factors have clearly been shaped
by governmental and civic actions, they are not typically controlled in econometric analysis.
6.3 Lessons for the drug legalization debate
The policy discussion described above has important theoretical and policy implications for
the ongoing drug legalization debate. The critical assumption for making a case in favor of
repealing the drug prohibitionist regime and replacing it by a legalized one, with drug control
policies based on taxation and regulations—just as in tobacco and alcohol cases—is the

56
existence of a strong inverse relation between these policy tools and the demand for the
addictive “bads.”
In effect, leaving aside the libertarian perspective, which believes that individuals are in all
circumstances the best stewards of their own welfare and, thus, that no interventions in
private “lifestyle” choices and/or in the economic activity are justified, even to improve
average well-being, a “rights and welfare” liberal perspective strongly advocates for a drug
regime change.
The proposal is based on the normative judgement that drug use is a personal choice that
should not provoke any governmental action, whereas drug abuse should be seen as a disease
that requires public health interventions.14 Framing the issue in these terms, drug policy
should address the risk factors associated with drug abuse, just as the risk factors associated
with other diseases must be controlled to prevent them.
The appeal of this argument is that, under a legalized drugs scenario, costs and harms
associated with the supply of addictive illegal “bads” are sharply reduced (e.g., existence of
a huge black market and the crime and violence tied to it, law enforcement and criminal
justice system expenditures, incarceration costs, etc.). In parallel, conventional policy tools,
such as taxes and regulations, might control costs and harms associated with the consumption
(use and abuse) of addictive “bads”.
Certainly, drug legalization means that the costs and harms associated with the supply of an
addictive illegal “bad” would be dramatically reduced, but not eliminated. However, based
on current evidence, whether the costs and harms associated with the consumption of an
addictive “bad” would be smaller or larger after legalizing it is clearly unknown. In this
14 This is the natural conclusion of following the U.S. National Institute of Drug Abuse definition of drug addiction as a chronic illness (see footnote no. 1).
57
context, the ability to predict upward or downward changes in the demand curve of an
addictive “bad” due to the legalization is critical. In other words, a counterfactual is needed.
The theory suggests that the total social harm associated with the use of an addictive illegal
“bad” is an interaction comprising three terms: harmfulness (average harm per dose),
prevalence (number of users), and intensity (number of doses per user).
In this line of reasoning, it makes sense to assume that legalization might reduce the
harmfulness of the addictive “bad,” after implementing governmental regulations on the
product similar to those applied to the pharmaceutical or even the tobacco industries.
However, it must be assumed that legalization would also reduce both the monetary and non-
monetary prices the price of an addictive illegal “bad”. Certainly, any legal market aims to
improve the ease of access to its product, removing all non-monetary prices associated with
purchasing the product (e.g., travel, time, operational conditions, risk of arrest, etc.).
Additionally, there is a strong academic consensus that legalizing an addictive and currently
illegal “bad” will lead to sharp monetary price reductions. For instance, while 1 gram of
cocaine can be purchased in a U.S. street for $ 100, the same gram (adjusted by purity) is
sold in Bogota (Colombia) for $1.50. Therefore, the cost of a gram of legalized cocaine
before taxes would be $1.50 plus the costs of transportation and distribution, which would
be much smaller than the current $100. Taking into account a more complex structure of
costs, Miron (2003) suggest an extremely large price reduction in the range of 10- to 40-fold.
Acknowledging that legalizing an addictive “bad” would remove the monetary and non-
monetary costs that currently keep its price high, it remains estimate the impact of these price
reductions on the other two terms of the total social harms equation: prevalence and intensity
of consumption. In other words, would the overwhelmed monetary and non-monetary price
58
reduction of a legalized addictive “bad” lead to an expansion of the number of consumers
(prevalence) and/or an increase in the quantity consumed per capita (intensity)?
The question goes directly to the core of the pro-legalization argument. Yet, the key problem
to answer here is the lack of accurate information about addictive illegal “bads” markets.
After reviewing the existing literature, MacCoun and Reuter (2011) suggest that there is no
firm evidence to predict a huge increase in the short-run in the number of consumers
(prevalence) after legalization, although we should expect some increase in the long-run.
However, they also consider that legalization is likely to significantly increase the number of
those doses used per capita (intensity). Accordingly, they conclude “…there is no firm basis
for projecting the net effect on total drug-related harm because of the complexity of the
policy-use-harm nexus.” (MacCoun and Reuter, 2011:143)
The estimations made this issue so far do not fuel optimism. Considering that the impact of
the huge price reductions caused by legalization on prevalence and intensity rates depends
on the price and regulations responsiveness of the legalized addictive “bad”, Kilmer et al.
(2010) estimated that cannabis legalization might increase consumption from 75% to 150–
200%, depending the demand function modeled.
In this context, taxation and regulations would play a critical role in sustaining the pro-
legalization argument. Theoretically speaking, any drop in legalized monetary and non-
monetary prices might be offset by appropriately calibrated taxes and regulations. Given the
lack of accurate data for addictive illegal “bads,” however, filling this gap with information
about tobacco and alcohol could be extremely useful to make an informed prediction on the

59
total social harm under a legalization scenario. This has been the precise proposal of this is
this study.15
Even though various theoretical and methodological issues should be addressed before
embracing my findings conclusive, a price elasticity of -0.061 on smoking prevalence
(Section 5.1.1) and -0.079 on smoking intensity (Section 5.3.1) does not fuel optimism about
the ability of taxation to reduce the number of consumers. If we assume the true parameters
are close to these estimates, the idea of controlling the expansion of demand through taxation
is highly questionable.
In addition to that, Kilmer et al. (2010) cast serious doubts on the effectiveness of using taxes
to offset an 80% price drop, as estimated after legalizing any addictive “bad.” The
effectiveness depends on the characteristics of the supply and, therefore, the structure of the
market. In this sense, MacCoun & Reuter (2001) explain the challenges of establishing such
“sin taxes” amidst highly organized tobacco and alcohol industries.
Considering the extremely wide range between the addictive “bad” cost and its illegal market
price, the tax level should be very high, giving rise to a smaller, but still large residually
profitable black market that might undercut the effect of taxation. Certainly, prohibition
creates an entire black market for addictive “bads.” Yet, as the studies on inter-state cigarette
smuggling activities point out, legalization, along with extremely high taxes, also creates an
illegal market, which involves smuggling activities at a level that could erode the attempt to
control demand and potentially increase the rate of theft from wholesalers and retailers.
In addition to taxation, regulations oriented to restrict the access and use of an addictive
legalized “bad” should theoretically raise the “bads” non-monetary costs. However, this
15 As noted in the introduction section, although I draw the analogy for all the addictive “bad” markets, Reuter (2013) explains that marijuana may provide the closest parallel to tobacco market.

60
study’s findings indicate that most of the regulations implemented to control the demand for
cigarette have no statistically significant estimates in the period under analysis. If the true
parameters were close to these estimates, regulations would not be able to offset the fall in
non-monetary prices caused by legalization.
Both conclusion should bring more caution to the drug legalization debate. Rather than
optimism, the available evidence leads to agnosticism about the ability of some policy tools
such as taxation and regulation to control the demand of a legalized addictive “bad.”
Furthermore, predictions based on the case of cigarette demand should lead to pessimism.
VII. Conclusion
The present study revisited analyses of factors explaining the dramatic decline in cigarette
consumption in the U.S. over the past 30 years, in the belief that these findings may be used
to shed light on some key aspects of the current drug legalization debate.
Using the CDC’s Behavioral Risk Factor Surveillance Survey and employing linear
probability and negative binominal count models, with State and time fixed effects, I
examined the impact of prices and regulations on smoking prevalence, intensity, and
cessation rates in the U.S. between 1993 and 2010. It resulted in three key findings.
First, while statistically significant, the price elasticities estimated in this study are quite
small: -0.061 for the probability of being smoker (smoking prevalence); 0.107 for the
probability of being a casual versus a regular smoker and -0.08 for the number of cigarettes
smoked daily (both measures of smoking intensity); 0.074 for the probability of attempting
to quit (smoking cessation). All these estimates are close to those found by Callison and
Kaestner (2012), but much smaller than conventional wisdom suggests, which has estimated
61
a price elasticity of smoking prevalence centered around -0.4, and for smoking intensity
centered around -0.2 (Chaloupka and Warner, 2000).
Second, the overwhelmingly majority of coefficients of the impact of various regulations
(clean air policies, sales regulations, and advertising restrictions) on smoking prevalence,
intensity, and cessation, are negative, but small and not statistically significant. Estimates for
regulation responsiveness ranged from -0.0048 to 0.073. However, only 7 estimates, within
a total of 40, were statistically significant at conventional level. Thus, this finding suggests
that the set of policies aimed for restricting the access and use of cigarettes did not produce
a significant impact on smoking prevalence, intensity, and cessation over the past 20 years.
Third, although it was not the primary subject of this study, I also estimated the impact of
tobacco treatment and prevention programs on smoking cessation. Similar to the results
obtained above, the estimates of the Medicaid coverage of medication for cessation
treatments and the total funds for tobacco control programs are extremely small and
statistically insignificant. In other words, these interventions did not produce any impact on
the probability of having tried to stop smoking in the past year.
Although many methodological aspects of this study require improvements before embracing
conclusive implications—and similar studies for estimating the price and regulation
responsiveness of alcohol should be brought to the analysis—these findings may shed some
light on the drugs legalization debate.
While anti-prohibition advocates claim that a legalized drug demand might be controlled
through (high) taxes and (tough) regulations, this study’s findings call that view into question.
If taxes and regulations do not have either economically or statistically significant impacts
on the prevalence, intensity, and cessation of an addictive “bad” consumption, as estimated

62
for smoking in this study, the idea of drugs legalization requires further research before
considering it in the policy realm.

63
Appendix
Table no. 1: Sources of national survey data on tobacco use, United States NSDUH National YRBS NHIS BRFS
Sponsoring organization SAMHSA CDC CDC CDC
Type of survey Cross-sectional Cross-sectional Cross-sectional Cross-sectional
Years 2012 1991, 1993, 1995, 1997, 1999, 2001, 2003, 2005, 2007, 2009, and 2011
1965–2012 (various years)
1984-2012
Mode of survey administration
Audio computer-assisted self-administered personal interview
School-based, self-administered questionnaire
Computer-assisted personal interview
Landline and Cellular Telephones
Response rate 2012: 86.1% for household screening; 73.0% for interviewing
2011: 81% for schools; 87% for students; 71% overall
2010: 60.8% for household adults 2012: 61.2% for household adults
2012: 49.72%
Sample size 2012: 68,309 persons ≥12 years of age, including 45,836 adults ≥18 years of age
2011: 15,425 9th–12th grade students
2010: 27,157 adults ≥18 years of age 2012: 34,525 adults ≥18 years of age
2010: around 430,000 adults
Type of tobacco use examined
Cigarettes, smokeless
tobacco (chewing tobacco, snuff), cigars, and pipe tobacco
Cigarettes, smokeless tobacco, and cigars
Cigarettes (annually), smokeless tobacco,
and cigars (selected years)
Cigarettes, smokeless tobacco,
other tobacco products, cessation.
Graph no. 3: Percentage of Smoker Among National Population Aged 18 and Older,
By Year
16
18
20
22
24
Sm
oke
r
1995 2000 2005 2010Year

64
Graph no. 4: Percentage of Casual Smokers Among Smokers, By Year
Graph no. 5: Average Number of Cigarettes Now Smoked, By Year
20
22
24
26
28
CA
SU
AL S
MO
KE
R
1995 2000 2005 2010YEAR
18.5
19
19.5
20
SM
OK
EN
UM
1992 1994 1996 1998 2000YEAR
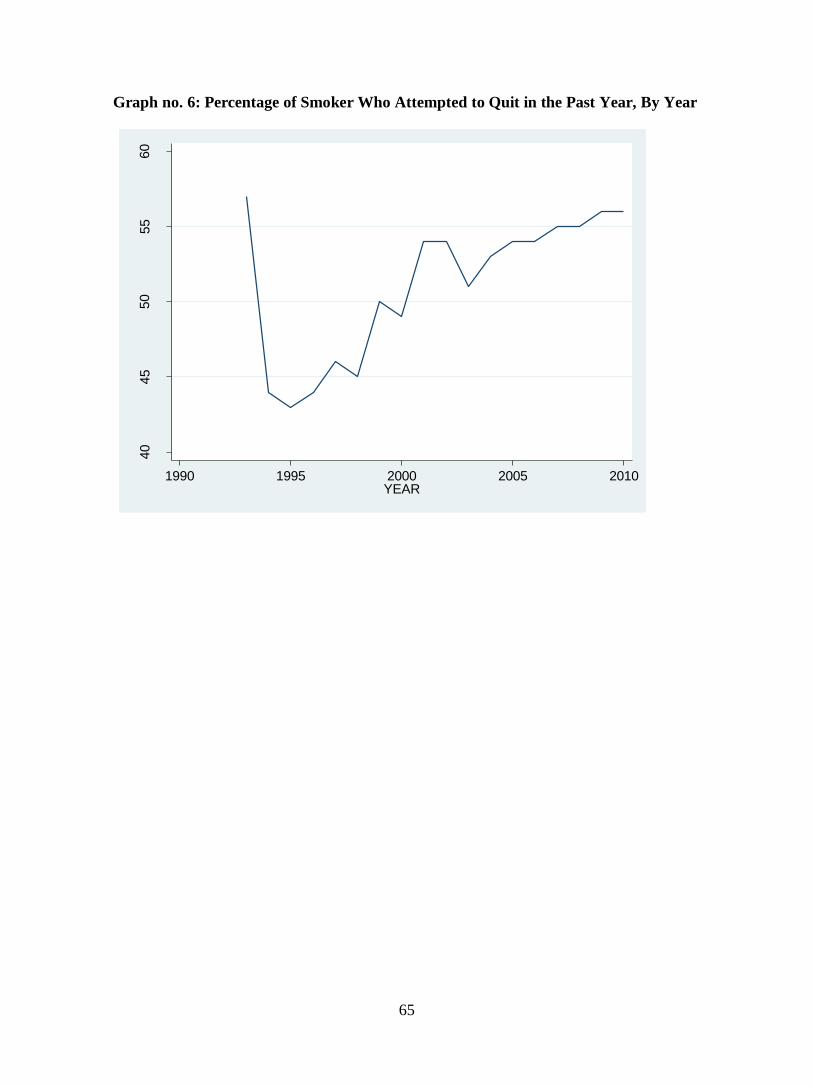
65
Graph no. 6: Percentage of Smoker Who Attempted to Quit in the Past Year, By Year
40
45
50
55
60
ST
OP
SM
K
1990 1995 2000 2005 2010YEAR

66
Graph no. 7: Weighted Average of a Package of Cigarette Prices, by State and year

67
Graph no. 8: Frequency distribution of ‘Smokenum”
0
.05
.1.1
5.2
Density
0 20 40 60 80 100number of cigarettes now smoked per day
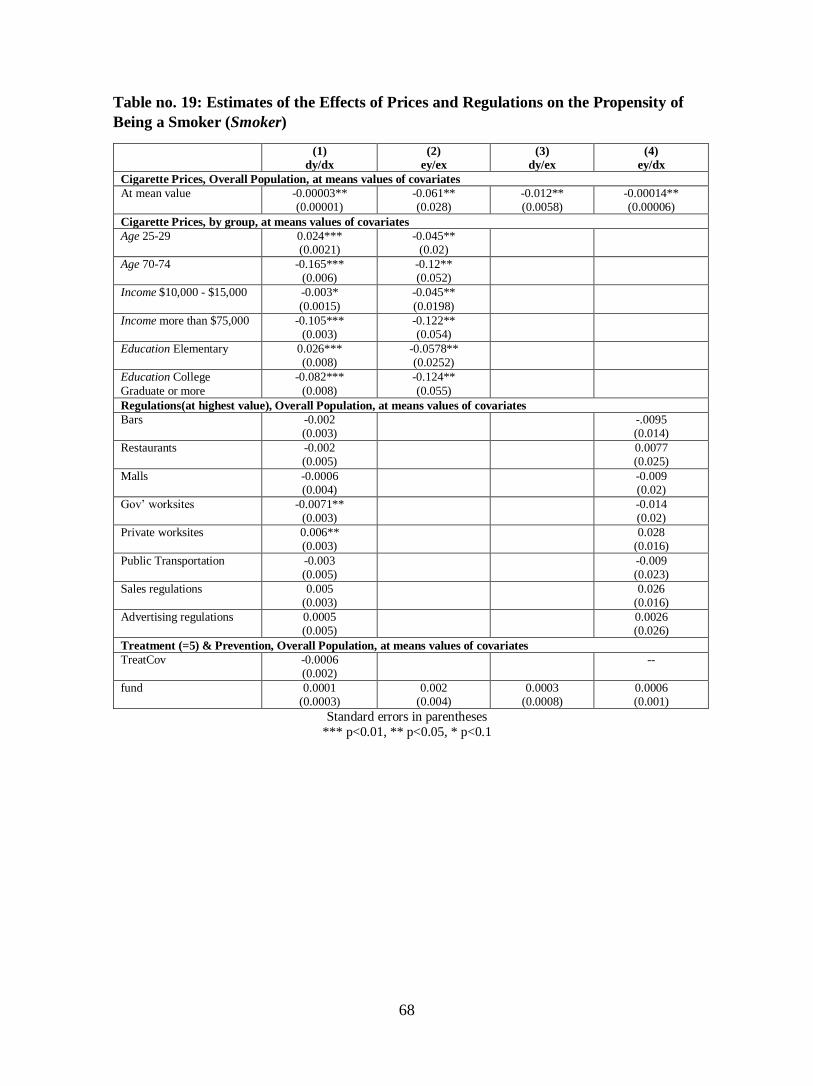
68
Table no. 19: Estimates of the Effects of Prices and Regulations on the Propensity of
Being a Smoker (Smoker)
(1)
dy/dx
(2)
ey/ex
(3)
dy/ex
(4)
ey/dx
Cigarette Prices, Overall Population, at means values of covariates
At mean value -0.00003** (0.00001)
-0.061** (0.028)
-0.012** (0.0058)
-0.00014** (0.00006)
Cigarette Prices, by group, at means values of covariates
Age 25-29 0.024*** (0.0021)
-0.045** (0.02)
Age 70-74 -0.165*** (0.006)
-0.12** (0.052)
Income $10,000 - $15,000 -0.003*
(0.0015)
-0.045**
(0.0198)
Income more than $75,000 -0.105*** (0.003)
-0.122** (0.054)
Education Elementary 0.026*** (0.008)
-0.0578** (0.0252)
Education College
Graduate or more
-0.082***
(0.008)
-0.124**
(0.055)
Regulations(at highest value), Overall Population, at means values of covariates
Bars -0.002 (0.003)
-.0095 (0.014)
Restaurants -0.002 (0.005)
0.0077 (0.025)
Malls -0.0006 (0.004)
-0.009 (0.02)
Gov’ worksites -0.0071** (0.003)
-0.014 (0.02)
Private worksites 0.006** (0.003)
0.028 (0.016)
Public Transportation -0.003 (0.005)
-0.009 (0.023)
Sales regulations 0.005 (0.003)
0.026 (0.016)
Advertising regulations 0.0005 (0.005)
0.0026 (0.026)
Treatment (=5) & Prevention, Overall Population, at means values of covariates
TreatCov -0.0006 (0.002)
--
fund 0.0001 (0.0003)
0.002 (0.004)
0.0003 (0.0008)
0.0006 (0.001)
Standard errors in parentheses
*** p<0.01, ** p<0.05, * p<0.1

69
Table no. 20: Estimates of the Effects of Prices and Regulations on the Propensity of
Being Casual Smoker (Smokinginten)
(1)
dy/dx
(2)
ey/ex
(3)
dy/ex
(4)
ey/dx
Cigarette Prices, Overall Population, at means values of covariates
At mean value 0.00006*** (0.000019)
0.107*** (0.035403)
0.025*** (0.0084)
0.0002*** (0.00008)
Cigarette Prices, by group, at means values of covariates
Age 25-29 -0.022*** (0.0025)
0.089*** (0.0263)
Age 70-74 -0.061***
(0.00782)
0.113***
(0.038)
Income $10,000 - $15,000 -0.0108*** (0.0026)
0.115*** (0.038)
Income more than $75,000 0.052*** (0.004)
0.089*** (0.029)
Education Elementary 0.015
(0.0178)
0.11***
(0.035)
Education College Graduate or more
0.13*** (0.018)
0.08*** (0.026)
Regulations (at highest value), Overall Population, at means values of covariates
Bars 0.008 (0.007)
0.018 (0.031)
Restaurants -0.0027 (0.0097)
-0.009 (0.041)
Malls -0.004 (0.006)
-0.013 (0.028)
Gov’ worksites 0.015** (0.005)
0.056 (0.02)
Private worksites -0.012* (0.007)
-0.055 (0.03)
Public Transportation 0.01* (0.005)
0.073 (0.03)
Sales regulations -0.0094 (0.011)
-0.042 (0.051)
Advertising regulations -0.004 (0.014)
-0.015 (0.064)
Treatment (=5) & Prevention, Overall Population, at means values of covariates
TreatCov 0.0007 (0.004)
--
fund 0.0003
(0.0005)
0.003
(0.006)
0.0008
(0.001)
0.0011
(0.002)
Standard errors in parentheses
*** p<0.01, ** p<0.05, * p<0.1

70
Table no. 21: Estimates of the Effects of Prices and Regulations on the Number of
Cigarettes Smoked in the past 30 days (Smokenum)
LPM NB
(1)
dy/dx
(2)
ey/ex
(3)
dy/ex
(4)
ey/dx
(5)
dy/dx
(6)
ey/ex
(7)
dy/ex
(8)
ey/dx
Cigarette Prices, Overall Population, at means values of covariates
At mean value -0.006
(0.004)
-0.079
(0.049)
-1.526
(0.937)
-0.0003
(0.0002)
-0.0004***
(0.0001)
-0.07***
(0.021)
-0.091***
(0.0313)
-0.0002***
(0.00008)
Cigarette Prices, by group, at means values of covariates
Age 25-29 1.37*** (0.147)
-0.092 (0.0564)
0.08*** (0.007)
-0.072*** (0.0234)
Age 70-74 3.49*** (0.274)
-0.075 (0.046)
0.153*** (0.013)
-0.065*** (0.021)
Income $10,000 - $15,000
-0.23 (0.149)
-0.0753 (0.046)
-0.0007 (0.007)
-0.066* (0.021)
Income more than $75,000
-0.81*** (0.229)
-0.084 (0.052)
-0.028*** (0.008)
-0.07*** (0.0226)
Education
Elementary
-0.84
(1.192)
-0.0653
(0.04)
-0.0061
(0.034)
-0.061***
(0.0195)
Education College Graduate or more
-3.545** (1.184)
-0.086 (0.053)
-0.124*** (0.033)
-0.071*** (0.023)
Regulations (at highest value), Overall Population, at means values of covariates
Bars -1.53*** (0.315)
-- 0.042 (0.03)
--
Restaurants -- -- -- --
Malls -- -- 0.387*** (0.053)
0.021** (0.00895)
Gov’ worksites
-0.752 (0.551)
-- 0.035** (0.016)
0.024** (0.011)
Private worksites
-- -- -0.033** (0.015)
-0.022** (0.01)
Public Transportation
1.55*** (0.128)
-- 0.029** (0.013)
0.018** (0.009)
Sales regulations
0.0035 (0.203)
0.0002 (0.011)
-0.007 (0.0084)
-0.0048 (0.0057)
Advertising regulations
-0.05 (0.345)
-0.0026 (0.018)
-0.0187** (0.0078)
-0.013** (0.005)
Treatment (=5) & Prevention, Overall Population, at means values of covariates
Treat Cov -0.055 (0.212)
-- 0.004 (0.0079)
0.0027 (0.005)
fund 0.023 (0.0422)
0.0009 (0.002)
0.0175 (0.0384)
0.0012 (0.0022)
-0.0027 (0.0017)
-0.0016 (0.001)
-0.0024 (0.00152)
-0.00183 (0.0012)
Standard errors in parentheses
*** p<0.01, ** p<0.05, * p<0.1

71
Table no. no. 22: Estimates of the Effects of Prices and Regulations on the Propensity
to Quit (Stopsmk)
(1)
dy/dx
(2)
ey/ex
(3)
dy/ex
(4)
ey/dx
Cigarette Prices, Overall Population, at means values of covariates
At mean value 0.00009*** (0.00003)
0.074*** (0.0235)
0.039*** (0.013)
.00017*** (0.00006)
Cigarette Prices, by group, at means values of covariates
Age 25-29 -0.068*** (0.0032)
0.061*** (0.019)
Age 70-74 -0.2323*** (0.006)
0.087*** (0.028)
Income $10,000 - $15,000 0.0063**
(0.003)
0.07***
(0.022)
Income more than $75,000 -0.028*** (0.0045)
0.0823*** (0.0262)
Education Elementary -0.017*** (0.015)
0.0693*** (0.022)
Education College Graduate or more 0.004***
(0.014)
0.0772***
(0.025)
Regulations (at highest value), Overall Population, at means values of covariates
Bars -0.0052 (0.0051)
-0.01 (0.0096)
Restaurants 0.012 (0.0092)
0.022 (0.017)
Malls 0.0031 (0.0101)
0.006 (0.019)
Gov’ worksites 0.0083 (0.007)
0.015 (.013)
Private worksites -0.0267** (0.0118)
-0.05** (0.022)
Public Transportation 0.025 (0.016)
0.047 (0.029)
Sales regulations -0.0228* (0.0119)
-0.043* (0.022)
Advertising regulations -0.0082 (0.0104)
-0.015 (0.0194)
Treatment (=5) & Prevention, Overall Population, at means values of covariates
TreatCov -0.00056 (0.0041)
-0.0012 (0.008)
Funds 0.0007 (0.0074)
0.003 (0.004)
0.002 (0.002)
0.0013 (0.0014)
Standard errors in parentheses
*** p<0.01, ** p<0.05, * p<0.1

72
References
Adda, Jerome and Cornaglia, Francesca. Taxes, Cigarette Consumption, and Smoking
Intensity. The American Economic Review, September 2006:1013-1028.
Alesci N., Forster J., & Blaine T. Smoking visibility, perceived acceptability, and frequency
in various locations among youth and adults. Preventive Medicine 2003; 36(3):272–
81
American Nonsmokers’ Rights Foundation. Municipalities with local 100% smokefree laws,
2013; < http://www.no-smoke.org/pdf/100ordlisttabs.pdf >; accessed: April 7, 2015.
Andrews RL & Franke GR. The determinants of cigarette consumption. Journal of Public
Policy & Marketing;10(1):81-100, 1991.
Babor T, Caetano R, Casswell S, Edwards G, Giesbrecht N, et al. 2010a. Alcohol: No
Ordinary Commodity. Oxford: Oxford Univ. Press
Bauer J., Hyland A., Li Q., Steger C., Cummings K. A longitudinal assessment of the impact
of smoke-free worksite policies on tobacco use. American Journal of Public Health
2005; 95(6):1024–9
Callison, Kevin and Kaestner, Robert. Do Higher Tobacco Taxes Reduce Adult Smoking?
New Evidence of the Effect of Recent Cigarette Tax Increases on Adult Smoking.
NBER Working Paper No. 18326, Cambridge, MA: National Bureau of Economic
Research, 2012.
Capehart T. The Changing Tobacco User’s Dollar. Electronic Outlook Report from the
Economic Research Service. Washington: U.S. Department of Agriculture, 2004;
<http://www.ers.usda.gov/media/1554472/tbs25701.pdf >; accessed: April 7, 2015

73
Caulkins, Jonathan P. and Peter Reuter. How Drug Enforcement Affects Drug
Prices. In Crime and Justice – A Review of Research, vol. 39, ed. Michael Tonry.
University of Chicago Press, pp.213-272, 2010.
Centers for Disease Control and Prevention. Best Practices for Comprehensive Tobacco
Control Programs—2007. Atlanta (GA): U.S. Department of Health and Human
Services, Centers for Disease Control and Prevention, National Center for Chronic
Disease and Health Promotion, Office on Smoking and Health, 2007.
Centers for Disease Control and Prevention. Disparities in secondhand smoke exposure—
United States, 1988– 1994 and 1999–2004. Morbidity and Mortality Weekly Report
2008a; 57(27):744–7.
Centers for Disease Control and Prevention. Quitting smoking among adults—United States,
2001–2010. Morbidity and Mortality Weekly Report 2011a; 60(44):1513–9.
Centers for Disease Control and Prevention. Smoking and Tobacco Use: Trends in Current
Cigarette Smoking Among High School Students and Adults, United States, 1965–
2011. Atlanta (GA): U.S. Department of Health and Human Services, 2011b.
Centers for Disease Control and Prevention. State smoking restrictions for private-sector
worksites, restaurants, and bars—United States, 2004 and 2007. Morbidity and
Mortality Weekly Report 2008b; 57(20):549–52.
Centers for Disease Control and Prevention. Vital signs: nonsmokers’ exposure to
secondhand smoke—United States, 1999–2008. Morbidity and Mortality Weekly
Report 2010; 59(35):1141–6.
Chaloupka F., Straif K., & Leon M. Effectiveness of tax and price policies in tobacco control.
Tobacco Control; 20(3):235–8, 2011.

74
Chaloupka Frank and Pacula R. The impact of price on youth tobacco use. In: Changing
Adolescent Smoking Prevalence—Where It Is and Why. Smoking and Tobacco
Control Monograph No. 14. Bethesda (MD): U.S. Department of Health and Human
Services, National Institutes of Health, National Cancer Institute, 2001:193–9. NIH
Publication No. 02–5086.
Chaloupka, Frank and Liccardo Pacula, Rosalie. An examination of gender and race
differences in youth smoking responsiveness to price and tobacco control policies.
NBER Working Paper No. 6541, Cambridge, MA: National Bureau of Economic
Research, 1998.
Chaloupka, Frank and Tauras, John. Price, Clean Indoor Air Laws, and Cigarrette Smoking:
Evidence for Longitudinal Data for Young Adults, NBER Working Paper No. 6937,
Cambridge, MA: National Bureau of Economic Research, 1999.
Chaloupka, Frank J. & Warner, Kenneth. The economics of smoking, NBER Working Paper
7047, Cambridge, MA: National Bureau of Economic Research, 1999.
Chaloupka, Frank y Wechsler, R. Price, Tobacco Control Policies and Smoking Among
Young Adults, NBER Working Paper No. 5012, Cambridge, MA: National Bureau
of Economic Research, 1990.
Chaloupka, Frank. Men, Women, and Addiction: The Case of Cigarette Smoking, NBER
Working Paper No. 3267, Cambridge, MA: National Bureau of Economic Research,
1990.
Community Preventive Services Task Force. Reducing tobacco use and secondhand smoke
exposure: smoke-free policies, 2012; <www.thecommunityguide.org/
tobacco/smokefreepolicies.html>; accessed: April 7, 2015.

75
Cook PJ. Paying the Tab: The Costs and Benefits of Alcohol Control. Princeton, NJ:
Princeton University Press, 2007
Eisenberg M. and Forster J. Adolescent smoking behavior: measures of social norms.
American Journal of Preventive Medicine 2003; 25(2):122–8
Elster J. Ulysses and the Sirens: Studies in Rationality and Irrationality. Cambridge:
Cambridge University Press, 1979.
Evans, W., Jeanne S. Ringel, Diana Stech. Tobacco Taxes and Public Policy to Discourage
Smoking, in: James M. Poterba, editor, “Tax Policy and the Economy,” volume 13,
Massachusetts: MIT Press, 1999.
Federal Trade Commission. Cigarette Report for 2011. Washington, DC, 2013.
Fiore MC, Jaén C, Baker T, Bailey W, Benowitz N, Curry S, Dorfman S, Froelicher E,
Goldstein M, Healton C, et al. Treating Tobacco Use and Dependence: 2008 Update.
Clinical Practice Guideline. Rockville (MD): U.S. Department of Health and Human
Services, Public Health Service, 2008
Gallet CA, List J. Cigarette demand: a meta-analysis of elasticities. Health Econ. 2003,
12:821–35.
Gallet CA. The demand for alcohol: a meta-analysis of elasticities. Aust. J. Agric. Resour.
Econ. 51:121–35, 2007
Gilpin E., Lee L., & Pierce J. Changes in population attitudes about where smoking should
not be allowed: California versus the rest of the U.S.A. Tobacco Control 2004;
13(1):38–44

76
Grossman, Michael. Individual Behaviors and Substance Use: The Role of Price, NBER
Working Paper No. 10948, Cambridge, MA: National Bureau of Economic Research,
2004.
Gruber, Jonathan and Koszegi, Botond. A Theory of Government Regulation of Addictive
Bads: Optimal Tax Levels and Tax Incidence for Cigarette Excise Taxation, NBER
Working Paper No. 8777, Cambridge, MA: National Bureau of Economic Research,
2002.
Gruber, Jonathan. Youth Smoking in the U.S.: Prices and Policies, NBER Working Paper
No. 7506, Cambridge, MA: National Bureau of Economic Research, 2000.
International Agency for Research on Cancer. Effectiveness of Tax and Price Policies for
Tobacco Control. IARC Handbooks of Cancer Prevention in Tobacco Control, Vol.
14. Lyon (France): International Agency for Research on Cancer, 2011
Kilmer B., Caulkins J., Pacula R., MacCoun R., & Reuter P. Altered State? Assessing How
Marijuana Legalization in California Could Influence Marijuana Consumption and
Public Budgets. Santa Monica, CA: RAND CORPORATION, 2010.
Koh H., & Sebelius K. Promoting prevention through the Affordable Care Act. New England
Journal of Medicine 2010; 363(14):1296–9.
Lewit EM, Coate D, Grossman M. The effects of government regulation on teenage smoking.
Journal of Law and Economics 1981;24(3):545-69.
Lewit EM, Coate D. The potential for using excise taxes to reduce smoking. Journal of Health
Economics 1982;1(2):121-45.

77
Liccardo Pacula, Rosalie and Lundberg, Russell (2014). Why Changes in Price Matter When
Thinking About Marijuana Policy: A Review of the Literature on the Elasticity of
Demand. Public Health Reviews, Vol. 35, No 2.
MacCoun, Robert and Reuter, Peter. Assessing Drug Prohibition and Its Alternatives: A
Guide for Agnostics, The Annual Review of Law and Social Science, 2011. 7:14.1–
14.18.
MacCoun, Robert and Reuter, Peter. Drug War Heresies. Learning from other vices, times,
& places, Cambridge University Press, MA: 2001.
Miura M., Daynard R. & Samet J. The role of litigation in tobacco control. Salud Publica de
México; 48(Suppl 1):S121–S36, 2006.
National Association of Attorneys General. MSA payment information, 2012,
<http://www.nasbo.org/sites/default/files/Master%20Settlement%20Agreement.pdf
>; accessed: April 7, 2015.
Orzechowski and Walker. The Tax Burden on Tobacco 2012. Historical Compilation, Vol.
47. Vol. 37, 2002. Arlington, VA: Orzechowski & Walker, 2013
Reuter, Peter. Can tobacco control endgame analysis learn anything from the US experience
with illegal drugs? Tob Control 22: i49–i51, 2013.
Richards JI, Curran CM. Oracles on “advertising”: searching for a definition. Journal of
Advertising 2002;31(2):63–77
Saffer, H., Dave, D. and Grossman, M. Behavioral Economics and the Demand for Alcohol:
Results from the NLSY97, NBER Working Paper No. 18180, Cambridge, MA:
National Bureau of Economic Research, 2012.

78
U.S. Department of Health and Human Services. How Tobacco Smoke Causes Disease—
The Biology and Behavioral Basis for Smoking-Attributable Disease: A Report of the
Surgeon General. Atlanta (GA): U.S. Department of Health and Human Services,
Centers for Disease Control and Prevention, National Center for Chronic Disease
Prevention and Health Promotion, Office on Smoking and Health, 2010.
U.S. Department of Health and Human Services. Preventing Tobacco Use Among Young
People: A Report of the Surgeon General. Atlanta (GA): U.S. Department of Health
and Human Services, Public Health Service, Centers for Disease Control and
Prevention, National Center for Chronic Disease Prevention and Health Promotion,
Office on Smoking and Health, 1994.
U.S. Department of Health and Human Services. Preventing Tobacco Use Among Youth and
Young Adults: A Report of the Surgeon General. Atlanta (GA): U.S. Department of
Health and Human Services, Centers for Disease Control and Prevention, National
Center for Chronic Disease Prevention and Health Promotion, Office on Smoking and
Health, 2012.
U.S. Department of Health and Human Services. Reducing Tobacco Use. A report of the
Surgeon General. Atlanta (GA): U.S. Department of Health and Human Services,
Centers for Disease Control and Prevention, National Center for Chronic Disease
Prevention and Health Promotion, Office on Smoking and Health, 2000.
U.S. Department of Health and Human Services. The Health Consequences of Involuntary
Exposure to Tobacco Smoke: A Report of the Surgeon General. Atlanta (GA): U.S.
Department of Health and Human Services, Centers for Disease Control and
Prevention, Coordinating Center for Health Promotion, National Center for Chronic
Disease Prevention and Health Promotion, Office on Smoking and Health, 1986.
79
U.S. Department of Health and Human Services. The Health Consequences of Smoking: A
Report of the Surgeon General. Atlanta (GA): U.S. Department of Health and Human
Services, Centers for Disease Control and Prevention, National Center for Chronic
Disease Prevention and Health Promotion, Office on Smoking and Health, 2004.
U.S. Department of Health and Human Services. The Health Consequences of Smoking—50
Years of Progress. A Report of the Surgeon General. Atlanta, GA: U.S. Department
of Health and Human Services, Centers for Disease Control and Prevention, National
Center for Chronic Disease Prevention and Health Promotion, Office on Smoking and
Health, 2014. Printed with corrections, January 2014.
Wagenaar AC, Salois MJ, Komro KA. Effects of beverage alcohol price and tax levels on
drinking: a meta-analysis of 1003 estimates from 112 studies. Addiction 104:179–90,
2009.
Wasserman J, Manning WG, Newhouse JP, Winkler JD. The effects of excise taxes and
regulations on cigarette smoking. Journal of Health Economics;10(1):43-64, 1991.