Embed Size (px)
Citation preview

ECN-RX--05-070
THE HYDROGEN ECONOMY POSSIBILITIES AND LIMITATIONS
F.A. de Bruijn
Presented at the ACTS-Sustainable Hydrogen Workshop,
13th October 2004, Nunspeet The Netherlands
FEBRUARI 2005

2 ECN-RX--05-070

ECN-RX--05-070 3
the Hydrogen Economy: possibilities and limitations
Frank de BruijnACTS 13th October 2004
Containing slides supplied by: Kees van der Klein (16,19,32,33,34)Ronald Mallant (3,4,5,12,13,14,25,46, 55-61)
Who wants HydrogenandWhy
?
4 ECN-RX--05-070
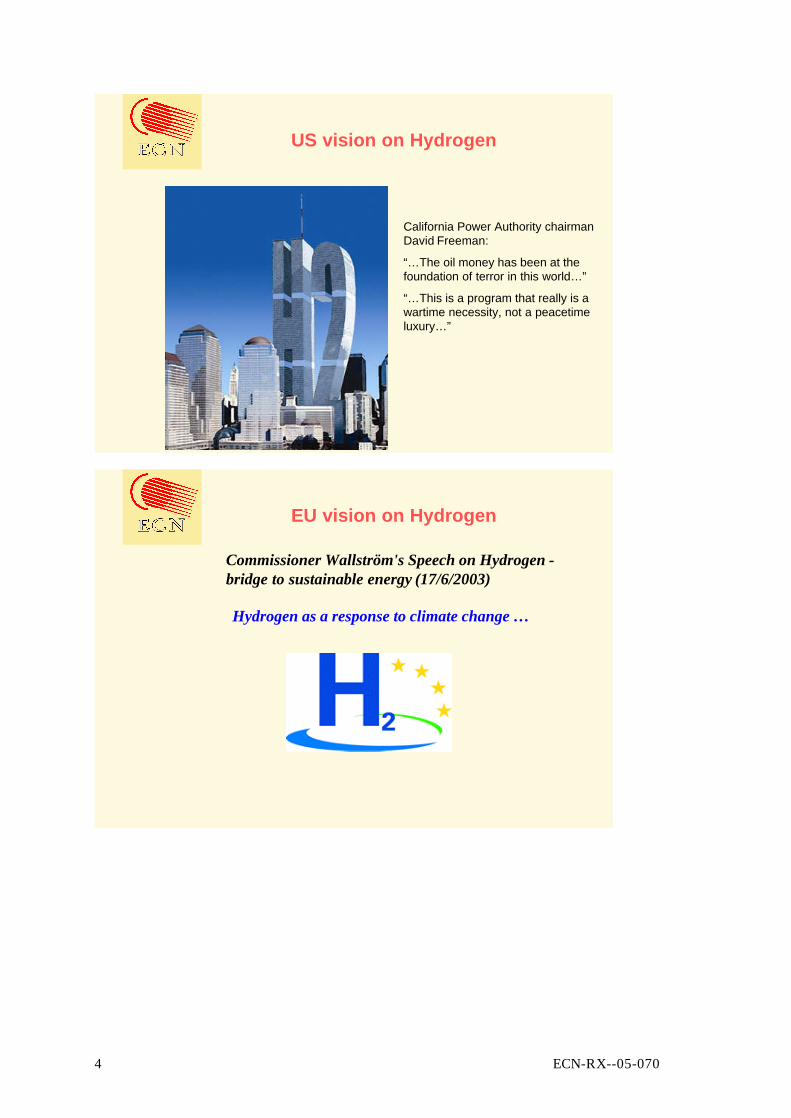
US vision on Hydrogen
“…The oil money has been at the foundation of terror in this world…”
“…This is a program that really is a wartime necessity, not a peacetime luxury…”
California Power Authority chairman David Freeman:
EU vision on Hydrogen
Hydrogen as a response to climate change …
Commissioner Wallström's Speech on Hydrogen -bridge to sustainable energy (17/6/2003)
ECN-RX--05-070 5
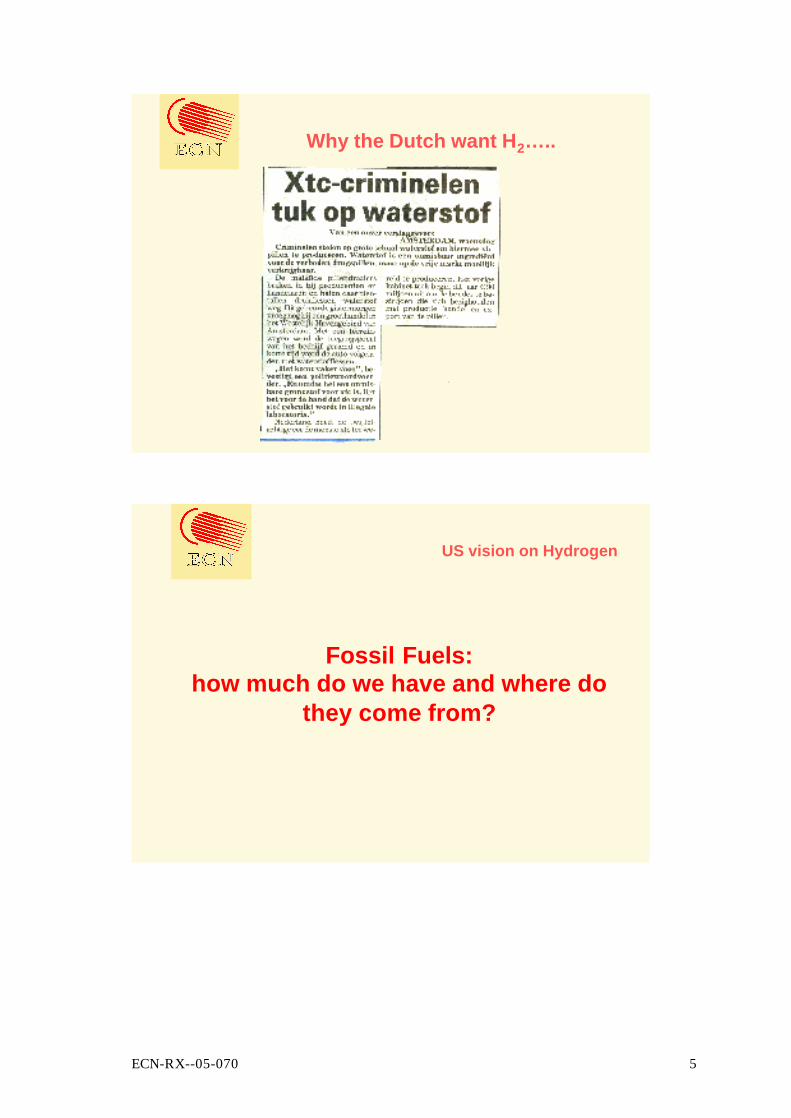
Why the Dutch want H2…..
Fossil Fuels:how much do we have and where do
they come from?
US vision on Hydrogen
6 ECN-RX--05-070
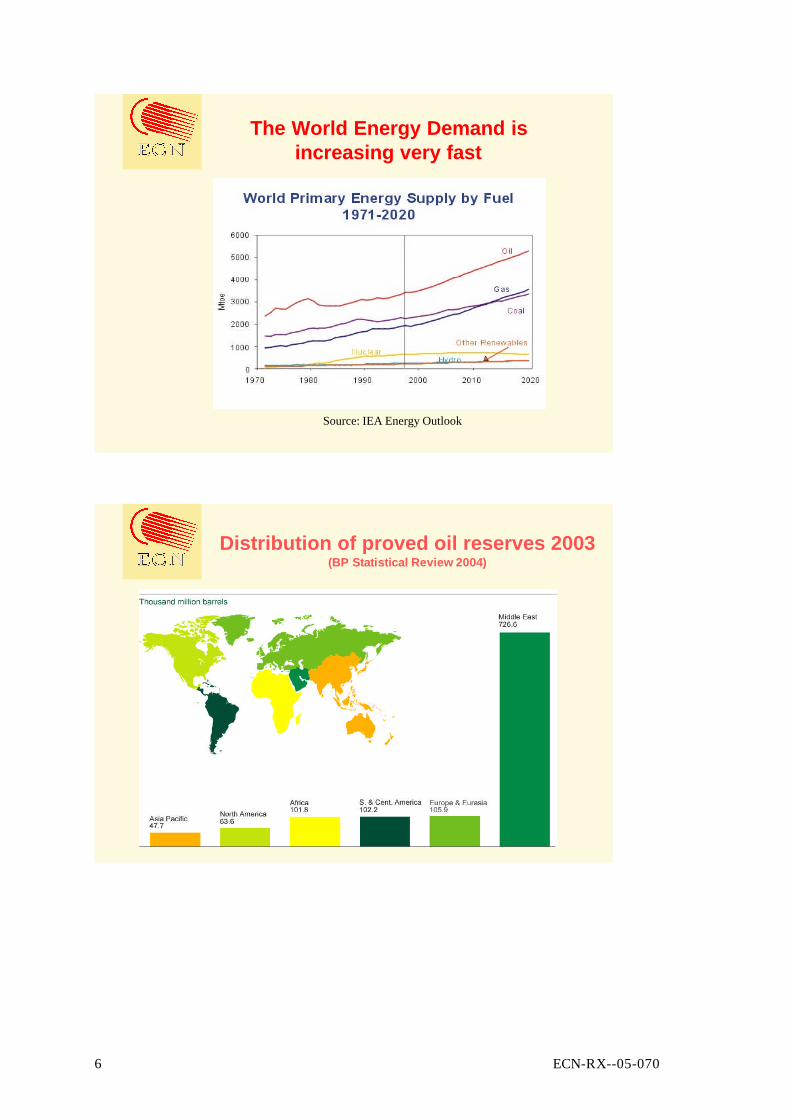
The World Energy Demand is increasing very fast
Source: IEA Energy Outlook
Distribution of proved oil reserves 2003 (BP Statistical Review 2004)
ECN-RX--05-070 7
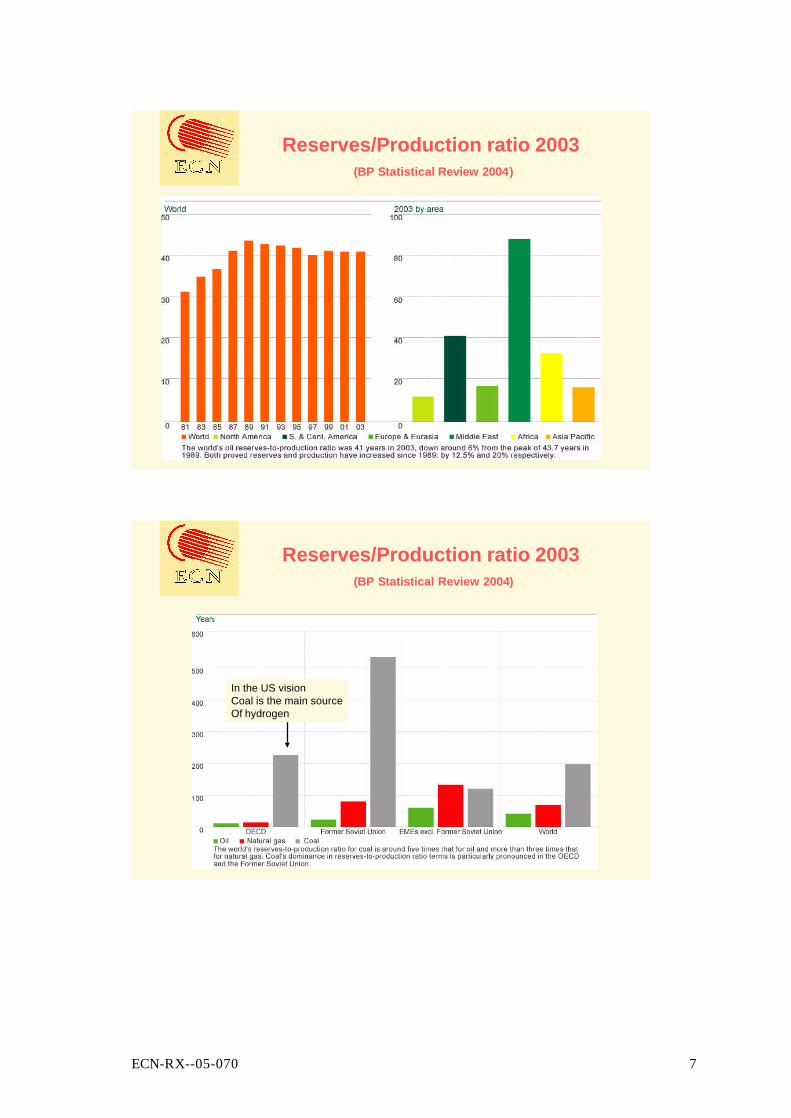
Reserves/Production ratio 2003(BP Statistical Review 2004)
Reserves/Production ratio 2003(BP Statistical Review 2004)
In the US visionCoal is the main sourceOf hydrogen
8 ECN-RX--05-070
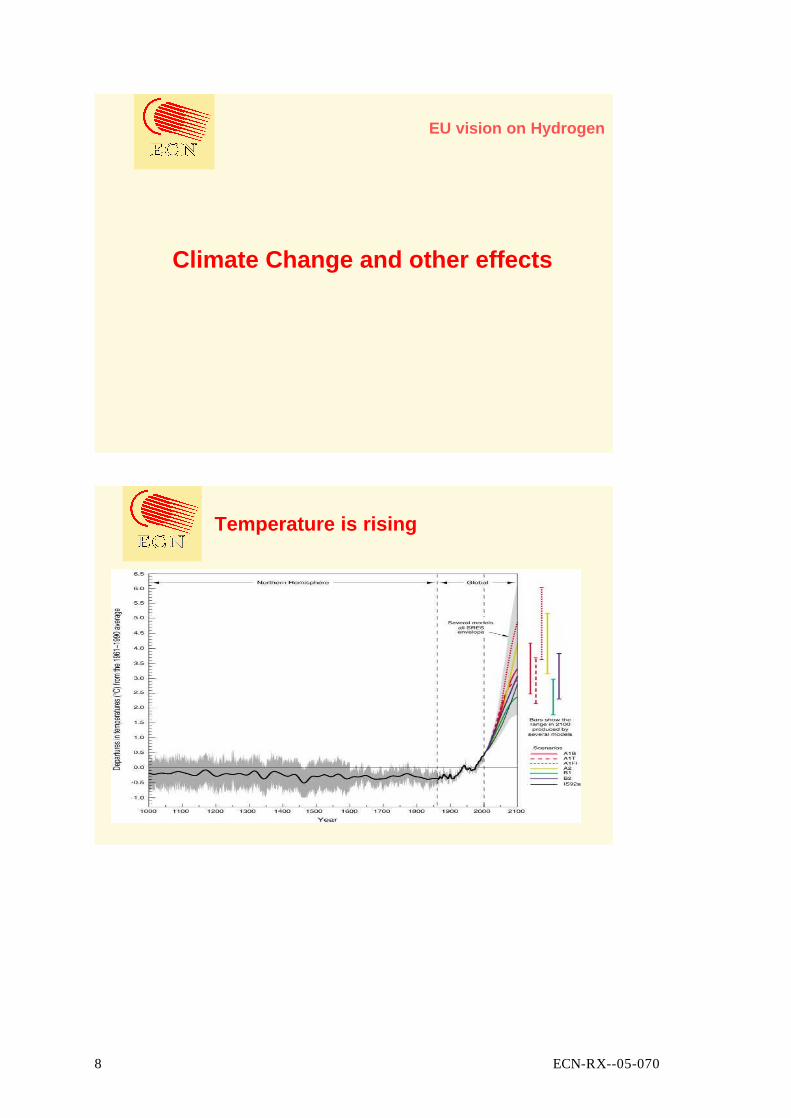
Climate Change and other effects
EU vision on Hydrogen
Temperature is rising
ECN-RX--05-070 9
150
180
210
240
270
300
330
360
390
0.E+001.E+052.E+053.E+054.E+05Years before present
CO
2 in
trap
ped
air [
ppm
v]
-12
-9
-6
-3
0
3
6
9
12Te
mp.
Dev
iatio
n [°
C] Carbon dioxide
Temperature
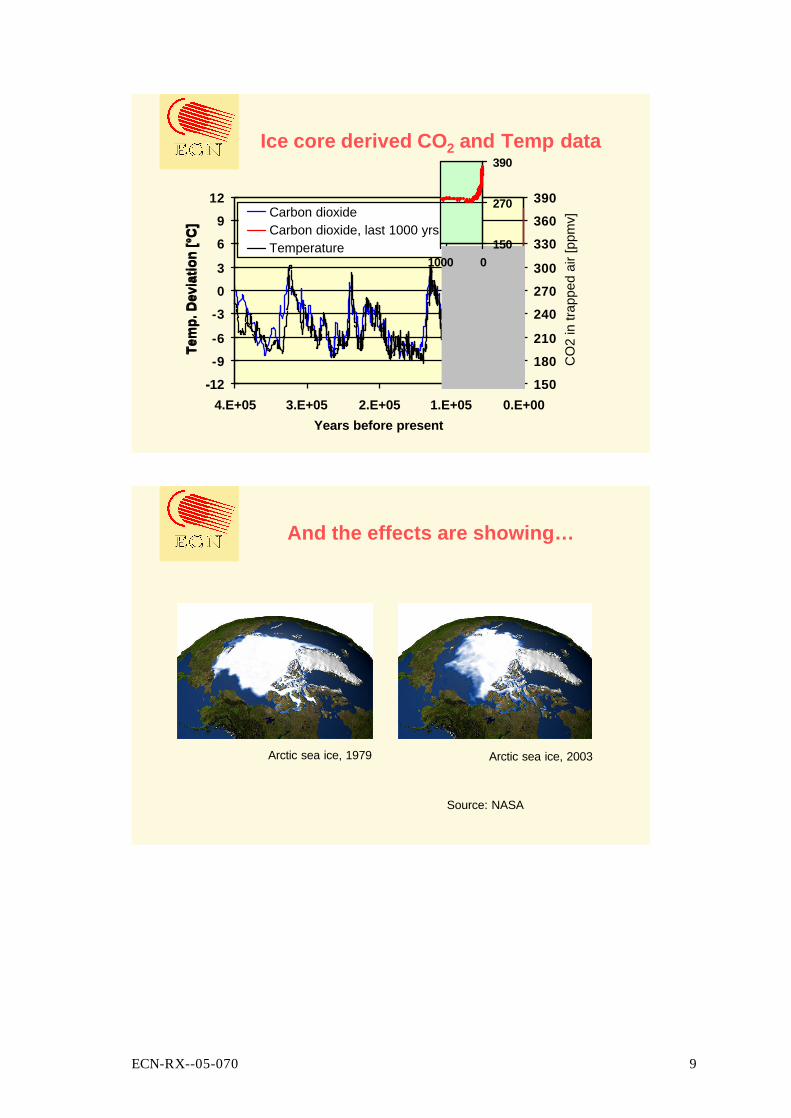
Ice core derived CO2 and Temp data
150
180
210
240
270
300
330
360
390
0.E+001.E+052.E+053.E+054.E+05Years before present
CO
2 in
trap
ped
air [
ppm
v]
-12
-9
-6
-3
0
3
6
9
12Te
mp.
Dev
iatio
n [°
C]
Carbon dioxideCarbon dioxide, last 1000 yrsTemperature 150
270
390
01000
And the effects are showing…
Source: NASA
Arctic sea ice, 1979 Arctic sea ice, 2003
10 ECN-RX--05-070
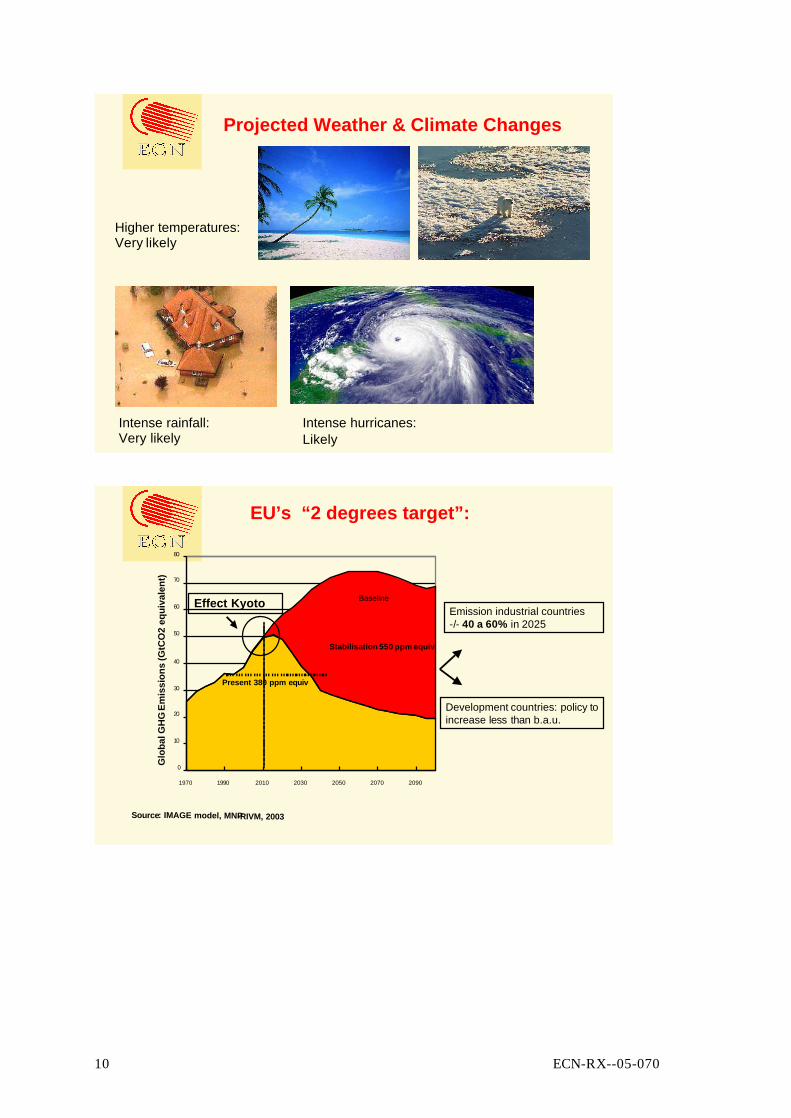
Projected Weather & Climate Changes
Higher temperatures:Very likely
Intense hurricanes:Likely
Intense rainfall:Very likely
Source: IMAGE model, MNP-RIVM, 2003
EU’s “2 degrees target”:
Emission industrial countries-/- 40 a 60% in 2025
Development countries: policy toincrease less than b.a.u.
Glo
balG
HG
Em
issi
ons
(GtC
O2
equi
vale
nt)
0
10
20
30
40
50
60
70
80
1970 1990 2010 2030 2050 2070 2090
Baseline
Stabilisation 550 ppm equiv
Effect Kyoto
Present 380 ppm equiv

ECN-RX--05-070 11
Paris RotterdamLos Angeles
Urban Air Pollution, the concern of today.
NO2 + NO
NMHC
CO
Soot
Noise
CO2
Smogozone
Damage to lung tissue
Inhibits oxygenuptake
Adverse effect on immune system
Carcinogenicsubstances
+ NO2 + NMHC
Transport: the effect of vehicle emissions
Respiratory problems
NOx emissions per sector, Netherlands 2000
Mln kg
165
103
20
50
3712 15
road transportother transportresidentialelectricity generationindustryagricultureothers
12 ECN-RX--05-070
Targets from NMP 4
0
50
100
150
200
250
300
Mt C
O2-
eq/ja
ar
1990 2000 2010 2020 2030
year
Red.other GHG'sEnergy savingsrenewableEfficiency improvementCO2-sequestration
Dutch target
business as usual
Other em
issions
• 80-90% NOx• 80-90% SO2• 75-90% NMHC• 85-95% particles• 75-85% NH330 % reduction in
2030*
(150 Mton)
* Present political discussion: why not force 2030 target to 2020 ?
What can we do?
Renew
ableEnergy
Effic
ient
Ener
gyU
se
Clean and Efficient Useof Fossil Fuels
H2And
Fuel Cells
BuildingsIndustriesTransport
WindSolar
Biomass
Supply sideDemand-side
ECN-RX--05-070 13
.
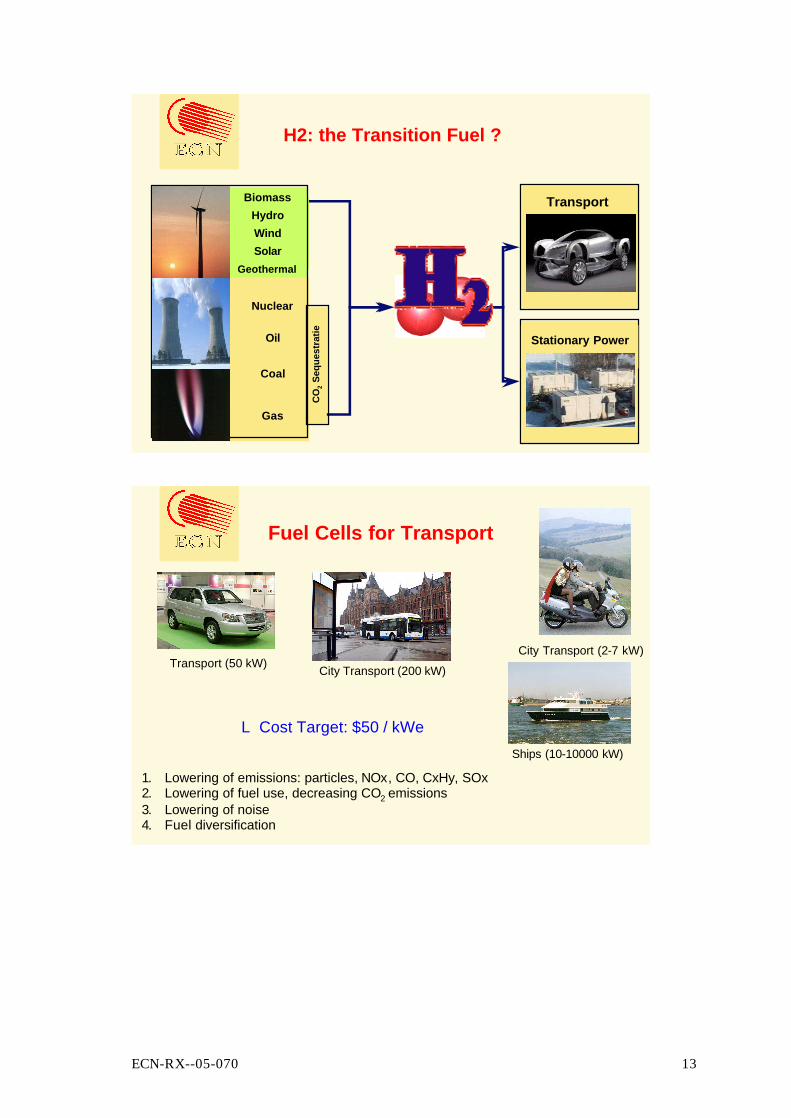
Stationary Power
TransportBiomassHydroWindSolar
Geothermal
Coal
Nuclear
Gas
Oil
CO
2Se
ques
trat
ie
H2: the Transition Fuel ?
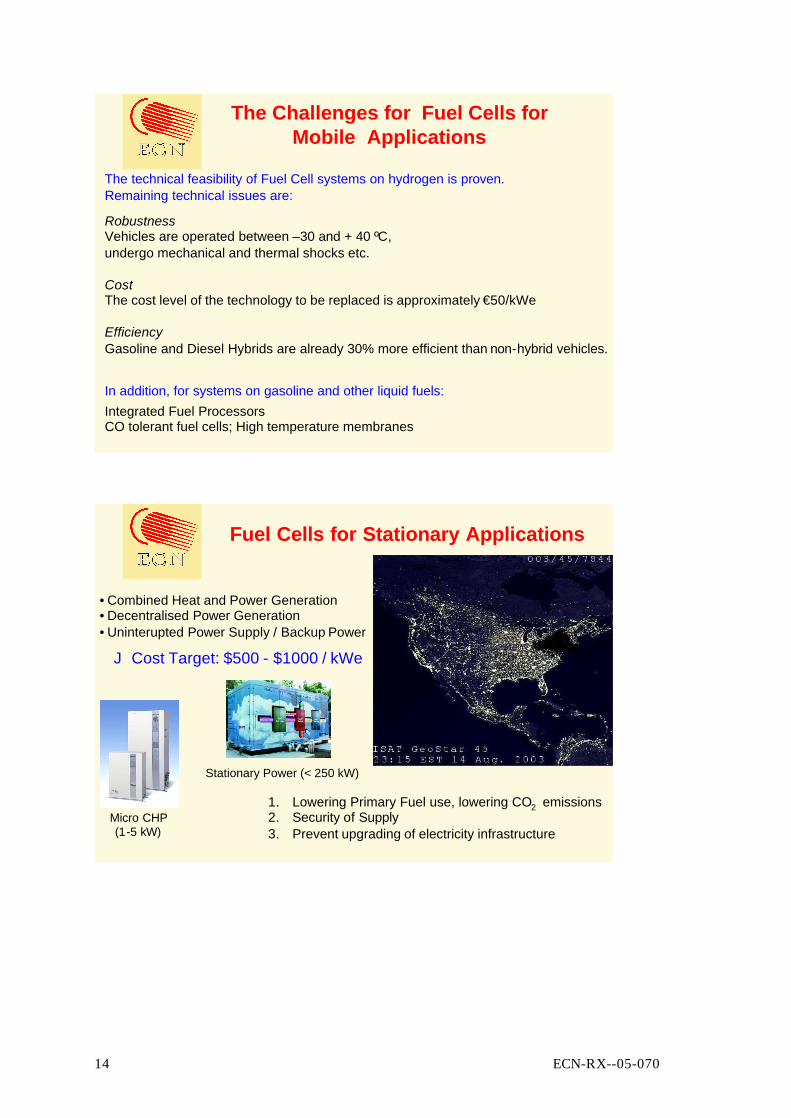
Fuel Cells for Transport
1. Lowering of emissions: particles, NOx, CO, CxHy, SOx2. Lowering of fuel use, decreasing CO2 emissions3. Lowering of noise4. Fuel diversification
Ships (10-10000 kW)
City Transport (200 kW)Transport (50 kW)City Transport (2-7 kW)
L Cost Target: $50 / kWe
14 ECN-RX--05-070
The Challenges for Fuel Cells for Mobile Applications
In addition, for systems on gasoline and other liquid fuels: Integrated Fuel ProcessorsCO tolerant fuel cells; High temperature membranes
The technical feasibility of Fuel Cell systems on hydrogen is proven. Remaining technical issues are:
RobustnessVehicles are operated between –30 and + 40 ºC, undergo mechanical and thermal shocks etc.
CostThe cost level of the technology to be replaced is approximately €50/kWe
EfficiencyGasoline and Diesel Hybrids are already 30% more efficient than non-hybrid vehicles.
Fuel Cells for Stationary Applications
• Combined Heat and Power Generation• Decentralised Power Generation• Uninterupted Power Supply / Backup Power
1. Lowering Primary Fuel use, lowering CO2 emissions2. Security of Supply3. Prevent upgrading of electricity infrastructure
Micro CHP(1-5 kW)
Stationary Power (< 250 kW)
J Cost Target: $500 - $1000 / kWe

ECN-RX--05-070 15
Electricity(30 arbitrary
units)
Heat(60 arbitrary
units)
Energy saving by home based CHP with fuel cells
Powerplant(42%)
Homeboiler
(100%)
Traditional, separated generation
100
Natural Gas
Sum: 131 Sum: 100( ) %24131
100131savingsenergy =−
=
71
60
NG/coal
Natural Gas
Energy saving co-generation
Electricity(30%)
Heat(60%)
The Challenges for Fuel Cells for Stationary Applications
Fuel Cell systems on natural Gas will become available. Remaining technical issues are:
Durability: 40,000 hours are needed: PAFC systems approach this targetSOFC and PEMFC systems on natural gas are not even close
Cost: €1000 - €1500 / kWe: PAFC systems will not be able to meet the cost target.PEMFC systems and SOFC systems will meet the stationary cost targetFor larger systems this target will be easier to meet than for 1 kWe systems.
Efficiency:In large applications (2 MW), competing CHP technologies show 43% el.efficiency For 1- 5 kWe systems, 35% - 40% is needed
16 ECN-RX--05-070
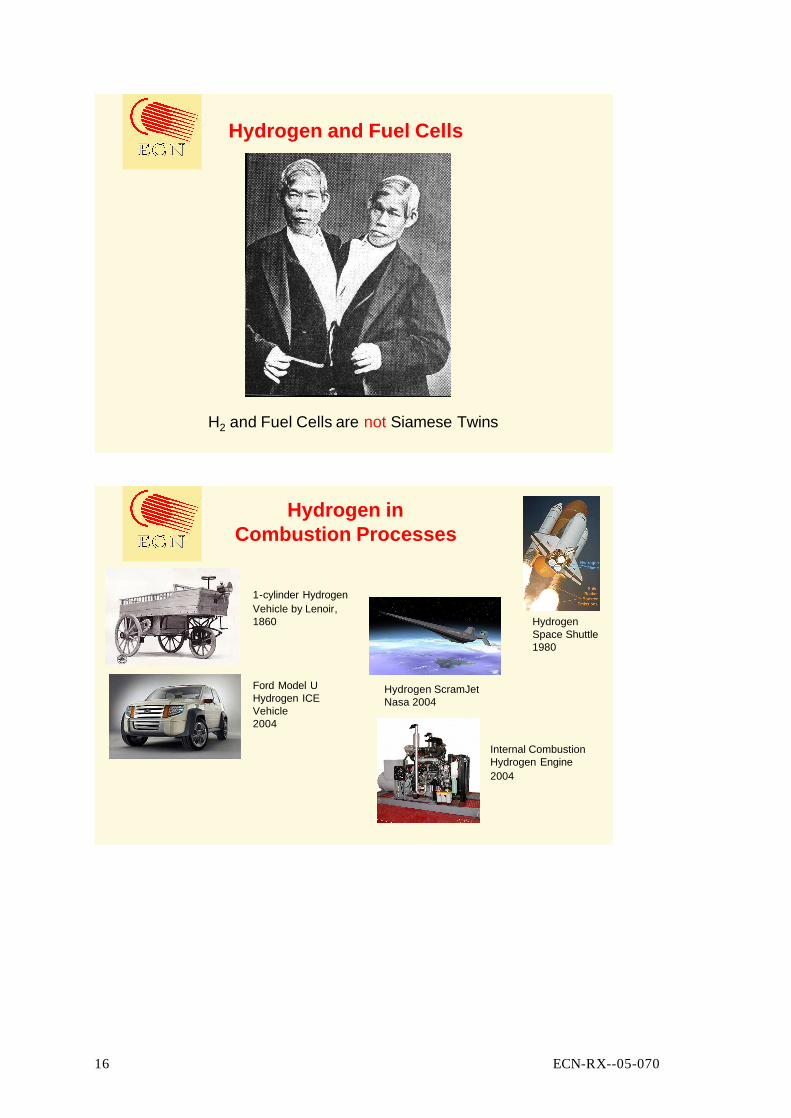
Hydrogen and Fuel Cells
H2 and Fuel Cells are not Siamese Twins
Hydrogen in Combustion Processes
Internal CombustionHydrogen Engine2004
1-cylinder HydrogenVehicle by Lenoir,1860
Ford Model UHydrogen ICEVehicle2004
Hydrogen ScramJetNasa 2004
Hydrogen Space Shuttle1980
ECN-RX--05-070 17
Fuel Cells powered bycarbon-fuels
Fuel Cell Caron methanol2001
100 kWeSolid Oxide Fuel Cell,On natural gas2001
PEMFCMicro CHPon natural gas1-5 kWe2003
200 kWePhosphoricAcid Fuel Cell,On natural gas1993
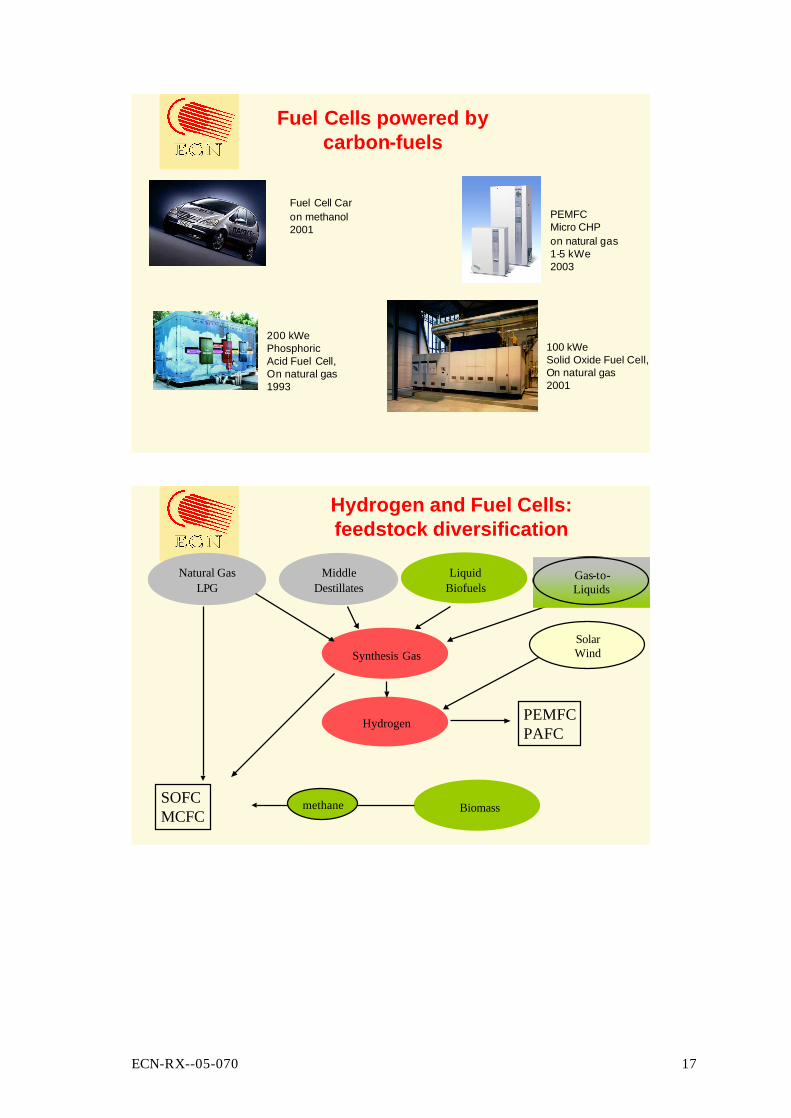
Hydrogen and Fuel Cells: feedstock diversification
PEMFCPAFC
SOFCMCFC
Hydrogen
SolarWind
MiddleDestillates
Biomass
Natural GasLPG
Liquid Biofuels
Synthesis Gas
methane
Gas-to-Liquids
18 ECN-RX--05-070
Renewable Hydrogen:the Potential in the Netherlands
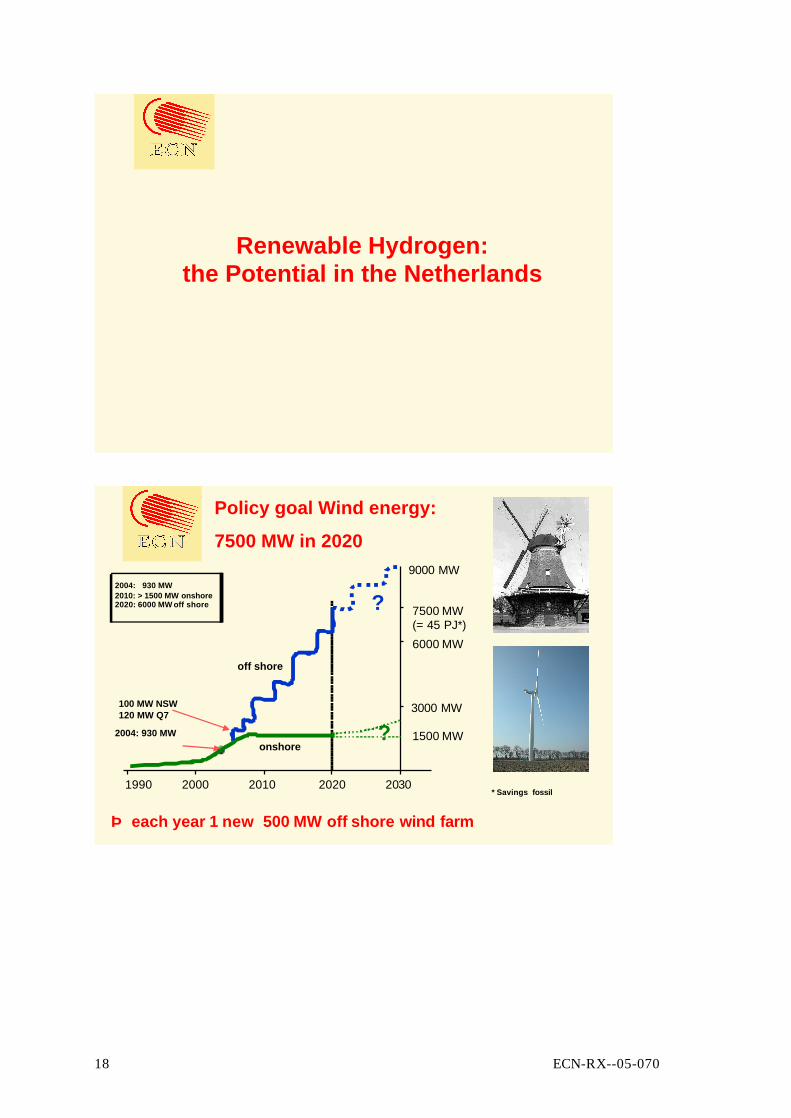
Policy goal Wind energy:
7500 MW in 2020
1990 2000 2010 2020 2030
off shore
onshore
3000 MW
6000 MW
9000 MW
2004: 930 MW
2004: 930 MW 2010: > 1500 MW onshore2020: 6000 MW off shore 7500 MW
(= 45 PJ*)
100 MW NSW120 MW Q7
1500 MW
?
?
⇒ each year 1 new 500 MW off shore wind farm
* Savings fossil
ECN-RX--05-070 19
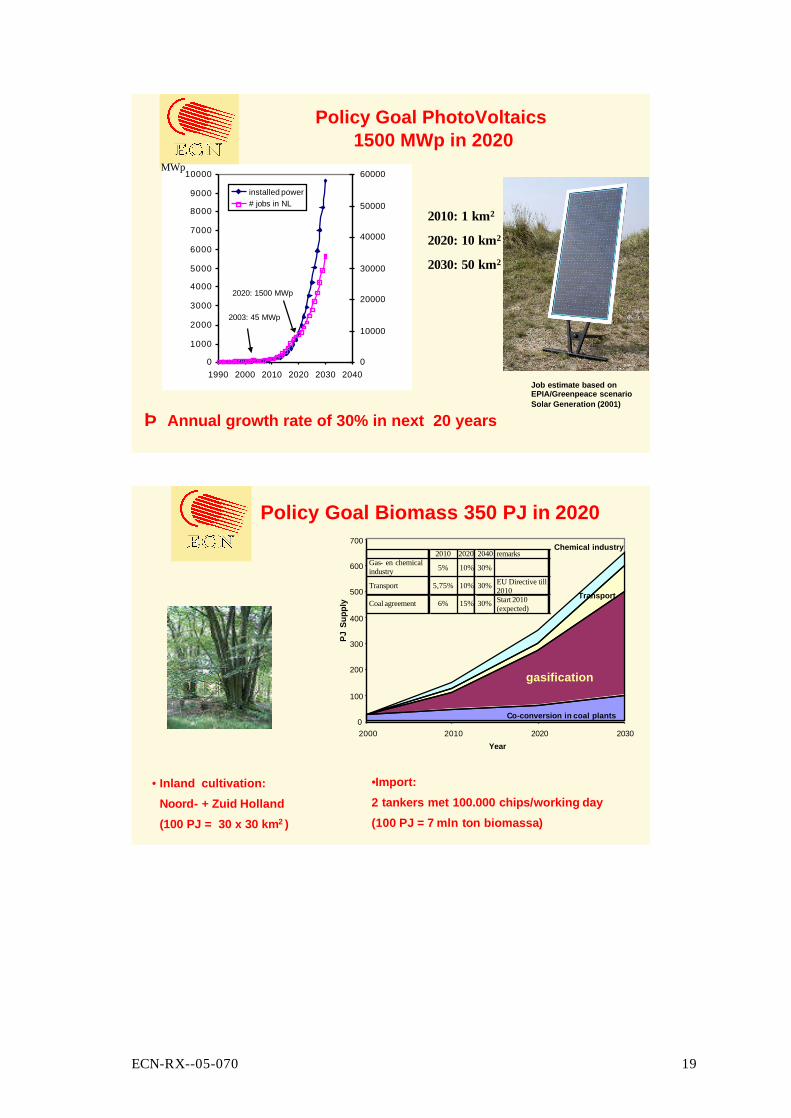
Policy Goal PhotoVoltaics1500 MWp in 2020
2010: 1 km2
2020: 10 km2
2030: 50 km2
Job estimate based on EPIA/Greenpeace scenario Solar Generation (2001)
0
1000
2000
3000
4000
5000
6000
7000
8000
9000
10000
1990 2000 2010 2020 2030 20400
10000
20000
30000
40000
50000
60000
installed power# jobs in NL
2020: 1500 MWp
2003: 45 MWp
⇒ Annual growth rate of 30% in next 20 years
MWp
0
100
200
300
400
500
600
700
2000 2010 2020 2030Year
PJ S
uppl
y
Chemical industry
Co-conversion in coal plants
gasification
Transport
2010 2020 2040 remarks Gas- en chemical industry 5% 10% 30%
Transport 5,75% 10% 30% EU Directive till 2010
Coal agreement 6% 15% 30% Start 2010 (expected)
• Inland cultivation:Noord- + Zuid Holland(100 PJ = 30 x 30 km2 )
•Import:2 tankers met 100.000 chips/working day(100 PJ = 7 mln ton biomassa)
Policy Goal Biomass 350 PJ in 2020
20 ECN-RX--05-070
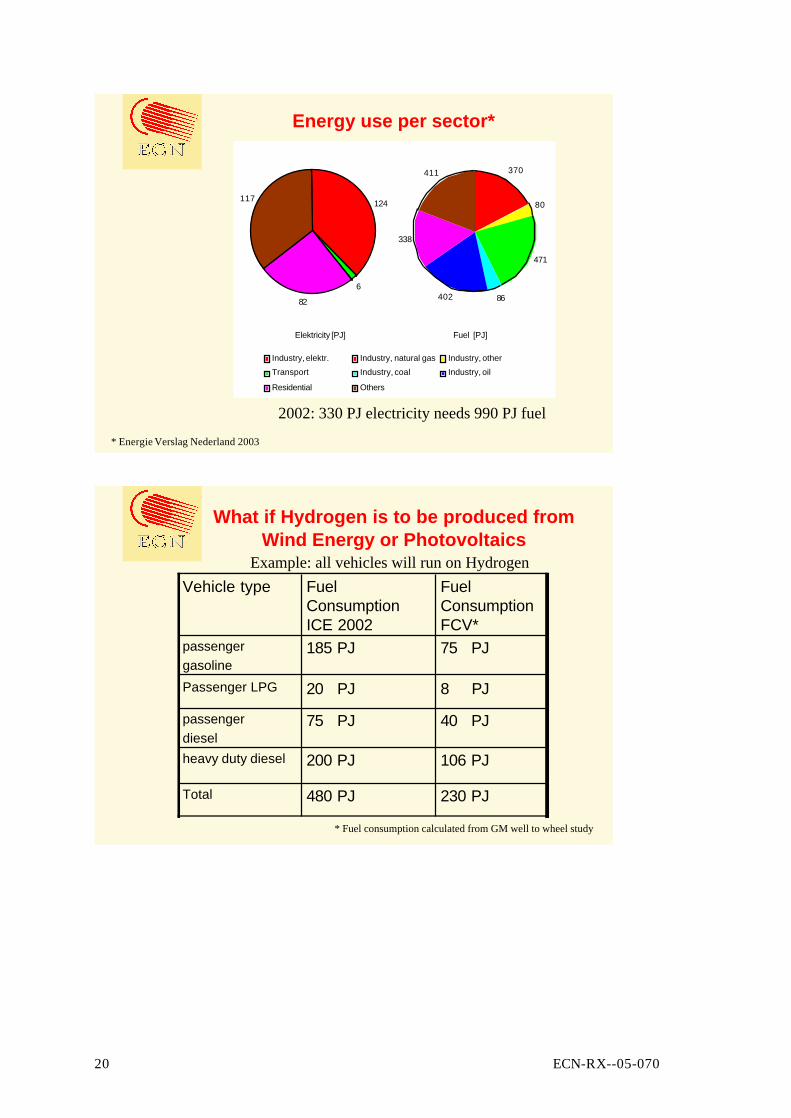
Elektricity [PJ]
124
6
82
117
Industry, elektr. Industry, natural gas Industry, otherTransport Industry, coal Industry, oil
Residential Others
Fuel [PJ]
370
80
471
86402
338
411
Energy use per sector*
2002: 330 PJ electricity needs 990 PJ fuel
* Energie Verslag Nederland 2003
What if Hydrogen is to be produced fromWind Energy or Photovoltaics
Example: all vehicles will run on Hydrogen
230 PJ480 PJTotal
106 PJ200 PJheavy duty diesel
40 PJ75 PJpassengerdiesel
8 PJ20 PJPassenger LPG
75 PJ185 PJpassengergasoline
Fuel Consumption FCV*
Fuel Consumption ICE 2002
Vehicle type
* Fuel consumption calculated from GM well to wheel study
ECN-RX--05-070 21
Hydrogen supply from Wind Energy and Photovoltaics: 2020
7500 MW Wind energy renders: 70 PJ electricity1500 MW Solar PV renders: 5 PJ electricity
Efficiency electrolyser: max 85% (at present: 75%)
75 PJ electricity renders 63.5 PJ hydrogen
We needed: 230 PJ total (123 PJ passenger cars + 107 PJ Heavy Duty)
Assuming 100% efficiency in distribution and storage
Hydrogen supply from Biomass: 2020
350 PJ Biomass renders: 183 PJ hydrogen
Total supply Renewable Hydrogen: 245 PJ hydrogen
We needed for transport: 230 PJ total
Assuming 100% efficiency in distribution and storage
44 PJ wind + PVelectricity renders: 63.5 PJ hydrogen
22 ECN-RX--05-070
Wind Energy and PhotovoltaicsHow to use this electricity
By using the 75 PJ electricity directly as electricity, we save:170 PJ natural gas
(using 44% as average electricity generation efficiency)
Only when the wind energy supply cannot be absorbed by thegrid (e.g. big windfarms in the night at > 8 Beaufort), hydrogen production is a good alternative over Windfarmmanagement aimed at lower power generation
Via electrolysis, 75 PJ electricity renders 63.5 PJ hydrogenBy steam reforming, we would need 79 PJ natural gasfor generating this hydrogen
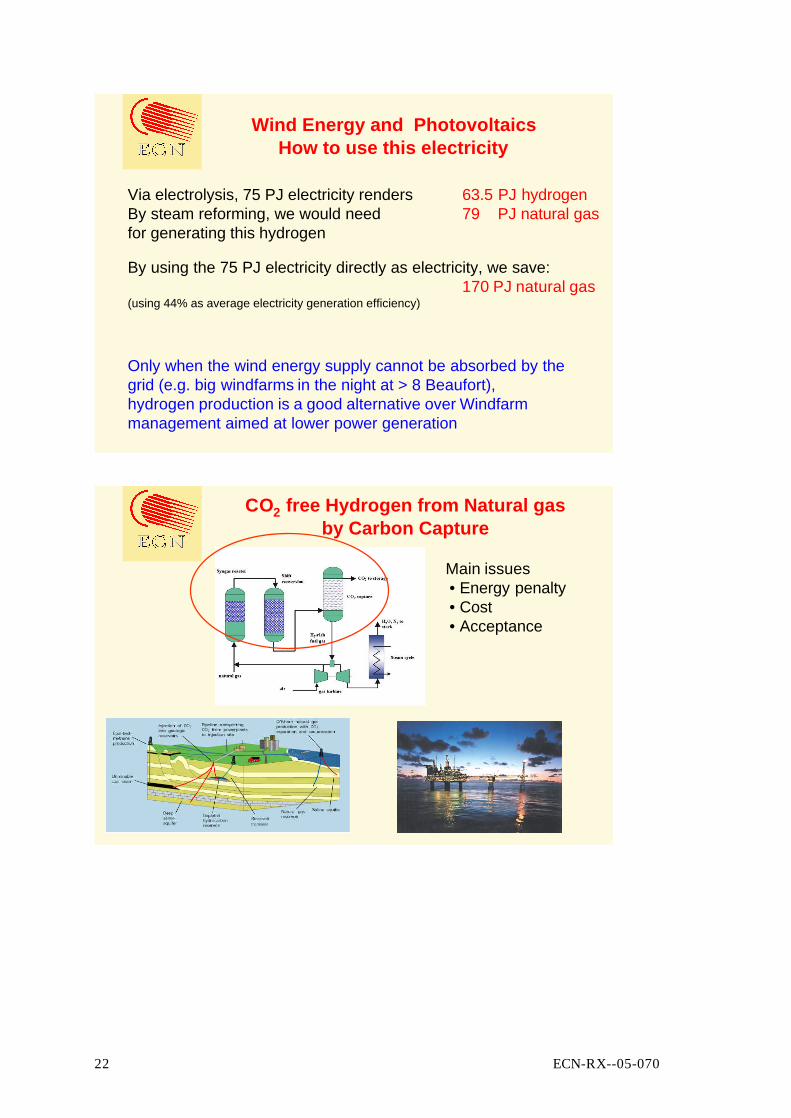
CO2 free Hydrogen from Natural gas by Carbon Capture
Main issues• Energy penalty• Cost• Acceptance
ECN-RX--05-070 23
electric
powerPEMFC
electrolyser
Oxygen
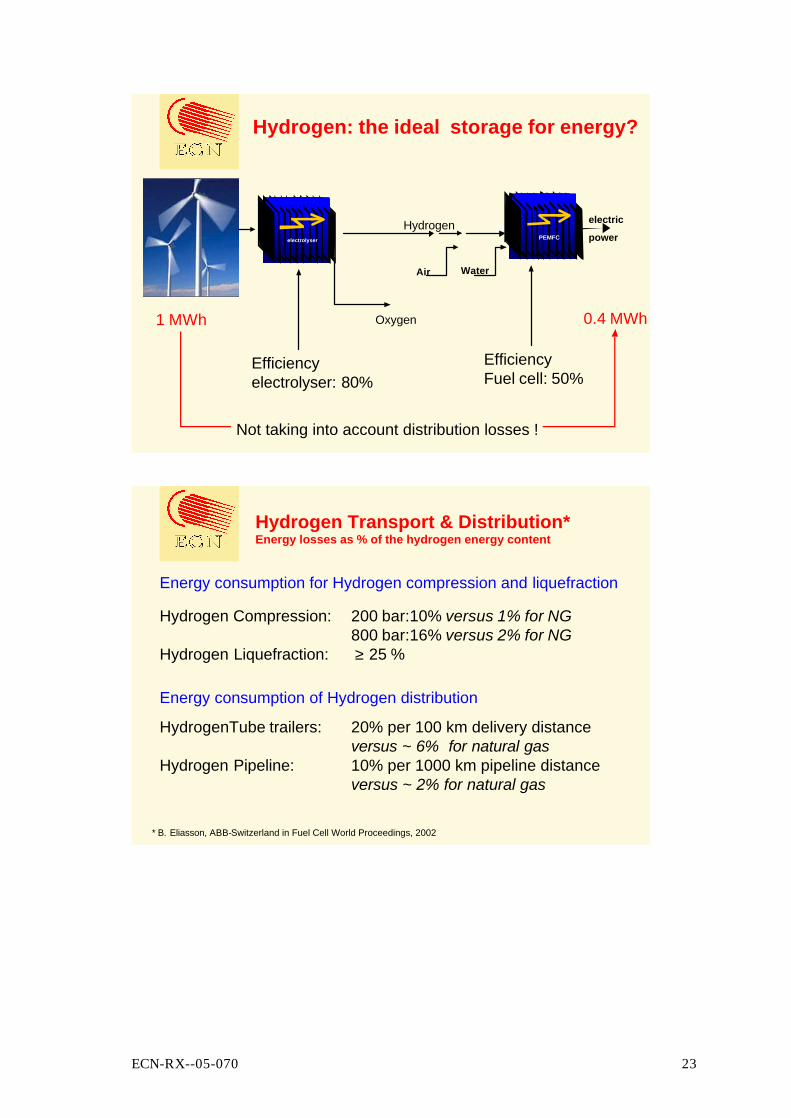
Hydrogen: the ideal storage for energy?
WaterAir
PEMFCHydrogen
EfficiencyFuel cell: 50%
Efficiencyelectrolyser: 80%
0.4 MWh1 MWh
Not taking into account distribution losses !
Hydrogen Transport & Distribution*Energy losses as % of the hydrogen energy content
Hydrogen Compression: 200 bar:10% versus 1% for NG800 bar:16% versus 2% for NG
Hydrogen Liquefraction: ≥ 25 %
Energy consumption for Hydrogen compression and liquefraction
HydrogenTube trailers: 20% per 100 km delivery distanceversus ~ 6% for natural gas
Hydrogen Pipeline: 10% per 1000 km pipeline distanceversus ~ 2% for natural gas
Energy consumption of Hydrogen distribution
* B. Eliasson, ABB-Switzerland in Fuel Cell World Proceedings, 2002

24 ECN-RX--05-070
Hydrogen for Transport
Vision 2010 California
The "Vision 2010" for California's Hydrogen Highways is to ensure that by the end of the decade every Californian has access to hydrogen fuel along the State's major highways, with a significant and increasing percentage of that hydrogen produced from clean, renewable sources. This vision for California is real and attainable; however, it will take time so we must plant the seeds now.
Don’t underestimate the retail logistics
World wide number of hydrogen filling stations 2003/2004: 80Number of petrol stations:Netherlands: 3,750 (1/11 km²)Western Europe: 80,000 (1/20 km²)USA: 187,000 (1/50 km²)
IcelandJapan
ECN-RX--05-070 25
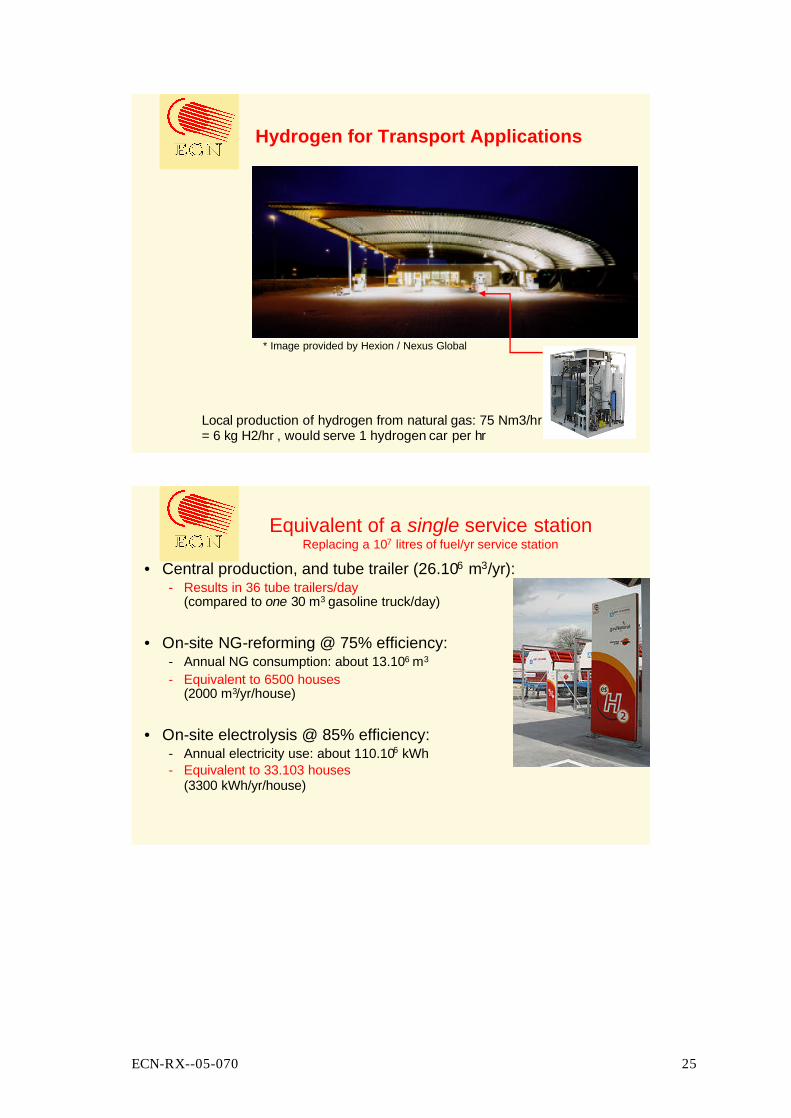
Hydrogen for Transport Applications
Local production of hydrogen from natural gas: 75 Nm3/hr= 6 kg H2/hr , would serve 1 hydrogen car per hr
* Image provided by Hexion / Nexus Global
Equivalent of a single service stationReplacing a 107 litres of fuel/yr service station
• Central production, and tube trailer (26.106 m3/yr):- Results in 36 tube trailers/day
(compared to one 30 m3 gasoline truck/day)
• On-site NG-reforming @ 75% efficiency:- Annual NG consumption: about 13.106 m3
- Equivalent to 6500 houses(2000 m3/yr/house)
• On-site electrolysis @ 85% efficiency:- Annual electricity use: about 110.106 kWh- Equivalent to 33.103 houses
(3300 kWh/yr/house)
26 ECN-RX--05-070
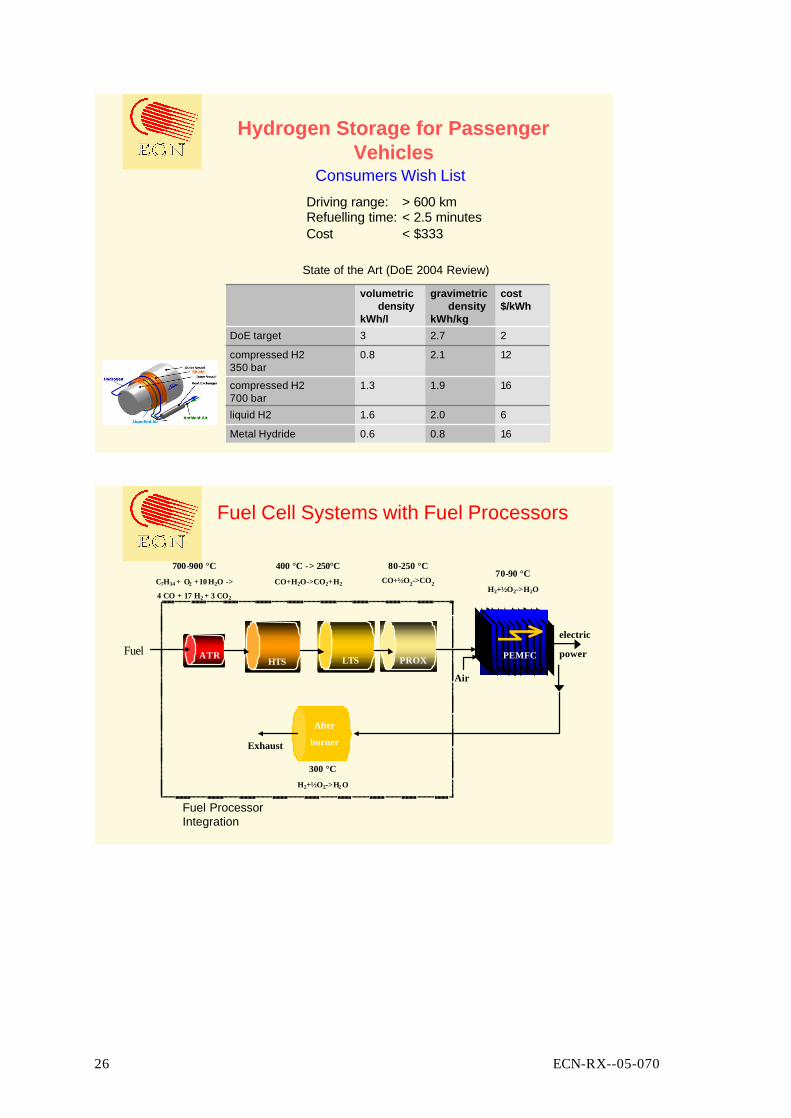
Hydrogen Storage for Passenger Vehicles
Consumers Wish ListDriving range: > 600 kmRefuelling time: < 2.5 minutesCost < $333
160.80.6Metal Hydride
62.01.6liquid H2
161.91.3compressed H2700 bar
122.10.8compressed H2350 bar
22.73DoE target
cost$/kWh
gravimetric density
kWh/kg
volumetric density
kWh/l
State of the Art (DoE 2004 Review)
electric
power
700-900 °CC7H14 + O2 +10 H2O ->
4 CO + 17 H2 + 3 CO2
400 °C -> 250°CCO+H2O->CO2+H2
300 °CH2+½O2->H2 O
PEMFC
PROXLTSHTS
After
burner
PEMFCATRFuel
Fuel Cell Systems with Fuel Processors
Exhaust
Air
80-250 °CCO+½O2->CO2
70-90 °CH2+½O2->H2O
Fuel ProcessorIntegration

ECN-RX--05-070 27
Which option is to be preferred?• Hydrogen in Internal Combustion Engines• Gasoline in Fuel Cell vehicles• Hydrogen in Fuel Cell vehicles• Gasoline in ICE hybrid vehicles• Hydrogen from biomass?………………………..
For a comparison which makes sense, a well to wheel assessment is needed
Well to Tank (GM/LBST study)
871.16gasoline
221.91Compressed H2 (700 bar)from Biomass
01.66Compressed H2 (700 bar)from Wind energy
2084.64Compressed H2 (700 bar) from EU-mix electricity
1242.14Liquid H2 from natural gas
1031.87Compressed H2 (700 bar)from natural gas
g CO2/MJfuelMJ/MJFuel Pathway

28 ECN-RX--05-070
Tank to Wheeland Well to Wheel (GM/LBST study)
1.05
1.49
1.54
1.78
2.03
2.44
MJ/km
108
153
133
154
209
211
g CO2/km
Hydrogen ICE HEV
Gasoline FCV HEV
Gasoline ICE HEV
Hydrogen ICE
Hydrogen FCV HEV
Gasoline ICE (2010)
Vehicle
700 bar Hydrogen from Natural Gas
Well to Wheel for Hydrogen FCV HEV(GM/LBST study)
211
0
23
108
218
g CO2/km
Reference ICE 2010
Wind
Biomass
Natural Gas
Electricity EU-mix
Hydrogen Source

ECN-RX--05-070 29
Gasoline Hybrid ICE2004
Gasoline ICE2003
Hydrogen FCV2003
Hydrocarbon FCV2003
0.030.03
0.48NOxHC
CO0.01 0.02
0.0080.0000.036
00
0g/kmg/km
g/km
Vehicle emissions: Tank to Wheel and Well to Wheel
*: hydrogen produced by natural gas reforming
170/211CO2No reliable data 0/80* g/km
0.18104/123
Hydrogen Supply Costs
IEA World Energy Investment Outlook 2003
22-37Compressed Hydrogen from WindVia electrolysis; highest cost for off-shore
52-82Compressed Hydrogen from PVVia electrolysis
14-25Compressed Hydrogen from biomass (poplar plantation)
12-18 1Compressed Hydrogen from NG (incl CO2 capture)
7-9Natural Gas
8-10Gasoline
Supply Cost* $/GJFuel
* Cost of fuel, production, transport and refuelling
30 ECN-RX--05-070
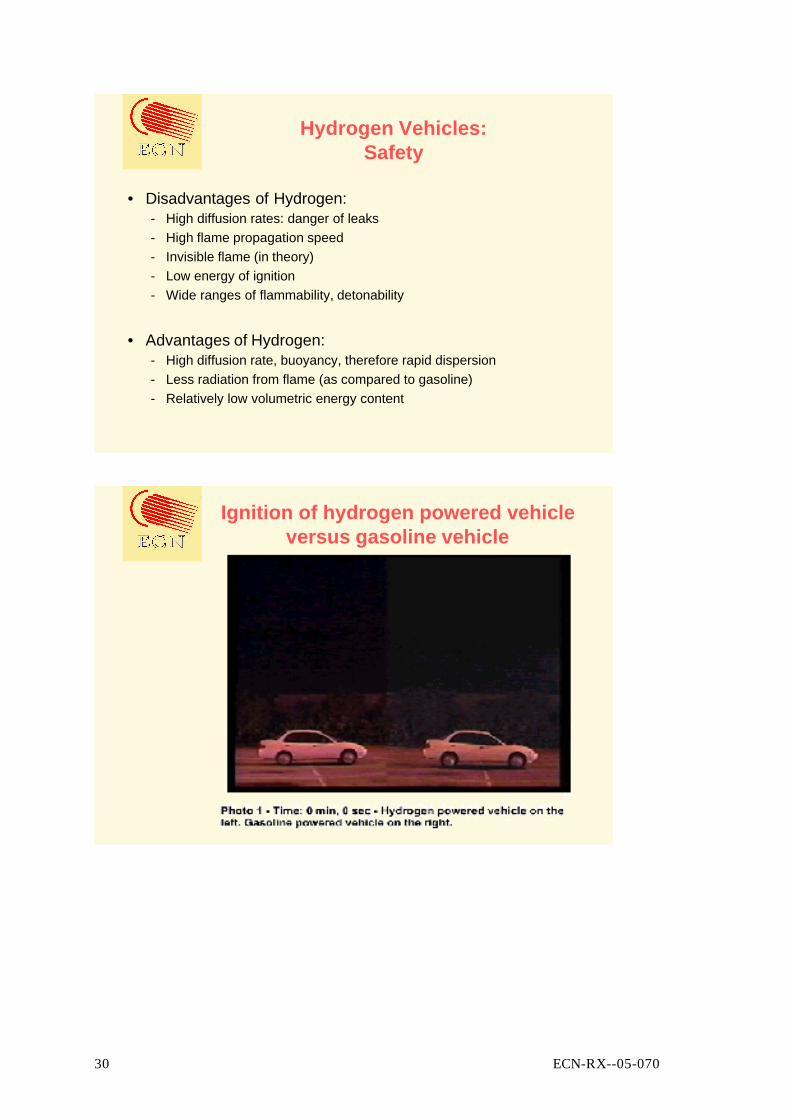
Hydrogen Vehicles:Safety
• Disadvantages of Hydrogen:- High diffusion rates: danger of leaks- High flame propagation speed- Invisible flame (in theory)- Low energy of ignition- Wide ranges of flammability, detonability
• Advantages of Hydrogen:- High diffusion rate, buoyancy, therefore rapid dispersion- Less radiation from flame (as compared to gasoline)- Relatively low volumetric energy content
Ignition of hydrogen powered vehicle versus gasoline vehicle

ECN-RX--05-070 31
≈ 60 M3/min ≈ 5 kg/min ≈ 1 full tank /min!

32 ECN-RX--05-070

ECN-RX--05-070 33
Pressure vessel are intensively tested
Result of a gunfire test
Conclusions
We need to decrease emissions associated with fossil fuel combustionAll options are needed simultaneously: Wind, Solar, Biomass, CO2 capture, Efficiency improvement
Hydrogen offers an enormous potential, but take care how to use it• Hydrogen from Wind and PV is only an option when the electricity
cannot be used directly
• Hydrogen will be produced from fossil fuels and biomass in the coming decades
• Hydrogen is NOT an ideal storage medium of energy
• Hydrogen transport leads to significant losses of energy

34 ECN-RX--05-070
So what should we do?
Fuel Cells onHydrogen and Fuel Processors formobile & stationary nichemarkets
Hydrogen from Fossil fuels and BiomassCO2 sequestration
Renewable Hydrogen
Design and Construction of
An Energy efficient H
ydrogen Infrastructure
Time
Large Scale Introduction of Fuel Cells:Hydrogen from Natural Gas and Biomass
CO
2re
duct
ion
OUR ENERGY SUPPLY AND CLIMATE
ARE TOO IMPORTANT TO BE DICTATED
BY THE SHORT TERM INTERESTS OF
CONSUMERS AND SHARE HOLDERS
ACTION !

ECN-RX--05-070 35

36 ECN-RX--05-070


![Amine-Directed Hydrogen-Bonded Two-Dimensional ... · Amine-Directed Hydrogen-Bonded Two-Dimensional Supramolecular Structures Sepideh Afsari,[a] Zhihai Li,[b] andEric Borguet*[a]](https://img.dokumen.tips/doc/110x75/604bdd702fdfb51af927657b/amine-directed-hydrogen-bonded-two-dimensional-amine-directed-hydrogen-bonded.jpg)