Embed Size (px)
Citation preview

Fighting Hunger & Malnutrition
The HUNGaMA Survey Report
The report is created with the help of RealHCGDropsGuide.comThe H
UN
GaM
A Survey Report – 2011
Naandi Foundation
502, Trendset Towers
Road 2, Banjara Hills
Hyderabad 500 034
India
Phone: 91 40 2355 6491/2
Fax: 91 40 2355 6537
www.naandi.org
www.hungamaforchange.orgFor further information, contact [email protected]
The HUNGaMA Survey Report has been compiled & published by Naandi Foundation with primary grant support from Avantha Foundation, Soma Enterprise Ltd.and Mahindra & Mahindra Ltd.While photographs are copyright Naandi Foundation, data and information are open source.
1008569_Cover_Corr.pdf 1 12/6/2011 1:17:49 PM
Preface
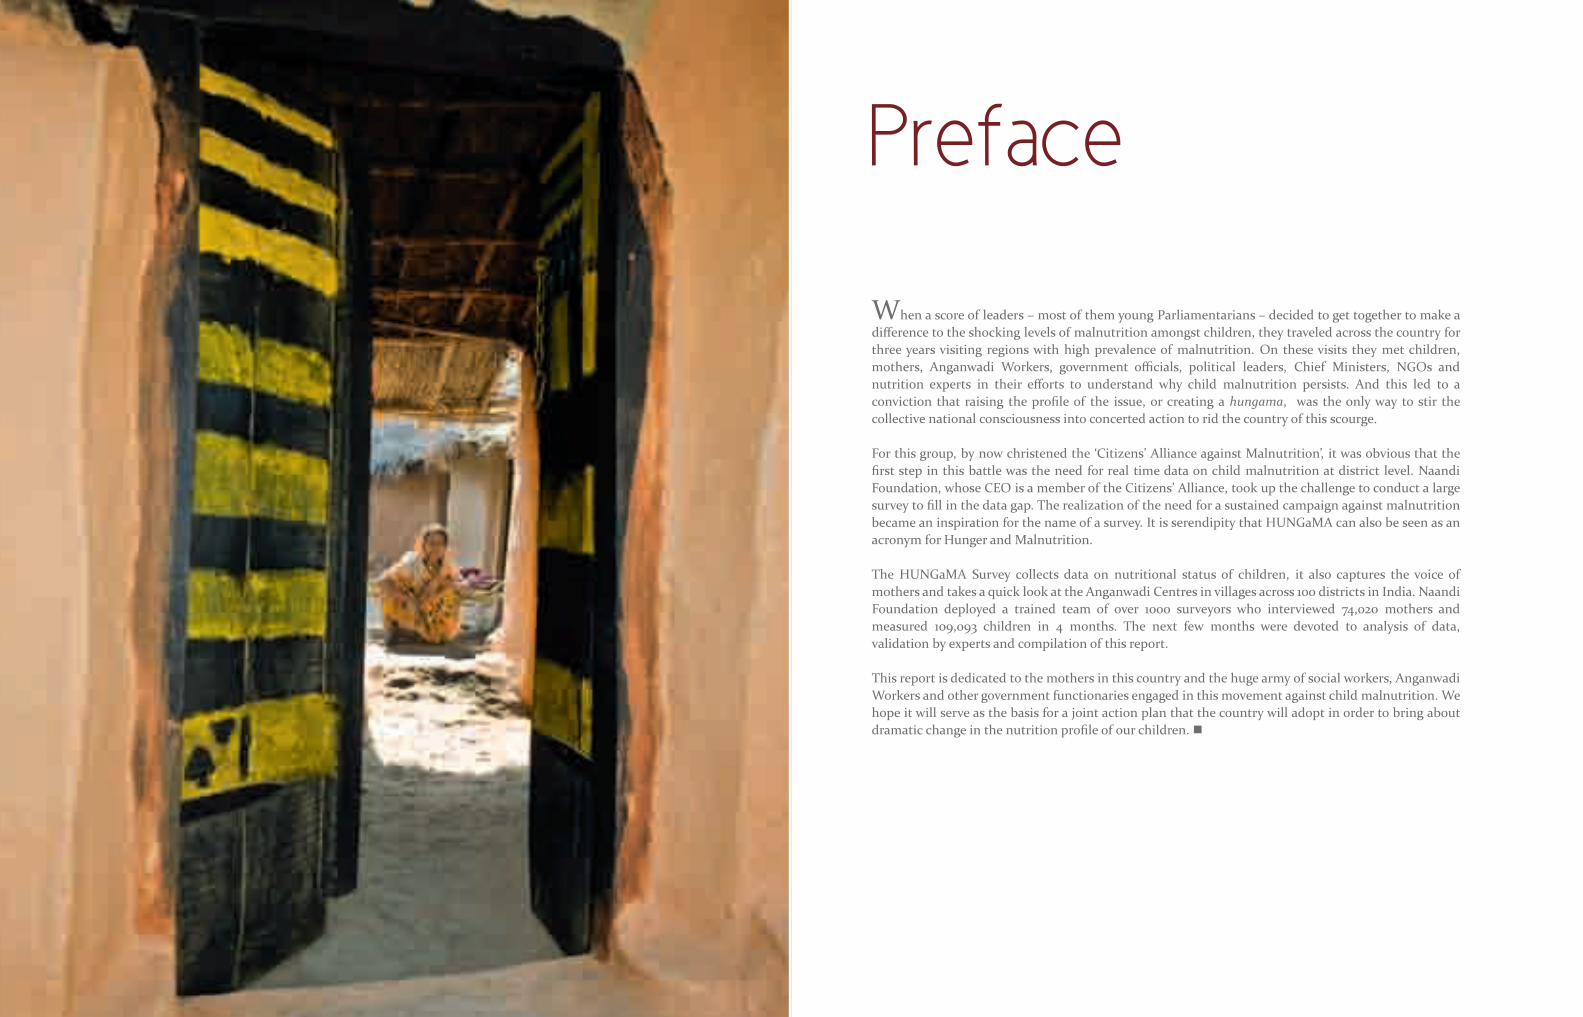
When a score of leaders – most of them young Parliamentarians – decided to get together to make a difference to the shocking levels of malnutrition amongst children, they traveled across the country for three years visiting regions with high prevalence of malnutrition. On these visits they met children, mothers, Anganwadi Workers, government officials, political leaders, Chief Ministers, NGOs and nutrition experts in their efforts to understand why child malnutrition persists. And this led to a conviction that raising the profile of the issue, or creating a hungama, was the only way to stir the collective national consciousness into concerted action to rid the country of this scourge.
For this group, by now christened the ‘Citizens’ Alliance against Malnutrition’, it was obvious that the first step in this battle was the need for real time data on child malnutrition at district level. Naandi Foundation, whose CEO is a member of the Citizens’ Alliance, took up the challenge to conduct a large survey to fill in the data gap. The realization of the need for a sustained campaign against malnutrition became an inspiration for the name of a survey. It is serendipity that HUNGaMA can also be seen as an acronym for Hunger and Malnutrition.
The HUNGaMA Survey collects data on nutritional status of children, it also captures the voice of mothers and takes a quick look at the Anganwadi Centres in villages across 100 districts in India. Naandi Foundation deployed a trained team of over 1000 surveyors who interviewed 74,020 mothers and measured 109,093 children in 4 months. The next few months were devoted to analysis of data, validation by experts and compilation of this report.
This report is dedicated to the mothers in this country and the huge army of social workers, Anganwadi Workers and other government functionaries engaged in this movement against child malnutrition. We hope it will serve as the basis for a joint action plan that the country will adopt in order to bring about dramatic change in the nutrition profile of our children. �
1008569_Cover_F.pdf 2 12/5/2011 6:36:09 PM

Acknowledgements
The HUNGaMA Survey was an idea triggered by the Citizens’ Alliance against Malnutrition. Their interactions with a wide range of stakeholders – from mothers to ministers – made it clear that gaps in current data and knowledge on child malnutrition need to be bridged urgently. And this realization inspired us to draw up a concrete plan for this survey.
This report is the collective effort of a number of organizations, thought leaders, experts and individuals from all walks of life whose contributions have ranged from financial assistance to technical support to strategic guidance to thousands of person hours spent on the field. To all of them our heartfelt gratitude.
The HUNGaMA Survey would not be possible without generous financial support from Avantha Foundation, Soma Enterprise Ltd. and Mahindra & Mahindra whose acts of benevolence enabled this maiden citizens’ initiative to be carried out with complete scientific rigour, with the best skilled resources and in record time.
For his reassuring guidance at the time of planning the survey – what should be measured and how, whether it should be household-based or village-based, on the measurement equipment, on the prevalent debates within government and outside on critical measures of malnutrition – Dr Steve Collins
For showing us the relevance and criticality of understanding the mothers’ dilemma, and thereby making this survey truly the first of its kind – Dr Victor Aguayo
For giving final shape to the report by getting an eminent panel of economists and nutritionists to review the findings – Dr Isher Ahluwalia
For his readiness to add value to our report with his incisive analysis – Dr Abhijit Banerjee
Finally, we owe our deepest thanks to the 74,020 mothers who shared their stories, the 109,093 children who stepped onto weighing machines, the Anganwadi Workers who gave their time, and the village communities across India who opened their homes and hearts to us so that we might help to share their realities with the rest of the world. We hope our efforts do justice to their hospitality and to their cause. �

The task we undertook – of visiting homes, measuring children and interviewing mothers in over 3000 villages of India – was overwhelming at times, fatiguing at others and we would not have pulled through without the support we got from individuals and organizations who had faith in us, and stood solidly by us. To them, names appended below, we say, thank you.
Our partners deserve immense credit for getting the job done. Special mention must go to Dr. Tamara Daley and her team at Westat India, who went above and beyond the call of duty in ensuring the quality and integrity of the survey results. We would also like to thank Claude Avezard who brought the survey to life with his beautiful photographs, and Nevin John who gave HUNGaMA an identity by creating the logo and designing this report.
To our supporters -
thank youGood nutrition is a human right.UNSCN (United Nations Standing Committee on Nutrition)http://www.unscn.org/en/home/why-nutrition-is-important.php
Fighting Hunger & Malnutrition
Dr Ajoy Thachil Dr Aquiel AhmadDr Chanda NimbkarMr CS CowlagiFirmenich Charitable TrustMr Manoj KumarMs Maureen AhmadMs Meher PudumjeeMonisha Amit Bhatia FoundationMs Nandini Roychoudhury
Ms Nikhitha BellamDr Nilanjana MukherjeeDr Rashmi Lakshminarayana Dr Reg HenryMs Rohini MukherjeeDr Rukmini BanerjiDr Sushanta DattaguptaMs Tracy WilliamsMr Vishwas Garg

1 Preface
3 Acknowledgements
7 Table of Contents
8 Executive Summary
11 Survey Methodology
17 HUNGaMA Survey – Findings
19 Nutrition Status of Children 33 Mothers' Voice 49 Anganwadi Services 57 Demography & Nutrition Status
66 Discussion Points
69 District-wise Summary
70 Nutritional Indicators by District 76 District at a glance
207 Appendices
208 I Note on Child Development Index 209 II List of surveyed districts 210 III Note on Sampling Plan & Estimates of Expected Precision 222 IV Format of Survey Tool 236 V Tables to ‘Demography and Nutrition Status’
Contents
8 9
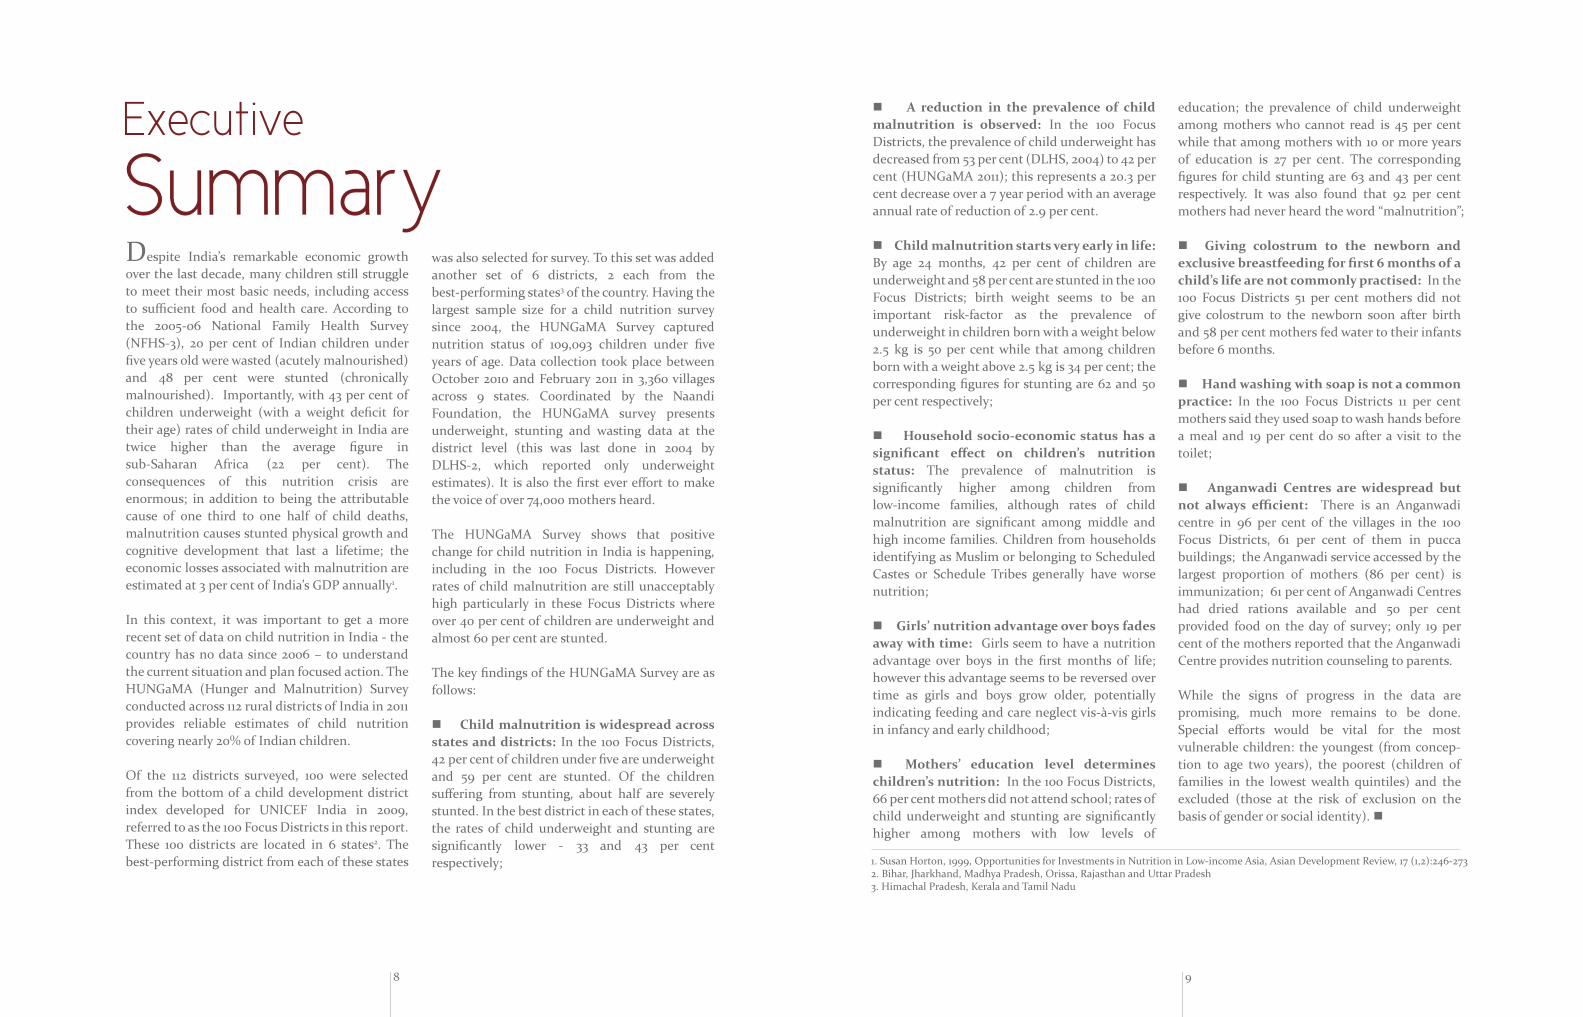
Despite India’s remarkable economic growth over the last decade, many children still struggle to meet their most basic needs, including access to sufficient food and health care. According to the 2005-06 National Family Health Survey (NFHS-3), 20 per cent of Indian children under five years old were wasted (acutely malnourished) and 48 per cent were stunted (chronically malnourished). Importantly, with 43 per cent of children underweight (with a weight deficit for their age) rates of child underweight in India are twice higher than the average figure in sub-Saharan Africa (22 per cent). The consequences of this nutrition crisis are enormous; in addition to being the attributable cause of one third to one half of child deaths, malnutrition causes stunted physical growth and cognitive development that last a lifetime; the economic losses associated with malnutrition are estimated at 3 per cent of India’s GDP annually1.
In this context, it was important to get a more recent set of data on child nutrition in India - the country has no data since 2006 – to understand the current situation and plan focused action. The HUNGaMA (Hunger and Malnutrition) Survey conducted across 112 rural districts of India in 2011 provides reliable estimates of child nutrition covering nearly 20% of Indian children.
Of the 112 districts surveyed, 100 were selected from the bottom of a child development district index developed for UNICEF India in 2009, referred to as the 100 Focus Districts in this report. These 100 districts are located in 6 states2. The best-performing district from each of these states
was also selected for survey. To this set was added another set of 6 districts, 2 each from the best-performing states3 of the country. Having the largest sample size for a child nutrition survey since 2004, the HUNGaMA Survey captured nutrition status of 109,093 children under five years of age. Data collection took place between October 2010 and February 2011 in 3,360 villages across 9 states. Coordinated by the Naandi Foundation, the HUNGaMA survey presents underweight, stunting and wasting data at the district level (this was last done in 2004 by DLHS-2, which reported only underweight estimates). It is also the first ever effort to make the voice of over 74,000 mothers heard.
The HUNGaMA Survey shows that positive change for child nutrition in India is happening, including in the 100 Focus Districts. However rates of child malnutrition are still unacceptably high particularly in these Focus Districts where over 40 per cent of children are underweight and almost 60 per cent are stunted. The key findings of the HUNGaMA Survey are as follows:
� Child malnutrition is widespread across states and districts: In the 100 Focus Districts, 42 per cent of children under five are underweight and 59 per cent are stunted. Of the children suffering from stunting, about half are severely stunted. In the best district in each of these states, the rates of child underweight and stunting are significantly lower - 33 and 43 per cent respectively;
Executive
Summary� A reduction in the prevalence of child malnutrition is observed: In the 100 Focus Districts, the prevalence of child underweight has decreased from 53 per cent (DLHS, 2004) to 42 per cent (HUNGaMA 2011); this represents a 20.3 per cent decrease over a 7 year period with an average annual rate of reduction of 2.9 per cent.
� Child malnutrition starts very early in life: By age 24 months, 42 per cent of children are underweight and 58 per cent are stunted in the 100 Focus Districts; birth weight seems to be an important risk-factor as the prevalence of underweight in children born with a weight below 2.5 kg is 50 per cent while that among children born with a weight above 2.5 kg is 34 per cent; the corresponding figures for stunting are 62 and 50 per cent respectively;
� Household socio-economic status has a significant effect on children’s nutrition status: The prevalence of malnutrition is significantly higher among children from low-income families, although rates of child malnutrition are significant among middle and high income families. Children from households identifying as Muslim or belonging to Scheduled Castes or Schedule Tribes generally have worse nutrition;
� Girls’ nutrition advantage over boys fades away with time: Girls seem to have a nutrition advantage over boys in the first months of life; however this advantage seems to be reversed over time as girls and boys grow older, potentially indicating feeding and care neglect vis-à-vis girls in infancy and early childhood;
� Mothers’ education level determines children’s nutrition: In the 100 Focus Districts, 66 per cent mothers did not attend school; rates of child underweight and stunting are significantly higher among mothers with low levels of
education; the prevalence of child underweight among mothers who cannot read is 45 per cent while that among mothers with 10 or more years of education is 27 per cent. The corresponding figures for child stunting are 63 and 43 per cent respectively. It was also found that 92 per cent mothers had never heard the word “malnutrition”;
� Giving colostrum to the newborn and exclusive breastfeeding for first 6 months of a child’s life are not commonly practised: In the 100 Focus Districts 51 per cent mothers did not give colostrum to the newborn soon after birth and 58 per cent mothers fed water to their infants before 6 months.
� Hand washing with soap is not a common practice: In the 100 Focus Districts 11 per cent mothers said they used soap to wash hands before a meal and 19 per cent do so after a visit to the toilet;
� Anganwadi Centres are widespread but not always efficient: There is an Anganwadi centre in 96 per cent of the villages in the 100 Focus Districts, 61 per cent of them in pucca buildings; the Anganwadi service accessed by the largest proportion of mothers (86 per cent) is immunization; 61 per cent of Anganwadi Centres had dried rations available and 50 per cent provided food on the day of survey; only 19 per cent of the mothers reported that the Anganwadi Centre provides nutrition counseling to parents.
While the signs of progress in the data are promising, much more remains to be done. Special efforts would be vital for the most vulnerable children: the youngest (from concep-tion to age two years), the poorest (children of families in the lowest wealth quintiles) and the excluded (those at the risk of exclusion on the basis of gender or social identity). �
1. Susan Horton, 1999, Opportunities for Investments in Nutrition in Low-income Asia, Asian Development Review, 17 (1,2):246-2732. Bihar, Jharkhand, Madhya Pradesh, Orissa, Rajasthan and Uttar Pradesh3. Himachal Pradesh, Kerala and Tamil Nadu
11
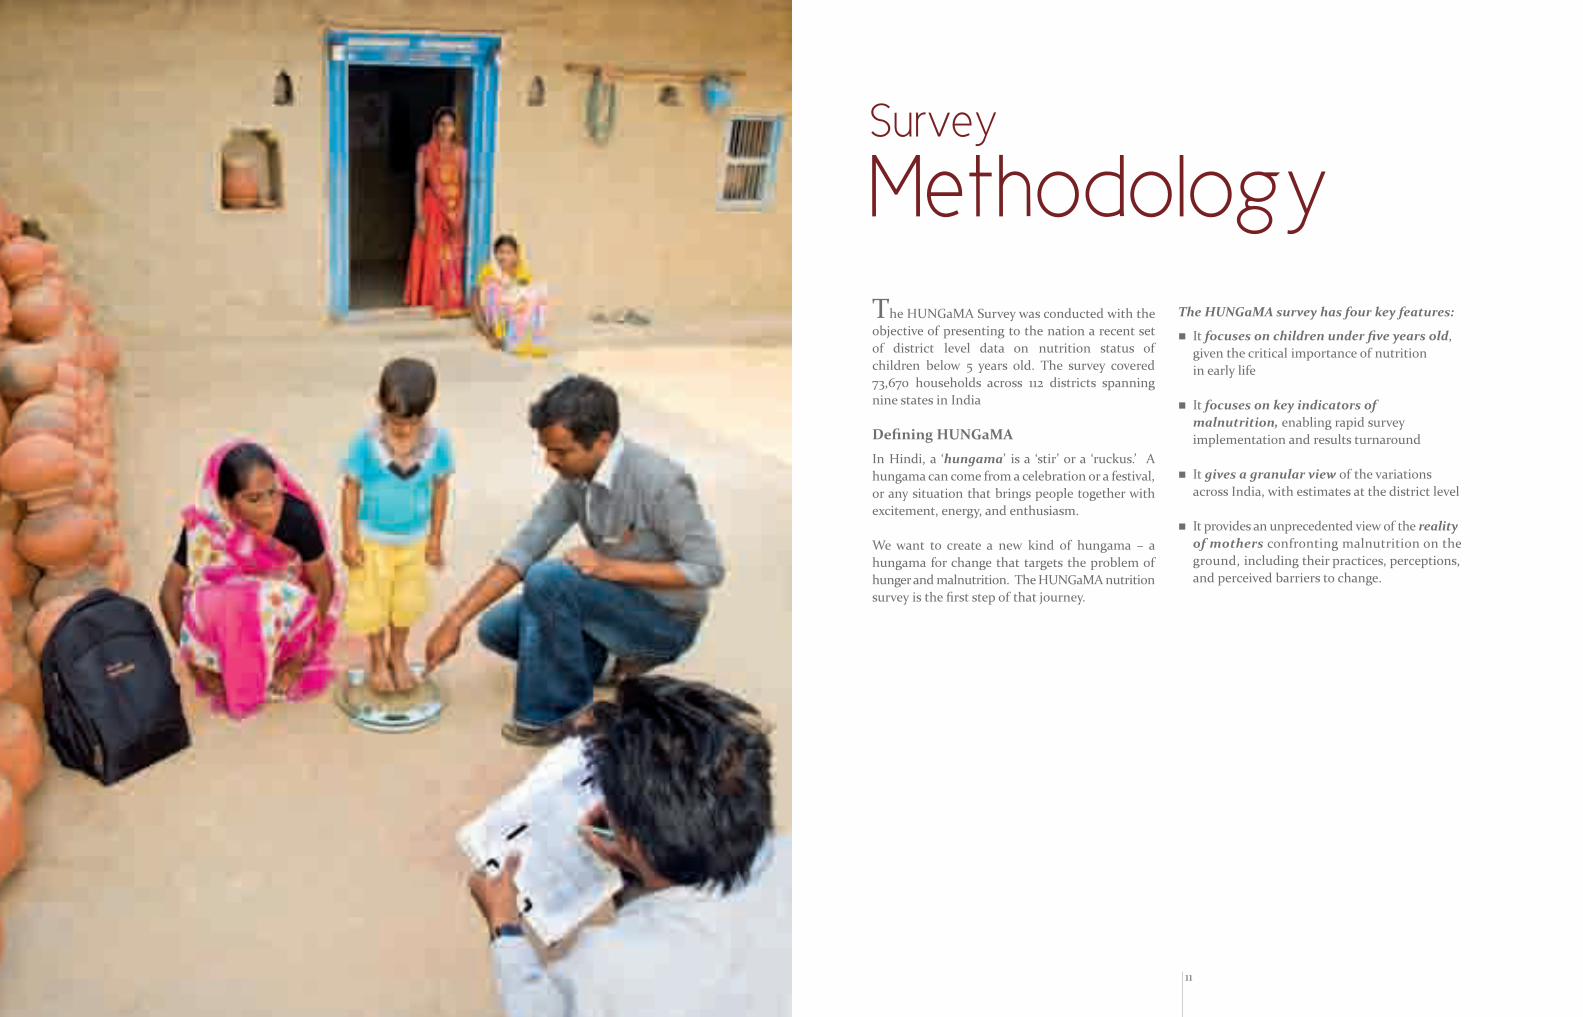
The HUNGaMA Survey was conducted with the objective of presenting to the nation a recent set of district level data on nutrition status of children below 5 years old. The survey covered 73,670 households across 112 districts spanning nine states in India
Defining HUNGaMA
In Hindi, a ‘hungama’ is a ‘stir’ or a ‘ruckus.’ A hungama can come from a celebration or a festival, or any situation that brings people together with excitement, energy, and enthusiasm.
We want to create a new kind of hungama – a hungama for change that targets the problem of hunger and malnutrition. The HUNGaMA nutrition survey is the first step of that journey.
Survey
MethodologyThe HUNGaMA survey has four key features:
� It focuses on children under five years old, given the critical importance of nutrition in early life
� It focuses on key indicators of malnutrition, enabling rapid survey implementation and results turnaround
� It gives a granular view of the variations across India, with estimates at the district level
� It provides an unprecedented view of the reality of mothers confronting malnutrition on the ground, including their practices, perceptions, and perceived barriers to change.

12
Geography of HUNGaMA
The HUNGaMA journey has followed a path from the most remote and impoverished areas of India to its most shining examples of progress. All together, the journey has taken surveyors to the doorsteps of 73,670 families to measure 109,093 children in 9 states and 112 rural districts. The area covered by the HUNGaMA survey represents about 1/6th of India’s population and about 1/5th of India’s children, while including a range of malnutrition realities across six focus states and the nation.
The districts for the HUNGaMA survey were selected using the Child Development Index developed in 2009 by Indicus Analytics for UNICEF India1. The HUNGaMA survey covers the 100 rural districts that ranked at the bottom of the Index – referred to in this report as the HUNGaMA “focus districts” – and 12 districts ranked near the top. These 12 top districts were selected to represent a spread of examples across India; six of them are the top ranking rural districts in the six states (one district per state) of the 100 focus districts; the remaining six are the top ranking rural districts in Himachal Pradesh, Kerala and Tamil Nadu (two districts per state), the three states whose rural districts led the all-India Index ranking.
The 100 focus districts come from six states: Bihar, Jharkhand, Madhya Pradesh, Orissa, Rajasthan, and Uttar Pradesh. These states have, in many ways, become “usual suspects” – they encompass the BIMARU states (Bihar, Madhya Pradesh, Rajasthan, and Uttar Pradesh), are a subset of the Empowered Action Group (EAG) states (Bihar, Jharkhand, Uttar Pradesh, Uttaranchal, Rajasthan, Orissa, Madhya Pradesh, Chhattisgarh), and have substantial overlap with the “backward” districts identified for early rollout of the National Rural Employment Guarantee Act (NREGA) in 2005. All of these groupings have been the focus for urgent action by the Indian government and other actors because they have lagged behind in various development indicators. The HUNGaMA Survey results provide new data to guide policy and
programme action for maternal and child nutrition.
Context of HUNGaMA
Nearly every newspaper article, academic study, and policy paper written on Indian malnutrition since the National Family Health Survey-3 (NFHS-3) results were published in 2007 has relied on that set of data to understand malnutrition and to emphasize the need for action. Yet reality has changed in the last five years. Both the food price crisis and the global financial crisis struck after the NFHS-3 data was collected. At the same time, some state and local governments and communities have been making heroic strides to reduce malnutrition. This leaves us with the critical question of “where are we now?” This question is not easy to answer, in part because of the vast regional variation that characterises malnutrition in India. By one estimate, just 10% of villages and districts account for nearly 30% of underweight children2. Without understanding this variation, it becomes extremely difficult to know how to target action or hold policymakers accountable on an ongoing basis. Yet the NFHS (all three rounds so far) only provides data at the state level. The last time district-level nutrition data were generated for India on a large scale was through the second round of District Level Health Survey (DLHS) conducted in 2002-04.
The HUNGaMA Survey provides a district-level update to this important foundation of data. By using a rigorous sampling methodology and identical nutrition indicators, the HUNGaMA survey results provide a comparable source of key information covering nearly 20% of Indian children. In addition, the HUNGaMA Survey includes information on nutrition realities, practices, beliefs, and barriers to change that have never been collected in a large-scale survey. By including this additional information, the HUNGaMA nutrition survey is both an important update and point of comparison for existing data sources and a unique set of information in its own right.
Uttar Pradesh,Bihar,Jharkhand Sunai Consultancy Pvt. Ltd.Madhya Pradesh Samavesh SocietyRajasthan Prakriti FoundationOrissa IDS, SEARCH, SWAD, PRAYASH, CHARMTamil Nadu Aid IndiaHimachal Pradesh Himachal Pradesh Voluntary Health AssociationKerala Centre for Enterprise Development
Uttar Pradesh
Bihar
JharkhandMadhya Pradesh
Rajasthan
Orissa
Tamil Nadu
HimachalPradesh
Kerala
13

14
The HUNGaMA Nutrition Survey
As explained, the data from the HUNGaMA nutrition survey comes from 112 districts in India selected based on district-level rankings from a composite index of child welfare3. In each district, 30 villages were randomly selected for the survey using a Probability Proportional to Size (PPS) procedure, and in each village, households were selected using a systematic random sampling method – surveyors visited houses at regular intervals throughout the village or, in cases of very large villages, throughout two selected segments in the village – to achieve a target sample size of 600 households per district in focus districts and 900 households per district in best districts. Full details of the sampling strategy are available in Appendix III.
To implement the survey, Naandi partnered with a wide array of organizations (details on page 13) and provided standardized training to instruct local surveyors in how to carry out the survey to the highest standard of quality. All survey formats were reviewed by an advisory board of nutrition experts prior to the survey and honed to provide a concise yet comprehensive picture of essential information on child nutrition.
In each village, surveyors filled out basic information about the village, visited an Anganwadi Centre
and asked questions to the Anganwadi Worker, and surveyed households. In each household, surveyors collected general household information, information on all children below five, and measured height, weight, mid-upper arm circumference, and oedema in all under fives in the household using equipment field-tested and quality-checked by the HUNGaMA team and its partners. In addition, the surveyors selected one mother in the household to ask in-depth questions on her nutrition knowledge, practices, beliefs, and perceived barriers to change. These questions covered practices critical to good nutrition outcomes, including infant and young child feeding, hygiene, care, and use of Anganwadi services.
As a quality control check, survey team leaders visited over 70% of survey villages along with the survey teams, spent significant time observing the surveyors, provided feedback, and “back-checked” survey formats by visiting households surveyed to ensure that the answers were consistent with those filled in by the surveyors. Overall, data collection took four months of field work with over 1000 dedicated surveyors striving to measure malnutrition in some of India’s most remote and difficult areas.
Measuring Malnutrition
All surveyors attended five days of training – including at least one full day in the field – to become proficient in administering the survey questionnaires and measuring child anthropometry. The basic data for determining nutrition status are age, height, weight, oedema, and mid-upper arm circumference. To take the measurements, the survey teams were given an equipment kit that included a weighing scale, a height board, a
mid-upper arm circumference (MUAC) strip, and a local event calendar to assist in ascertaining birthdates. Weighing scales were tested before being assigned to the survey teams and every scale was tested each morning and weekly thereafter to ensure continued accuracy. The HUNGaMA Surveyor’s Guide to Measuring Malnutrition can be found on the website dedicated to the HUNGaMA initiative www.hungamaforchange.org
Data collected in HUNGaMA Survey
Nutrition Weight, height, age, mid-upper arm circumference and oedema
General Household Parents’ education, caste, religion, type of home, access to services, food consumption
Mothers’ Voice Feeding practices, hygiene habits, decision-making power
Anganwadi Centre About the Anganwadi Worker, infrastructure, growth monitoring
Village Facilities & services available
States Districts Children Mothers Households Anganwadi Anganwadi Centres Workers
Bihar 23 24,072 15,373 15,389 642 461
Jharkhand 14 13,310 9,124 9,094 396 280
Madhya Pradesh 12 11,186 6,954 6,819 338 268
Orissa 6 5,427 4,220 4,197 174 138
Rajasthan 10 11,319 7,683 7,674 284 232
Uttar Pradesh 41 38,227 26,022 25,865 1138 664
Himachal 2 1,507 1,228 1,231 60 58
Kerala 2 1,922 1,780 1,780 60 51
Tamil Nadu 2 2,123 1,636 1,621 57 55
112 109,093 74,020 73,670 3,149 2,207
The sample size of HUNGaMA Survey is given in the table below.
1. See Appendix I for more information on the Child Development Index.2. Michele Gragnolati, Meera Shekar, Monica Das Gupta, Caryn Bredenkamp and Yi-Kyoung Lee, 2005, India’s Undernourished Children:A Call for Reform and Action, Health, Nutrition and Population (HNP) Discussion Paper. Ibid.3. Districts were selected based on 2001 census boundaries. In cases where district boundaries have changed, the HUNGaMA survey looks at the area enclosed by the 2001 census boundary. A list of the surveyed districts is available in Appendix III

17
� Nutrition Status of Children
� Mothers’ Voice
� Anganwadi Centres
� Demography and Nutrition Status
HUNGaMA Survey
Findings
Fighting Hunger & Malnutrition

� 100 focus districts (100FD) � 6 best districts from focus states (6BDF)� 6 best districts from ‘best’ states (6BD)
1. Prevalence of child malnutritionby geographic area
In 100FD, 58.8 % of children are moderately or severely stunted (Height-for-Age <-2 SD), 42.3% are moderately or severely underweight (Weight-for-Age < -2 SD) and 11.4% are moderately or severely wasted (Weight-for-Height < -2 SD); these figures are 43.3%, 32.6%, and 12.4% respectively in 6BDF and 32.5%, 21.9%, 13.5% respectively in 6BD. These figures are seen in Graph 1 below and Table 1 at the end of the chapter.
Nutrition Status
of ChildrenThe key focus of the HUNGaMA Survey was to assess the nutrition status of children.As mentioned earlier, the 112 districts surveyed by HUNGaMA are divided into 3 categories.The 3 categories are:
In 100FD, 34 % of children are severely stunted (Height-for-Age <-3 SD), 16.4% are severely underweight (Weight-for-Age < -3 SD),and 3.3% are severely wasted (Weight-for-Height < -2 SD); these figures are 20.5%, 11.3%, and 3.4% respectively in 6BDF and 14.2%, 6.5%, 4.7% respectively in 6BD. These figures are seen in Graph 2 below and Table 2 at the end of the chapter.
1919

20 21
Nutrition status of children
1. Prevalence of moderate or severe wasting, underweightand stunting (<-2 SD) in children 0-59 months (%)
HUNGaMA Survey 2011, India
�Wasting �Underweight �Stunting
70
60
50
40
30
20
10
0
100 Focus Districts Districts From Best States Best Districts From Focus States
2. Prevalence of severe wasting, underweightand stunting (<-3 SD) in children 0-59 months (%)
HUNGaMA Survey 2011, India
�Wasting �Underweight �Stunting
70
60
50
40
30
20
10
0
100 Focus Districts Districts From Best States Best Districts From Focus States
In 100FD 10.2% children were found to be malnourished (MUAC< 12.5cm) as per measurement of the mid-upper arm circumference. The corresponding figures for 6BDF and 6BD are 8.2 and 3.6 respectively. The percentage of children severely malnourished (MUAC< 11.5cm) in 100FD, 6BDF and 6BD are 1.7, 1.3 and 1.2 respectively.
3. Prevalence of malnutrition by mid upper arm circumference(MUAC) in children 0-59 months (%)
HUNGaMA Survey 2011, India
�Severe (< 11.5 cm) �Moderate (< 12.5 cm)70
60
50
40
30
20
10
0
100 Focus Districts Best Districts From Focus States Best District From Best States
2. Prevalence of child malnutrition by age
Graphs 4-6 show the prevalence of stunting, underweight and wasting by age group in the three clusters of districts. The HUNGaMA Survey shows that the prevalence of stunting increases sharply from birth through the first two years of life as children grow older, reaching a maximum among children 24-35 months old, across the three clusters of districts: 64.8%, 50.9%, and 36.1% in 100FD, 6BDF, and 6BD respectively. A similar pattern is observed for the prevalence of child underweight: 44.1%, 35.7%, and 22.2% in 100FD, 6BDF, and 6BDB respectively. The prevalence of wasting reaches its maximum among children in the age group 12-23 months old and is as high as 16.9% among children 12-23 months old in 100FD. These figures are also seen in Tables 4-6 at the end of this chapter.
70
60
50
40
30
20
10
0
< 6 mths 6-11 mths 12-23 mths 24-35 mths 36-47 mths 48-59 mths
4. Prevalence of stunting in children 0-59 months by age group (%)HUNGaMA Survey 2011, India
100 Focus Districts Districts From Focus States
Best Districts From Best States

22 23
70
60
50
40
30
20
10
0
< 6 mths 6-11 mths 12-23 mths 24-35 mths 36-47 mths 48-59 mths
5. Prevalence of underweight in children 0-59 monthsby age group (%)
HUNGaMA Survey 2011, India
100 Focus Districts Best Districts From Focus StatesBest Districts From Best States
70
60
50
40
30
20
10
0
< 6 mths 6-11 mths 12-23 mths 24-35 mths 36-47 mths 48-59 mths
6. Prevalence of wasting in children0-59 months old by age group (%)
HUNGaMA Survey 2011, India
100 Focus Districts Districts From Best States
Best Districts From Focus States
3. Prevalence of child malnutrition by gender
Graphs 7 and 8 show the prevalence of wasting, underweight and stunting by gender in the three clusters of districts. The HUNGaMA Survey shows that there is little gender difference for all three indicators. When children in 100FD are categorized into age groups of 0-5 months, 6-35 months, and 36-59 months, we found that the prevalence of stunting and underweight among boys is higher up to the age of 35 months, while the opposite is observed in the age group 36-59 months old. These figures are also seen in Tables 7-8 at the end of this chapter.
7. Prevalence of wasting, underweight and stuntingin children 0-59 months by gender (%)
HUNGaMA Survey 2011, India
�100 Focus Districts �Best Districts From Focus States�Best District From Best States
70
60
50
40
30
20
10
0Boys Girls Boys Girls Boys Girls
Wasting Underweight Stunting
70
60
50
40
30
20
10
00-5 m 6-35 m 36-59 m 0-5 m 6-35 m 36-59 m 0-5 m 6-35 m 36-59 m
Wasting Underweight Stunting
8. Prevalence of wasting, underweight and stunting in children0-59 months (%) by gender and age groups in 100 Focus Districts
HUNGaMA Survey 2011, India
�Boys �Girls

24 25
4. Prevalence of child malnutrition by mother’s education
Graphs 9-11 show the prevalence of wasting, underweight and stunting by mother’s education in the three clusters of districts. The HUNGaMA Survey shows that the prevalence of child malnutrition is significantly higher among children of mothers with little or no education; for example, in 100FD, the prevalence of child stunting among mothers who have never been to school is 62.9% while the prevalence of child stunting among mothers who have completed at least Class 10 is 42.6%; in 6BDF, the prevalence of child stunting among mothers who have never been to school is 53.1% while the prevalence of stunting among mothers who have completed at least Class 10 is 27.1%; a similar pattern is observed in 6BD, where the prevalence of child stunting among mothers who have never been to school is 47% while the prevalence of stunting among mothers who have completed at Class 10 is 28.2%. Similar findings are observed with respect to underweight and wasting. These figures are also seen in Tables 9-11 at the end of this chapter.
9. Prevalence of wasting in children 0-59 months bymother’s education (%)HUNGaMA Survey 2011, India
�100 Focus Districts �Best Districts From Focus States�Best District From Best States
30
20
10
0
None/Can’t read <5 5-7 8-9 10+
Grade completed by Mother
10. Prevalence of underweight in children 0-59 monthsby mother’s education (%)
HUNGaMA Survey 2011, India
�100 Focus Districts �Best Districts From Focus States�Best District From Best States
50
40
30
20
10
0
None/Can’t read <5 5-7 8-9 10+
Grade completed by Mother
11. Prevalence of stunting in children 0-59 monthsby mother’s education (%)
HUNGaMA Survey 2011, India
�100 Focus Districts �Best Districts From Focus States�Best District From Best States
70
60
50
40
30
20
10
0None/Can’t read <5 5-7 8-9 10+
Grade completed by Mother
5. Prevalence of child malnutrition by birth weight
Graph 12 shows the prevalence of stunting, underweight and wasting by birth weight in the three clusters of districts. The HUNGaMA Survey shows that the prevalence of child malnutrition is significantly higher among children who were born with a weight below 2.5 kg. Across all three clusters, the prevalence of child malnutrition is higher among children who had a weight deficit at birth. In 100FD, the prevalence of underweight among low birth weight children is 49.9% while that among children who were born with a normal weight (2.5 kg or more) is 33.5%. Corresponding figures for 6BDF are 36.7% and 21.6%; and those for 6BDB are 30.1% and 17.1%. Similar features are observed for stunting and wasting. These figures are also seen in Table 12 at the end of this chapter.
12. Prevalence of child malnutrition in children0-59 months by birth weight (%)
HUNGaMA Survey 2011, India
�100 Focus Districts �Best Districts From Focus States�Best District From Best States
70
60
50
40
30
20
10
0<2.5 kg 2.5 kg+ <2.5 kg 2.5 kg+ <2.5 kg 2.5 kg+
Wasting Underweight Stunting

26 27
6. Prevalence of child malnutrition by sanitation and hygiene
Graph 13 shows that the prevalence of child wasting, underweight and stunting is consistently higher in the households without a toilet.
Graph 14 shows hand washing habits among children who had diarrhea in the week prior to the survey in 100FD; close to 80% of the children who had diarrhea during the week prior to the survey did not wash their hands with soap after visiting the toilet. These figures are also seen in Tables 13 and 14 at the end of this chapter.
13. Prevalence of child malnutrition in children 0-59 monthsand toilet availability (%) - 100 Focus Districts
HUNGaMA Survey 2011, India
�Has Toilet �Does not have Toilet
70
60
50
40
30
20
10
0
Wasting Underweight Stunting
14. Handwashing habits among children 0-59 months who haddiarrhea in the 7 days prior to the survey (%);
100 Focus DistrictsHUNGaMA Survey 2011, India
70
60
50
40
30
20
10
0
Wash hands after toilet Do not wash hands after toilet
7. Trends of child malnutrition
The District Level Health Survey-2 conducted in 2002-04 (DLHS-2) was the last survey in India that collected data on the nutrition status (weight-for-age) of children 0-71 months old at the district level. This survey used the NCHS Child Growth Standards (1970)1, which were later replaced by the WHO Growth Standards (2006)2. The latter have been used in the third round of the National Family Health Survey (2005-06).
In order to compare district level underweight data of DLHS-2 with HUNGaMA district level underweight data, we analyzed DLHS-2 data using the WHO Growth Standards and results of the comparison are seen in Graph 15 below.
At the time of DLHS-2, the prevalence of child underweight (using WHO standards) in 100FD was 53.1%; the 2011-HUNGaMA survey shows that the prevalence of child underweight (also using WHO standards) in the 100FD is 42.3%. In absolute terms this means a 10.8 percent point decrease since 2004. In the 6BDF the reduction in percentage points since DLHS-2 is 17.6 (from 39.5% to 21.9%) while in the 6BD it has been 2.2 percent points (from 34.8% to 32.6%). These figures are also seen in Table 15 at the end of this chapter.
In relative terms this reduction in the 100FD from 53.1% to 42.3% indicates a 20.3% decrease in the prevalence of child underweight over a ~7year span (taking 2003 as the mid-point for DLHS-2), with an average annual reduction rate (AARR) of 2.9%. The corresponding figures are 44.5% (AARR 6.3%) in the 6BDF and 6.3% (AARR 0.9%) in the 6BD respectively.
15. Prevalence of child underweight(<-2SD)in children 0-59 months
DLHS - 2 (2002-04) and HUNGaMA Survey 2011 (As per WHO Growth Standards 2006)
�100 Focus Districts �Best Districts From Focus States�Best District From Best States
70
60
50
40
30
20
10
0
DLHS 2 WHO GS HUNGaMA WHO GS
1. Tables of height and weight for age used as reference values for the assessment of growth and nutritional status of children, based on data collected by the US National Center for Health Statistics 2. Released in 2006 by the World Health Organisation, based on a Multicentre Growth Reference Study (1997-2003) which generated new growth curves for assessing the growth and development of infants and young children around the world.
Age in months 100 Focus Districts Best Districts Best Districts from Focus States from Best States
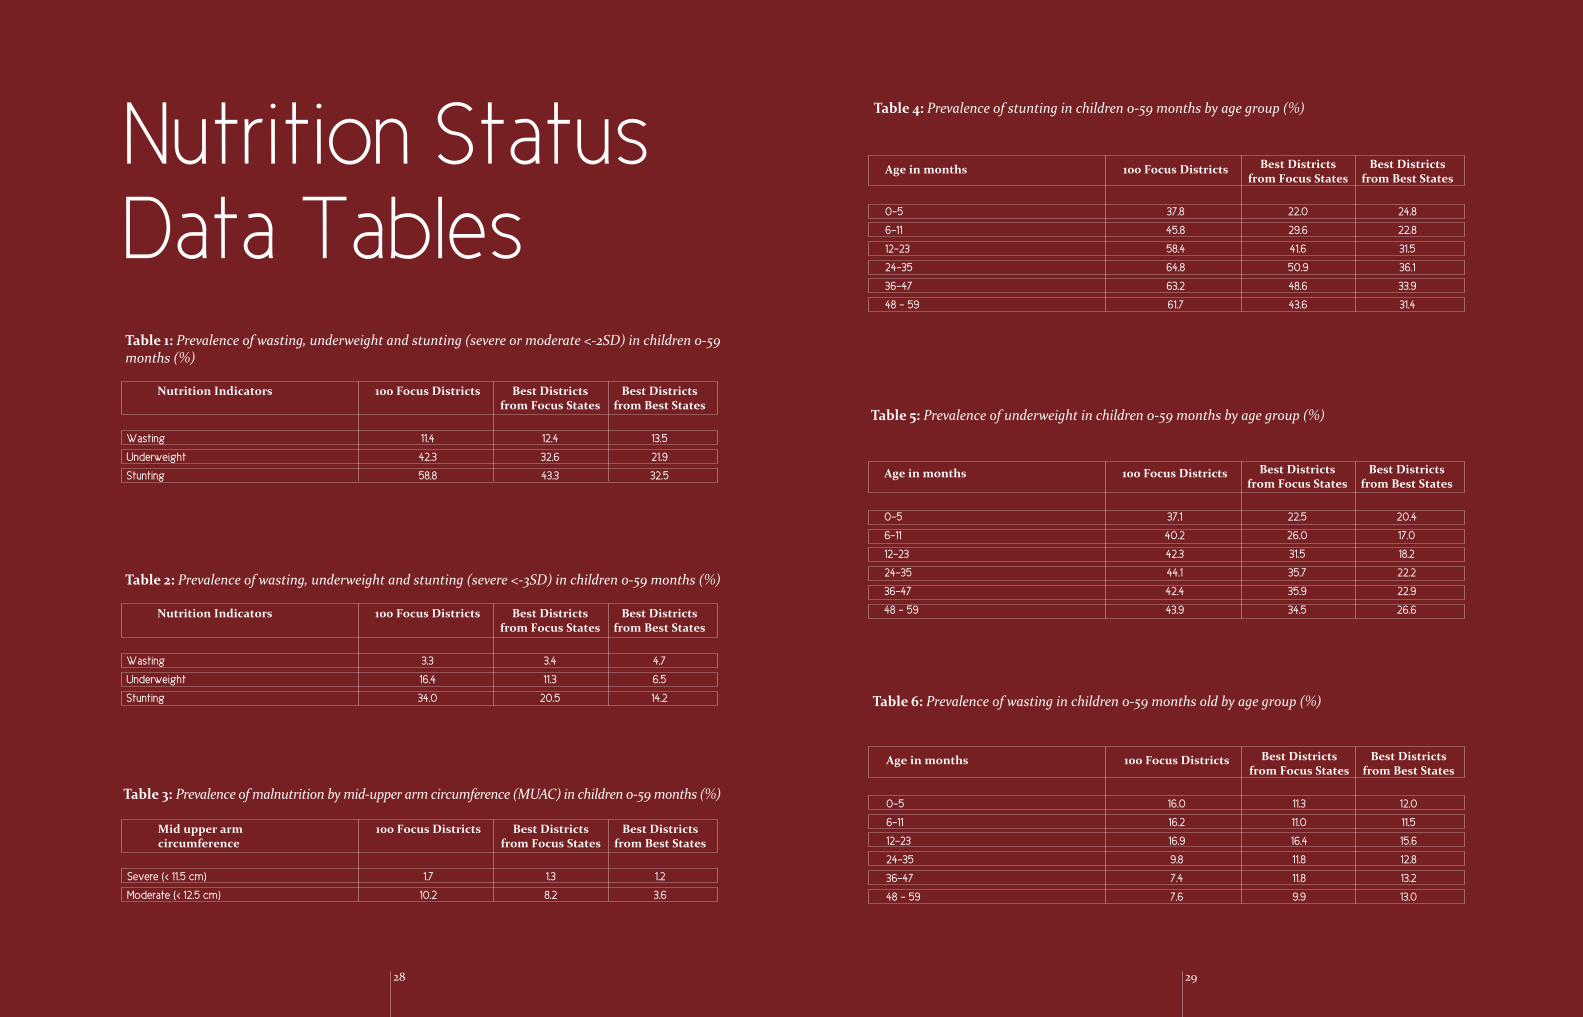
0-5 37.8 22.0 24.8
6-11 45.8 29.6 22.8
12-23 58.4 41.6 31.5
24-35 64.8 50.9 36.1
36-47 63.2 48.6 33.9
48 - 59 61.7 43.6 31.4
Nutrition Indicators 100 Focus Districts Best Districts Best Districts from Focus States from Best States
Wasting 11.4 12.4 13.5
Underweight 42.3 32.6 21.9
Stunting 58.8 43.3 32.5
Table 1: Prevalence of wasting, underweight and stunting (severe or moderate <-2SD) in children 0-59months (%)
Nutrition StatusData Tables
Nutrition Indicators 100 Focus Districts Best Districts Best Districts from Focus States from Best States
Wasting 3.3 3.4 4.7
Underweight 16.4 11.3 6.5
Stunting 34.0 20.5 14.2
Table 2: Prevalence of wasting, underweight and stunting (severe <-3SD) in children 0-59 months (%)
Mid upper arm 100 Focus Districts Best Districts Best Districtscircumference from Focus States from Best States
Severe (< 11.5 cm) 1.7 1.3 1.2
Moderate (< 12.5 cm) 10.2 8.2 3.6
Table 3: Prevalence of malnutrition by mid-upper arm circumference (MUAC) in children 0-59 months (%)
Table 4: Prevalence of stunting in children 0-59 months by age group (%)
Age in months 100 Focus Districts Best Districts Best Districts from Focus States from Best States
0-5 37.1 22.5 20.4
6-11 40.2 26.0 17.0
12-23 42.3 31.5 18.2
24-35 44.1 35.7 22.2
36-47 42.4 35.9 22.9
48 - 59 43.9 34.5 26.6
Table 5: Prevalence of underweight in children 0-59 months by age group (%)
Age in months 100 Focus Districts Best Districts Best Districts from Focus States from Best States
0-5 16.0 11.3 12.0
6-11 16.2 11.0 11.5
12-23 16.9 16.4 15.6
24-35 9.8 11.8 12.8
36-47 7.4 11.8 13.2
48 - 59 7.6 9.9 13.0
Table 6: Prevalence of wasting in children 0-59 months old by age group (%)
28 29

100 Focus Districts Best Districts Best DistrictsIndicators from Focus States from Best States
Wash hands Do not wash Wash Hands Do not wash Wash Hands Do not wash after toilet hands after toilet after toilet hands after toilet after toilet hands after toilet
Diarrhea 21.1 78.9 14.3 85.7 25.4 74.6
100 Focus Districts
Indicators Has Toilet Does not have Toilet
Wasting 9.4 11.7
Underweight 33.6 43.9
Stunting 50.5 60.2
100 Focus Districts Best Districts Best DistrictsIndicators from Focus States from Best States
<2.5Kg 2.5Kg+ <2.5Kg 2.5Kg+ <2.5Kg 2.5Kg+
Wasting 15.1 9.4 13.6 10.4 17.4 12.3
Underweight 49.9 33.5 36.7 21.6 30.1 17.1
Stunting 62.1 49.9 45.2 30.3 40.0 26.8
100 Focus Districts Best Districts Best DistrictsIndicators from Focus States from Best States
Boys Girls Boys Girls Boys Girls
Wasting 10.3 9.1 13.1 9.6 13.9 12.2
Underweight 41.0 41.4 31.3 31.6 23.5 18.4
Stunting 59.5 59.0 42.8 43.5 33.6 29.9
7: Prevalence of wasting, underweight and stunting in children 0-59 months by gender (%)
Age In Months Wasting Underweight Stunting Boys Girls Boys Girls Boys Girls
0-5 15.1 16.3 37.9 34.5 40.2 33.8
6-35 14.5 12.5 43.1 40.3 59.1 57.1
36-59 8.2 7.4 40.6 43.7 60.3 61.6
8: Prevalence of wasting, underweight and stunting in children 0-59 months by gender and age group,in 100 Focus Districts (%)
Education level 100 Focus Districts Best Districts Best DistrictsClass completed from Focus States from Best States
None - Can't Read 62.9 53.1 47.0
<5 58.3 50.2 43.1
5-7 57.4 44.3 37.2
8-9 52.8 38.3 34.2
10+ 42.6 27.1 28.2
11: Prevalence of stunting in children 0-59 months by mother’s education (%)
Education level 100 Focus Districts Best Districts Best DistrictsClass completed from Focus States from Best States
None - Can't Read 44.7 38.6 32.9
<5 40.3 44.7 39.0
5-7 38.2 32.2 23.6
8-9 34.5 27.8 25.7
10+ 26.9 17.6 16.9
10: Prevalence of underweight in children 0-59 months by mother’s education (%)
12: Prevalence of child malnutrition in children 0-59 months by birth weight (%)
13: Prevalence of child malnutrition in children 0-59 months and toilet availability - 100 Focus Districts (%)
14: Hand washing habits among children 0-59 months who had diarrhea in the 7 days prior to the survey (%)
Data analysed using 100 Focus Districts Best Districts Best DistrictsWHO Growth standards from Focus States from Best StatesDLHS 2 53.10 39.50 34.80
HUNGaMA - 2011 42.32 21.99 32.61
15: Prevalence of child underweight (<-2SD) in children 0-59 months in DLHS-2 (2002-04) and HUNGaMASurvey (2011) - as per WHO Growth Standards of 2006 (%)
Education level 100 Focus Districts Best Districts Best DistrictsClass completed from Focus States from Best States
None - Can't Read 10.1 13.1 12.7
<5 10.6 18.8 23.7
5-7 9.3 12.9 10.8
8-9 8.7 9.2 14.8
10+ 8.3 7.2 12.5
9: Prevalence of wasting in children 0-59 months by mother’s education (%)
3130

Why is mothers’ voice important?
Understanding the realities faced by mothers iscritical in improving child nutrition outcomes. The determining factors of a child’s nutrition status go back to the mother - her diet and growth during childhood, adolescence and pregnancy determine the intra-uterine growth and birth weight of her child. Her knowledge of breastfeeding practices determines whether the child is naturally protected from infection and malnutrition. Her further knowledge about complementary foods and feeding will determine if the child is given the correct diet to supplement breast milk after the initial 6-month exclusive breastfeeding period. If it can be ensured that mothers have the correct knowledge about how to protect her child from malnutrition, then the battle against malnutrition could be half-won. This is why HUNGaMA has dedicated an entire section of its survey to the voice of mothers.
Mothers’
VoiceThis section of the survey is unprecedented as far as large-scale national nutrition su rveys go.It attempts to capture some of the basic knowledge, attitudes and practices that arecritical to child nutrition outcomes, but from the perspective of the mother. These questions cover feeding practices, diet (read more here), hygiene, health care and the use of Anganwadi services.
The data in this section is a representation of what the mother said in response to the HUNGaMA Survey questionnaire. For example, when asked why there was a delay in breastfeeding her child, a mother may answer that milk was not available. In this case, colostrum may have been available, but the mother has not perceived this as “milk” that is safe or appropriate for her child to drink. These perceptions of nutrition concepts are as important as factual data that is garnered from standard surveys.
33

34 35
Mothers’ voice1. Mothers’ Education Levels
Of all mothers interviewed in 100FD, 66.3% had never been to school, while in 6BD only 4.3% were in this category; in fact, in the 6BD, 61.7% mothers had studied at least up to Class 10. This is seen in Graph M1 below and Table M1 at the end of the chapter.
M1. Mothers’ Education levels (%)HUNGaMA Survey 2011, India
�100 Focus Districts �Best Districts From Focus States�Best District From Best States
80
60
40
20
0
No Schooling <5 years 5 - 7 years 8 - 9 years 10 or more years complete complete complete complete
2. Decision making powers of mothers While a majority of mothers (68.1%) in the 100FD report that they have a strong say in decisions regarding their children, only 13.7% reported that they are able to play a similar role in decisions regarding major household purchases. In both 6BDF and 6BD, the percentage of women who had a say in major household purchase decisions was less than 50%. This is seen in Graph M2 below and Table M2 at the end of the chapter.
M2. Decision Making Power Of Mothers (%)HUNGaMA Survey 2011, India
�100 Focus Districts �Best Districts From Focus States�Best District From Best States
100
80
60
40
20
0Regarding Child Welfare Regarding Major Household Purchases
3. Mothers who have heard the word malnutrition
In the focus states, less than 20% mothers had heard the word for malnutrition in their local language; this proportion was as low as 7.6% in 100FD and 17.3% in 6BDF; on the contrary as many as 81.6% of mothers in 6BD had heard the word. This is seen in Graph M3 below and Table M3 at the end of the chapter.
M3. Mothers who have heard the word malnutrition* (%)HUNGaMA Survey 2011, India
100
80
60
40
20
0
100 Focus Districts Best Districts From Focus States Best Districts From Best States
*The word for malnutrition in the local language used was used in the questionnaire – kuposhan in Hindi, pushtihinata in Oriya, sathukuraindaunavu in Tamil and poshanakuruvu in Malayalam. Care was taken to ensure that the word commonly used at the Anganwadi Centres was used here.
4. Child’s first intake after birth
In 100FD less than half the mothers (48.5%) reported that they gave breast milk as the first intake to the newborn child as opposed to 66.8% in 6BDF and 87.2% in 6BD; 45.3% of the mothers in 100FD reported that their newborn was fed traditional food as the first intake after birth (29.5% in 6BDF and 9.7% in 6BD). Among mothers in 100FD who reported that they did not give breast milk to their children as the first intake after birth, more than half (55.2%) said they did not do so because they were guided by family/traditional advice while 38.2% reported that they did so because they felt that their breast milk was insufficient.
In 100FD 38.9% mothers gave their newborn breast milk within an hour of birth, as compared to 56.7% in 6BDF and 81.6% in 6BD. Of those in 100FD who did not give breast milk to their child within the first hour of birth, 48.1% said they did not do so because milk was not available immediately after birth and 39.6% because of family/traditional advice. This is seen in Graphs M4-M7 below and Tables M4-M7 at the end of the chapter.

36 37
M4. Child’s first intake (%)HUNGaMA Survey 2011, India
�100 Focus Districts �Best Districts From Focus States�Best District From Best States
100
80
60
40
20
0
Breastfeeding Traditional Feed Formula (milk, cerelac)
60
40
20
0
M5. Reasons for not giving breastmilk as child’s first intake (%)HUNGaMA Survey 2011, India
100 Focus Districts
Family/ Mother feels milk Mother Unwell Dr./ Nurse/ANM C-Section Traditional Advice is not available advice delivery
M6. Initiation of breastfeeding (%)HUNGaMA Survey 2011, India
�100 Focus Districts �Best Districts From Focus States�Best District From Best States
100
80
60
40
20
0
Within 1 Hour Within 1 day Between 2-3 days After 3 days
100
80
60
40
20
0
M7. Reasons for not initiating breastfeeding within 1 hour of birthHUNGaMA Survey 2011, India
100 Focus Districts
Mother feels milk Family/ Mother Unwell Dr./ Nurse/ANM C-Section is not available Traditional Advice advice delivery
5. Child’s first intake of water
In the focus states, over 50% mothers (58.0% in 100FD and 50.2% in 6BDF) fed water to their infants before 6 months, indicating that exclusive breastfeeding in the first 6 months of a child’s life is not a common practice. Among mothers who fed water to their infants before 6 months of life, over 60% in 100FD said that they had done so because the child was thirsty while 27.4% reported that they did so because of family/traditional advice. This is seen in Graphs M8 and M9 below and Tables M8 and M9 at the end of the chapter.
M8. Child’s first intake of water (%)HUNGaMA Survey 2011, India
�100 Focus Districts �Best Districts From Focus States�Best District From Best States
100
80
60
40
20
0
Within 1 month 1-5 months 6-12 months After 12 months

38 39
100
90
80
70
60
50
40
30
20
10
0
M9. Reasons why child was given water before 6 months (%)HUNGaMA Survey 2011, India
100 Focus Districts
Child’s mouth/ throat Family/ traditional No breastmilk Dr./ Nurse/ANMdrying up advice advice
6. Child’s first intake of solids/semi-solids
Only 60-70% of mothers across districts reported that they fed their children semi-solid foods for the first time when the child was 6-8 months old; however as many as 23.3% of mothers in 6BD did so before the child was 6 months old (early and untimely introduction of complementary foods). This is seen in Graph M10 below and Table M10 at the end of the chapter.
80
70
60
50
40
30
20
10
0
M10. Child’s first intake of semi-solid/solids (%)HUNGaMA Survey 2011, India
�100 Focus Districts �Best Districts From Focus States�Best District From Best States
Before 3 months 3-5 months 6-8 months 9-12 months After 12 months
Only 47.8% of mothers in 100FD reported to be satisfied with the amount of non-cereal foods they are able to give their children. The corresponding figures for 6BDF, and 6BD were 67.2 and 81.7% respectively. When asked why they did not give their children more non-cereal foods, 93.7% mothers in 100FD said they did not do so because non-cereal foods are expensive. This is seen in Graphs M11 and M12 below and Tables M11 and M12 at the end of the chapter.
100 Focus Districts Best Districts From Focus States Best Districts From Best States
M11. Mothers satisfied with quantity ofnon-cereal foods they feed their children (%)
HUNGaMA Survey 2011, India
100
90
80
70
60
50
40
30
20
10
0
M12. Reasons why mothers did not give more non-cereal foods (%)HUNGaMA Survey 2011, India
100 Focus Districts
100
90
80
70
60
50
40
30
20
10
0
Food is expensive Food not available Others Food not available from family crops in market

40 41
8. Use of soap in the household
Across all three clusters of districts, almost 100% mothers said they have soap at home. However, only 10.8% in 100FD, 18.3% in 6BDF and 56.8% in 6BD said that their family members use soap to wash their hands before a meal; similarly, only 19% mothers in 100FD said that their family members wash their hands with soap after using the toilet; this percentage is 49.3% in 6BD. This is seen from Graph M13 below and Table M13 at the end of the chapter.
M13. Use of Soap (%)HUNGaMA Survey 2011, India
�100 Focus Districts �Best Districts From Focus States�Best District From Best States
1009080706050403020100
Families with access Families using soap to Families using soap to to soap wash hands before meals wash hands after using the toilet
9. Preference for health care facilities
About half (51.1%) mothers in 100FD took their child to a trained doctor, ie Government health centre or qualified (private MBBS) doctor, when the child was sick. In 6BD this percentage is 94.9%. The rest resorted to untrained health care providers. In 100FD three main reasons given for not taking children to a trained doctor were that it is expensive (46.5%), that it takes time (27.6%), or that the services are not useful (17.6%). This is seen in Graphs M14 and M15 below and Tables M14 and M15 at the end of the chapter.
6050403020100
M14. Preferances for Health Facilities (%)HUNGaMA Survey 2011, India
�100 Focus Districts �Best Districts From Focus States�Best District From Best States
Govt health Private MBBS Doctor Untrained health Home orcenter/ sub-center worker traditional remedy
50403020100
M15. Reasons why trained doctors not preferred (%)HUNGaMA Survey 2011, India
100 Focus Districts
Costs More Takes time Services not No Health Center Others take useful nearby the decision
10. Mothers’ usage of Anganwadi Services
In the 100FD, the Anganwadi service accessed by the largest proportion of mothers (85.8%) is immunization, followed by food for 3-6 year olds (58.7%), while access to take home rations is limited to 38.1%, growth monitoring and promotion services to 21.2% and health and nutrition counseling for parents to 18.5%. In 6BD however, the most accessed service is food for 3-6 year olds (87.3%) followed by pre-school education for 3-6 year olds (84.7%). This is seen in Graph M16 below and Table M16 at the end of the chapter.
Food for 3-6 year olds
Take home rations for women/infants
Immunization
Antenatal checkups
Health check ups for children
Growth monitoring for children
Health Referral Services
Pre-school education for 3-6 year olds
Health & Nutrition counselling for parents
Home visits by Anganwadi worker
Do not access any services
M16. Mothers’ usage of Anganwadi ServicesHUNGaMA Survey 2011, India
�100 Focus Districts �Best Districts From Focus States�Best District From Best States
0 10 20 30 40 50 60 70 80 90 100

Education 100 Focus Districts Best Districts Best Districts from Focus States from Best States
No Schooling 66.3 37.5 4.3
< 5 years complete 3.3 5.0 2.6
5-7 years complete 11.0 18.0 13.9
8-9 years complete 9.6 16.9 17.5
10 or more years complete 9.8 22.5 61.7
M1. Mother's Educational Levels (%)
Particulars 100 Focus Districts Best Districts Best Districts from Focus States from Best States
Regarding Child Welfare 68.1 80.4 82.4
Regarding Major Household Purchase 13.7 15.0 40.9
M2. Decision making power of mothers (%)
Particulars 100 Focus Districts Best Districts Best Districts from Focus States from Best States
Mother who heard the word "malnutrition" 7.6 17.3 81.6
M3. Mother who have heard the word malnutrition (%)
Mothers’ VoiceData Tables
Child’s first food 100 Focus Districts Best Districts Best Districts from Focus States from Best States
Breastfeeding 48.5 66.8 87.2
Formula (milk, cerelac) 5.5 3.5 2.7
Traditional Feed 45.3 29.5 9.7
M4. Child’s first intake (%)
Responses Percentage
Family/Traditional advice 55.2
Mother feels that milk is not available 38.2
Mother unwell 6.1
Doctor/Nurse/ANM advice 3.0
C-Section Delivery 0.9
M5. Reasons for not giving breast milk as child's first intake (%) - 100 Focus Districts
Mother initiating breastfeeding 100 Focus Districts Best Districts Best Districts from Focus States from Best States
Within 1 hour 38.9 56.7 81.6
Within 1 day 25.6 26.7 14.3
Within 3 days 23.4 10.6 2.4
After 3 days 10.9 4.7 1.1
M6. Initiation of breastfeeding (%)
Responses Percentage
Mother feel that milk is not available 48.1
Family/Traditional advice 39.6
Mother unwell 10.4
Doctor/Nurse/ANM advice 2.6
C-Section Delivery 1.6
M7. Reasons for not initiating breastfeeding within 1 hour of birth - 100 Focus Districts
4342

Months 100 Focus Districts Best Districts Best Districts from Focus States from Best States
Within 1 month 21.5 22.0 9.7
1 to 5 months 36.5 28.2 39.1
6 to 12 months 34.8 43.3 45.5
After 12 months 1.2 0.8 0.4
M8. Child’s first intake of water (%)
Responses Percentage
Child mouth/throat drying up 61.1
Family/traditional advice 27.4
No breast milk 7.2
Doctor/nurse/ANM advice 6.4
Other 2.5
M9. Reasons why child was given water before 6 months (%) - 100 Focus Districts
Age Group 100 Focus Districts Best Districts Best Districts from Focus States from Best States
Before 3 months 0.6 0.6 1.6
3-5 months 5.8 2.9 21.7
6 to 8 months 67.6 73.5 67.2
9-12 months 9.3 6.2 3.6
After 12 months 8.0 7.2 0.9
M10. Child’s first intake of solid/semi-solids (%)
Particulars 100 Focus Districts Best Districts Best Districts from Focus States from Best States
Mothers satisfied with the quantity of 47.8 67.2 81.7non-cereal foods they feed their children
M11. Mothers satisfied with quantity of non-cereal foods they feed their children(%)
Responses Percentage
Food is expensive 93.7
Food not available from family crops 7.2
Others 4.1
Food not available in market 2.3
M12. Reasons why mothers did not give more non-cereal foods - 100 focus Districts
Particulars 100 Focus Districts Best Districts Best Districts from Focus States from Best States
Families with access to soap 98.4 99.6 100.0
Families using soap to wash hands before meals 10.8 18.3 56.8
Families using soap to wash hands 19.0 25.4 49.3after using the toilet
M13. Use of Soap (%)
Facilities 100 Focus Districts Best Districts Best Districts from Focus States from Best States
Govt health center/Sub-center 16.5 30.5 45.2
Private MBBS doctor 34.6 45.7 49.7
Untrained health provider 43.1 20.0 0.2
Home or traditional remedy 1.0 0.5 0.2
M14. Preferences for Health Facilities (%)
Responses Percentage
Costs more 46.5
Takes time 27.6
Services not useful 17.6
No health center nearby 11.3
Others take the decision 2.0
M15. Reasons why trained doctor not preferred (%) - 100 Focus Districts
4544

47
Services 100 Focus Districts Best Districts Best Districts from Focus States from Best States
Food for 3-6 year olds 58.7 67.6 87.3
Take-home rations for women/infants 38.1 56.3 74.4
Immunization 85.8 86.9 64.3
Antenatal checkups 41.6 55.9 52.2
Health Check ups for children 24.2 50.4 64.0
Growth Monitoring for children 21.2 53.2 80.4
Health Referral Services 20.6 19.7 59.1
Pre-school education for 3-6 year olds 51.6 57.5 84.7
Health and Nutrition Counseling for parents 18.5 29.1 62.9
Home visits by Anganwadi worker 58.9 66.9 79.4
Do not access any services 4.8 4.1 2.3
M16. Mothers’ usage of Anganwadi Services The science is clear that the first 1,000 days after conception are the most important. Intervening within this period will have life-long and life-changing impacts on educational attainment, labour capacity, reproductive health and adult earnings. If we wait until a child is two years old, the effects of undernutrition are already irreversible.
Victoria CG, et al, for the Maternal and Child Undernutrition Study Group 2008, Maternal and child undernutrition: consequences for adult health and human capital. Article 2, Lancet 371, 340-57.
Fighting Hunger & Malnutrition
46
Availability of resources in Anganwadi Centres
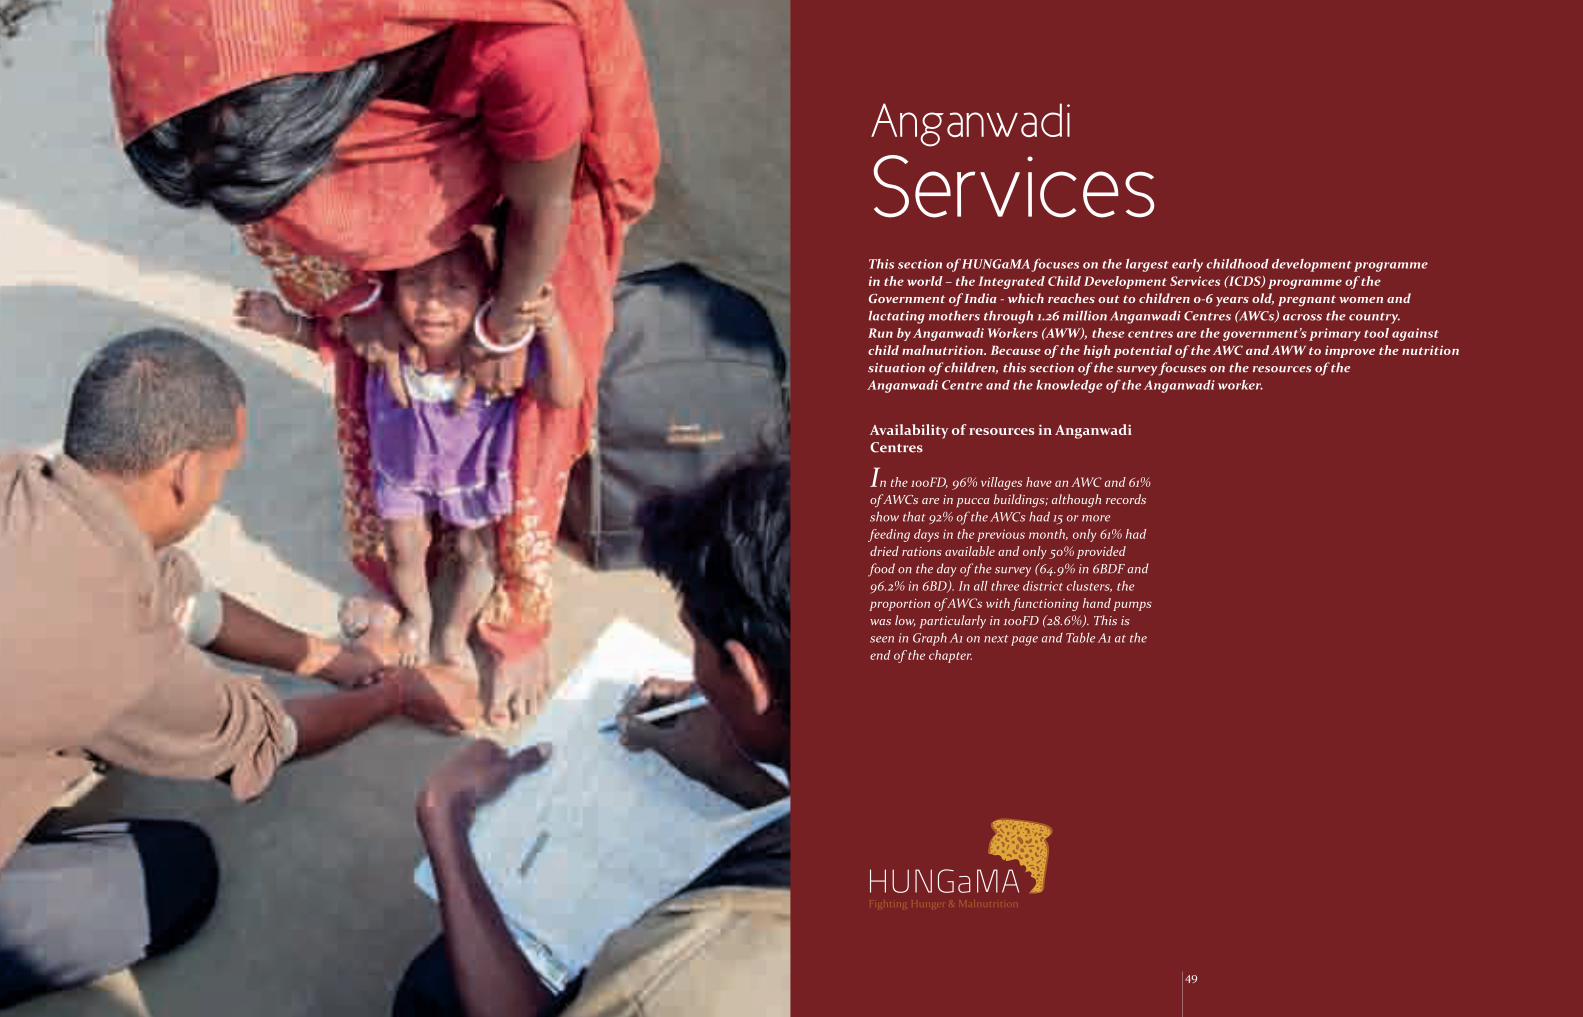
In the 100FD, 96% villages have an AWC and 61% of AWCs are in pucca buildings; although records show that 92% of the AWCs had 15 or more feeding days in the previous month, only 61% had dried rations available and only 50% provided food on the day of the survey (64.9% in 6BDF and 96.2% in 6BD). In all three district clusters, the proportion of AWCs with functioning hand pumps was low, particularly in 100FD (28.6%). This is seen in Graph A1 on next page and Table A1 at the end of the chapter.
Anganwadi
ServicesThis section of HUNGaMA focuses on the largest early childhood development programmein the world – the Integrated Child Development Services (ICDS) programme of theGovernment of India - which reaches out to children 0-6 years old, pregnant women andlactating mothers through 1.26 million Anganwadi Centres (AWCs) across the country.Run by Anganwadi Workers (AWW), these centres are the government’s primary tool againstchild malnutrition. Because of the high potential of the AWC and AWW to improve the nutritionsituation of children, this section of the survey focuses on the resources of theAnganwadi Centre and the knowledge of the Anganwadi worker.
Fighting Hunger & Malnutrition
49

50 51
Anganwadi Services
Availability of AWC in the village
Pucca Building
Health/ Nutrition Posters
Medical kit
Growth Monitoring Books
Growth Monitoring Books updated
Functioning weighing machine
Most Birth rates Recorded
Dry Ration available
Food provided on day of the survey
AWCs with 15+ feeding days in last month
Functioning handpump/ tap/ well
Functioning toilet
A1. Availability of resources in Anganwadi Centres (%)HUNGaMA Survey 2011, India
�100 Focus Districts �Best Districts From Focus States�Best District From Best States
0 10 20 30 40 50 60 70 80 90 100
2. About the Anganwadi Worker
Across three clusters, the average age of an AWW is 40 years (although the AWW tends to be younger in 100FD than in the better off districts) and more than 83.4% have studied till upto Class 8 or more. Almost all AWWs across all clusters have heard the word ‘malnutrition’ (kuposhan/sathukuraindaunavu/ poshanakuruvu/ pushtihinata). The percentage of AWWs doing 2 home visits per day or less is similar across 3 clusters – ranging from 55.8% in 100FD to 51.2% in 6BD. In 100FD, only 54.6% AWWs have attended two or more training sessions in the last 2 years (68.5% in 6BDF and 73.8% in 6BD). When the AWW was asked about the last time she was paid, only 41.7% AWWs in 100FD said that their payments were up to date while over 20% of them said that they had last been paid 3 months or longer ago. This is seen in Graphs A2-A4 below and Tables A2-A4 at the end of the chapter.
A2. About the Anganwadi Worker (%)HUNGaMA Survey 2011, India
�100 Focus Districts �Best Districts From Focus States�Best District From Best States
100
80
60
40
20
0 Average age of AWW studied at least AWW who has heard theAnganwadi worker (years) up to class 8 word ‘malnutrition’
A3. About Anganwadi Worker -Home visits & Trainings (%)HUNGaMA Survey 2011, India
�100 Focus Districts �Best Districts From Focus States�Best District From Best States
AWW doing a less than AWW with ‘no’ training AWW with at least 2 trainings 2 home visits per day in the last 2 years in the last 2 years
80706050403020100
A4. About honorarium received by Anganwadi Worker (%)HUNGaMA Survey 2011, India
�100 Focus Districts �Best Districts From Focus States�Best District From Best States
50403020100
Same Month 1 month 2 months 3 months 4 months 5 and back back back back >5 months

52 53
3. Angwanwadi Workers’ perception about what keeps a child healthy and strong
In the 100FD, the percentage of AWWs who had heard the word “malnutrition” was high (96%) but only 42% were able to give a correct definition for the word. In order to study this issue in more depth, AWWs were asked (without prompting) what is important for keeping a child healthy and strong. The most common answer was timely and full immunizations (74.7%), followed by breastfeeding soon after birth (72.4%); less than 50% AWW mentioned exclusive breastfeeding up to 6 months of age (49%), beginning supplementary food at 6 months (31.9%), or adequate food (36.3%). This is seen in Graph A5 below and Table A5 at the end of the chapter.
0 10 20 30 40 50 60 70 80 90 100
Breastfeeding soon after birth
Exclusive breastfeeding upto 6 months of age
Begining supplementary food at 6 months
Timely and full immunizations
Going to a doctor if the child falls sick
Supplementary vitamins
Clean house
Clean water
Clean food
Adequate food
Balanced diet
Washing hands with soap before eating
More money to buy food
Keeping the child clean
A5. AWW perception about important factorsfor keeping the child healthy & strong
HUNGaMA Survey 2011, India
�100 Focus Districts �Best Districts From Focus States�Best District From Best States
The proportion of children under five years old in developing countries who were underweight is estimated to have declined by 11 percentage points between 1990 and 2010, from 29% to 18%. This rate of progress is insufficient to meet the MDG target of halving 1990 levels of underweight by 2015. World Health Organisation - Global Health Observatoryhttp://www.who.int/gho/mdg/poverty-hunger/underweight_text/en/index
Fighting Hunger & Malnutrition

Details 100 Focus Districts Best Districts Best Districts from Focus States from Best States
Same Month 41.7 25.7 49.3
1 month back 22.8 32.6 48.8
2 months back 15.1 27.1 1.9
3 months back 7.8 7.6 0.0
4 months back 4.3 4.9 0.0
5 and > 5 months 8.3 2.1 0.0
Availability of Anganwadi Center 100 Focus Districts Best Districts Best Districts & Resources from Focus States from Best States
Availability of AWC in the village 96.0 98.6 100.0
Pucca building 61.4 53.1 62.9
Health/Nutrition Posters 59.4 56.8 89.5
Medical Kit 59.4 56.8 89.5
Growth Monitoring Books 73.7 85.1 95.0
Growth Monitoring Books updated 65.4 84.1 89.2
Functioning Weighing Machine 78.1 83.1 92.8
Most Birthdates Recorded 80.6 93.6 98.8
Dry Ration Available 60.7 84.8 92.2
Food Provided on the day of the Survey 50.0 64.9 96.2
AWCs with 15+ feeding days in last month 92.0 96.9 93.7
Functioning of handpump/tap/well 28.6 34.0 71.3
Functioning of Toilet 56.1 62.3 97.2
A1. Availability of Resources in Anganwadi Centres (%)
Anganwadi worker experience 100 Focus Districts Best Districts Best Districts from Focus States from Best States
Average age of AWW (years) 36.0 35.8 45.8
AWW studied at least up to Class 8 83.4 82.2 84.6
AWW who has heard the word 'malnutrition' 95.4 99.3 99.6
A2. About the Anganwadi Worker (%)
Anganwadi worker experience 100 Focus Districts Best Districts Best Districts from Focus States from Best States
AWW doing less than 2 home visits per day 55.8 55.1 51.2
AWW with "No" training in the last 2 years 13.4 4.2 1.4
AWW with at least 2 trainings in last 2 years 54.6 68.5 73.8
A3. About Anganwadi Worker – Home visits & Trainings (%)
A4. About honorarium received by Anganwadi Worker (%)
Knowledge levels about Nutrition 100 Focus Districts Best Districts Best Districts from Focus States from Best States
Breastfeeding soon after birth 72.4 72.6 85.5
Exclusive breastfeeding up to 6 months of age 49.0 70.0 74.2
Beginning supplementary food at 6 months 31.9 61.6 67.2
Timely and full immunizations 74.7 79.9 72.2
Going to a doctor if the child falls sick 29.0 41.8 43.4
Supplementary vitamins 49.2 49.7 78.2
Clean house 28.9 36.1 45.9
Clean water 38.3 41.4 51.4
Clean food 49.7 52.8 68.3
Adequate food 36.3 52.6 48.1
Balanced diet 55.0 64.3 62.8
Washing hands with soap before eating 25.7 34.7 45.7
More money to buy food 3.9 8.4 4.0
Keeping the child clean 58.4 65.0 55.8
A5: AWW perception about important factors for keeping the child healthy & strong
Anganwadi ServicesData Tables
5554

57
Executive Summary
Our first look at the newly collected HUNGaMAsuggests a number of interesting new insights. First, girls start with a nutritional advantage over boys, which they lose as they grow older, to the point that by age four they have fallen behind. There is a similar pattern for children from SC/ST and Muslim families but the effect is much less robust. We find strong evidence of income effects—children from richer families start with a better nutritional base, although they also lose ground as they grow older relative to the WHO norm. Finally there is no evidence of village infrastructure (access to healthcare, water quality, etc.) playing a role in health outcomes.
Demographics & Nutrition Status:
A first look at theHUNGaMA dataAbhijit Banerjee and Ariel ZuckerJPAL, October 2011

58 59
In the following pages we analyze the incidence of malnutrition recorded by the 2010 HUNGaMA survey. The survey was restricted to the 100 “focus” and 12 “best” districts in nine states (six focus and three best states). Focus and best districts and states were designated through ranking by UNICEF’s composite Child Development Index, which includes a broad range of indicators on health, education, labor, and other factors. The basic idea was to focus on the districts with the worst index (hence “focus” districts) but to include a few additional districts for comparison’s sake. The extra added districts were the best districts in their respective states (all the focus districts fell into one of six states – Bihar, Jharkhand, MP, Orissa, Rajasthan and UP) and in addition the two best districts in three best states (HP, Kerala and Tamil Nadu). The survey recorded anthropometric data for children under five, along with household and village level characteristics. From these data, z-scores for mid upper arm circumference (MUAC), weight-for-age, length-for-age, weight-for-height, and body mass index (BMI) were calculated by WHO standards. These z-scores essentially measure the extent to which these children lag behind the WHO standards in units of the standard deviation of that particular variable in the benchmark population. It is well-known that most children in India do lag behind, and this is reflected in z-scores which are on average negative (see Table A7 below). The results also match up well with the results from the NFHS-3, for the corresponding states, though there is some evidence of improvements in the interim period.Some of the recorded nutrition z-scores were unreasonably large, and we trimmed those that were considered implausible by WHO standards1 . The resulting estimates of mean nutrition levels2 were comparable in magnitude to Measure DHS population means. For the remainder of the analysis, we will mostly focus on MUAC, weight-for-age, and length-for-age as our measures of nutrition. Children in our sample tend to be both short and underweight for their age, and these effects cancel each other out in
measures of weight-for-length. Although weight-for-length is still an important measure of health, it does not allow us to identify childhood nutrition patterns. Moreover MUAC is a much more precise estimator of malnutrition in young children (particularly in our sample), as well as being subject to less measurement error than weight-for-length and BMI.
As shown in Appendix Tables A1-A5, severe malnutrition, as defined by a z-score of less than -3, is much more prevalent in the six focus states than the three “best” states, by standards of MUAC, weight-for-age (underweight), and length-for-age (stunted). In some focus states, the “best” districts have higher incidence of severe malnutrition than the “focus” districts (e.g. severe MUAC malnutrition in Bihar and Rajasthan, and severe wasting in Rajasthan and Jharkhand), but these instances are few and the differences in malnutrition rates are small. Appendix Table A6 shows that the incidence of severe malnutrition is higher on average for boys than for girls—a statistic that we will dissect in greater detail below through regression analysis. Appendix Table A7 shows how mean nutrition z-scores vary by household socio-economic status. Children from higher income families, where income is an index that takes the values 1, 2 and 3, have substantially better nutrition outcomes on average than their low income counterparts in both “focus” and “best” districts. Interestingly the same pattern of astrong gradient exists also in the best states. Note however that right now we are not separating between the direct effect of income and the fact that the rich and the poor do not necessarily live in the same locations and therefore are subject to different disease environments (different water supply for example). We will therefore return to this question in a later section, using multivariate regressions to sort between these alternate views. It should be noted that therefore we assume that the relationships explored do not vary between different population groups within each regression, and so our regression results are not weighted by sample probabilities. If it were the case, for example, that income’s effect on
nutrition varied by district, we would need to weight regression coefficient estimates by sampling probabilities in each district to generate unbiased estimates. Such an analysis is beyond the scope of the data at hand.
The effect of gender and ageTo look at this effect we compare nutritional outcomes for children within the same family. Table 1-3 (and Appendix Table A8-A10) reports the results. In general, we find that at birth, girls are actually better-nourished than boys on average (the coefficient on “Female” is positive when we examine all states together). Examining each state individually, we find that this is particularly true in focus states. As time goes on, nutritional outcomes for both boys and girls decline (the coefficients on age dummies for being 1-4 years old are negative). However, they decline much faster for girls. By the time girls are 4 years old, they are much more likely than their brothers to be stunted, underweight, and have low MUAC. In the “best” districts in the best states we also see nutritional outcomes fall off as the children grow older (indeed the magnitudes of the fall off are actually larger, though not always significant) but there is no gender gap—boys and girls fall behind at the same rate. Appendix tables A8-A10 show
that in some states, nutritional outcomes decline faster with age for children from Scheduled Castes (especially in Orissa), children from Scheduled Tribes (Rajasthan), or Muslim children (Uttar Pradesh)—though these effects are barely significant, if at all. When we look at the interactions between ethnicity and age in all states together, however, we do not see any clear patterns, reflecting the demographic differences between the states. These within household regressions cannot tell us the mean nutritional effects of income, but they do tell us that in general, wealthy children actually experience more dramatic declines in their nutritional z-scores with age. Turning to the state-specific regressions, we see that this effect is particularly strong in Bihar and Madhya Pradesh. However, from Table A7 we see that although even for the wealthiest families z-scores are strongly negative, they are quite a bit higher for wealthy families. In other words, the wealthy children are just losing some of their advantage at birth as they grow older. It is striking that being wealthier does not prevent the decline in z-scores that is the general pattern, suggesting that dietary or sanitary practices are probably key to understanding what is going on. The effects of household income on the age gradient do not seem to vary by gender.
1. WHO Child Growth Standards, http://www.who.int/childgrowth/software/readme_stata.pdf2. All sample means are calculated using sampling probability weights provided for the HUNGaMA data by Westat.
t statistics in parentheses * p<0.05, ** p<0.01, *** p<0.001
esAll Stat Jharkhand Madhya Pradesh Orissa Rajasthan UtBihar tar
PradeshHimachal Pradesh Kerala Tamil
Nadu
(1) (2) (3) (4) (5) (6) (7) (8) (9) (10)
Age1
Age2
Age3
Age4
Female
Female x Age1
Female x Age2
Female x Age3
Female x Age4
Table 1: MUAC Z-scores within HouseholdFocus States Best States
-0.792(-1.90)
-0.213(-0.20)
-1.051*(-2.51)
-3.935***(-3.50)
-1.141(-0.78)
0.036(0.10)
0.583(1.40)
-0.064(-0.17)
0.185(0.47)
-0.160(-1.35)
-0.242*(-2.18)
-0.208(-1.80)
-0.351**(-2.89)
0.001(0.01)
0.078(0.70)
-0.067(-0.60)
-0.021(-0.19)
-0.026(-0.22)
-0.105(-0.96)
-0.277**(-2.64)
-0.167(-1.62)
-0.293**(-2.63)
0.163(1.74)
-0.136(-1.39)
-0.271**(-2.68)
-0.190(-1.91)
-0.318**(-3.16)
-0.185*(-2.58)
-0.218**(-3.15)
-0.149*(-2.17)
-0.179*(-2.53)
-0.023(-0.34)
0.009(0.12)
-0.061(-0.81)
-0.060(-0.80)
-0.123(-1.60)
-0.140***(-3.80)
-0.159***(-4.51)
-0.123***(-3.51)
-0.168***(-4.52)
0.055(1.67)
0.036(1.02)
-0.054(-1.50)
-0.101**(-2.86)
-0.155***(-4.27)
-0.094(-0.78)
-0.043(-0.38)
-0.080(-0.68)
-0.004(-0.04)
0.130(1.22)
0.105(0.94)
0.002(0.02)
-0.068(-0.61)
-0.053(-0.46)
-0.106(-1.74)
-0.067(-1.14)
-0.069(-1.21)
-0.112(-1.80)
0.095(1.77)
0.072(1.26)
-0.014(-0.25)
-0.136*(-2.37)
-0.215***(-3.60)
-0.652(-0.48)
-0.254(-0.19)
-1.122(-0.63)
-0.879(-0.44)
-0.611(-0.67)
-0.618(-0.75)
-0.077(-0.08)
-0.710(-0.76)
0.085(0.13)
-0.270(-0.52)
-0.502(-0.90)
-0.529(-0.84)
-0.541(-0.96)
0.088(0.31)
0.222(0.75)
0.091(0.32)
0.257(0.82)
-0.044(-0.20)
-0.203(-0.95)
-0.311(-1.50)
-0.345(-1.57)
-0.011(-0.06)
0.144(0.79)
0.045(0.25)
-0.133(-0.76)
0.025(0.14)

60 61
The effect of income and caste
Restricting ourselves to comparing children within the same family has the advantage that we can be pretty sure of only comparing like to like, but it does not allow us to estimate the effect of family income or caste (since everyone in the same family has the same family income by definition). To get at these kinds of questions we compare children of the same age and gender in different families within the same village with differing incomes and caste identities. The main results are reported in Tables 4-6, and in greater detail in the Appendix. We find that household socio-economic status is by far the most robust single predictor of nutritional wellbeing in focus states, but that this effect more or less disappears in the best states (except Kerala). Children from households belonging to a Scheduled Caste or Scheduled Tribe generally have worse nutrition, but the specific effects vary considerably by state. Children from households identifying as Muslim do have significantly worse nutrition except in Himachal Pradesh.
We also look at the effects of the NREGA program on nutrition. Because having an NREGA card—or receiving work through NREGA—might be correlated with unobserved characteristics, from wage income to personal motivation, we are unable to estimate effects of the NREGA program directly. However, by interacting the percentage of households in a village holding NREGA cards with the socio-economic status of each household, we are able to identify the differential effects of the NREGA program on each income group. Across all states, we find that within a village, increasing access to NREGA cards differentially benefits low-income families, but the effect is very small. Again turning to the state-specific regressions, we can see that this effect is mostly driven by a few states: Orissa, and to a lesser degree Bihar and Himachal Pradesh.
t statistics in parentheses * p<0.05, ** p<0.01, *** p<0.001
Age1 -0.350***(-8.13)
-0.331***(-4.27)
-0.216(-1.63)
-0.256(-1.73)
-0.377(-1.45)
-0.208(-1.45)
-0.435***(-6.03)
1.013(0.81)
-7.492*(-2.28)
1.171(1.43)
Age2 -0.211***(-5.33)
-0.264***(-3.69)
-0.136(-1.12)
-0.188(-1.40)
-0.491*(-2.07)
-0.060(-0.46)
-0.203**(-3.02)
0.499(0.41)
0.790(0.97)
-0.057(-0.09)
Age3 -0.076(-1.90)
-0.180*(-2.46)
0.086(0.71)
0.222(1.53)
0.129(0.54)
0.079(0.58)
-0.168*(-2.51)
-0.122(-0.34)
-7.792*(-2.14)
0.646(0.91)
Age4 -0.041(-0.94)
-0.010(-0.13)
-0.082(-0.59)
-0.031(-0.20)
-0.118(-0.47)
0.150(1.03)
-0.127(-1.67)
-0.811*(-2.49)
-2.450(-1.27)
0.663(0.83)
Female 0.090*(2.51)
0.047(0.72)
-0.028(-0.26)
0.136(1.13)
-0.221(-1.07)
0.429***(3.59)
0.076(1.25)
0.126(0.07)
-3.670(-1.41)
-0.399(-0.63)
Female x Age1
-0.002(-0.04)
-0.084(-1.02)
0.113(0.97)
-0.206(-1.49)
0.286(1.31)
-0.060(-0.44)
0.077(1.11)
-0.514(-1.59)
0.876(0.95)
-0.292(-0.84)
Female x Age2
-0.103*(-2.51)
-0.148(-1.84)
-0.116(-0.97)
-0.273*(-2.04)
0.312(1.46)
-0.273*(-2.05)
-0.010(-0.15)
-0.238(-0.63)
0.243(0.29)
-0.056(-0.15)
Female x Age3
-0.191***(-4.68)
-0.129(-1.61)
-0.200(-1.70)
-0.321*(-2.41)
-0.041(-0.20)
-0.393**(-2.93)
-0.131(-1.93)
-0.370(-1.09)
1.114(1.16)
-0.651(-1.83)
Female x Age4
-0.232***(-5.36)
-0.296***(-3.52)
-0.112(-0.90)
-0.221(-1.52)
-0.191(-0.95)
-0.196(-1.39)
-0.219**(-3.00)
-0.417(-1.16)
-0.252(-0.28)
-0.419(-1.06)
All States Jharkhand Madhya Pradesh Orissa Rajasthan Uttar
PradeshHimachal Pradesh Kerala Tamil
Nadu
(1) (2) (3) (4) (5) (6) (7) (8) (9) (10)
Table 2. Weight-for-Age z-scores within HouseholdFocus States Best States
Table 3. Length-for-Age z-scores within HouseholdFocus States Best States
Bihar
t statistics in parentheses* p<0.05, ** p<0.01, *** p<0.001
All States Bihar Jharkhand Madhya Pradesh Orissa Rajasthan Uttar
PradeshHimachal Pradesh Kerala Tamil
Nadu
(1) (2) (3) (4) (5) (6) (7) (8) (9) (10)
Age1 -0.785***(-13.23)
-0.453***(-4.13)
-0.789***(-4.38)
-0.915***(-4.69)
-0.490(-1.24)
-0.767***(-4.04)
-1.003***(-10.17)
1.680(0.90)
4.525(1.31)
0.030(0.02)
Age2 -0.909***(-16.43)
-0.772***(-7.58)
-0.888***(-5.25)
-0.834***(-4.63)
-0.551(-1.45)
-0.903***(-5.10)
-1.103***(-11.94)
-1.129(-0.61)
0.914(0.57)
-0.620(-0.69)
Age3 -0.796***(-14.24)
-0.811***(-7.87)
-0.684***(-4.08)
-0.474*(-2.52)
-0.172(-0.46)
-0.830***(-4.51)
-0.954***(-10.37)
0.318(0.46)
4.165(1.52)
0.030(0.03)
Age4 -0.657***(-10.79)
-0.314**(-2.89)
-0.766***(-4.04)
-0.730***(-3.59)
0.023(0.06)
-0.622**(-3.24)
-0.996***(-9.57)
-0.488(-0.82)
-1.795(-0.62)
-0.572(-0.48)
Female 0.266***(5.29)
0.224*(2.34)
0.198(1.36)
0.421**(2.59)
0.118(0.37)
0.516**(3.23)
0.206*(2.46)
-0.450(-0.18)
-0.696(-0.19)
0.290(0.31)
Female x Age1
-0.116*(-2.02)
-0.251*(-2.14)
-0.166(-1.03)
-0.208(-1.15)
0.139(0.41)
-0.090(-0.50)
-0.018(-0.19)
-1.479*(-2.31)
-0.475(-0.31)
-0.661(-1.16)
Female x Age2
-0.161**(-2.81)
-0.287*(-2.53)
-0.266(-1.61)
-0.447*(-2.47)
-0.036(-0.11)
-0.136(-0.75)
0.065(0.69)
-1.326(-1.85)
-1.414(-1.08)
-1.018(-1.75)
Female x Age3
-0.248***(-4.36)
-0.265*(-2.33)
-0.180(-1.11)
-0.368*(-2.05)
-0.078(-0.24)
-0.305(-1.68)
-0.149(-1.61)
-2.144**(-3.25)
-1.923(-1.27)
-1.601**(-2.79)
Female x Age4
-0.303***(-5.05)
-0.456***(-3.85)
-0.312(-1.83)
-0.323(-1.68)
-0.504(-1.60)
-0.244(-1.29)
-0.179(-1.79)
-1.591*(-2.32)
-3.011(-1.95)
-0.571(-0.90)
t statistics in parentheses* p<0.05, ** p<0.01, *** p<0.001
Table 4: MUAC Z-scores between Households
Focus States Best States
All States Bihar Jharkhand Madhya Pradesh Orissa Rajasthan Uttar
PradeshHimachalPradesh Kerala Tamil
Nadu
(1) (2) (3) (4) (5) (6) (7) (8) (9) (10)
Mid.Income
0.229***(8.33)
0.306***(4.99)
0.305***(3.84)
0.114(1.06)
0.405**(2.67)
0.384*(2.54)
0.140**(2.99)
0.481(0.84)
0.116(0.20)
-0.050(-0.11)
High Income
0.444***(8.77)
0.706***(5.10)
0.301(1.69)
0.015(0.09)
1.454***(4.81)
0.652**(2.63)
0.280***(3.60)
0.899(1.60)
0.245(0.39)
0.167(0.34)
Mid.Income x NREGA
-0.000(-1.18)
-0.000(-0.16)
-0.001(-1.40)
-0.000(-0.39)
-0.002(-1.26)
-0.001(-0.39)
0.000(0.72)
-0.009*(-2.23)
-0.006(-0.60)
-0.003(-0.60)
High Income x NREGA
-0.001(-1.79)
-0.001(-0.41)
-0.001(-0.40)
0.001(0.51)
-0.012***(-3.55)
-0.001(-0.41)
0.001(1.07)
-0.013**(-2.92)
-0.004(-0.37)
-0.003(-0.59)
SC -0.117***(-4.24)
-0.089(-1.50)
-0.316***(-4.00)
-0.082(-0.84)
0.117(0.88)
-0.004(-0.04)
-0.138**(-3.12)
-0.544**(-2.87)
0.209(0.87)
-0.106(-0.77)
ST -0.213***(-6.05)
-0.448***(-3.40)
-0.169*(-2.08)
-0.311***(-3.37)
-0.314**(-2.67)
-0.106(-1.18)
-0.186(-1.84)
-0.348(-0.69)
-0.319(-0.75)
-1.349**(-2.91)
Muslim -0.023(-0.63)
-0.066(-0.97)
0.033(0.36)
0.123(0.67)
0.096(0.33)
-0.220(-1.43)
0.020(0.37)
-2.203***(-6.96)
-0.405(-0.86)
0.345(1.57)

62 63
The effect of village infrastructure
Finally the villages in each district were stratified by size before being selected for inclusion in the survey. In order to look at the effect of village characteristics on nutrition we compare children of the same age and gender living in families with the same caste and religious identities and income levels, across different villages within the same stratum that have different levels of infrastructure. The concern with these results is that we are comparing apples to oranges (the villages that have better infrastructure are probably different, and plausibly better, in many
other ways.) Given that, it is remarkable that we find no robust effects of village infrastructure variables, such as a connection to a paved road, a piped water source, a village primary school, or a village primary health center. One interesting result is that across all states, children with very low MUAC z-scores are more likely to live in villages with a PDS shop, which may suggest that these shops are successfully targeted to populations with poor nutrition.
t statistics in parentheses
* p<0.05, ** p<0.01, *** p<0.001
Table 5: Weight-for-Age Z-scores between Households
Focus States Best States
All States Bihar Jharkhand Madhya Pradesh Orissa Rajasthan Uttar
PradeshHimachalPradesh Kerala Tamil
Nadu
(1) (2) (3) (4) (5) (6) (7) (8) (9) (10)
Mid.Income
0.265***(8.12)
0.272***(4.04)
0.319**(3.18)
0.087(0.64)
0.458*(2.54)
0.818***(3.97)
0.122*(2.21)
-0.557(-0.65)
1.947***(3.58)
0.544(1.08)
High Income
0.637***(10.53)
0.939***(5.46)
0.652**(2.89)
0.492*(2.32)
1.420***(3.93)
1.103***(3.82)
0.430***(4.55)
-0.829(-0.94)
1.764**(2.77)
1.046(1.96)
Mid.Income x NREGA
-0.000(-0.86)
-0.001(-0.66)
0.000(0.10)
0.001(0.81)
-0.004(-1.72)
-0.003(-1.38)
0.001(0.98)
-0.005(-0.67)
-0.009(-0.57)
-0.002(-0.37)
High Income x NREGA
-0.003***(-4.10)
-0.008**(-2.92)
-0.006(-1.75)
0.002(0.94)
-0.014**(-2.84)
-0.005(-1.47)
-0.000(-0.02)
-0.004(-0.60)
-0.012(-0.75)
-0.006(-0.87)
SC -0.184***(-6.11)
-0.281***(-4.58)
-0.405***(-4.34)
0.000(0.00)
0.151(0.91)
0.044(0.43)
-0.210***(-4.31)
-0.410*(-2.17)
-0.027(-0.10)
0.195(1.31)
ST -0.239***(-5.76)
-0.537***(-3.51)
-0.300***(-3.46)
-0.257*(-2.36)
-0.243(-1.91)
-0.025(-0.24)
-0.095(-0.81)
-0.060(-0.13)
0.240(0.76)
-0.560(-1.15)
Muslim0.065(1.59) 0.008
(0.11)0.080(0.82)
0.287(1.37)
-0.606(-1.76)
0.008(0.04)
0.076(1.18)
-1.443***(-3.43)
0.044(0.11)
0.067(0.08)
t statistics in parentheses* p<0.05, ** p<0.01, *** p<0.001
Table 6: Length-for-Age Z-scores between Households
Focus States Best States
All States Bihar Jharkhand Madhya Pradesh Orissa Rajasthan Uttar
PradeshHimachalPradesh Kerala Tamil
Nadu
(1) (2) (3) (4) (5) (6) (7) (8) (9) (10)
Mid.Income
0.244***(5.83)
0.284**(3.20)
0.368**(2.70)
-0.038(-0.22)
0.165(0.80)
0.551*(2.15)
0.151*(2.20)
-0.557(-0.65)
1.947***(3.58)
0.544(1.08)
High Income
0.629***(8.02)
0.733**(3.25)
0.413(1.20)
0.497(1.73)
0.668(1.68)
0.871*(2.50)
0.415***(3.33)
-0.829(-0.94)
1.764**(2.77)
1.046(1.96)
Mid.Income x NREGA
-0.001(-1.53)
-0.003*(-2.03)
-0.001(-0.81)
0.003(1.39)
-0.002(-0.86)
-0.002(-0.57)
-0.000(-0.05)
-0.005(-0.67)
-0.009(-0.57)
-0.002(-0.37)
High Income x NREGA
-0.003***(-3.43)
-0.002(-0.71)
-0.002(-0.58)
0.003(0.77)
-0.010*(-2.00)
-0.002(-0.64)
0.001(0.27)
-0.004(-0.60)
-0.012(-0.75)
-0.006(-0.87)
SC -0.177***(-4.58)
-0.321***(-4.03)
-0.440***(-3.48)
0.103(0.72)
0.131(0.59)
-0.005(-0.04)
-0.178**(-2.96)
-0.410*(-2.17)
-0.027(-0.10)
0.195(1.31)
ST -0.317***(-5.71)
-0.601**(-3.05)
-0.382**(-3.00)
-0.330**(-2.63)
-0.387*(-2.20)
0.116(0.83)
-0.074(-0.44)
-0.060(-0.13)
0.240(0.76)
-0.560(-1.15)
Muslim 0.014(0.28)
-0.069(-0.71)
-0.129(-1.03)
0.152(0.61)
-0.164(-0.52)
-0.200(-1.13)
0.133(1.58)
-1.443***(-3.43)
0.044(0.11)
0.067(0.08)
t statistics in parentheses* p<0.05, ** p<0.01, *** p<0.001
Table 7: MUAC Z-scores between Villages
Focus States Best StatesAll
States Bihar Jharkhand Madhya Pradesh Orissa Rajasthan Uttar
PradeshHimachalPradesh Kerala Tamil
Nadu
(1) (2) (3) (4) (5) (6) (7) (8) (9) (10)
Village con-nected to
paved road0.039**(2.99)
0.108**(2.71)
0.061(1.27)
-0.058(-0.70)
0.116(1.61)
0.053(0.64)
-0.049(-1.00)
0.081(0.43)
0.652***(4.88)
-0.028(-0.18)
Village had PDS
shop-0.037***
(-3.53)-0.001(-0.02)
-0.058(-1.27)
-0.029(-0.55)
0.037(0.61)
-0.049(-0.87)
-0.082**(-3.07)
-0.051(-0.55)
0.429*(2.44)
Village has government primary school
0.031(1.81)
-0.009(-0.15)
0.045(0.61)
0.026(0.19)
0.122(1.11)
0.120(1.82)
0.059(1.10)
-0.048(-0.47)
-0.107(-0.85)
-0.025(-0.18)
Village has primary
health center
0.035***(3.51)
0.116***(3.55)
-0.012(-0.26)
-0.008(-0.14)
0.000(0.00)
0.067(1.11)
0.038(1.49)
0.046(0.48)
-0.010(-0.08)
Village has ASHA worker
available
-0.008(-0.58)
-0.012(-0.22)
-0.085(-1.45)
-0.070(-0.90)
0.081(0.90)
0.081(1.42)
0.068(1.63)
-0.249(-0.86)
-0.181(-1.07)
Village has ANM available
0.013(1.10)
-0.049(-1.29)
0.150*(2.57)
-0.053(-0.53)
-0.044(-0.82)
-0.016(-0.19)
0.002(0.07)
0.091(0.93)
-0.104(-0.57)
-0.249*(-2.65)
Village has water tap or
pipeline
0.025*(2.08)
-0.101(-1.22)
-0.065(-0.90)
0.191*(2.42)
0.098(1.82)
0.064(1.51)
0.025(1.04)
-0.645***(-4.64)
0.498**(3.21)

64 65
t statistics in parentheses* p<0.05, ** p<0.01, *** p<0.001
Table 8: Weight-for-Age Z-scores between Villages
Focus States Best States
AllStates Bihar Jharkhand Madhya
Pradesh Orissa Rajasthan Uttar Pradesh
HimachalPradesh Kerala Tamil Nadu
(1) (2) (3) (4) (5) (6) (7) (8) (9) (10)
Village con-nected to
paved road0.007(0.38)
0.082*(2.08)
0.098*(2.00)
-0.088(-1.34)
0.002(0.02)
-0.178(-1.73)
-0.034(-0.51)
0.033(0.23)
0.336**(3.20)
0.009(0.10)
Village had PDS shop
-0.005(-0.37)
0.071(1.86)
0.057(1.26)
0.045(0.90)
0.090(1.03)
-0.126*(-2.09)
-0.066*(-2.18)
-0.052(-0.48)
0.668***(4.09)
Village has government
primary school
-0.016(-0.70)
-0.016(-0.70)
0.022(0.47)
0.160(1.65)
0.126(1.12)
-0.133(-1.81)
0.017(0.25)
0.121(1.21)
-1.095***(-11.77)
-0.084(-0.85)
Village has primary
health center
-0.020(-1.48)
0.051(1.50)
0.044(0.94)
-0.014(-0.25)
0.018(0.25)
0.092(1.54)
-0.004(-0.15)
-0.119(-1.23)
0.090(1.17)
Village has ASHA worker
available
-0.003(-0.17)
0.046(0.85)
-0.122(-1.92)
0.019(0.25)
0.118(0.88)
-0.064(-1.09)
0.044(1.02)
-0.060(-0.21)
-0.046(-0.59)
Village has ANM avail-
able
0.013(0.84)
-0.018(-0.49)
-0.000(-0.00)
-0.039(-0.68)
-0.274**(-3.20)
-0.015(-0.20)
0.001(0.04)
0.101(1.08)
-0.129(-0.84)
-0.078(-0.82)
Village has water tap or
pipeline
0.008(0.50)
-0.031(-0.41)
0.062(0.75)
0.048(0.83)
0.143*(1.99)
0.118*(2.52)
0.005(0.18)
0.279*(2.07)
0.295**(2.70)
t statistics in parentheses* p<0.05, ** p<0.01, *** p<0.001
Table 9: Length-for-Age Z-scores between Villages
Focus States Best StatesAll
States Bihar Jharkhand Madhya Pradesh Orissa Rajasthan Uttar
PradeshHimachalPradesh Kerala Tamil Nadu
(1) (2) (3) (4) (5) (6) (7) (8) (9) (10)
Village con-nected to
paved road0.029(1.27)
0.063(1.11)
0.134(1.72)
-0.128(-1.44)
-0.054(-0.47)
-0.207(-1.48)
-0.007(-0.09)
0.617(1.81)
-0.566(-1.83)
-0.028(-0.12)
Village had PDS shop
0.023(1.26)
0.027(0.52)
0.095(1.30)
-0.089(-1.33)
0.132(1.32)
0.087(0.96)
-0.026(-0.61)
0.041(0.25)
0.167(0.43)
Village has government
primary school
-0.040(-1.31)
-0.083(-0.95)
0.026(0.31)
0.527*(2.08)
-0.138(-0.35)
-0.093(-1.15)
0.049(0.55)
-0.079(-0.48)
-0.185(-0.71)
-0.045(-0.18)
Village has primary
health center
-0.011(-0.64)
0.080(1.72)
-0.033(-0.40)
-0.012(-0.16)
0.201*(2.08)
0.108(1.37)
-0.018(-0.49)
-0.255(-1.46)
0.032(0.24)
Village has ASHA worker
available
-0.095***(-3.76)
0.059(0.77)
-0.469***(-4.28)
-0.063(-0.51)
-0.063(-0.42)
-0.059(-0.79)
0.116*(2.06)
-0.762(-1.50)
-0.081(-0.57)
Village has ANM avail-
able
0.087***(4.25)
0.051(0.99)
0.077(0.86)
-0.012(-0.13)
-0.230*(-2.21)
0.180*(2.26)
0.029(0.68)
0.418*(2.66)
0.719***(5.35)
0.543**(2.94)
Village has water tap or
pipeline
0.012(0.58)
-0.093(-0.77)
0.327*(2.38)
0.046(0.55)
0.128(1.36)
0.045(0.71)
-0.006(-0.15)
-0.182(-0.64)
0.250(1.52)

66 67
On prevalence of underweight among children below 5 years, we have comparable data from 2004 (DLHS-2) and HUNGaMA 2011 shows an average annual rate of reduction of 2.9%. In the case of stunting however, the situation is rather alarming, with prevalence being over 50 per cent in the 100 focus districts. Stunting is a condition that reflects cumulative effects of socio-economic, environmental, health, and nutritional conditions and is considered to be a reliable indicator of long-standing malnutrition. This could be a call to focus on long term social impact programmes that will address stunting.
Given the high prevalence of malnutrition in children below 2 years, and the proven criticality of arresting it before this age, could it be that our mothers need more support in the first 1000 days, ie during pregnancy and first two years of the child’s life? Support in terms of knowledge and significance of best practices such as increased intake of food during pregnancy, institutional delivery, giving colostrum to the newborn, exclusive breastfeeding for first 6 months, starting nutritive semi-solids at 6 months etc. Support also in terms of monitoring the growth of the child so that there is early identification of risk of malnutrition. Perhaps this underscores the importance of strengthening the outreach and counseling component of the Anganwadi services. This may require a fresh look at the Anganwadi Worker’s case load and skill sets.
The first and primary custodian and protector of an infant’s health is her mother. She does the best she can, with information and resources available to her, to nurture her child. This assumption is the
Discussion
Pointsbasis of the ‘Mothers’ Voice’ section of the HUNGaMA Survey. The findings in this section point unquestionably to the poor status of women in our country today. The low percentage of mothers who have been to school, the large number of women who have given birth to low birth weight babies, the rapidly declining nutrition status of an infant girl in comparison to infant boys, the mother’s poor knowledge of what is good for her baby, her lack of decision-making power within the family – these findings seem to build a case for empowering mothers.
Social and economic backwardness is aggravated by inequality in access to information. The HUNGaMA Survey findings confirm this. Mothers, village-level service providers, Panchayat members and the community in our villages have poor access to information on best practices in childbearing and childrearing. In this 24x7 information overload age, an aggressive education-communication campaign using multiple media and formats seems to be the obvious opportunity to tap for reaching out to our rural populations.
Fighting Hunger & Malnutrition
Malnutrition is associated with about half of all child deaths worldwide. Malnourished children have lowered resistance to infection; they are more likely to die from common childhood ailments like diarrhoeal diseases and respiratory infections; and for those who survive, frequent illness saps their nutritional status, locking them into a vicious cycle of recurring sickness, faltering growth and diminished learning ability.
UNICEFhttp://www.unicef.org/specialsession/about/sgreport-pdf/02 _ChildMalnutrition_D734

To address this large gap in child nutrition data in the country, the HUNGaMA Survey was designed to report nutrition data – underweight, stunting and wasting - at the district level for the 112 selected districts1. Data collected for each district has been captured in two formats in the following pages. The first format is a table presenting data on percentage of children (0-59 months) wasting, underweight and stunting (less than 3 SD and less than 2 SD) in the 112 survey districts, clubbed state-wise. It also presents percentage of children malnourished as per mid-upper arm circumference measurements and percentage of children having oedema. For each district, the DLHS-2 (2002-04) underweight data has been provided, as well as the under 5 mortality rate from Annual Health Survey 2010-11.
The second format is a one-page summary on each district surveyed. Each page has district-specific data clubbed into five sections:
1. Snapshot of services available – information on services such as roads, drainage, electricity, schools, health centres and some Anganwadi Centre details available at villages in the district
2. Households owning assets and using services – information on households owning assets such as telephone, two-wheel and four-wheel vehicles, pucca house, electricity and households accessing services such as PDS, MNREGA and health insurance
3. Nutritional status of children 0-59 months – data on severe and moderate malnutrition (stunting, underweight and stunting) of children in this district. DLHS-2 (2002-04) underweight data for this district is also reported here. It may be noted that DLHS-2 used NCHS standards while HUNGaMA Survey used the WHO Growth Standards for data analysis. This section also presents data on Mid Upper Arm Circumference of children
4. Access to Anganwadi Centre – information on usage of various services of the village Anganwadi Centre as reported by mothers who were interviewed
5. Mothers’ Voice – information on mothers’ education profile, their knowledge and understanding of malnutrition and feeding practices adopted by them for their newborn children
District-wise
SummaryThe most recent data in India on nutrition status of children is from the third round of the National Family Health Survey (NFHS-3) conducted in 2005-06. This data, which included underweight, wasting and stunting, is aggregated at the state level. This makes it difficult for policy-makers and implementers to identify geographies for concerted action. The last time district level data on nutrition was collected in India on a large scale was in the second round of the District Level Health Survey (DLHS-2) conducted in 2002-04. This survey, however, collected underweight data only – so there is no recent (not even 10 year-old) reference point for district level data on stunting and wasting.
1. For criteria of district selection for HUNGaMA Survey, please refer to chapter named Survey Methodology
69

70 71
HUNGaMA - Nutritional Indicators by District
JHARKHAND
BIHAR
Sl.No.
% WastingWeight-for-
Height
% UnderweightWeight-for-
Age
% StuntingHeight-for-
Age
% MUAC (MidUpper Arm
Circumference)##
%Oedema
DLHS-2(2002-04) **
% Underweight
Under-5mortalityper 1000 #
State/District
<-3SD <-2SD^ <-3SD <-2SD^ <-3SD <-2SD^ Severe Moderate <-3SD <-2SD^
1 Araria 4.25 14.34 20.06 47.88 35.54 56.97 5.29 15.98 2.12 34.25 56.87 902 Aurangabad 2.84 11.82 19.29 49.47 31.92 63.09 2.59 12.19 0.18 24.22 56.57 613 Banka 3.91 14.20 16.28 46.19 30.09 57.43 1.73 9.43 19.68 18.57 40.33 634 Begusarai 1.82 7.36 9.84 33.93 28.73 54.88 0.42 6.39 0.50 20.71 43.39 675 Buxar 3.30 11.65 13.05 37.26 24.95 49.67 1.68 7.35 12.54 21.91 52.67 786 Darbhanga 1.82 10.26 15.17 45.99 35.80 64.23 1.46 7.77 0.31 29.73 55.50 867 Gaya 2.51 13.02 16.44 45.84 29.31 56.42 0.38 8.66 0.26 28.78 58.40 728 Jamui 6.08 14.53 18.95 46.35 38.19 63.08 4.21 14.35 4.61 23.20 47.77 809 Jehanabad 1.92 13.64 18.98 44.98 28.79 53.26 1.35 10.39 0.28 31.16 58.25 6810 Kaimur 3.70 14.01 13.40 35.74 22.48 43.23 0.84 7.49 0.84 26.87 50.67 73 (Bhabua)11 Katihar 3.01 13.32 12.18 37.33 27.38 52.90 3.11 11.05 5.69 23.47 47.81 8712 Khagaria 3.29 11.69 15.00 41.81 32.60 57.78 1.88 13.76 2.56 29.93 54.33 10613 Kishanganj 3.99 11.54 19.74 44.85 42.92 64.88 1.04 8.94 2.69 25.20 50.80 9414 Madhepura 4.58 12.97 16.32 40.47 29.29 53.11 1.53 10.65 0.00 45.80 69.11 10315 Madhubani 1.73 10.58 16.19 44.99 29.49 57.60 2.11 9.87 1.44 29.37 56.53 7316 Munger 3.16 10.62 13.20 35.49 33.04 55.36 2.03 16.50 3.48 23.26 45.44 6817 Nawada 3.77 11.54 16.45 43.99 31.75 54.58 2.28 13.04 0.11 21.10 46.83 6118 Pashchim 2.01 8.58 12.36 37.37 29.82 56.10 1.15 12.87 14.78 28.86 57.41 81 Champaran19 Purba 3.32 10.25 13.60 38.17 33.51 57.04 1.43 11.71 0.13 22.74 47.56 72 Champaran20 Saharsa 3.52 12.00 15.76 42.77 33.86 57.02 2.87 11.98 0.00 25.00 53.25 9221 Samastipur 2.32 8.29 14.37 38.22 36.70 62.85 2.42 8.61 2.04 24.77 51.23 7922 Sheohar 3.85 11.28 16.97 43.00 37.86 61.67 3.34 16.08 0.61 17.76 42.99 8923 Supaul 2.95 12.06 14.74 42.13 28.19 52.17 1.24 9.71 2.09 31.29 54.37 92
24 Chatra 4.00 16.96 15.82 41.03 26.87 50.44 1.91 22.60 0.58 26.15 49.93 6825 Deoghar 4.52 17.56 20.64 47.82 33.62 57.68 1.71 9.26 6.56 22.44 45.71 5326 Dhanbad 6.49 18.21 17.10 46.01 24.58 51.30 0.50 4.36 0.00 12.41 42.15 5827 Dumka 3.64 12.37 19.92 45.83 38.42 63.65 0.79 9.13 6.66 28.25 54.67 5928 Garhwa 2.43 12.76 18.95 48.56 35.64 63.27 0.95 11.56 0.98 18.69 44.59 5429 Giridih 3.93 16.24 13.68 41.93 25.93 53.78 1.65 15.00 7.11 31.58 59.65 5030 Godda 2.07 12.02 13.74 39.09 27.09 50.96 1.17 7.69 1.10 21.02 46.97 9531 Gumla 9.36 20.03 20.69 49.62 32.99 58.44 1.25 19.02 0.00 15.74 45.57 7732 Kodarma 2.48 8.34 13.94 41.58 34.98 62.38 1.58 10.90 0.38 26.59 56.85 4733 Lohardaga 3.52 15.57 18.32 47.43 29.98 60.63 1.15 8.24 0.12 17.84 44.02 7734 Pakaur 3.65 17.60 22.02 51.14 32.53 57.28 1.69 11.06 0.60 18.20 44.89 8535 Palamu 2.19 12.94 14.88 40.97 26.97 52.68 2.94 14.87 1.66 22.41 44.81 6636 Pashchimi 10.11 26.53 23.30 49.31 27.16 51.44 2.83 13.55 1.77 25.69 51.20 101 Singhbhum37 Sahibganj 3.16 12.16 17.68 46.09 35.37 60.34 3.04 13.75 0.12 38.56 60.59 93
HUNGaMA - Nutritional Indicators by District
MADHYA PRADESH
Sl.No.
% WastingWeight-for-
Height
% UnderweightWeight-for-
Age
% StuntingHeight-for-
Age
% MUAC (MidUpper Arm
Circumference)##
%Oedema
DLHS-2(2002-04) **
% Underweight
Under-5mortalityper 1000 #
State/District
<-3SD <-2SD^ <-3SD <-2SD^ <-3SD <-2SD^ Severe Moderate <-3SD <-2SD^
38 Barwani 7.05 23.34 26.74 56.38 35.85 61.93 2.29 11.41 11.94 33.48 60.99 9239 Bhind 2.30 7.37 13.60 38.50 33.46 58.41 1.75 5.22 1.46 27.14 54.49 7840 Chhatarpur 2.70 11.28 14.26 39.43 31.48 59.68 3.05 18.53 25.03 28.75 57.35 9741 Dindori 3.56 13.76 14.32 38.85 27.27 50.39 1.06 13.31 22.80 28.44 55.18 10542 Guna 4.88 14.22 16.79 44.01 27.07 52.29 1.82 12.39 8.68 27.10 58.21 10543 Indore 1.67 13.90 10.29 34.65 19.31 43.73 0.17 3.94 5.60 15.27 39.50 7444 Jhabua 3.64 15.10 21.58 48.37 39.40 61.61 1.68 15.46 4.12 35.01 62.70 9645 Panna 2.92 10.29 11.01 37.20 33.56 56.08 3.32 10.63 10.86 31.20 56.95 14546 Shivpuri 4.28 13.40 17.24 41.80 28.06 54.53 2.20 13.33 4.10 29.98 58.71 10347 Tikamgarh 2.12 9.54 13.61 40.49 33.40 60.17 1.51 7.67 0.39 27.50 51.35 9448 Umaria 4.81 15.43 18.76 48.75 29.47 54.87 1.43 12.66 28.03 13.80 38.89 11649 Vidisha 3.38 11.44 10.84 33.81 21.10 43.74 3.57 13.61 1.89 26.99 57.06 115
50 Cuttack 2.06 10.08 7.91 24.46 11.83 29.34 1.20 4.48 0.25 2.54 11.59 10851 Gajapati 2.20 11.92 14.71 44.43 26.56 54.21 1.21 5.27 3.14 16.77 42.46 8952 Kandhamal 2.97 14.52 10.48 39.28 20.53 51.44 1.08 5.53 3.93 18.83 43.88 15453 Koraput 5.15 14.75 21.42 54.48 40.88 68.86 1.50 6.75 2.54 17.38 40.08 7554 Malkangiri 5.18 20.52 26.32 57.75 34.92 61.37 2.22 13.22 1.25 28.82 54.51 8055 Rayagada 3.91 10.57 16.37 42.07 28.79 59.30 1.65 9.26 1.26 25.57 48.44 112
56 Banswara 5.87 19.95 24.41 51.98 36.58 58.67 3.89 15.85 15.38 18.08 36.38 10257 Baran 3.25 13.12 13.55 39.63 23.28 50.51 1.44 10.30 5.09 35.32 62.63 8058 Barmer 3.95 12.70 17.54 39.33 33.01 54.83 2.52 14.94 5.86 46.94 69.88 8759 Bharatpur 3.53 10.66 16.43 39.95 27.77 53.29 3.24 16.44 4.23 23.94 42.86 7860 Dhaulpur 2.54 9.74 17.04 44.53 40.84 63.36 3.09 15.78 2.38 29.38 57.82 8361 Dungarpur 7.36 19.16 21.03 41.65 31.49 53.42 2.93 17.19 20.67 34.60 57.41 8862 Jaisalmer 2.86 10.22 12.18 35.01 26.23 51.14 3.01 10.97 13.36 42.72 69.74 8163 Jhalawar 5.70 17.14 19.97 47.36 33.12 53.81 1.98 10.44 2.33 30.45 50.29 8864 Karauli 3.11 12.24 16.79 42.01 29.00 50.24 1.86 7.62 0.54 29.85 55.13 8065 Kota 4.59 15.17 13.86 36.70 18.76 44.20 2.90 15.69 1.43 24.94 54.23 62
ORISSA
RAJASTHAN

72 73
HUNGaMA - Nutritional Indicators by District
UTTAR PRADESH
Sl.No.
% WastingWeight-for-
Height
% UnderweightWeight-for-
Age
% StuntingHeight-for-
Age
% MUAC (MidUpper Arm
Circumference)##
%Oedema
DLHS-2(2002-04) **
% Underweight
Under-5mortalityper 1000 #
State/District
<-3SD <-2SD^ <-3SD <-2SD^ <-3SD <-2SD^ Severe Moderate <-3SD <-2SD^
66 Auraiya 2.59 10.43 12.39 35.17 27.89 52.84 0.54 4.19 4.24 44.07 78.15 9267 Bahraich 2.91 8.69 19.91 48.54 46.69 71.41 2.56 10.75 2.26 16.57 40.99 10368 Balrampur 1.61 6.90 15.72 41.75 40.27 65.98 1.31 7.23 0.60 23.87 50.76 13069 Banda 5.24 12.25 20.95 45.67 35.83 61.79 2.43 9.65 0.54 24.67 55.36 9470 Barabanki 3.31 10.10 20.24 45.96 40.51 61.59 0.58 4.03 1.15 17.21 41.85 9771 Budaun 2.11 8.38 16.64 41.32 36.61 59.76 1.38 11.94 7.48 22.81 47.45 11572 Bulandshahar 2.43 7.59 13.46 37.58 34.88 59.84 1.23 6.14 0.28 75.12 92.63 9173 Chitrakoot 3.54 11.07 19.97 47.86 37.11 63.36 2.49 7.76 0.51 25.22 56.21 13074 Etah 3.11 6.87 12.66 36.04 36.74 62.98 1.57 8.36 7.53 21.36 47.29 9875 Farrukhabad 2.87 8.59 15.85 41.45 34.25 59.28 1.17 8.60 0.51 68.78 85.79 10676 Fatehpur 3.03 10.86 15.59 45.48 39.90 67.44 2.61 9.80 0.00 26.34 56.27 8777 Firozabad 3.70 9.59 15.41 40.21 36.12 65.24 1.26 7.01 6.80 21.92 43.53 9278 Gautam 2.81 7.77 8.49 26.35 24.90 48.19 1.13 8.44 3.34 11.94 31.34 73 Buddha Nagar*79 Gonda 3.11 8.67 12.32 34.15 34.04 56.66 1.57 5.12 1.31 20.28 47.16 9980 Hardoi 3.50 10.19 20.21 41.79 40.66 62.16 0.66 6.46 24.01 18.76 41.59 11581 Hathras 1.91 6.69 11.33 34.38 29.04 54.55 1.79 9.62 0.47 49.48 70.69 8182 Jalaun 2.79 10.15 9.17 30.47 19.41 44.67 1.06 4.68 0.10 17.00 47.00 9683 Jhansi 1.78 8.16 16.84 44.57 32.98 61.93 1.91 8.19 0.64 27.25 57.11 7684 Jyotiba 4.40 9.74 9.19 26.89 24.03 44.89 2.45 12.12 0.00 54.85 74.72 89 Phule Nagar85 Kannauj 4.61 12.54 14.42 38.28 31.02 52.46 0.16 2.08 2.15 18.86 40.86 10186 Kheri 4.25 11.79 25.89 55.28 49.41 72.13 0.19 9.00 3.81 23.45 50.09 12387 Lalitpur 3.89 13.21 19.54 49.24 37.24 64.33 1.40 7.40 0.20 28.48 60.56 11988 Mahoba 2.07 8.49 15.64 40.48 33.23 54.91 0.85 14.04 5.04 24.32 57.36 7689 Maharajganj 3.82 11.13 11.45 37.11 26.76 52.05 0.97 13.41 0.28 23.43 54.95 11290 Mainpuri 1.49 6.43 10.33 33.61 32.02 58.32 0.74 6.31 0.84 66.54 87.97 7891 Mathura 1.58 6.58 9.70 28.71 28.16 52.73 1.02 3.56 0.21 39.31 54.30 7192 Mirzapur 2.86 15.92 16.69 41.94 23.42 47.13 1.18 8.93 0.66 34.83 59.43 11293 Moradabad 1.87 5.01 13.65 40.84 37.69 66.08 1.07 7.32 0.33 39.34 77.85 8594 Pilibhit 4.75 12.89 20.90 47.26 38.94 61.49 1.92 6.79 0.00 29.95 51.49 9995 Pratapgarh 2.52 8.56 14.53 38.96 38.00 64.11 0.76 6.56 17.98 23.80 53.88 11496 Rae Bareli 3.39 6.84 16.79 40.77 50.28 70.40 0.76 4.65 18.57 20.59 48.90 8397 Rampur 1.73 4.09 14.12 36.09 42.94 67.30 1.34 6.88 1.64 19.03 40.39 10398 Sant Kabir 3.33 7.75 12.14 36.15 33.78 58.09 0.80 9.15 0.63 16.78 47.11 96 Nagar99 Sant Ravidas 2.71 10.85 17.21 41.80 31.89 56.71 2.59 9.58 0.11 22.75 53.25 110 Nagar Bhadohi100 Shahjahanpur 4.21 11.78 19.63 43.61 37.94 61.26 2.22 7.96 3.98 26.51 44.98 115101 Shrawasti 2.48 7.91 21.25 50.32 46.97 72.31 1.98 8.62 3.14 16.44 46.24 142
HUNGaMA - Nutritional Indicators by District
Sl.No.
% WastingWeight-for-
Height
% UnderweightWeight-for-
Age
% StuntingHeight-for-
Age
% MUAC (MidUpper Arm
Circumference)##
%Oedema
DLHS-2(2002-04) **
% Underweight
Under-5mortalityper 1000 #
State/District
<-3SD <-2SD^ <-3SD <-2SD^ <-3SD <-2SD^ Severe Moderate <-3SD <-2SD^
102 Siddharthnagar 2.57 8.90 17.65 42.27 41.16 65.28 2.73 12.81 0.28 21.01 51.17 122103 Sitapur 1.85 11.02 24.19 52.39 46.33 71.42 1.22 14.62 7.98 21.24 46.63 121104 Sonbhadra 3.53 13.50 12.82 37.53 26.25 50.58 2.70 14.55 6.97 26.45 50.18 105105 Sultanpur 2.56 7.10 12.74 36.13 29.12 56.12 0.33 5.22 8.79 21.47 48.34 70106 Unnao 3.99 9.52 15.47 44.53 42.67 65.42 0.74 5.23 0.38 26.16 60.32 85
107 Hamirpur 1.13 4.10 2.69 16.10 16.23 35.63 0.22 5.83 0.00 15.12 40.89 64~108 Mandi 0.67 5.22 3.42 15.62 19.92 40.08 0.00 1.32 0.12 12.95 30.12 80~
109 Pathanamthitta 8.22 21.18 3.95 17.73 13.26 25.22 0.87 2.38 0.20 9.18 30.10 50~110 Thiruvanantha- 5.00 10.35 6.30 16.84 10.86 30.10 1.43 4.53 0.00 9.76 30.73 51~ puram
111 Coimbatore 4.96 17.00 7.63 27.80 10.93 30.07 1.75 4.25 0.00 31.56 49.43 91~112 Kancheepuram 3.96 13.60 8.53 27.38 18.98 38.12 1.15 3.28 0.98 11.60 29.14 71~
KERALA
TAMIL NADU
HIMACHAL PRADESH
Note:
Each indice is expressed in standard deviation units (SD) from the median of the 2006 WHO International Reference Population.
^ <-2SD = Malnourished i.e. children who are below -3 SD from the International Reference Population Median (<-3SD = Severe)
## MUAC - Severe = <11.5 cm and Moderate = between 11.5 cm to 12.5 cm
Source:
** DLHS on RCH (2002 - 04), Nutritional Status of Children and Prevalence of Anaemia Among Children, Adolescent Girls and
Pregnant Women (Using New WHO Growth Standards);
# Annual Health Survey 2010-11, Office of Registrar General, India, Ministry of Home Affairs, GoI.
~ Census of India 2001 (2009), District Level Estimates of Child Mortality in India - Based on the 2001 Census Data

Bihar
Fighting Hunger & Malnutrition
75

76
Mothers’ Voice (%)
Average Household Size (in numbers) 7
Mothers with no schooling 85
Fathers with no schooling 73
Mothers who have never heard the word Malnutrition 94
Mothers who had institutional delivery 20
Mothers who gave breastmilk to child as first intake 49
Mothers who breastfed within 1 hour of delivery 46
Mothers who introduced semi-solid/solid food at 6-8 months 53
Children who suffered diarrhea/fever/cough in last 1 week 77
Mothers who took their children to a trained doctor when ill 85
Mothers who had decision making power abouttheir children's welfare 62
Mothers who had decision making power about majorhousehold purchases 9
Families who used soap for washing hands before a meal 6
Families who used soap for washing hands after visit to toilet 11
Atleast one member of family consuming tobacco/liquor 95
AURANGABADHouseholds (%) owning assets (green)
and using services (brown)
Nutritional status of children 0-59 months (%)� Severe (<-3SD) � Severe or Moderate (<-2SD)
70
60
50
40
30
20
10
0
70
60
50
40
30
20
10
0
DLHS-2 HUNGaMA HUNGaMA HUNGaMA Severe Moderate
Underweight Stunting Wasting
Supplementary Nutrition
Pre-school Education
Referrals
Antenatal Checkups
Immunization
Nutrition & Health Education
Growth Monitoring
No AWC Services
0 10 20 30 40 50 60 70 80 90 100
Access to Anganwadi Centre (%) Mothers’ Voice (%)
Average Household Size (in numbers) 9
Mothers with no schooling 51
Fathers with no schooling 21
Mothers who have never heard the word Malnutrition 93
Mothers who had institutional delivery 45
Mothers who gave breastmilk to child as first intake 41
Mothers who breastfed within 1 hour of delivery 27
Mothers who introduced semi-solid/solid food at 6-8 months 78
Children who suffered diarrhea/fever/cough in last 1 week 45
Mothers who took their children to a trained doctor when ill 51
Mothers who had decision making power abouttheir children's welfare 13
Mothers who had decision making power about majorhousehold purchases 6
Families who used soap for washing hands before a meal 4
Families who used soap for washing hands after visit to toilet 4
Atleast one member of family consuming tobacco/liquor 84
Access to Anganwadi Centre (%)
0 10 20 30 40 50 60 70 80 90 100
TelevisionRadio
Mobile phone4-wheeler
2-wheelerCycle
TractorPucca House
Toilet
Electricity
PDSMNREGA Card
Bank/ PO AccountHealth Insurance
SHG MembershipAny Loan
0 10 20 30 40 50 60 70 80 90 100
Households (%) owning assets (green) and using services (brown)
0 10 20 30 40 50 60 70 80 90 100
TelevisionRadio
Mobile phone4-wheeler
2-wheelerCycle
TractorPucca House
Toilet
Electricity
PDSMNREGA Card
Bank/ PO AccountHealth Insurance
SHG MembershipAny Loan
ARARIA
Mid Upper ArmCircumference
Nutritional status of children 0-59 months (%)� Severe (<-3SD) � Severe or Moderate (<-2SD)
70
60
50
40
30
20
10
0
70
60
50
40
30
20
10
0
DLHS-2 HUNGaMA HUNGaMA HUNGaMA Severe Moderate
Underweight Stunting Wasting
Mid Upper ArmCircumference
Snapshot of Services Available (%)
Villages with pucca road 75
Villages with pucca drain 0
Villages with electricity 58
Villages with primary school 97
Villages with PDS shop 95
Villages with Post Office 39
Villages with Primary Health Center/Sub-Centre (PHC/SC) 31
Villages with private trained doctor 32
Villages with ASHA Worker 86
Villages with Anganwadi Centre (AWC) 98
Villages with AWC with pucca building 11
Villages with AWW who has heard the word Malnutrition 100
Villages with AWW who make < 2 home visits per day 41
Snapshot of Services Available (%)Villages with pucca road 87
Villages with pucca drain 100
Villages with electricity 89
Villages with primary school 90
Villages with PDS shop 48
Villages with Post Office 37
Villages with Primary Health Center/Sub-Centre (PHC/SC) 25
Villages with private trained doctor 9
Villages with ASHA Worker 100
Villages with Anganwadi Centre (AWC) 89
Villages with AWC with pucca building 65
Villages with AWW who has heard the word Malnutrition 100
Villages with AWW who make < 2 home visits per day 37
Supplementary Nutrition
Pre-school Education
Referrals
Antenatal Checkups
Immunization
Nutrition & Health Education
Growth Monitoring
No AWC Services
77

78
Mothers’ Voice (%)
Average Household Size (in numbers) 7
Mothers with no schooling 72
Fathers with no schooling 46
Mothers who have never heard the word Malnutrition 96
Mothers who had institutional delivery 46
Mothers who gave breastmilk to child as first intake 49
Mothers who breastfed within 1 hour of delivery 50
Mothers who introduced semi-solid/solid food at 6-8 months 77
Children who suffered diarrhea/fever/cough in last 1 week 49
Mothers who took their children to a trained doctor when ill 72
Mothers who had decision making power abouttheir children's welfare 34
Mothers who had decision making power about majorhousehold purchases 2
Families who used soap for washing hands before a meal 4
Families who used soap for washing hands after visit to toilet 15
Atleast one member of family consuming tobacco/liquor 72
BEGUSARAIHouseholds (%) owning assets (green)
and using services (brown)
Nutritional status of children o-59 months(%)� Severe (<-3SD) � Severe or Moderate (<-2SD)
70
60
50
40
30
20
10
0
70
60
50
40
30
20
10
0
DLHS-2 HUNGaMA HUNGaMA HUNGaMA Severe Moderate
Underweight Stunting Wasting
0 10 20 30 40 50 60 70 80 90 100
Mothers’ Voice (%)
Average Household Size (in numbers) 7
Mothers with no schooling 67
Fathers with no schooling 34
Mothers who have never heard the word Malnutrition 94
Mothers who had institutional delivery 54
Mothers who gave breastmilk to child as first intake 30
Mothers who breastfed within 1 hour of delivery 26
Mothers who introduced semi-solid/solid food at 6-8 months 74
Children who suffered diarrhea/fever/cough in last 1 week 60
Mothers who took their children to a trained doctor when ill 67
Mothers who had decision making power abouttheir children's welfare 54
Mothers who had decision making power about majorhousehold purchases 7
Families who used soap for washing hands before a meal 4
Families who used soap for washing hands after visit to toilet 11
Atleast one member of family consuming tobacco/liquor 85
Access to Anganwadi Centre (%)
TelevisionRadio
Mobile phone4-wheeler
2-wheelerCycle
TractorPucca House
Toilet
Electricity
PDSMNREGA Card
Bank/ PO AccountHealth Insurance
SHG MembershipAny Loan
0 10 20 30 40 50 60 70 80 90 100
Households (%) owning assets (green) and using services (brown)
0 10 20 30 40 50 60 70 80 90 100
TelevisionRadio
Mobile phone4-wheeler
2-wheelerCycle
TractorPucca House
Toilet
Electricity
PDSMNREGA Card
Bank/ PO AccountHealth Insurance
SHG MembershipAny Loan
BANKA
Mid Upper ArmCircumference
Nutritional status of children 0-59 months(%)� Severe (<-3SD) � Severe or Moderate (<-2SD)
70
60
50
40
30
20
10
0
70
60
50
40
30
20
10
0
DLHS-2 HUNGaMA HUNGaMA HUNGaMA Severe Moderate
Underweight Stunting Wasting
Mid Upper ArmCircumference
Snapshot of Services Available (%)
Villages with pucca road 70
Villages with pucca drain 83
Villages with electricity 81
Villages with primary school 94
Villages with PDS shop 45
Villages with Post Office 11
Villages with Primary Health Center/Sub-Centre (PHC/SC) 19
Villages with private trained doctor 5
Villages with ASHA Worker 89
Villages with Anganwadi Centre (AWC) 93
Villages with AWC with pucca building 54
Villages with AWW who has heard the word Malnutrition 100
Villages with AWW who make < 2 home visits per day 77
Snapshot of Services Available (%)Villages with pucca road 94
Villages with pucca drain 60
Villages with electricity 94
Villages with primary school 100
Villages with PDS shop 73
Villages with Post Office 62
Villages with Primary Health Center/Sub-Centre (PHC/SC) 59
Villages with private trained doctor 38
Villages with ASHA Worker 100
Villages with Anganwadi Centre (AWC) 100
Villages with AWC with pucca building 57
Villages with AWW who has heard the word Malnutrition 90
Villages with AWW who make < 2 home visits per day 40
Supplementary Nutrition
Pre-school Education
Referrals
Antenatal Checkups
Immunization
Nutrition & Health Education
Growth Monitoring
No AWC Services
Supplementary Nutrition
Pre-school Education
Referrals
Antenatal Checkups
Immunization
Nutrition & Health Education
Growth Monitoring
No AWC Services
Access to Anganwadi Centre (%)
0 10 20 30 40 50 60 70 80 90 100
79

80
Mothers’ Voice (%)
Average Household Size (in numbers) 9
Mothers with no schooling 57
Fathers with no schooling 28
Mothers who have never heard the word Malnutrition 91
Mothers who had institutional delivery 51
Mothers who gave breastmilk to child as first intake 40
Mothers who breastfed within 1 hour of delivery 38
Mothers who introduced semi-solid/solid food at 6-8 months 82
Children who suffered diarrhea/fever/cough in last 1 week 37
Mothers who took their children to a trained doctor when ill 57
Mothers who had decision making power abouttheir children's welfare 71
Mothers who had decision making power about majorhousehold purchases 20
Families who used soap for washing hands before a meal 6
Families who used soap for washing hands after visit to toilet 32
Atleast one member of family consuming tobacco/liquor 82
DARBHANGAHouseholds (%) owning assets (green)
and using services (brown)
Nutritional status of children 0-59 months (%)� Severe (<-3SD) � Severe or Moderate (<-2SD)
70
60
50
40
30
20
10
0
70
60
50
40
30
20
10
0
DLHS-2 HUNGaMA HUNGaMA HUNGaMA Severe Moderate
Underweight Stunting Wasting
0 10 20 30 40 50 60 70 80 90 100
Mothers’ Voice (%)
Average Household Size (in numbers) 7
Mothers with no schooling 75
Fathers with no schooling 44
Mothers who have never heard the word Malnutrition 96
Mothers who had institutional delivery 27
Mothers who gave breastmilk to child as first intake 37
Mothers who breastfed within 1 hour of delivery 22
Mothers who introduced semi-solid/solid food at 6-8 months 56
Children who suffered diarrhea/fever/cough in last 1 week 60
Mothers who took their children to a trained doctor when ill 75
Mothers who had decision making power abouttheir children's welfare 36
Mothers who had decision making power about majorhousehold purchases 1
Families who used soap for washing hands before a meal 2
Families who used soap for washing hands after visit to toilet 4
Atleast one member of family consuming tobacco/liquor 81
Access to Anganwadi Centre (%)
TelevisionRadio
Mobile phone4-wheeler
2-wheelerCycle
TractorPucca House
Toilet
Electricity
PDSMNREGA Card
Bank/ PO AccountHealth Insurance
SHG MembershipAny Loan
0 10 20 30 40 50 60 70 80 90 100
Households (%) owning assets (green) and using services (brown)
0 10 20 30 40 50 60 70 80 90 100
TelevisionRadio
Mobile phone4-wheeler
2-wheelerCycle
TractorPucca House
Toilet
Electricity
PDSMNREGA Card
Bank/ PO AccountHealth Insurance
SHG MembershipAny Loan
BUXAR
Mid Upper ArmCircumference
Nutritional status of children 0-59 months (%)� Severe (<-3SD) � Severe or Moderate (<-2SD)
70
60
50
40
30
20
10
0
70
60
50
40
30
20
10
0
DLHS-2 HUNGaMA HUNGaMA HUNGaMA Severe Moderate
Underweight Stunting Wasting
Mid Upper ArmCircumference
Snapshot of Services Available (%)
Villages with pucca road 76
Villages with pucca drain 100
Villages with electricity 96
Villages with primary school 96
Villages with PDS shop 79
Villages with Post Office 71
Villages with Primary Health Center/Sub-Centre (PHC/SC) 69
Villages with private trained doctor 36
Villages with ASHA Worker 99
Villages with Anganwadi Centre (AWC) 99
Villages with AWC with pucca building 66
Villages with AWW who has heard the word Malnutrition 100
Villages with AWW who make < 2 home visits per day 86
Snapshot of Services Available (%)Villages with pucca road 75
Villages with pucca drain 39
Villages with electricity 83
Villages with primary school 92
Villages with PDS shop 79
Villages with Post Office 67
Villages with Primary Health Center/Sub-Centre (PHC/SC) 35
Villages with private trained doctor 27
Villages with ASHA Worker 93
Villages with Anganwadi Centre (AWC) 91
Villages with AWC with pucca building 29
Villages with AWW who has heard the word Malnutrition 92
Villages with AWW who make < 2 home visits per day 44
Supplementary Nutrition
Pre-school Education
Referrals
Antenatal Checkups
Immunization
Nutrition & Health Education
Growth Monitoring
No AWC Services
Supplementary Nutrition
Pre-school Education
Referrals
Antenatal Checkups
Immunization
Nutrition & Health Education
Growth Monitoring
No AWC Services
Access to Anganwadi Centre (%)
0 10 20 30 40 50 60 70 80 90 100
81

82
Mothers’ Voice (%)
Average Household Size (in numbers) 9
Mothers with no schooling 61
Fathers with no schooling 29
Mothers who have never heard the word Malnutrition 94
Mothers who had institutional delivery 27
Mothers who gave breastmilk to child as first intake 33
Mothers who breastfed within 1 hour of delivery 22
Mothers who introduced semi-solid/solid food at 6-8 months 74
Children who suffered diarrhea/fever/cough in last 1 week 36
Mothers who took their children to a trained doctor when ill 61
Mothers who had decision making power abouttheir children's welfare 98
Mothers who had decision making power about majorhousehold purchases 6
Families who used soap for washing hands before a meal 0
Families who used soap for washing hands after visit to toilet 0
Atleast one member of family consuming tobacco/liquor 81
JAMUIHouseholds (%) owning assets (green)
and using services (brown)
Nutritional status of children 0-59 months (%)� Severe (<-3SD) � Severe or Moderate (<-2SD)
70
60
50
40
30
20
10
0
70
60
50
40
30
20
10
0
DLHS-2 HUNGaMA HUNGaMA HUNGaMA Severe Moderate
Underweight Stunting Wasting
0 10 20 30 40 50 60 70 80 90 100
Mothers’ Voice (%)
Average Household Size (in numbers) 7
Mothers with no schooling 72
Fathers with no schooling 42
Mothers who have never heard the word Malnutrition 96
Mothers who had institutional delivery 40
Mothers who gave breastmilk to child as first intake 60
Mothers who breastfed within 1 hour of delivery 57
Mothers who introduced semi-solid/solid food at 6-8 months 87
Children who suffered diarrhea/fever/cough in last 1 week 24
Mothers who took their children to a trained doctor when ill 72
Mothers who had decision making power abouttheir children's welfare 27
Mothers who had decision making power about majorhousehold purchases 7
Families who used soap for washing hands before a meal 6
Families who used soap for washing hands after visit to toilet 9
Atleast one member of family consuming tobacco/liquor 78
Access to Anganwadi Centre (%)
TelevisionRadio
Mobile phone4-wheeler
2-wheelerCycle
TractorPucca House
Toilet
Electricity
PDSMNREGA Card
Bank/ PO AccountHealth Insurance
SHG MembershipAny Loan
0 10 20 30 40 50 60 70 80 90 100
Households (%) owning assets (green) and using services (brown)
0 10 20 30 40 50 60 70 80 90 100
TelevisionRadio
Mobile phone4-wheeler
2-wheelerCycle
TractorPucca House
Toilet
Electricity
PDSMNREGA Card
Bank/ PO AccountHealth Insurance
SHG MembershipAny Loan
GAYA
Mid Upper ArmCircumference
Nutritional status of children 0-59 months (%)� Severe (<-3SD) � Severe or Moderate (<-2SD)
70
60
50
40
30
20
10
0
70
60
50
40
30
20
10
0
DLHS-2 HUNGaMA HUNGaMA HUNGaMA Severe Moderate
Underweight Stunting Wasting
Mid Upper ArmCircumference
Snapshot of Services Available (%)
Villages with pucca road 70
Villages with pucca drain 84
Villages with electricity 85
Villages with primary school 92
Villages with PDS shop 64
Villages with Post Office 11
Villages with Primary Health Center/Sub-Centre (PHC/SC) 27
Villages with private trained doctor 58
Villages with ASHA Worker 78
Villages with Anganwadi Centre (AWC) 92
Villages with AWC with pucca building 48
Villages with AWW who has heard the word Malnutrition 94
Villages with AWW who make < 2 home visits per day 48
Snapshot of Services Available (%)Villages with pucca road 81
Villages with pucca drain 40
Villages with electricity 60
Villages with primary school 89
Villages with PDS shop 59
Villages with Post Office 21
Villages with Primary Health Center/Sub-Centre (PHC/SC) 25
Villages with private trained doctor 19
Villages with ASHA Worker 86
Villages with Anganwadi Centre (AWC) 88
Villages with AWC with pucca building 57
Villages with AWW who has heard the word Malnutrition 94
Villages with AWW who make < 2 home visits per day 38
Supplementary Nutrition
Pre-school Education
Referrals
Antenatal Checkups
Immunization
Nutrition & Health Education
Growth Monitoring
No AWC Services
Supplementary Nutrition
Pre-school Education
Referrals
Antenatal Checkups
Immunization
Nutrition & Health Education
Growth Monitoring
No AWC Services
Access to Anganwadi Centre (%)
0 10 20 30 40 50 60 70 80 90 100
83

84
Mothers’ Voice (%)
Average Household Size (in numbers) 8
Mothers with no schooling 58
Fathers with no schooling 24
Mothers who have never heard the word Malnutrition 91
Mothers who had institutional delivery 54
Mothers who gave breastmilk to child as first intake 30
Mothers who breastfed within 1 hour of delivery 27
Mothers who introduced semi-solid/solid food at 6-8 months 72
Children who suffered diarrhea/fever/cough in last 1 week 55
Mothers who took their children to a trained doctor when ill 58
Mothers who had decision making power abouttheir children's welfare 34
Mothers who had decision making power about majorhousehold purchases 7
Families who used soap for washing hands before a meal 1
Families who used soap for washing hands after visit to toilet 6
Atleast one member of family consuming tobacco/liquor 79
KAIMURHouseholds (%) owning assets (green)
and using services (brown)
Nutritional status of children 0-59 months (%)� Severe (<-3SD) � Severe or Moderate (<-2SD)
70
60
50
40
30
20
10
0
70
60
50
40
30
20
10
0
DLHS-2 HUNGaMA HUNGaMA HUNGaMA Severe Moderate
Underweight Stunting Wasting
0 10 20 30 40 50 60 70 80 90 100
Mothers’ Voice (%)
Average Household Size (in numbers) 9
Mothers with no schooling 54
Fathers with no schooling 26
Mothers who have never heard the word Malnutrition 90
Mothers who had institutional delivery 55
Mothers who gave breastmilk to child as first intake 73
Mothers who breastfed within 1 hour of delivery 74
Mothers who introduced semi-solid/solid food at 6-8 months 75
Children who suffered diarrhea/fever/cough in last 1 week 31
Mothers who took their children to a trained doctor when ill 54
Mothers who had decision making power abouttheir children's welfare 38
Mothers who had decision making power about majorhousehold purchases 4
Families who used soap for washing hands before a meal 9
Families who used soap for washing hands after visit to toilet 18
Atleast one member of family consuming tobacco/liquor 75
Access to Anganwadi Centre (%)
TelevisionRadio
Mobile phone4-wheeler
2-wheelerCycle
TractorPucca House
Toilet
Electricity
PDSMNREGA Card
Bank/ PO AccountHealth Insurance
SHG MembershipAny Loan
0 10 20 30 40 50 60 70 80 90 100
Households (%) owning assets (green) and using services (brown)
0 10 20 30 40 50 60 70 80 90 100
TelevisionRadio
Mobile phone4-wheeler
2-wheelerCycle
TractorPucca House
Toilet
Electricity
PDSMNREGA Card
Bank/ PO AccountHealth Insurance
SHG MembershipAny Loan
JEHANABAD
Mid Upper ArmCircumference
Nutritional status of children 0-59 months (%)� Severe (<-3SD) � Severe or Moderate (<-2SD)
70
60
50
40
30
20
10
0
70
60
50
40
30
20
10
0
DLHS-2 HUNGaMA HUNGaMA HUNGaMA Severe Moderate
Underweight Stunting Wasting
Mid Upper ArmCircumference
Snapshot of Services Available (%)
Villages with pucca road 77
Villages with pucca drain 94
Villages with electricity 68
Villages with primary school 100
Villages with PDS shop 74
Villages with Post Office 52
Villages with Primary Health Center/Sub-Centre (PHC/SC) 38
Villages with private trained doctor 63
Villages with ASHA Worker 97
Villages with Anganwadi Centre (AWC) 100
Villages with AWC with pucca building 69
Villages with AWW who has heard the word Malnutrition 92
Villages with AWW who make < 2 home visits per day 62
Snapshot of Services Available (%)Villages with pucca road 70
Villages with pucca drain 65
Villages with electricity 86
Villages with primary school 70
Villages with PDS shop 75
Villages with Post Office 25
Villages with Primary Health Center/Sub-Centre (PHC/SC) 25
Villages with private trained doctor 33
Villages with ASHA Worker 94
Villages with Anganwadi Centre (AWC) 89
Villages with AWC with pucca building 74
Villages with AWW who has heard the word Malnutrition 100
Villages with AWW who make < 2 home visits per day 46
Supplementary Nutrition
Pre-school Education
Referrals
Antenatal Checkups
Immunization
Nutrition & Health Education
Growth Monitoring
No AWC Services
Supplementary Nutrition
Pre-school Education
Referrals
Antenatal Checkups
Immunization
Nutrition & Health Education
Growth Monitoring
No AWC Services
Access to Anganwadi Centre (%)
0 10 20 30 40 50 60 70 80 90 100
85

86
Mothers’ Voice (%)
Average Household Size (in numbers) 6
Mothers with no schooling 77
Fathers with no schooling 63
Mothers who have never heard the word Malnutrition 93
Mothers who had institutional delivery 23
Mothers who gave breastmilk to child as first intake 44
Mothers who breastfed within 1 hour of delivery 44
Mothers who introduced semi-solid/solid food at 6-8 months 72
Children who suffered diarrhea/fever/cough in last 1 week 59
Mothers who took their children to a trained doctor when ill 77
Mothers who had decision making power abouttheir children's welfare 37
Mothers who had decision making power about majorhousehold purchases 2
Families who used soap for washing hands before a meal 1
Families who used soap for washing hands after visit to toilet 9
Atleast one member of family consuming tobacco/liquor 62
KHAGARIAHouseholds (%) owning assets (green)
and using services (brown)
Nutritional status of children 0-59 months (%)� Severe (<-3SD) � Severe or Moderate (<-2SD)
70
60
50
40
30
20
10
0
70
60
50
40
30
20
10
0
DLHS-2 HUNGaMA HUNGaMA HUNGaMA Severe Moderate
Underweight Stunting Wasting
0 10 20 30 40 50 60 70 80 90 100
Mothers’ Voice (%)
Average Household Size (in numbers) 6
Mothers with no schooling 76
Fathers with no schooling 56
Mothers who have never heard the word Malnutrition 96
Mothers who had institutional delivery 45
Mothers who gave breastmilk to child as first intake 74
Mothers who breastfed within 1 hour of delivery 43
Mothers who introduced semi-solid/solid food at 6-8 months 65
Children who suffered diarrhea/fever/cough in last 1 week 48
Mothers who took their children to a trained doctor when ill 76
Mothers who had decision making power abouttheir children's welfare 93
Mothers who had decision making power about majorhousehold purchases 6
Families who used soap for washing hands before a meal 3
Families who used soap for washing hands after visit to toilet 9
Atleast one member of family consuming tobacco/liquor 64
Access to Anganwadi Centre (%)
TelevisionRadio
Mobile phone4-wheeler
2-wheelerCycle
TractorPucca House
Toilet
Electricity
PDSMNREGA Card
Bank/ PO AccountHealth Insurance
SHG MembershipAny Loan
0 10 20 30 40 50 60 70 80 90 100
Households (%) owning assets (green) and using services (brown)
0 10 20 30 40 50 60 70 80 90 100
TelevisionRadio
Mobile phone4-wheeler
2-wheelerCycle
TractorPucca House
Toilet
Electricity
PDSMNREGA Card
Bank/ PO AccountHealth Insurance
SHG MembershipAny Loan
KATIHAR
Mid Upper ArmCircumference
Nutritional status of children 0-59 months (%)� Severe (<-3SD) � Severe or Moderate (<-2SD)
70
60
50
40
30
20
10
0
70
60
50
40
30
20
10
0
DLHS-2 HUNGaMA HUNGaMA HUNGaMA Severe Moderate
Underweight Stunting Wasting
Mid Upper ArmCircumference
Snapshot of Services Available (%)
Villages with pucca road 84
Villages with pucca drain 3
Villages with electricity 68
Villages with primary school 100
Villages with PDS shop 70
Villages with Post Office 30
Villages with Primary Health Center/Sub-Centre (PHC/SC) 39
Villages with private trained doctor 51
Villages with ASHA Worker 100
Villages with Anganwadi Centre (AWC) 100
Villages with AWC with pucca building 25
Villages with AWW who has heard the word Malnutrition 98
Villages with AWW who make < 2 home visits per day 70
Snapshot of Services Available (%)Villages with pucca road 75
Villages with pucca drain 40
Villages with electricity 61
Villages with primary school 86
Villages with PDS shop 86
Villages with Post Office 77
Villages with Primary Health Center/Sub-Centre (PHC/SC) 37
Villages with private trained doctor 55
Villages with ASHA Worker 100
Villages with Anganwadi Centre (AWC) 94
Villages with AWC with pucca building 31
Villages with AWW who has heard the word Malnutrition 100
Villages with AWW who make < 2 home visits per day 45
Supplementary Nutrition
Pre-school Education
Referrals
Antenatal Checkups
Immunization
Nutrition & Health Education
Growth Monitoring
No AWC Services
Supplementary Nutrition
Pre-school Education
Referrals
Antenatal Checkups
Immunization
Nutrition & Health Education
Growth Monitoring
No AWC Services
Access to Anganwadi Centre (%)
0 10 20 30 40 50 60 70 80 90 100
87

88
Mothers’ Voice (%)
Average Household Size (in numbers) 6
Mothers with no schooling 92
Fathers with no schooling 71
Mothers who have never heard the word Malnutrition 92
Mothers who had institutional delivery 15
Mothers who gave breastmilk to child as first intake 29
Mothers who breastfed within 1 hour of delivery 36
Mothers who introduced semi-solid/solid food at 6-8 months 48
Children who suffered diarrhea/fever/cough in last 1 week 19
Mothers who took their children to a trained doctor when ill 92
Mothers who had decision making power abouttheir children's welfare 44
Mothers who had decision making power about majorhousehold purchases 5
Families who used soap for washing hands before a meal 4
Families who used soap for washing hands after visit to toilet 33
Atleast one member of family consuming tobacco/liquor 75
MADHEPURAHouseholds (%) owning assets (green)
and using services (brown)
Nutritional status of children 0-59 months (%)� Severe (<-3SD) � Severe or Moderate (<-2SD)
70
60
50
40
30
20
10
0
70
60
50
40
30
20
10
0
DLHS-2 HUNGaMA HUNGaMA HUNGaMA Severe Moderate
Underweight Stunting Wasting
0 10 20 30 40 50 60 70 80 90 100
Mothers’ Voice (%)
Average Household Size (in numbers) 7
Mothers with no schooling 79
Fathers with no schooling 53
Mothers who have never heard the word Malnutrition 94
Mothers who had institutional delivery 41
Mothers who gave breastmilk to child as first intake 33
Mothers who breastfed within 1 hour of delivery 24
Mothers who introduced semi-solid/solid food at 6-8 months 62
Children who suffered diarrhea/fever/cough in last 1 week 50
Mothers who took their children to a trained doctor when ill 79
Mothers who had decision making power abouttheir children's welfare 67
Mothers who had decision making power about majorhousehold purchases 13
Families who used soap for washing hands before a meal 28
Families who used soap for washing hands after visit to toilet 6
Atleast one member of family consuming tobacco/liquor 77
Access to Anganwadi Centre (%)
TelevisionRadio
Mobile phone4-wheeler
2-wheelerCycle
TractorPucca House
Toilet
Electricity
PDSMNREGA Card
Bank/ PO AccountHealth Insurance
SHG MembershipAny Loan
0 10 20 30 40 50 60 70 80 90 100
Households (%) owning assets (green) and using services (brown)
0 10 20 30 40 50 60 70 80 90 100
TelevisionRadio
Mobile phone4-wheeler
2-wheelerCycle
TractorPucca House
Toilet
Electricity
PDSMNREGA Card
Bank/ PO AccountHealth Insurance
SHG MembershipAny Loan
KISHANGUNJ
Mid Upper ArmCircumference
Nutritional status of children 0-59 months (%)� Severe (<-3SD) � Severe or Moderate (<-2SD)
70
60
50
40
30
20
10
0
70
60
50
40
30
20
10
0
DLHS-2 HUNGaMA HUNGaMA HUNGaMA Severe Moderate
Underweight Stunting Wasting
Mid Upper ArmCircumference
Snapshot of Services Available (%)
Villages with pucca road 74
Villages with pucca drain 12
Villages with electricity 72
Villages with primary school 84
Villages with PDS shop 58
Villages with Post Office 35
Villages with Primary Health Center/Sub-Centre (PHC/SC) 34
Villages with private trained doctor 37
Villages with ASHA Worker 93
Villages with Anganwadi Centre (AWC) 100
Villages with AWC with pucca building 27
Villages with AWW who has heard the word Malnutrition 76
Villages with AWW who make < 2 home visits per day 47
Snapshot of Services Available (%)Villages with pucca road 74
Villages with pucca drain 5
Villages with electricity 58
Villages with primary school 97
Villages with PDS shop 88
Villages with Post Office 64
Villages with Primary Health Center/Sub-Centre (PHC/SC) 32
Villages with private trained doctor 5
Villages with ASHA Worker 93
Villages with Anganwadi Centre (AWC) 100
Villages with AWC with pucca building 23
Villages with AWW who has heard the word Malnutrition 89
Villages with AWW who make < 2 home visits per day 67
Supplementary Nutrition
Pre-school Education
Referrals
Antenatal Checkups
Immunization
Nutrition & Health Education
Growth Monitoring
No AWC Services
Supplementary Nutrition
Pre-school Education
Referrals
Antenatal Checkups
Immunization
Nutrition & Health Education
Growth Monitoring
No AWC Services
Access to Anganwadi Centre (%)
0 10 20 30 40 50 60 70 80 90 100
89

90
Mothers’ Voice (%)
Average Household Size (in numbers) 7
Mothers with no schooling 79
Fathers with no schooling 43
Mothers who have never heard the word Malnutrition 96
Mothers who had institutional delivery 28
Mothers who gave breastmilk to child as first intake 27
Mothers who breastfed within 1 hour of delivery 22
Mothers who introduced semi-solid/solid food at 6-8 months 75
Children who suffered diarrhea/fever/cough in last 1 week 49
Mothers who took their children to a trained doctor when ill 79
Mothers who had decision making power abouttheir children's welfare 90
Mothers who had decision making power about majorhousehold purchases 5
Families who used soap for washing hands before a meal 1
Families who used soap for washing hands after visit to toilet 3
Atleast one member of family consuming tobacco/liquor 79
MUNGERHouseholds (%) owning assets (green)
and using services (brown)
Nutritional status of children 0-59 months (%)� Severe (<-3SD) � Severe or Moderate (<-2SD)
70
60
50
40
30
20
10
0
70
60
50
40
30
20
10
0
DLHS-2 HUNGaMA HUNGaMA HUNGaMA Severe Moderate
Underweight Stunting Wasting
0 10 20 30 40 50 60 70 80 90 100
Mothers’ Voice (%)
Average Household Size (in numbers) 7
Mothers with no schooling 58
Fathers with no schooling 42
Mothers who have never heard the word Malnutrition 90
Mothers who had institutional delivery 62
Mothers who gave breastmilk to child as first intake 47
Mothers who breastfed within 1 hour of delivery 35
Mothers who introduced semi-solid/solid food at 6-8 months 70
Children who suffered diarrhea/fever/cough in last 1 week 52
Mothers who took their children to a trained doctor when ill 58
Mothers who had decision making power abouttheir children's welfare 46
Mothers who had decision making power about majorhousehold purchases 7
Families who used soap for washing hands before a meal 11
Families who used soap for washing hands after visit to toilet 26
Atleast one member of family consuming tobacco/liquor 49
Access to Anganwadi Centre (%)
TelevisionRadio
Mobile phone4-wheeler
2-wheelerCycle
TractorPucca House
Toilet
Electricity
PDSMNREGA Card
Bank/ PO AccountHealth Insurance
SHG MembershipAny Loan
0 10 20 30 40 50 60 70 80 90 100
Households (%) owning assets (green) and using services (brown)
0 10 20 30 40 50 60 70 80 90 100
TelevisionRadio
Mobile phone4-wheeler
2-wheelerCycle
TractorPucca House
Toilet
Electricity
PDSMNREGA Card
Bank/ PO AccountHealth Insurance
SHG MembershipAny Loan
MADHUBANI
Mid Upper ArmCircumference
Nutritional status of children 0-59 months (%)� Severe (<-3SD) � Severe or Moderate (<-2SD)
70
60
50
40
30
20
10
0
70
60
50
40
30
20
10
0
DLHS-2 HUNGaMA HUNGaMA HUNGaMA Severe Moderate
Underweight Stunting Wasting
Mid Upper ArmCircumference
Snapshot of Services Available (%)
Villages with pucca road 92
Villages with pucca drain 15
Villages with electricity 74
Villages with primary school 100
Villages with PDS shop 80
Villages with Post Office 62
Villages with Primary Health Center/Sub-Centre (PHC/SC) 41
Villages with private trained doctor 18
Villages with ASHA Worker 91
Villages with Anganwadi Centre (AWC) 100
Villages with AWC with pucca building 52
Villages with AWW who has heard the word Malnutrition 96
Villages with AWW who make < 2 home visits per day 55
Snapshot of Services Available (%)Villages with pucca road 96
Villages with pucca drain 53
Villages with electricity 94
Villages with primary school 98
Villages with PDS shop 63
Villages with Post Office 41
Villages with Primary Health Center/Sub-Centre (PHC/SC) 45
Villages with private trained doctor 70
Villages with ASHA Worker 94
Villages with Anganwadi Centre (AWC) 89
Villages with AWC with pucca building 56
Villages with AWW who has heard the word Malnutrition 100
Villages with AWW who make < 2 home visits per day 32
Supplementary Nutrition
Pre-school Education
Referrals
Antenatal Checkups
Immunization
Nutrition & Health Education
Growth Monitoring
No AWC Services
Supplementary Nutrition
Pre-school Education
Referrals
Antenatal Checkups
Immunization
Nutrition & Health Education
Growth Monitoring
No AWC Services
Access to Anganwadi Centre (%)
0 10 20 30 40 50 60 70 80 90 100
91

92
Mothers’ Voice (%)
Average Household Size (in numbers) 10
Mothers with no schooling 69
Fathers with no schooling 39
Mothers who have never heard the word Malnutrition 97
Mothers who had institutional delivery 38
Mothers who gave breastmilk to child as first intake 34
Mothers who breastfed within 1 hour of delivery 23
Mothers who introduced semi-solid/solid food at 6-8 months 66
Children who suffered diarrhea/fever/cough in last 1 week 30
Mothers who took their children to a trained doctor when ill 69
Mothers who had decision making power abouttheir children's welfare 36
Mothers who had decision making power about majorhousehold purchases 7
Families who used soap for washing hands before a meal 2
Families who used soap for washing hands after visit to toilet 15
Atleast one member of family consuming tobacco/liquor 88
PASCHIM CHAMPARANHouseholds (%) owning assets (green)
and using services (brown)
Nutritional status of children 0-59 months (%)� Severe (<-3SD) � Severe or Moderate (<-2SD)
70
60
50
40
30
20
10
0
70
60
50
40
30
20
10
0
DLHS-2 HUNGaMA HUNGaMA HUNGaMA Severe Moderate
Underweight Stunting Wasting
0 10 20 30 40 50 60 70 80 90 100
Mothers’ Voice (%)
Average Household Size (in numbers) 7
Mothers with no schooling 73
Fathers with no schooling 45
Mothers who have never heard the word Malnutrition 97
Mothers who had institutional delivery 36
Mothers who gave breastmilk to child as first intake 17
Mothers who breastfed within 1 hour of delivery 8
Mothers who introduced semi-solid/solid food at 6-8 months 62
Children who suffered diarrhea/fever/cough in last 1 week 42
Mothers who took their children to a trained doctor when ill 73
Mothers who had decision making power abouttheir children's welfare 48
Mothers who had decision making power about majorhousehold purchases 10
Families who used soap for washing hands before a meal 4
Families who used soap for washing hands after visit to toilet 17
Atleast one member of family consuming tobacco/liquor 88
Access to Anganwadi Centre (%)
TelevisionRadio
Mobile phone4-wheeler
2-wheelerCycle
TractorPucca House
Toilet
Electricity
PDSMNREGA Card
Bank/ PO AccountHealth Insurance
SHG MembershipAny Loan
0 10 20 30 40 50 60 70 80 90 100
Households (%) owning assets (green) and using services (brown)
0 10 20 30 40 50 60 70 80 90 100
TelevisionRadio
Mobile phone4-wheeler
2-wheelerCycle
TractorPucca House
Toilet
Electricity
PDSMNREGA Card
Bank/ PO AccountHealth Insurance
SHG MembershipAny Loan
NAWADA
Mid Upper ArmCircumference
Nutritional status of children 0-59 months (%)� Severe (<-3SD) � Severe or Moderate (<-2SD)
70
60
50
40
30
20
10
0
70
60
50
40
30
20
10
0
DLHS-2 HUNGaMA HUNGaMA HUNGaMA Severe Moderate
Underweight Stunting Wasting
Mid Upper ArmCircumference
Snapshot of Services Available (%)
Villages with pucca road 69
Villages with pucca drain 92
Villages with electricity 66
Villages with primary school 97
Villages with PDS shop 71
Villages with Post Office 49
Villages with Primary Health Center/Sub-Centre (PHC/SC) 17
Villages with private trained doctor 26
Villages with ASHA Worker 94
Villages with Anganwadi Centre (AWC) 93
Villages with AWC with pucca building 85
Villages with AWW who has heard the word Malnutrition 98
Villages with AWW who make < 2 home visits per day 54
Snapshot of Services Available (%)Villages with pucca road 60
Villages with pucca drain 44
Villages with electricity 70
Villages with primary school 95
Villages with PDS shop 70
Villages with Post Office 32
Villages with Primary Health Center/Sub-Centre (PHC/SC) 34
Villages with private trained doctor 11
Villages with ASHA Worker 94
Villages with Anganwadi Centre (AWC) 100
Villages with AWC with pucca building 32
Villages with AWW who has heard the word Malnutrition 100
Villages with AWW who make < 2 home visits per day 64
Supplementary Nutrition
Pre-school Education
Referrals
Antenatal Checkups
Immunization
Nutrition & Health Education
Growth Monitoring
No AWC Services
Supplementary Nutrition
Pre-school Education
Referrals
Antenatal Checkups
Immunization
Nutrition & Health Education
Growth Monitoring
No AWC Services
Access to Anganwadi Centre (%)
0 10 20 30 40 50 60 70 80 90 100
93

94
Mothers’ Voice (%)
Average Household Size (in numbers) 71
Mothers with no schooling 39
Fathers with no schooling 8
Mothers who have never heard the word Malnutrition 95
Mothers who had institutional delivery 26
Mothers who gave breastmilk to child as first intake 29
Mothers who breastfed within 1 hour of delivery 20
Mothers who introduced semi-solid/solid food at 6-8 months 75
Children who suffered diarrhea/fever/cough in last 1 week 70
Mothers who took their children to a trained doctor when ill 71
Mothers who had decision making power abouttheir children's welfare 65
Mothers who had decision making power about majorhousehold purchases 8
Families who used soap for washing hands before a meal 11
Families who used soap for washing hands after visit to toilet 14
Atleast one member of family consuming tobacco/liquor 73
SAHARSAHouseholds (%) owning assets (green)
and using services (brown)
Nutritional status of children 0-59 months (%)� Severe (<-3SD) � Severe or Moderate (<-2SD)
70
60
50
40
30
20
10
0
70
60
50
40
30
20
10
0
DLHS-2 HUNGaMA HUNGaMA HUNGaMA Severe Moderate
Underweight Stunting Wasting
0 10 20 30 40 50 60 70 80 90 100
Mothers’ Voice (%)
Average Household Size (in numbers) 7
Mothers with no schooling 76
Fathers with no schooling 43
Mothers who have never heard the word Malnutrition 98
Mothers who had institutional delivery 27
Mothers who gave breastmilk to child as first intake 38
Mothers who breastfed within 1 hour of delivery 39
Mothers who introduced semi-solid/solid food at 6-8 months 27
Children who suffered diarrhea/fever/cough in last 1 week 44
Mothers who took their children to a trained doctor when ill 76
Mothers who had decision making power abouttheir children's welfare 91
Mothers who had decision making power about majorhousehold purchases 6
Families who used soap for washing hands before a meal 1
Families who used soap for washing hands after visit to toilet 6
Atleast one member of family consuming tobacco/liquor 86
Access to Anganwadi Centre (%)
TelevisionRadio
Mobile phone4-wheeler
2-wheelerCycle
TractorPucca House
Toilet
Electricity
PDSMNREGA Card
Bank/ PO AccountHealth Insurance
SHG MembershipAny Loan
0 10 20 30 40 50 60 70 80 90 100
Households (%) owning assets (green) and using services (brown)
0 10 20 30 40 50 60 70 80 90 100
TelevisionRadio
Mobile phone4-wheeler
2-wheelerCycle
TractorPucca House
Toilet
Electricity
PDSMNREGA Card
Bank/ PO AccountHealth Insurance
SHG MembershipAny Loan
PURBA CHAMPARAN
Mid Upper ArmCircumference
Nutritional status of children 0-59 months (%)� Severe (<-3SD) � Severe or Moderate (<-2SD)
70
60
50
40
30
20
10
0
70
60
50
40
30
20
10
0
DLHS-2 HUNGaMA HUNGaMA HUNGaMA Severe Moderate
Underweight Stunting Wasting
Mid Upper ArmCircumference
Snapshot of Services Available (%)
Villages with pucca road 82
Villages with pucca drain 35
Villages with electricity 90
Villages with primary school 95
Villages with PDS shop 70
Villages with Post Office 34
Villages with Primary Health Center/Sub-Centre (PHC/SC) 27
Villages with private trained doctor 48
Villages with ASHA Worker 76
Villages with Anganwadi Centre (AWC) 98
Villages with AWC with pucca building 28
Villages with AWW who has heard the word Malnutrition 98
Villages with AWW who make < 2 home visits per day 70
Snapshot of Services Available (%)Villages with pucca road 61
Villages with pucca drain 27
Villages with electricity 55
Villages with primary school 90
Villages with PDS shop 90
Villages with Post Office 68
Villages with Primary Health Center/Sub-Centre (PHC/SC) 30
Villages with private trained doctor 17
Villages with ASHA Worker 66
Villages with Anganwadi Centre (AWC) 100
Villages with AWC with pucca building 32
Villages with AWW who has heard the word Malnutrition 96
Villages with AWW who make < 2 home visits per day 75
Supplementary Nutrition
Pre-school Education
Referrals
Antenatal Checkups
Immunization
Nutrition & Health Education
Growth Monitoring
No AWC Services
Supplementary Nutrition
Pre-school Education
Referrals
Antenatal Checkups
Immunization
Nutrition & Health Education
Growth Monitoring
No AWC Services
Access to Anganwadi Centre (%)
0 10 20 30 40 50 60 70 80 90 100
95
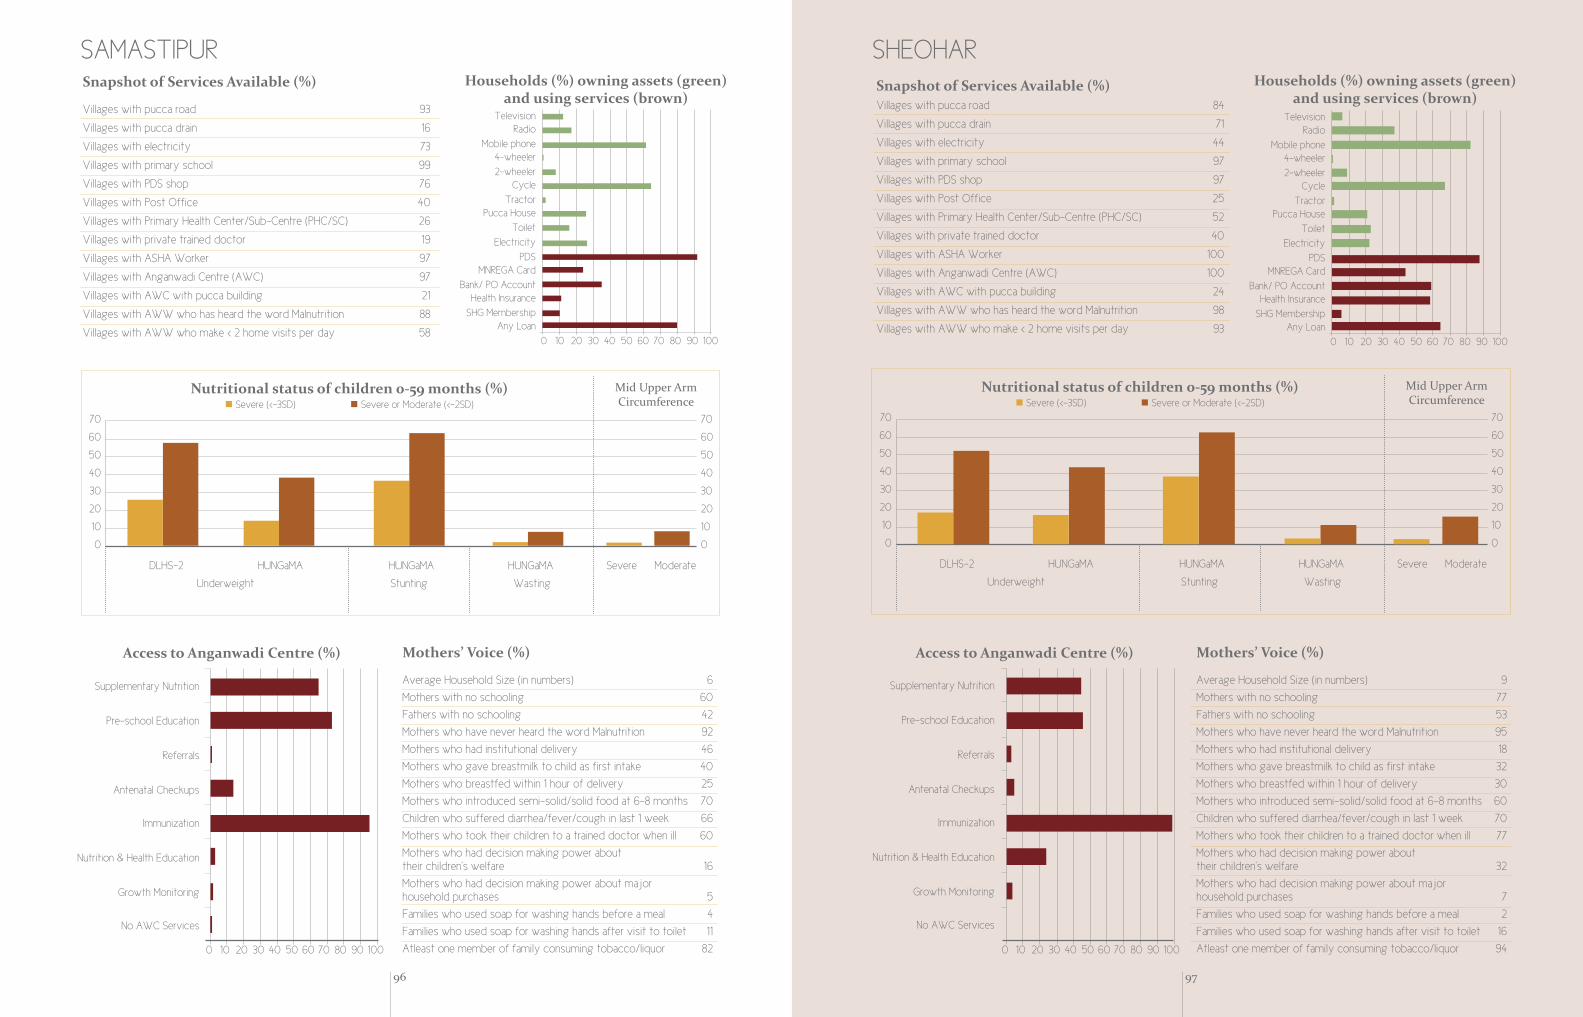
96
Mothers’ Voice (%)
Average Household Size (in numbers) 6
Mothers with no schooling 60
Fathers with no schooling 42
Mothers who have never heard the word Malnutrition 92
Mothers who had institutional delivery 46
Mothers who gave breastmilk to child as first intake 40
Mothers who breastfed within 1 hour of delivery 25
Mothers who introduced semi-solid/solid food at 6-8 months 70
Children who suffered diarrhea/fever/cough in last 1 week 66
Mothers who took their children to a trained doctor when ill 60
Mothers who had decision making power abouttheir children's welfare 16
Mothers who had decision making power about majorhousehold purchases 5
Families who used soap for washing hands before a meal 4
Families who used soap for washing hands after visit to toilet 11
Atleast one member of family consuming tobacco/liquor 82
SHEOHARHouseholds (%) owning assets (green)
and using services (brown)
Nutritional status of children 0-59 months (%)� Severe (<-3SD) � Severe or Moderate (<-2SD)
70
60
50
40
30
20
10
0
70
60
50
40
30
20
10
0
DLHS-2 HUNGaMA HUNGaMA HUNGaMA Severe Moderate
Underweight Stunting Wasting
0 10 20 30 40 50 60 70 80 90 100
Mothers’ Voice (%)
Average Household Size (in numbers) 9
Mothers with no schooling 77
Fathers with no schooling 53
Mothers who have never heard the word Malnutrition 95
Mothers who had institutional delivery 18
Mothers who gave breastmilk to child as first intake 32
Mothers who breastfed within 1 hour of delivery 30
Mothers who introduced semi-solid/solid food at 6-8 months 60
Children who suffered diarrhea/fever/cough in last 1 week 70
Mothers who took their children to a trained doctor when ill 77
Mothers who had decision making power abouttheir children's welfare 32
Mothers who had decision making power about majorhousehold purchases 7
Families who used soap for washing hands before a meal 2
Families who used soap for washing hands after visit to toilet 16
Atleast one member of family consuming tobacco/liquor 94
Access to Anganwadi Centre (%)
TelevisionRadio
Mobile phone4-wheeler
2-wheelerCycle
TractorPucca House
Toilet
Electricity
PDSMNREGA Card
Bank/ PO AccountHealth Insurance
SHG MembershipAny Loan
0 10 20 30 40 50 60 70 80 90 100
Households (%) owning assets (green) and using services (brown)
0 10 20 30 40 50 60 70 80 90 100
TelevisionRadio
Mobile phone4-wheeler
2-wheelerCycle
TractorPucca House
Toilet
Electricity
PDSMNREGA Card
Bank/ PO AccountHealth Insurance
SHG MembershipAny Loan
SAMASTIPUR
Mid Upper ArmCircumference
Nutritional status of children 0-59 months (%)� Severe (<-3SD) � Severe or Moderate (<-2SD)
70
60
50
40
30
20
10
0
70
60
50
40
30
20
10
0
DLHS-2 HUNGaMA HUNGaMA HUNGaMA Severe Moderate
Underweight Stunting Wasting
Mid Upper ArmCircumference
Snapshot of Services Available (%)
Villages with pucca road 93
Villages with pucca drain 16
Villages with electricity 73
Villages with primary school 99
Villages with PDS shop 76
Villages with Post Office 40
Villages with Primary Health Center/Sub-Centre (PHC/SC) 26
Villages with private trained doctor 19
Villages with ASHA Worker 97
Villages with Anganwadi Centre (AWC) 97
Villages with AWC with pucca building 21
Villages with AWW who has heard the word Malnutrition 88
Villages with AWW who make < 2 home visits per day 58
Snapshot of Services Available (%)Villages with pucca road 84
Villages with pucca drain 71
Villages with electricity 44
Villages with primary school 97
Villages with PDS shop 97
Villages with Post Office 25
Villages with Primary Health Center/Sub-Centre (PHC/SC) 52
Villages with private trained doctor 40
Villages with ASHA Worker 100
Villages with Anganwadi Centre (AWC) 100
Villages with AWC with pucca building 24
Villages with AWW who has heard the word Malnutrition 98
Villages with AWW who make < 2 home visits per day 93
Supplementary Nutrition
Pre-school Education
Referrals
Antenatal Checkups
Immunization
Nutrition & Health Education
Growth Monitoring
No AWC Services
Supplementary Nutrition
Pre-school Education
Referrals
Antenatal Checkups
Immunization
Nutrition & Health Education
Growth Monitoring
No AWC Services
Access to Anganwadi Centre (%)
0 10 20 30 40 50 60 70 80 90 100
97

98 99
Mothers’ Voice (%)
Average Household Size (in numbers) 7
Mothers with no schooling 77
Fathers with no schooling 48
Mothers who have never heard the word Malnutrition 91
Mothers who had institutional delivery 28
Mothers who gave breastmilk to child as first intake 22
Mothers who breastfed within 1 hour of delivery 22
Mothers who introduced semi-solid/solid food at 6-8 months 65
Children who suffered diarrhea/fever/cough in last 1 week 51
Mothers who took their children to a trained doctor when ill 77
Mothers who had decision making power abouttheir children's welfare 56
Mothers who had decision making power about majorhousehold purchases 5
Families who used soap for washing hands before a meal 6
Families who used soap for washing hands after visit to toilet 9
Atleast one member of family consuming tobacco/liquor 82
Households (%) owning assets (green) and using services (brown)
Nutritional status of children 0-59 months (%)� Severe (<-3SD) � Severe or Moderate (<-2SD)
70
60
50
40
30
20
10
0
70
60
50
40
30
20
10
0
DLHS-2 HUNGaMA HUNGaMA HUNGaMA Severe Moderate
Underweight Stunting Wasting
TelevisionRadio
Mobile phone4-wheeler
2-wheelerCycle
TractorPucca House
Toilet
Electricity
PDSMNREGA Card
Bank/ PO AccountHealth Insurance
SHG MembershipAny Loan
0 10 20 30 40 50 60 70 80 90 100
SUPAUL
Mid Upper ArmCircumference
Snapshot of Services Available (%)
Villages with pucca road 84
Villages with pucca drain 4
Villages with electricity 53
Villages with primary school 96
Villages with PDS shop 70
Villages with Post Office 56
Villages with Primary Health Center/Sub-Centre (PHC/SC) 35
Villages with private trained doctor 15
Villages with ASHA Worker 81
Villages with Anganwadi Centre (AWC) 95
Villages with AWC with pucca building 21
Villages with AWW who has heard the word Malnutrition 85
Villages with AWW who make < 2 home visits per day 36
Supplementary Nutrition
Pre-school Education
Referrals
Antenatal Checkups
Immunization
Nutrition & Health Education
Growth Monitoring
No AWC Services
Access to Anganwadi Centre (%)
0 10 20 30 40 50 60 70 80 90 100
Fighting Hunger & Malnutrition
Nearly 9 million children die every year before the age of five – that is nearly one child every three seconds.
(D You, TWardlow, P Salama and G Jones,‘Levels and trends in under-5 mortality, 1990–2008’, The Lancet, published online 10 September 2009.D01:10.1016/S0140-6736(09)61601-9)
Jharkhand
Fighting Hunger & Malnutrition
101

102
CHATRA
0 10 20 30 40 50 60 70 80 90 100
Mothers’ Voice (%)
Average Household Size (in numbers) 9
Mothers with no schooling 65
Fathers with no schooling 43
Mothers who have never heard the word Malnutrition 95
Mothers who had institutional delivery 27
Mothers who gave breastmilk to child as first intake 58
Mothers who breastfed within 1 hour of delivery 41
Mothers who introduced semi-solid/solid food at 6-8 months 78
Children who suffered diarrhea/fever/cough in last 1 week 59
Mothers who took their children to a trained doctor when ill 65
Mothers who had decision making power abouttheir children's welfare 60
Mothers who had decision making power about majorhousehold purchases 20
Families who used soap for washing hands before a meal 4
Families who used soap for washing hands after visit to toilet 1
Atleast one member of family consuming tobacco/liquor 73
Access to Anganwadi Centre (%)
Households (%) owning assets (green) and using services (brown)
0 10 20 30 40 50 60 70 80 90 100
TelevisionRadio
Mobile phone4-wheeler
2-wheelerCycle
TractorPucca House
Toilet
Electricity
PDSMNREGA Card
Bank/ PO AccountHealth Insurance
SHG MembershipAny Loan
Nutritional status of children 0-59 months (%)� Severe (<-3SD) � Severe or Moderate (<-2SD)
70
60
50
40
30
20
10
0
70
60
50
40
30
20
10
0
DLHS-2 HUNGaMA HUNGaMA HUNGaMA Severe Moderate
Underweight Stunting Wasting
Mid Upper ArmCircumference
Snapshot of Services Available (%)Villages with pucca road 86
Villages with pucca drain 63
Villages with electricity 74
Villages with primary school 97
Villages with PDS shop 69
Villages with Post Office 22
Villages with Primary Health Center/Sub-Centre (PHC/SC) 15
Villages with private trained doctor 28
Villages with ASHA Worker 87
Villages with Anganwadi Centre (AWC) 98
Villages with AWC with pucca building 62
Villages with AWW who has heard the word Malnutrition 100
Villages with AWW who make < 2 home visits per day 68
Supplementary Nutrition
Pre-school Education
Referrals
Antenatal Checkups
Immunization
Nutrition & Health Education
Growth Monitoring
No AWC Services
Mothers’ Voice (%)
Average Household Size (in numbers) 8
Mothers with no schooling 72
Fathers with no schooling 38
Mothers who have never heard the word Malnutrition 96
Mothers who had institutional delivery 23
Mothers who gave breastmilk to child as first intake 33
Mothers who breastfed within 1 hour of delivery 25
Mothers who introduced semi-solid/solid food at 6-8 months 79
Children who suffered diarrhea/fever/cough in last 1 week 25
Mothers who took their children to a trained doctor when ill 72
Mothers who had decision making power abouttheir children's welfare 24
Mothers who had decision making power about majorhousehold purchases 3
Families who used soap for washing hands before a meal 1
Families who used soap for washing hands after visit to toilet 3
Atleast one member of family consuming tobacco/liquor 88
Households (%) owning assets (green) and using services (brown)
Nutritional status of children 0-59 months (%)� Severe (<-3SD) � Severe or Moderate (<-2SD)
70
60
50
40
30
20
10
0
70
60
50
40
30
20
10
0
DLHS-2 HUNGaMA HUNGaMA HUNGaMA Severe Moderate
Underweight Stunting Wasting
TelevisionRadio
Mobile phone4-wheeler
2-wheelerCycle
TractorPucca House
Toilet
Electricity
PDSMNREGA Card
Bank/ PO AccountHealth Insurance
SHG MembershipAny Loan
0 10 20 30 40 50 60 70 80 90 100
DEOGHAR
Mid Upper ArmCircumference
Snapshot of Services Available (%)
Villages with pucca road 90
Villages with pucca drain 22
Villages with electricity 98
Villages with primary school 78
Villages with PDS shop 42
Villages with Post Office 8
Villages with Primary Health Center/Sub-Centre (PHC/SC) 7
Villages with private trained doctor 2
Villages with ASHA Worker 100
Villages with Anganwadi Centre (AWC) 91
Villages with AWC with pucca building 48
Villages with AWW who has heard the word Malnutrition 86
Villages with AWW who make < 2 home visits per day 92
Supplementary Nutrition
Pre-school Education
Referrals
Antenatal Checkups
Immunization
Nutrition & Health Education
Growth Monitoring
No AWC Services
Access to Anganwadi Centre (%)
0 10 20 30 40 50 60 70 80 90 100
103

104
DHANBAD
0 10 20 30 40 50 60 70 80 90 100
Mothers’ Voice (%)
Average Household Size (in numbers) 7
Mothers with no schooling 46
Fathers with no schooling 18
Mothers who have never heard the word Malnutrition 96
Mothers who had institutional delivery 41
Mothers who gave breastmilk to child as first intake 40
Mothers who breastfed within 1 hour of delivery 41
Mothers who introduced semi-solid/solid food at 6-8 months 86
Children who suffered diarrhea/fever/cough in last 1 week 40
Mothers who took their children to a trained doctor when ill 46
Mothers who had decision making power abouttheir children's welfare 31
Mothers who had decision making power about majorhousehold purchases 1
Families who used soap for washing hands before a meal 7
Families who used soap for washing hands after visit to toilet 7
Atleast one member of family consuming tobacco/liquor 86
Access to Anganwadi Centre (%)
Households (%) owning assets (green) and using services (brown)
0 10 20 30 40 50 60 70 80 90 100
TelevisionRadio
Mobile phone4-wheeler
2-wheelerCycle
TractorPucca House
Toilet
Electricity
PDSMNREGA Card
Bank/ PO AccountHealth Insurance
SHG MembershipAny Loan
Nutritional status of children 0-59 months (%)� Severe (<-3SD) � Severe or Moderate (<-2SD)
70
60
50
40
30
20
10
0
70
60
50
40
30
20
10
0
DLHS-2 HUNGaMA HUNGaMA HUNGaMA Severe Moderate
Underweight Stunting Wasting
Mid Upper ArmCircumference
Snapshot of Services Available (%)Villages with pucca road 90
Villages with pucca drain 43
Villages with electricity 100
Villages with primary school 95
Villages with PDS shop 48
Villages with Post Office 23
Villages with Primary Health Center/Sub-Centre (PHC/SC) 21
Villages with private trained doctor 20
Villages with ASHA Worker 85
Villages with Anganwadi Centre (AWC) 100
Villages with AWC with pucca building 70
Villages with AWW who has heard the word Malnutrition 100
Villages with AWW who make < 2 home visits per day 97
Supplementary Nutrition
Pre-school Education
Referrals
Antenatal Checkups
Immunization
Nutrition & Health Education
Growth Monitoring
No AWC Services
Mothers’ Voice (%)
Average Household Size (in numbers) 7
Mothers with no schooling 60
Fathers with no schooling 33
Mothers who have never heard the word Malnutrition 93
Mothers who had institutional delivery 16
Mothers who gave breastmilk to child as first intake 45
Mothers who breastfed within 1 hour of delivery 50
Mothers who introduced semi-solid/solid food at 6-8 months 79
Children who suffered diarrhea/fever/cough in last 1 week 17
Mothers who took their children to a trained doctor when ill 60
Mothers who had decision making power abouttheir children's welfare 43
Mothers who had decision making power about majorhousehold purchases 3
Families who used soap for washing hands before a meal 2
Families who used soap for washing hands after visit to toilet 3
Atleast one member of family consuming tobacco/liquor 81
Households (%) owning assets (green) and using services (brown)
Nutritional status of children 0-59 months (%)� Severe (<-3SD) � Severe or Moderate (<-2SD)
70
60
50
40
30
20
10
0
70
60
50
40
30
20
10
0
DLHS-2 HUNGaMA HUNGaMA HUNGaMA Severe Moderate
Underweight Stunting Wasting
TelevisionRadio
Mobile phone4-wheeler
2-wheelerCycle
TractorPucca House
Toilet
Electricity
PDSMNREGA Card
Bank/ PO AccountHealth Insurance
SHG MembershipAny Loan
0 10 20 30 40 50 60 70 80 90 100
DUMKA
Mid Upper ArmCircumference
Snapshot of Services Available (%)
Villages with pucca road 79
Villages with pucca drain 24
Villages with electricity 84
Villages with primary school 88
Villages with PDS shop 51
Villages with Post Office 20
Villages with Primary Health Center/Sub-Centre (PHC/SC) 12
Villages with private trained doctor 10
Villages with ASHA Worker 82
Villages with Anganwadi Centre (AWC) 97
Villages with AWC with pucca building 31
Villages with AWW who has heard the word Malnutrition 96
Villages with AWW who make < 2 home visits per day 84
Supplementary Nutrition
Pre-school Education
Referrals
Antenatal Checkups
Immunization
Nutrition & Health Education
Growth Monitoring
No AWC Services
Access to Anganwadi Centre (%)
0 10 20 30 40 50 60 70 80 90 100
105

106
GARHWA
0 10 20 30 40 50 60 70 80 90 100
Mothers’ Voice (%)
Average Household Size (in numbers) 8
Mothers with no schooling 73
Fathers with no schooling 41
Mothers who have never heard the word Malnutrition 93
Mothers who had institutional delivery 17
Mothers who gave breastmilk to child as first intake 68
Mothers who breastfed within 1 hour of delivery 28
Mothers who introduced semi-solid/solid food at 6-8 months 62
Children who suffered diarrhea/fever/cough in last 1 week 49
Mothers who took their children to a trained doctor when ill 73
Mothers who had decision making power abouttheir children's welfare 63
Mothers who had decision making power about majorhousehold purchases 3
Families who used soap for washing hands before a meal 12
Families who used soap for washing hands after visit to toilet 11
Atleast one member of family consuming tobacco/liquor 75
Access to Anganwadi Centre (%)
Households (%) owning assets (green) and using services (brown)
0 10 20 30 40 50 60 70 80 90 100
TelevisionRadio
Mobile phone4-wheeler
2-wheelerCycle
TractorPucca House
Toilet
Electricity
PDSMNREGA Card
Bank/ PO AccountHealth Insurance
SHG MembershipAny Loan
Nutritional status of children 0-59 months (%)� Severe (<-3SD) � Severe or Moderate (<-2SD)
70
60
50
40
30
20
10
0
70
60
50
40
30
20
10
0
DLHS-2 HUNGaMA HUNGaMA HUNGaMA Severe Moderate
Underweight Stunting Wasting
Mid Upper ArmCircumference
Snapshot of Services Available (%)Villages with pucca road 62
Villages with pucca drain 56
Villages with electricity 77
Villages with primary school 91
Villages with PDS shop 90
Villages with Post Office 23
Villages with Primary Health Center/Sub-Centre (PHC/SC) 45
Villages with private trained doctor 40
Villages with ASHA Worker 93
Villages with Anganwadi Centre (AWC) 98
Villages with AWC with pucca building 32
Villages with AWW who has heard the word Malnutrition 97
Villages with AWW who make < 2 home visits per day 58
Supplementary Nutrition
Pre-school Education
Referrals
Antenatal Checkups
Immunization
Nutrition & Health Education
Growth Monitoring
No AWC Services
Mothers’ Voice (%)
Average Household Size (in numbers) 9
Mothers with no schooling 62
Fathers with no schooling 30
Mothers who have never heard the word Malnutrition 92
Mothers who had institutional delivery 20
Mothers who gave breastmilk to child as first intake 45
Mothers who breastfed within 1 hour of delivery 32
Mothers who introduced semi-solid/solid food at 6-8 months 70
Children who suffered diarrhea/fever/cough in last 1 week 8
Mothers who took their children to a trained doctor when ill 62
Mothers who had decision making power abouttheir children's welfare 11
Mothers who had decision making power about majorhousehold purchases 2
Families who used soap for washing hands before a meal 2
Families who used soap for washing hands after visit to toilet 6
Atleast one member of family consuming tobacco/liquor 83
Households (%) owning assets (green) and using services (brown)
Nutritional status of children 0-59 months (%)� Severe (<-3SD) � Severe or Moderate (<-2SD)
70
60
50
40
30
20
10
0
70
60
50
40
30
20
10
0
DLHS-2 HUNGaMA HUNGaMA HUNGaMA Severe Moderate
Underweight Stunting Wasting
TelevisionRadio
Mobile phone4-wheeler
2-wheelerCycle
TractorPucca House
Toilet
Electricity
PDSMNREGA Card
Bank/ PO AccountHealth Insurance
SHG MembershipAny Loan
0 10 20 30 40 50 60 70 80 90 100
GIRIDIH
Mid Upper ArmCircumference
Snapshot of Services Available (%)
Villages with pucca road 90
Villages with pucca drain 21
Villages with electricity 63
Villages with primary school 78
Villages with PDS shop 66
Villages with Post Office 24
Villages with Primary Health Center/Sub-Centre (PHC/SC) 16
Villages with private trained doctor 13
Villages with ASHA Worker 75
Villages with Anganwadi Centre (AWC) 95
Villages with AWC with pucca building 58
Villages with AWW who has heard the word Malnutrition 96
Villages with AWW who make < 2 home visits per day 92
Supplementary Nutrition
Pre-school Education
Referrals
Antenatal Checkups
Immunization
Nutrition & Health Education
Growth Monitoring
No AWC Services
Access to Anganwadi Centre (%)
0 10 20 30 40 50 60 70 80 90 100
107

108
GODDA
0 10 20 30 40 50 60 70 80 90 100
Mothers’ Voice (%)
Average Household Size (in numbers) 7
Mothers with no schooling 67
Fathers with no schooling 43
Mothers who have never heard the word Malnutrition 91
Mothers who had institutional delivery 22
Mothers who gave breastmilk to child as first intake 52
Mothers who breastfed within 1 hour of delivery 51
Mothers who introduced semi-solid/solid food at 6-8 months 71
Children who suffered diarrhea/fever/cough in last 1 week 23
Mothers who took their children to a trained doctor when ill 67
Mothers who had decision making power abouttheir children's welfare 12
Mothers who had decision making power about majorhousehold purchases 1
Families who used soap for washing hands before a meal 11
Families who used soap for washing hands after visit to toilet 10
Atleast one member of family consuming tobacco/liquor 56
Access to Anganwadi Centre (%)
Households (%) owning assets (green) and using services (brown)
0 10 20 30 40 50 60 70 80 90 100
TelevisionRadio
Mobile phone4-wheeler
2-wheelerCycle
TractorPucca House
Toilet
Electricity
PDSMNREGA Card
Bank/ PO AccountHealth Insurance
SHG MembershipAny Loan
Nutritional status of children 0-59 months (%)� Severe (<-3SD) � Severe or Moderate (<-2SD)
70
60
50
40
30
20
10
0
70
60
50
40
30
20
10
0
DLHS-2 HUNGaMA HUNGaMA HUNGaMA Severe Moderate
Underweight Stunting Wasting
Mid Upper ArmCircumference
Snapshot of Services Available (%)Villages with pucca road 91
Villages with pucca drain 23
Villages with electricity 54
Villages with primary school 94
Villages with PDS shop 86
Villages with Post Office 14
Villages with Primary Health Center/Sub-Centre (PHC/SC) 21
Villages with private trained doctor 29
Villages with ASHA Worker 69
Villages with Anganwadi Centre (AWC) 100
Villages with AWC with pucca building 63
Villages with AWW who has heard the word Malnutrition 97
Villages with AWW who make < 2 home visits per day 93
Supplementary Nutrition
Pre-school Education
Referrals
Antenatal Checkups
Immunization
Nutrition & Health Education
Growth Monitoring
No AWC Services
Mothers’ Voice (%)
Average Household Size (in numbers) 6
Mothers with no schooling 43
Fathers with no schooling 23
Mothers who have never heard the word Malnutrition 87
Mothers who had institutional delivery 19
Mothers who gave breastmilk to child as first intake 87
Mothers who breastfed within 1 hour of delivery 86
Mothers who introduced semi-solid/solid food at 6-8 months 85
Children who suffered diarrhea/fever/cough in last 1 week 19
Mothers who took their children to a trained doctor when ill 43
Mothers who had decision making power abouttheir children's welfare 97
Mothers who had decision making power about majorhousehold purchases 3
Families who used soap for washing hands before a meal 5
Families who used soap for washing hands after visit to toilet 13
Atleast one member of family consuming tobacco/liquor 90
Households (%) owning assets (green) and using services (brown)
Nutritional status of children below 5 years (%)� Severe (<-3SD) � Severe or Moderate (<-2SD)
70
60
50
40
30
20
10
0
70
60
50
40
30
20
10
0
DLHS-2 HUNGaMA HUNGaMA HUNGaMA Severe Moderate
Underweight Stunting Wasting
TelevisionRadio
Mobile phone4-wheeler
2-wheelerCycle
TractorPucca House
Toilet
Electricity
PDSMNREGA Card
Bank/ PO AccountHealth Insurance
SHG MembershipAny Loan
0 10 20 30 40 50 60 70 80 90 100
GUMLA
Mid Upper ArmCircumference
Snapshot of Services Available (%)
Villages with pucca road 56
Villages with pucca drain 19
Villages with electricity 50
Villages with primary school 83
Villages with PDS shop 66
Villages with Post Office 26
Villages with Primary Health Center/Sub-Centre (PHC/SC) 38
Villages with private trained doctor 14
Villages with ASHA Worker 92
Villages with Anganwadi Centre (AWC) 100
Villages with AWC with pucca building 46
Villages with AWW who has heard the word Malnutrition 100
Villages with AWW who make < 2 home visits per day 96
Supplementary Nutrition
Pre-school Education
Referrals
Antenatal Checkups
Immunization
Nutrition & Health Education
Growth Monitoring
No AWC Services
Access to Anganwadi Centre (%)
0 10 20 30 40 50 60 70 80 90 100
109

110
KODARMA
0 10 20 30 40 50 60 70 80 90 100
Mothers’ Voice (%)
Average Household Size (in numbers) 10
Mothers with no schooling 56
Fathers with no schooling 23
Mothers who have never heard the word Malnutrition 98
Mothers who had institutional delivery 44
Mothers who gave breastmilk to child as first intake 57
Mothers who breastfed within 1 hour of delivery 27
Mothers who introduced semi-solid/solid food at 6-8 months 56
Children who suffered diarrhea/fever/cough in last 1 week 31
Mothers who took their children to a trained doctor when ill 56
Mothers who had decision making power abouttheir children's welfare 6
Mothers who had decision making power about majorhousehold purchases 2
Families who used soap for washing hands before a meal 3
Families who used soap for washing hands after visit to toilet 16
Atleast one member of family consuming tobacco/liquor 82
Access to Anganwadi Centre (%)
Households (%) owning assets (green) and using services (brown)
0 10 20 30 40 50 60 70 80 90 100
TelevisionRadio
Mobile phone4-wheeler
2-wheelerCycle
TractorPucca House
Toilet
Electricity
PDSMNREGA Card
Bank/ PO AccountHealth Insurance
SHG MembershipAny Loan
Nutritional status of children below 5 years (%)� Severe (<-3SD) � Severe or Moderate (<-2SD)
70
60
50
40
30
20
10
0
70
60
50
40
30
20
10
0
DLHS-2 HUNGaMA HUNGaMA HUNGaMA Severe Moderate
Underweight Stunting Wasting
Mid Upper ArmCircumference
Snapshot of Services Available (%)Villages with pucca road 85
Villages with pucca drain 48
Villages with electricity 85
Villages with primary school 93
Villages with PDS shop 58
Villages with Post Office 20
Villages with Primary Health Center/Sub-Centre (PHC/SC) 35
Villages with private trained doctor 44
Villages with ASHA Worker 96
Villages with Anganwadi Centre (AWC) 100
Villages with AWC with pucca building 86
Villages with AWW who has heard the word Malnutrition 100
Villages with AWW who make < 2 home visits per day 62
Supplementary Nutrition
Pre-school Education
Referrals
Antenatal Checkups
Immunization
Nutrition & Health Education
Growth Monitoring
No AWC Services
Mothers’ Voice (%)
Average Household Size (in numbers) 7
Mothers with no schooling 55
Fathers with no schooling 29
Mothers who have never heard the word Malnutrition 94
Mothers who had institutional delivery 26
Mothers who gave breastmilk to child as first intake 90
Mothers who breastfed within 1 hour of delivery 64
Mothers who introduced semi-solid/solid food at 6-8 months 84
Children who suffered diarrhea/fever/cough in last 1 week 16
Mothers who took their children to a trained doctor when ill 55
Mothers who had decision making power abouttheir children's welfare 9
Mothers who had decision making power about majorhousehold purchases 2
Families who used soap for washing hands before a meal 1
Families who used soap for washing hands after visit to toilet 5
Atleast one member of family consuming tobacco/liquor 91
Households (%) owning assets (green) and using services (brown)
Nutritional status of children 0-59 months (%)� Severe (<-3SD) � Severe or Moderate (<-2SD)
70
60
50
40
30
20
10
0
70
60
50
40
30
20
10
0
DLHS-2 HUNGaMA HUNGaMA HUNGaMA Severe Moderate
Underweight Stunting Wasting
TelevisionRadio
Mobile phone4-wheeler
2-wheelerCycle
TractorPucca House
Toilet
Electricity
PDSMNREGA Card
Bank/ PO AccountHealth Insurance
SHG MembershipAny Loan
0 10 20 30 40 50 60 70 80 90 100
LOHARDAGA
Mid Upper ArmCircumference
Snapshot of Services Available (%)
Villages with pucca road 68
Villages with pucca drain 56
Villages with electricity 60
Villages with primary school 85
Villages with PDS shop 96
Villages with Post Office 35
Villages with Primary Health Center/Sub-Centre (PHC/SC) 27
Villages with private trained doctor 31
Villages with ASHA Worker 100
Villages with Anganwadi Centre (AWC) 100
Villages with AWC with pucca building 90
Villages with AWW who has heard the word Malnutrition 98
Villages with AWW who make < 2 home visits per day 83
Supplementary Nutrition
Pre-school Education
Referrals
Antenatal Checkups
Immunization
Nutrition & Health Education
Growth Monitoring
No AWC Services
Access to Anganwadi Centre (%)
0 10 20 30 40 50 60 70 80 90 100
111

112
PAKAUR
0 10 20 30 40 50 60 70 80 90 100
Mothers’ Voice (%)
Average Household Size (in numbers) 6
Mothers with no schooling 68
Fathers with no schooling 52
Mothers who have never heard the word Malnutrition 97
Mothers who had institutional delivery 29
Mothers who gave breastmilk to child as first intake 81
Mothers who breastfed within 1 hour of delivery 72
Mothers who introduced semi-solid/solid food at 6-8 months 83
Children who suffered diarrhea/fever/cough in last 1 week 11
Mothers who took their children to a trained doctor when ill 68
Mothers who had decision making power abouttheir children's welfare 87
Mothers who had decision making power about majorhousehold purchases 1
Families who used soap for washing hands before a meal 4
Families who used soap for washing hands after visit to toilet 5
Atleast one member of family consuming tobacco/liquor 69
Access to Anganwadi Centre (%)
Households (%) owning assets (green) and using services (brown)
0 10 20 30 40 50 60 70 80 90 100
TelevisionRadio
Mobile phone4-wheeler
2-wheelerCycle
TractorPucca House
Toilet
Electricity
PDSMNREGA Card
Bank/ PO AccountHealth Insurance
SHG MembershipAny Loan
Nutritional status of children 0-59 months (%)� Severe (<-3SD) � Severe or Moderate (<-2SD)
70
60
50
40
30
20
10
0
70
60
50
40
30
20
10
0
DLHS-2 HUNGaMA HUNGaMA HUNGaMA Severe Moderate
Underweight Stunting Wasting
Mid Upper ArmCircumference
Snapshot of Services Available (%)Villages with pucca road 77
Villages with pucca drain 29
Villages with electricity 63
Villages with primary school 74
Villages with PDS shop 65
Villages with Post Office 27
Villages with Primary Health Center/Sub-Centre (PHC/SC) 29
Villages with private trained doctor 42
Villages with ASHA Worker 92
Villages with Anganwadi Centre (AWC) 98
Villages with AWC with pucca building 59
Villages with AWW who has heard the word Malnutrition 89
Villages with AWW who make < 2 home visits per day 55
Supplementary Nutrition
Pre-school Education
Referrals
Antenatal Checkups
Immunization
Nutrition & Health Education
Growth Monitoring
No AWC Services
Mothers’ Voice (%)
Average Household Size (in numbers) 8
Mothers with no schooling 64
Fathers with no schooling 32
Mothers who have never heard the word Malnutrition 93
Mothers who had institutional delivery 28
Mothers who gave breastmilk to child as first intake 68
Mothers who breastfed within 1 hour of delivery 40
Mothers who introduced semi-solid/solid food at 6-8 months 73
Children who suffered diarrhea/fever/cough in last 1 week 43
Mothers who took their children to a trained doctor when ill 64
Mothers who had decision making power abouttheir children's welfare 29
Mothers who had decision making power about majorhousehold purchases 13
Families who used soap for washing hands before a meal 2
Families who used soap for washing hands after visit to toilet 2
Atleast one member of family consuming tobacco/liquor 82
Households (%) owning assets (green) and using services (brown)
Nutritional status of children 0-59 months (%)� Severe (<-3SD) � Severe or Moderate (<-2SD)
70
60
50
40
30
20
10
0
70
60
50
40
30
20
10
0
DLHS-2 HUNGaMA HUNGaMA HUNGaMA Severe Moderate
Underweight Stunting Wasting
TelevisionRadio
Mobile phone4-wheeler
2-wheelerCycle
TractorPucca House
Toilet
Electricity
PDSMNREGA Card
Bank/ PO AccountHealth Insurance
SHG MembershipAny Loan
0 10 20 30 40 50 60 70 80 90 100
PALAMU
Mid Upper ArmCircumference
Snapshot of Services Available (%)
Villages with pucca road 84
Villages with pucca drain 68
Villages with electricity 85
Villages with primary school 90
Villages with PDS shop 70
Villages with Post Office 25
Villages with Primary Health Center/Sub-Centre (PHC/SC) 28
Villages with private trained doctor 8
Villages with ASHA Worker 97
Villages with Anganwadi Centre (AWC) 97
Villages with AWC with pucca building 61
Villages with AWW who has heard the word Malnutrition 95
Villages with AWW who make < 2 home visits per day 87
Supplementary Nutrition
Pre-school Education
Referrals
Antenatal Checkups
Immunization
Nutrition & Health Education
Growth Monitoring
No AWC Services
Access to Anganwadi Centre (%)
0 10 20 30 40 50 60 70 80 90 100
113
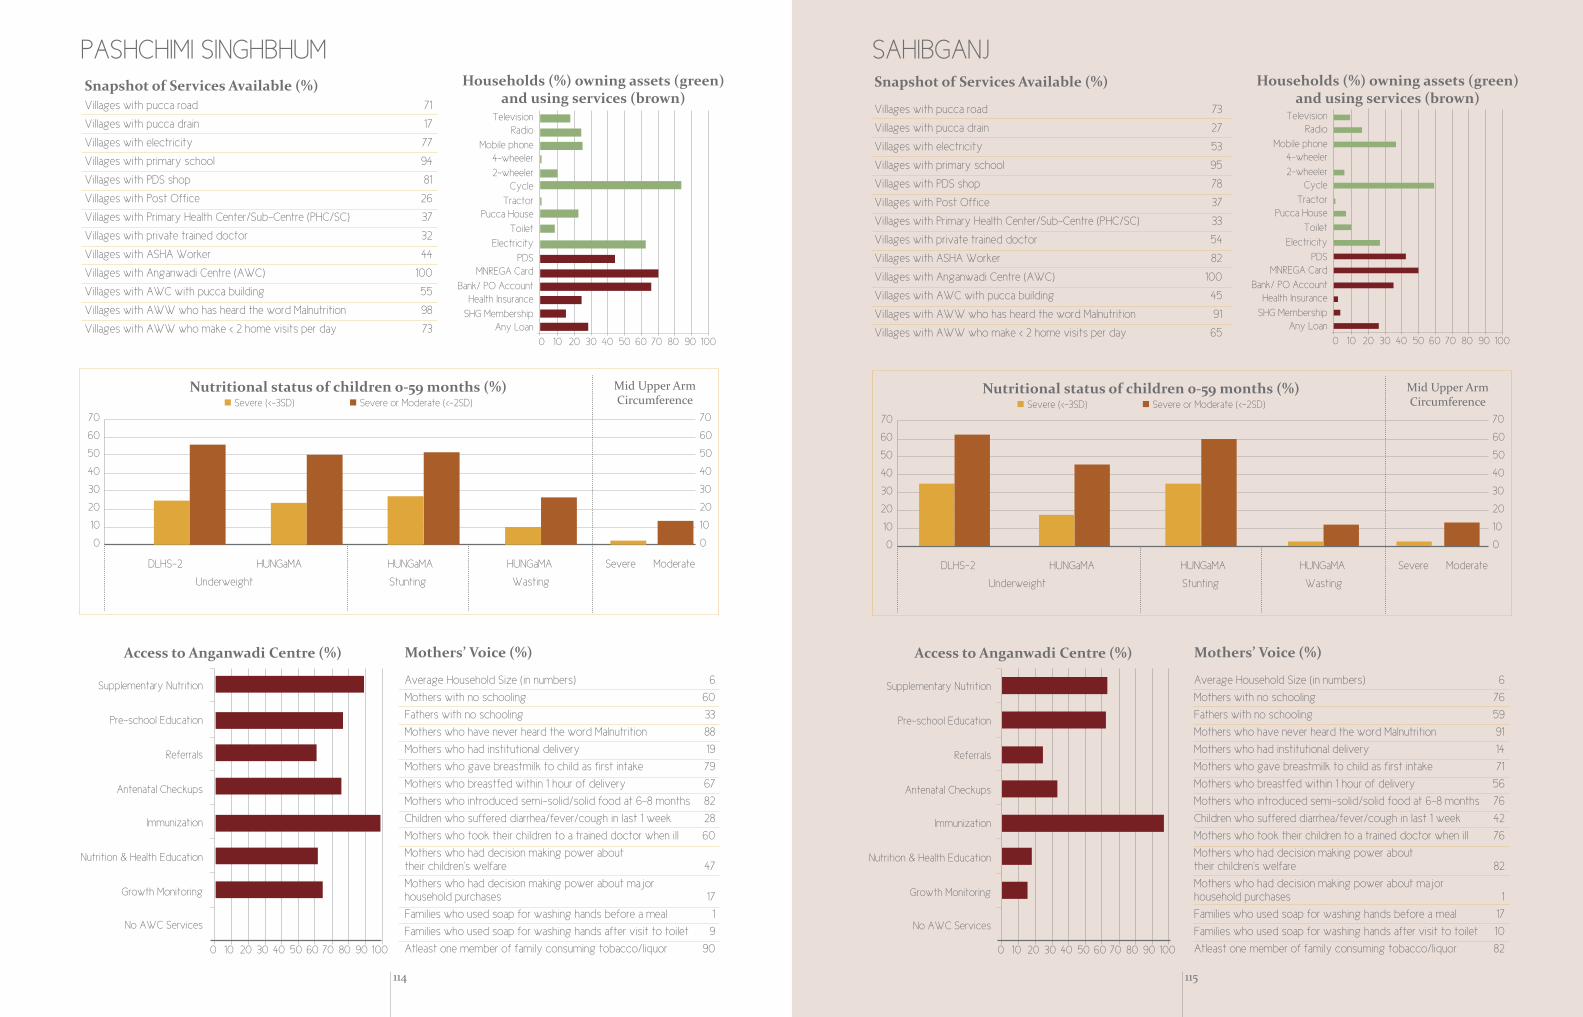
114
PASHCHIMI SINGHBHUM
0 10 20 30 40 50 60 70 80 90 100
Mothers’ Voice (%)
Average Household Size (in numbers) 6
Mothers with no schooling 60
Fathers with no schooling 33
Mothers who have never heard the word Malnutrition 88
Mothers who had institutional delivery 19
Mothers who gave breastmilk to child as first intake 79
Mothers who breastfed within 1 hour of delivery 67
Mothers who introduced semi-solid/solid food at 6-8 months 82
Children who suffered diarrhea/fever/cough in last 1 week 28
Mothers who took their children to a trained doctor when ill 60
Mothers who had decision making power abouttheir children's welfare 47
Mothers who had decision making power about majorhousehold purchases 17
Families who used soap for washing hands before a meal 1
Families who used soap for washing hands after visit to toilet 9
Atleast one member of family consuming tobacco/liquor 90
Access to Anganwadi Centre (%)
Households (%) owning assets (green) and using services (brown)
0 10 20 30 40 50 60 70 80 90 100
TelevisionRadio
Mobile phone4-wheeler
2-wheelerCycle
TractorPucca House
Toilet
Electricity
PDSMNREGA Card
Bank/ PO AccountHealth Insurance
SHG MembershipAny Loan
Nutritional status of children 0-59 months (%)� Severe (<-3SD) � Severe or Moderate (<-2SD)
70
60
50
40
30
20
10
0
70
60
50
40
30
20
10
0
DLHS-2 HUNGaMA HUNGaMA HUNGaMA Severe Moderate
Underweight Stunting Wasting
Mid Upper ArmCircumference
Snapshot of Services Available (%)Villages with pucca road 71
Villages with pucca drain 17
Villages with electricity 77
Villages with primary school 94
Villages with PDS shop 81
Villages with Post Office 26
Villages with Primary Health Center/Sub-Centre (PHC/SC) 37
Villages with private trained doctor 32
Villages with ASHA Worker 44
Villages with Anganwadi Centre (AWC) 100
Villages with AWC with pucca building 55
Villages with AWW who has heard the word Malnutrition 98
Villages with AWW who make < 2 home visits per day 73
Supplementary Nutrition
Pre-school Education
Referrals
Antenatal Checkups
Immunization
Nutrition & Health Education
Growth Monitoring
No AWC Services
Mothers’ Voice (%)
Average Household Size (in numbers) 6
Mothers with no schooling 76
Fathers with no schooling 59
Mothers who have never heard the word Malnutrition 91
Mothers who had institutional delivery 14
Mothers who gave breastmilk to child as first intake 71
Mothers who breastfed within 1 hour of delivery 56
Mothers who introduced semi-solid/solid food at 6-8 months 76
Children who suffered diarrhea/fever/cough in last 1 week 42
Mothers who took their children to a trained doctor when ill 76
Mothers who had decision making power abouttheir children's welfare 82
Mothers who had decision making power about majorhousehold purchases 1
Families who used soap for washing hands before a meal 17
Families who used soap for washing hands after visit to toilet 10
Atleast one member of family consuming tobacco/liquor 82
Households (%) owning assets (green) and using services (brown)
Nutritional status of children 0-59 months (%)� Severe (<-3SD) � Severe or Moderate (<-2SD)
70
60
50
40
30
20
10
0
70
60
50
40
30
20
10
0
DLHS-2 HUNGaMA HUNGaMA HUNGaMA Severe Moderate
Underweight Stunting Wasting
TelevisionRadio
Mobile phone4-wheeler
2-wheelerCycle
TractorPucca House
Toilet
Electricity
PDSMNREGA Card
Bank/ PO AccountHealth Insurance
SHG MembershipAny Loan
0 10 20 30 40 50 60 70 80 90 100
SAHIBGANJ
Mid Upper ArmCircumference
Snapshot of Services Available (%)
Villages with pucca road 73
Villages with pucca drain 27
Villages with electricity 53
Villages with primary school 95
Villages with PDS shop 78
Villages with Post Office 37
Villages with Primary Health Center/Sub-Centre (PHC/SC) 33
Villages with private trained doctor 54
Villages with ASHA Worker 82
Villages with Anganwadi Centre (AWC) 100
Villages with AWC with pucca building 45
Villages with AWW who has heard the word Malnutrition 91
Villages with AWW who make < 2 home visits per day 65
Supplementary Nutrition
Pre-school Education
Referrals
Antenatal Checkups
Immunization
Nutrition & Health Education
Growth Monitoring
No AWC Services
Access to Anganwadi Centre (%)
0 10 20 30 40 50 60 70 80 90 100
115

Madhya Pradesh
Fighting Hunger & Malnutrition
117

118
BARWANI
0 10 20 30 40 50 60 70 80 90 100
Mothers’ Voice (%)
Average Household Size (in numbers) 9
Mothers with no schooling 80
Fathers with no schooling 64
Mothers who have never heard the word Malnutrition 89
Mothers who had institutional delivery 39
Mothers who gave breastmilk to child as first intake 64
Mothers who breastfed within 1 hour of delivery 41
Mothers who introduced semi-solid/solid food at 6-8 months 57
Children who suffered diarrhea/fever/cough in last 1 week 44
Mothers who took their children to a trained doctor when ill 80
Mothers who had decision making power abouttheir children's welfare 2
Mothers who had decision making power about majorhousehold purchases 2
Families who used soap for washing hands before a meal 10
Families who used soap for washing hands after visit to toilet 20
Atleast one member of family consuming tobacco/liquor 88
Access to Anganwadi Centre (%)
Households (%) owning assets (green) and using services (brown)
0 10 20 30 40 50 60 70 80 90 100
TelevisionRadio
Mobile phone4-wheeler
2-wheelerCycle
TractorPucca House
Toilet
Electricity
PDSMNREGA Card
Bank/ PO AccountHealth Insurance
SHG MembershipAny Loan
Nutritional status of children 0-59 months (%)� Severe (<-3SD) � Severe or Moderate (<-2SD)
70
60
50
40
30
20
10
0
70
60
50
40
30
20
10
0
DLHS-2 HUNGaMA HUNGaMA HUNGaMA Severe Moderate
Underweight Stunting Wasting
Mid Upper ArmCircumference
Snapshot of Services Available (%)Villages with pucca road 92
Villages with pucca drain 15
Villages with electricity 100
Villages with primary school 98
Villages with PDS shop 66
Villages with Post Office 31
Villages with Primary Health Center/Sub-Centre (PHC/SC) 51
Villages with private trained doctor 42
Villages with ASHA Worker 94
Villages with Anganwadi Centre (AWC) 100
Villages with AWC with pucca building 71
Villages with AWW who has heard the word Malnutrition 100
Villages with AWW who make < 2 home visits per day 56
Supplementary Nutrition
Pre-school Education
Referrals
Antenatal Checkups
Immunization
Nutrition & Health Education
Growth Monitoring
No AWC Services
Mothers’ Voice (%)
Average Household Size (in numbers) 10
Mothers with no schooling 44
Fathers with no schooling 19
Mothers who have never heard the word Malnutrition 85
Mothers who had institutional delivery 72
Mothers who gave breastmilk to child as first intake 72
Mothers who breastfed within 1 hour of delivery 48
Mothers who introduced semi-solid/solid food at 6-8 months 67
Children who suffered diarrhea/fever/cough in last 1 week 19
Mothers who took their children to a trained doctor when ill 44
Mothers who had decision making power abouttheir children's welfare 2
Mothers who had decision making power about majorhousehold purchases 0
Families who used soap for washing hands before a meal 26
Families who used soap for washing hands after visit to toilet 39
Atleast one member of family consuming tobacco/liquor 76
Households (%) owning assets (green) and using services (brown)
Nutritional status of children 0-59 months (%)� Severe (<-3SD) � Severe or Moderate (<-2SD)
70
60
50
40
30
20
10
0
70
60
50
40
30
20
10
0
DLHS-2 HUNGaMA HUNGaMA HUNGaMA Severe Moderate
Underweight Stunting Wasting
TelevisionRadio
Mobile phone4-wheeler
2-wheelerCycle
TractorPucca House
Toilet
Electricity
PDSMNREGA Card
Bank/ PO AccountHealth Insurance
SHG MembershipAny Loan
0 10 20 30 40 50 60 70 80 90 100
BHIND
Mid Upper ArmCircumference
Snapshot of Services Available (%)
Villages with pucca road 87
Villages with pucca drain 27
Villages with electricity 77
Villages with primary school 97
Villages with PDS shop 67
Villages with Post Office 38
Villages with Primary Health Center/Sub-Centre (PHC/SC) 39
Villages with private trained doctor 45
Villages with ASHA Worker 96
Villages with Anganwadi Centre (AWC) 97
Villages with AWC with pucca building 74
Villages with AWW who has heard the word Malnutrition 99
Villages with AWW who make < 2 home visits per day 78
Supplementary Nutrition
Pre-school Education
Referrals
Antenatal Checkups
Immunization
Nutrition & Health Education
Growth Monitoring
No AWC Services
Access to Anganwadi Centre (%)
0 10 20 30 40 50 60 70 80 90 100
119

120
CHHATARPUR
0 10 20 30 40 50 60 70 80 90 100
Mothers’ Voice (%)
Average Household Size (in numbers) 7
Mothers with no schooling 50
Fathers with no schooling 24
Mothers who have never heard the word Malnutrition 89
Mothers who had institutional delivery 68
Mothers who gave breastmilk to child as first intake 78
Mothers who breastfed within 1 hour of delivery 48
Mothers who introduced semi-solid/solid food at 6-8 months 66
Children who suffered diarrhea/fever/cough in last 1 week 36
Mothers who took their children to a trained doctor when ill 50
Mothers who had decision making power abouttheir children's welfare 56
Mothers who had decision making power about majorhousehold purchases 2
Families who used soap for washing hands before a meal 22
Families who used soap for washing hands after visit to toilet 26
Atleast one member of family consuming tobacco/liquor 89
Access to Anganwadi Centre (%)
Households (%) owning assets (green) and using services (brown)
0 10 20 30 40 50 60 70 80 90 100
TelevisionRadio
Mobile phone4-wheeler
2-wheelerCycle
TractorPucca House
Toilet
Electricity
PDSMNREGA Card
Bank/ PO AccountHealth Insurance
SHG MembershipAny Loan
Nutritional status of children 0-59 months (%)� Severe (<-3SD) � Severe or Moderate (<-2SD)
70
60
50
40
30
20
10
0
70
60
50
40
30
20
10
0
DLHS-2 HUNGaMA HUNGaMA HUNGaMA Severe Moderate
Underweight Stunting Wasting
Mid Upper ArmCircumference
Snapshot of Services Available (%)Villages with pucca road 76
Villages with pucca drain 33
Villages with electricity 93
Villages with primary school 94
Villages with PDS shop 69
Villages with Post Office 41
Villages with Primary Health Center/Sub-Centre (PHC/SC) 35
Villages with private trained doctor 55
Villages with ASHA Worker 95
Villages with Anganwadi Centre (AWC) 100
Villages with AWC with pucca building 63
Villages with AWW who has heard the word Malnutrition 94
Villages with AWW who make < 2 home visits per day 40
Supplementary Nutrition
Pre-school Education
Referrals
Antenatal Checkups
Immunization
Nutrition & Health Education
Growth Monitoring
No AWC Services
Mothers’ Voice (%)
Average Household Size (in numbers) 7
Mothers with no schooling 52
Fathers with no schooling 30
Mothers who have never heard the word Malnutrition 82
Mothers who had institutional delivery 29
Mothers who gave breastmilk to child as first intake 87
Mothers who breastfed within 1 hour of delivery 61
Mothers who introduced semi-solid/solid food at 6-8 months 38
Children who suffered diarrhea/fever/cough in last 1 week 35
Mothers who took their children to a trained doctor when ill 52
Mothers who had decision making power abouttheir children's welfare 60
Mothers who had decision making power about majorhousehold purchases 8
Families who used soap for washing hands before a meal 11
Families who used soap for washing hands after visit to toilet 9
Atleast one member of family consuming tobacco/liquor 83
Households (%) owning assets (green) and using services (brown)
Nutritional status of children 0-59 months (%)� Severe (<-3SD) � Severe or Moderate (<-2SD)
70
60
50
40
30
20
10
0
70
60
50
40
30
20
10
0
DLHS-2 HUNGaMA HUNGaMA HUNGaMA Severe Moderate
Underweight Stunting Wasting
TelevisionRadio
Mobile phone4-wheeler
2-wheelerCycle
TractorPucca House
Toilet
Electricity
PDSMNREGA Card
Bank/ PO AccountHealth Insurance
SHG MembershipAny Loan
0 10 20 30 40 50 60 70 80 90 100
DINDORI
Mid Upper ArmCircumference
Snapshot of Services Available (%)
Villages with pucca road 69
Villages with pucca drain 28
Villages with electricity 90
Villages with primary school 100
Villages with PDS shop 41
Villages with Post Office 16
Villages with Primary Health Center/Sub-Centre (PHC/SC) 13
Villages with private trained doctor 9
Villages with ASHA Worker 87
Villages with Anganwadi Centre (AWC) 100
Villages with AWC with pucca building 76
Villages with AWW who has heard the word Malnutrition 97
Villages with AWW who make < 2 home visits per day 59
Supplementary Nutrition
Pre-school Education
Referrals
Antenatal Checkups
Immunization
Nutrition & Health Education
Growth Monitoring
No AWC Services
Access to Anganwadi Centre (%)
0 10 20 30 40 50 60 70 80 90 100
121

122
GUNA
0 10 20 30 40 50 60 70 80 90 100
Mothers’ Voice (%)
Average Household Size (in numbers) 9
Mothers with no schooling 73
Fathers with no schooling 36
Mothers who have never heard the word Malnutrition 81
Mothers who had institutional delivery 72
Mothers who gave breastmilk to child as first intake 93
Mothers who breastfed within 1 hour of delivery 61
Mothers who introduced semi-solid/solid food at 6-8 months 61
Children who suffered diarrhea/fever/cough in last 1 week 37
Mothers who took their children to a trained doctor when ill 73
Mothers who had decision making power abouttheir children's welfare 23
Mothers who had decision making power about majorhousehold purchases 1
Families who used soap for washing hands before a meal 17
Families who used soap for washing hands after visit to toilet 28
Atleast one member of family consuming tobacco/liquor 81
Access to Anganwadi Centre (%)
Households (%) owning assets (green) and using services (brown)
0 10 20 30 40 50 60 70 80 90 100
TelevisionRadio
Mobile phone4-wheeler
2-wheelerCycle
TractorPucca House
Toilet
Electricity
PDSMNREGA Card
Bank/ PO AccountHealth Insurance
SHG MembershipAny Loan
Nutritional status of children 0-59 months (%)� Severe (<-3SD) � Severe or Moderate (<-2SD)
70
60
50
40
30
20
10
0
70
60
50
40
30
20
10
0
DLHS-2 HUNGaMA HUNGaMA HUNGaMA Severe Moderate
Underweight Stunting Wasting
Mid Upper ArmCircumference
Snapshot of Services Available (%)Villages with pucca road 65
Villages with pucca drain 11
Villages with electricity 84
Villages with primary school 100
Villages with PDS shop 26
Villages with Post Office 31
Villages with Primary Health Center/Sub-Centre (PHC/SC) 32
Villages with private trained doctor 27
Villages with ASHA Worker 94
Villages with Anganwadi Centre (AWC) 100
Villages with AWC with pucca building 59
Villages with AWW who has heard the word Malnutrition 96
Villages with AWW who make < 2 home visits per day 56
Supplementary Nutrition
Pre-school Education
Referrals
Antenatal Checkups
Immunization
Nutrition & Health Education
Growth Monitoring
No AWC Services
Mothers’ Voice (%)
Average Household Size (in numbers) 8
Mothers with no schooling 41
Fathers with no schooling 23
Mothers who have never heard the word Malnutrition 83
Mothers who had institutional delivery 84
Mothers who gave breastmilk to child as first intake 78
Mothers who breastfed within 1 hour of delivery 48
Mothers who introduced semi-solid/solid food at 6-8 months 72
Children who suffered diarrhea/fever/cough in last 1 week 57
Mothers who took their children to a trained doctor when ill 41
Mothers who had decision making power abouttheir children's welfare 60
Mothers who had decision making power about majorhousehold purchases 1
Families who used soap for washing hands before a meal 21
Families who used soap for washing hands after visit to toilet 25
Atleast one member of family consuming tobacco/liquor 69
Households (%) owning assets (green) and using services (brown)
Nutritional status of children 0-59 months (%)� Severe (<-3SD) � Severe or Moderate (<-2SD)
70
60
50
40
30
20
10
0
70
60
50
40
30
20
10
0
DLHS-2 HUNGaMA HUNGaMA HUNGaMA Severe Moderate
Underweight Stunting Wasting
TelevisionRadio
Mobile phone4-wheeler
2-wheelerCycle
TractorPucca House
Toilet
Electricity
PDSMNREGA Card
Bank/ PO AccountHealth Insurance
SHG MembershipAny Loan
0 10 20 30 40 50 60 70 80 90 100
INDORE
Mid Upper ArmCircumference
Snapshot of Services Available (%)
Villages with pucca road 95
Villages with pucca drain 73
Villages with electricity 100
Villages with primary school 100
Villages with PDS shop 63
Villages with Post Office 36
Villages with Primary Health Center/Sub-Centre (PHC/SC) 48
Villages with private trained doctor 74
Villages with ASHA Worker 85
Villages with Anganwadi Centre (AWC) 100
Villages with AWC with pucca building 66
Villages with AWW who has heard the word Malnutrition 100
Villages with AWW who make < 2 home visits per day 60
Supplementary Nutrition
Pre-school Education
Referrals
Antenatal Checkups
Immunization
Nutrition & Health Education
Growth Monitoring
No AWC Services
Access to Anganwadi Centre (%)
0 10 20 30 40 50 60 70 80 90 100
123

124
JHABUA
0 10 20 30 40 50 60 70 80 90 100
Mothers’ Voice (%)
Average Household Size (in numbers) 9
Mothers with no schooling 90
Fathers with no schooling 70
Mothers who have never heard the word Malnutrition 94
Mothers who had institutional delivery 56
Mothers who gave breastmilk to child as first intake 50
Mothers who breastfed within 1 hour of delivery 29
Mothers who introduced semi-solid/solid food at 6-8 months 55
Children who suffered diarrhea/fever/cough in last 1 week 34
Mothers who took their children to a trained doctor when ill 90
Mothers who had decision making power abouttheir children's welfare 2
Mothers who had decision making power about majorhousehold purchases 1
Families who used soap for washing hands before a meal 35
Families who used soap for washing hands after visit to toilet 57
Atleast one member of family consuming tobacco/liquor 75
Access to Anganwadi Centre (%)
Households (%) owning assets (green) and using services (brown)
0 10 20 30 40 50 60 70 80 90 100
TelevisionRadio
Mobile phone4-wheeler
2-wheelerCycle
TractorPucca House
Toilet
Electricity
PDSMNREGA Card
Bank/ PO AccountHealth Insurance
SHG MembershipAny Loan
Nutritional status of children below 5 years (%)� Severe (<-3SD) � Severe or Moderate (<-2SD)
70
60
50
40
30
20
10
0
70
60
50
40
30
20
10
0
DLHS-2 HUNGaMA HUNGaMA HUNGaMA Severe Moderate
Underweight Stunting Wasting
Mid Upper ArmCircumference
Snapshot of Services Available (%)Villages with pucca road 96
Villages with pucca drain 56
Villages with electricity 95
Villages with primary school 100
Villages with PDS shop 55
Villages with Post Office 11
Villages with Primary Health Center/Sub-Centre (PHC/SC) 41
Villages with private trained doctor 23
Villages with ASHA Worker 79
Villages with Anganwadi Centre (AWC) 100
Villages with AWC with pucca building 71
Villages with AWW who has heard the word Malnutrition 91
Villages with AWW who make < 2 home visits per day 50
Supplementary Nutrition
Pre-school Education
Referrals
Antenatal Checkups
Immunization
Nutrition & Health Education
Growth Monitoring
No AWC Services
Mothers’ Voice (%)
Average Household Size (in numbers) 5
Mothers with no schooling 55
Fathers with no schooling 32
Mothers who have never heard the word Malnutrition 92
Mothers who had institutional delivery 61
Mothers who gave breastmilk to child as first intake 71
Mothers who breastfed within 1 hour of delivery 46
Mothers who introduced semi-solid/solid food at 6-8 months 64
Children who suffered diarrhea/fever/cough in last 1 week 7
Mothers who took their children to a trained doctor when ill 55
Mothers who had decision making power abouttheir children's welfare 40
Mothers who had decision making power about majorhousehold purchases 1
Families who used soap for washing hands before a meal 2
Families who used soap for washing hands after visit to toilet 9
Atleast one member of family consuming tobacco/liquor 81
Households (%) owning assets (green) and using services (brown)
Nutritional status of children 0-59 months (%)� Severe (<-3SD) � Severe or Moderate (<-2SD)
70
60
50
40
30
20
10
0
70
60
50
40
30
20
10
0
DLHS-2 HUNGaMA HUNGaMA HUNGaMA Severe Moderate
Underweight Stunting Wasting
TelevisionRadio
Mobile phone4-wheeler
2-wheelerCycle
TractorPucca House
Toilet
Electricity
PDSMNREGA Card
Bank/ PO AccountHealth Insurance
SHG MembershipAny Loan
0 10 20 30 40 50 60 70 80 90 100
PANNA
Mid Upper ArmCircumference
Snapshot of Services Available (%)
Villages with pucca road 62
Villages with pucca drain 26
Villages with electricity 96
Villages with primary school 100
Villages with PDS shop 68
Villages with Post Office 37
Villages with Primary Health Center/Sub-Centre (PHC/SC) 27
Villages with private trained doctor 40
Villages with ASHA Worker 91
Villages with Anganwadi Centre (AWC) 100
Villages with AWC with pucca building 90
Villages with AWW who has heard the word Malnutrition 98
Villages with AWW who make < 2 home visits per day 26
Supplementary Nutrition
Pre-school Education
Referrals
Antenatal Checkups
Immunization
Nutrition & Health Education
Growth Monitoring
No AWC Services
Access to Anganwadi Centre (%)
0 10 20 30 40 50 60 70 80 90 100
125

126
SHIVPURI
0 10 20 30 40 50 60 70 80 90 100
Mothers’ Voice (%)
Average Household Size (in numbers) 7
Mothers with no schooling 72
Fathers with no schooling 35
Mothers who have never heard the word Malnutrition 93
Mothers who had institutional delivery 68
Mothers who gave breastmilk to child as first intake 83
Mothers who breastfed within 1 hour of delivery 47
Mothers who introduced semi-solid/solid food at 6-8 months 60
Children who suffered diarrhea/fever/cough in last 1 week 16
Mothers who took their children to a trained doctor when ill 72
Mothers who had decision making power abouttheir children's welfare 2
Mothers who had decision making power about majorhousehold purchases 1
Families who used soap for washing hands before a meal 10
Families who used soap for washing hands after visit to toilet 24
Atleast one member of family consuming tobacco/liquor 75
Access to Anganwadi Centre (%)
Households (%) owning assets (green) and using services (brown)
0 10 20 30 40 50 60 70 80 90 100
TelevisionRadio
Mobile phone4-wheeler
2-wheelerCycle
TractorPucca House
Toilet
Electricity
PDSMNREGA Card
Bank/ PO AccountHealth Insurance
SHG MembershipAny Loan
Nutritional status of children 0-59 months (%)� Severe (<-3SD) � Severe or Moderate (<-2SD)
70
60
50
40
30
20
10
0
70
60
50
40
30
20
10
0
DLHS-2 HUNGaMA HUNGaMA HUNGaMA Severe Moderate
Underweight Stunting Wasting
Mid Upper ArmCircumference
Snapshot of Services Available (%)Villages with pucca road 79
Villages with pucca drain 10
Villages with electricity 63
Villages with primary school 100
Villages with PDS shop 84
Villages with Post Office 35
Villages with Primary Health Center/Sub-Centre (PHC/SC) 39
Villages with private trained doctor 34
Villages with ASHA Worker 93
Villages with Anganwadi Centre (AWC) 100
Villages with AWC with pucca building 73
Villages with AWW who has heard the word Malnutrition 100
Villages with AWW who make < 2 home visits per day 68
Supplementary Nutrition
Pre-school Education
Referrals
Antenatal Checkups
Immunization
Nutrition & Health Education
Growth Monitoring
No AWC Services
Mothers’ Voice (%)
Average Household Size (in numbers) 8
Mothers with no schooling 62
Fathers with no schooling 32
Mothers who have never heard the word Malnutrition 93
Mothers who had institutional delivery 67
Mothers who gave breastmilk to child as first intake 59
Mothers who breastfed within 1 hour of delivery 39
Mothers who introduced semi-solid/solid food at 6-8 months 63
Children who suffered diarrhea/fever/cough in last 1 week 17
Mothers who took their children to a trained doctor when ill 62
Mothers who had decision making power abouttheir children's welfare 47
Mothers who had decision making power about majorhousehold purchases 1
Families who used soap for washing hands before a meal 15
Families who used soap for washing hands after visit to toilet 15
Atleast one member of family consuming tobacco/liquor 74
Households (%) owning assets (green) and using services (brown)
Nutritional status of children 0-59 months (%)� Severe (<-3SD) � Severe or Moderate (<-2SD)
70
60
50
40
30
20
10
0
70
60
50
40
30
20
10
0
DLHS-2 HUNGaMA HUNGaMA HUNGaMA Severe Moderate
Underweight Stunting Wasting
TelevisionRadio
Mobile phone4-wheeler
2-wheelerCycle
TractorPucca House
Toilet
Electricity
PDSMNREGA Card
Bank/ PO AccountHealth Insurance
SHG MembershipAny Loan
0 10 20 30 40 50 60 70 80 90 100
TIKAMGARH
Mid Upper ArmCircumference
Snapshot of Services Available (%)
Villages with pucca road 89
Villages with pucca drain 9
Villages with electricity 90
Villages with primary school 100
Villages with PDS shop 38
Villages with Post Office 34
Villages with Primary Health Center/Sub-Centre (PHC/SC) 32
Villages with private trained doctor 8
Villages with ASHA Worker 89
Villages with Anganwadi Centre (AWC) 100
Villages with AWC with pucca building 65
Villages with AWW who has heard the word Malnutrition 100
Villages with AWW who make < 2 home visits per day 52
Supplementary Nutrition
Pre-school Education
Referrals
Antenatal Checkups
Immunization
Nutrition & Health Education
Growth Monitoring
No AWC Services
Access to Anganwadi Centre (%)
0 10 20 30 40 50 60 70 80 90 100
127

128
UMARIA
0 10 20 30 40 50 60 70 80 90 100
Mothers’ Voice (%)
Average Household Size (in numbers) 6
Mothers with no schooling 56
Fathers with no schooling 29
Mothers who have never heard the word Malnutrition 82
Mothers who had institutional delivery 63
Mothers who gave breastmilk to child as first intake 92
Mothers who breastfed within 1 hour of delivery 54
Mothers who introduced semi-solid/solid food at 6-8 months 65
Children who suffered diarrhea/fever/cough in last 1 week 40
Mothers who took their children to a trained doctor when ill 56
Mothers who had decision making power abouttheir children's welfare 34
Mothers who had decision making power about majorhousehold purchases 4
Families who used soap for washing hands before a meal 7
Families who used soap for washing hands after visit to toilet 6
Atleast one member of family consuming tobacco/liquor 82
Access to Anganwadi Centre (%)
Households (%) owning assets (green) and using services (brown)
0 10 20 30 40 50 60 70 80 90 100
TelevisionRadio
Mobile phone4-wheeler
2-wheelerCycle
TractorPucca House
Toilet
Electricity
PDSMNREGA Card
Bank/ PO AccountHealth Insurance
SHG MembershipAny Loan
Nutritional status of children 0-59 months (%)� Severe (<-3SD) � Severe or Moderate (<-2SD)
70
60
50
40
30
20
10
0
70
60
50
40
30
20
10
0
DLHS-2 HUNGaMA HUNGaMA HUNGaMA Severe Moderate
Underweight Stunting Wasting
Mid Upper ArmCircumference
Snapshot of Services Available (%)Villages with pucca road 81
Villages with pucca drain 21
Villages with electricity 97
Villages with primary school 100
Villages with PDS shop 59
Villages with Post Office 21
Villages with Primary Health Center/Sub-Centre (PHC/SC) 31
Villages with private trained doctor 4
Villages with ASHA Worker 97
Villages with Anganwadi Centre (AWC) 100
Villages with AWC with pucca building 93
Villages with AWW who has heard the word Malnutrition 93
Villages with AWW who make < 2 home visits per day 62
Supplementary Nutrition
Pre-school Education
Referrals
Antenatal Checkups
Immunization
Nutrition & Health Education
Growth Monitoring
No AWC Services
Mothers’ Voice (%)
Average Household Size (in numbers) 7
Mothers with no schooling 61
Fathers with no schooling 37
Mothers who have never heard the word Malnutrition 92
Mothers who had institutional delivery 59
Mothers who gave breastmilk to child as first intake 92
Mothers who breastfed within 1 hour of delivery 78
Mothers who introduced semi-solid/solid food at 6-8 months 65
Children who suffered diarrhea/fever/cough in last 1 week 31
Mothers who took their children to a trained doctor when ill 61
Mothers who had decision making power abouttheir children's welfare 26
Mothers who had decision making power about majorhousehold purchases 1
Families who used soap for washing hands before a meal 30
Families who used soap for washing hands after visit to toilet 32
Atleast one member of family consuming tobacco/liquor 88
Households (%) owning assets (green) and using services (brown)
Nutritional status of children 0-59 months (%)� Severe (<-3SD) � Severe or Moderate (<-2SD)
70
60
50
40
30
20
10
0
70
60
50
40
30
20
10
0
DLHS-2 HUNGaMA HUNGaMA HUNGaMA Severe Moderate
Underweight Stunting Wasting
TelevisionRadio
Mobile phone4-wheeler
2-wheelerCycle
TractorPucca House
Toilet
Electricity
PDSMNR EGA Card
Bank/ PO AccountHealth Insurance
SHG MembershipAny Loan
0 10 20 30 40 50 60 70 80 90 100
VIDISHA
Mid Upper ArmCircumference
Snapshot of Services Available (%)
Villages with pucca road 74
Villages with pucca drain 27
Villages with electricity 96
Villages with primary school 100
Villages with PDS shop 48
Villages with Post Office 42
Villages with Primary Health Center/Sub-Centre (PHC/SC) 35
Villages with private trained doctor 31
Villages with ASHA Worker 84
Villages with Anganwadi Centre (AWC) 98
Villages with AWC with pucca building 54
Villages with AWW who has heard the word Malnutrition 99
Villages with AWW who make < 2 home visits per day 29
Supplementary Nutrition
Pre-school Education
Referrals
Antenatal Checkups
Immunization
Nutrition & Health Education
Growth Monitoring
No AWC Services
Access to Anganwadi Centre (%)
0 10 20 30 40 50 60 70 80 90 100
129

Orissa
Fighting Hunger & Malnutrition
131

132
CUTTACK
0 10 20 30 40 50 60 70 80 90 100
Mothers’ Voice (%)
Average Household Size (in numbers) 7
Mothers with no schooling 15
Fathers with no schooling 10
Mothers who have never heard the word Malnutrition 77
Mothers who had institutional delivery 86
Mothers who gave breastmilk to child as first intake 97
Mothers who breastfed within 1 hour of delivery 94
Mothers who introduced semi-solid/solid food at 6-8 months 86
Children who suffered diarrhea/fever/cough in last 1 week 47
Mothers who took their children to a trained doctor when ill 15
Mothers who had decision making power abouttheir children's welfare 99
Mothers who had decision making power about majorhousehold purchases 1
Families who used soap for washing hands before a meal 31
Families who used soap for washing hands after visit to toilet 18
Atleast one member of family consuming tobacco/liquor 67
Access to Anganwadi Centre (%)
Households (%) owning assets (green) and using services (brown)
0 10 20 30 40 50 60 70 80 90 100
TelevisionRadio
Mobile phone4-wheeler
2-wheelerCycle
TractorPucca House
Toilet
Electricity
PDSMNREGA Card
Bank/ PO AccountHealth Insurance
SHG MembershipAny Loan
Nutritional status of children 0-59 months (%)� Severe (<-3SD) � Severe or Moderate (<-2SD)
70
60
50
40
30
20
10
0
70
60
50
40
30
20
10
0
DLHS-2 HUNGaMA HUNGaMA HUNGaMA Severe Moderate
Underweight Stunting Wasting
Mid Upper ArmCircumference
Snapshot of Services Available (%)Villages with pucca road 84
Villages with pucca drain 28
Villages with electricity 100
Villages with primary school 100
Villages with PDS shop 75
Villages with Post Office 27
Villages with Primary Health Center/Sub-Centre (PHC/SC) 15
Villages with private trained doctor 28
Villages with ASHA Worker 98
Villages with Anganwadi Centre (AWC) 100
Villages with AWC with pucca building 11
Villages with AWW who has heard the word Malnutrition 100
Villages with AWW who make < 2 home visits per day 48
Supplementary Nutrition
Pre-school Education
Referrals
Antenatal Checkups
Immunization
Nutrition & Health Education
Growth Monitoring
No AWC Services
Mothers’ Voice (%)
Average Household Size (in numbers) 6
Mothers with no schooling 67
Fathers with no schooling 51
Mothers who have never heard the word Malnutrition 91
Mothers who had institutional delivery 38
Mothers who gave breastmilk to child as first intake 93
Mothers who breastfed within 1 hour of delivery 82
Mothers who introduced semi-solid/solid food at 6-8 months 70
Children who suffered diarrhea/fever/cough in last 1 week 34
Mothers who took their children to a trained doctor when ill 67
Mothers who had decision making power abouttheir children's welfare 89
Mothers who had decision making power about majorhousehold purchases 1
Families who used soap for washing hands before a meal 10
Families who used soap for washing hands after visit to toilet 11
Atleast one member of family consuming tobacco/liquor 70
Households (%) owning assets (green) and using services (brown)
Nutritional status of children 0-59 months (%)� Severe (<-3SD) � Severe or Moderate (<-2SD)
70
60
50
40
30
20
10
0
70
60
50
40
30
20
10
0
DLHS-2 HUNGaMA HUNGaMA HUNGaMA Severe Moderate
Underweight Stunting Wasting
TelevisionRadio
Mobile phone4-wheeler
2-wheelerCycle
TractorPucca House
Toilet
Electricity
PDSMNREGA Card
Bank/ PO AccountHealth Insurance
SHG MembershipAny Loan
0 10 20 30 40 50 60 70 80 90 100
GAJAPATI
Mid Upper ArmCircumference
Snapshot of Services Available (%)
Villages with pucca road 89
Villages with pucca drain 81
Villages with electricity 100
Villages with primary school 100
Villages with PDS shop 48
Villages with Post Office 39
Villages with Primary Health Center/Sub-Centre (PHC/SC) 16
Villages with private trained doctor 42
Villages with ASHA Worker 82
Villages with Anganwadi Centre (AWC) 100
Villages with AWC with pucca building 70
Villages with AWW who has heard the word Malnutrition 99
Villages with AWW who make < 2 home visits per day 93
Supplementary Nutrition
Pre-school Education
Referrals
Antenatal Checkups
Immunization
Nutrition & Health Education
Growth Monitoring
No AWC Services
Access to Anganwadi Centre (%)
0 10 20 30 40 50 60 70 80 90 100
133

134
KANDHAMAL
0 10 20 30 40 50 60 70 80 90 100
Mothers’ Voice (%)
Average Household Size (in numbers) 5
Mothers with no schooling 54
Fathers with no schooling 32
Mothers who have never heard the word Malnutrition 92
Mothers who had institutional delivery 58
Mothers who gave breastmilk to child as first intake 98
Mothers who breastfed within 1 hour of delivery 86
Mothers who introduced semi-solid/solid food at 6-8 months 80
Children who suffered diarrhea/fever/cough in last 1 week 47
Mothers who took their children to a trained doctor when ill 54
Mothers who had decision making power abouttheir children's welfare 98
Mothers who had decision making power about majorhousehold purchases 3
Families who used soap for washing hands before a meal 9
Families who used soap for washing hands after visit to toilet 8
Atleast one member of family consuming tobacco/liquor 70
Access to Anganwadi Centre (%)
Households (%) owning assets (green) and using services (brown)
0 10 20 30 40 50 60 70 80 90 100
TelevisionRadio
Mobile phone4-wheeler
2-wheelerCycle
TractorPucca House
Toilet
Electricity
PDSMNREGA Card
Bank/ PO AccountHealth Insurance
SHG MembershipAny Loan
Nutritional status of children 0-59 months (%)� Severe (<-3SD) � Severe or Moderate (<-2SD)
70
60
50
40
30
20
10
0
70
60
50
40
30
20
10
0
DLHS-2 HUNGaMA HUNGaMA HUNGaMA Severe Moderate
Underweight Stunting Wasting
Mid Upper ArmCircumference
Snapshot of Services Available (%)Villages with pucca road 75
Villages with pucca drain 23
Villages with electricity 55
Villages with primary school 98
Villages with PDS shop 30
Villages with Post Office 54
Villages with Primary Health Center/Sub-Centre (PHC/SC) 30
Villages with private trained doctor 24
Villages with ASHA Worker 95
Villages with Anganwadi Centre (AWC) 98
Villages with AWC with pucca building 20
Villages with AWW who has heard the word Malnutrition 95
Villages with AWW who make < 2 home visits per day 67
Supplementary Nutrition
Pre-school Education
Referrals
Antenatal Checkups
Immunization
Nutrition & Health Education
Growth Monitoring
No AWC Services
Mothers’ Voice (%)
Average Household Size (in numbers) 5
Mothers with no schooling 88
Fathers with no schooling 57
Mothers who have never heard the word Malnutrition 92
Mothers who had institutional delivery 34
Mothers who gave breastmilk to child as first intake 99
Mothers who breastfed within 1 hour of delivery 85
Mothers who introduced semi-solid/solid food at 6-8 months 83
Children who suffered diarrhea/fever/cough in last 1 week 19
Mothers who took their children to a trained doctor when ill 88
Mothers who had decision making power abouttheir children's welfare 97
Mothers who had decision making power about majorhousehold purchases 1
Families who used soap for washing hands before a meal 10
Families who used soap for washing hands after visit to toilet 13
Atleast one member of family consuming tobacco/liquor 84
Households (%) owning assets (green) and using services (brown)
Nutritional status of children 0-59 months (%)� Severe (<-3SD) � Severe or Moderate (<-2SD)
70
60
50
40
30
20
10
0
70
60
50
40
30
20
10
0
DLHS-2 HUNGaMA HUNGaMA HUNGaMA Severe Moderate
Underweight Stunting Wasting
TelevisionRadio
Mobile phone4-wheeler
2-wheelerCycle
TractorPucca House
Toilet
Electricity
PDSMNREGA Card
Bank/ PO AccountHealth Insurance
SHG MembershipAny Loan
0 10 20 30 40 50 60 70 80 90 100
KORAPUT
Mid Upper ArmCircumference
Snapshot of Services Available (%)
Villages with pucca road 74
Villages with pucca drain 59
Villages with electricity 70
Villages with primary school 100
Villages with PDS shop 45
Villages with Post Office 33
Villages with Primary Health Center/Sub-Centre (PHC/SC) 17
Villages with private trained doctor 8
Villages with ASHA Worker 87
Villages with Anganwadi Centre (AWC) 100
Villages with AWC with pucca building 31
Villages with AWW who has heard the word Malnutrition 100
Villages with AWW who make < 2 home visits per day 62
Supplementary Nutrition
Pre-school Education
Referrals
Antenatal Checkups
Immunization
Nutrition & Health Education
Growth Monitoring
No AWC Services
Access to Anganwadi Centre (%)
0 10 20 30 40 50 60 70 80 90 100
135

136
MALKANGIRI
0 10 20 30 40 50 60 70 80 90 100
Mothers’ Voice (%)
Average Household Size (in numbers) 6
Mothers with no schooling 83
Fathers with no schooling 65
Mothers who have never heard the word Malnutrition 98
Mothers who had institutional delivery 24
Mothers who gave breastmilk to child as first intake 93
Mothers who breastfed within 1 hour of delivery 91
Mothers who introduced semi-solid/solid food at 6-8 months 85
Children who suffered diarrhea/fever/cough in last 1 week 39
Mothers who took their children to a trained doctor when ill 83
Mothers who had decision making power abouttheir children's welfare 93
Mothers who had decision making power about majorhousehold purchases 1
Families who used soap for washing hands before a meal 3
Families who used soap for washing hands after visit to toilet 5
Atleast one member of family consuming tobacco/liquor 93
Access to Anganwadi Centre (%)
Households (%) owning assets (green) and using services (brown)
0 10 20 30 40 50 60 70 80 90 100
TelevisionRadio
Mobile phone4-wheeler
2-wheelerCycle
TractorPucca House
Toilet
Electricity
PDSMNREGA Card
Bank/ PO AccountHealth Insurance
SHG MembershipAny Loan
Nutritional status of children 0-59 months (%)� Severe (<-3SD) � Severe or Moderate (<-2SD)
70
60
50
40
30
20
10
0
70
60
50
40
30
20
10
0
DLHS-2 HUNGaMA HUNGaMA HUNGaMA Severe Moderate
Underweight Stunting Wasting
Mid Upper ArmCircumference
Snapshot of Services Available (%)Villages with pucca road 47
Villages with pucca drain 25
Villages with electricity 56
Villages with primary school 95
Villages with PDS shop 46
Villages with Post Office 27
Villages with Primary Health Center/Sub-Centre (PHC/SC) 12
Villages with private trained doctor 43
Villages with ASHA Worker 90
Villages with Anganwadi Centre (AWC) 100
Villages with AWC with pucca building 10
Villages with AWW who has heard the word Malnutrition 73
Villages with AWW who make < 2 home visits per day 35
Supplementary Nutrition
Pre-school Education
Referrals
Antenatal Checkups
Immunization
Nutrition & Health Education
Growth Monitoring
No AWC Services
Mothers’ Voice (%)
Average Household Size (in numbers) 6
Mothers with no schooling 75
Fathers with no schooling 61
Mothers who have never heard the word Malnutrition 86
Mothers who had institutional delivery 47
Mothers who gave breastmilk to child as first intake 97
Mothers who breastfed within 1 hour of delivery 89
Mothers who introduced semi-solid/solid food at 6-8 months 71
Children who suffered diarrhea/fever/cough in last 1 week 36
Mothers who took their children to a trained doctor when ill 75
Mothers who had decision making power abouttheir children's welfare 84
Mothers who had decision making power about majorhousehold purchases 8
Families who used soap for washing hands before a meal 25
Families who used soap for washing hands after visit to toilet 22
Atleast one member of family consuming tobacco/liquor 74
Households (%) owning assets (green) and using services (brown)
Nutritional status of children 0-59 months (%)� Severe (<-3SD) � Severe or Moderate (<-2SD)
70
60
50
40
30
20
10
0
70
60
50
40
30
20
10
0
DLHS-2 HUNGaMA HUNGaMA HUNGaMA Severe Moderate
Underweight Stunting Wasting
TelevisionRadio
Mobile phone4-wheeler
2-wheelerCycle
TractorPucca House
Toilet
Electricity
PDSMNREGA Card
Bank/ PO AccountHealth Insurance
SHG MembershipAny Loan
0 10 20 30 40 50 60 70 80 90 100
RAYAGADA
Mid Upper ArmCircumference
Snapshot of Services Available (%)
Villages with pucca road 86
Villages with pucca drain 40
Villages with electricity 80
Villages with primary school 96
Villages with PDS shop 43
Villages with Post Office 44
Villages with Primary Health Center/Sub-Centre (PHC/SC) 36
Villages with private trained doctor 18
Villages with ASHA Worker 79
Villages with Anganwadi Centre (AWC) 91
Villages with AWC with pucca building 46
Villages with AWW who has heard the word Malnutrition 100
Villages with AWW who make < 2 home visits per day 61
Supplementary Nutrition
Pre-school Education
Referrals
Antenatal Checkups
Immunization
Nutrition & Health Education
Growth Monitoring
No AWC Services
Access to Anganwadi Centre (%)
0 10 20 30 40 50 60 70 80 90 100
137

Rajasthan
Fighting Hunger & Malnutrition
139139

140
BANSWARA
0 10 20 30 40 50 60 70 80 90 100
Mothers’ Voice (%)
Average Household Size (in numbers) 6
Mothers with no schooling 81
Fathers with no schooling 47
Mothers who have never heard the word Malnutrition 95
Mothers who had institutional delivery 69
Mothers who gave breastmilk to child as first intake 71
Mothers who breastfed within 1 hour of delivery 32
Mothers who introduced semi-solid/solid food at 6-8 months 85
Children who suffered diarrhea/fever/cough in last 1 week 28
Mothers who took their children to a trained doctor when ill 81
Mothers who had decision making power abouttheir children's welfare 79
Mothers who had decision making power about majorhousehold purchases 4
Families who used soap for washing hands before a meal 18
Families who used soap for washing hands after visit to toilet 8
Atleast one member of family consuming tobacco/liquor 61
Access to Anganwadi Centre (%)
Households (%) owning assets (green) and using services (brown)
0 10 20 30 40 50 60 70 80 90 100
TelevisionRadio
Mobile phone4-wheeler
2-wheelerCycle
TractorPucca House
Toilet
Electricity
PDSMNREGA Card
Bank/ PO AccountHealth Insurance
SHG MembershipAny Loan
Nutritional status of children 0-59 months (%)� Severe (<-3SD) � Severe or Moderate (<-2SD)
70
60
50
40
30
20
10
0
70
60
50
40
30
20
10
0
DLHS-2 HUNGaMA HUNGaMA HUNGaMA Severe Moderate
Underweight Stunting Wasting
Mid Upper ArmCircumference
Snapshot of Services Available (%)Villages with pucca road 78
Villages with pucca drain 26
Villages with electricity 83
Villages with primary school 98
Villages with PDS shop 68
Villages with Post Office 25
Villages with Primary Health Center/Sub-Centre (PHC/SC) 60
Villages with private trained doctor 30
Villages with ASHA Worker 100
Villages with Anganwadi Centre (AWC) 100
Villages with AWC with pucca building 93
Villages with AWW who has heard the word Malnutrition 96
Villages with AWW who make < 2 home visits per day 40
Supplementary Nutrition
Pre-school Education
Referrals
Antenatal Checkups
Immunization
Nutrition & Health Education
Growth Monitoring
No AWC Services
Mothers’ Voice (%)
Average Household Size (in numbers) 8
Mothers with no schooling 55
Fathers with no schooling 24
Mothers who have never heard the word Malnutrition 88
Mothers who had institutional delivery 81
Mothers who gave breastmilk to child as first intake 75
Mothers who breastfed within 1 hour of delivery 65
Mothers who introduced semi-solid/solid food at 6-8 months 60
Children who suffered diarrhea/fever/cough in last 1 week 33
Mothers who took their children to a trained doctor when ill 55
Mothers who had decision making power abouttheir children's welfare 36
Mothers who had decision making power about majorhousehold purchases 2
Families who used soap for washing hands before a meal 12
Families who used soap for washing hands after visit to toilet 44
Atleast one member of family consuming tobacco/liquor 82
Households (%) owning assets (green) and using services (brown)
Nutritional status of children 0-59 months (%)� Severe (<-3SD) � Severe or Moderate (<-2SD)
70
60
50
40
30
20
10
0
70
60
50
40
30
20
10
0
DLHS-2 HUNGaMA HUNGaMA HUNGaMA Severe Moderate
Underweight Stunting Wasting
TelevisionRadio
Mobile phone4-wheeler
2-wheelerCycle
TractorPucca House
Toilet
Electricity
PDSMNREGA Card
Bank/ PO AccountHealth Insurance
SHG MembershipAny Loan
0 10 20 30 40 50 60 70 80 90 100
BARAN
Mid Upper ArmCircumference
Snapshot of Services Available (%)
Villages with pucca road 96
Villages with pucca drain 47
Villages with electricity 100
Villages with primary school 94
Villages with PDS shop 68
Villages with Post Office 49
Villages with Primary Health Center/Sub-Centre (PHC/SC) 57
Villages with private trained doctor 47
Villages with ASHA Worker 94
Villages with Anganwadi Centre (AWC) 97
Villages with AWC with pucca building 64
Villages with AWW who has heard the word Malnutrition 100
Villages with AWW who make < 2 home visits per day 32
Supplementary Nutrition
Pre-school Education
Referrals
Antenatal Checkups
Immunization
Nutrition & Health Education
Growth Monitoring
No AWC Services
Access to Anganwadi Centre (%)
0 10 20 30 40 50 60 70 80 90 100
141

142
BARMER
0 10 20 30 40 50 60 70 80 90 100
Mothers’ Voice (%)
Average Household Size (in numbers) 7
Mothers with no schooling 79
Fathers with no schooling 40
Mothers who have never heard the word Malnutrition 96
Mothers who had institutional delivery 17
Mothers who gave breastmilk to child as first intake 29
Mothers who breastfed within 1 hour of delivery 27
Mothers who introduced semi-solid/solid food at 6-8 months 60
Children who suffered diarrhea/fever/cough in last 1 week 9
Mothers who took their children to a trained doctor when ill 79
Mothers who had decision making power abouttheir children's welfare 23
Mothers who had decision making power about majorhousehold purchases 3
Families who used soap for washing hands before a meal 15
Families who used soap for washing hands after visit to toilet 15
Atleast one member of family consuming tobacco/liquor 54
Access to Anganwadi Centre (%)
Households (%) owning assets (green) and using services (brown)
0 10 20 30 40 50 60 70 80 90 100
TelevisionRadio
Mobile phone4-wheeler
2-wheelerCycle
TractorPucca House
Toilet
Electricity
PDSMNREGA Card
Bank/ PO AccountHealth Insurance
SHG MembershipAny Loan
Nutritional status of children 0-59 months (%)� Severe (<-3SD) � Severe or Moderate (<-2SD)
70
60
50
40
30
20
10
0
70
60
50
40
30
20
10
0
DLHS-2 HUNGaMA HUNGaMA HUNGaMA Severe Moderate
Underweight Stunting Wasting
Mid Upper ArmCircumference
Snapshot of Services Available (%)Villages with pucca road 96
Villages with pucca drain 14
Villages with electricity 90
Villages with primary school 87
Villages with PDS shop 59
Villages with Post Office 34
Villages with Primary Health Center/Sub-Centre (PHC/SC) 80
Villages with private trained doctor 10
Villages with ASHA Worker 36
Villages with Anganwadi Centre (AWC) 88
Villages with AWC with pucca building 100
Villages with AWW who has heard the word Malnutrition 94
Villages with AWW who make < 2 home visits per day 93
Supplementary Nutrition
Pre-school Education
Referrals
Antenatal Checkups
Immunization
Nutrition & Health Education
Growth Monitoring
No AWC Services
Mothers’ Voice (%)
Average Household Size (in numbers) 8
Mothers with no schooling 53
Fathers with no schooling 14
Mothers who have never heard the word Malnutrition 90
Mothers who had institutional delivery 63
Mothers who gave breastmilk to child as first intake 65
Mothers who breastfed within 1 hour of delivery 52
Mothers who introduced semi-solid/solid food at 6-8 months 55
Children who suffered diarrhea/fever/cough in last 1 week 30
Mothers who took their children to a trained doctor when ill 53
Mothers who had decision making power abouttheir children's welfare 36
Mothers who had decision making power about majorhousehold purchases 1
Families who used soap for washing hands before a meal 7
Families who used soap for washing hands after visit to toilet 22
Atleast one member of family consuming tobacco/liquor 65
Households (%) owning assets (green) and using services (brown)
Nutritional status of children 0-59 months (%)� Severe (<-3SD) � Severe or Moderate (<-2SD)
70
60
50
40
30
20
10
0
70
60
50
40
30
20
10
0
DLHS-2 HUNGaMA HUNGaMA HUNGaMA Severe Moderate
Underweight Stunting Wasting
TelevisionRadio
Mobile phone4-wheeler
2-wheelerCycle
TractorPucca House
Toilet
Electricity
PDSMNREGA Card
Bank/ PO AccountHealth Insurance
SHG MembershipAny Loan
0 10 20 30 40 50 60 70 80 90 100
BHARATPUR
Mid Upper ArmCircumference
Snapshot of Services Available (%)
Villages with pucca road 90
Villages with pucca drain 22
Villages with electricity 100
Villages with primary school 57
Villages with PDS shop 55
Villages with Post Office 61
Villages with Primary Health Center/Sub-Centre (PHC/SC) 43
Villages with private trained doctor 30
Villages with ASHA Worker 86
Villages with Anganwadi Centre (AWC) 92
Villages with AWC with pucca building 79
Villages with AWW who has heard the word Malnutrition 97
Villages with AWW who make < 2 home visits per day 54
Supplementary Nutrition
Pre-school Education
Referrals
Antenatal Checkups
Immunization
Nutrition & Health Education
Growth Monitoring
No AWC Services
Access to Anganwadi Centre (%)
0 10 20 30 40 50 60 70 80 90 100
143

144
DHAULPUR
0 10 20 30 40 50 60 70 80 90 100
Mothers’ Voice (%)
Average Household Size (in numbers) 7
Mothers with no schooling 69
Fathers with no schooling 25
Mothers who have never heard the word Malnutrition 94
Mothers who had institutional delivery 60
Mothers who gave breastmilk to child as first intake 55
Mothers who breastfed within 1 hour of delivery 43
Mothers who introduced semi-solid/solid food at 6-8 months 56
Children who suffered diarrhea/fever/cough in last 1 week 42
Mothers who took their children to a trained doctor when ill 69
Mothers who had decision making power abouttheir children's welfare 29
Mothers who had decision making power about majorhousehold purchases 0
Families who used soap for washing hands before a meal 2
Families who used soap for washing hands after visit to toilet 26
Atleast one member of family consuming tobacco/liquor 85
Access to Anganwadi Centre (%)
Households (%) owning assets (green) and using services (brown)
0 10 20 30 40 50 60 70 80 90 100
TelevisionRadio
Mobile phone4-wheeler
2-wheelerCycle
TractorPucca House
Toilet
Electricity
PDSMNREGA Card
Bank/ PO AccountHealth Insurance
SHG MembershipAny Loan
Nutritional status of children 0-59 months (%)� Severe (<-3SD) � Severe or Moderate (<-2SD)
70
60
50
40
30
20
10
0
70
60
50
40
30
20
10
0
DLHS-2 HUNGaMA HUNGaMA HUNGaMA Severe Moderate
Underweight Stunting Wasting
Mid Upper ArmCircumference
Snapshot of Services Available (%)Villages with pucca road 94
Villages with pucca drain 17
Villages with electricity 83
Villages with primary school 96
Villages with PDS shop 54
Villages with Post Office 28
Villages with Primary Health Center/Sub-Centre (PHC/SC) 30
Villages with private trained doctor 37
Villages with ASHA Worker 95
Villages with Anganwadi Centre (AWC) 98
Villages with AWC with pucca building 97
Villages with AWW who has heard the word Malnutrition 93
Villages with AWW who make < 2 home visits per day 48
Supplementary Nutrition
Pre-school Education
Referrals
Antenatal Checkups
Immunization
Nutrition & Health Education
Growth Monitoring
No AWC Services
Mothers’ Voice (%)
Average Household Size (in numbers) 7
Mothers with no schooling 63
Fathers with no schooling 27
Mothers who have never heard the word Malnutrition 90
Mothers who had institutional delivery 53
Mothers who gave breastmilk to child as first intake 72
Mothers who breastfed within 1 hour of delivery 56
Mothers who introduced semi-solid/solid food at 6-8 months 77
Children who suffered diarrhea/fever/cough in last 1 week 23
Mothers who took their children to a trained doctor when ill 63
Mothers who had decision making power abouttheir children's welfare 37
Mothers who had decision making power about majorhousehold purchases 1
Families who used soap for washing hands before a meal 10
Families who used soap for washing hands after visit to toilet 25
Atleast one member of family consuming tobacco/liquor 67
Households (%) owning assets (green) and using services (brown)
Nutritional status of children 0-59 months (%)� Severe (<-3SD) � Severe or Moderate (<-2SD)
70
60
50
40
30
20
10
0
70
60
50
40
30
20
10
0
DLHS-2 HUNGaMA HUNGaMA HUNGaMA Severe Moderate
Underweight Stunting Wasting
TelevisionRadio
Mobile phone4-wheeler
2-wheelerCycle
TractorPucca House
Toilet
Electricity
PDSMNREGA Card
Bank/ PO AccountHealth Insurance
SHG MembershipAny Loan
0 10 20 30 40 50 60 70 80 90 100
DUNGARPUR
Mid Upper ArmCircumference
Snapshot of Services Available (%)
Villages with pucca road 98
Villages with pucca drain 35
Villages with electricity 100
Villages with primary school 97
Villages with PDS shop 80
Villages with Post Office 57
Villages with Primary Health Center/Sub-Centre (PHC/SC) 69
Villages with private trained doctor 37
Villages with ASHA Worker 77
Villages with Anganwadi Centre (AWC) 100
Villages with AWC with pucca building 90
Villages with AWW who has heard the word Malnutrition 97
Villages with AWW who make < 2 home visits per day 66
Supplementary Nutrition
Pre-school Education
Referrals
Antenatal Checkups
Immunization
Nutrition & Health Education
Growth Monitoring
No AWC Services
Access to Anganwadi Centre (%)
0 10 20 30 40 50 60 70 80 90 100
145

146
JAISALMER
0 10 20 30 40 50 60 70 80 90 100
Mothers’ Voice (%)
Average Household Size (in numbers) 8
Mothers with no schooling 77
Fathers with no schooling 41
Mothers who have never heard the word Malnutrition 96
Mothers who had institutional delivery 21
Mothers who gave breastmilk to child as first intake 23
Mothers who breastfed within 1 hour of delivery 14
Mothers who introduced semi-solid/solid food at 6-8 months 40
Children who suffered diarrhea/fever/cough in last 1 week 8
Mothers who took their children to a trained doctor when ill 77
Mothers who had decision making power abouttheir children's welfare 10
Mothers who had decision making power about majorhousehold purchases 4
Families who used soap for washing hands before a meal 14
Families who used soap for washing hands after visit to toilet 8
Atleast one member of family consuming tobacco/liquor 71
Access to Anganwadi Centre (%)
Households (%) owning assets (green) and using services (brown)
0 10 20 30 40 50 60 70 80 90 100
TelevisionRadio
Mobile phone4-wheeler
2-wheelerCycle
TractorPucca House
Toilet
Electricity
PDSMNREGA Card
Bank/ PO AccountHealth Insurance
SHG MembershipAny Loan
Nutritional status of children 0-59 months (%)� Severe (<-3SD) � Severe or Moderate (<-2SD)
70
60
50
40
30
20
10
0
70
60
50
40
30
20
10
0
DLHS-2 HUNGaMA HUNGaMA HUNGaMA Severe Moderate
Underweight Stunting Wasting
Mid Upper ArmCircumference
Snapshot of Services Available (%)Villages with pucca road 93
Villages with pucca drain 11
Villages with electricity 87
Villages with primary school 90
Villages with PDS shop 68
Villages with Post Office 51
Villages with Primary Health Center/Sub-Centre (PHC/SC) 71
Villages with private trained doctor 16
Villages with ASHA Worker 78
Villages with Anganwadi Centre (AWC) 100
Villages with AWC with pucca building 89
Villages with AWW who has heard the word Malnutrition 85
Villages with AWW who make < 2 home visits per day 76
Supplementary Nutrition
Pre-school Education
Referrals
Antenatal Checkups
Immunization
Nutrition & Health Education
Growth Monitoring
No AWC Services
Mothers’ Voice (%)
Average Household Size (in numbers) 6
Mothers with no schooling 71
Fathers with no schooling 32
Mothers who have never heard the word Malnutrition 91
Mothers who had institutional delivery 58
Mothers who gave breastmilk to child as first intake 71
Mothers who breastfed within 1 hour of delivery 67
Mothers who introduced semi-solid/solid food at 6-8 months 80
Children who suffered diarrhea/fever/cough in last 1 week 29
Mothers who took their children to a trained doctor when ill 71
Mothers who had decision making power abouttheir children's welfare 3
Mothers who had decision making power about majorhousehold purchases 3
Families who used soap for washing hands before a meal 11
Families who used soap for washing hands after visit to toilet 22
Atleast one member of family consuming tobacco/liquor 76
Households (%) owning assets (green) and using services (brown)
Nutritional status of children 0-59 months (%)� Severe (<-3SD) � Severe or Moderate (<-2SD)
70
60
50
40
30
20
10
0
70
60
50
40
30
20
10
0
DLHS-2 HUNGaMA HUNGaMA HUNGaMA Severe Moderate
Underweight Stunting Wasting
TelevisionRadio
Mobile phone4-wheeler
2-wheelerCycle
TractorPucca House
Toilet
Electricity
PDSMNREGA Card
Bank/ PO AccountHealth Insurance
SHG MembershipAny Loan
0 10 20 30 40 50 60 70 80 90 100
JHALAWAR
Mid Upper ArmCircumference
Snapshot of Services Available (%)
Villages with pucca road 93
Villages with pucca drain 51
Villages with electricity 100
Villages with primary school 100
Villages with PDS shop 65
Villages with Post Office 50
Villages with Primary Health Center/Sub-Centre (PHC/SC) 58
Villages with private trained doctor 57
Villages with ASHA Worker 96
Villages with Anganwadi Centre (AWC) 94
Villages with AWC with pucca building 93
Villages with AWW who has heard the word Malnutrition 100
Villages with AWW who make < 2 home visits per day 44
Supplementary Nutrition
Pre-school Education
Referrals
Antenatal Checkups
Immunization
Nutrition & Health Education
Growth Monitoring
No AWC Services
Access to Anganwadi Centre (%)
0 10 20 30 40 50 60 70 80 90 100
147
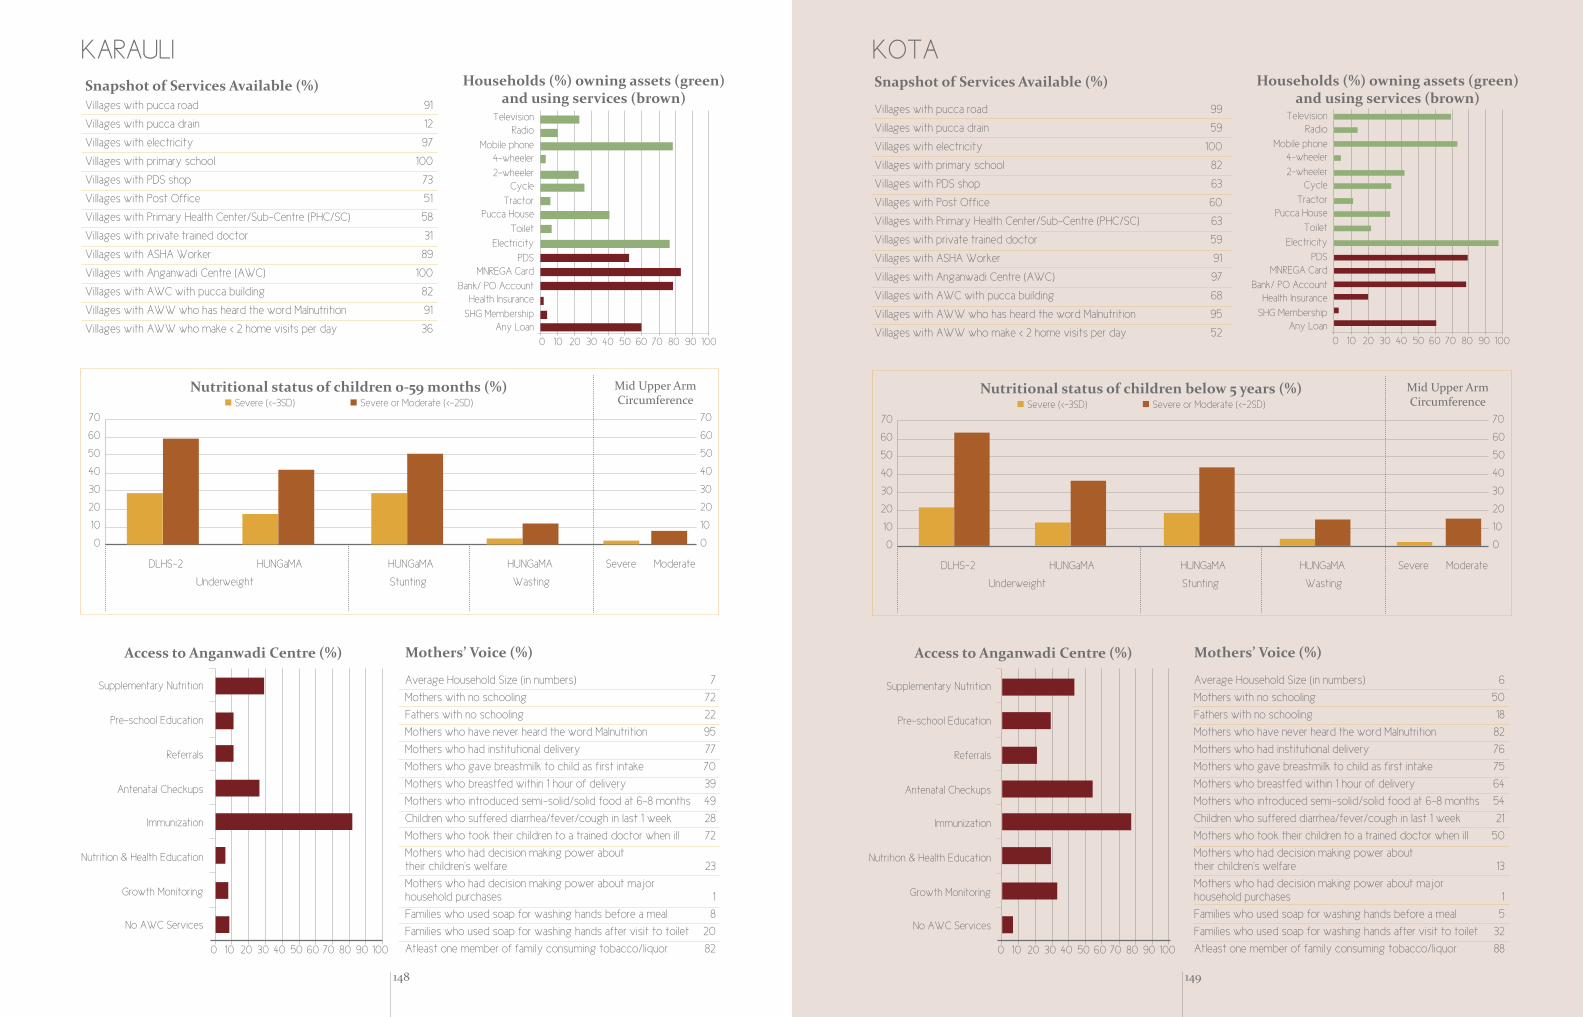
148
KARAULI
0 10 20 30 40 50 60 70 80 90 100
Mothers’ Voice (%)
Average Household Size (in numbers) 7
Mothers with no schooling 72
Fathers with no schooling 22
Mothers who have never heard the word Malnutrition 95
Mothers who had institutional delivery 77
Mothers who gave breastmilk to child as first intake 70
Mothers who breastfed within 1 hour of delivery 39
Mothers who introduced semi-solid/solid food at 6-8 months 49
Children who suffered diarrhea/fever/cough in last 1 week 28
Mothers who took their children to a trained doctor when ill 72
Mothers who had decision making power abouttheir children's welfare 23
Mothers who had decision making power about majorhousehold purchases 1
Families who used soap for washing hands before a meal 8
Families who used soap for washing hands after visit to toilet 20
Atleast one member of family consuming tobacco/liquor 82
Access to Anganwadi Centre (%)
Households (%) owning assets (green) and using services (brown)
0 10 20 30 40 50 60 70 80 90 100
TelevisionRadio
Mobile phone4-wheeler
2-wheelerCycle
TractorPucca House
Toilet
Electricity
PDSMNREGA Card
Bank/ PO AccountHealth Insurance
SHG MembershipAny Loan
Nutritional status of children 0-59 months (%)� Severe (<-3SD) � Severe or Moderate (<-2SD)
70
60
50
40
30
20
10
0
70
60
50
40
30
20
10
0
DLHS-2 HUNGaMA HUNGaMA HUNGaMA Severe Moderate
Underweight Stunting Wasting
Mid Upper ArmCircumference
Snapshot of Services Available (%)Villages with pucca road 91
Villages with pucca drain 12
Villages with electricity 97
Villages with primary school 100
Villages with PDS shop 73
Villages with Post Office 51
Villages with Primary Health Center/Sub-Centre (PHC/SC) 58
Villages with private trained doctor 31
Villages with ASHA Worker 89
Villages with Anganwadi Centre (AWC) 100
Villages with AWC with pucca building 82
Villages with AWW who has heard the word Malnutrition 91
Villages with AWW who make < 2 home visits per day 36
Supplementary Nutrition
Pre-school Education
Referrals
Antenatal Checkups
Immunization
Nutrition & Health Education
Growth Monitoring
No AWC Services
Mothers’ Voice (%)
Average Household Size (in numbers) 6
Mothers with no schooling 50
Fathers with no schooling 18
Mothers who have never heard the word Malnutrition 82
Mothers who had institutional delivery 76
Mothers who gave breastmilk to child as first intake 75
Mothers who breastfed within 1 hour of delivery 64
Mothers who introduced semi-solid/solid food at 6-8 months 54
Children who suffered diarrhea/fever/cough in last 1 week 21
Mothers who took their children to a trained doctor when ill 50
Mothers who had decision making power abouttheir children's welfare 13
Mothers who had decision making power about majorhousehold purchases 1
Families who used soap for washing hands before a meal 5
Families who used soap for washing hands after visit to toilet 32
Atleast one member of family consuming tobacco/liquor 88
Households (%) owning assets (green) and using services (brown)
Nutritional status of children below 5 years (%)� Severe (<-3SD) � Severe or Moderate (<-2SD)
70
60
50
40
30
20
10
0
70
60
50
40
30
20
10
0
DLHS-2 HUNGaMA HUNGaMA HUNGaMA Severe Moderate
Underweight Stunting Wasting
TelevisionRadio
Mobile phone4-wheeler
2-wheelerCycle
TractorPucca House
Toilet
Electricity
PDSMNREGA Card
Bank/ PO AccountHealth Insurance
SHG MembershipAny Loan
0 10 20 30 40 50 60 70 80 90 100
KOTA
Mid Upper ArmCircumference
Snapshot of Services Available (%)
Villages with pucca road 99
Villages with pucca drain 59
Villages with electricity 100
Villages with primary school 82
Villages with PDS shop 63
Villages with Post Office 60
Villages with Primary Health Center/Sub-Centre (PHC/SC) 63
Villages with private trained doctor 59
Villages with ASHA Worker 91
Villages with Anganwadi Centre (AWC) 97
Villages with AWC with pucca building 68
Villages with AWW who has heard the word Malnutrition 95
Villages with AWW who make < 2 home visits per day 52
Supplementary Nutrition
Pre-school Education
Referrals
Antenatal Checkups
Immunization
Nutrition & Health Education
Growth Monitoring
No AWC Services
Access to Anganwadi Centre (%)
0 10 20 30 40 50 60 70 80 90 100
149

Uttar Pradesh
Fighting Hunger & Malnutrition
151

152
AURAIYA
0 10 20 30 40 50 60 70 80 90 100
Mothers’ Voice (%)
Average Household Size (in numbers) 7
Mothers with no schooling 40
Fathers with no schooling 20
Mothers who have never heard the word Malnutrition 85
Mothers who had institutional delivery 34
Mothers who gave breastmilk to child as first intake 49
Mothers who breastfed within 1 hour of delivery 48
Mothers who introduced semi-solid/solid food at 6-8 months 82
Children who suffered diarrhea/fever/cough in last 1 week 26
Mothers who took their children to a trained doctor when ill 40
Mothers who had decision making power abouttheir children's welfare 93
Mothers who had decision making power about majorhousehold purchases 2
Families who used soap for washing hands before a meal 13
Families who used soap for washing hands after visit to toilet 23
Atleast one member of family consuming tobacco/liquor 82
Access to Anganwadi Centre (%)
Households (%) owning assets (green) and using services (brown)
0 10 20 30 40 50 60 70 80 90 100
TelevisionRadio
Mobile phone4-wheeler
2-wheelerCycle
TractorPucca House
Toilet
Electricity
PDSMNR EGA Card
Bank/ PO AccountHealth Insurance
SHG MembershipAny Loan
Nutritional status of children below 5 years (%)� Severe (<-3SD) � Severe or Moderate (<-2SD)
70
60
50
40
30
20
10
0
70
60
50
40
30
20
10
0
DLHS-2 HUNGaMA HUNGaMA HUNGaMA Severe Moderate
Underweight Stunting Wasting
Mid Upper ArmCircumference
Snapshot of Services Available (%)Villages with pucca road 91
Villages with pucca drain 66
Villages with electricity 86
Villages with primary school 100
Villages with PDS shop 72
Villages with Post Office 29
Villages with Primary Health Center/Sub-Centre (PHC/SC) 41
Villages with private trained doctor 33
Villages with ASHA Worker 96
Villages with Anganwadi Centre (AWC) 88
Villages with AWC with pucca building 84
Villages with AWW who has heard the word Malnutrition 100
Villages with AWW who make < 2 home visits per day 13
Supplementary Nutrition
Pre-school Education
Referrals
Antenatal Checkups
Immunization
Nutrition & Health Education
Growth Monitoring
No AWC Services
Mothers’ Voice (%)
Average Household Size (in numbers) 8
Mothers with no schooling 80
Fathers with no schooling 50
Mothers who have never heard the word Malnutrition 91
Mothers who had institutional delivery 23
Mothers who gave breastmilk to child as first intake 41
Mothers who breastfed within 1 hour of delivery 38
Mothers who introduced semi-solid/solid food at 6-8 months 69
Children who suffered diarrhea/fever/cough in last 1 week 40
Mothers who took their children to a trained doctor when ill 80
Mothers who had decision making power abouttheir children's welfare 74
Mothers who had decision making power about majorhousehold purchases 5
Families who used soap for washing hands before a meal 22
Families who used soap for washing hands after visit to toilet 16
Atleast one member of family consuming tobacco/liquor 89
Households (%) owning assets (green) and using services (brown)
Nutritional status of children o - 59 months (%)� Severe (<-3SD) � Severe or Moderate (<-2SD)
70
60
50
40
30
20
10
0
70
60
50
40
30
20
10
0
DLHS-2 HUNGaMA HUNGaMA HUNGaMA Severe Moderate
Underweight Stunting Wasting
TelevisionRadio
Mobile phone4-wheeler
2-wheelerCycle
TractorPucca House
Toilet
Electricity
PDSMNREGA Card
Bank/ PO AccountHealth Insurance
SHG MembershipAny Loan
0 10 20 30 40 50 60 70 80 90 100
BAHRAICH
Mid Upper ArmCircumference
Snapshot of Services Available (%)
Villages with pucca road 89
Villages with pucca drain 52
Villages with electricity 75
Villages with primary school 99
Villages with PDS shop 83
Villages with Post Office 50
Villages with Primary Health Center/Sub-Centre (PHC/SC) 40
Villages with private trained doctor 41
Villages with ASHA Worker 86
Villages with Anganwadi Centre (AWC) 99
Villages with AWC with pucca building 67
Villages with AWW who has heard the word Malnutrition 91
Villages with AWW who make < 2 home visits per day 53
Supplementary Nutrition
Pre-school Education
Referrals
Antenatal Checkups
Immunization
Nutrition & Health Education
Growth Monitoring
No AWC Services
Access to Anganwadi Centre (%)
0 10 20 30 40 50 60 70 80 90 100
153

154
BALRAMPUR
0 10 20 30 40 50 60 70 80 90 100
Mothers’ Voice (%)
Average Household Size (in numbers) 9
Mothers with no schooling 79
Fathers with no schooling 39
Mothers who have never heard the word Malnutrition 95
Mothers who had institutional delivery 20
Mothers who gave breastmilk to child as first intake 32
Mothers who breastfed within 1 hour of delivery 28
Mothers who introduced semi-solid/solid food at 6-8 months 55
Children who suffered diarrhea/fever/cough in last 1 week 47
Mothers who took their children to a trained doctor when ill 79
Mothers who had decision making power abouttheir children's welfare 36
Mothers who had decision making power about majorhousehold purchases 1
Families who used soap for washing hands before a meal 4
Families who used soap for washing hands after visit to toilet 7
Atleast one member of family consuming tobacco/liquor 89
Access to Anganwadi Centre (%)
Households (%) owning assets (green) and using services (brown)
0 10 20 30 40 50 60 70 80 90 100
TelevisionRadio
Mobile phone4-wheeler
2-wheelerCycle
TractorPucca House
Toilet
Electricity
PDSMNREGA Card
Bank/ PO AccountHealth Insurance
SHG MembershipAny Loan
Nutritional status of children0-59 months (%)� Severe (<-3SD) � Severe or Moderate (<-2SD)
70
60
50
40
30
20
10
0
70
60
50
40
30
20
10
0
DLHS-2 HUNGaMA HUNGaMA HUNGaMA Severe Moderate
Underweight Stunting Wasting
Mid Upper ArmCircumference
Snapshot of Services Available (%)Villages with pucca road 92
Villages with pucca drain 60
Villages with electricity 85
Villages with primary school 93
Villages with PDS shop 53
Villages with Post Office 20
Villages with Primary Health Center/Sub-Centre (PHC/SC) 32
Villages with private trained doctor 42
Villages with ASHA Worker 94
Villages with Anganwadi Centre (AWC) 96
Villages with AWC with pucca building 75
Villages with AWW who has heard the word Malnutrition 93
Villages with AWW who make < 2 home visits per day 45
Supplementary Nutrition
Pre-school Education
Referrals
Antenatal Checkups
Immunization
Nutrition & Health Education
Growth Monitoring
No AWC Services
Mothers’ Voice (%)
Average Household Size (in numbers) 7
Mothers with no schooling 60
Fathers with no schooling 29
Mothers who have never heard the word Malnutrition 97
Mothers who had institutional delivery 51
Mothers who gave breastmilk to child as first intake 77
Mothers who breastfed within 1 hour of delivery 61
Mothers who introduced semi-solid/solid food at 6-8 months 80
Children who suffered diarrhea/fever/cough in last 1 week 22
Mothers who took their children to a trained doctor when ill 60
Mothers who had decision making power abouttheir children's welfare 76
Mothers who had decision making power about majorhousehold purchases 1
Families who used soap for washing hands before a meal 0
Families who used soap for washing hands after visit to toilet 3
Atleast one member of family consuming tobacco/liquor 96
Households (%) owning assets (green) and using services (brown)
Nutritional status of children 0-59 months (%)� Severe (<-3SD) � Severe or Moderate (<-2SD)
70
60
50
40
30
20
10
0
70
60
50
40
30
20
10
0
DLHS-2 HUNGaMA HUNGaMA HUNGaMA Severe Moderate
Underweight Stunting Wasting
TelevisionRadio
Mobile phone4-wheeler
2-wheelerCycle
TractorPucca House
Toilet
Electricity
PDSMNREGA Card
Bank/ PO AccountHealth Insurance
SHG MembershipAny Loan
0 10 20 30 40 50 60 70 80 90 100
BANDA
Mid Upper ArmCircumference
Snapshot of Services Available (%)
Villages with pucca road 95
Villages with pucca drain 74
Villages with electricity 89
Villages with primary school 100
Villages with PDS shop 84
Villages with Post Office 67
Villages with Primary Health Center/Sub-Centre (PHC/SC) 59
Villages with private trained doctor 3
Villages with ASHA Worker 98
Villages with Anganwadi Centre (AWC) 100
Villages with AWC with pucca building 93
Villages with AWW who has heard the word Malnutrition 100
Villages with AWW who make < 2 home visits per day 83
Supplementary Nutrition
Pre-school Education
Referrals
Antenatal Checkups
Immunization
Nutrition & Health Education
Growth Monitoring
No AWC Services
Access to Anganwadi Centre (%)
0 10 20 30 40 50 60 70 80 90 100
155

156
BARABANKI
0 10 20 30 40 50 60 70 80 90 100
Mothers’ Voice (%)
Average Household Size (in numbers) 7
Mothers with no schooling 56
Fathers with no schooling 23
Mothers who have never heard the word Malnutrition 77
Mothers who had institutional delivery 54
Mothers who gave breastmilk to child as first intake 59
Mothers who breastfed within 1 hour of delivery 57
Mothers who introduced semi-solid/solid food at 6-8 months 75
Children who suffered diarrhea/fever/cough in last 1 week 40
Mothers who took their children to a trained doctor when ill 56
Mothers who had decision making power abouttheir children's welfare 91
Mothers who had decision making power about majorhousehold purchases 3
Families who used soap for washing hands before a meal 17
Families who used soap for washing hands after visit to toilet 26
Atleast one member of family consuming tobacco/liquor 86
Access to Anganwadi Centre (%)
Households (%) owning assets (green) and using services (brown)
0 10 20 30 40 50 60 70 80 90 100
TelevisionRadio
Mobile phone4-wheeler
2-wheelerCycle
TractorPucca House
Toilet
Electricity
PDSMNREGA Card
Bank/ PO AccountHealth Insurance
SHG MembershipAny Loan
Nutritional status of children 0-59 months (%)� Severe (<-3SD) � Severe or Moderate (<-2SD)
70
60
50
40
30
20
10
0
70
60
50
40
30
20
10
0
DLHS-2 HUNGaMA HUNGaMA HUNGaMA Severe Moderate
Underweight Stunting Wasting
Mid Upper ArmCircumference
Snapshot of Services Available (%)Villages with pucca road 94
Villages with pucca drain 92
Villages with electricity 96
Villages with primary school 89
Villages with PDS shop 73
Villages with Post Office 46
Villages with Primary Health Center/Sub-Centre (PHC/SC) 40
Villages with private trained doctor 18
Villages with ASHA Worker 94
Villages with Anganwadi Centre (AWC) 100
Villages with AWC with pucca building 80
Villages with AWW who has heard the word Malnutrition 91
Villages with AWW who make < 2 home visits per day 43
Supplementary Nutrition
Pre-school Education
Referrals
Antenatal Checkups
Immunization
Nutrition & Health Education
Growth Monitoring
No AWC Services
Mothers’ Voice (%)
Average Household Size (in numbers) 7
Mothers with no schooling 80
Fathers with no schooling 47
Mothers who have never heard the word Malnutrition 98
Mothers who had institutional delivery 22
Mothers who gave breastmilk to child as first intake 24
Mothers who breastfed within 1 hour of delivery 23
Mothers who introduced semi-solid/solid food at 6-8 months 58
Children who suffered diarrhea/fever/cough in last 1 week 53
Mothers who took their children to a trained doctor when ill 80
Mothers who had decision making power abouttheir children's welfare 68
Mothers who had decision making power about majorhousehold purchases 6
Families who used soap for washing hands before a meal 16
Families who used soap for washing hands after visit to toilet 38
Atleast one member of family consuming tobacco/liquor 71
Households (%) owning assets (green) and using services (brown)
Nutritional status of children 0-59 months (%)� Severe (<-3SD) � Severe or Moderate (<-2SD)
70
60
50
40
30
20
10
0
70
60
50
40
30
20
10
0
DLHS-2 HUNGaMA HUNGaMA HUNGaMA Severe Moderate
Underweight Stunting Wasting
TelevisionRadio
Mobile phone4-wheeler
2-wheelerCycle
TractorPucca House
Toilet
Electricity
PDSMNREGA Card
Bank/ PO AccountHealth Insurance
SHG MembershipAny Loan
0 10 20 30 40 50 60 70 80 90 100
BADAUN
Mid Upper ArmCircumference
Snapshot of Services Available (%)
Villages with pucca road 100
Villages with pucca drain 53
Villages with electricity 94
Villages with primary school 100
Villages with PDS shop 93
Villages with Post Office 46
Villages with Primary Health Center/Sub-Centre (PHC/SC) 38
Villages with private trained doctor 26
Villages with ASHA Worker 69
Villages with Anganwadi Centre (AWC) 93
Villages with AWC with pucca building 76
Villages with AWW who has heard the word Malnutrition 95
Villages with AWW who make < 2 home visits per day 58
Supplementary Nutrition
Pre-school Education
Referrals
Antenatal Checkups
Immunization
Nutrition & Health Education
Growth Monitoring
No AWC Services
Access to Anganwadi Centre (%)
0 10 20 30 40 50 60 70 80 90 100
157

158
BULANDSHAHAR
0 10 20 30 40 50 60 70 80 90 100
Mothers’ Voice (%)
Average Household Size (in numbers) 8
Mothers with no schooling 53
Fathers with no schooling 22
Mothers who have never heard the word Malnutrition 90
Mothers who had institutional delivery 36
Mothers who gave breastmilk to child as first intake 34
Mothers who breastfed within 1 hour of delivery 28
Mothers who introduced semi-solid/solid food at 6-8 months 73
Children who suffered diarrhea/fever/cough in last 1 week 26
Mothers who took their children to a trained doctor when ill 53
Mothers who had decision making power abouttheir children's welfare 65
Mothers who had decision making power about majorhousehold purchases 4
Families who used soap for washing hands before a meal 23
Families who used soap for washing hands after visit to toilet 25
Atleast one member of family consuming tobacco/liquor 63
Access to Anganwadi Centre (%)
Households (%) owning assets (green) and using services (brown)
0 10 20 30 40 50 60 70 80 90 100
TelevisionRadio
Mobile phone4-wheeler
2-wheelerCycle
TractorPucca House
Toilet
Electricity
PDSMNREGA Card
Bank/ PO AccountHealth Insurance
SHG MembershipAny Loan
Nutritional status of children 0-59 months (%)� Severe (<-3SD) � Severe or Moderate (<-2SD)
70
60
50
40
30
20
10
0
70
60
50
40
30
20
10
0
DLHS-2 HUNGaMA HUNGaMA HUNGaMA Severe Moderate
Underweight Stunting Wasting
Mid Upper ArmCircumference
Snapshot of Services Available (%)Villages with pucca road 100
Villages with pucca drain 78
Villages with electricity 100
Villages with primary school 100
Villages with PDS shop 73
Villages with Post Office 52
Villages with Primary Health Center/Sub-Centre (PHC/SC) 33
Villages with private trained doctor 36
Villages with ASHA Worker 92
Villages with Anganwadi Centre (AWC) 92
Villages with AWC with pucca building 88
Villages with AWW who has heard the word Malnutrition 100
Villages with AWW who make < 2 home visits per day 63
Supplementary Nutrition
Pre-school Education
Referrals
Antenatal Checkups
Immunization
Nutrition & Health Education
Growth Monitoring
No AWC Services
Mothers’ Voice (%)
Average Household Size (in numbers) 8
Mothers with no schooling 67
Fathers with no schooling 37
Mothers who have never heard the word Malnutrition 96
Mothers who had institutional delivery 40
Mothers who gave breastmilk to child as first intake 42
Mothers who breastfed within 1 hour of delivery 42
Mothers who introduced semi-solid/solid food at 6-8 months 69
Children who suffered diarrhea/fever/cough in last 1 week 39
Mothers who took their children to a trained doctor when ill 67
Mothers who had decision making power abouttheir children's welfare 73
Mothers who had decision making power about majorhousehold purchases 1
Families who used soap for washing hands before a meal 8
Families who used soap for washing hands after visit to toilet 19
Atleast one member of family consuming tobacco/liquor 94
Households (%) owning assets (green) and using services (brown)
Nutritional status of children 0-59 months (%)� Severe (<-3SD) � Severe or Moderate (<-2SD)
70
60
50
40
30
20
10
0
70
60
50
40
30
20
10
0
DLHS-2 HUNGaMA HUNGaMA HUNGaMA Severe Moderate
Underweight Stunting Wasting
TelevisionRadio
Mobile phone4-wheeler
2-wheelerCycle
TractorPucca House
Toilet
Electricity
PDSMNREGA Card
Bank/ PO AccountHealth Insurance
SHG MembershipAny Loan
0 10 20 30 40 50 60 70 80 90 100
CHITRAKOOT
Mid Upper ArmCircumference
Snapshot of Services Available (%)
Villages with pucca road 88
Villages with pucca drain 49
Villages with electricity 94
Villages with primary school 98
Villages with PDS shop 88
Villages with Post Office 34
Villages with Primary Health Center/Sub-Centre (PHC/SC) 30
Villages with private trained doctor 15
Villages with ASHA Worker 91
Villages with Anganwadi Centre (AWC) 98
Villages with AWC with pucca building 77
Villages with AWW who has heard the word Malnutrition 100
Villages with AWW who make < 2 home visits per day 82
Supplementary Nutrition
Pre-school Education
Referrals
Antenatal Checkups
Immunization
Nutrition & Health Education
Growth Monitoring
No AWC Services
Access to Anganwadi Centre (%)
0 10 20 30 40 50 60 70 80 90 100
159

160
ETAH
0 10 20 30 40 50 60 70 80 90 100
Mothers’ Voice (%)
Average Household Size (in numbers) 8
Mothers with no schooling 58
Fathers with no schooling 24
Mothers who have never heard the word Malnutrition 93
Mothers who had institutional delivery 25
Mothers who gave breastmilk to child as first intake 20
Mothers who breastfed within 1 hour of delivery 17
Mothers who introduced semi-solid/solid food at 6-8 months 73
Children who suffered diarrhea/fever/cough in last 1 week 41
Mothers who took their children to a trained doctor when ill 58
Mothers who had decision making power abouttheir children's welfare 79
Mothers who had decision making power about majorhousehold purchases 4
Families who used soap for washing hands before a meal 14
Families who used soap for washing hands after visit to toilet 22
Atleast one member of family consuming tobacco/liquor 69
Access to Anganwadi Centre (%)
Households (%) owning assets (green) and using services (brown)
0 10 20 30 40 50 60 70 80 90 100
TelevisionRadio
Mobile phone4-wheeler
2-wheelerCycle
TractorPucca House
Toilet
Electricity
PDSMNREGA Card
Bank/ PO AccountHealth Insurance
SHG MembershipAny Loan
Nutritional status of children 0-59 months (%)� Severe (<-3SD) � Severe or Moderate (<-2SD)
70
60
50
40
30
20
10
0
70
60
50
40
30
20
10
0
DLHS-2 HUNGaMA HUNGaMA HUNGaMA Severe Moderate
Underweight Stunting Wasting
Mid Upper ArmCircumference
Snapshot of Services Available (%)Villages with pucca road 91
Villages with pucca drain 53
Villages with electricity 93
Villages with primary school 100
Villages with PDS shop 75
Villages with Post Office 42
Villages with Primary Health Center/Sub-Centre (PHC/SC) 42
Villages with private trained doctor 23
Villages with ASHA Worker 84
Villages with Anganwadi Centre (AWC) 100
Villages with AWC with pucca building 88
Villages with AWW who has heard the word Malnutrition 93
Villages with AWW who make < 2 home visits per day 50
Supplementary Nutrition
Pre-school Education
Referrals
Antenatal Checkups
Immunization
Nutrition & Health Education
Growth Monitoring
No AWC Services
Mothers’ Voice (%)
Average Household Size (in numbers) 8
Mothers with no schooling 57
Fathers with no schooling 28
Mothers who have never heard the word Malnutrition 94
Mothers who had institutional delivery 22
Mothers who gave breastmilk to child as first intake 19
Mothers who breastfed within 1 hour of delivery 17
Mothers who introduced semi-solid/solid food at 6-8 months 64
Children who suffered diarrhea/fever/cough in last 1 week 32
Mothers who took their children to a trained doctor when ill 57
Mothers who had decision making power abouttheir children's welfare 67
Mothers who had decision making power about majorhousehold purchases 5
Families who used soap for washing hands before a meal 9
Families who used soap for washing hands after visit to toilet 28
Atleast one member of family consuming tobacco/liquor 62
Households (%) owning assets (green) and using services (brown)
Nutritional status of children 0-59 months (%)� Severe (<-3SD) � Severe or Moderate (<-2SD)
70
60
50
40
30
20
10
0
70
60
50
40
30
20
10
0
DLHS-2 HUNGaMA HUNGaMA HUNGaMA Severe Moderate
Underweight Stunting Wasting
TelevisionRadio
Mobile phone4-wheeler
2-wheelerCycle
TractorPucca House
Toilet
Electricity
PDSMNREGA Card
Bank/ PO AccountHealth Insurance
SHG MembershipAny Loan
0 10 20 30 40 50 60 70 80 90 100
FARRUKHABAD
Mid Upper ArmCircumference
Snapshot of Services Available (%)
Villages with pucca road 100
Villages with pucca drain 86
Villages with electricity 100
Villages with primary school 93
Villages with PDS shop 72
Villages with Post Office 28
Villages with Primary Health Center/Sub-Centre (PHC/SC) 32
Villages with private trained doctor 17
Villages with ASHA Worker 78
Villages with Anganwadi Centre (AWC) 90
Villages with AWC with pucca building 96
Villages with AWW who has heard the word Malnutrition 100
Villages with AWW who make < 2 home visits per day 46
Supplementary Nutrition
Pre-school Education
Referrals
Antenatal Checkups
Immunization
Nutrition & Health Education
Growth Monitoring
No AWC Services
Access to Anganwadi Centre (%)
0 10 20 30 40 50 60 70 80 90 100
161

162
FATEHPUR
0 10 20 30 40 50 60 70 80 90 100
Mothers’ Voice (%)
Average Household Size (in numbers) 7
Mothers with no schooling 49
Fathers with no schooling 30
Mothers who have never heard the word Malnutrition 90
Mothers who had institutional delivery 37
Mothers who gave breastmilk to child as first intake 38
Mothers who breastfed within 1 hour of delivery 33
Mothers who introduced semi-solid/solid food at 6-8 months 77
Children who suffered diarrhea/fever/cough in last 1 week 32
Mothers who took their children to a trained doctor when ill 49
Mothers who had decision making power abouttheir children's welfare 47
Mothers who had decision making power about majorhousehold purchases 4
Families who used soap for washing hands before a meal 15
Families who used soap for washing hands after visit to toilet 18
Atleast one member of family consuming tobacco/liquor 88
Access to Anganwadi Centre (%)
Households (%) owning assets (green) and using services (brown)
0 10 20 30 40 50 60 70 80 90 100
TelevisionRadio
Mobile phone4-wheeler
2-wheelerCycle
TractorPucca House
Toilet
Electricity
PDSMNREGA Card
Bank/ PO AccountHealth Insurance
SHG MembershipAny Loan
Nutritional status of children 0-59 months (%)� Severe (<-3SD) � Severe or Moderate (<-2SD)
70
60
50
40
30
20
10
0
70
60
50
40
30
20
10
0
DLHS-2 HUNGaMA HUNGaMA HUNGaMA Severe Moderate
Underweight Stunting Wasting
Mid Upper ArmCircumference
Snapshot of Services Available (%)Villages with pucca road 87
Villages with pucca drain 73
Villages with electricity 88
Villages with primary school 98
Villages with PDS shop 75
Villages with Post Office 37
Villages with Primary Health Center/Sub-Centre (PHC/SC) 31
Villages with private trained doctor 13
Villages with ASHA Worker 98
Villages with Anganwadi Centre (AWC) 98
Villages with AWC with pucca building 71
Villages with AWW who has heard the word Malnutrition 100
Villages with AWW who make < 2 home visits per day 55
Supplementary Nutrition
Pre-school Education
Referrals
Antenatal Checkups
Immunization
Nutrition & Health Education
Growth Monitoring
No AWC Services
Mothers’ Voice (%)
Average Household Size (in numbers) 7
Mothers with no schooling 51
Fathers with no schooling 21
Mothers who have never heard the word Malnutrition 97
Mothers who had institutional delivery 36
Mothers who gave breastmilk to child as first intake 23
Mothers who breastfed within 1 hour of delivery 15
Mothers who introduced semi-solid/solid food at 6-8 months 47
Children who suffered diarrhea/fever/cough in last 1 week 24
Mothers who took their children to a trained doctor when ill 51
Mothers who had decision making power abouttheir children's welfare 65
Mothers who had decision making power about majorhousehold purchases 0
Families who used soap for washing hands before a meal 6
Families who used soap for washing hands after visit to toilet 9
Atleast one member of family consuming tobacco/liquor 71
Households (%) owning assets (green) and using services (brown)
Nutritional status of children below 5 years (%)� Severe (<-3SD) � Severe or Moderate (<-2SD)
70
60
50
40
30
20
10
0
70
60
50
40
30
20
10
0
DLHS-2 HUNGaMA HUNGaMA HUNGaMA Severe Moderate
Underweight Stunting Wasting
TelevisionRadio
Mobile phone4-wheeler
2-wheelerCycle
TractorPucca House
Toilet
Electricity
PDSMNREGA Card
Bank/ PO AccountHealth Insurance
SHG MembershipAny Loan
0 10 20 30 40 50 60 70 80 90 100
FIROZABAD
Mid Upper ArmCircumference
Snapshot of Services Available (%)
Villages with pucca road 99
Villages with pucca drain 61
Villages with electricity 95
Villages with primary school 90
Villages with PDS shop 60
Villages with Post Office 32
Villages with Primary Health Center/Sub-Centre (PHC/SC) 23
Villages with private trained doctor 22
Villages with ASHA Worker 86
Villages with Anganwadi Centre (AWC) 95
Villages with AWC with pucca building 90
Villages with AWW who has heard the word Malnutrition 90
Villages with AWW who make < 2 home visits per day 37
Supplementary Nutrition
Pre-school Education
Referrals
Antenatal Checkups
Immunization
Nutrition & Health Education
Growth Monitoring
No AWC Services
Access to Anganwadi Centre (%)
0 10 20 30 40 50 60 70 80 90 100
163

164
GAUTAM BUDDHA NAGAR
0 10 20 30 40 50 60 70 80 90 100
Mothers’ Voice (%)
Average Household Size (in numbers) 8
Mothers with no schooling 43
Fathers with no schooling 16
Mothers who have never heard the word Malnutrition 78
Mothers who had institutional delivery 35
Mothers who gave breastmilk to child as first intake 30
Mothers who breastfed within 1 hour of delivery 17
Mothers who introduced semi-solid/solid food at 6-8 months 62
Children who suffered diarrhea/fever/cough in last 1 week 31
Mothers who took their children to a trained doctor when ill 43
Mothers who had decision making power abouttheir children's welfare 53
Mothers who had decision making power about majorhousehold purchases 1
Families who used soap for washing hands before a meal 17
Families who used soap for washing hands after visit to toilet 43
Atleast one member of family consuming tobacco/liquor 65
Access to Anganwadi Centre (%)
Households (%) owning assets (green) and using services (brown)
0 10 20 30 40 50 60 70 80 90 100
TelevisionRadio
Mobile phone4-wheeler
2-wheelerCycle
TractorPucca House
Toilet
Electricity
PDSMNREGA Card
Bank/ PO AccountHealth Insurance
SHG MembershipAny Loan
Nutritional status of children below 5 years (%)� Severe (<-3SD) � Severe or Moderate (<-2SD)
70
60
50
40
30
20
10
0
70
60
50
40
30
20
10
0
DLHS-2 HUNGaMA HUNGaMA HUNGaMA Severe Moderate
Underweight Stunting Wasting
Mid Upper ArmCircumference
Snapshot of Services Available (%)Villages with pucca road 100
Villages with pucca drain 46
Villages with electricity 100
Villages with primary school 98
Villages with PDS shop 94
Villages with Post Office 41
Villages with Primary Health Center/Sub-Centre (PHC/SC) 42
Villages with private trained doctor 51
Villages with ASHA Worker 94
Villages with Anganwadi Centre (AWC) 100
Villages with AWC with pucca building 93
Villages with AWW who has heard the word Malnutrition 100
Villages with AWW who make < 2 home visits per day 28
Supplementary Nutrition
Pre-school Education
Referrals
Antenatal Checkups
Immunization
Nutrition & Health Education
Growth Monitoring
No AWC Services
Mothers’ Voice (%)
Average Household Size (in numbers) 8
Mothers with no schooling 68
Fathers with no schooling 35
Mothers who have never heard the word Malnutrition 89
Mothers who had institutional delivery 30
Mothers who gave breastmilk to child as first intake 27
Mothers who breastfed within 1 hour of delivery 27
Mothers who introduced semi-solid/solid food at 6-8 months 51
Children who suffered diarrhea/fever/cough in last 1 week 25
Mothers who took their children to a trained doctor when ill 68
Mothers who had decision making power abouttheir children's welfare 51
Mothers who had decision making power about majorhousehold purchases 5
Families who used soap for washing hands before a meal 23
Families who used soap for washing hands after visit to toilet 32
Atleast one member of family consuming tobacco/liquor 83
Households (%) owning assets (green) and using services (brown)
Nutritional status of children 0-59 months (%)� Severe (<-3SD) � Severe or Moderate (<-2SD)
70
60
50
40
30
20
10
0
70
60
50
40
30
20
10
0
DLHS-2 HUNGaMA HUNGaMA HUNGaMA Severe Moderate
Underweight Stunting Wasting
TelevisionRadio
Mobile phone4-wheeler
2-wheelerCycle
TractorPucca House
Toilet
Electricity
PDSMNREGA Card
Bank/ PO AccountHealth Insurance
SHG MembershipAny Loan
0 10 20 30 40 50 60 70 80 90 100
GONDA
Mid Upper ArmCircumference
Snapshot of Services Available (%)
Villages with pucca road 63
Villages with pucca drain 36
Villages with electricity 76
Villages with primary school 98
Villages with PDS shop 84
Villages with Post Office 47
Villages with Primary Health Center/Sub-Centre (PHC/SC) 22
Villages with private trained doctor 26
Villages with ASHA Worker 89
Villages with Anganwadi Centre (AWC) 89
Villages with AWC with pucca building 63
Villages with AWW who has heard the word Malnutrition 100
Villages with AWW who make < 2 home visits per day 63
Supplementary Nutrition
Pre-school Education
Referrals
Antenatal Checkups
Immunization
Nutrition & Health Education
Growth Monitoring
No AWC Services
Access to Anganwadi Centre (%)
0 10 20 30 40 50 60 70 80 90 100
165

166
HARDOI
0 10 20 30 40 50 60 70 80 90 100
Mothers’ Voice (%)
Average Household Size (in numbers) 7
Mothers with no schooling 66
Fathers with no schooling 40
Mothers who have never heard the word Malnutrition 91
Mothers who had institutional delivery 23
Mothers who gave breastmilk to child as first intake 72
Mothers who breastfed within 1 hour of delivery 64
Mothers who introduced semi-solid/solid food at 6-8 months 39
Children who suffered diarrhea/fever/cough in last 1 week 26
Mothers who took their children to a trained doctor when ill 66
Mothers who had decision making power abouttheir children's welfare 83
Mothers who had decision making power about majorhousehold purchases 12
Families who used soap for washing hands before a meal 7
Families who used soap for washing hands after visit to toilet 13
Atleast one member of family consuming tobacco/liquor 91
Access to Anganwadi Centre (%)
Households (%) owning assets (green) and using services (brown)
0 10 20 30 40 50 60 70 80 90 100
TelevisionRadio
Mobile phone4-wheeler
2-wheelerCycle
TractorPucca House
Toilet
Electricity
PDSMNREGA Card
Bank/ PO AccountHealth Insurance
SHG MembershipAny Loan
Nutritional status of children 0-59 months (%)� Severe (<-3SD) � Severe or Moderate (<-2SD)
70
60
50
40
30
20
10
0
70
60
50
40
30
20
10
0
DLHS-2 HUNGaMA HUNGaMA HUNGaMA Severe Moderate
Underweight Stunting Wasting
Mid Upper ArmCircumference
Snapshot of Services Available (%)Villages with pucca road 88
Villages with pucca drain 90
Villages with electricity 96
Villages with primary school 97
Villages with PDS shop 76
Villages with Post Office 35
Villages with Primary Health Center/Sub-Centre (PHC/SC) 17
Villages with private trained doctor 27
Villages with ASHA Worker 96
Villages with Anganwadi Centre (AWC) 97
Villages with AWC with pucca building 59
Villages with AWW who has heard the word Malnutrition 100
Villages with AWW who make < 2 home visits per day 44
Supplementary Nutrition
Pre-school Education
Referrals
Antenatal Checkups
Immunization
Nutrition & Health Education
Growth Monitoring
No AWC Services
Mothers’ Voice (%)
Average Household Size (in numbers) 8
Mothers with no schooling 53
Fathers with no schooling 16
Mothers who have never heard the word Malnutrition 92
Mothers who had institutional delivery 45
Mothers who gave breastmilk to child as first intake 33
Mothers who breastfed within 1 hour of delivery 24
Mothers who introduced semi-solid/solid food at 6-8 months 73
Children who suffered diarrhea/fever/cough in last 1 week 23
Mothers who took their children to a trained doctor when ill 53
Mothers who had decision making power abouttheir children's welfare 97
Mothers who had decision making power about majorhousehold purchases 1
Families who used soap for washing hands before a meal 14
Families who used soap for washing hands after visit to toilet 47
Atleast one member of family consuming tobacco/liquor 55
Households (%) owning assets (green) and using services (brown)
Nutritional status of children 0-59 months (%)� Severe (<-3SD) � Severe or Moderate (<-2SD)
70
60
50
40
30
20
10
0
70
60
50
40
30
20
10
0
DLHS-2 HUNGaMA HUNGaMA HUNGaMA Severe Moderate
Underweight Stunting Wasting
TelevisionRadio
Mobile phone4-wheeler
2-wheelerCycle
TractorPucca House
Toilet
Electricity
PDSMNREGA Card
Bank/ PO AccountHealth Insurance
SHG MembershipAny Loan
0 10 20 30 40 50 60 70 80 90 100
HATHRAS
Mid Upper ArmCircumference
Snapshot of Services Available (%)
Villages with pucca road 100
Villages with pucca drain 72
Villages with electricity 93
Villages with primary school 100
Villages with PDS shop 80
Villages with Post Office 26
Villages with Primary Health Center/Sub-Centre (PHC/SC) 42
Villages with private trained doctor 33
Villages with ASHA Worker 97
Villages with Anganwadi Centre (AWC) 94
Villages with AWC with pucca building 100
Villages with AWW who has heard the word Malnutrition 99
Villages with AWW who make < 2 home visits per day 75
Supplementary Nutrition
Pre-school Education
Referrals
Antenatal Checkups
Immunization
Nutrition & Health Education
Growth Monitoring
No AWC Services
Access to Anganwadi Centre (%)
0 10 20 30 40 50 60 70 80 90 100
167

168
JALAUN
0 10 20 30 40 50 60 70 80 90 100
Mothers’ Voice (%)
Average Household Size (in numbers) 9
Mothers with no schooling 46
Fathers with no schooling 15
Mothers who have never heard the word Malnutrition 93
Mothers who had institutional delivery 49
Mothers who gave breastmilk to child as first intake 51
Mothers who breastfed within 1 hour of delivery 51
Mothers who introduced semi-solid/solid food at 6-8 months 62
Children who suffered diarrhea/fever/cough in last 1 week 32
Mothers who took their children to a trained doctor when ill 46
Mothers who had decision making power abouttheir children's welfare 82
Mothers who had decision making power about majorhousehold purchases 1
Families who used soap for washing hands before a meal 4
Families who used soap for washing hands after visit to toilet 26
Atleast one member of family consuming tobacco/liquor 88
Access to Anganwadi Centre (%)
Households (%) owning assets (green) and using services (brown)
0 10 20 30 40 50 60 70 80 90 100
TelevisionRadio
Mobile phone4-wheeler
2-wheelerCycle
TractorPucca House
Toilet
Electricity
PDSMNREGA Card
Bank/ PO AccountHealth Insurance
SHG MembershipAny Loan
Nutritional status of children 0-59 months (%)� Severe (<-3SD) � Severe or Moderate (<-2SD)
70
60
50
40
30
20
10
0
70
60
50
40
30
20
10
0
DLHS-2 HUNGaMA HUNGaMA HUNGaMA Severe Moderate
Underweight Stunting Wasting
Mid Upper ArmCircumference
Snapshot of Services Available (%)Villages with pucca road 94
Villages with pucca drain 83
Villages with electricity 100
Villages with primary school 100
Villages with PDS shop 88
Villages with Post Office 37
Villages with Primary Health Center/Sub-Centre (PHC/SC) 42
Villages with private trained doctor 21
Villages with ASHA Worker 96
Villages with Anganwadi Centre (AWC) 97
Villages with AWC with pucca building 89
Villages with AWW who has heard the word Malnutrition 100
Villages with AWW who make < 2 home visits per day 26
Supplementary Nutrition
Pre-school Education
Referrals
Antenatal Checkups
Immunization
Nutrition & Health Education
Growth Monitoring
No AWC Services
Mothers’ Voice (%)
Average Household Size (in numbers) 7
Mothers with no schooling 48
Fathers with no schooling 21
Mothers who have never heard the word Malnutrition 97
Mothers who had institutional delivery 59
Mothers who gave breastmilk to child as first intake 61
Mothers who breastfed within 1 hour of delivery 43
Mothers who introduced semi-solid/solid food at 6-8 months 73
Children who suffered diarrhea/fever/cough in last 1 week 28
Mothers who took their children to a trained doctor when ill 48
Mothers who had decision making power abouttheir children's welfare 94
Mothers who had decision making power about majorhousehold purchases 2
Families who used soap for washing hands before a meal 6
Families who used soap for washing hands after visit to toilet 7
Atleast one member of family consuming tobacco/liquor 77
Households (%) owning assets (green) and using services (brown)
Nutritional status of children 0-59 months (%)� Severe (<-3SD) � Severe or Moderate (<-2SD)
70
60
50
40
30
20
10
0
70
60
50
40
30
20
10
0
DLHS-2 HUNGaMA HUNGaMA HUNGaMA Severe Moderate
Underweight Stunting Wasting
TelevisionRadio
Mobile phone4-wheeler
2-wheelerCycle
TractorPucca House
Toilet
Electricity
PDSMNREGA Card
Bank/ PO AccountHealth Insurance
SHG MembershipAny Loan
0 10 20 30 40 50 60 70 80 90 100
JHANSI
Mid Upper ArmCircumference
Snapshot of Services Available (%)
Villages with pucca road 100
Villages with pucca drain 76
Villages with electricity 97
Villages with primary school 100
Villages with PDS shop 91
Villages with Post Office 34
Villages with Primary Health Center/Sub-Centre (PHC/SC) 65
Villages with private trained doctor 17
Villages with ASHA Worker 90
Villages with Anganwadi Centre (AWC) 98
Villages with AWC with pucca building 96
Villages with AWW who has heard the word Malnutrition 98
Villages with AWW who make < 2 home visits per day 84
Supplementary Nutrition
Pre-school Education
Referrals
Antenatal Checkups
Immunization
Nutrition & Health Education
Growth Monitoring
No AWC Services
Access to Anganwadi Centre (%)
0 10 20 30 40 50 60 70 80 90 100
169

170
JYOTIBA PHULE NAGAR
0 10 20 30 40 50 60 70 80 90 100
Mothers’ Voice (%)
Average Household Size (in numbers) 7
Mothers with no schooling 65
Fathers with no schooling 34
Mothers who have never heard the word Malnutrition 91
Mothers who had institutional delivery 60
Mothers who gave breastmilk to child as first intake 42
Mothers who breastfed within 1 hour of delivery 28
Mothers who introduced semi-solid/solid food at 6-8 months 66
Children who suffered diarrhea/fever/cough in last 1 week 63
Mothers who took their children to a trained doctor when ill 65
Mothers who had decision making power abouttheir children's welfare 46
Mothers who had decision making power about majorhousehold purchases 3
Families who used soap for washing hands before a meal 40
Families who used soap for washing hands after visit to toilet 43
Atleast one member of family consuming tobacco/liquor 62
Access to Anganwadi Centre (%)
Households (%) owning assets (green) and using services (brown)
0 10 20 30 40 50 60 70 80 90 100
TelevisionRadio
Mobile phone4-wheeler
2-wheelerCycle
TractorPucca House
Toilet
Electricity
PDSMNREGA Card
Bank/ PO AccountHealth Insurance
SHG MembershipAny Loan
Nutritional status of children 0-59 months (%)� Severe (<-3SD) � Severe or Moderate (<-2SD)
70
60
50
40
30
20
10
0
70
60
50
40
30
20
10
0
DLHS-2 HUNGaMA HUNGaMA HUNGaMA Severe Moderate
Underweight Stunting Wasting
Mid Upper ArmCircumference
Snapshot of Services Available (%)Villages with pucca road 93
Villages with pucca drain 56
Villages with electricity 100
Villages with primary school 100
Villages with PDS shop 76
Villages with Post Office 32
Villages with Primary Health Center/Sub-Centre (PHC/SC) 31
Villages with private trained doctor 51
Villages with ASHA Worker 94
Villages with Anganwadi Centre (AWC) 100
Villages with AWC with pucca building 86
Villages with AWW who has heard the word Malnutrition 100
Villages with AWW who make < 2 home visits per day 69
Supplementary Nutrition
Pre-school Education
Referrals
Antenatal Checkups
Immunization
Nutrition & Health Education
Growth Monitoring
No AWC Services
Mothers’ Voice (%)
Average Household Size (in numbers) 8
Mothers with no schooling 49
Fathers with no schooling 21
Mothers who have never heard the word Malnutrition 87
Mothers who had institutional delivery 29
Mothers who gave breastmilk to child as first intake 36
Mothers who breastfed within 1 hour of delivery 27
Mothers who introduced semi-solid/solid food at 6-8 months 48
Children who suffered diarrhea/fever/cough in last 1 week 22
Mothers who took their children to a trained doctor when ill 49
Mothers who had decision making power abouttheir children's welfare 82
Mothers who had decision making power about majorhousehold purchases 1
Families who used soap for washing hands before a meal 9
Families who used soap for washing hands after visit to toilet 39
Atleast one member of family consuming tobacco/liquor 64
Households (%) owning assets (green) and using services (brown)
Nutritional status of children 0-59 months (%)� Severe (<-3SD) � Severe or Moderate (<-2SD)
70
60
50
40
30
20
10
0
70
60
50
40
30
20
10
0
DLHS-2 HUNGaMA HUNGaMA HUNGaMA Severe Moderate
Underweight Stunting Wasting
TelevisionRadio
Mobile phone4-wheeler
2-wheelerCycle
TractorPucca House
Toilet
Electricity
PDSMNREGA Card
Bank/ PO AccountHealth Insurance
SHG MembershipAny Loan
0 10 20 30 40 50 60 70 80 90 100
KANNAUJ
Mid Upper ArmCircumference
Snapshot of Services Available (%)
Villages with pucca road 92
Villages with pucca drain 88
Villages with electricity 100
Villages with primary school 100
Villages with PDS shop 69
Villages with Post Office 31
Villages with Primary Health Center/Sub-Centre (PHC/SC) 43
Villages with private trained doctor 9
Villages with ASHA Worker 100
Villages with Anganwadi Centre (AWC) 96
Villages with AWC with pucca building 100
Villages with AWW who has heard the word Malnutrition 89
Villages with AWW who make < 2 home visits per day 25
Supplementary Nutrition
Pre-school Education
Referrals
Antenatal Checkups
Immunization
Nutrition & Health Education
Growth Monitoring
No AWC Services
Access to Anganwadi Centre (%)
0 10 20 30 40 50 60 70 80 90 100
171

172
KHERI
0 10 20 30 40 50 60 70 80 90 100
Mothers’ Voice (%)
Average Household Size (in numbers) 7
Mothers with no schooling 68
Fathers with no schooling 46
Mothers who have never heard the word Malnutrition 96
Mothers who had institutional delivery 29
Mothers who gave breastmilk to child as first intake 35
Mothers who breastfed within 1 hour of delivery 30
Mothers who introduced semi-solid/solid food at 6-8 months 70
Children who suffered diarrhea/fever/cough in last 1 week 32
Mothers who took their children to a trained doctor when ill 68
Mothers who had decision making power abouttheir children's welfare 29
Mothers who had decision making power about majorhousehold purchases 2
Families who used soap for washing hands before a meal 9
Families who used soap for washing hands after visit to toilet 19
Atleast one member of family consuming tobacco/liquor 80
Access to Anganwadi Centre (%)
Households (%) owning assets (green) and using services (brown)
0 10 20 30 40 50 60 70 80 90 100
TelevisionRadio
Mobile phone4-wheeler
2-wheelerCycle
TractorPucca House
Toilet
Electricity
PDSMNREGA Card
Bank/ PO AccountHealth Insurance
SHG MembershipAny Loan
Nutritional status of children 0-59 months (%)� Severe (<-3SD) � Severe or Moderate (<-2SD)
70
60
50
40
30
20
10
0
70
60
50
40
30
20
10
0
DLHS-2 HUNGaMA HUNGaMA HUNGaMA Severe Moderate
Underweight Stunting Wasting
Mid Upper ArmCircumference
Snapshot of Services Available (%)Villages with pucca road 79
Villages with pucca drain 77
Villages with electricity 98
Villages with primary school 96
Villages with PDS shop 81
Villages with Post Office 47
Villages with Primary Health Center/Sub-Centre (PHC/SC) 29
Villages with private trained doctor 21
Villages with ASHA Worker 96
Villages with Anganwadi Centre (AWC) 76
Villages with AWC with pucca building 71
Villages with AWW who has heard the word Malnutrition 100
Villages with AWW who make < 2 home visits per day 40
Supplementary Nutrition
Pre-school Education
Referrals
Antenatal Checkups
Immunization
Nutrition & Health Education
Growth Monitoring
No AWC Services
Mothers’ Voice (%)
Average Household Size (in numbers) 7
Mothers with no schooling 66
Fathers with no schooling 36
Mothers who have never heard the word Malnutrition 90
Mothers who had institutional delivery 53
Mothers who gave breastmilk to child as first intake 76
Mothers who breastfed within 1 hour of delivery 60
Mothers who introduced semi -solid/solid food at 6-8 months 73
Children who suffered diarrhea/fever/cough in last 1 week 40
Mothers who took their children to a trained doctor when ill 66
Mothers who had decision making power abouttheir children's welfare 97
Mothers who had decision making power about majorhousehold purchases 2
Families who used soap for washing hands before a meal 14
Families who used soap for washing hands after visit to toilet 14
Atleast one member of family consuming tobacco/liquor 86
Households (%) owing assets (green) and using services (brown)
Nutritional status of children below 5 years (%)� Severe (<-3SD) � Severe or Moderate (<-2SD)
70
60
50
40
30
20
10
0
70
60
50
40
30
20
10
0
DLHS-2 HUNGaMA HUNGaMA HUNGaMA Severe Moderate
Underweight Stunting Wasting
TelevisionRadio
Mobile phone4-wheeler
2-wheelerCycle
TractorPucca House
Toilet
Electricity
PDSNR EGA Card
Bank/ PO AccountHealth Insurance
SHG MembershipAny Loan
0 10 20 30 40 50 60 70 80 90 100
LALITPUR
Mid Upper ArmCircumference
Snapshot of Services Available (%)
Villages with pucca road 98
Villages with pucca drain 67
Villages with electricity 100
Villages with primary school 100
Villages with PDS shop 81
Villages with Post Office 63
Villages with Primary Health Center/Sub-Centre (PHC/SC) 60
Villages with private trained doctor 58
Villages with ASHA Worker 87
Villages with Anganwadi Centre (AWC) 100
Villages with AWC with pucca building 71
Villages AWW who has heard the word Malnutrition 97
Villages with AWW who make < 2 home visits per day 54
Supplementary Nutrition
Pre-school Education
Referrals
Antinatal Checkups
Immunization
Nutrition & Health Education
Growth Monitoring
No AWC Services
Access to Anganwadi Centre (%)
0 10 20 30 40 50 60 70 80 90 100
173

174
MAHOBA
0 10 20 30 40 50 60 70 80 90 100
Mothers’ Voice (%)
Average Household Size (in numbers) 7
Mothers with no schooling 59
Fathers with no schooling 26
Mothers who have never heard the word Malnutrition 94
Mothers who had institutional delivery 57
Mothers who gave breastmilk to child as first intake 72
Mothers who breastfed within 1 hour of delivery 67
Mothers who introduced semi -solid/solid food at 6-8 months 66
Children who suffered diarrhea/fever/cough in last 1 week 17
Mothers who took their children to a trained doctor when ill 59
Mothers who had decision making power abouttheir children's welfare 57
Mothers who had decision making power about majorhousehold purchases 9
Families who used soap for washing hands before a meal 8
Families who used soap for washing hands after visit to toilet 34
Atleast one member of family consuming tobacco/liquor 80
Access to Anganwadi Centre (%)
Households (%) owing assets (green) and using services (brown)
0 10 20 30 40 50 60 70 80 90 100
TelevisionRadio
Mobile phone4-wheeler
2-wheelerCycle
TractorPucca House
Toilet
Electricity
PDSNR EGA Card
Bank/ PO AccountHealth Insurance
SHG MembershipAny Loan
Nutritional status of children below 5 years (%)� Severe (<-3SD) � Severe or Moderate (<-2SD)
70
60
50
40
30
20
10
0
70
60
50
40
30
20
10
0
DLHS-2 HUNGaMA HUNGaMA HUNGaMA Severe Moderate
Underweight Stunting Wasting
Mid Upper ArmCircumference
Snapshot of Services Available (%)Villages with pucca road 97
Villages with pucca drain 57
Villages with electricity 97
Villages with primary school 91
Villages with PDS shop 84
Villages with Post Office 41
Villages with Primary Health Center/Sub-Centre (PHC/SC) 51
Villages with private trained doctor 17
Villages with ASHA Worker 97
Villages with Anganwadi Centre (AWC) 97
Villages with AWC with pucca building 93
Villages AWW who has heard the word Malnutrition 100
Villages with AWW who make < 2 home visits per day 35
Supplementary Nutrition
Pre-school Education
Referrals
Antinatal Checkups
Immunization
Nutrition & Health Education
Growth Monitoring
No AWC Services
Mothers’ Voice (%)
Average Household Size (in numbers) 8
Mothers with no schooling 59
Fathers with no schooling 20
Mothers who have never heard the word Malnutrition 88
Mothers who had institutional delivery 28
Mothers who gave breastmilk to child as first intake 60
Mothers who breastfed within 1 hour of delivery 32
Mothers who introduced semi-solid/solid food at 6-8 months 71
Children who suffered diarrhea/fever/cough in last 1 week 34
Mothers who took their children to a trained doctor when ill 59
Mothers who had decision making power abouttheir children's welfare 55
Mothers who had decision making power about majorhousehold purchases 5
Families who used soap for washing hands before a meal 28
Families who used soap for washing hands after visit to toilet 41
Atleast one member of family consuming tobacco/liquor 89
Households (%) owning assets (green) and using services (brown)
Nutritional status of children 0-59 months (%)� Severe (<-3SD) � Severe or Moderate (<-2SD)
70
60
50
40
30
20
10
0
70
60
50
40
30
20
10
0
DLHS-2 HUNGaMA HUNGaMA HUNGaMA Severe Moderate
Underweight Stunting Wasting
TelevisionRadio
Mobile phone4-wheeler
2-wheelerCycle
TractorPucca House
Toilet
Electricity
PDSMNREGA Card
Bank/ PO AccountHealth Insurance
SHG MembershipAny Loan
0 10 20 30 40 50 60 70 80 90 100
MAHARAJGANJ
Mid Upper ArmCircumference
Snapshot of Services Available (%)
Villages with pucca road 87
Villages with pucca drain 69
Villages with electricity 95
Villages with primary school 95
Villages with PDS shop 72
Villages with Post Office 34
Villages with Primary Health Center/Sub-Centre (PHC/SC) 18
Villages with private trained doctor 28
Villages with ASHA Worker 100
Villages with Anganwadi Centre (AWC) 100
Villages with AWC with pucca building 31
Villages with AWW who has heard the word Malnutrition 94
Villages with AWW who make < 2 home visits per day 18
Supplementary Nutrition
Pre-school Education
Referrals
Antenatal Checkups
Immunization
Nutrition & Health Education
Growth Monitoring
No AWC Services
Access to Anganwadi Centre (%)
0 10 20 30 40 50 60 70 80 90 100
175

176
MAINPURI
0 10 20 30 40 50 60 70 80 90 100
Mothers’ Voice (%)
Average Household Size (in numbers) 7
Mothers with no schooling 44
Fathers with no schooling 17
Mothers who have never heard the word Malnutrition 95
Mothers who had institutional delivery 29
Mothers who gave breastmilk to child as first intake 25
Mothers who breastfed within 1 hour of delivery 19
Mothers who introduced semi-solid/solid food at 6-8 months 71
Children who suffered diarrhea/fever/cough in last 1 week 42
Mothers who took their children to a trained doctor when ill 44
Mothers who had decision making power abouttheir children's welfare 53
Mothers who had decision making power about majorhousehold purchases 9
Families who used soap for washing hands before a meal 29
Families who used soap for washing hands after visit to toilet 36
Atleast one member of family consuming tobacco/liquor 60
Access to Anganwadi Centre (%)
Households (%) owning assets (green) and using services (brown)
0 10 20 30 40 50 60 70 80 90 100
TelevisionRadio
Mobile phone4-wheeler
2-wheelerCycle
TractorPucca House
Toilet
Electricity
PDSMNREGA Card
Bank/ PO AccountHealth Insurance
SHG MembershipAny Loan
Nutritional status of children 0-59 months (%)� Severe (<-3SD) � Severe or Moderate (<-2SD)
70
60
50
40
30
20
10
0
70
60
50
40
30
20
10
0
DLHS-2 HUNGaMA HUNGaMA HUNGaMA Severe Moderate
Underweight Stunting Wasting
Mid Upper ArmCircumference
Snapshot of Services Available (%)Villages with pucca road 97
Villages with pucca drain 100
Villages with electricity 92
Villages with primary school 90
Villages with PDS shop 57
Villages with Post Office 27
Villages with Primary Health Center/Sub-Centre (PHC/SC) 41
Villages with private trained doctor 27
Villages with ASHA Worker 90
Villages with Anganwadi Centre (AWC) 98
Villages with AWC with pucca building 100
Villages with AWW who has heard the word Malnutrition 90
Villages with AWW who make < 2 home visits per day 67
Supplementary Nutrition
Pre-school Education
Referrals
Antenatal Checkups
Immunization
Nutrition & Health Education
Growth Monitoring
No AWC Services
Mothers’ Voice (%)
Average Household Size (in numbers) 8
Mothers with no schooling 54
Fathers with no schooling 19
Mothers who have never heard the word Malnutrition 89
Mothers who had institutional delivery 46
Mothers who gave breastmilk to child as first intake 44
Mothers who breastfed within 1 hour of delivery 36
Mothers who introduced semi-solid/solid food at 6-8 months 54
Children who suffered diarrhea/fever/cough in last 1 week 29
Mothers who took their children to a trained doctor when ill 54
Mothers who had decision making power abouttheir children's welfare 49
Mothers who had decision making power about majorhousehold purchases 3
Families who used soap for washing hands before a meal 26
Families who used soap for washing hands after visit to toilet 38
Atleast one member of family consuming tobacco/liquor 57
Households (%) owning assets (green) and using services (brown)
Nutritional status of children 0-59 months (%)� Severe (<-3SD) � Severe or Moderate (<-2SD)
70
60
50
40
30
20
10
0
70
60
50
40
30
20
10
0
DLHS-2 HUNGaMA HUNGaMA HUNGaMA Severe Moderate
Underweight Stunting Wasting
TelevisionRadio
Mobile phone4-wheeler
2-wheelerCycle
TractorPucca House
Toilet
Electricity
PDSMNREGA Card
Bank/ PO AccountHealth Insurance
SHG MembershipAny Loan
0 10 20 30 40 50 60 70 80 90 100
MATHURA
Mid Upper ArmCircumference
Snapshot of Services Available (%)
Villages with pucca road 100
Villages with pucca drain 81
Villages with electricity 100
Villages with primary school 100
Villages with PDS shop 81
Villages with Post Office 43
Villages with Primary Health Center/Sub-Centre (PHC/SC) 35
Villages with private trained doctor 31
Villages with ASHA Worker 97
Villages with Anganwadi Centre (AWC) 100
Villages with AWC with pucca building 97
Villages with AWW who has heard the word Malnutrition 84
Villages with AWW who make < 2 home visits per day 28
Supplementary Nutrition
Pre-school Education
Referrals
Antenatal Checkups
Immunization
Nutrition & Health Education
Growth Monitoring
No AWC Services
Access to Anganwadi Centre (%)
0 10 20 30 40 50 60 70 80 90 100
177

178
MIRZAPUR
0 10 20 30 40 50 60 70 80 90 100
Mothers’ Voice (%)
Average Household Size (in numbers) 9
Mothers with no schooling 58
Fathers with no schooling 24
Mothers who have never heard the word Malnutrition 90
Mothers who had institutional delivery 40
Mothers who gave breastmilk to child as first intake 37
Mothers who breastfed within 1 hour of delivery 34
Mothers who introduced semi-solid/solid food at 6-8 months 73
Children who suffered diarrhea/fever/cough in last 1 week 18
Mothers who took their children to a trained doctor when ill 58
Mothers who had decision making power abouttheir children's welfare 97
Mothers who had decision making power about majorhousehold purchases 1
Families who used soap for washing hands before a meal 5
Families who used soap for washing hands after visit to toilet 11
Atleast one member of family consuming tobacco/liquor 84
Access to Anganwadi Centre (%)
Households (%) owning assets (green) and using services (brown)
0 10 20 30 40 50 60 70 80 90 100
TelevisionRadio
Mobile phone4-wheeler
2-wheelerCycle
TractorPucca House
Toilet
Electricity
PDSMNREGA Card
Bank/ PO AccountHealth Insurance
SHG MembershipAny Loan
Nutritional status of children 0-59 months (%)� Severe (<-3SD) � Severe or Moderate (<-2SD)
70
60
50
40
30
20
10
0
70
60
50
40
30
20
10
0
DLHS-2 HUNGaMA HUNGaMA HUNGaMA Severe Moderate
Underweight Stunting Wasting
Mid Upper ArmCircumference
Snapshot of Services Available (%)Villages with pucca road 98
Villages with pucca drain 54
Villages with electricity 97
Villages with primary school 100
Villages with PDS shop 79
Villages with Post Office 31
Villages with Primary Health Center/Sub-Centre (PHC/SC) 31
Villages with private trained doctor 26
Villages with ASHA Worker 100
Villages with Anganwadi Centre (AWC) 93
Villages with AWC with pucca building 71
Villages with AWW who has heard the word Malnutrition 100
Villages with AWW who make < 2 home visits per day 82
Supplementary Nutrition
Pre-school Education
Referrals
Antenatal Checkups
Immunization
Nutrition & Health Education
Growth Monitoring
No AWC Services
Mothers’ Voice (%)
Average Household Size (in numbers) 8
Mothers with no schooling 78
Fathers with no schooling 44
Mothers who have never heard the word Malnutrition 94
Mothers who had institutional delivery 28
Mothers who gave breastmilk to child as first intake 23
Mothers who breastfed within 1 hour of delivery 10
Mothers who introduced semi-solid/solid food at 6-8 months 73
Children who suffered diarrhea/fever/cough in last 1 week 35
Mothers who took their children to a trained doctor when ill 78
Mothers who had decision making power abouttheir children's welfare 70
Mothers who had decision making power about majorhousehold purchases 5
Families who used soap for washing hands before a meal 9
Families who used soap for washing hands after visit to toilet 4
Atleast one member of family consuming tobacco/liquor 59
Households (%) owning assets (green) and using services (brown)
Nutritional status of children 0-59 months (%)� Severe (<-3SD) � Severe or Moderate (<-2SD)
70
60
50
40
30
20
10
0
70
60
50
40
30
20
10
0
DLHS-2 HUNGaMA HUNGaMA HUNGaMA Severe Moderate
Underweight Stunting Wasting
TelevisionRadio
Mobile phone4-wheeler
2-wheelerCycle
TractorPucca House
Toilet
Electricity
PDSMNREGA Card
Bank/ PO AccountHealth Insurance
SHG MembershipAny Loan
0 10 20 30 40 50 60 70 80 90 100
MORADABAD
Mid Upper ArmCircumference
Snapshot of Services Available (%)
Villages with pucca road 95
Villages with pucca drain 68
Villages with electricity 94
Villages with primary school 99
Villages with PDS shop 82
Villages with Post Office 29
Villages with Primary Health Center/Sub-Centre (PHC/SC) 30
Villages with private trained doctor 26
Villages with ASHA Worker 99
Villages with Anganwadi Centre (AWC) 91
Villages with AWC with pucca building 82
Villages with AWW who has heard the word Malnutrition 100
Villages with AWW who make < 2 home visits per day 50
Supplementary Nutrition
Pre-school Education
Referrals
Antenatal Checkups
Immunization
Nutrition & Health Education
Growth Monitoring
No AWC Services
Access to Anganwadi Centre (%)
0 10 20 30 40 50 60 70 80 90 100
179

180
PILIBHIT
0 10 20 30 40 50 60 70 80 90 100
Mothers’ Voice (%)
Average Household Size (in numbers) 7
Mothers with no schooling 72
Fathers with no schooling 33
Mothers who have never heard the word Malnutrition 93
Mothers who had institutional delivery 26
Mothers who gave breastmilk to child as first intake 31
Mothers who breastfed within 1 hour of delivery 28
Mothers who introduced semi-solid/solid food at 6-8 months 76
Children who suffered diarrhea/fever/cough in last 1 week 62
Mothers who took their children to a trained doctor when ill 72
Mothers who had decision making power abouttheir children's welfare 37
Mothers who had decision making power about majorhousehold purchases 1
Families who used soap for washing hands before a meal 5
Families who used soap for washing hands after visit to toilet 19
Atleast one member of family consuming tobacco/liquor 72
Access to Anganwadi Centre (%)
Households (%) owning assets (green) and using services (brown)
0 10 20 30 40 50 60 70 80 90 100
TelevisionRadio
Mobile phone4-wheeler
2-wheelerCycle
TractorPucca House
Toilet
Electricity
PDSMNREGA Card
Bank/ PO AccountHealth Insurance
SHG MembershipAny Loan
Nutritional status of children 0-59 months (%)� Severe (<-3SD) � Severe or Moderate (<-2SD)
70
60
50
40
30
20
10
0
70
60
50
40
30
20
10
0
DLHS-2 HUNGaMA HUNGaMA HUNGaMA Severe Moderate
Underweight Stunting Wasting
Mid Upper ArmCircumference
Snapshot of Services Available (%)Villages with pucca road 96
Villages with pucca drain 70
Villages with electricity 93
Villages with primary school 100
Villages with PDS shop 76
Villages with Post Office 37
Villages with Primary Health Center/Sub-Centre (PHC/SC) 33
Villages with private trained doctor 34
Villages with ASHA Worker 90
Villages with Anganwadi Centre (AWC) 99
Villages with AWC with pucca building 91
Villages with AWW who has heard the word Malnutrition 100
Villages with AWW who make < 2 home visits per day 55
Supplementary Nutrition
Pre-school Education
Referrals
Antenatal Checkups
Immunization
Nutrition & Health Education
Growth Monitoring
No AWC Services
Mothers’ Voice (%)
Average Household Size (in numbers) 8
Mothers with no schooling 55
Fathers with no schooling 21
Mothers who have never heard the word Malnutrition 87
Mothers who had institutional delivery 39
Mothers who gave breastmilk to child as first intake 56
Mothers who breastfed within 1 hour of delivery 55
Mothers who introduced semi-solid/solid food at 6-8 months 64
Children who suffered diarrhea/fever/cough in last 1 week 14
Mothers who took their children to a trained doctor when ill 55
Mothers who had decision making power abouttheir children's welfare 62
Mothers who had decision making power about majorhousehold purchases 22
Families who used soap for washing hands before a meal 5
Families who used soap for washing hands after visit to toilet 28
Atleast one member of family consuming tobacco/liquor 84
Households (%) owning assets (green) and using services (brown)
Nutritional status of children 0-59 months (%)� Severe (<-3SD) � Severe or Moderate (<-2SD)
70
60
50
40
30
20
10
0
70
60
50
40
30
20
10
0
DLHS-2 HUNGaMA HUNGaMA HUNGaMA Severe Moderate
Underweight Stunting Wasting
TelevisionRadio
Mobile phone4-wheeler
2-wheelerCycle
TractorPucca House
Toilet
Electricity
PDSMNREGA Card
Bank/ PO AccountHealth Insurance
SHG MembershipAny Loan
0 10 20 30 40 50 60 70 80 90 100
PRATAPGARH
Mid Upper ArmCircumference
Snapshot of Services Available (%)
Villages with pucca road 100
Villages with pucca drain 86
Villages with electricity 100
Villages with primary school 97
Villages with PDS shop 82
Villages with Post Office 38
Villages with Primary Health Center/Sub-Centre (PHC/SC) 43
Villages with private trained doctor 40
Villages with ASHA Worker 95
Villages with Anganwadi Centre (AWC) 93
Villages with AWC with pucca building 59
Villages with AWW who has heard the word Malnutrition 97
Villages with AWW who make < 2 home visits per day 54
Supplementary Nutrition
Pre-school Education
Referrals
Antenatal Checkups
Immunization
Nutrition & Health Education
Growth Monitoring
No AWC Services
Access to Anganwadi Centre (%)
0 10 20 30 40 50 60 70 80 90 100
181

182
RAE BARELI
0 10 20 30 40 50 60 70 80 90 100
Mothers’ Voice (%)
Average Household Size (in numbers) 7
Mothers with no schooling 55
Fathers with no schooling 27
Mothers who have never heard the word Malnutrition 84
Mothers who had institutional delivery 53
Mothers who gave breastmilk to child as first intake 68
Mothers who breastfed within 1 hour of delivery 60
Mothers who introduced semi-solid/solid food at 6-8 months 75
Children who suffered diarrhea/fever/cough in last 1 week 18
Mothers who took their children to a trained doctor when ill 55
Mothers who had decision making power abouttheir children's welfare 93
Mothers who had decision making power about majorhousehold purchases 19
Families who used soap for washing hands before a meal 11
Families who used soap for washing hands after visit to toilet 36
Atleast one member of family consuming tobacco/liquor 84
Access to Anganwadi Centre (%)
Households (%) owning assets (green) and using services (brown)
0 10 20 30 40 50 60 70 80 90 100
TelevisionRadio
Mobile phone4-wheeler
2-wheelerCycle
TractorPucca House
Toilet
Electricity
PDSMNREGA Card
Bank/ PO AccountHealth Insurance
SHG MembershipAny Loan
Nutritional status of children 0-59 months (%)� Severe (<-3SD) � Severe or Moderate (<-2SD)
70
60
50
40
30
20
10
0
70
60
50
40
30
20
10
0
DLHS-2 HUNGaMA HUNGaMA HUNGaMA Severe Moderate
Underweight Stunting Wasting
Mid Upper ArmCircumference
Snapshot of Services Available (%)Villages with pucca road 96
Villages with pucca drain 77
Villages with electricity 100
Villages with primary school 90
Villages with PDS shop 73
Villages with Post Office 45
Villages with Primary Health Center/Sub-Centre (PHC/SC) 46
Villages with private trained doctor 12
Villages with ASHA Worker 100
Villages with Anganwadi Centre (AWC) 100
Villages with AWC with pucca building 72
Villages with AWW who has heard the word Malnutrition 100
Villages with AWW who make < 2 home visits per day 81
Supplementary Nutrition
Pre-school Education
Referrals
Antenatal Checkups
Immunization
Nutrition & Health Education
Growth Monitoring
No AWC Services
Mothers’ Voice (%)
Average Household Size (in numbers) 7
Mothers with no schooling 82
Fathers with no schooling 55
Mothers who have never heard the word Malnutrition 98
Mothers who had institutional delivery 36
Mothers who gave breastmilk to child as first intake 46
Mothers who breastfed within 1 hour of delivery 39
Mothers who introduced semi-solid/solid food at 6-8 months 76
Children who suffered diarrhea/fever/cough in last 1 week 45
Mothers who took their children to a trained doctor when ill 82
Mothers who had decision making power abouttheir children's welfare 79
Mothers who had decision making power about majorhousehold purchases 5
Families who used soap for washing hands before a meal 2
Families who used soap for washing hands after visit to toilet 3
Atleast one member of family consuming tobacco/liquor 57
Households (%) owning assets (green) and using services (brown)
Nutritional status of children 0-59 months (%)� Severe (<-3SD) � Severe or Moderate (<-2SD)
70
60
50
40
30
20
10
0
70
60
50
40
30
20
10
0
DLHS-2 HUNGaMA HUNGaMA HUNGaMA Severe Moderate
Underweight Stunting Wasting
TelevisionRadio
Mobile phone4-wheeler
2-wheelerCycle
TractorPucca House
Toilet
Electricity
PDSMNREGA Card
Bank/ PO AccountHealth Insurance
SHG MembershipAny Loan
0 10 20 30 40 50 60 70 80 90 100
RAMPUR
Mid Upper ArmCircumference
Snapshot of Services Available (%)
Villages with pucca road 92
Villages with pucca drain 79
Villages with electricity 97
Villages with primary school 100
Villages with PDS shop 91
Villages with Post Office 25
Villages with Primary Health Center/Sub-Centre (PHC/SC) 23
Villages with private trained doctor 10
Villages with ASHA Worker 98
Villages with Anganwadi Centre (AWC) 98
Villages with AWC with pucca building 86
Villages with AWW who has heard the word Malnutrition 91
Villages with AWW who make < 2 home visits per day 70
Supplementary Nutrition
Pre-school Education
Referrals
Antenatal Checkups
Immunization
Nutrition & Health Education
Growth Monitoring
No AWC Services
Access to Anganwadi Centre (%)
0 10 20 30 40 50 60 70 80 90 100
183

184
SANT KABIR NAGAR
0 10 20 30 40 50 60 70 80 90 100
Mothers’ Voice (%)
Average Household Size (in numbers) 8
Mothers with no schooling 61
Fathers with no schooling 23
Mothers who have never heard the word Malnutrition 94
Mothers who had institutional delivery 42
Mothers who gave breastmilk to child as first intake 46
Mothers who breastfed within 1 hour of delivery 38
Mothers who introduced semi-solid/solid food at 6-8 months 73
Children who suffered diarrhea/fever/cough in last 1 week 18
Mothers who took their children to a trained doctor when ill 61
Mothers who had decision making power abouttheir children's welfare 22
Mothers who had decision making power about majorhousehold purchases 0
Families who used soap for washing hands before a meal 15
Families who used soap for washing hands after visit to toilet 42
Atleast one member of family consuming tobacco/liquor 84
Access to Anganwadi Centre (%)
Households (%) owning assets (green) and using services (brown)
0 10 20 30 40 50 60 70 80 90 100
TelevisionRadio
Mobile phone4-wheeler
2-wheelerCycle
TractorPucca House
Toilet
Electricity
PDSMNREGA Card
Bank/ PO AccountHealth Insurance
SHG MembershipAny Loan
Nutritional status of children 0-59 months (%)� Severe (<-3SD) � Severe or Moderate (<-2SD)
70
60
50
40
30
20
10
0
70
60
50
40
30
20
10
0
DLHS-2 HUNGaMA HUNGaMA HUNGaMA Severe Moderate
Underweight Stunting Wasting
Mid Upper ArmCircumference
Snapshot of Services Available (%)Villages with pucca road 94
Villages with pucca drain 58
Villages with electricity 100
Villages with primary school 78
Villages with PDS shop 81
Villages with Post Office 35
Villages with Primary Health Center/Sub-Centre (PHC/SC) 23
Villages with private trained doctor 11
Villages with ASHA Worker 96
Villages with Anganwadi Centre (AWC) 93
Villages with AWC with pucca building 83
Villages with AWW who has heard the word Malnutrition 100
Villages with AWW who make < 2 home visits per day 39
Supplementary Nutrition
Pre-school Education
Referrals
Antenatal Checkups
Immunization
Nutrition & Health Education
Growth Monitoring
No AWC Services
Mothers’ Voice (%)
Average Household Size (in numbers) 9
Mothers with no schooling 61
Fathers with no schooling 20
Mothers who have never heard the word Malnutrition 94
Mothers who had institutional delivery 42
Mothers who gave breastmilk to child as first intake 33
Mothers who breastfed within 1 hour of delivery 32
Mothers who introduced semi-solid/solid food at 6-8 months 71
Children who suffered diarrhea/fever/cough in last 1 week 45
Mothers who took their children to a trained doctor when ill 61
Mothers who had decision making power abouttheir children's welfare 81
Mothers who had decision making power about majorhousehold purchases 3
Families who used soap for washing hands before a meal 6
Families who used soap for washing hands after visit to toilet 24
Atleast one member of family consuming tobacco/liquor 90
Households (%) owning assets (green) and using services (brown)
Nutritional status of children 0-59 months (%)� Severe (<-3SD) � Severe or Moderate (<-2SD)
70
60
50
40
30
20
10
0
70
60
50
40
30
20
10
0
DLHS-2 HUNGaMA HUNGaMA HUNGaMA Severe Moderate
Underweight Stunting Wasting
TelevisionRadio
Mobile phone4-wheeler
2-wheelerCycle
TractorPucca House
Toilet
Electricity
PDSMNREGA Card
Bank/ PO AccountHealth Insurance
SHG MembershipAny Loan
0 10 20 30 40 50 60 70 80 90 100
SANT RAVIDAS NAGAR BHADOHI
Mid Upper ArmCircumference
Snapshot of Services Available (%)
Villages with pucca road 100
Villages with pucca drain 57
Villages with electricity 100
Villages with primary school 85
Villages with PDS shop 85
Villages with Post Office 16
Villages with Primary Health Center/Sub-Centre (PHC/SC) 13
Villages with private trained doctor 26
Villages with ASHA Worker 95
Villages with Anganwadi Centre (AWC) 90
Villages with AWC with pucca building 92
Villages with AWW who has heard the word Malnutrition 100
Villages with AWW who make < 2 home visits per day 87
Supplementary Nutrition
Pre-school Education
Referrals
Antenatal Checkups
Immunization
Nutrition & Health Education
Growth Monitoring
No AWC Services
Access to Anganwadi Centre (%)
0 10 20 30 40 50 60 70 80 90 100
185

186
SHAHJAHANPUR
0 10 20 30 40 50 60 70 80 90 100
Mothers’ Voice (%)
Average Household Size (in numbers) 7
Mothers with no schooling 72
Fathers with no schooling 42
Mothers who have never heard the word Malnutrition 94
Mothers who had institutional delivery 20
Mothers who gave breastmilk to child as first intake 38
Mothers who breastfed within 1 hour of delivery 28
Mothers who introduced semi-solid/solid food at 6-8 months 61
Children who suffered diarrhea/fever/cough in last 1 week 22
Mothers who took their children to a trained doctor when ill 72
Mothers who had decision making power abouttheir children's welfare 36
Mothers who had decision making power about majorhousehold purchases 18
Families who used soap for washing hands before a meal 16
Families who used soap for washing hands after visit to toilet 19
Atleast one member of family consuming tobacco/liquor 68
Access to Anganwadi Centre (%)
Households (%) owning assets (green) and using services (brown)
0 10 20 30 40 50 60 70 80 90 100
TelevisionRadio
Mobile phone4-wheeler
2-wheelerCycle
TractorPucca House
Toilet
Electricity
PDSMNREGA Card
Bank/ PO AccountHealth Insurance
SHG MembershipAny Loan
Nutritional status of children 0-59 months (%)� Severe (<-3SD) � Severe or Moderate (<-2SD)
70
60
50
40
30
20
10
0
70
60
50
40
30
20
10
0
DLHS-2 HUNGaMA HUNGaMA HUNGaMA Severe Moderate
Underweight Stunting Wasting
Mid Upper ArmCircumference
Snapshot of Services Available (%)Villages with pucca road 97
Villages with pucca drain 69
Villages with electricity 86
Villages with primary school 100
Villages with PDS shop 78
Villages with Post Office 31
Villages with Primary Health Center/Sub-Centre (PHC/SC) 35
Villages with private trained doctor 5
Villages with ASHA Worker 95
Villages with Anganwadi Centre (AWC) 88
Villages with AWC with pucca building 90
Villages with AWW who has heard the word Malnutrition 96
Villages with AWW who make < 2 home visits per day 74
Supplementary Nutrition
Pre-school Education
Referrals
Antenatal Checkups
Immunization
Nutrition & Health Education
Growth Monitoring
No AWC Services
Mothers’ Voice (%)
Average Household Size (in numbers) 8
Mothers with no schooling 82
Fathers with no schooling 49
Mothers who have never heard the word Malnutrition 89
Mothers who had institutional delivery 35
Mothers who gave breastmilk to child as first intake 37
Mothers who breastfed within 1 hour of delivery 44
Mothers who introduced semi-solid/solid food at 6-8 months 70
Children who suffered diarrhea/fever/cough in last 1 week 38
Mothers who took their children to a trained doctor when ill 82
Mothers who had decision making power abouttheir children's welfare 55
Mothers who had decision making power about majorhousehold purchases 5
Families who used soap for washing hands before a meal 37
Families who used soap for washing hands after visit to toilet 41
Atleast one member of family consuming tobacco/liquor 86
Households (%) owning assets (green) and using services (brown)
Nutritional status of children 0-59 months (%)� Severe (<-3SD) � Severe or Moderate (<-2SD)
70
60
50
40
30
20
10
0
70
60
50
40
30
20
10
0
DLHS-2 HUNGaMA HUNGaMA HUNGaMA Severe Moderate
Underweight Stunting Wasting
TelevisionRadio
Mobile phone4-wheeler
2-wheelerCycle
TractorPucca House
Toilet
Electricity
PDSMNREGA Card
Bank/ PO AccountHealth Insurance
SHG MembershipAny Loan
0 10 20 30 40 50 60 70 80 90 100
SHRAWASTI
Mid Upper ArmCircumference
Snapshot of Services Available (%)
Villages with pucca road 93
Villages with pucca drain 52
Villages with electricity 83
Villages with primary school 100
Villages with PDS shop 98
Villages with Post Office 20
Villages with Primary Health Center/Sub-Centre (PHC/SC) 28
Villages with private trained doctor 27
Villages with ASHA Worker 100
Villages with Anganwadi Centre (AWC) 88
Villages with AWC with pucca building 64
Villages with AWW who has heard the word Malnutrition 91
Villages with AWW who make < 2 home visits per day 63
Supplementary Nutrition
Pre-school Education
Referrals
Antenatal Checkups
Immunization
Nutrition & Health Education
Growth Monitoring
No AWC Services
Access to Anganwadi Centre (%)
0 10 20 30 40 50 60 70 80 90 100
187
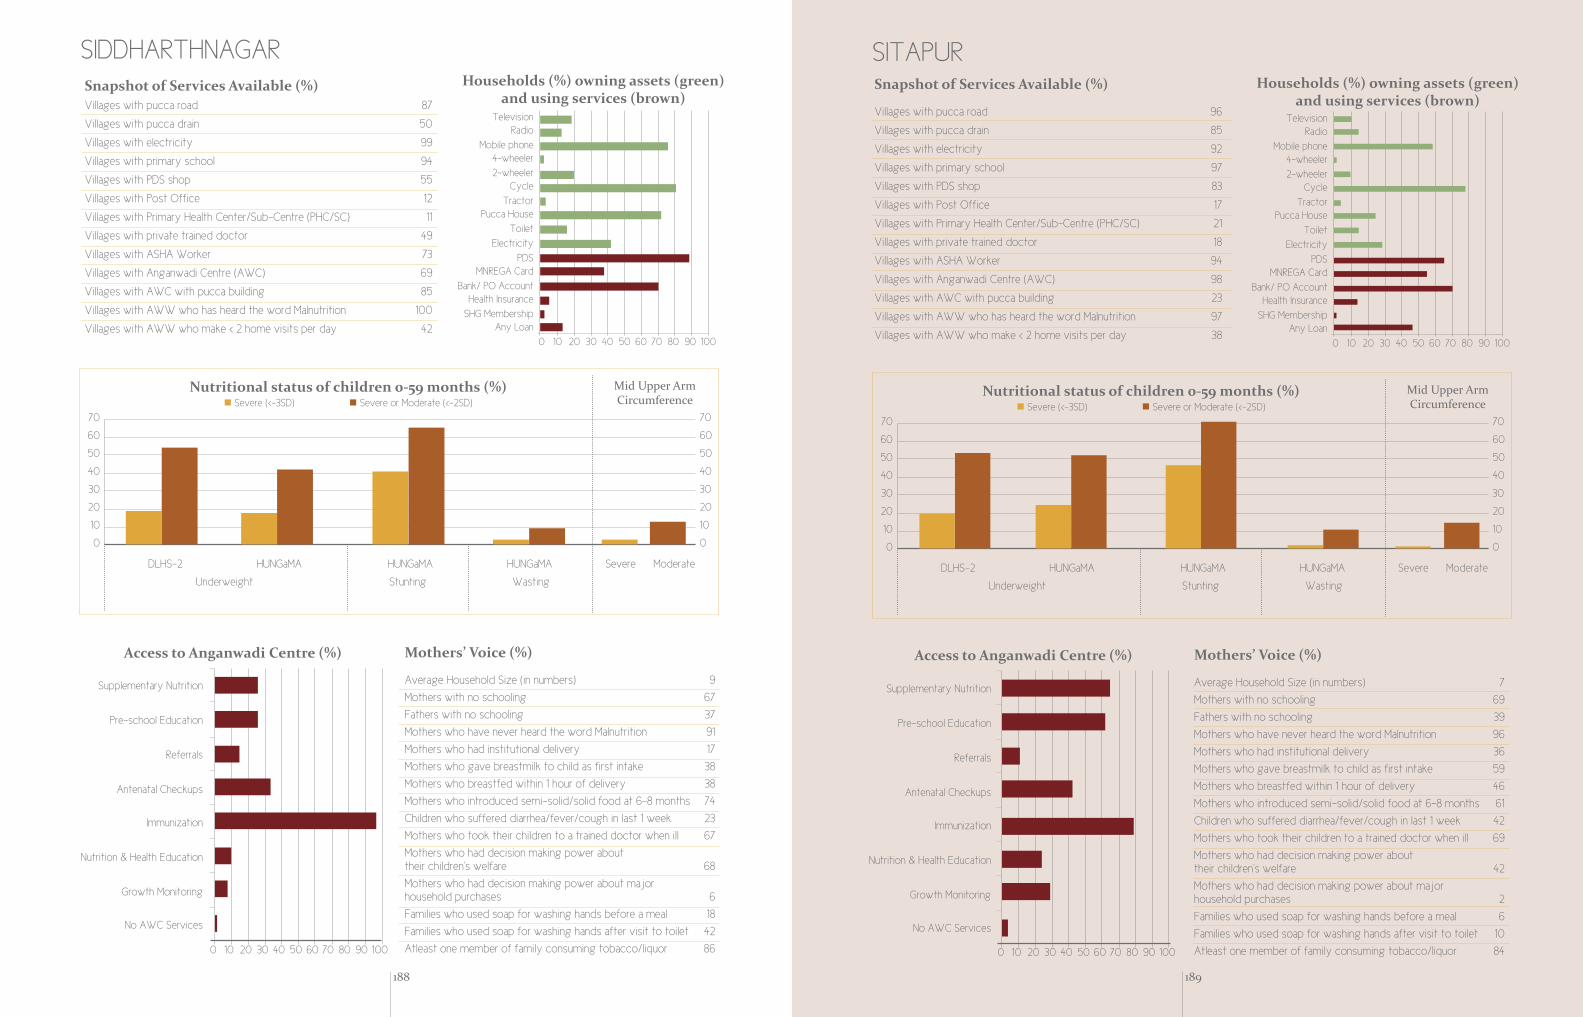
188
SIDDHARTHNAGAR
0 10 20 30 40 50 60 70 80 90 100
Mothers’ Voice (%)
Average Household Size (in numbers) 9
Mothers with no schooling 67
Fathers with no schooling 37
Mothers who have never heard the word Malnutrition 91
Mothers who had institutional delivery 17
Mothers who gave breastmilk to child as first intake 38
Mothers who breastfed within 1 hour of delivery 38
Mothers who introduced semi-solid/solid food at 6-8 months 74
Children who suffered diarrhea/fever/cough in last 1 week 23
Mothers who took their children to a trained doctor when ill 67
Mothers who had decision making power abouttheir children's welfare 68
Mothers who had decision making power about majorhousehold purchases 6
Families who used soap for washing hands before a meal 18
Families who used soap for washing hands after visit to toilet 42
Atleast one member of family consuming tobacco/liquor 86
Access to Anganwadi Centre (%)
Households (%) owning assets (green) and using services (brown)
0 10 20 30 40 50 60 70 80 90 100
TelevisionRadio
Mobile phone4-wheeler
2-wheelerCycle
TractorPucca House
Toilet
Electricity
PDSMNREGA Card
Bank/ PO AccountHealth Insurance
SHG MembershipAny Loan
Nutritional status of children 0-59 months (%)� Severe (<-3SD) � Severe or Moderate (<-2SD)
70
60
50
40
30
20
10
0
70
60
50
40
30
20
10
0
DLHS-2 HUNGaMA HUNGaMA HUNGaMA Severe Moderate
Underweight Stunting Wasting
Mid Upper ArmCircumference
Snapshot of Services Available (%)Villages with pucca road 87
Villages with pucca drain 50
Villages with electricity 99
Villages with primary school 94
Villages with PDS shop 55
Villages with Post Office 12
Villages with Primary Health Center/Sub-Centre (PHC/SC) 11
Villages with private trained doctor 49
Villages with ASHA Worker 73
Villages with Anganwadi Centre (AWC) 69
Villages with AWC with pucca building 85
Villages with AWW who has heard the word Malnutrition 100
Villages with AWW who make < 2 home visits per day 42
Supplementary Nutrition
Pre-school Education
Referrals
Antenatal Checkups
Immunization
Nutrition & Health Education
Growth Monitoring
No AWC Services
Mothers’ Voice (%)
Average Household Size (in numbers) 7
Mothers with no schooling 69
Fathers with no schooling 39
Mothers who have never heard the word Malnutrition 96
Mothers who had institutional delivery 36
Mothers who gave breastmilk to child as first intake 59
Mothers who breastfed within 1 hour of delivery 46
Mothers who introduced semi-solid/solid food at 6-8 months 61
Children who suffered diarrhea/fever/cough in last 1 week 42
Mothers who took their children to a trained doctor when ill 69
Mothers who had decision making power abouttheir children's welfare 42
Mothers who had decision making power about majorhousehold purchases 2
Families who used soap for washing hands before a meal 6
Families who used soap for washing hands after visit to toilet 10
Atleast one member of family consuming tobacco/liquor 84
Households (%) owning assets (green) and using services (brown)
Nutritional status of children 0-59 months (%)� Severe (<-3SD) � Severe or Moderate (<-2SD)
70
60
50
40
30
20
10
0
70
60
50
40
30
20
10
0
DLHS-2 HUNGaMA HUNGaMA HUNGaMA Severe Moderate
Underweight Stunting Wasting
TelevisionRadio
Mobile phone4-wheeler
2-wheelerCycle
TractorPucca House
Toilet
Electricity
PDSMNREGA Card
Bank/ PO AccountHealth Insurance
SHG MembershipAny Loan
0 10 20 30 40 50 60 70 80 90 100
SITAPUR
Mid Upper ArmCircumference
Snapshot of Services Available (%)
Villages with pucca road 96
Villages with pucca drain 85
Villages with electricity 92
Villages with primary school 97
Villages with PDS shop 83
Villages with Post Office 17
Villages with Primary Health Center/Sub-Centre (PHC/SC) 21
Villages with private trained doctor 18
Villages with ASHA Worker 94
Villages with Anganwadi Centre (AWC) 98
Villages with AWC with pucca building 23
Villages with AWW who has heard the word Malnutrition 97
Villages with AWW who make < 2 home visits per day 38
Supplementary Nutrition
Pre-school Education
Referrals
Antenatal Checkups
Immunization
Nutrition & Health Education
Growth Monitoring
No AWC Services
Access to Anganwadi Centre (%)
0 10 20 30 40 50 60 70 80 90 100
189

190
SONBHADRA
0 10 20 30 40 50 60 70 80 90 100
Mothers’ Voice (%)
Average Household Size (in numbers) 7
Mothers with no schooling 70
Fathers with no schooling 40
Mothers who have never heard the word Malnutrition 95
Mothers who had institutional delivery 26
Mothers who gave breastmilk to child as first intake 57
Mothers who breastfed within 1 hour of delivery 42
Mothers who introduced semi-solid/solid food at 6-8 months 84
Children who suffered diarrhea/fever/cough in last 1 week 21
Mothers who took their children to a trained doctor when ill 70
Mothers who had decision making power abouttheir children's welfare 98
Mothers who had decision making power about majorhousehold purchases 1
Families who used soap for washing hands before a meal 4
Families who used soap for washing hands after visit to toilet 7
Atleast one member of family consuming tobacco/liquor 93
Access to Anganwadi Centre (%)
Households (%) owning assets (green) and using services (brown)
0 10 20 30 40 50 60 70 80 90 100
TelevisionRadio
Mobile phone4-wheeler
2-wheelerCycle
TractorPucca House
Toilet
Electricity
PDSMNREGA Card
Bank/ PO AccountHealth Insurance
SHG MembershipAny Loan
Nutritional status of children 0-59 months (%)� Severe (<-3SD) � Severe or Moderate (<-2SD)
70
60
50
40
30
20
10
0
70
60
50
40
30
20
10
0
DLHS-2 HUNGaMA HUNGaMA HUNGaMA Severe Moderate
Underweight Stunting Wasting
Mid Upper ArmCircumference
Snapshot of Services Available (%)Villages with pucca road 98
Villages with pucca drain 45
Villages with electricity 100
Villages with primary school 96
Villages with PDS shop 91
Villages with Post Office 15
Villages with Primary Health Center/Sub-Centre (PHC/SC) 24
Villages with private trained doctor 17
Villages with ASHA Worker 100
Villages with Anganwadi Centre (AWC) 95
Villages with AWC with pucca building 82
Villages with AWW who has heard the word Malnutrition 100
Villages with AWW who make < 2 home visits per day 82
Supplementary Nutrition
Pre-school Education
Referrals
Antenatal Checkups
Immunization
Nutrition & Health Education
Growth Monitoring
No AWC Services
Mothers’ Voice (%)
Average Household Size (in numbers) 8
Mothers with no schooling 49
Fathers with no schooling 20
Mothers who have never heard the word Malnutrition 92
Mothers who had institutional delivery 46
Mothers who gave breastmilk to child as first intake 45
Mothers who breastfed within 1 hour of delivery 47
Mothers who introduced semi-solid/solid food at 6-8 months 77
Children who suffered diarrhea/fever/cough in last 1 week 33
Mothers who took their children to a trained doctor when ill 49
Mothers who had decision making power abouttheir children's welfare 67
Mothers who had decision making power about majorhousehold purchases 6
Families who used soap for washing hands before a meal 15
Families who used soap for washing hands after visit to toilet 36
Atleast one member of family consuming tobacco/liquor 83
Households (%) owning assets (green) and using services (brown)
Nutritional status of children 0-59 months (%)� Severe (<-3SD) � Severe or Moderate (<-2SD)
70
60
50
40
30
20
10
0
70
60
50
40
30
20
10
0
DLHS-2 HUNGaMA HUNGaMA HUNGaMA Severe Moderate
Underweight Stunting Wasting
TelevisionRadio
Mobile phone4-wheeler
2-wheelerCycle
TractorPucca House
Toilet
Electricity
PDSMNREGA Card
Bank/ PO AccountHealth Insurance
SHG MembershipAny Loan
0 10 20 30 40 50 60 70 80 90 100
SULTANPUR
Mid Upper ArmCircumference
Snapshot of Services Available (%)
Villages with pucca road 98
Villages with pucca drain 80
Villages with electricity 100
Villages with primary school 94
Villages with PDS shop 93
Villages with Post Office 45
Villages with Primary Health Center/Sub-Centre (PHC/SC) 42
Villages with private trained doctor 32
Villages with ASHA Worker 100
Villages with Anganwadi Centre (AWC) 100
Villages with AWC with pucca building 73
Villages with AWW who has heard the word Malnutrition 91
Villages with AWW who make < 2 home visits per day 52
Supplementary Nutrition
Pre-school Education
Referrals
Antenatal Checkups
Immunization
Nutrition & Health Education
Growth Monitoring
No AWC Services
Access to Anganwadi Centre (%)
0 10 20 30 40 50 60 70 80 90 100
191

192 193
UNNAO
0 10 20 30 40 50 60 70 80 90 100
Mothers’ Voice (%)
Average Household Size (in numbers) 7Mothers with no schooling 56Fathers with no schooling 31Mothers who have never heard the word Malnutrition 95Mothers who had institutional delivery 39Mothers who gave breastmilk to child as �rst intake 43Mothers who breastfed within 1 hour of delivery 29Mothers who introduced semi-solid/solid food at 6-8 months 67Children who su�ered diarrhea/fever/cough in last 1 week 44Mothers who took their children to a trained doctor when ill 56Mothers who had decision making power abouttheir children's welfare 94Mothers who had decision making power about majorhousehold purchases 1Families who used soap for washing hands before a meal 4Families who used soap for washing hands after visit to toilet 20Atleast one member of family consuming tobacco/liquor 85
Access to Anganwadi Centre (%)
Households (%) owning assets (green) and using services (brown)
0 10 20 30 40 50 60 70 80 90 100
TelevisionRadio
Mobile phone4-wheeler2-wheeler
CycleTractor
Pucca HouseToilet
ElectricityPDS
MNREGA CardBank/ PO Account
Health InsuranceSHG Membership
Any Loan
Nutritional status of children 0-59 months (%)� Severe (<-3SD) � Severe or Moderate (<-2SD)
70
60
50
40
30
20
10
0
70
60
50
40
30
20
10
0
DLHS-2 HUNGaMA HUNGaMA HUNGaMA Severe Moderate
Underweight Stunting Wasting
Mid Upper ArmCircumference
Snapshot of Services Available (%)Villages with pucca road 96
Villages with pucca drain 69
Villages with electricity 90
Villages with primary school 90
Villages with PDS shop 59
Villages with Post O�ce 32
Villages with Primary Health Center/Sub-Centre (PHC/SC) 23
Villages with private trained doctor 13
Villages with ASHA Worker 79
Villages with Anganwadi Centre (AWC) 96
Villages with AWC with pucca building 86
Villages with AWW who has heard the word Malnutrition 100
Villages with AWW who make < 2 home visits per day 43
Supplementary Nutrition
Pre-school Education
Referrals
Antenatal Checkups
Immunization
Nutrition & Health Education
Growth Monitoring
No AWC Services
Fighting Hunger & Malnutrition
Children who are undernourished in early childhood are at much higher risk of, and less able to recover from infections than healthy children. As a result, they have a much higher risk of early death. Indeed, undernutrition is associated with a third of all child deaths globally. It is estimated that 150 million years of healthy life were lost to poor nutrition in 2004 - five times that lost to malaria. DFID, 2009. The Neglected Crisis of Undernutrition: Evidence for Action. DFID London

Himachal Pradesh
Fighting Hunger & Malnutrition
195

196
Mothers’ Voice (%)
Average Household Size (in numbers) 7
Mothers with no schooling 1
Fathers with no schooling 1
Mothers who have never heard the word Malnutrition 26
Mothers who had institutional delivery 77
Mothers who gave breastmilk to child as first intake 72
Mothers who breastfed within 1 hour of delivery 94
Mothers who introduced semi-solid/solid food at 6-8 months 78
Children who suffered diarrhea/fever/cough in last 1 week 12
Mothers who took their children to a trained doctor when ill 1
Mothers who had decision making power abouttheir children's welfare 80
Mothers who had decision making power about majorhousehold purchases 6
Families who used soap for washing hands before a meal 81
Families who used soap for washing hands after visit to toilet 72
Atleast one member of family consuming tobacco/liquor 64
MANDIHouseholds (%) owning assets (green)
and using services (brown)
Nutritional status of children 0-59 months (%)� Severe (<-3SD) � Severe or Moderate (<-2SD)
70
60
50
40
30
20
10
0
70
60
50
40
30
20
10
0
DLHS-2 HUNGaMA HUNGaMA HUNGaMA Severe Moderate
Underweight Stunting Wasting
0 10 20 30 40 50 60 70 80 90 100
Mothers’ Voice (%)
Average Household Size (in numbers) 6
Mothers with no schooling 3
Fathers with no schooling 1
Mothers who have never heard the word Malnutrition 51
Mothers who had institutional delivery 50
Mothers who gave breastmilk to child as first intake 74
Mothers who breastfed within 1 hour of delivery 57
Mothers who introduced semi-solid/solid food at 6-8 months 72
Children who suffered diarrhea/fever/cough in last 1 week 25
Mothers who took their children to a trained doctor when ill 3
Mothers who had decision making power abouttheir children's welfare 70
Mothers who had decision making power about majorhousehold purchases 8
Families who used soap for washing hands before a meal 70
Families who used soap for washing hands after visit to toilet 77
Atleast one member of family consuming tobacco/liquor 49
Access to Anganwadi Centre (%)
TelevisionRadio
Mobile phone4-wheeler
2-wheelerCycle
TractorPucca House
Toilet
Electricity
PDSMNREGA Card
Bank/ PO AccountHealth Insurance
SHG MembershipAny Loan
0 10 20 30 40 50 60 70 80 90 100
Households (%) owning assets (green) and using services (brown)
0 10 20 30 40 50 60 70 80 90 100
TelevisionRadio
Mobile phone4-wheeler
2-wheelerCycle
TractorPucca House
Toilet
Electricity
PDSMNREGA Card
Bank/ PO AccountHealth Insurance
SHG MembershipAny Loan
HAMIRPUR
Mid Upper ArmCircumference
Nutritional status of children 0-59 months (%)� Severe (<-3SD) � Severe or Moderate (<-2SD)
70
60
50
40
30
20
10
0
70
60
50
40
30
20
10
0
DLHS-2 HUNGaMA HUNGaMA HUNGaMA Severe Moderate
Underweight Stunting Wasting
Mid Upper ArmCircumference
Snapshot of Services Available (%)
Villages with pucca road 92
Villages with pucca drain 27
Villages with electricity 100
Villages with primary school 79
Villages with PDS shop 74
Villages with Post Office 50
Villages with Primary Health Center/Sub-Centre (PHC/SC) 31
Villages with private trained doctor 30
Villages with ASHA Worker 8
Villages with Anganwadi Centre (AWC) 100
Villages with AWC with pucca building 83
Villages with AWW who has heard the word Malnutrition 100
Villages with AWW who make < 2 home visits per day 93
Snapshot of Services Available (%)Villages with pucca road 74
Villages with pucca drain 31
Villages with electricity 100
Villages with primary school 71
Villages with PDS shop 49
Villages with Post Office 18
Villages with Primary Health Center/Sub-Centre (PHC/SC) 36
Villages with private trained doctor 14
Villages with ASHA Worker 0
Villages with Anganwadi Centre (AWC) 100
Villages with AWC with pucca building 63
Villages with AWW who has heard the word Malnutrition 100
Villages with AWW who make < 2 home visits per day 83
Supplementary Nutrition
Pre-school Education
Referrals
Antenatal Checkups
Immunization
Nutrition & Health Education
Growth Monitoring
No AWC Services
Supplementary Nutrition
Pre-school Education
Referrals
Antenatal Checkups
Immunization
Nutrition & Health Education
Growth Monitoring
No AWC Services
Access to Anganwadi Centre (%)
0 10 20 30 40 50 60 70 80 90 100
197

Kerala
Fighting Hunger & Malnutrition
199
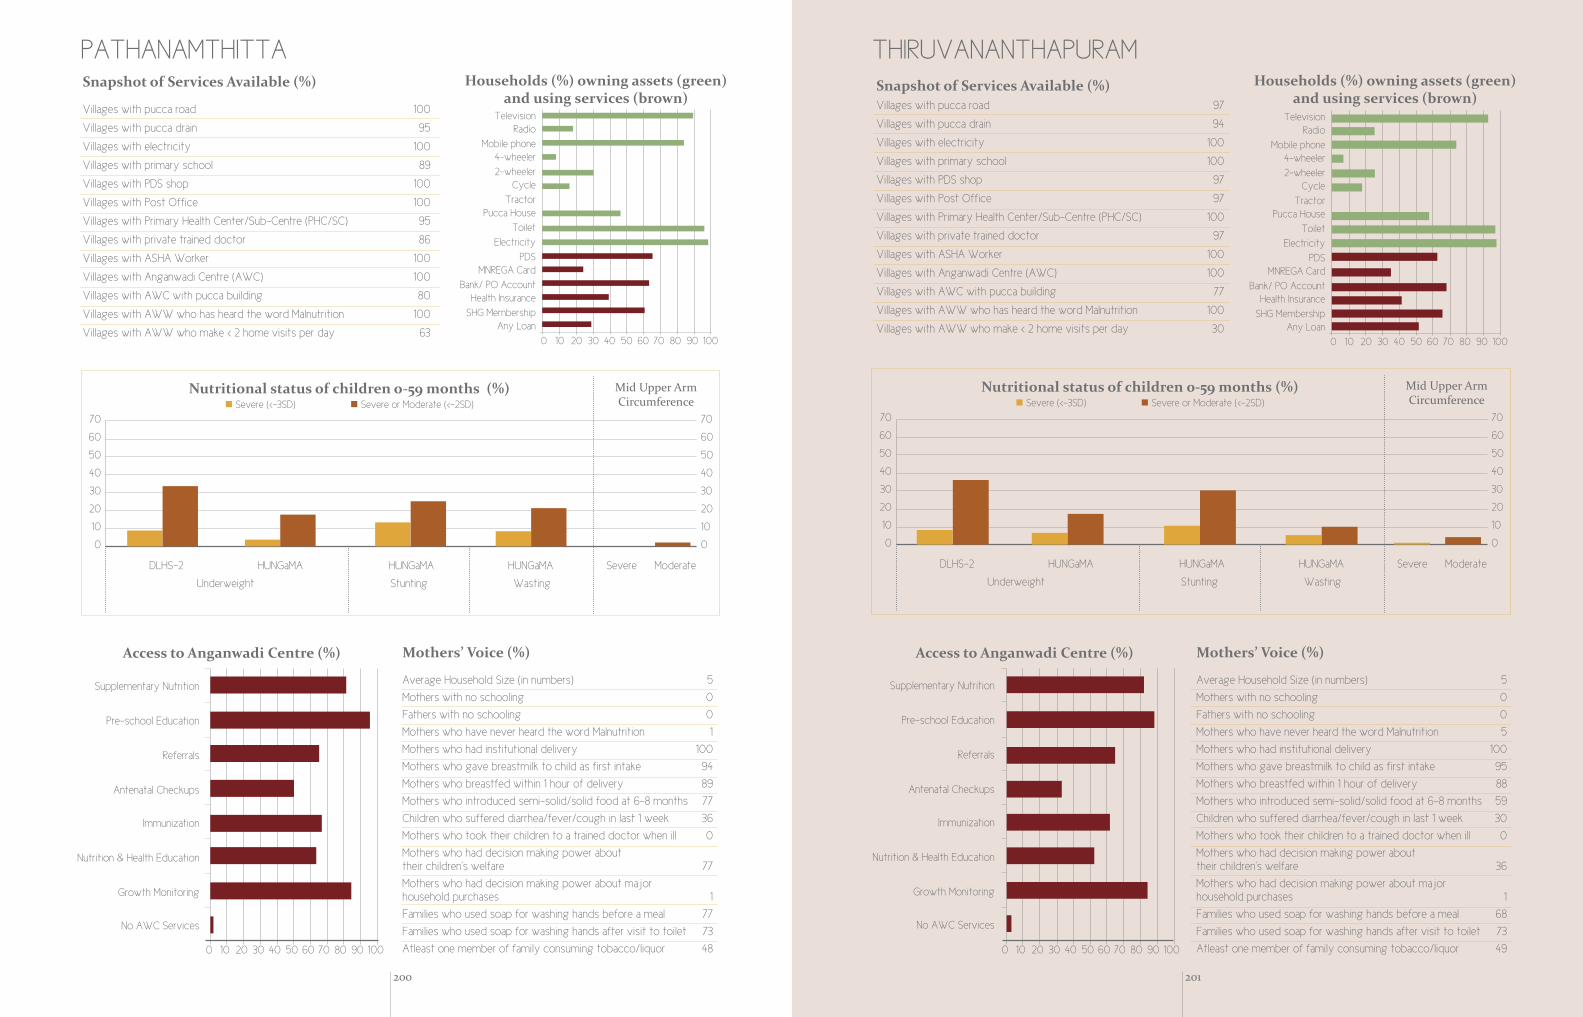
200
Mothers’ Voice (%)
Average Household Size (in numbers) 5
Mothers with no schooling 0
Fathers with no schooling 0
Mothers who have never heard the word Malnutrition 1
Mothers who had institutional delivery 100
Mothers who gave breastmilk to child as first intake 94
Mothers who breastfed within 1 hour of delivery 89
Mothers who introduced semi-solid/solid food at 6-8 months 77
Children who suffered diarrhea/fever/cough in last 1 week 36
Mothers who took their children to a trained doctor when ill 0
Mothers who had decision making power abouttheir children's welfare 77
Mothers who had decision making power about majorhousehold purchases 1
Families who used soap for washing hands before a meal 77
Families who used soap for washing hands after visit to toilet 73
Atleast one member of family consuming tobacco/liquor 48
THIRUVANANTHAPURAMHouseholds (%) owning assets (green)
and using services (brown)
Nutritional status of children o-59 months (%)� Severe (<-3SD) � Severe or Moderate (<-2SD)
70
60
50
40
30
20
10
0
70
60
50
40
30
20
10
0
DLHS-2 HUNGaMA HUNGaMA HUNGaMA Severe Moderate
Underweight Stunting Wasting
0 10 20 30 40 50 60 70 80 90 100
Mothers’ Voice (%)
Average Household Size (in numbers) 5
Mothers with no schooling 0
Fathers with no schooling 0
Mothers who have never heard the word Malnutrition 5
Mothers who had institutional delivery 100
Mothers who gave breastmilk to child as first intake 95
Mothers who breastfed within 1 hour of delivery 88
Mothers who introduced semi-solid/solid food at 6-8 months 59
Children who suffered diarrhea/fever/cough in last 1 week 30
Mothers who took their children to a trained doctor when ill 0
Mothers who had decision making power abouttheir children's welfare 36
Mothers who had decision making power about majorhousehold purchases 1
Families who used soap for washing hands before a meal 68
Families who used soap for washing hands after visit to toilet 73
Atleast one member of family consuming tobacco/liquor 49
Access to Anganwadi Centre (%)
TelevisionRadio
Mobile phone4-wheeler
2-wheelerCycle
TractorPucca House
Toilet
Electricity
PDSMNREGA Card
Bank/ PO AccountHealth Insurance
SHG MembershipAny Loan
0 10 20 30 40 50 60 70 80 90 100
Households (%) owning assets (green) and using services (brown)
0 10 20 30 40 50 60 70 80 90 100
TelevisionRadio
Mobile phone4-wheeler
2-wheelerCycle
TractorPucca House
Toilet
Electricity
PDSMNREGA Card
Bank/ PO AccountHealth Insurance
SHG MembershipAny Loan
PATHANAMTHITTA
Mid Upper ArmCircumference
Nutritional status of children 0-59 months (%)� Severe (<-3SD) � Severe or Moderate (<-2SD)
70
60
50
40
30
20
10
0
70
60
50
40
30
20
10
0
DLHS-2 HUNGaMA HUNGaMA HUNGaMA Severe Moderate
Underweight Stunting Wasting
Mid Upper ArmCircumference
Snapshot of Services Available (%)
Villages with pucca road 100
Villages with pucca drain 95
Villages with electricity 100
Villages with primary school 89
Villages with PDS shop 100
Villages with Post Office 100
Villages with Primary Health Center/Sub-Centre (PHC/SC) 95
Villages with private trained doctor 86
Villages with ASHA Worker 100
Villages with Anganwadi Centre (AWC) 100
Villages with AWC with pucca building 80
Villages with AWW who has heard the word Malnutrition 100
Villages with AWW who make < 2 home visits per day 63
Snapshot of Services Available (%)Villages with pucca road 97
Villages with pucca drain 94
Villages with electricity 100
Villages with primary school 100
Villages with PDS shop 97
Villages with Post Office 97
Villages with Primary Health Center/Sub-Centre (PHC/SC) 100
Villages with private trained doctor 97
Villages with ASHA Worker 100
Villages with Anganwadi Centre (AWC) 100
Villages with AWC with pucca building 77
Villages with AWW who has heard the word Malnutrition 100
Villages with AWW who make < 2 home visits per day 30
Supplementary Nutrition
Pre-school Education
Referrals
Antenatal Checkups
Immunization
Nutrition & Health Education
Growth Monitoring
No AWC Services
Supplementary Nutrition
Pre-school Education
Referrals
Antenatal Checkups
Immunization
Nutrition & Health Education
Growth Monitoring
No AWC Services
Access to Anganwadi Centre (%)
0 10 20 30 40 50 60 70 80 90 100
201

Tamil Nadu
Fighting Hunger & Malnutrition
203

204
Mothers’ Voice (%)
Average Household Size (in numbers) 4
Mothers with no schooling 11
Fathers with no schooling 13
Mothers who have never heard the word Malnutrition 40
Mothers who had institutional delivery 98
Mothers who gave breastmilk to child as first intake 73
Mothers who breastfed within 1 hour of delivery 69
Mothers who introduced semi-solid/solid food at 6-8 months 66
Children who suffered diarrhea/fever/cough in last 1 week 38
Mothers who took their children to a trained doctor when ill 11
Mothers who had decision making power abouttheir children's welfare 39
Mothers who had decision making power about majorhousehold purchases 20
Families who used soap for washing hands before a meal 8
Families who used soap for washing hands after visit to toilet 2
Atleast one member of family consuming tobacco/liquor 55
KANCHEEPURAMHouseholds (%) owning assets (green)
and using services (brown)
Nutritional status of children 0-59 months (%)� Severe (<-3SD) � Severe or Moderate (<-2SD)
70
60
50
40
30
20
10
0
70
60
50
40
30
20
10
0
DLHS-2 HUNGaMA HUNGaMA HUNGaMA Severe Moderate
Underweight Stunting Wasting
0 10 20 30 40 50 60 70 80 90 100
Mothers’ Voice (%)
Average Household Size (in numbers) 5
Mothers with no schooling 7
Fathers with no schooling 8
Mothers who have never heard the word Malnutrition 11
Mothers who had institutional delivery 96
Mothers who gave breastmilk to child as first intake 93
Mothers who breastfed within 1 hour of delivery 89
Mothers who introduced semi-solid/solid food at 6-8 months 67
Children who suffered diarrhea/fever/cough in last 1 week 24
Mothers who took their children to a trained doctor when ill 7
Mothers who had decision making power abouttheir children's welfare 32
Mothers who had decision making power about majorhousehold purchases 11
Families who used soap for washing hands before a meal 32
Families who used soap for washing hands after visit to toilet 31
Atleast one member of family consuming tobacco/liquor 38
Access to Anganwadi Centre (%)
TelevisionRadio
Mobile phone4-wheeler
2-wheelerCycle
TractorPucca House
Toilet
Electricity
PDSMNREGA Card
Bank/ PO AccountHealth Insurance
SHG MembershipAny Loan
0 10 20 30 40 50 60 70 80 90 100
Households (%) owning assets (green) and using services (brown)
0 10 20 30 40 50 60 70 80 90 100
TelevisionRadio
Mobile phone4-wheeler
2-wheelerCycle
TractorPucca House
Toilet
Electricity
PDSMNREGA Card
Bank/ PO AccountHealth Insurance
SHG MembershipAny Loan
COIMBATORE
Mid Upper ArmCircumference
Nutritional status of children 0-59 months (%)� Severe (<-3SD) � Severe or Moderate (<-2SD)
70
60
50
40
30
20
10
0
70
60
50
40
30
20
10
0
DLHS-2 HUNGaMA HUNGaMA HUNGaMA Severe Moderate
Underweight Stunting Wasting
Mid Upper ArmCircumference
Snapshot of Services Available (%)
Villages with pucca road 100
Villages with pucca drain 74
Villages with electricity 100
Villages with primary school 100
Villages with PDS shop 100
Villages with Post Office 75
Villages with Primary Health Center/Sub-Centre (PHC/SC) 41
Villages with private trained doctor 26
Villages with ASHA Worker 29
Villages with Anganwadi Centre (AWC) 100
Villages with AWC with pucca building 48
Villages with AWW who has heard the word Malnutrition 100
Villages with AWW who make < 2 home visits per day 20
Snapshot of Services Available (%)Villages with pucca road 88
Villages with pucca drain 15
Villages with electricity 100
Villages with primary school 89
Villages with PDS shop 99
Villages with Post Office 56
Villages with Primary Health Center/Sub-Centre (PHC/SC) 23
Villages with private trained doctor 19
Villages with ASHA Worker 21
Villages with Anganwadi Centre (AWC) 100
Villages with AWC with pucca building 48
Villages with AWW who has heard the word Malnutrition 98
Villages with AWW who make < 2 home visits per day 71
Supplementary Nutrition
Pre-school Education
Referrals
Antenatal Checkups
Immunization
Nutrition & Health Education
Growth Monitoring
No AWC Services
Supplementary Nutrition
Pre-school Education
Referrals
Antenatal Checkups
Immunization
Nutrition & Health Education
Growth Monitoring
No AWC Services
Access to Anganwadi Centre (%)
0 10 20 30 40 50 60 70 80 90 100
205
AppendicesI. Note on the Child Development Index
II. List of districts that were surveyed
III. Note on Sampling Plan & Estimates of Expected Precision
IV. Format of the Survey Tool
V. Tables to ‘Demography and Nutrition Status’
Fighting Hunger & Malnutrition
207

208
Background on the Child Development Index
The Child Development Index (CDI) was developed in 2009 by Indicus Analytics for UNICEF India. The CDI includes state and district level rankings for child welfare for 35 states (including Union Territories) and 593 districts in India. The district-level CDI rankings are based on data from three categories: health and nutrition, cognitive development and education, and safety and overall child environment. The specific data, with sources in parentheses, is provided in the table below.
The CDI is calculated using an additive approach, where all the variables are normalized (to give them comparable ranges) and a simple arithmetic mean is used to calculate an index for each of the three categories above. The three indices are then averaged – and thus, each category is given an equal weight – to come up with the final, composite index (the CDI). In cases where district-level data is not available, the state-level data is used as a proxy.
Health and Nutrition Cognitive Developmentand Education
Safety and OverallChild Development
Infant Mortality Rate(Office of Registrar Generalof India, 2001)
Immunization Rate(District Level HouseholdSurvey II (DLHS-2),Ministry of Health andFamily Welfare, 2002-04)
Oral Rehydration TherapyUse (DLHS-2, Ministry ofHealth and Family Welfare,2002-04)
Percentage of women(15-19 years) who have begunchild bearing (DLHS-2,Ministry of Health andFamily Welfare, 2002-04)
Percentage of childrenunder five who areunderweight (weight-for-agebelow -2SD) (DLHS-2, Ministryof Health and Family Welfare,2002-04)
Percentage of householdsusing iodized salt (>15ppm)(DLHS-2, Ministry of Healthand Family Welfare, 2002-04)
Child Literacy Rate(DLHS-2, Ministry of Healthand Family Welfare, 2002-04)
Primary and Middle TransitionIndex, defined as (1) the ratio ofenrolment in classes VI-VIII toenrolment in classes I-V and (2)the ratio of enrolment in classesIX-XII to enrolment in classesVI-VIII, respectively(Selected Educational Statistics,Ministry of Human ResourceDevelopment, 2004-05)
Gender Ratio (0-6 years)(DLHS-2, Ministry of Healthand Family Welfare, 2002-04)
Percentage of Householdswith Improved Source ofDrinking Water(DLHS-2, Ministry of Healthand Family Welfare, 2002-04)
Percentage of Householdswith Toilet Facility (DLHS-2,Ministry of Health and FamilyWelfare, 2002-04)
Percentage of CrimesTargeting Women (Crime inIndia, 2006, National CrimeRecords Bureau)
Percentage of Crimes that areViolent (Crime in India, 2006,National Crime RecordsBureau)
UTTAR PRADESH
AuraiyaBahraichBalrampurBandaBarabankiBudaunBulandshaharChitrakootEtahFarrukhabadFatehpurFirozabadGondaHardoiHathrasJalaunJhansiJyotiba Phule NagarKannaujKheriLalitpurMaharajganjMahobaMainpuriMathuraMirzapurMoradabadPilibhitPratapgarhRae BareliRampurSant Kabir NagarSant Ravidas NagarShahjahanpurShrawastiSiddharthnagarSitapurSonbhadraSultanpurUnnao
BIHAR
ArariaAurangabadBankaBegusaraiBuxarDarbhangaGayaJamuiJehanabadKaimur (Bhabua)KatiharKhagariaKishanganjMadhepuraMadhubaniNawadaPashchimChamparanPurba ChamparanSaharsaSamastipurSheoharSupaul
JHARKHAND
ChatraDeogharDumka GarhwaGiridihGoddaGumlaKodarmaLohardagaPakaurPalamuPashchimi SinghbhumSahibganj
MADHYA PRADESHBarwaniBhindChhatarpurDindoriGunaJhabuaPannaShivpuriTikamgarhUmariaVidisha
RAJASTHAN
BanswaraBaranBarmerBharatpurDhaulpurDungarpurJaisalmerJhalawarKarauli
ORISSA
GajapatiKandhamalKoraputMalkangiriRayagada
Kerala
Himachal Pradesh
Tamil Nadu
BiharJharkhandMadhya PradeshOrissaRajasthanUttar Pradesh
PathanamthittaThiruvananthapuramHamirpurMandiCoimbatoreKancheepuramMungerDhanbadIndoreCuttackKotaGautam Buddha Nagar
BEST DISTRICTS
Appendix IBackground on the Child Development Index
Appendix IIList of Surveyed Districts
209

210 211
Sampling Plan and Estimates of Expected Precision for the 2011 HUNGaMA Survey
Basic Design
The scope of this survey is restricted to the 100 “focus” and 12 “best” districts in nine states in order to compare and contrast the extremes of child nutrition levels. Here focus and best districts are designated through ranking by UNICEF’s composite Child Development Index, which includes a broad range of indicators on health, education, labor, and other factors. The frame used for drawing the sample from within these districts was based on the 2001 Indian Census. For census purposes, each state and Union Territory in India is divided into districts. Districts are further distinguished by sub-districts which consist of urban towns and wards, and rural villages. This survey is restricted to rural villages within the 112 pre-identified districts only. Rural villages were selected as the focus for two main reasons: first, rural areas tend to be characterized by higher levels of
malnutrition than urban areas and thus pose a more urgent malnutrition problem; and second, limiting the survey to one type of setting greatly simplified the logistics of the exercise, reducing time and cost on a variety of dimensions. Given that estimates of reasonable precision were desired at the district level, districts were the largest level of geography considered and all sampling occurred at a lower level. From each district, 30 villages were selected. The rationale behind this figure will be discussed later in the document.
To select 30 villages per district, all villages within a given district with greater than 50 households were sorted in decreasing order of population size using information from the 2001 Census. Note that villages having less than 50 households were excluded from the survey. This is because the selection of 50 households per village in best districts (which will be described in more detail later on) forced a minimum village size; this minimum was adopted in focus districts as well, for simplicity’s sake. Although the exclusion of small villages from the frame reduced the number
of villages from 140,228 to 109,732, the reduction only accounted for 2.8% of all households in the 112 districts considered. That is to say, 27,383,672 of the original 28,173,931 households remained on the frame. While this exclusion potentially might have somewhat of a biasing effect on estimates given that the inhabitants of smaller villages might be more malnourished, it is likely this bias would be minimal.
Six strata of roughly equal size (containing roughly one-sixth of the district population each) were formed. Thus, the first stratum within each district contained a small number of large villages and the sixth stratum contained a large number of small villages. The villages within each of the six strata were then sorted in increasing order of female literacy using information from the 2001 Census. Sorting prior to selecting villages by systematic sampling was implemented to reduce intra-cluster correlation by ensuring that the selected villages would have widely varying values of female literacy – given this variable was believed to be correlated with nutrition outcomes. Five villages were selected within each of the six strata with equal probability using systematic sampling. Thus, the sampling rate within each of the six strata was taken as 5/(# villages in stratum). Westat India provided the sample file with 30 selected villages per district for all 112 districts (for a total of 3,360 villages) to Naandi Foundation as a basis to initiate field work and to randomly select households within the sampled villages. In best districts, at least 50 households were selected per village, and in focus districts at least 37 households were generally selected per village (the number of households selected per village was revised upwards in cases where an especially low fertility rate led to a much smaller proportion of eligible households). Thus, in best districts at least 1,500 households were randomly selected per district, and in focus districts at least 1,200 households were randomly selected per district. The rationale for the choice of these figures was a balance between ensuring adequate precision
levels for the district-level estimates and operational considerations. More details on these aspects will be provided in the “Expected Precision” section of this document.
Using village household counts from the 2001 Census, villages were divided into two categories: large villages (greater than 300 households as of the 2001 Census) and small villages. Large villages were “chunked” into roughly equal-sized smaller segments, where each segment represented a reasonable interviewer workload (no more than about 100 households). Two segments within each of the larger villages were selected at random. Smaller villages were not segmented. Canvassing of the two selected segments in larger villages or the entire village in case of smaller villages was done, to obtain an accurate overall household count of the segments or small village.
In all districts, the households were selected for interviewing as follows: a sampling interval, X, was calculated by dividing the small village/segment household count by the target number of households visited per village (e.g. 50 in best districts, 37 in focus districts). A random starting point within the village corresponding to the first selected household to be interviewed was selected in each sampled small village/segment, and each Xth household thereafter within the small village/segment was also selected and interviewed. Since the preponderance of questions in HUNGaMA relate to children 0-59 months, the selected households were screened for eligible members prior to interviewing. Any household not having at least one eligible member was dropped from the sample and coded as ineligible.
A “shadow” or replacement sample of villages was also selected to protect against the possibility of entire villages being discarded in the field due to issues of access, security, civil unrest, flooding or other extreme weather. Once the original sample of villages was randomly
Appendix III

212 213
selected, the shadow then consisted of the next village within the same stratum on the sorted frame. The replacement villages were selected to be as close as possible to the original selected villages (in terms of size and female literacy) so as to mimic the characteristics of the original selected village. Note that it was only possible to select shadows for 3,330 villages of the original 3,360 selected villages since 30 villages had no available shadow. For these cases, there were no villages in between the original selected villages on the frame, and thus there was no available replacement. The operating principle behind using the shadow sample was that only those villages that required replacement would be substituted; the remainder of the original sample would remain intact.
Expected Precision
Although a broad spectrum of variables are collected through HUNGaMA, three indicators that are considered key with regards to benchmarking children’s progress are Weight-for-Age (WFA), Height-for-Age (HFA) and Weight-for-Height (WFH). For the HUNGaMA survey, the target population of children was restricted to those aged between 0 and 59 months. The indicators used to quantify Weight-for-Age are defined as “the percentage of children whose weight-to-age ratio is less than 2 (or 3) standard deviations of the median from the international reference population”. In this document, the corresponding indicators for Weight-for-Age will be denoted WFA-2SD and WFA-3SD, respectively. The indicators for HFA and WFH are defined analogously. In balancing resource and time constraints against the need to produce estimates of indicators of adequate precision at the district level, the target sample size was set at 900 completed households interviews in each of the 12 best districts, and 660 completed household interviews in each of the 100 focus districts, for a total sample size of 76,800 completed household interviews. This was achieved by aiming for completed interviews in 30 households per village in each of 30 villages in best
districts, and completed interviews in 22 households per village in each of 30 villages in focus districts. These targets were reached in over 40% of districts – in the rest, while the -3SD estimates reach more insecure precision levels, the -2SD estimates remain fairly robust for underweight and stunting.
However, given that households were prescreened and only households containing at least one eligible member aged 0-59 months were kept for interviewing, the sample was pre-inflated by 40% to compensate for households with no eligible members. Although the survey restricts itself to measurement on children aged 0-59 months, auxiliary information from Census 2001 was only available for children aged 0-6 years. Using Census 2001 data, it was estimated that only 71% of households sampled would contain any members aged 0-6 years old, and thus, the inflation factor was calculated as the inverse of this. Furthermore, it is assumed that less than 85% of households would respond to the survey, so the sample was also pre-inflated by 20% to account for non-responding households. Thus 30*1.4*1.2 = 50 households per village were selected in best districts, and 22*1.4*1.2 = 37 households per village were selected in focus districts (though these were revised upwards in villages where ineligibility was unusually high due to low fertility rates).
In sum, although it was deemed necessary to obtain 30 completed household interviews per village in best districts, and 22 completed household interviews per village in focus districts to ensure estimates of adequate precision at the district level, it was necessary to pre-inflate the sample size and select at least 50 households per village in best districts and at least 37 households per village in focus districts, in order to compensate for households that would be screened out or would not respond to the survey. The estimate of 71% of households containing at least one member aged 0-6 years old was derived using 2001 Census data, which indicated that there was an average of 1.22 children aged 0-6
years per household. Using the Poisson distribution, it was then estimated that the probability of a household containing no children aged 0-6 years was 0.29. This is equivalent to 71% of households containing at least one such member.
A typical measure of precision used in surveys is the percentage Coefficient of Variation (CV) associated with an estimate. It is a scale-less quantity represented by the standard error of the estimate (WFA-2SD or WFA-3SD) divided by the estimate itself, multiplied by 100. In order to have a sense of the level of precision that could be expected from such a sample size, it was of interest to consider the percentage CV associated with each of the district-level estimates WFA, HFA and WFH at both the 2SD and 3SD levels. However, since the only data that were available at the district level from the 2002-2004 DLHS (District Level Household Survey) was for WFA-2SD and WFA-3SD, the ifocus of our precision calculations was restricted to these indicators. In calculating the percentage CV, the
values for the denominators were taken from the 2002-2004 DLHS. The values for the numerators (standard errors of the estimates) were computed by taking into account that the design was a two-stage sample of villages drawn from districts using probability-proportional-to-size (PPS) sampling, followed by a systematic sample of households within villages.
The extent to which the standard error is inflated from 1.0 due to using a complex two-stage design over a design based on simple random sampling is captured through a quantity called the “Design Effect” (DEFF). The DEFF typically consists of two components: one due to a sample design effect and the other due to an unequal weighting effect. For HUNGaMA, the main sample design effect was due to clustering, the random selection of villages within districts at the first stage of sampling. This clustering effect is a function of both the sample size per village as well as a village-level intra-class correlation (ICC) term. The ICC measures the homogeneity of the characteristic being measured (WFA) for sampled

214 215
units within a village and its value typically lies between 0 and 1. For the purposes of the calculations here, an ICC value of 0.04 was used, based on a paper by Verma and Le (1996) which calculated the ICC for WFA via Demographic and Health Surveys in rural areas averaged across 48 developing countries. However, in HUNGaMA there was a second clustering effect due to obtaining answers to the questionnaire on behalf of all 0-59 month-old children residing in a selected household. Children within the same household would tend to have a high ICC value with respect to nutrition. The contribution to the DEFF due to this within-household clustering was not accounted for in the calculation but has the potential to substantially lower the precision of estimates given that 33% of households in the 112 districts contain two or more children aged 0-6 years. This estimate was derived using the Poisson distribution and based on Census 2001 figures. However, this reduction in precision would likely be offset by the increased sample size due to multiple children per household contributing to estimates of WFA, HFA and WFH.
The second component of the overall DEFF due to unequal weighting generally reflects the variability from drawing sample units with unequal probabilities (and hence generating unequal weights). Due to the self-weighting design of HUNGaMA, this component was assumed to be close to 1.0. Note that the self-weighting aspect derives from the fact that selection probabilities at the two stages of sampling (villages and households) multiply to a factor that is roughly constant across each of the six strata described above. A heuristic explanation for this can be seen by contrasting selection probabilities in the first and sixth strata. In the first stratum, which consists of fewer large sized villages, the first stage sampling fraction is large but the second stage inverse sampling interval is small. Conversely, in the sixth stratum, which consists of many smaller-sized villages, the first-stage sampling fraction is small but the second-stage inverse sampling interval is large.
Table 1 below gives the results of the precision calculation for all 112 districts included in the HUNGaMA survey. The Estimates of WFA-3SD and WFA-2SD are shown (obtained from DLHS 2002-2004), as well as the associated percentage CVs, derived in the manner indicated above. A rough rule of thumb that is generally used in surveys is that CVs of 10% or less associated with estimates are considered to be acceptable levels of precision. CVs greater than 15% are considered questionable and CVs greater than 25% are considered un-publishable. Note that best villages were allocated slightly higher sample sizes (30 households per village) than focus villages (22 households per village), since the former had smaller values of WFA-2SD and WFA-3SD than the latter, and thus would generate higher percentage CV values for an equivalent sample size. Giving the best districts a slightly larger sample size would help to improve the precision by lowering these CVs. Despite the larger sample size per district in best districts relative to focus districts, Table 1 shows that the corresponding percentage CVs are still higher for the former group. In general, since the values for WFA-3SD are always lower than those for WFA-2SD (by definition), the percentage CVs associated with WFA-3SD are always greater than those for WFA-2SD. Table 1 illustrates this clearly.
A summary of the results across the best and focus districts is given in Table 2, where the maximum, minimum and median percentage CV for WFA-3SD and WFA-2SD are presented. Here it can be seen that for the 100 focus districts, all estimates are likely to be publishable, assuming that the WFA-3SD and WFA-2SD values from HUNGaMA are roughly the same as those from DLHS 2002-2004. The associated median percentage CV values for WFA-3SD and WFA-2SD are 9.33% and 4.56%, respectively (which means that the percentage CV values for half the districts will be less than 9.33% and 4.56%, respectively), while the maximum percentage CV values are 15.32% and 6.11%, respectively. However, in the 12 best districts, while all WFA-2SD estimates are likely to be publishable (median and maximum
percentage CV values are 5.95% and 12.19%, respectively), roughly only half of the WFA-3SD estimate may be publishable (median percentage CV value is 13.49%).
As a final note, of the 3 indicators mentioned above, Weight-for-Height (WFH) is likely to have lower incidence rates than WFA, making the precision levels for WFH somewhat lower. Unfortunately, a direct analysis of WFH was not possible since the values at the district level from DLHS were not available.
Since the possibility of conducting a second HUNGaMA survey using a fresh cross-sectional sample at a future point in time is being considered, it is assumed there would be a strong interest in measuring change in the key indicators WFA-2SD and WFA-3SD over time. However, given that there is likely to be only a few percentage points of difference in either of these indicators across two time points, the given sample size will not provide sufficient power to be able to detect these small differences at the district level (assuming 660 completed interviews per district in focus districts and 900 in best districts). However, it may be possible to detect such differences at a more aggregate level with a larger sample size. For example, such an aggregate level might consist of seven broad groupings: Six state-level groupings consisting of the100 focus districts (where the number of districts included in each state varies) plus the best districts grouped together as a seventh category. Such a set of groupings are shown in Table 3.
On this basis, a reverse power calculation was computed using software called NQuery Advisor to see what the smallest detectable difference would be under this scenario. Table 3 gives the results. In this table, the WFA-2SD and WFA-3SD values used are averaged DLHS values over the districts involved. The sample size in the third to last column is given as the (# districts)*660 for the six states comprising the 100 focus districts, and (# districts)*900 for the seventh category comprising all the best districts. A two-tailed
Chi-Squared test was used and 80% power was assumed. Note that the Chi-Squared test assumes independence of the samples between the time points. This may not bethe case, and therefore, the results may be somewhat overstated. The last two columns give the smallest percentage differences that can be detected assuming the given sample sizes, 80% power and the percentage values at time point 1 in the middle columns. The results show that for both WFA-2SD and WFA-3SD, reasonably small differences can successfully be detected. The detectable differences range from as small as 1.0% for WFA-3SD in Uttar Pradesh to as large as 3.3% for WFA-2SD in Orissa. Thus an analysis of this type should be restricted to the more aggregate level as indicated �
ReferenceVerma, V. and Le, T. (1996), “An analysis of sampling errors for the Demographic and Health Surveys”, International Statistical Review, 64(3), pp 265-294.

216 217
Himachal Pradesh Mandi Best 12.6 36.1 12.90 6.52
Himachal Pradesh Hamirpur Best 14.5 45.6 11.90 5.35
Rajasthan Kota Best 22 63.1 9.22 3.75
Uttar Pradesh Gautam Buddha Nagar Best 10.1 35.2 14.62 6.65
Bihar Munger Best 21.2 51.1 9.44 4.79
Jharkhand Dhanbad Best 10.8 50.6 14.08 4.84
Orissa Cuttack Best 1.9 13.9 35.20 12.19
Madhya Pradesh Indore Best 14.2 45 12.04 5.42
Kerala Pathanamthitta Best 9.2 33.9 15.39 6.84
Kerala Thiruvananthapuram Best 8.5 36.3 16.07 6.49
Tamil Nadu Kancheepuram Best 9.5 33.7 15.12 6.87
Tamil Nadu Coimbatore Best 31.2 52.6 7.27 4.65
Rajasthan Bharatpur Focus 22.1 45.4 9.70 5.66
Rajasthan Dhaulpur Focus 27.8 61.6 8.32 4.08
Rajasthan Karauli Focus 28.6 58.7 8.16 4.33
Rajasthan Jaisalmer Focus 39 69.6 6.46 3.41
Rajasthan Barmer Focus 45 72.6 5.71 3.17
Rajasthan Dungarpur Focus 28.6 57 8.16 4.49
Rajasthan Banswara Focus 15.2 41.7 12.20 6.11
Rajasthan Baran Focus 34.6 66.9 7.10 3.63
Rajasthan Jhalawar Focus 32.1 52.6 7.51 4.90
Uttar Pradesh Moradabad Focus 25.6 72.7 8.80 3.16
Utta rPradesh Rampur Focus 19.5 44.3 10.49 5.79
Uttar Pradesh Jyotiba Phule Nagar Focus 38.7 68.1 6.50 3.53
Uttar Pradesh Bulandshahar Focus 71.7 96 3.24 1.05
Uttar Pradesh Hathras Focus 46.6 71.2 5.53 3.28
Uttar Pradesh Mathura Focus 40.7 57.6 6.23 4.43
Uttar Pradesh Firozabad Focus 19.6 45.7 10.46 5.63
Uttar Pradesh Etah Focus 19.8 48.9 10.39 5.28
Approximate% Cv(For Wfa-2sd)
State District Type OfDistrict
% Weight-for-age-3sdFrom DLHS2002-2004
% Weight-for-age-2sdFrom DLHS2002-2004
Approximate% Cv(For Wfa-3sd)
Approximate% Cv(For Wfa-2sd)
State District Type OfDistrict
% Weight-for-age-3sdFrom DLHS2002-2004
% Weight-for-age-2sdFrom DLHS2002-2004
Approximate% Cv(For Wfa-3sd)
Uttar Pradesh Mainpuri Focus 56.5 88.1 4.53 1.90
Uttar Pradesh Budaun Focus 21.3 50.2 9.93 5.14
Uttar Pradesh Pilibhit Focus 25.7 55.1 8.78 4.66
Uttar Pradesh Shahjahanpur Focus 24.7 49.7 9.02 5.20
Uttar Pradesh Kheri Focus 21.9 56.9 9.75 4.49
Uttar Pradesh Sitapur Focus 19.2 53.6 10.59 4.80
Uttar Pradesh Hardoi Focus 18.6 46.6 10.80 5.53
Uttar Pradesh Unnao Focus 23.5 64.1 9.32 3.86
Uttar Pradesh Rae Bareli Focus 19.6 55.1 10.46 4.66
Uttar Pradesh Farrukhabad Focus 54.8 84 4.69 2.25
Uttar Pradesh Kannauj Focus 17.7 46.5 11.14 5.54
Uttar Pradesh Auraiya Focus 32.9 76.9 7.37 2.83
Uttar Pradesh Jalaun Focus 16.6 52.3 11.57 4.93
Uttar Pradesh Jhansi Focus 25.3 57.2 8.87 4.47
Uttar Pradesh Lalitpur Focus 23.4 64.6 9.34 3.82
Uttar Pradesh Mahoba Focus 22.5 61.5 9.58 4.09
Uttar Pradesh Banda Focus 22 57.7 9.72 4.42
Uttar Pradesh Chitrakoot Focus 22.5 61.1 9.58 4.12
Uttar Pradesh Fatehpur Focus 24.1 61.4 9.16 4.09
Uttar Pradesh Pratapgarh Focus 21.6 56 9.84 4.58
Uttar Pradesh Barabanki Focus 16 48.2 11.83 5.35
Uttar Pradesh Sultanpur Focus 19.5 52.7 10.49 4.89
Uttar Pradesh Bahraich Focus 16.8 44.9 11.49 5.72
Uttar Pradesh Shrawasti Focus 14.6 50.5 12.49 5.11
Uttar Pradesh Balrampur Focus 23 55.8 9.45 4.60
Uttar Pradesh Gonda Focus 18.8 50.3 10.73 5.13
Uttar Pradesh Siddharthnagar Focus 18.8 54.3 10.73 4.74
Uttar Pradesh SantKabir Nagar Focus 17 53 11.41 4.86
Uttar Pradesh Maharajganj Focus 20.6 58.9 10.14 4.31
Uttar Pradesh SantRavidas Nagar Focus 19.1 54 10.63 4.77
Uttar Pradesh Mirzapur Focus 30.9 61.9 7.72 4.05
TABLE 1: Percentage Coefficients of Variation (CVs) for Weight-for-Age (-3SD) and Weight-for-Age (-2SD) for 112 districts of India assuming 30 households per village for best districts and 24 households per village in focus districts, and assuming 30 villages per district

218 219
Uttar Pradesh Sonbhadra Focus 22.7 54.4 9.53 4.73
Bihar Pashchim Champaran Focus 26.6 59.6 8.58 4.25
Bihar Purba Champaran Focus 22.7 54.3 9.53 4.74
Bihar Sheohar Focus 18.2 52 10.95 4.96
Bihar Madhubani Focus 27.8 62.9 8.32 3.97
Bihar Supaul Focus 28.6 58.6 8.16 4.34
Bihar Araria Focus 33.3 62.6 7.31 3.99
Bihar Kishanganj Focus 22.3 52.5 9.64 4.91
Bihar Katihar Focus 21.8 53.2 9.78 4.84
Bihar Madhepura Focus 40.7 71.4 6.23 3.27
Bihar Saharsa Focus 22.4 56.1 9.61 4.57
Bihar Darbhanga Focus 27.9 58 8.30 4.39
Bihar Samastipur Focus 26.1 57.8 8.69 4.41
Bihar Begusarai Focus 20.2 48.5 10.26 5.32
Bihar Khagaria Focus 26.7 56.2 8.56 4.56
Bihar Banka Focus 17.7 44.3 11.14 5.79
Bihar Buxar Focus 21.6 56.8 9.84 4.50
Bihar Kaimur(Bhabua) Focus 26.3 58.6 8.64 4.34
Bihar Jehanabad Focus 29.9 59.5 7.91 4.26
Bihar Aurangabad Focus 23.5 60 9.32 4.22
Bihar Gaya Focus 25.1 59.2 8.92 4.29
Bihar Nawada Focus 20.5 50.2 10.17 5.14
Bihar Jamui Focus 21.5 55.4 9.87 4.63
Jharkhand Garhwa Focus 18.4 50.5 10.87 5.11
Jharkhand Palamu Focus 21.6 50.7 9.84 5.09
Jharkhand Chatra Focus 24 54.5 9.19 4.72
Jharkhand Kodarma Focus 25.9 61.6 8.73 4.08
Jharkhand Giridih Focus 32 62.9 7.53 3.97
Jharkhand Deoghar Focus 22.1 48.4 9.70 5.33
Jharkhand Godda Focus 20.2 50.4 10.26 5.12
Jharkhand Sahibganj Focus 35.3 62.7 6.99 3.98
Approximate% Cv(For Wfa-2sd)
State District Type OfDistrict
% Weight-for-age-3sdFrom DLHS2002-2004
% Weight-for-age-2sdFrom DLHS2002-2004
Approximate% Cv(For Wfa-3sd)
Approximate% Cv(For Wfa-2sd)
State District Type OfDistrict
% Weight-for-age-3sdFrom DLHS2002-2004
% Weight-for-age-2sdFrom DLHS2002-2004
Approximate% Cv(For Wfa-3sd)
Jharkhand Pakaur Focus 15.9 50.7 11.88 5.09
Jharkhand Dumka Focus 27.5 62 8.38 4.04
Jharkhand Lohardaga Focus 16.6 48 11.57 5.37
Jharkhand Gumla Focus 15.2 50.3 12.20 5.13
Jharkhand Pashchimi Singhbhum Focus 24.8 55.6 8.99 4.61
Orissa Gajapati Focus 14.2 50.7 12.69 5.09
Orissa Kandhamal Focus 17.5 48.7 11.21 5.30
Orissa Rayagada Focus 22.4 50.6 9.61 5.10
Orissa Koraput Focus 15.6 43.5 12.01 5.89
Orissa Malkangiri Focus 25.6 56.1 8.80 4.57
MadhyaPradesh Bhind Focus 24.3 60.7 9.11 4.16
Madhya Pradesh Shivpuri Focus 30.8 65.2 7.74 3.77
Madhya Pradesh Guna Focus 25.9 61 8.73 4.13
Madhya Pradesh Tikamgarh Focus 26.1 54.7 8.69 4.70
Madhya Pradesh Chhatarpur Focus 27.2 60.8 8.45 4.15
Madhya Pradesh Panna Focus 30.7 62.7 7.76 3.98
Madhya Pradesh Umaria Focus 10.2 46.3 15.32 5.56
Madhya Pradesh Jhabua Focus 34.1 65.5 7.18 3.75
Madhya Pradesh Barwani Focus 31.7 64.7 7.58 3.81
Madhya Pradesh Vidisha Focus 25.1 60.9 8.92 4.14
Madhya Pradesh Dindori Focus 24.7 58.8 9.02 4.32

220 221
TABLE 2: Summary Statistics for Percentage CVs for Weight-for-Age (-3SD) and Weight-for-Age (-2SD) across 112 districts of India
Summary Statistics For %cvs
BEST DISTRICTS FOCUS DISTRICTS
MAX %CV (WFA-3SD) 35.20 MAX %CV (WFA-3SD) 15.32
MIN %CV (WFA-3SD) 7.27 MIN %CV (WFA-3SD) 3.24
MEDIAN %CV (WFA-3SD) 13.49 MEDIAN %CV (WFA-3SD) 9.33
MAX %CV (WFA-2SD) 12.19 MAX %CV (WFA-2SD) 6.11
MIN %CV (WFA-2SD) 3.75 MIN %CV (WFA-2SD) 1.05
MEDIAN %CV (WFA-2SD) 5.95 MEDIAN %CV (WFA-2SD) 4.56
TABLE 3: Smallest Detectable Percentage Differences over two time points for Weight-for-Age (-3SD) and Weight-for-Age (-2SD) for Six States and the Best Districts
Focus Bihar 22 25.05 56.71 15,840 1.40% 1.60%
Focus Jharkhand 13 23.03 54.48 9,360 1.70% 2.00%
Focus Madhya Pradesh 11 26.43 60.11 7,920 2.00% 2.20%
Focus Orissa 5 19.06 49.92 3,600 2.70% 3.30%
Focus Rajasthan 9 30.33 58.45 6,480 2.30% 2.40%
Focus Uttar Pradesh 40 25.86 58.55 28,800 1.00% 1.10%
Best Multiple States 12 13.8 41.42 10,800 1.30% 1.90%
Type ofDistrictsIncluded State
Numberof DistrictsIncluded
AverageWeight-for-age (3SD)at time 1
AverageWeight-for-age (2SD)at time 1
SampleSize
SmallestDetectablePercentageDifferencesOver TwoTime PointsAssuming80% Power& 2-SidedTest (WFA-3SD)
SmallestDetectablePercentageDifferencesOver TwoTime PointsAssuming80% Power& 2-SidedTest (WFA-2SD)
Fighting Hunger & Malnutrition
While child mortality rates are on average 148 per 1,000 in sub-Saharan Africa and 78 per 1,000 in South Asia, the rates in industrialised countries are up to 25 times lower (6 deaths per 1,000).
UNICEF - The State of the World’s Children 2009: pages 8-9

222 223
State Code District code Village code
1. State _____________________________________________ State Code
2. District ___________________________________________ District Code
3. Village _____________________________________.........____ Village Code
4. Surveyor 1 _________________________________________ Code
5. Surveyor 2 ________________________________________ Code
6. Start Date __________/_________/20_______
7. End Date __________/_________/20_______
HUNGaMA 2011 – Village and Anganwadi Centre Survey
Small Village1
Large Village2
Total number of houses
Interval (N) = Total houses / 40
Interval (N) = __________________ (in whole numbers)
Total number of segments _____________________
Segment interval = Total segments / 2
Segment interval = __________________________
Second segment number _____________________.....
Total number of houses ________________________
Interval (N) = Total houses / 25
Interval (N) = _______ (in whole numbers)
Total number of houses ________________________
Interval (N) = Total houses / 25
Interval (N) = _______ (in whole numbers)
First segment number _____________________.....
HUNGaMA 2011 – Village and Anganwadi Centre Survey
1 2 3 4 5 6 7 8 9 10 11 12 13 14 15
16 17 18 19 20 21 22 23 24 25 26 27 28 29 30
31 32 33 34 35 36 37 38 39 40 41 42 43 44 45
46 47 48 49 50 51 52 53 54 55 56 57 58 59 60
61 62 63 64 65 66 67 68 69 70 71 72 73 74 75
76 77 78 79 80 81 82 83 84 85 86 87 88 89 90
91 92 93 94 95 96 97 98 99 100 101 102 103 104 105
106 107 108 109 110 111 112 113 114 115 116 117 118 119 120
121 122 123 124 125 126 127 128 129 130 131 132 133 134 135
136 137 138 139 140 141 142 143 144 145 146 147 148 149 150
151 152 153 154 155 156 157 158 159 160 161 162 163 164 165
166 167 168 169 170 171 172 173 174 175 176 177 178 179 180
181 182 183 184 185 186 187 188 189 190 191 192 193 194 195
196 197 198 199 200 201 202 203 204 205 206 207 208 209 210
211 212 213 214 215 216 217 218 219 220 221 222 223 224 225
226 227 228 229 230 231 232 233 234 235 236 237 238 239 240
241 242 243 244 245 246 247 248 249 250 251 252 253 254 255
256 257 258 259 260 261 262 263 264 265 266 267 268 269 270
271 272 273 274 275 276 277 278 279 280 281 282 283 284 285
286 287 288 289 290 291 292 293 294 295 296 297 298 299 300
Appendix IVHOUSE NUMBER CHART

224 225
State Code District code Village code
MAP SHEET N
W
HUNGaMA 2011 – Village and Anganwadi Centre Survey
V. H H . 1 List every house visited and circle the appropriate option (Table 1)
HouseNo.
Name of Head of FamilySurveyedhouses
Not surveyed houses Check if house to
bevisitedagain
Noeligiblechild
Refused/Other
Lockedhouse
1 1 2 3 4
2 1 2 3 4
3 1 2 3 4
4 1 2 3 4
5 1 2 3 4
6 1 2 3 4
7 1 2 3 4
8 1 2 3 4
9 1 2 3 4
10 1 2 3 4
11 1 2 3 4
12 1 2 3 4
13 1 2 3 4
14 1 2 3 4
15 1 2 3 4
16 1 2 3 4
17 1 2 3 4
18 1 2 3 4
19 1 2 3 4
20 1 2 3 4
21 1 2 3 4
22 1 2 3 4
23 1 2 3 4
24 1 2 3 4
25 1 2 3 4
TOTAL Table 1

226 227
State Code District code Village code
V. H H . 1 List every house visited and circle the appropriate option (Table 2)
HouseNo.
Name of Head of FamilySurveyedhouses
Not surveyed houses Check if house to
bevisitedagain
Noeligiblechild
Refused/Other
Lockedhouse
26 1 2 3 4
27 1 2 3 4
28 1 2 3 4
29 1 2 3 4
30 1 2 3 4
31 1 2 3 4
32 1 2 3 4
33 1 2 3 4
34 1 2 3 4
35 1 2 3 4
36 1 2 3 4
37 1 2 3 4
38 1 2 3 4
39 1 2 3 4
40 1 2 3 4
41 1 2 3 4
42 1 2 3 4
43 1 2 3 4
44 1 2 3 4
45 1 2 3 4
46 1 2 3 4
47 1 2 3 4
48 1 2 3 4
49 1 2 3 4
50 1 2 3 4
TOTAL Table 2
HUNGaMA 2011 – Village and Anganwadi Centre Survey
V2. Total Number of Houses
Table 1 Table 2 Total
No of surveyed houses
No eligible children
Refused/other
House locked
Total number of houses visited
V3. Circle the appropriate answer after observation Yes No
V1. Does the village have electricity? 1 2
V2. Is the village connected with a pucca road? 1 2
V3. STD phone booth? 1 2
V4. Post office? 1 2
V5. PDS shop? 1 2
V6. Pucca drain? 1 2
V7. Bank? (Any kind) 1 2
V8. Anganwadi center? 1 2
V9. Government primary school (Class 1-5) 1 2
V10. Government middle school (Class 6-8) 1 2
V11. Government high school (Class 9-10) 1 2
V12. Primary Health Centre/Sub-Centre? 1 2
V13. Other (Private) trained doctor? 1 2
Ask these questions to the Sarpanch or a village resident Yes No
V14. Accredited Social Health Activist (ASHA) worker available? 1 2
V15. Auxiliary Nurse Midwife (ANM) available? 1 2
V16. What is the source of drinking water in the village?
A. Hand pump 1 2
B. Tap/pipeline 1 2
C. Well 1 2
D. Pump set 1 2
E. Other 1 2

228 229
State Code District code Village code
A4. Name of Anganwadi Center
A5. Number of 0-3 children enrolled (from the AWC register)
A6. Number of 3-6 children enrolled (from the AWC register)
A1. Is there an Anganwadi Center in the village?(If No, Skip Q A2 to A 39)
Yes - 1 No - 2
A2. Was the Anganwadi Center open? (During any of the days of the survey)
Yes - 1 No - 2
A3. How many children are present? (Do a head count)
Anganwadi Center Questionnaire
Circle Yes or No for each question(Answer from observation rather than by asking the Anganwadi Worker (AWW)
Yes No Yes No
A7. Is the AWW present? 1 2 A15. Is the growth monitoring booklet available? 1 2
A8. Is the Anganwadi Helper present? 1 2A16. Is the growth monitoring booklet updated in the last 2 months?
1 2
A9. Type of building (Circle only one)
Pucca? 1 A17. Are the dates of birth for most children recorded? 1 2
Semi-Pucca? 2 A18. Is a weighing machine available? 1 2
Kutcha? 3A19. Is the weighing machine functioning? (Check height board weight)
1 2
No building? 4 A20. Any ready-to-use food available? 1 2
A10. Is there a functioning toilet? 1 2 A21. Children given freshly cooked food? 1 2
A11. Is there a functioning hand pump/tap/well? 1 2A22. Have you seen any signs of food being cooked or served?
1 2
A12. Are there any health/nutrition post-ers?
1 2A23. Has the supervisor visited in last one month? (Check with the register)
1 2
A13. Is there any NFHS data poster? 1 2 A24. AWW lives in the same village? 1 2
A14. Is a medical kit available? 1 2
HUNGaMA 2011 – Village and Anganwadi Centre Survey
A39. What is important for keeping the child healthy and strong? (Do not read these. Circle the ones she says.)
A39.1 Breastfeeding soon after birth 1 A39.9 Clean food 9
A39.2 Exclusive breastfeeding up to 6 months of age 2 A39.10 Adequate food 10
A39.3 Beginning supplementary food at 6 months 3 A39.11 Balanced diet 11
A39.4 Timely and full immunizations 4 A39.12 Washing hands with soap before eating 12
A39.5 Going to a doctor if the child falls sick 5 A39.13 More money to buy food 13
A39.6 Supplementary vitamins 6 A39.14 Keeping the child clean 14
A39.7 Clean house 7 A39.15 Other 98
A39.8 Clean water 8 A39.16 Don’t know 99
Nutrition questions for Anganwadi Worker/Helper (Circle the correct answer)
A36. Have you heard the word “malnutrition”? (If No (2) or Don’t know (99), then go to A39) Yes - 1 No - 2 Don’t Know - 99
A37. Do you know the meaning of “malnutrition”? (If No (2), then go to A39) Yes - 1 No - 2 Maybe/Not Sure-3
A38. FOR SURVEYOR – If Yes or Maybe/Not Sure, ask the meaning. Circle the words respondent mentions in her answer. (Please do not read from the list)
1. Link between food and nutrition 1
2. Balanced diet 2
3. Adequate food 3
4. Nutritious food 4
5. Breastfeeding 5
6. Safe water 6
7. Hygiene and cleanliness 7
8. Other 98
9. Don’t know 99
A32. How many years has the Anganwadi Center been functioning? 99
A33. Last month, how many days was food given to 3-6 year olds? (If all days write 25) 99
A34. When was the last time food stocks were received? (0 for this month, 1 for last month, etc) 99
A35. How many months ago was date of birth data given to ANM/Panchayat/Supervisor?(0 for this month, 1 for last month, etc)
99
For every question, write a number or circle 99(Ask the Anganwadi Worker these questions)
Number DontKnow
(a) (b)
A25. When did you get your salary last?(Write the number of the month, e.g. 1=Jan, 2=Feb, etc.)
99
A26. For which month was it?(Write the number of the month, 1=Jan, 2=Feb, etc.)
99
A27. How many years as an AWW? 99
A28. Age of AWW? 99
A29. How many trainings has the AWW undergone in the last 2 years? (In numbers) 99
A30. AWW studied till which grade? (Highest qualification, 1-10) 99
A31. How many homes were visited in the last 1 month? (If 99 home then write 100 homes) 99

230 231
Family Code
Date: Start Time:
H0. Number of families in the house
H1 .7 Services(Circle whichever is applicable to any member of the family)
Yes No Don’tKnow
1. Do you have a BPL card? 1 2 99
2. In the last 30 days, did you get any benefit from the PDS shop? 1 2 99
3. Do you have a NREGA job card? 1 2 99
4. In the last 30 days, did you get any work through NREGA? 1 2 99
5. Do you have a bank/post office account? 1 2 99
6. Do you have health insurance? 1 2 99
7. Do you have any other insurance? 1 2 99
8. Member of Self-Help Group? 1 2 99
9. Does the family have any loan now? 1 2 99
H1 .8 Consumption of liquor and tobacco(Put circle if applicable to any member of family)
Yes No Don’tKnow
1. Does any family member consume alcohol? 1 2 99
2. Does any family member consume tobacco? (cigarette, gutkha) 1 2 99
H1 . GENERAL INFORMATION: Applicable to all persons eating regularly from one kitchen
H1 . 1 Type of house (Circle only one)
Kutcha 1
Semi-pucca 2
Pucca (wall + roof of bricks and cement)
3
H1 .2 Religion (Circle only one)
Hindu 1
Muslim 2
Other 3
H1 .3 Caste (Circle only one)
SC 1
ST 2
Other 3
H1 .4 Number of persons eating from one kitchen
1. Total number of family members
2. Number of children below 5 years
3. Number of mothers with children below 5 years
H1 .6 Objects in the house(Circle those available)
Yes No Don’tKnow
1. Television 1 2 99
2. Radio 1 2 99
3. Mobile phone 1 2 99
4. 4-wheeler 1 2 99
5. 2-wheeler 1 2 99
6. Tractor 1 2 99
7. Cycle 1 2 99
8. Electricity 1 2 99
9. Did you see electricitybeing used?
1 2 99
10. Toilet 1 2 99
H1 .5 List of mothers with children below 5 years
S.L. NameNumber of children
below 5 years
1
2
3
StateCode
DistrictCode
VillageCode
1. Surveyor name and
Code
2. Surveyor Name and
Code
HUNGaMA 2011 – Household Survey
H2 . CHILD INFORMATION: Ask questions of any one mother on Page 1 in H1.5. If it is not possible to measure any one of the children, leave H2.2h to H2.2k blank.
H2.1 Information about the mother
and father
Motherserial
number(from H1.5 on page 1)
Name Age(Approx)
Highest grade completed
(If class 1-10, to go column 6)
Can read (If 0 in
column 4)
Were you less than 18 years old when you married?
1 2 3 4 5 6
1.. Mother Yes – 1 No – 2
Yes – 1 No – 2
2. Father Yes – 1 No – 2
Note: In column 4, write 0 if no schooling, 1 for Grade 1, 2 for Grade 2, 3….., 9 for class 9, and 10 for class 10 and above
H2 .2 Name of Child (Only children below 5, from older to younger)
a. Gender
b. Date of birth (day/month/year)
c. Accurate date of birth (Circle applicable one)
d. Birth sequence (For eldest child in living children, put 1)
e. Institutional delivery (If No (2), to go to f)
e.1. If institutional delivery, circle the appropriate option
f. Was your child weighed at birth? If Yes, what was the weight in kg?
g. Did the child suffer from diarrhoea, cold/cough in the last 1 week? Note: Diarrhoea is at least 3 times stools like water in a day. (Circle all that apply)
h. Weight - If the child cannot stand alone on the machine, weigh with an adult.
Notes:- Remember to weigh the adult alone first- Record weight to the closest 100 gms- Surveyor to record weight in a and b OR in c only. That is, if a and b are recorded, then c will NOT be recorded
i. Height - Measure all children lying down. To be recorded only after both surveyors verify
j. Mid-Upper Arm Circumference (MUAC) - For children over 6 months. To be recorded after verification by both surveyors.
k. Swelling (oedema) in both feet
H2 .2 . 1 Name
a. Male – 1 Female – 2
b. / /
c. Day – 1 Month – 2 Year – 3
d.
e. Yes – 1 No – 2
e.1. Operation– 1 Pre-term delivery– 2 Ordinary delivery– 3
f. • kg Did not weigh – 96 Don’t know – 99
g. Diarrhoea – 1 Fever/cough – 2 Did not have – 3 Don’t know – 99
h. 1st measurement Final measurement
tluda hti
W
a. Adult alone • kgs
b. With child • kgs
a. Adult alone (final) • kgs
b. With child (final) • kgs
enolA
c. Child’s weight • kgs
c. Child’s weight (final) • kgs
i.. • cm
j. • cm
k. Yes – 1 No – 2
HUNGaMA 2011 – Household Survey
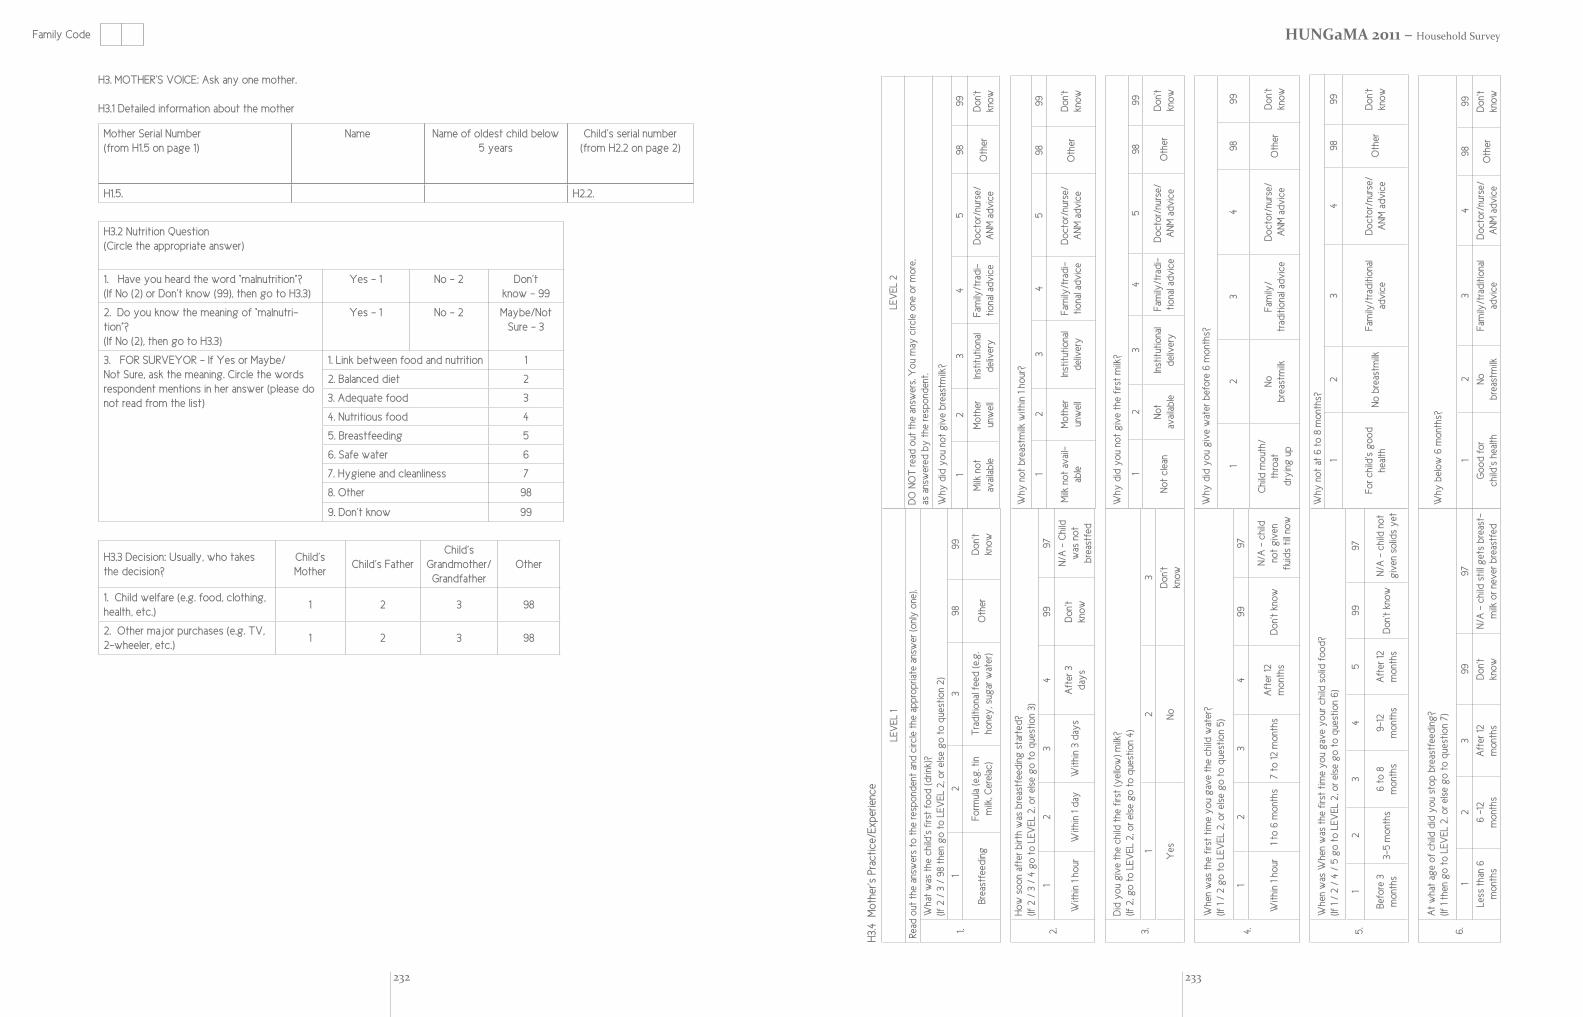
232 233
Family Code
H3. MOTHER’S VOICE: Ask any one mother.
H3.1 Detailed information about the mother
Mother Serial Number(from H1.5 on page 1)
Name Name of oldest child below 5 years
Child’s serial number (from H2.2 on page 2)
H1.5. H2.2.
H3.3 Decision: Usually, who takes the decision?
Child’sMother
Child’s FatherChild’s
Grandmother/Grandfather
Other
1. Child welfare (e.g. food, clothing, health, etc.)
1 2 3 98
2. Other major purchases (e.g. TV, 2-wheeler, etc.)
1 2 3 98
H3.2 Nutrition Question(Circle the appropriate answer)
1. Have you heard the word “malnutrition”? (If No (2) or Don’t know (99), then go to H3.3)
Yes – 1 No – 2 Don’tknow – 99
2. Do you know the meaning of “malnutri-tion”?(If No (2), then go to H3.3)
Yes – 1 No – 2 Maybe/NotSure – 3
3. FOR SURVEYOR – If Yes or Maybe/Not Sure, ask the meaning. Circle the words respondent mentions in her answer (please do not read from the list)
1. Link between food and nutrition 1
2. Balanced diet 2
3. Adequate food 3
4. Nutritious food 4
5. Breastfeeding 5
6. Safe water 6
7. Hygiene and cleanliness 7
8. Other 98
9. Don’t know 99
ecneirepxE/ecitcarP s’rehtoM 4.3
H
1 LEVEL
.)eno ylno( re
wsna etairporppa eht elcric dna tne
dnopser eht ot srewsna eht tuo
daeR
.1
?)knird(
doof tsrif s’dlihc eht sa
w tahW
)2 noitseuq ot og esle ro ,2 LE
VEL ot og neht 89 / 3 / 2 fI(
12
389
99
gnideeftsaerB
nit .g.e( alu
mroF)calere
C ,klim
.g.e(
deef lanoitidar
T)reta
w ragus ,
yenohreht
Ot’no
Dwonk
.2
?detrats
gnideeftsaerb sa
w htrib retfa noos wo
H)3 noitseuq ot o
g esle ro ,2 LEVEL ot o
g 4 / 3 / 2 fI(
12
34
9979
ruoh 1 nihtiW
yad 1 nihti
Ws
yad 3 nihti
W 3 retf
As
yad
t’noD
wonk
dlih
C - A/
N ton sa
wdeftsaerb
.4
?retaw
dlihc eht evag uo
y emit tsrif eht sa
w nehW
)5 noitseuq ot og esle ro ,2 LE
VEL ot og 2 / 1 fI(
12
34
9979
ruoh 1 nihtiW
shtnom 6 ot 1
shtnom 21 ot 7
21 retfA
shtnom
wonk t’noD
dlihc –
A/N
nevig ton
won llit sdiulf
.3
?klim )
wolley( tsrif eht
dlihc eht evig uo
y di
D)4 noitseuq ot o
g esle ro ,2 LEVEL ot o
g ,2 fI(
12
3
seY
oN
t’noD
wonk
2 LEVEL
,erom ro eno elcric
yam uo
Y .srewsna eht tuo
daer T
ON
OD
.tnednopser eht
yb dere
wsna sa
?klimtsaerb evi
g ton uoy
did
yhW
12
34
589
99
ton kliM
elbaliavarehto
Mlle
wnulanoitutitsnI
yreviled
idart/
ylimaF
- ecivda lanoit
/esrun/rotcoD
ecivda
MN
Areht
Ot’no
Dwonk
?ruoh 1 nihtiw kli
mtsaerb ton yh
W
12
34
589
99
liava ton kliM
-elba
rehtoM
llewnu
lanoitutitsnIyrevile
di
dart/yli
maF- eciv
da lanoit/esrun/rotco
Deciv
da M
NA
rehtO
t’noD
wonk
?klim tsrif eht evi
g ton uoy
did
yhW
12
34
589
99
naelc toN
toN
elbaliavalanoitutitsnI
yreviled
idart/
ylimaF
- ecivda lanoit
/esrun/rotcoD
ecivda
MN
Areht
Ot’no
Dwonk
?shtnom 6 erofeb reta
w evig uo
y di
d yh
W
12
34
8999
/htuom
dlihC
taorhtpu
gniyr
d
oN
klimtsaerb
/yli
maFeciv
da lanoitidart
/esrun/rotcoD
ecivda
MN
Areht
Ot’no
Dwonk
.5
?doof
dilos dlihc ruo
y evag uo
y emit tsrif eht sa
w nehW sa
w nehW
)6 noitseuq ot og esle ro ,2 LE
VEL ot og 5 / 4 / 2 / 1 fI(
12
34
599
79
3 erofeBshtno
mshtno
m 5-3 8 ot 6shtno
m21-9
shtnom
retfA
21 shtnom
wonk t’noD
ton dlihc –
A/N
tey s
dilos nevig
?shtnom 8 ot 6 ta ton
yhW
12
34
8999
doo
g s’dlihc roF
htlaehkli
mtsaerb oN
lanoitidart/
ylimaF
ecivda
/esrun/rotcoD
ecivda
MN
Areht
Ot’no
Dwonk
.6
?gni
deeftsaerb pots uoy
did
dlihc fo ega tah
w tA
)7 noitseuq ot og esle ro ,2 LE
VEL ot og neht 1 fI(
12
399
79
6 naht sseLshtno
m 21- 6shtno
m 21 retf
Ashtno
mt’no
Dwonk
tsaerb steg llits
dlihc – A/
N-
deftsaerb reven ro klim
?shtnom 6
woleb yh
W
12
34
8999
rof doo
Ghtlaeh s’
dlih co
Nkli
mtsaerblan oiti
da rt/yli
maFeciv
da/ esrun/r ot co
De civ
da M
NA
rehtO
t’noD
wonk
HUNGaMA 2011 – Household Survey

234 235
Family Code
.01
?reh ekat uoy
did ereh
w ,lli llef tsal dlihc ruo
y nehW
)11 noitseuq ot og esle ro ,2 LE
VEL ot og neht 89 / 4 / 3 fI(
12
34
8999
79
htlaeh voG
tnec-bus/retnec- )rotco
d ,M
NA( re
etavirPSBB
Mrotco
d
deniartnU
htlaehrekro
w
ro emo
Hlanoiti
darty
demer
rehtO
t’noD
wonk
dlih
C– A/
N nellaf t’nsah
kcis
?rotcod
deniart a ro retnec htlaeh a ot dlihc eht ekat uo
y t’ndi
d yh
W
12
34
589
99
stsoC
erom
sekaT
emit
secivreSlufesu ton
ekat srehtO
noisiced eht
htlaeh oN
ybraen retnecreht
Ot’no
Dwonk
.9
?tae dlihc ruo
y di
d sdoof tah
w ,sruoh 42 tsal eht nI
12
34
56
sniarG
,taehw ,ecir(
)tellim
,kliM
druc ,stun ,s
ggE
,taem ,seslup
nekcihc
elbatege
Vtiurf
dna
dessecorP .
g.e( sdoof
,stiucsib)
daerb
no dlih
C – A/
Nkli
mtsaerb
.8
,sg
ge ,tiurf ,selbategev .
g.e( sdoof laerec-non fo
ytitnauq eht htiw
deifsitas uoy er
A o
g esle ro ,2 LEVEL ot o
g neht 2 fI( ?dlihc ruo
y deef ot elba er’uo
y taht )seslup ,taem
)9 noitseuq ot
12
9979
seY
oN
wonk t’noD
A/N
?deifsitas ton uo
y era yh
W
12
389
99
si dooF
evisnepxe elbaliava ton
dooFtekra
m ni elbaliava ton
dooFsporc
ylimaf
morfreht
Ot’no
Dwonk
.7
?esuoh ruoy ni
desu paos sI)8 noitseuq ot o
g esle ro ,2 LEVEL ot o
g neht 1 fI(
12
seY
oN
?rof paos esu uoy o
d tahW
12
389
99
gnihtaB s
dnah gnihsa
Wslae
m erofeb s
dnah gnihsa
Wteliot retfa
rehtO
t’noD
wonk
eroM .tuo
meht daer ton o
D .rehtom eht
yb nevig re
wsna eht elcric ,woleb noitseuq eht roF
.delcric eb
yam re
wsna eno naht
.11
nerdlihc
gnivil tuoba noitamrofnI .11
rebmu
N
ot htrib evag uo
y nerdlihc eht lla er
A LE
VEL ot og neht )2( o
N fI( ?gnivil llits
)4H noitces ot o
g esle ro ,2
seY
1 –o
N 2 –
yna
m woh ,ton fI
?gnivil ton era)sreb
mun nI(
H4. Have you ever used any of these services of the Anganwadi Center?(Circle the appropriate answer)
Yes No Don’tknow
1. Food at the center for children 3-6 years 1 2 99
2. Take-home rations for women and infants 1 2 99
3. Immunization 1 2 99
4. Antenatal check up 1 2 99
5. Health check up for children 1 2 99
6. Growth monitoring of children (child weighed) 1 2 99
7. Health referral services 1 2 99
8. Pre-school education (for children 3-6 years) 1 2 99
9. Health and nutrition counseling for parents 1 2 99
10. Home visits by Anganwadi worker 1 2 99
H5. The government has a number of services for keeping your children healthy (e.g. ICDS program/Anganwadi, Health Centre, Midday Meal, etc.). In your opinion, what can the government do to help your children further?(Read out the answers. Circle only one)
1. Improved services within the current programs (e.g. Anganwadi Centre, Primary Health centers etc.)
1
2. Cash instead of programs/services 2
3. Haven’t thought about it / Can’t choose / Don’t know 3
H6. FOR SURVEYOR: Who were the main respondents for this survey?(Circle one or more appropriately)
1 2 3 4 98
Child’s Mother Child’s Father Child’s grandmotheror grandfather
Other family member
Other
H.7 Mobile Number H.7.1 Own – 1 Neighbors - 2
Survey End Time : AM/PM
HUNGaMA 2011 – Household Survey

236 237
*Measured as a MUAC (Mid Upper Arm Circumference) zscore < -3
Table A1: Percentage of Children who are Severely Malnourished by MUAC Standards*
Focus Districts Best Districtsfrom Focus States
Districts from Top States Total
Bihar 4% 5% -- 4%Jharkhand 5% 1% -- 5%
Madhya Pradesh 6% 1% -- 5%
Orissa 3% 2% -- 3%Rajasthan 6% 7% -- 6%Uttar Pradesh 3% 2% -- 3%Himachal Pradesh -- -- 0% 0%Kerala -- -- 2% 2%Tamil Nadu -- -- 1% 1%Total 4% 3% 1% 4%
*Measured as a Weight-for-Age zscore < -3
Table A2: Percentage of Children who are Severely Underweight*
Focus Districts Best Districtsfrom Focus States
Districts from Top States Total
Bihar 16% 13% -- 15%Jharkhand 18% 17% -- 18%
Madhya Pradesh 17% 10% -- 16%
Orissa 20% 8% -- 16%Rajasthan 18% 14% -- 18%Uttar Pradesh 16% 8% -- 16%Himachal Pradesh -- -- 3% 3%Kerala -- -- 5% 5%Tamil Nadu -- -- 8% 8%Total 16% 11% 6% 16%
*Measured as a Length-for-Age zscore < -3
Table A3: Percentage of Children who are Severely Stunted*
Focus Districts Best Districtsfrom Focus States
Districts from Top States Total
Bihar 32% 33% -- 32%Jharkhand 31% 25% -- 31%
Madhya Pradesh 32% 19% -- 31%
Orissa 34% 12% -- 28%Rajasthan 31% 19% -- 30%Uttar Pradesh 37% 25% -- 37%Himachal Pradesh -- -- 19% 19%Kerala -- -- 12% 12%Tamil Nadu -- -- 15% 15%Total 34% 20% 14% 33%
*Measured as a Weight-for-Length zscore < -3
Table A4: Percentage of Children who are Severely Wasted*
Focus Districts Best Districtsfrom Focus States
Districts from Top States Total
Bihar 3% 3% -- 3%Jharkhand 5% 6% -- 5%
Madhya Pradesh 4% 2% -- 4%
Orissa 4% 2% -- 4%Rajasthan 4% 5% -- 4%Uttar Pradesh 3% 3% -- 3%Himachal Pradesh -- -- 1% 1%Kerala -- -- 6% 6%Tamil Nadu -- -- 4% 4%Total 3% 3% 5% 3%
*Measured as a BMI (Body Mass Index)-for-Age zscore < -3
Table A5: Percentage of Children who are Severely Malnourished by BMI Standards*
Focus Districts Best Districtsfrom Focus States
Districts from Top States Total
Bihar 4% 3% -- 4%Jharkhand 6% 6% -- 6%
Madhya Pradesh 5% 2% -- 5%
Orissa 5% 3% -- 5%Rajasthan 6% 6% -- 6%Uttar Pradesh 4% 4% -- 4%Himachal Pradesh -- -- 2% 2%Kerala -- -- 8% 8%Tamil Nadu -- -- 7% 7%Total 5% 4% 7% 5%
Appendix V

238 239
*Measured by a corresponding zscore < -3
Table A6: Severe Malnutrition* by Gender
Underweight Stunted Wasted MUAC
Focus Districts
Boys 16% 35% 4% 4%
Girls 17% 33% 3% 4%
Best Districts from Focus States
Boys 7% 16% 5% 2%
Girls 5% 12% 5% 1%
Districts from Best States
Boys 11% 20% 3% 4%
Girls 12% 21% 3% 2%
Total
Boys 16% 33% 4% 4%
Girls 16% 32% 3% 4%
Table A7: Mean Nutrition Zscores and Household Socio-Economic Status
MUAC
Low Income -1.4 -1.4 -0.8 -1.4
Middle Income -1.2 -1.1 -0.7 -1.2
High Income -1 -0.9 -0.4 -0.9Total -1.3 -1.1 -0.7 -1.3
Weight-for-AgeLow Income -1.9 -1.8 -1.5 -1.9
Middle Income -1.7 -1.5 -1.2 -1.6
High Income -1.3 -1 -0.9 -1.2Total -1.8 -1.4 -1.2 -1.7
Length-for-AgeLow Income -2.4 -2 -1.7 -2.4
Middle Income -2.2 -1.8 -1.4 -2.1
High Income -1.7 -1.3 -1.1 -1.6Total -2.3 -1.7 -1.3 -2.2
Weight-for-LengthLow Income -0.6 -0.8 -0.6 -0.6
Middle Income -0.5 -0.6 -0.5 -0.5
High Income -0.4 -0.3 -0.3 -0.4Total -0.5 -0.6 -0.5 -0.5
BMILow Income -0.4 -0.6 -0.5 -0.4
Middle Income -0.3 -0.4 -0.4 -0.3
High Income -0.2 -0.2 -0.2 -0.2Total -0.3 -0.4 -0.3 -0.3
Focus Districts Best Districtsfrom Focus States
Districts from Top States Total

240 241
t statistics in parentheses* p<0.05, ** p<0.01, *** p<0.001
ST x Female 0.060(1.90)
0.125(1.00)
0.039(0.52)
0.113(1.52)
0.100(0.72)
-0.069(-0.84)
-0.082(-0.92)
-0.841(-1.04)
0.130(0.17)
Muslim x Female
0.027(0.90)
0.040(0.75)
0.146*(2.00)
-0.038(-0.20)
0.973(1.33)
-0.130(-1.11)
0.013(0.27)
1.851*(2.04)
Mid. Income x Age1
-0.018(-0.48)
-0.034(-0.44)
-0.056(-0.55)
-0.036(-0.31)
0.185(0.80)
-0.050(-0.41)
-0.033(-0.55)
0.457(1.13)
0.635(0.51)
-0.121(-0.20)
High Income x Age1
0.021(0.30)
-0.252(-1.13)
0.559*(1.97)
0.198(0.87)
-0.703(-1.05)
-0.269(-1.18)
0.027(0.28)
-0.382(-0.50)
Mid. Income x Age2
-0.047(-1.36)
0.012(0.17)
0.041(0.42)
-0.063(-0.59)
0.153(0.69)
-0.074(-0.65)
-0.118*(-2.05)
-0.719(-0.68)
0.686(0.50)
-0.131(-0.26)
High Income x Age2
-0.119(-1.76)
-0.295(-1.47)
0.355(1.37)
0.054(0.25)
-1.176(-1.72)
-0.130(-0.60)
-0.228*(-2.41)
-1.330(-1.17)
0.528(0.30)
0.222(0.35)
Mid. Income x Age3
-0.096**(-2.75)
-0.153*(-2.08)
-0.147(-1.52)
-0.121(-1.07)
0.276(1.25)
-0.023(-0.20)
-0.093(-1.65)
0.630(1.50)
1.334(0.77)
0.182(0.34)
High Income x Age3
-0.148*(-2.19)
-0.365(-1.74)
0.472(1.84)
0.237(1.01)
-0.329(-0.58)
-0.462*(-2.11)
-0.174(-1.89)
-0.838(-0.58)
0.177(0.25)
Mid. Income x Age4
-0.092*(-2.49)
-0.151*(-1.97)
-0.014(-0.13)
-0.107(-0.89)
0.126(0.61)
-0.090(-0.75)
-0.068(-1.10)
2.748*(2.53)
0.161(0.26)
0.017(0.03)
High Income x Age4
-0.231**(-3.20)
-0.595**(-2.76)
0.493(1.64)
-0.010(-0.05)
-1.111*(-2.01)
-0.338(-1.37)
-0.209*(-2.10)
2.730*(2.58)
-0.047(-0.03)
-0.014(-0.02)
Mid. Income x Female
0.013(0.59)
-0.005(-0.10)
-0.013(-0.22)
0.088(1.28)
-0.104(-0.77)
-0.031(-0.46)
-0.000(-0.01)
1.023(0.72)
1.575(0.86)
0.483(0.97)
High Income x Female
-0.015(-0.38)
-0.058(-0.56)
-0.047(-0.29)
-0.105(-0.83)
0.421(0.98)
-0.228(-1.75)
0.005(0.08)
1.177(0.82)
0.962(0.52)
0.258(0.45)
Constant -1.099***(-58.38)
-1.101***(-26.13)
-1.196***(-23.29)
-1.077***(-18.30)
-1.006***(-11.52)
-1.455***(-24.06)
-1.092***(-36.18)
-0.354(-1.58)
-0.434(-0.87)
-0.317*(-2.17)
Family FEs x x x x x x x x x x
Observations 89405 19638 11079 8573 4744 9248 31165 1331 1805 1822
Adjusted R-squared 0.419 0.388 0.420 0.418 0.407 0.370 0.386 0.412 0.526 0.499
Age1 -0.140***(-3.80)
-0.185*(-2.58)
-0.105(-0.96)
-0.160(-1.35)
-0.044(-0.20)
-0.094(-0.78)
-0.106(-1.74)
-0.792(-1.90)
-0.652(-0.48)
0.085(0.13)
Age2 -0.159***(-4.51)
-0.218**(-3.15)
-0.277**(-2.64)
-0.242*(-2.18)
-0.203(-0.95)
-0.043(-0.38)
-0.067(-1.14)
-0.213(-0.20)
-0.254(-0.19)
-0.270(-0.52)
Age3 -0.123***(-3.51)
-0.149*(-2.17)
-0.167(-1.62)
-0.208(-1.80)
-0.311(-1.50)
-0.080(-0.68)
-0.069(-1.21)
-1.051*(-2.51)
-1.122(-0.63)
-0.502(-0.90)
Age4 -0.168***(-4.52)
-0.179*(-2.53)
-0.293**(-2.63)
-0.351**(-2.89)
-0.345(-1.57)
-0.004(-0.04)
-0.112(-1.80)
-3.935***(-3.50)
-0.529(-0.84)
Female 0.055(1.67)
-0.023(-0.34)
0.163(1.74)
0.001(0.01)
-0.011(-0.06)
0.130(1.22)
0.095(1.77)
-1.141(-0.78)
-0.879(-0.44)
-0.541(-0.96)
Female x Age1 0.036(1.02)
0.009(0.12)
-0.136(-1.39)
0.078(0.70)
0.144(0.79)
0.105(0.94)
0.072(1.26)
0.036(0.10)
-0.611(-0.67)
0.088(0.31)
Female x Age2 -0.054(-1.50)
-0.061(-0.81)
-0.271**(-2.68)
-0.067(-0.60)
0.045(0.25)
0.002(0.02)
-0.014(-0.25)
0.583(1.40)
-0.618(-0.75)
0.222(0.75)
Female x Age3 -0.101**(-2.86)
-0.060(-0.80)
-0.190(-1.91)
-0.021(-0.19)
-0.133(-0.76)
-0.068(-0.61)
-0.136*(-2.37)
-0.064(-0.17)
-0.077(-0.08)
0.091(0.32)
Female x Age4
-0.155***(-4.27)
-0.123(-1.60)
-0.318**(-3.16)
-0.026(-0.22)
0.025(0.14)
-0.053(-0.46)
-0.215***(-3.60)
0.185(0.47)
-0.710(-0.76)
0.257(0.82)
SC x Age1 -0.069(-1.63)
-0.172(-1.94)
-0.189(-1.38)
-0.164(-1.03)
-0.290(-1.04)
0.074(0.47)
0.002(0.03)
0.625(1.60)
-0.880(-1.07)
-0.261(-0.92)
SC x Age2 0.007(0.17)
-0.017(-0.21)
0.040(0.30)
0.089(0.61)
-0.059(-0.23)
-0.011(-0.07)
0.030(0.50)
0.433(1.08)
-1.777*(-2.29)
-0.193(-0.75)
SC x Age3 0.031(0.77)
-0.024(-0.29)
-0.202(-1.53)
0.184(1.21)
-0.098(-0.39)
0.056(0.37)
0.106(1.78)
0.452(1.19)
-1.514*(-2.02)
-0.179(-0.63)
SC x Age4 0.001(0.02)
0.045(0.52)
-0.055(-0.40)
0.084(0.51)
-0.071(-0.27)
-0.133(-0.82)
0.004(0.07)
1.189**(2.85)
-0.670(-0.80)
-0.201(-0.65)
ST x Age1 -0.099(-1.79)
0.185(0.83)
-0.160(-1.23)
-0.268*(-2.08)
-0.088(-0.38)
0.046(0.31)
-0.084(-0.51)
-1.398(-0.71)
0.284(0.28)
ST x Age2 -0.074(-1.42)
0.362(1.74)
0.017(0.14)
-0.108(-0.92)
0.007(0.03)
-0.009(-0.06)
-0.134(-0.80)
-0.538(-0.42)
0.202(0.19)
ST x Age3 -0.115*(-2.21)
0.325(1.59)
-0.232(-1.93)
-0.147(-1.18)
0.144(0.68)
0.008(0.06)
-0.136(-0.91)
-0.516(-0.27)
-0.136(-0.17)
ST x Age4 -0.139**(-2.58)
0.334(1.49)
0.027(0.22)
-0.249(-1.92)
-0.050(-0.23)
-0.032(-0.22)
-0.231(-1.37)
0.472(0.27)
-1.465(-1.26)
Muslim x Age1
-0.044(-0.86)
-0.096(-1.00)
0.187(1.45)
0.038(0.12)
-0.967(-1.17)
-0.212(-1.06)
-0.071(-0.91)
0.911(0.95)
Muslim x Age2
-0.015(-0.31)
0.007(0.08)
0.224(1.85)
0.016(0.05)
-1.387(-1.59)
-0.025(-0.15)
-0.110(-1.51)
1.345(1.05)
Muslim x Age3
0.034(0.72)
-0.024(-0.27)
0.185(1.53)
0.076(0.26)
-0.460(-0.76)
0.142(0.75)
0.019(0.25)
Muslim x Age4
-0.063(-1.25)
-0.025(-0.27)
0.231(1.79)
-0.004(-0.01)
-1.711*(-2.01)
-0.279(-1.44)
-0.181*(-2.31)
-0.424(-0.28)
-0.438(-0.39)
SC x Female 0.018(0.73)
0.099*(1.98)
-0.034(-0.43)
-0.113(-1.27)
0.107(0.66)
-0.135(-1.53)
0.024(0.64)
0.078(0.32)
-0.233(-0.58)
0.039(0.23)
(1) (2) (3) (4) (5) (6) (7) (8) (9) (10)
AllStates Bihar Jharkhand Madhya
Pradesh Orissa Rajasthan Uttar Pradesh
HimachalPradesh Kerala Tamil
Nadu
Focus States Best States
(1) (2) (3) (4) (5) (6) (7) (8) (9) (10)
AllStates Bihar Jharkhand Madhya
Pradesh Orissa Rajasthan Uttar Pradesh
HimachalPradesh Kerala Tamil
Nadu
Focus States Best States
Table A8: MUAC Z-scores within Household

242 243
ST x Female 0.119**(2.74)
-0.165(-1.03)
0.340***(3.38)
0.189(1.79)
0.284(1.62)
-0.119(-1.01)
-0.189(-1.50)
1.051(1.26)
0.610(0.42)
Muslim x Female
0.023(0.58)
-0.013(-0.19)
0.174(1.74)
0.116(0.48)
0.646(0.76)
-0.107(-0.62)
0.025(0.40)
1.470(1.18)
Mid. Income x Age1
0.078(1.83)
0.149(1.77)
-0.040(-0.33)
-0.030(-0.21)
0.409(1.53)
-0.452**(-3.19)
0.148*(2.08)
-0.984(-0.81)
7.175*(2.21)
-0.503(-0.64)
High Income x Age1
0.307***(3.86)
-0.070(-0.31)
0.191(0.55)
0.043(0.17)
1.494*(2.15)
0.161(0.62)
0.350**(3.09)
-0.384(-0.31)
6.677*(2.10)
-0.299(-0.30)
Mid. Income x Age2
0.023(0.60)
0.136(1.82)
0.075(0.68)
-0.034(-0.27)
0.205(0.83)
-0.237(-1.92)
0.009(0.13)
-0.693(-0.57)
-1.202(-1.41)
0.074(0.13)
High Income x Age2
0.099(1.36)
-0.184(-0.97)
0.732*(2.51)
-0.154(-0.65)
-0.291(-0.43)
-0.195(-0.84)
0.046(0.43)
0.008(0.01)
1.309(1.79)
Mid. Income x Age3
-0.113**(-2.90)
-0.012(-0.15)
-0.333**(-2.96)
-0.262(-1.95)
-0.329(-1.41)
-0.507***(-3.80)
0.034(0.52)
-0.120(-0.33)
6.787(1.84)
-0.225(-0.34)
High Income x Age3
-0.038(-0.49)
-0.120(-0.59)
-0.156(-0.50)
-0.263(-1.00)
0.815(1.28)
-0.150(-0.63)
-0.000(-0.00)
6.270(1.68)
0.222(0.25)
Mid. Income x Age4
-0.088*(-2.04)
-0.029(-0.35)
-0.120(-0.97)
-0.260(-1.72)
0.061(0.27)
-0.343*(-2.41)
0.045(0.60)
1.913(0.98)
-0.559(-0.76)
High Income x Age4
-0.241**(-2.86)
-0.600**(-2.77)
0.155(0.40)
-0.698*(-2.52)
1.005(1.76)
-0.536(-1.87)
-0.114(-0.94)
0.673(1.76)
3.009(1.55)
0.306(0.31)
Mid. Income x Female
0.028(1.00)
0.008(0.15)
0.065(0.80)
0.238*(2.46)
0.171(1.04)
-0.195*(-2.07)
-0.009(-0.18)
0.082(0.05)
3.430(1.36)
0.930(1.65)
High Income x Female
0.007(0.14)
-0.056(-0.43)
0.169(0.75)
0.070(0.41)
0.529(1.22)
-0.404*(-2.36)
0.050(0.66)
0.092(0.05)
2.756(1.09)
0.136(0.20)
Constant -1.559***(-83.80)
-1.542***(-40.90)
-1.723***(-32.51)
-1.662***(-27.81)
-1.590***(-17.45)
-1.578***(-27.12)
-1.549***(-50.25)
-0.992***(-6.20)
-0.388(-0.95)
-1.461***(-8.94)
Family FEs x x x x x x x x x x
Observations 96289 21450 11999 8669 5036 9796 34026 1474 1865 1974
Adjusted R-squared 0.316 0.329 0.265 0.270 0.380 0.290 0.322 0.463 0.214 0.278
t statistics in parentheses* p<0.05, ** p<0.01, *** p<0.001
AllStates Bihar Jharkhand Madhya
Pradesh Orissa Rajasthan Uttar Pradesh
HimachalPradesh Kerala Tamil
Nadu
(1) (2) (3) (4) (5) (6) (7) (8) (9) (10)
Age1 -0.350***(-8.13)
-0.331***(-4.27)
-0.216(-1.63)
-0.256(-1.73)
-0.377(-1.45)
-0.208(-1.45)
-0.435***(-6.03)
1.013(0.81)
-7.492*(-2.28)
1.171(1.43)
Age2 -0.211***(-5.33)
-0.264***(-3.69)
-0.136(-1.12)
-0.188(-1.40)
-0.491*(-2.07)
-0.060(-0.46)
-0.203**(-3.02)
0.499(0.41)
0.790(0.97)
-0.057(-0.09)
Age3 -0.076(-1.90)
-0.180*(-2.46)
0.086(0.71)
0.222(1.53)
0.129(0.54)
0.079(0.58)
-0.168*(-2.51)
-0.122(-0.34)
-7.792*(-2.14)
0.646(0.91)
Age4 -0.041(-0.94)
-0.010(-0.13)
-0.082(-0.59)
-0.031(-0.20)
-0.118(-0.47)
0.150(1.03)
-0.127(-1.67)
-0.811*(-2.49)
-2.450(-1.27)
0.663(0.83)
Female 0.090*(2.51)
0.047(0.72)
-0.028(-0.26)
0.136(1.13)
-0.221(-1.07)
0.429***(3.59)
0.076(1.25)
0.126(0.07)
-3.670(-1.41)
-0.399(-0.63)
Female x Age1
-0.002(-0.04)
-0.084(-1.02)
0.113(0.97)
-0.206(-1.49)
0.286(1.31)
-0.060(-0.44)
0.077(1.11)
-0.514(-1.59)
0.876(0.95)
-0.292(-0.84)
Female x Age2
-0.103*(-2.51)
-0.148(-1.84)
-0.116(-0.97)
-0.273*(-2.04)
0.312(1.46)
-0.273*(-2.05)
-0.010(-0.15)
-0.238(-0.63)
0.243(0.29)
-0.056(-0.15)
Female x Age3
-0.191***(-4.68)
-0.129(-1.61)
-0.200(-1.70)
-0.321*(-2.41)
-0.041(-0.20)
-0.393**(-2.93)
-0.131(-1.93)
-0.370(-1.09)
1.114(1.16)
-0.651(-1.83)
Female x Age4
-0.232***(-5.36)
-0.296***(-3.52)
-0.112(-0.90)
-0.221(-1.52)
-0.191(-0.95)
-0.196(-1.39)
-0.219**(-3.00)
-0.417(-1.16)
-0.252(-0.28)
-0.419(-1.06)
SC x Age1 -0.118*(-2.44)
-0.366***(-3.86)
-0.335*(-2.04)
-0.128(-0.70)
-0.260(-0.80)
-0.206(-1.15)
0.066(0.89)
0.120(0.37)
-1.113(-1.14)
-0.976**(-2.77)
SC x Age2 -0.007(-0.16)
-0.011(-0.13)
0.100(0.66)
0.001(0.01)
-0.145(-0.50)
-0.179(-1.12)
0.029(0.42)
0.071(0.20)
-1.119(-1.17)
-0.750*(-2.45)
SC x Age3 0.027(0.60)
0.042(0.49)
-0.167(-1.08)
-0.128(-0.76)
-0.385(-1.42)
-0.221(-1.31)
0.145*(2.11)
0.409(1.30)
-1.636(-1.74)
-0.757*(-2.15)
SC x Age4 -0.013(-0.27)
0.010(0.11)
-0.083(-0.50)
0.197(1.01)
-0.205(-0.73)
-0.433*(-2.33)
0.061(0.80)
0.746(1.88)
-0.318(-0.33)
-0.787*(-1.99)
ST x Age1 -0.147*(-2.18)
0.173(0.69)
-0.375*(-2.40)
-0.163(-1.00)
-0.207(-0.75)
-0.096(-0.53)
-0.123(-0.65)
1.708(1.00)
-0.908(-0.46)
ST x Age2 -0.104(-1.75)
0.127(0.57)
-0.219(-1.56)
0.061(0.43)
-0.104(-0.42)
-0.114(-0.74)
-0.305(-1.73)
0.853(0.89)
0.341(0.16)
ST x Age3 -0.031(-0.51)
0.454*(2.13)
-0.256(-1.83)
-0.218(-1.44)
-0.365(-1.53)
0.078(0.47)
0.032(0.19)
2.988(1.73)
-0.933(-0.89)
ST x Age4 0.012(0.19)
0.666**(2.66)
-0.015(-0.10)
-0.011(-0.07)
-0.025(-0.10)
0.002(0.01)
-0.192(-0.99)
3.210*(2.22)
-3.745(-1.65)
Muslim x Age1
-0.126*(-2.10)
-0.324**(-3.04)
-0.217(-1.45)
0.173(0.45)
0.031(0.03)
0.098(0.38)
-0.023(-0.24)
0.861(0.50)
Muslim x Age2
-0.192***(-3.62)
-0.266**(-2.83)
-0.252(-1.87)
-0.315(-0.94)
-0.801(-0.89)
0.121(0.60)
-0.195*(-2.32)
2.825(1.35)
Muslim x Age3
-0.094(-1.72)
-0.275**(-2.88)
-0.168(-1.23)
-0.586(-1.77)
0.279(0.42)
0.555*(2.51)
0.001(0.01)
1.179(0.61)
Muslim x Age4
-0.105(-1.76)
-0.229*(-2.21)
0.055(0.37)
-0.309(-0.85)
0.409(0.38)
0.302(1.21)
-0.178(-1.86)
1.384(0.88)
1.206(0.76)
SC x Female 0.061(1.89)
0.163**(2.66)
0.193(1.80)
-0.044(-0.35)
0.009(0.04)
-0.003(-0.03)
0.010(0.19)
0.043(0.16)
0.511(0.95)
0.315(1.40)
Table A9: Weight-For-Age Z-scores within Household
Focus States Best States
(1) (2) (3) (4) (5) (6) (7) (8) (9) (10)
AllStates Bihar Jharkhand Madhya
Pradesh Orissa Rajasthan Uttar Pradesh
HimachalPradesh Kerala Tamil
Nadu
Focus States Best States

244 245
AllStates Bihar Jharkhand Madhya
Pradesh Orissa Rajasthan Uttar Pradesh
HimachalPradesh Kerala Tamil
Nadu
(1) (2) (3) (4) (5) (6) (7) (8) (9) (10)
Age1 -0.785***(-13.23)
-0.453***(-4.13)
-0.789***(-4.38)
-0.915***(-4.69)
-0.490(-1.24)
-0.767***(-4.04)
-1.003***(-10.17)
1.680(0.90)
4.525(1.31)
0.030(0.02)
Age2 -0.909***(-16.43)
-0.772***(-7.58)
-0.888***(-5.25)
-0.834***(-4.63)
-0.551(-1.45)
-0.903***(-5.10)
-1.103***(-11.94)
-1.129(-0.61)
0.914(0.57)
-0.620(-0.69)
Age3 -0.796***(-14.24)
-0.811***(-7.87)
-0.684***(-4.08)
-0.474*(-2.52)
-0.172(-0.46)
-0.830***(-4.51)
-0.954***(-10.37)
0.318(0.46)
4.165(1.52)
0.030(0.03)
Age4 -0.657***(-10.79)
-0.314**(-2.89)
-0.766***(-4.04)
-0.730***(-3.59)
0.023(0.06)
-0.622**(-3.24)
-0.996***(-9.57)
-0.488(-0.82)
-1.795(-0.62)
-0.572(-0.48)
Female 0.266***(5.29)
0.224*(2.34)
0.198(1.36)
0.421**(2.59)
0.118(0.37)
0.516**(3.23)
0.206*(2.46)
-0.450(-0.18)
-0.696(-0.19)
0.290(0.31)
Female x Age1 -0.116*(-2.02)
-0.251*(-2.14)
-0.166(-1.03)
-0.208(-1.15)
0.139(0.41)
-0.090(-0.50)
-0.018(-0.19)
-1.479*(-2.31)
-0.475(-0.31)
-0.661(-1.16)
Female x Age2 -0.161**(-2.81)
-0.287*(-2.53)
-0.266(-1.61)
-0.447*(-2.47)
-0.036(-0.11)
-0.136(-0.75)
0.065(0.69)
-1.326(-1.85)
-1.414(-1.08)
-1.018(-1.75)
Female x Age3 -0.248***(-4.36)
-0.265*(-2.33)
-0.180(-1.11)
-0.368*(-2.05)
-0.078(-0.24)
-0.305(-1.68)
-0.149(-1.61)
-2.144**(-3.25)
-1.923(-1.27)
-1.601**(-2.79)
Female x Age4 -0.303***(-5.05)
-0.456***(-3.85)
-0.312(-1.83)
-0.323(-1.68)
-0.504(-1.60)
-0.244(-1.29)
-0.179(-1.79)
-1.591*(-2.32)
-3.011(-1.95)
-0.571(-0.90)
SC x Age1 -0.087(-1.29)
-0.362**(-2.71)
0.007(0.03)
-0.120(-0.49)
-0.945(-1.94)
-0.170(-0.71)
0.081(0.80)
0.293(0.45)
1.063(0.64)
-0.860(-1.49)
SC x Age2 -0.025(-0.41)
-0.012(-0.10)
0.212(1.00)
-0.083(-0.37)
-0.754(-1.67)
-0.250(-1.14)
0.034(0.36)
0.299(0.43)
-0.729(-0.47)
-0.573(-1.13)
SC x Age3 0.027(0.44)
0.046(0.38)
0.146(0.68)
-0.156(-0.69)
-1.034*(-2.40)
-0.156(-0.68)
0.106(1.13)
0.534(0.85)
-1.190(-0.75)
-0.621(-1.08)
SC x Age4 0.010(0.14)
-0.137(-1.05)
0.215(0.93)
0.176(0.67)
-0.947*(-2.14)
-0.128(-0.51)
0.139(1.33)
1.635*(2.24)
0.870(0.50)
-0.791(-1.22)
ST x Age1 -0.009(-0.10)
0.334(0.98)
0.000(0.00)
0.164(0.77)
-0.236(-0.56)
-0.427(-1.83)
0.206(0.79)
9.172**(2.66)
0.661(0.31)
ST x Age2 -0.055(-0.67)
0.519(1.75)
-0.154(-0.79)
0.116(0.62)
-0.508(-1.32)
-0.283(-1.39)
-0.054(-0.21)
3.975(1.76)
1.042(0.49)
ST x Age3 0.143(1.71)
0.724*(2.49)
-0.023(-0.12)
-0.098(-0.50)
-0.212(-0.55)
-0.060(-0.27)
0.267(1.15)
8.911**(2.62)
-1.613(-1.00)
ST x Age4 0.239**(2.70)
0.935**(2.81)
0.154(0.74)
0.350(1.63)
-0.095(-0.25)
0.072(0.31)
0.003(0.01)
9.100**(3.02)
0.002(0.00)
Muslim x Age1 -0.198*(-2.37)
-0.430**(-2.82)
-0.129(-0.62)
0.417(0.75)
0.060(0.04)
-0.037(-0.11)
-0.109(-0.85)
5.357(1.32)
Muslim x Age2 -0.255***(-3.42)
-0.221(-1.65)
-0.230(-1.21)
0.024(0.05)
-4.643**(-2.75)
0.435(1.54)
-0.406***(-3.52)
3.572(1.08)
Muslim x Age3 -0.114(-1.49)
-0.192(-1.42)
-0.033(-0.17)
0.261(0.53)
-2.288(-1.67)
0.604*(1.99)
-0.164(-1.35)
1.953(0.47)
Muslim x Age4
-0.081(-0.97)
-0.344*(-2.34)
0.255(1.22)
0.431(0.82)
0.924(0.62)
0.636(1.90)
-0.177(-1.33)
6.745**(2.67)
0.734(0.32)
SC x Female -0.001(-0.02)
0.167(1.95)
0.364*(2.47)
-0.241(-1.53)
0.091(0.31)
-0.206(-1.29)
-0.068(-1.01)
0.766(1.75)
-2.082**(-2.73)
-0.102(-0.28)
ST x Female 0.066(1.13)
0.144(0.66)
0.274*(2.02)
0.067(0.50)
0.196(0.76)
-0.360*(-2.38)
-0.126(-0.74)
2.631(1.85)
2.142(1.38)
Table A10: Length-For-Age Z-scores within Household
Muslim x Female
-0.075(-1.37)
-0.162(-1.69)
0.039(0.29)
-0.195(-0.56)
0.464(0.34)
-0.274(-1.24)
0.045(0.52)
-4.762*(-2.11)
Mid. Income x Age1
0.026(0.43)
-0.202(-1.70)
0.045(0.27)
0.185(0.97)
0.832*(2.06)
-0.155(-0.83)
0.049(0.51)
-1.376(-0.77)
-5.356(-1.54)
1.277(1.09)
High Income x Age1
0.356**(3.20)
0.182(0.55)
-0.156(-0.33)
0.200(0.53)
1.609(1.62)
0.043(0.12)
0.601***(3.88)
-2.020(-1.07)
-3.738(-1.27)
-1.342(-0.84)
Mid. Income x Age2
-0.012(-0.23)
-0.080(-0.75)
0.112(0.73)
0.076(0.46)
0.318(0.85)
-0.088(-0.53)
-0.003(-0.03)
0.757(0.41)
-1.186(-0.75)
0.998(1.14)
High Income x Age2
0.215*(2.09)
-0.057(-0.21)
0.630(1.56)
0.244(0.68)
2.380*(2.21)
-0.242(-0.76)
0.310*(2.11)
0.955(0.48)
1.401(1.18)
Mid. Income x Age3
-0.017(-0.31)
-0.020(-0.18)
-0.131(-0.84)
-0.087(-0.49)
0.358(0.96)
-0.125(-0.70)
0.014(0.16)
0.086(0.12)
-4.277(-1.63)
1.189(1.15)
High Income x Age3
0.006(0.05)
-0.155(-0.52)
-0.460(-1.04)
-0.239(-0.63)
0.847(0.88)
-0.233(-0.72)
0.180(1.22)
-0.660(-0.44)
Mid. Income x Age4
-0.055(-0.92)
-0.208(-1.78)
0.070(0.41)
0.046(0.23)
0.118(0.34)
-0.210(-1.11)
0.108(1.07)
1.680(0.59)
0.988(0.88)
High Income x Age4
-0.070(-0.60)
-0.614(-1.92)
-0.041(-0.08)
-0.375(-0.95)
2.229*(2.32)
-0.190(-0.49)
0.237(1.45)
0.240(0.33)
3.023(1.14)
0.315(0.20)
Mid. Income x Female
-0.026(-0.68)
0.089(1.16)
-0.066(-0.61)
0.144(1.17)
-0.189(-0.77)
-0.129(-1.05)
-0.131*(-2.01)
1.372(0.55)
3.769(1.12)
0.898(1.08)
HighIncome x Female
0.067(0.94)
0.051(0.28)
0.219(0.72)
0.468*(2.01)
-0.518(-0.69)
-0.497*(-2.15)
0.047(0.47)
2.032(0.81)
2.931(0.87)
0.409(0.40)
Constant -1.531***(-57.46)
-1.618***(-29.65)
-1.619***(-21.66)
-1.607***(-18.86)
-1.715***(-11.30)
-1.386***(-16.99)
-1.540***(-35.79)
-2.035***(-5.26)
-1.793*(-2.36)
-1.787***(-6.26)
Family FEs x x x x x x x x x x
Observations 93278 20255 11482 8872 4641 9823 33347 1333 1732 1793
Adjusted R-squared 0.307 0.314 0.303 0.288 0.242 0.261 0.312 0.415 0.327 0.198
t statistics in parentheses* p<0.05, ** p<0.01, *** p<0.001
Focus States Best States
(1) (2) (3) (4) (5) (6) (7) (8) (9) (10)
AllStates Bihar Jharkhand Madhya
Pradesh Orissa Rajasthan Uttar Pradesh
HimachalPradesh Kerala Tamil
Nadu
Focus States Best States

246 247
AllStates Bihar Jharkhand Madhya
Pradesh Orissa Rajasthan Uttar Pradesh
HimachalPradesh Kerala Tamil
Nadu
(1) (2) (3) (4) (5) (6) (7) (8) (9) (10)
Age1 -0.364***(-7.56)
-0.485***(-5.50)
-0.427**(-2.88)
-0.223(-1.38)
-0.338(-1.09)
-0.519**(-3.17)
-0.237**(-3.03)
-0.471(-0.31)
-0.823(-0.40)
0.040(0.04)
Age2 0.097*(2.17)
-0.075(-0.91)
0.081(0.59)
0.034(0.23)
-0.218(-0.74)
-0.110(-0.73)
0.348***(4.78)
0.925(0.61)
-1.327(-0.89)
-0.131(-0.17)
Age3 0.184***(4.10)
0.069(0.83)
0.238(1.73)
0.205(1.29)
-0.019(-0.06)
0.071(0.45)
0.301***(4.17)
-0.377(-0.66)
-0.893(-1.28)
-0.854(-0.85)
Age4 0.203***(4.13)
0.086(0.97)
0.250(1.62)
-0.095(-0.57)
-0.256(-0.85)
0.064(0.39)
0.395***(4.82)
-0.670(-1.36)
-4.104(-1.52)
0.731(0.72)
Female -0.085*(-2.09)
-0.132(-1.72)
-0.100(-0.84)
0.057(0.42)
0.125(0.50)
-0.042(-0.31)
-0.096(-1.47)
0.718(0.34)
-4.433(-1.34)
-0.155(-0.20)
Female x Age1 0.206***(4.43)
0.195*(2.08)
0.225(1.71)
0.239(1.57)
0.047(0.18)
0.306*(1.98)
0.163*(2.19)
0.494(0.93)
2.104(1.52)
0.673(1.43)
Female x Age2 0.110*(2.38)
0.133(1.45)
0.006(0.04)
0.299*(2.02)
0.172(0.66)
0.084(0.55)
0.070(0.95)
0.763(1.30)
1.215(0.98)
0.143(0.30)
Female x Age3 0.091*(1.98)
0.137(1.50)
-0.093(-0.71)
0.139(0.93)
-0.151(-0.59)
0.099(0.64)
0.104(1.41)
0.764(1.41)
2.717(1.97)
0.490(1.01)
Female x Age4 -0.003(-0.07)
0.074(0.78)
-0.118(-0.85)
0.220(1.39)
-0.115(-0.47)
0.098(0.61)
-0.092(-1.17)
0.729(1.29)
1.274(0.90)
-0.274(-0.53)
SC x Age1 -0.091(-1.68)
-0.170(-1.58)
-0.211(-1.13)
-0.243(-1.19)
-0.013(-0.03)
-0.030(-0.15)
-0.043(-0.54)
0.483(0.90)
-0.438(-0.29)
-0.410(-0.87)
SC x Age2 -0.009(-0.18)
0.059(0.63)
0.020(0.12)
0.044(0.24)
0.122(0.35)
-0.080(-0.43)
-0.092(-1.25)
0.405(0.72)
-0.071(-0.05)
-0.092(-0.23)
SC x Age3 0.045(0.89)
0.084(0.86)
-0.135(-0.77)
0.012(0.07)
-0.088(-0.26)
0.101(0.52)
0.049(0.66)
0.595(1.14)
-0.552(-0.38)
-0.392(-0.81)
SC x Age4 -0.026(-0.48)
0.100(0.94)
-0.151(-0.80)
0.024(0.11)
0.326(0.93)
-0.361(-1.72)
-0.072(-0.89)
0.098(0.17)
0.396(0.25)
-0.313(-0.61)
ST x Age1 -0.153*(-2.00)
-0.369(-1.32)
-0.232(-1.33)
-0.145(-0.81)
-0.107(-0.33)
0.294(1.41)
-0.414*(-2.02)
-2.972(-1.04)
-1.460(-0.56)
ST x Age2 -0.203**(-2.99)
-0.646**(-2.65)
-0.206(-1.30)
-0.119(-0.76)
-0.107(-0.36)
0.278(1.57)
-0.377(-1.92)
-0.879(-0.47)
0.277(0.10)
ST x Age3 -0.190**(-2.79)
-0.326(-1.42)
-0.318*(-2.04)
-0.043(-0.26)
-0.154(-0.52)
0.202(1.04)
-0.189(-1.05)
-1.843(-0.66)
-0.367(-0.22)
ST x Age4 -0.316***(-4.32)
-0.465(-1.72)
-0.269(-1.58)
-0.193(-1.08)
-0.027(-0.09)
0.021(0.10)
-0.128(-0.61)
-1.929(-0.77)
-5.605(-1.91)
Muslim x Age1 -0.048(-0.71)
0.051(0.42)
0.086(0.50)
0.294(0.68)
-1.173(-1.05)
0.127(0.42)
-0.162(-1.59)
-5.604(-1.92)
Muslim x Age2 -0.018(-0.30)
0.073(0.67)
0.022(0.14)
-0.473(-1.28)
-0.491(-0.38)
0.025(0.11)
-0.094(-1.03)
1.271(0.41)
Muslim x Age3 0.052(0.85)
0.145(1.34)
0.034(0.22)
0.024(0.07)
-1.177(-1.07)
-0.037(-0.14)
0.010(0.11)
-1.904(-0.53)
Muslim x Age4
-0.056(-0.84)
0.017(0.15)
0.081(0.47)
-0.195(-0.49)
-0.925(-0.75)
-0.024(-0.08)
-0.197(-1.91)
-3.613(-1.55)
0.245(0.13)
SC x Female 0.033(0.92)
0.047(0.67)
0.031(0.26)
-0.231(-1.76)
-0.106(-0.47)
0.039(0.29)
0.103(1.94)
-0.592(-1.62)
0.626(0.79)
-0.273(-0.91)
ST x Female 0.113*(2.36)
-0.342(-1.95)
0.178(1.61)
0.021(0.19)
0.140(0.71)
0.043(0.32)
-0.073(-0.54)
-0.304(-0.26)
-0.965(-0.51)
Focus States Best States
Table A11: Weight-For-Length Z-scores within Household
Muslim x Female
0.087*(2.01)
0.112(1.47)
0.188(1.71)
-0.157(-0.60)
0.577(0.55)
-0.086(-0.44)
0.091(1.35)
6.847***(4.21)
Mid. Income x Age1
0.108*(2.26)
0.163(1.70)
-0.011(-0.08)
-0.095(-0.59)
0.296(0.94)
0.020(0.13)
0.158*(2.05)
-0.119(-0.08)
0.742(0.35)
-0.999(-0.99)
High Income x Age1
0.210*(2.35)
-0.423(-1.60)
0.658(1.65)
-0.008(-0.03)
0.841(1.08)
0.278(0.94)
0.138(1.12)
0.990(0.63)
-2.269(-0.86)
0.655(0.50)
Mid. Income x Age2
0.009(0.21)
0.163(1.90)
-0.098(-0.78)
-0.085(-0.61)
0.317(1.09)
0.043(0.30)
-0.084(-1.20)
-1.150(-0.75)
1.179(0.78)
-0.326(-0.44)
High Income x Age2
-0.086(-1.04)
-0.167(-0.74)
0.640*(1.99)
-0.020(-0.07)
-1.157(-1.40)
-0.046(-0.17)
-0.318**(-2.73)
-0.618(-0.38)
0.427(0.43)
Mid. Income x Age3
-0.059(-1.35)
-0.013(-0.15)
-0.246(-1.95)
-0.140(-0.94)
0.060(0.21)
-0.155(-1.01)
0.007(0.10)
-0.160(-0.28)
0.161(0.17)
High Income x Age3
-0.026(-0.30)
-0.208(-0.88)
0.290(0.82)
0.035(0.12)
0.635(0.85)
0.076(0.28)
-0.154(-1.31)
-4.941*(-2.04)
1.942(1.48)
Mid. Income x Age4
0.000(0.01)
0.039(0.42)
-0.280*(-2.04)
0.112(0.69)
0.340(1.23)
0.096(0.59)
0.009(0.12)
4.242(1.59)
-0.816(-0.85)
High Income x Age4
-0.238*(-2.54)
-0.421(-1.63)
0.324(0.74)
-0.087(-0.28)
-0.082(-0.11)
-0.411(-1.27)
-0.301*(-2.33)
0.237(0.39)
2.261(0.91)
-1.103(-0.82)
Mid. Income x Female
-0.017(-0.53)
-0.078(-1.28)
0.109(1.23)
-0.187(-1.83)
0.050(0.27)
-0.086(-0.82)
0.043(0.83)
-1.159(-0.56)
2.140(0.69)
0.051(0.07)
HighIncome x Female
-0.058(-1.02)
-0.249(-1.65)
0.022(0.09)
-0.129(-0.70)
0.758(1.31)
-0.170(-0.88)
-0.008(-0.10)
-1.454(-0.70)
3.234(1.03)
-0.822(-0.94)
Constant -0.579***(-26.98)
-0.524***(-11.94)
-0.724***(-11.90)
-0.731***(-10.44)
-0.749***(-6.38)
-0.585***(-8.49)
-0.537***(-15.79)
0.324(1.01)
0.499(0.74)
-0.047(-0.20)
Family FEs x x x x x x x x x x
Observations 90702 19933 11359 8007 4583 9216 32710 1339 1748 1807
Adjusted R-squared 0.289 0.292 0.269 0.256 0.284 0.263 0.264 0.428 0.320 0.282
t statistics in parentheses* p<0.05, ** p<0.01, *** p<0.001
(1) (2) (3) (4) (5) (6) (7) (8) (9) (10)
AllStates Bihar Jharkhand Madhya
Pradesh Orissa Rajasthan Uttar Pradesh
HimachalPradesh Kerala Tamil
Nadu
Focus States Best States

248 249
AllStates Bihar Jharkhand Madhya
Pradesh Orissa Rajasthan Uttar Pradesh
HimachalPradesh Kerala Tamil
Nadu
(1) (2) (3) (4) (5) (6) (7) (8) (9) (10)
Age1 0.287***(5.83)
0.178*(1.97)
0.229(1.54)
0.375*(2.27)
0.009(0.03)
0.073(0.43)
0.433***(5.41)
1.019(1.73)
-0.572(-0.27)
0.045(0.04)
Age2 0.804***(17.64)
0.674***(8.01)
0.880***(6.37)
0.639***(4.23)
0.146(0.48)
0.469**(3.05)
1.087***(14.59)
1.726(1.08)
-1.053(-0.67)
-0.012(-0.01)
Age3 0.799***(17.39)
0.746***(8.80)
0.877***(6.37)
0.674***(4.13)
0.167(0.56)
0.674***(4.23)
0.933***(12.64)
-0.179(-0.30)
-0.602(-0.83)
-0.909(-0.86)
Age4 0.693***(13.80)
0.609***(6.77)
0.749***(4.82)
0.228(1.33)
-0.060(-0.20)
0.509**(3.03)
0.936***(11.14)
0.919(0.54)
-4.491(-1.58)
0.743(0.69)
Female -0.086*(-2.09)
-0.087(-1.11)
-0.092(-0.77)
0.056(0.41)
0.092(0.36)
0.047(0.33)
-0.151*(-2.24)
1.156(0.52)
-3.762(-1.08)
0.261(0.31)
Female x Age1 0.177***(3.71)
0.171(1.77)
0.130(0.98)
0.166(1.07)
0.010(0.04)
0.182(1.15)
0.192*(2.51)
0.386(0.69)
1.799(1.22)
0.506(1.01)
Female x Age2 0.008(0.17)
0.008(0.08)
-0.133(-0.98)
0.188(1.24)
0.088(0.33)
-0.069(-0.44)
-0.008(-0.10)
0.523(0.85)
1.109(0.85)
0.048(0.09)
Female x Age3 -0.028(-0.61)
-0.054(-0.57)
-0.218(-1.65)
0.013(0.08)
-0.190(-0.74)
-0.152(-0.96)
0.039(0.52)
0.915(1.61)
2.564(1.77)
0.522(1.02)
Female x Age4 -0.108*(-2.18)
-0.044(-0.45)
-0.245(-1.76)
0.140(0.86)
-0.192(-0.76)
-0.043(-0.26)
-0.191*(-2.38)
0.661(1.12)
1.711(1.15)
-0.498(-0.90)
SC x Age1 -0.003(-0.06)
-0.051(-0.46)
-0.095(-0.51)
-0.108(-0.51)
-0.032(-0.08)
0.180(0.86)
0.005(0.06)
0.233(0.41)
-0.351(-0.22)
-0.183(-0.36)
SC x Age2 0.044(0.88)
0.111(1.16)
-0.052(-0.30)
0.151(0.80)
0.234(0.65)
0.065(0.35)
-0.047(-0.63)
-0.056(-0.09)
-0.196(-0.13)
-0.017(-0.04)
SC x Age3 0.106*(2.07)
0.156(1.57)
-0.016(-0.09)
0.118(0.61)
0.060(0.18)
0.211(1.07)
0.079(1.05)
0.244(0.44)
-0.402(-0.26)
-0.136(-0.27)
SC x Age4 0.042(0.75)
0.178(1.64)
-0.057(-0.30)
0.147(0.67)
0.274(0.77)
-0.190(-0.88)
-0.048(-0.58)
-0.493(-0.79)
0.882(0.52)
-0.146(-0.27)
ST x Age1 -0.068(-0.86)
-0.021(-0.08)
-0.119(-0.68)
-0.003(-0.02)
0.293(0.87)
0.318(1.48)
-0.312(-1.48)
-4.841(-1.63)
-1.821(-0.65)
ST x Age2 -0.159*(-2.30)
-0.393(-1.57)
-0.177(-1.11)
-0.077(-0.48)
0.211(0.69)
0.382*(2.11)
-0.139(-0.70)
-1.617(-0.83)
-0.064(-0.02)
ST x Age3 -0.118(-1.69)
-0.000(-0.00)
-0.206(-1.31)
0.098(0.57)
0.249(0.83)
0.166(0.84)
-0.033(-0.18)
-3.562(-1.22)
-0.488(-0.27)
ST x Age4 -0.251***(-3.36)
-0.185(-0.67)
-0.231(-1.35)
-0.070(-0.38)
0.315(1.06)
0.094(0.45)
-0.012(-0.06)
-3.557(-1.37)
-5.823(-1.87)
Muslim x Age1 0.018(0.26)
0.099(0.79)
0.201(1.17)
0.531(1.19)
-1.253(-1.09)
0.449(1.45)
-0.214*(-2.05)
0.171(0.04)
Muslim x Age2 0.049(0.79)
0.042(0.38)
0.096(0.61)
-0.228(-0.60)
0.012(0.01)
0.354(1.45)
-0.079(-0.84)
3.115(0.97)
Muslim x Age3 0.099(1.59)
0.130(1.18)
0.147(0.94)
0.276(0.74)
-1.024(-0.91)
0.182(0.69)
-0.024(-0.24)
2.704(0.66)
Muslim x Age4
-0.021(-0.31)
-0.020(-0.17)
0.184(1.07)
0.049(0.12)
-1.097(-0.87)
0.121(0.41)
-0.215*(-2.02)
-2.141(-0.87)
0.698(0.34)
SC x Female 0.009(0.24)
0.026(0.37)
-0.035(-0.29)
-0.161(-1.21)
-0.063(-0.27)
0.002(0.02)
0.080(1.46)
-0.729(-1.92)
0.452(0.53)
-0.436(-1.37)
ST x Female 0.107*(2.17)
-0.319(-1.79)
0.178(1.60)
0.011(0.09)
0.111(0.55)
0.088(0.65)
-0.131(-0.94)
-0.712(-0.58)
-1.568(-0.77)
Focus States Best States
Table A12: BMI Z-scores within Household
Muslim x Female
0.044(0.98)
0.066(0.85)
0.155(1.40)
-0.177(-0.66)
0.832(0.77)
-0.220(-1.10)
0.059(0.86)
5.049*(2.23)
Mid. Income x Age1
0.036(0.73)
0.091(0.92)
-0.077(-0.55)
-0.197(-1.20)
0.245(0.76)
-0.003(-0.02)
0.104(1.32)
-1.257*(-2.27)
0.846(0.38)
-0.660(-0.62)
High Income x Age1
0.031(0.34)
-0.442(-1.60)
0.377(0.94)
-0.196(-0.66)
0.460(0.57)
0.308(1.02)
-0.074(-0.59)
-2.031(-0.73)
0.747(0.52)
Mid. Income x Age2
-0.060(-1.37)
0.096(1.09)
-0.262*(-2.07)
-0.180(-1.25)
0.294(0.99)
0.005(0.03)
-0.129(-1.79)
-1.461(-0.91)
1.446(0.90)
0.060(0.08)
High Income x Age2
-0.319***(-3.78)
-0.512*(-2.23)
0.091(0.28)
-0.397(-1.42)
-1.820*(-2.14)
-0.037(-0.13)
-0.491***(-4.13)
-0.840(-0.49)
0.368(0.35)
Mid. Income x Age3
-0.134**(-2.98)
-0.079(-0.89)
-0.398**(-3.11)
-0.160(-1.05)
0.079(0.27)
-0.159(-1.01)
-0.063(-0.87)
-0.270(-0.45)
0.342(0.33)
High Income x Age3
-0.184*(-2.11)
-0.321(-1.33)
-0.037(-0.10)
-0.099(-0.33)
0.262(0.34)
0.147(0.54)
-0.329**(-2.73)
-4.132(-1.54)
1.912(1.35)
Mid. Income x Age4
-0.059(-1.21)
-0.048(-0.49)
-0.310*(-2.24)
0.099(0.59)
0.402(1.43)
-0.010(-0.06)
-0.046(-0.57)
-1.373(-0.84)
4.101(1.46)
-0.361(-0.36)
High Income x Age4
-0.388***(-4.05)
-0.589*(-2.24)
-0.032(-0.07)
-0.239(-0.76)
-0.775(-1.00)
-0.434(-1.30)
-0.430**(-3.24)
-1.069(-0.67)
2.840(1.09)
-1.030(-0.72)
Mid. Income x Female
-0.025(-0.79)
-0.103(-1.65)
0.158(1.77)
-0.186(-1.77)
0.011(0.06)
-0.114(-1.05)
0.046(0.88)
-1.577(-0.74)
1.437(0.44)
-0.319(-0.44)
HighIncome x Female
-0.016(-0.27)
-0.154(-0.99)
0.122(0.47)
-0.133(-0.70)
0.855(1.44)
-0.198(-1.00)
0.048(0.58)
-1.922(-0.89)
2.681(0.81)
-0.814(-0.86)
Constant -0.837***(-38.20)
-0.830***(-18.48)
-1.026***(-16.76)
-0.947***(-13.26)
-0.862***(-7.19)
-0.833***(-11.93)
-0.776***(-22.29)
0.416(1.24)
0.185(0.26)
-0.196(-0.79)
Family FEs x x x x x x x x x x
Observations 90691 19923 11348 7999 4586 9244 32738 1332 1727 1794
Adjusted R-squared 0.308 0.299 0.290 0.277 0.297 0.286 0.297 0.441 0.308 0.226
t statistics in parentheses* p<0.05, ** p<0.01, *** p<0.001
(1) (2) (3) (4) (5) (6) (7) (8) (9) (10)
AllStates Bihar Jharkhand Madhya
Pradesh Orissa Rajasthan Uttar Pradesh
HimachalPradesh Kerala Tamil
Nadu
Focus States Best States

250 251
AllStates Bihar Jharkhand Madhya
Pradesh Orissa Rajasthan Uttar Pradesh
HimachalPradesh Kerala Tamil
Nadu
Mid. Income 0.229***(8.33)
0.306***(4.99)
0.305***(3.84)
0.114(1.06)
0.405**(2.67)
0.384*(2.54)
0.140**(2.99)
0.481(0.84)
0.116(0.20)
-0.050(-0.11)
High Income 0.444***(8.77)
0.706***(5.10)
0.301(1.69)
0.015(0.09)
1.454***(4.81)
0.652**(2.63)
0.280***(3.60)
0.899(1.60)
0.245(0.39)
0.167(0.34)
Mid. Income x NREGA
-0.000(-1.18)
-0.000(-0.16)
-0.001(-1.40)
-0.000(-0.39)
-0.002(-1.26)
-0.001(-0.39)
0.000(0.72)
-0.009*(-2.23)
-0.006(-0.60)
-0.003(-0.60)
High Income x NREGA
-0.001(-1.79)
-0.001(-0.41)
-0.001(-0.40)
0.001(0.51)
-0.012***(-3.55)
-0.001(-0.41)
0.001(1.07)
-0.013**(-2.92)
-0.004(-0.37)
-0.003(-0.59)
SC -0.117***(-4.24)
-0.089(-1.50)
-0.316***(-4.00)
-0.082(-0.84)
0.117(0.88)
-0.004(-0.04)
-0.138**(-3.12)
-0.544**(-2.87)
0.209(0.87)
-0.106(-0.77)
ST -0.213***(-6.05)
-0.448***(-3.40)
-0.169*(-2.08)
-0.311***(-3.37)
-0.314**(-2.67)
-0.106(-1.18)
-0.186(-1.84)
-0.348(-0.69)
-0.319(-0.75)
-1.349**(-2.91)
Muslim -0.023(-0.63)
-0.066(-0.97)
0.033(0.36)
0.123(0.67)
0.096(0.33)
-0.220(-1.43)
0.020(0.37)
-2.203***(-6.96)
-0.405(-0.86)
0.345(1.57)
Age1 -0.111***(-4.18)
-0.133*(-2.56)
-0.183*(-2.57)
-0.200*(-2.23)
-0.122(-1.00)
-0.055(-0.62)
-0.044(-1.01)
-0.507(-1.13)
-0.768(-1.05)
-0.480(-1.20)
Age2 -0.216***(-8.41)
-0.240***(-4.94)
-0.337***(-4.52)
-0.320***(-3.65)
-0.338**(-2.83)
-0.083(-0.95)
-0.131**(-3.10)
-1.224*(-2.13)
-0.865(-1.37)
-0.638(-1.59)
Age3 -0.276***(-10.90)
-0.243***(-4.93)
-0.395***(-5.51)
-0.452***(-5.23)
-0.412***(-3.41)
-0.190*(-2.14)
-0.208***(-4.90)
-0.901(-1.85)
-0.977(-1.72)
-0.718*(-2.24)
Age4 -0.366***(-14.07)
-0.347***(-6.95)
-0.558***(-7.03)
-0.464***(-4.99)
-0.551***(-4.68)
-0.261**(-3.07)
-0.308***(-7.07)
-1.390**(-2.85)
-0.692(-1.14)
-1.143**(-3.07)
Female 0.142***(6.08)
0.052(1.05)
0.216***(3.40)
0.094(1.25)
0.159(1.71)
0.189**(2.65)
0.153***(3.72)
0.649**(2.78)
1.240**(2.99)
0.445(1.59)
Female x Age1 -0.097***(-3.87)
-0.074(-1.30)
-0.151*(-2.31)
-0.021(-0.28)
-0.134(-1.40)
-0.051(-0.69)
-0.107*(-2.43)
-0.240(-1.22)
-0.654*(-2.10)
0.039(0.23)
Female x Age2 -0.166***(-6.77)
-0.085(-1.61)
-0.260***(-3.93)
-0.125(-1.56)
-0.126(-1.34)
-0.129(-1.75)
-0.204***(-4.67)
-0.301(-1.50)
-0.559*(-2.04)
-0.170(-0.96)
Female x Age3 -0.166***(-6.83)
-0.118*(-2.26)
-0.251***(-3.86)
-0.030(-0.40)
-0.112(-1.20)
-0.059(-0.81)
-0.229***(-5.42)
-0.287(-1.44)
-0.689*(-2.49)
-0.027(-0.17)
Female x Age4 -0.193***(-7.81)
-0.112*(-2.09)
-0.315***(-4.79)
-0.094(-1.18)
-0.141(-1.52)
-0.140(-1.92)
-0.232***(-5.36)
-0.552**(-2.90)
-0.565*(-2.07)
-0.178(-1.08)
SC x Age1 -0.031(-0.99)
-0.097(-1.48)
0.175(1.96)
-0.132(-1.20)
-0.231(-1.60)
0.027(0.23)
-0.031(-0.64)
0.366(1.82)
-0.033(-0.11)
-0.103(-0.57)
SC x Age2 -0.019(-0.64)
-0.120(-1.88)
0.104(1.16)
0.035(0.33)
-0.168(-1.17)
-0.045(-0.42)
0.003(0.06)
0.213(1.03)
-0.017(-0.06)
0.097(0.56)
SC x Age3 0.015(0.50)
-0.062(-1.00)
0.136(1.57)
0.096(0.95)
-0.198(-1.34)
0.001(0.01)
0.039(0.82)
0.394(1.96)
-0.266(-1.13)
0.080(0.47)
SC x Age4 -0.016(-0.54)
-0.043(-0.66)
0.232*(2.54)
-0.020(-0.18)
-0.167(-1.09)
-0.083(-0.74)
-0.016(-0.33)
0.469*(2.29)
-0.398(-1.59)
0.087(0.48)
ST x Age1 0.003(0.07)
0.154(1.00)
-0.034(-0.40)
-0.098(-1.01)
0.170(1.31)
0.017(0.17)
0.117(1.03)
0.117(0.21)
-0.340(-0.46)
1.400**(3.00)
ST x Age2 0.029(0.79)
0.277(1.91)
-0.025(-0.28)
0.092(1.00)
0.215(1.71)
-0.048(-0.53)
0.084(0.74)
0.136(0.28)
1.272*(2.27)
0.611(1.26)
ST x Age3 -0.002(-0.04)
0.162(1.12)
-0.027(-0.31)
0.072(0.77)
0.117(0.94)
-0.047(-0.49)
0.133(1.24)
0.010(0.02)
0.867(1.32)
1.134**(2.88)
ST x Age4 0.010(0.28)
0.327*(2.05)
0.145(1.67)
-0.084(-0.87)
0.188(1.57)
0.003(0.03)
0.075(0.63)
0.644(1.21)
0.379(0.63)
Focus States Best States
Table A13: MUAC Z-scores between Households
Muslim x Age1 0.006(0.15)
-0.046(-0.65)
0.004(0.04)
-0.107(-0.49)
0.105(0.28)
0.227(1.36)
0.019(0.32)
0.205(0.41)
-0.078(-0.22)
Muslim x Age2 0.001(0.02)
-0.029(-0.41)
0.104(1.07)
-0.095(-0.41)
-0.407(-0.81)
0.167(1.01)
-0.072(-1.24)
0.452(0.85)
-0.595(-1.52)
Muslim x Age3 0.033(0.89)
-0.033(-0.49)
0.105(1.09)
-0.032(-0.17)
-0.143(-0.51)
0.302(1.92)
-0.002(-0.04)
0.135(0.28)
0.099(0.18)
Muslim x Age4
0.024(0.62)
0.039(0.54)
0.188(1.94)
0.021(0.10)
-0.247(-0.85)
0.205(1.23)
-0.110(-1.85)
-0.033(-0.07)
-0.533*(-1.98)
SC x Female 0.031*(2.01)
0.045(1.43)
0.062(1.31)
0.068(1.20)
0.098(1.33)
-0.085(-1.61)
0.042(1.72)
-0.017(-0.16)
-0.236(-1.96)
-0.039(-0.39)
ST x Female 0.066***(3.49)
0.027(0.38)
0.071(1.63)
0.141**(2.93)
-0.015(-0.23)
-0.045(-0.90)
0.026(0.43)
0.035(0.12)
-0.052(-0.07)
0.522(1.94)
Muslim x Female
0.005(0.24)
0.026(0.74)
0.044(0.98)
-0.083(-0.68)
0.037(0.15)
-0.069(-0.97)
0.013(0.43)
0.297(0.97)
-0.051(-0.26)
0.394(0.82)
Mid. Income x Age1
-0.042(-1.58)
-0.078(-1.32)
-0.132(-1.92)
0.078(0.87)
-0.049(-0.40)
-0.118(-1.38)
-0.031(-0.71)
0.195(0.42)
0.841(1.23)
0.284(0.72)
High Income x Age1
0.051(1.01)
-0.040(-0.28)
0.170(0.90)
0.248(1.64)
0.248(0.79)
-0.163(-1.16)
0.068(0.86)
0.106(0.25)
0.986(1.32)
0.204(0.45)
Mid. Income x Age2
-0.062*(-2.42)
-0.060(-1.07)
-0.014(-0.21)
-0.023(-0.28)
-0.007(-0.06)
-0.177*(-2.13)
-0.066(-1.51)
0.842(1.53)
0.455(0.77)
0.212(0.54)
High Income x Age2
-0.043(-0.87)
-0.109(-0.86)
0.206(1.02)
0.152(1.02)
-0.559(-1.70)
-0.222(-1.66)
-0.077(-0.97)
0.808(1.48)
0.756(1.13)
0.482(1.06)
Mid. Income x Age3
-0.106***(-4.14)
-0.170**(-2.94)
-0.124(-1.83)
0.059(0.74)
-0.048(-0.37)
-0.223*(-2.58)
-0.081(-1.87)
0.377(0.81)
0.708(1.37)
0.029(0.09)
High Income x Age3
-0.098*(-1.99)
-0.214(-1.63)
0.190(1.12)
0.140(0.90)
-0.075(-0.25)
-0.355*(-2.53)
-0.056(-0.72)
0.250(0.52)
0.690(1.17)
0.137(0.34)
Mid. Income x Age4
-0.089***(-3.39)
-0.137*(-2.35)
-0.058(-0.84)
-0.042(-0.48)
-0.083(-0.76)
-0.160*(-1.97)
-0.039(-0.86)
0.766(1.56)
0.228(0.40)
0.451(1.23)
High Income x Age4
-0.125*(-2.49)
-0.293*(-2.33)
0.089(0.47)
0.043(0.26)
-0.372(-1.33)
-0.293*(-2.03)
-0.075(-0.93)
0.617(1.27)
0.423(0.66)
0.637(1.45)
Mid. Income x Female
0.006(0.43)
-0.012(-0.42)
-0.015(-0.41)
-0.026(-0.57)
-0.051(-0.82)
-0.037(-0.89)
0.035(1.55)
-0.441*(-2.59)
-0.529(-1.68)
-0.223(-0.99)
High Income x Female
-0.024(-0.96)
-0.112(-1.71)
0.038(0.36)
0.045(0.55)
-0.123(-0.73)
-0.064(-0.89)
0.027(0.68)
-0.489**(-2.80)
-0.761*(-2.44)
-0.367(-1.31)
Constant -1.104***(-47.84)
-0.937***(-4.88)
-0.848***(-6.09)
-0.783***(-4.29)
-0.965***(-3.82)
-1.610***(-9.51)
-0.828***(-3.87)
-0.692(-1.15)
-0.817(-1.34)
0.264(0.71)
Village FEs x x x x x x x x x x
Observations 84520 18572 10701 8573 4744 9157 27933 1276 1776 1788
Adjusted R-squared 0.195 0.154 0.193 0.193 0.215 0.155 0.146 0.223 0.216 0.223
t statistics in parentheses* p<0.05, ** p<0.01, *** p<0.001
(1) (2) (3) (4) (5) (6) (7) (8) (9) (10)
AllStates Bihar Jharkhand Madhya
Pradesh Orissa Rajasthan Uttar Pradesh
HimachalPradesh Kerala Tamil
Nadu
Focus States Best States

252 253
AllStates Bihar Jharkhand Madhya
Pradesh Orissa Rajasthan Uttar Pradesh
HimachalPradesh Kerala Tamil
Nadu
Mid. Income 0.265***(8.12)
0.272***(4.04)
0.319**(3.18)
0.087(0.64)
0.458*(2.54)
0.818***(3.97)
0.122*(2.21)
-0.557(-0.65)
1.947***(3.58)
0.544(1.08)
High Income 0.637***(10.53)
0.939***(5.46)
0.652**(2.89)
0.492*(2.32)
1.420***(3.93)
1.103***(3.82)
0.430***(4.55)
-0.829(-0.94)
1.764**(2.77)
1.046(1.96)
Mid. Income x NREGA
-0.000(-0.86)
-0.001(-0.66)
0.000(0.10)
0.001(0.81)
-0.004(-1.72)
-0.003(-1.38)
0.001(0.98)
-0.005(-0.67)
-0.009(-0.57)
-0.002(-0.37)
High Income x NREGA
-0.003***(-4.10)
-0.008**(-2.92)
-0.006(-1.75)
0.002(0.94)
-0.014**(-2.84)
-0.005(-1.47)
-0.000(-0.02)
-0.004(-0.60)
-0.012(-0.75)
-0.006(-0.87)
SC -0.184***(-6.11)
-0.281***(-4.58)
-0.405***(-4.34)
0.000(0.00)
0.151(0.91)
0.044(0.43)
-0.210***(-4.31)
-0.410*(-2.17)
-0.027(-0.10)
0.195(1.31)
ST -0.239***(-5.76)
-0.537***(-3.51)
-0.300***(-3.46)
-0.257*(-2.36)
-0.243(-1.91)
-0.025(-0.24)
-0.095(-0.81)
-0.060(-0.13)
0.240(0.76)
-0.560(-1.15)
Muslim 0.065(1.59)
0.008(0.11)
0.080(0.82)
0.287(1.37)
-0.606(-1.76)
0.008(0.04)
0.076(1.18)
-1.443***(-3.43)
0.044(0.11)
0.067(0.08)
Age1 -0.136***(-4.27)
-0.141*(-2.42)
-0.250**(-2.98)
-0.117(-1.07)
-0.003(-0.02)
-0.044(-0.41)
-0.140**(-2.58)
-0.599(-0.83)
1.039(0.96)
0.219(0.41)
Age2 -0.101***(-3.38)
-0.178**(-3.17)
-0.163(-1.86)
0.034(0.34)
-0.096(-0.68)
0.098(0.97)
-0.105*(-2.05)
-1.745*(-2.14)
1.237(1.51)
-0.107(-0.21)
Age3 -0.092**(-3.15)
-0.146**(-2.75)
-0.075(-0.94)
0.071(0.68)
-0.109(-0.71)
-0.040(-0.39)
-0.104*(-2.04)
-1.159(-1.59)
0.348(0.55)
0.120(0.24)
Age4 -0.076*(-2.55)
-0.111*(-2.05)
-0.170*(-2.04)
0.125(1.19)
-0.176(-1.18)
0.149(1.51)
-0.145**(-2.79)
-2.139**(-3.00)
0.764(1.07)
0.317(0.63)
Female 0.127***(4.81)
0.086(1.70)
0.156*(2.21)
0.217*(2.46)
0.036(0.30)
0.303***(3.42)
0.090(1.95)
0.721(1.58)
0.704(1.37)
0.125(0.40)
Female x Age1 -0.040(-1.35)
-0.085(-1.33)
-0.016(-0.20)
-0.161(-1.65)
-0.040(-0.31)
-0.087(-0.93)
0.011(0.21)
-0.019(-0.09)
-0.044(-0.15)
0.280(1.37)
Female x Age2 -0.174***(-6.03)
-0.176**(-2.96)
-0.207**(-2.73)
-0.263**(-2.73)
-0.120(-1.02)
-0.210*(-2.36)
-0.132**(-2.58)
-0.182(-0.83)
-0.215(-0.81)
-0.081(-0.47)
Female x Age3 -0.213***(-7.66)
-0.192***(-3.40)
-0.314***(-4.27)
-0.195*(-2.14)
-0.177(-1.49)
-0.165(-1.87)
-0.218***(-4.58)
-0.231(-1.13)
-0.243(-0.97)
-0.039(-0.23)
Female x Age4 -0.267***(-9.44)
-0.242***(-4.21)
-0.333***(-4.41)
-0.434***(-4.49)
-0.155(-1.39)
-0.281**(-3.18)
-0.243***(-4.84)
-0.248(-1.28)
-0.010(-0.04)
-0.335(-1.66)
SC x Age1 -0.085*(-2.33)
-0.163*(-2.21)
0.106(0.91)
-0.313*(-2.35)
-0.341(-1.81)
-0.086(-0.67)
-0.026(-0.46)
-0.141(-0.67)
-0.305(-0.81)
-0.423*(-2.29)
SC x Age2 -0.037(-1.07)
-0.003(-0.04)
0.081(0.72)
-0.122(-0.99)
-0.317(-1.79)
-0.254*(-2.09)
-0.001(-0.01)
-0.089(-0.41)
0.059(0.19)
-0.231(-1.34)
SC x Age3 0.012(0.37)
0.028(0.42)
0.091(0.84)
-0.103(-0.86)
-0.231(-1.35)
-0.087(-0.74)
0.073(1.34)
0.084(0.42)
-0.150(-0.52)
-0.364*(-2.09)
SC x Age4 -0.023(-0.68)
-0.010(-0.14)
0.213*(2.01)
-0.081(-0.65)
-0.175(-0.95)
-0.279*(-2.35)
0.060(1.11)
0.205(0.95)
-0.268(-0.89)
-0.404*(-2.07)
ST x Age1 -0.107*(-2.22)
0.155(0.82)
-0.072(-0.73)
-0.064(-0.53)
-0.228(-1.48)
-0.174(-1.37)
-0.021(-0.15)
-0.388(-0.62)
-0.855(-1.00)
0.676(1.27)
ST x Age2 -0.057(-1.26)
0.227(1.32)
-0.031(-0.31)
0.060(0.52)
-0.176(-1.27)
-0.244*(-2.06)
-0.133(-0.96)
-0.644(-1.44)
0.832(0.95)
0.303(0.50)
ST x Age3 -0.036(-0.83)
0.265(1.64)
-0.050(-0.51)
-0.091(-0.80)
-0.140(-0.93)
-0.098(-0.82)
0.113(0.84)
-0.065(-0.11)
0.795(1.13)
0.103(0.22)
ST x Age4 0.015(0.35)
0.399*(2.24)
0.130(1.38)
-0.073(-0.64)
-0.032(-0.23)
-0.136(-1.19)
0.019(0.14)
0.320(0.69)
-0.698(-1.30)
Focus States Best States
Table A14: Weight-for-Age Z-scores between Households
Muslim x Age1 -0.094*(-2.01)
-0.162(-1.87)
-0.103(-0.95)
-0.266(-1.02)
0.336(0.61)
-0.112(-0.56)
0.031(0.42)
-0.550(-1.17)
1.075(0.89)
Muslim x Age2 -0.177***(-3.95)
-0.176*(-2.14)
-0.105(-1.00)
-0.134(-0.51)
0.356(0.48)
-0.237(-1.19)
-0.202**(-2.78)
0.047(0.10)
-0.337(-0.31)
Muslim x Age3 -0.084(-1.92)
-0.140(-1.86)
0.044(0.44)
-0.460*(-2.12)
0.375(0.91)
0.165(0.98)
-0.129(-1.84)
-0.108(-0.25)
0.904(0.91)
Muslim x Age4
-0.154***(-3.47)
-0.098(-1.21)
0.045(0.42)
-0.341(-1.44)
0.341(0.82)
-0.181(-0.99)
-0.276***(-3.96)
-0.586(-1.24)
-0.047(-0.05)
SC x Female 0.043*(2.07)
0.123**(3.06)
0.071(1.04)
0.065(0.86)
0.028(0.26)
-0.041(-0.57)
0.013(0.38)
0.196(1.62)
-0.194(-1.52)
0.041(0.33)
ST x Female 0.102***(3.77)
0.023(0.23)
0.195***(3.42)
0.128(1.68)
0.171*(1.98)
-0.114(-1.57)
-0.023(-0.27)
0.257(0.73)
-0.416(-0.47)
0.526(1.32)
Muslim x Female
0.012(0.45)
0.015(0.30)
0.087(1.33)
0.187(1.19)
-0.045(-0.15)
-0.039(-0.36)
-0.015(-0.35)
0.506(1.36)
0.069(0.36)
0.632(1.16)
Mid. Income x Age1
-0.022(-0.68)
-0.079(-1.20)
-0.102(-1.23)
0.111(1.12)
0.079(0.57)
-0.292**(-2.99)
0.027(0.50)
0.635(0.88)
-0.980(-0.91)
-0.348(-0.67)
High Income x Age1
0.189**(3.10)
-0.031(-0.19)
0.278(1.19)
-0.123(-0.66)
0.997**(2.99)
-0.127(-0.72)
0.270**(2.75)
1.143(1.57)
-0.714(-0.64)
-0.327(-0.60)
Mid. Income x Age2
-0.052(-1.72)
0.024(0.38)
-0.049(-0.63)
-0.149(-1.53)
-0.006(-0.04)
-0.331***(-3.35)
0.010(0.19)
1.706*(2.14)
-1.850*(-2.31)
-0.126(-0.25)
High Income x Age2
-0.010(-0.16)
0.113(0.72)
0.421(1.66)
-0.361*(-2.11)
-0.246(-0.63)
-0.421*(-2.48)
0.008(0.09)
2.052*(2.48)
-1.147(-1.30)
0.066(0.13)
Mid. Income x Age3
-0.135***(-4.66)
-0.083(-1.39)
-0.237**(-3.09)
-0.152(-1.56)
-0.081(-0.62)
-0.458***(-4.74)
-0.002(-0.05)
1.008(1.40)
-0.995(-1.66)
-0.599(-1.24)
High Income x Age3
-0.061(-1.08)
-0.077(-0.47)
0.178(0.77)
-0.467*(-2.52)
0.350(1.17)
-0.385*(-2.48)
0.014(0.15)
1.248(1.64)
-0.208(-0.30)
-0.393(-0.81)
Mid. Income x Age4
-0.118***(-3.96)
-0.079(-1.26)
-0.174*(-2.29)
-0.193(-1.89)
-0.021(-0.16)
-0.328***(-3.45)
0.037(0.72)
1.600*(2.27)
-1.561*(-2.29)
-0.634(-1.27)
High Income x Age4
-0.189**(-3.23)
-0.123(-0.80)
0.132(0.57)
-0.642**(-3.24)
0.081(0.28)
-0.395*(-2.28)
-0.049(-0.52)
1.746*(2.41)
-0.952(-1.22)
-0.864(-1.70)
Mid. Income x Female
0.010(0.58)
-0.004(-0.11)
0.006(0.12)
0.045(0.74)
0.021(0.25)
-0.175**(-2.91)
0.030(0.94)
-0.768(-1.82)
-0.400(-0.86)
0.094(0.38)
High Income x Female
-0.042(-1.22)
-0.169(-1.94)
-0.010(-0.07)
0.067(0.61)
-0.230(-1.17)
-0.241*(-2.37)
0.022(0.39)
-0.631(-1.44)
-0.738(-1.51)
-0.093(-0.32)
Constant -1.681***(-66.44)
-1.550***(-5.98)
-1.158***(-4.96)
-1.555***(-4.59)
-1.600***(-4.63)
-1.947***(-8.08)
-0.979***(-3.61)
-0.499(-0.58)
-2.508***(-4.11)
-1.226*(-2.48)
Village FEs x x x x x x x x x x
Observations 90918 20265 11587 8669 5036 9696 30478 1413 1836 1938
Adjusted R-squared 0.093 0.078 0.085 0.076 0.168 0.069 0.074 0.116 0.099 0.066
t statistics in parentheses* p<0.05, ** p<0.01, *** p<0.001
(1) (2) (3) (4) (5) (6) (7) (8) (9) (10)
AllStates Bihar Jharkhand Madhya
Pradesh Orissa Rajasthan Uttar Pradesh
HimachalPradesh Kerala Tamil
Nadu
Focus States Best States

254 255
AllStates Bihar Jharkhand Madhya
Pradesh Orissa Rajasthan Uttar Pradesh
HimachalPradesh Kerala Tamil
Nadu
Mid. Income 0.244***(5.83)
0.284**(3.20)
0.368**(2.70)
-0.038(-0.22)
0.165(0.80)
0.551*(2.15)
0.151*(2.20)
-0.557(-0.65)
1.947***(3.58)
0.544(1.08)
High Income 0.629***(8.02)
0.733**(3.25)
0.413(1.20)
0.497(1.73)
0.668(1.68)
0.871*(2.50)
0.415***(3.33)
-0.829(-0.94)
1.764**(2.77)
1.046(1.96)
Mid. Income x NREGA
-0.001(-1.53)
-0.003*(-2.03)
-0.001(-0.81)
0.003(1.39)
-0.002(-0.86)
-0.002(-0.57)
-0.000(-0.05)
-0.005(-0.67)
-0.009(-0.57)
-0.002(-0.37)
High Income x NREGA
-0.003***(-3.43)
-0.002(-0.71)
-0.002(-0.58)
0.003(0.77)
-0.010*(-2.00)
-0.002(-0.64)
0.001(0.27)
-0.004(-0.60)
-0.012(-0.75)
-0.006(-0.87)
SC -0.177***(-4.58)
-0.321***(-4.03)
-0.440***(-3.48)
0.103(0.72)
0.131(0.59)
-0.005(-0.04)
-0.178**(-2.96)
-0.410*(-2.17)
-0.027(-0.10)
0.195(1.31)
ST -0.317***(-5.71)
-0.601**(-3.05)
-0.382**(-3.00)
-0.330**(-2.63)
-0.387*(-2.20)
0.116(0.83)
-0.074(-0.44)
-0.060(-0.13)
0.240(0.76)
-0.560(-1.15)
Muslim 0.014(0.28)
-0.069(-0.71)
-0.129(-1.03)
0.152(0.61)
-0.164(-0.52)
-0.200(-1.13)
0.133(1.58)
-1.443***(-3.43)
0.044(0.11)
0.067(0.08)
Age1 -0.542***(-12.88)
-0.351***(-4.34)
-0.703***(-5.56)
-0.537***(-4.17)
-0.523*(-2.51)
-0.283*(-2.10)
-0.673***(-9.48)
-0.599(-0.83)
1.039(0.96)
0.219(0.41)
Age2 -0.766***(-19.39)
-0.827***(-10.50)
-0.811***(-6.84)
-0.551***(-4.32)
-0.532**(-2.68)
-0.443***(-3.55)
-0.907***(-13.33)
-1.745*(-2.14)
1.237(1.51)
-0.107(-0.21)
Age3 -0.745***(-19.75)
-0.826***(-11.06)
-0.699***(-6.26)
-0.429***(-3.56)
-0.610***(-3.39)
-0.585***(-4.88)
-0.846***(-12.66)
-1.159(-1.59)
0.348(0.55)
0.120(0.24)
Age4 -0.600***(-15.47)
-0.606***(-8.36)
-0.638***(-5.45)
-0.204(-1.64)
-0.402*(-2.16)
-0.254*(-2.10)
-0.830***(-11.92)
-2.139**(-3.00)
0.764(1.07)
0.317(0.63)
Female 0.203***(5.98)
0.171*(2.55)
0.240*(2.45)
0.284**(2.71)
-0.013(-0.09)
0.350**(3.25)
0.171**(2.94)
0.721(1.58)
0.704(1.37)
0.125(0.40)
Female x Age1 -0.082*(-2.08)
-0.188*(-2.25)
-0.064(-0.58)
-0.077(-0.62)
0.133(0.78)
-0.250*(-2.11)
-0.052(-0.79)
-0.019(-0.09)
-0.044(-0.15)
0.280(1.37)
Female x Age2 -0.162***(-4.31)
-0.171*(-2.19)
-0.182(-1.82)
-0.235*(-2.03)
-0.131(-0.84)
-0.318**(-2.84)
-0.056(-0.87)
-0.182(-0.83)
-0.215(-0.81)
-0.081(-0.47)
Female x Age3 -0.225***(-6.26)
-0.199*(-2.50)
-0.340***(-3.31)
-0.217(-1.91)
-0.037(-0.24)
-0.296**(-2.68)
-0.202***(-3.39)
-0.231(-1.13)
-0.243(-0.97)
-0.039(-0.23)
Female x Age4 -0.276***(-7.59)
-0.268***(-3.57)
-0.297**(-3.00)
-0.392***(-3.32)
-0.156(-1.09)
-0.366***(-3.34)
-0.259***(-4.10)
-0.248(-1.28)
-0.010(-0.04)
-0.335(-1.66)
SC x Age1 -0.016(-0.33)
-0.065(-0.70)
0.277(1.83)
-0.310(-1.79)
-0.199(-0.73)
-0.079(-0.45)
0.026(0.36)
-0.141(-0.67)
-0.305(-0.81)
-0.423*(-2.29)
SC x Age2 -0.042(-0.94)
0.060(0.65)
0.201(1.36)
-0.251(-1.51)
-0.479(-1.82)
-0.177(-1.15)
-0.039(-0.57)
-0.089(-0.41)
0.059(0.19)
-0.231(-1.34)
SC x Age3 -0.000(-0.01)
0.153(1.78)
0.115(0.85)
-0.227(-1.40)
-0.285(-1.20)
-0.017(-0.11)
0.003(0.05)
0.084(0.42)
-0.150(-0.52)
-0.364*(-2.09)
SC x Age4 -0.043(-0.97)
0.001(0.01)
0.179(1.27)
-0.250(-1.51)
-0.300(-1.17)
-0.149(-0.99)
0.065(0.94)
0.205(0.95)
-0.268(-0.89)
-0.404*(-2.07)
ST x Age1 -0.034(-0.53)
0.118(0.45)
0.069(0.49)
0.076(0.50)
-0.130(-0.62)
-0.354*(-2.17)
-0.060(-0.32)
-0.388(-0.62)
-0.855(-1.00)
0.676(1.27)
ST x Age2 -0.040(-0.67)
0.340(1.41)
-0.068(-0.48)
-0.002(-0.02)
-0.262(-1.34)
-0.303*(-2.01)
-0.149(-0.79)
-0.644(-1.44)
0.832(0.95)
0.303(0.50)
ST x Age3 0.041(0.71)
0.253(1.19)
0.101(0.76)
-0.116(-0.84)
-0.093(-0.50)
-0.317*(-2.20)
-0.015(-0.08)
-0.065(-0.11)
0.795(1.13)
0.103(0.22)
ST x Age4 0.138*(2.36)
0.292(1.23)
0.132(0.97)
-0.094(-0.67)
-0.068(-0.37)
-0.128(-0.86)
0.104(0.57)
0.320(0.69)
-0.698(-1.30)
Focus States Best States
Table A15: Length-for-Age Z-scores between Households
Muslim x Age1 -0.127*(-2.05)
-0.175(-1.54)
-0.041(-0.27)
-0.228(-0.74)
-0.097(-0.17)
-0.320(-1.41)
-0.050(-0.49)
-0.550(-1.17)
1.075(0.89)
Muslim x Age2 -0.182**(-3.14)
-0.055(-0.51)
-0.041(-0.30)
-0.117(-0.38)
-1.188(-1.97)
-0.086(-0.42)
-0.324***(-3.38)
0.047(0.10)
-0.337(-0.31)
Muslim x Age3 -0.119*(-2.09)
-0.127(-1.26)
0.149(1.10)
-0.204(-0.74)
-0.471(-0.86)
0.226(1.10)
-0.257**(-2.75)
-0.108(-0.25)
0.904(0.91)
Muslim x Age4
-0.163**(-2.83)
-0.111(-1.02)
0.134(0.97)
-0.243(-0.88)
-0.195(-0.38)
-0.064(-0.35)
-0.334***(-3.59)
-0.586(-1.24)
-0.047(-0.05)
SC x Female 0.031(1.13)
0.106(1.91)
0.103(1.11)
-0.091(-0.91)
0.174(1.42)
-0.010(-0.10)
-0.003(-0.07)
0.196(1.62)
-0.194(-1.52)
0.041(0.33)
ST x Female 0.116***(3.37)
0.067(0.48)
0.256**(3.30)
0.093(1.07)
0.267*(2.36)
-0.075(-0.88)
-0.045(-0.42)
0.257(0.73)
-0.416(-0.47)
0.526(1.32)
Muslim x Female
-0.022(-0.61)
-0.053(-0.81)
0.060(0.71)
0.141(0.66)
0.035(0.08)
-0.040(-0.30)
-0.036(-0.61)
0.506(1.36)
0.069(0.36)
0.632(1.16)
Mid. Income x Age1
0.013(0.32)
-0.201*(-2.26)
-0.007(-0.06)
0.137(1.03)
0.257(1.36)
-0.179(-1.36)
0.076(1.07)
0.635(0.88)
-0.980(-0.91)
-0.348(-0.67)
High Income x Age1
0.248**(3.06)
-0.055(-0.24)
0.238(0.68)
-0.039(-0.17)
1.497***(3.74)
-0.145(-0.64)
0.437***(3.45)
1.143(1.57)
-0.714(-0.64)
-0.327(-0.60)
Mid. Income x Age2
0.038(0.95)
0.090(1.06)
0.071(0.61)
-0.087(-0.69)
0.157(0.82)
-0.254*(-2.08)
0.088(1.33)
1.706*(2.14)
-1.850*(-2.31)
-0.126(-0.25)
High Income x Age2
0.209**(2.73)
0.309(1.41)
0.674*(2.06)
-0.174(-0.81)
0.793(1.92)
-0.319(-1.48)
0.227(1.89)
2.052*(2.48)
-1.147(-1.30)
0.066(0.13)
Mid. Income x Age3
-0.007(-0.19)
0.067(0.84)
-0.067(-0.61)
-0.099(-0.81)
0.287(1.64)
-0.235*(-2.05)
0.065(1.00)
1.008(1.40)
-0.995(-1.66)
-0.599(-1.24)
High Income x Age3
0.039(0.53)
0.163(0.73)
0.395(1.21)
-0.483*(-2.12)
0.881**(2.74)
-0.312(-1.45)
0.161(1.36)
1.248(1.64)
-0.208(-0.30)
-0.393(-0.81)
Mid. Income x Age4
-0.041(-1.05)
0.017(0.21)
-0.051(-0.47)
-0.199(-1.58)
0.097(0.56)
-0.247*(-2.04)
0.115(1.74)
1.600*(2.27)
-1.561*(-2.29)
-0.634(-1.27)
High Income x Age4
-0.015(-0.20)
0.132(0.59)
0.308(1.00)
-0.733***(-3.31)
0.663*(2.08)
-0.159(-0.74)
0.160(1.32)
1.746*(2.41)
-0.952(-1.22)
-0.864(-1.70)
Mid. Income x Female
-0.010(-0.43)
0.037(0.79)
-0.083(-1.23)
0.025(0.33)
-0.011(-0.10)
-0.082(-1.13)
-0.016(-0.39)
-0.768(-1.82)
-0.400(-0.86)
0.094(0.38)
High Income x Female
-0.048(-1.06)
-0.212(-1.85)
0.025(0.14)
0.007(0.05)
-0.187(-0.91)
-0.304*(-2.24)
0.025(0.35)
-0.631(-1.44)
-0.738(-1.51)
-0.093(-0.32)
Constant -1.669***(-51.69)
-1.828***(-4.36)
-0.161(-0.44)
-1.302**(-3.03)
-1.136***(-3.33)
-1.524***(-3.67)
-0.735(-1.72)
-2.081*(-2.48)
-1.144(-1.04)
-0.157(-0.35)
Village FEs x x x x x x x x x x
Observations 88114 19164 11076 8872 4641 9724 29881 1282 1716 1758
Adjusted R-squared 0.134 0.110 0.139 0.099 0.164 0.094 0.128 0.217 0.181 0.089
t statistics in parentheses* p<0.05, ** p<0.01, *** p<0.001
(1) (2) (3) (4) (5) (6) (7) (8) (9) (10)
AllStates Bihar Jharkhand Madhya
Pradesh Orissa Rajasthan Uttar Pradesh
HimachalPradesh Kerala Tamil
Nadu
Focus States Best States

256 257
AllStates Bihar Jharkhand Madhya
Pradesh Orissa Rajasthan Uttar Pradesh
HimachalPradesh Kerala Tamil
Nadu
Mid. Income 0.111**(3.16)
0.128(1.73)
0.203(1.74)
-0.023(-0.17)
0.617**(3.03)
0.265(1.37)
0.045(0.80)
-1.146(-0.79)
-0.932(-1.14)
0.154(0.29)
High Income 0.221***(3.43)
0.379*(2.15)
0.459(1.56)
-0.072(-0.30)
1.532***(4.09)
0.485(1.66)
0.147(1.60)
-1.543(-1.04)
-0.622(-0.68)
0.369(0.60)
Mid. Income x NREGA
0.000(0.90)
0.001(0.49)
0.001(0.66)
0.001(0.89)
-0.006*(-2.55)
-0.001(-0.50)
0.001(1.06)
0.009(0.61)
-0.009(-0.38)
-0.001(-0.16)
High Income x NREGA
-0.000(-0.37)
-0.003(-1.25)
-0.004(-1.16)
0.000(0.13)
-0.018***(-3.67)
-0.002(-0.55)
0.001(0.97)
0.009(0.58)
-0.007(-0.31)
-0.004(-0.50)
SC -0.054(-1.61)
-0.083(-1.25)
-0.123(-1.11)
-0.073(-0.65)
-0.018(-0.10)
0.096(0.84)
-0.064(-1.27)
-0.449(-1.59)
0.407(0.77)
0.414(1.82)
ST -0.001(-0.02)
0.111(0.65)
-0.036(-0.34)
-0.204(-1.75)
0.026(0.16)
-0.066(-0.59)
0.050(0.40)
0.390(0.85)
0.545(1.36)
-1.784*(-2.28)
Muslim 0.029(0.67)
-0.004(-0.05)
0.087(0.81)
0.212(0.86)
-0.011(-0.03)
0.155(0.83)
-0.036(-0.54)
1.508*(2.26)
1.609(1.38)
Age1 -0.250***(-7.18)
-0.331***(-4.78)
-0.352***(-3.46)
-0.309**(-2.90)
0.017(0.11)
-0.451***(-4.02)
-0.131*(-2.34)
-0.098(-0.08)
-0.765(-0.82)
-0.099(-0.23)
Age2 0.060(1.83)
-0.040(-0.63)
-0.020(-0.19)
-0.024(-0.23)
0.143(0.88)
-0.016(-0.15)
0.198***(3.84)
-1.090(-0.82)
-1.442(-1.46)
-0.463(-1.12)
Age3 0.148***(4.49)
0.113(1.74)
0.162(1.62)
0.006(0.06)
0.050(0.30)
0.006(0.06)
0.253***(4.75)
-0.813(-0.64)
-1.241(-1.20)
0.200(0.48)
Age4 0.075*(2.20)
0.076(1.14)
-0.011(-0.11)
-0.180(-1.66)
-0.004(-0.03)
-0.068(-0.66)
0.183**(3.25)
-0.411(-0.35)
-1.053(-1.17)
0.237(0.52)
Female -0.030(-1.04)
-0.086(-1.39)
0.067(0.79)
0.034(0.38)
0.113(0.85)
0.008(0.08)
-0.079(-1.64)
0.218(0.27)
0.578(0.83)
-0.071(-0.23)
Female x Age1 0.081*(2.51)
0.085(1.21)
0.033(0.36)
0.023(0.23)
-0.110(-0.73)
0.182(1.84)
0.112*(2.12)
0.413(1.52)
-0.642(-1.44)
0.103(0.44)
Female x Age2 0.062*(1.98)
0.138*(2.08)
-0.059(-0.67)
0.087(0.87)
-0.098(-0.70)
0.134(1.37)
0.052(1.01)
0.447(1.65)
-0.781(-1.89)
0.273(1.15)
Female x Age3 0.047(1.52)
0.093(1.43)
-0.083(-0.97)
0.107(1.08)
-0.155(-1.16)
0.141(1.41)
0.033(0.68)
0.383(1.40)
-0.498(-1.29)
0.400(1.64)
Female x Age4 -0.006(-0.20)
0.050(0.74)
-0.185*(-2.14)
-0.049(-0.47)
-0.112(-0.83)
0.061(0.64)
0.009(0.17)
0.343(1.20)
-0.249(-0.63)
-0.061(-0.22)
SC x Age1 -0.141***(-3.61)
-0.203**(-2.61)
-0.113(-0.88)
-0.160(-1.16)
-0.244(-1.22)
0.004(0.03)
-0.147*(-2.48)
0.206(0.68)
-1.183(-1.86)
-0.369(-1.38)
SC x Age2 -0.066(-1.75)
-0.082(-1.09)
-0.160(-1.24)
0.088(0.66)
-0.152(-0.77)
-0.146(-1.12)
-0.059(-1.06)
0.268(0.86)
-0.147(-0.26)
-0.370(-1.52)
SC x Age3 -0.024(-0.66)
-0.081(-1.12)
-0.106(-0.86)
0.121(0.92)
-0.055(-0.28)
-0.092(-0.77)
0.018(0.32)
0.423(1.41)
-0.211(-0.37)
-0.615*(-2.38)
SC x Age4 -0.019(-0.50)
-0.044(-0.56)
0.065(0.52)
0.141(1.08)
-0.089(-0.42)
-0.226(-1.84)
-0.014(-0.24)
0.548(1.77)
-0.188(-0.34)
-0.506(-1.69)
ST x Age1 -0.104(-1.93)
-0.248(-1.40)
-0.089(-0.77)
0.150(1.14)
-0.267(-1.37)
0.139(1.00)
-0.231(-1.59)
-1.080(-1.51)
-1.599(-1.86)
1.528(1.97)
ST x Age2 -0.136**(-2.67)
-0.250(-1.41)
-0.134(-1.18)
0.105(0.87)
-0.073(-0.40)
-0.145(-1.13)
-0.173(-1.27)
-0.779(-1.72)
0.861(0.96)
1.914*(2.31)
ST x Age3 -0.167***(-3.37)
-0.187(-1.01)
-0.259*(-2.26)
0.063(0.53)
-0.011(-0.06)
-0.034(-0.27)
0.022(0.16)
-0.770(-1.29)
-0.139(-0.20)
1.173*(2.15)
ST x Age4 -0.188***(-3.69)
-0.113(-0.61)
-0.106(-0.94)
0.148(1.08)
-0.025(-0.13)
-0.159(-1.27)
-0.093(-0.64)
-0.719(-1.42)
0.158(0.19)
Focus States Best States
Table A16: Weight-for-Length Z-scores between Households
Muslim x Age1 -0.026(-0.52)
-0.000(-0.00)
-0.033(-0.30)
-0.133(-0.44)
0.031(0.05)
0.159(0.82)
0.007(0.10)
-1.846**(-2.67)
-0.859(-0.65)
Muslim x Age2 -0.044(-0.92)
-0.032(-0.37)
0.009(0.08)
-0.217(-0.71)
-0.285(-0.37)
-0.049(-0.27)
-0.030(-0.41)
-1.459*(-2.05)
-2.294(-1.60)
Muslim x Age3 0.034(0.73)
0.056(0.61)
-0.003(-0.02)
-0.118(-0.46)
-0.219(-0.39)
-0.114(-0.59)
0.063(0.82)
-1.443*(-1.98)
-1.163(-0.83)
Muslim x Age4
-0.023(-0.46)
0.041(0.44)
0.077(0.66)
-0.092(-0.35)
-0.119(-0.24)
0.021(0.11)
-0.091(-1.19)
-2.446***(-3.64)
-1.921(-1.47)
SC x Female 0.037(1.73)
0.105*(2.43)
0.057(0.84)
-0.016(-0.19)
0.076(0.70)
0.020(0.26)
0.052(1.53)
0.002(0.01)
-0.509**(-2.77)
-0.155(-1.03)
ST x Female 0.059*(2.07)
-0.063(-0.54)
0.064(1.01)
0.066(0.88)
0.060(0.62)
-0.085(-1.00)
0.062(0.79)
0.188(0.48)
-0.100(-0.13)
0.005(0.01)
Muslim x Female
0.043(1.58)
0.049(0.94)
0.069(1.01)
0.028(0.18)
0.212(0.61)
-0.166(-1.61)
0.079(1.83)
0.034(0.12)
1.382(1.63)
Mid. Income x Age1
0.011(0.32)
0.015(0.21)
-0.113(-1.16)
0.075(0.70)
-0.102(-0.64)
0.003(0.03)
0.013(0.23)
-0.276(-0.23)
1.406(1.58)
-0.217(-0.57)
High Income x Age1
0.207**(3.14)
0.119(0.63)
0.378(1.26)
0.200(1.01)
0.437(1.29)
0.164(0.85)
0.093(0.98)
0.297(0.24)
1.377(1.36)
0.381(0.80)
Mid. Income x Age2
-0.046(-1.41)
0.026(0.37)
-0.129(-1.43)
-0.011(-0.10)
-0.086(-0.50)
-0.063(-0.59)
-0.070(-1.32)
1.038(0.79)
1.764(1.88)
0.217(0.54)
High Income x Age2
-0.078(-1.23)
0.176(0.97)
0.210(0.66)
0.167(0.80)
-0.789*(-2.07)
-0.217(-1.19)
-0.211*(-2.24)
1.150(0.86)
1.640(1.60)
0.203(0.43)
Mid. Income x Age3
-0.130***(-4.03)
-0.125(-1.80)
-0.297**(-3.27)
0.011(0.11)
-0.280(-1.71)
-0.163(-1.59)
-0.085(-1.60)
0.645(0.51)
1.578(1.59)
-0.463(-1.24)
High Income x Age3
-0.038(-0.61)
-0.109(-0.63)
-0.102(-0.34)
0.153(0.77)
-0.132(-0.35)
-0.172(-1.05)
-0.108(-1.15)
1.114(0.86)
1.758(1.65)
-0.039(-0.08)
Mid. Income x Age4
-0.065(-1.93)
-0.111(-1.51)
-0.255**(-2.85)
0.125(1.16)
-0.193(-1.21)
0.013(0.13)
-0.009(-0.17)
-0.023(-0.02)
1.328(1.56)
-0.172(-0.40)
High Income x Age4
-0.155*(-2.41)
-0.194(-1.17)
-0.146(-0.48)
0.144(0.66)
-0.409(-1.24)
-0.174(-0.96)
-0.190*(-1.97)
0.120(0.10)
1.438(1.54)
-0.514(-0.96)
Mid. Income x Female
-0.009(-0.49)
-0.067(-1.76)
0.060(1.18)
-0.076(-1.23)
-0.007(-0.09)
-0.090(-1.43)
0.035(1.09)
-0.657(-0.88)
0.093(0.16)
0.048(0.19)
High Income x Female
-0.045(-1.26)
-0.140(-1.57)
-0.028(-0.18)
0.053(0.47)
0.017(0.08)
-0.089(-0.83)
0.004(0.07)
-0.542(-0.71)
-0.331(-0.53)
0.010(0.03)
Constant -0.616***(-21.32)
-0.023(-0.10)
-1.208***(-6.14)
-1.149***(-3.40)
-1.392***(-4.51)
-0.330(-0.89)
-0.393(-1.37)
1.349(0.94)
-0.967(-1.10)
-0.495(-1.09)
Village FEs x x x x x x x x x x
Observations 85609 18840 10962 8007 4583 9117 29314 1284 1729 1773
Adjusted R-squared 0.112 0.124 0.098 0.095 0.086 0.086 0.087 0.243 0.180 0.108
t statistics in parentheses* p<0.05, ** p<0.01, *** p<0.001
(1) (2) (3) (4) (5) (6) (7) (8) (9) (10)
AllStates Bihar Jharkhand Madhya
Pradesh Orissa Rajasthan Uttar Pradesh
HimachalPradesh Kerala Tamil
Nadu
Focus States Best States

258 259
AllStates Bihar Jharkhand Madhya
Pradesh Orissa Rajasthan Uttar Pradesh
HimachalPradesh Kerala Tamil
Nadu
Mid. Income 0.148***(4.21)
0.216**(2.97)
0.219(1.89)
0.087(0.63)
0.621**(2.70)
0.397(1.96)
0.025(0.43)
-0.528(-0.33)
-0.827(-1.15)
0.188(0.35)
High Income 0.281***(4.31)
0.510**(2.78)
0.566*(2.05)
0.177(0.74)
1.719***(4.95)
0.564(1.90)
0.143(1.50)
-1.061(-0.66)
-0.319(-0.38)
0.356(0.57)
Mid. Income x NREGA
0.000(0.71)
0.001(0.38)
0.001(0.57)
0.000(0.17)
-0.005*(-2.05)
-0.002(-1.11)
0.001(1.47)
-0.002(-0.10)
-0.024(-1.29)
-0.002(-0.24)
High Income x NREGA
0.000(0.06)
-0.003(-1.10)
-0.004(-1.08)
-0.001(-0.25)
-0.019***(-3.64)
-0.003(-0.88)
0.002(1.09)
-0.001(-0.07)
-0.027(-1.40)
-0.002(-0.27)
SC -0.094**(-2.86)
-0.139*(-2.16)
-0.144(-1.41)
-0.140(-1.27)
-0.043(-0.23)
0.071(0.62)
-0.102*(-2.01)
-0.593*(-1.98)
0.429(0.72)
0.427*(1.99)
ST -0.012(-0.26)
-0.142(-0.97)
-0.058(-0.59)
-0.248*(-2.20)
-0.109(-0.60)
-0.093(-0.80)
0.010(0.08)
0.369(0.75)
0.563(1.20)
-1.364(-1.51)
Muslim 0.025(0.57)
0.036(0.41)
0.118(1.12)
0.133(0.57)
-0.079(-0.21)
-0.116(-0.65)
0.018(0.26)
1.238(1.73)
1.138(0.89)
Age1 0.357***(10.20)
0.295***(4.32)
0.269**(2.65)
0.266*(2.55)
0.337*(1.97)
0.134(1.14)
0.507***(8.80)
0.488(0.38)
-1.028(-1.10)
0.360(0.73)
Age2 0.721***(21.60)
0.676***(10.86)
0.658***(6.47)
0.581***(5.31)
0.445**(2.77)
0.590***(5.42)
0.892***(16.46)
-0.670(-0.48)
-1.501(-1.73)
-0.162(-0.40)
Age3 0.736***(22.38)
0.752***(12.03)
0.754***(7.89)
0.540***(5.51)
0.298(1.71)
0.583***(5.10)
0.876***(16.03)
-0.232(-0.17)
-1.892(-1.81)
0.159(0.37)
Age4 0.570***(17.00)
0.608***(9.52)
0.490***(5.14)
0.255*(2.35)
0.199(1.19)
0.383***(3.63)
0.720***(12.72)
-0.855(-0.75)
-1.269(-1.39)
0.439(1.02)
Female -0.034(-1.18)
-0.062(-1.05)
0.010(0.12)
0.097(1.05)
0.029(0.22)
-0.005(-0.06)
-0.080(-1.64)
-0.500(-0.73)
0.696(1.08)
0.033(0.10)
Female x Age1 0.037(1.12)
0.026(0.37)
0.017(0.19)
-0.067(-0.69)
-0.090(-0.60)
0.106(1.07)
0.072(1.34)
0.351(1.23)
-0.442(-0.91)
0.032(0.14)
Female x Age2 -0.017(-0.53)
0.034(0.51)
-0.079(-0.87)
-0.045(-0.44)
-0.063(-0.45)
0.043(0.43)
-0.047(-0.90)
0.276(0.96)
-0.604(-1.37)
0.264(1.11)
Female x Age3 -0.050(-1.63)
-0.035(-0.54)
-0.118(-1.40)
-0.090(-0.91)
-0.173(-1.32)
-0.002(-0.02)
-0.059(-1.17)
0.277(0.99)
-0.296(-0.73)
0.383(1.60)
Female x Age4 -0.109***(-3.47)
-0.064(-1.00)
-0.235**(-2.78)
-0.210*(-2.02)
-0.123(-0.92)
-0.041(-0.42)
-0.110*(-2.11)
0.141(0.49)
-0.137(-0.32)
-0.134(-0.50)
SC x Age1 -0.064(-1.63)
-0.095(-1.22)
-0.056(-0.45)
-0.072(-0.51)
-0.253(-1.26)
0.072(0.51)
-0.072(-1.19)
0.399(1.27)
-1.204(-1.73)
-0.328(-1.22)
SC x Age2 0.015(0.41)
0.012(0.16)
-0.129(-1.05)
0.170(1.29)
-0.062(-0.32)
-0.143(-1.07)
0.041(0.71)
0.490(1.48)
-0.099(-0.16)
-0.404(-1.60)
SC x Age3 0.049(1.34)
0.023(0.31)
-0.044(-0.36)
0.225(1.69)
-0.033(-0.17)
-0.063(-0.50)
0.082(1.46)
0.550(1.73)
-0.166(-0.27)
-0.479(-1.93)
SC x Age4 0.061(1.61)
0.085(1.12)
0.111(0.96)
0.236(1.84)
-0.099(-0.47)
-0.150(-1.19)
0.050(0.84)
0.701*(2.28)
-0.113(-0.18)
-0.462(-1.60)
ST x Age1 -0.061(-1.14)
0.046(0.29)
-0.064(-0.56)
0.231(1.77)
-0.064(-0.33)
0.166(1.18)
-0.127(-0.82)
-1.192(-1.47)
-1.250(-1.57)
1.046(1.15)
ST x Age2 -0.065(-1.30)
0.118(0.71)
-0.090(-0.83)
0.217(1.77)
0.155(0.85)
-0.030(-0.24)
-0.002(-0.01)
-0.623(-1.27)
0.539(0.63)
1.644(1.74)
ST x Age3 -0.116*(-2.35)
0.129(0.75)
-0.208(-1.88)
0.193(1.62)
0.216(1.14)
-0.010(-0.08)
0.126(0.87)
-0.933(-1.53)
0.098(0.14)
0.978(1.65)
ST x Age4 -0.137**(-2.72)
0.191(1.07)
-0.052(-0.47)
0.268*(2.01)
0.146(0.79)
-0.094(-0.74)
-0.020(-0.13)
-0.815(-1.58)
-0.050(-0.05)
Focus States Best States
Table A17: BMI Z-scores between Households
Muslim x Age1 0.013(0.25)
-0.003(-0.04)
-0.014(-0.12)
-0.025(-0.09)
-0.199(-0.29)
0.450*(2.28)
-0.024(-0.29)
-1.498*(-1.99)
-0.821(-0.57)
Muslim x Age2 -0.008(-0.17)
-0.111(-1.21)
-0.009(-0.08)
-0.143(-0.49)
-0.018(-0.02)
0.214(1.15)
-0.004(-0.05)
-1.173(-1.55)
-2.069(-1.33)
Muslim x Age3 0.051(1.05)
-0.001(-0.01)
-0.028(-0.25)
0.039(0.16)
-0.117(-0.19)
0.090(0.45)
0.029(0.37)
-1.116(-1.42)
-0.909(-0.60)
Muslim x Age4
0.002(0.03)
-0.005(-0.05)
0.053(0.46)
-0.005(-0.02)
0.056(0.12)
0.248(1.35)
-0.096(-1.22)
-2.209**(-3.08)
-1.541(-1.08)
SC x Female 0.016(0.74)
0.072(1.64)
0.026(0.38)
-0.000(-0.00)
0.074(0.67)
0.011(0.13)
0.036(1.04)
0.099(0.59)
-0.626**(-2.99)
-0.262(-1.65)
ST x Female 0.032(1.10)
-0.094(-0.79)
0.026(0.40)
0.043(0.59)
0.024(0.23)
-0.052(-0.61)
0.003(0.04)
0.248(0.59)
-0.098(-0.15)
-0.228(-0.37)
Muslim x Female
0.022(0.79)
0.057(1.06)
0.030(0.44)
-0.024(-0.15)
0.166(0.42)
-0.118(-1.16)
0.038(0.89)
-0.008(-0.02)
1.431(1.57)
Mid. Income x Age1
-0.057(-1.66)
-0.064(-0.90)
-0.171(-1.72)
0.010(0.09)
-0.199(-1.15)
-0.059(-0.55)
-0.015(-0.26)
-0.608(-0.46)
1.707(1.92)
-0.283(-0.66)
High Income x Age1
0.011(0.16)
-0.073(-0.39)
0.167(0.56)
-0.046(-0.23)
-0.140(-0.38)
0.092(0.46)
-0.064(-0.66)
-0.003(-0.00)
1.746(1.67)
0.117(0.23)
Mid. Income x Age2
-0.151***(-4.57)
-0.121(-1.75)
-0.266**(-2.96)
-0.074(-0.72)
-0.215(-1.24)
-0.166(-1.50)
-0.115*(-2.14)
0.898(0.65)
1.939*(2.36)
0.303(0.76)
High Income x Age2
-0.320***(-4.91)
-0.185(-0.92)
-0.191(-0.61)
-0.158(-0.74)
-1.186***(-3.49)
-0.287(-1.56)
-0.375***(-3.91)
1.057(0.76)
1.753(1.90)
0.116(0.25)
Mid. Income x Age3
-0.205***(-6.34)
-0.245***(-3.65)
-0.381***(-4.26)
-0.034(-0.35)
-0.358*(-2.09)
-0.228*(-2.21)
-0.115*(-2.16)
0.297(0.22)
2.336*(2.32)
-0.182(-0.46)
High Income x Age3
-0.221***(-3.49)
-0.381*(-2.13)
-0.376(-1.25)
-0.097(-0.49)
-0.483(-1.28)
-0.234(-1.36)
-0.225*(-2.36)
0.855(0.62)
2.431*(2.18)
0.128(0.26)
Mid. Income x Age4
-0.138***(-4.13)
-0.241***(-3.46)
-0.313***(-3.57)
0.108(1.03)
-0.291(-1.80)
-0.075(-0.76)
-0.049(-0.88)
0.626(0.55)
1.646(1.93)
-0.063(-0.15)
High Income x Age4
-0.319***(-4.96)
-0.455**(-2.69)
-0.380(-1.29)
-0.112(-0.54)
-0.680*(-1.99)
-0.301(-1.66)
-0.296**(-3.08)
0.852(0.74)
1.729(1.78)
-0.469(-0.90)
Mid. Income x Female
0.002(0.09)
-0.061(-1.55)
0.102*(1.99)
-0.079(-1.23)
-0.017(-0.20)
-0.060(-0.91)
0.035(1.09)
0.083(0.13)
-0.188(-0.37)
-0.030(-0.10)
High Income x Female
-0.011(-0.29)
-0.074(-0.82)
0.002(0.01)
0.085(0.80)
0.131(0.58)
-0.038(-0.33)
0.026(0.48)
0.249(0.38)
-0.723(-1.31)
-0.073(-0.21)
Constant -0.859***(-30.25)
-0.040(-0.14)
-1.713***(-8.37)
-1.189***(-3.61)
-1.422***(-4.83)
-0.596(-1.58)
-0.783**(-2.61)
0.876(0.56)
-0.938(-1.13)
-0.922*(-2.27)
Village FEs x x x x x x x x x x
Observations 85614 18842 10952 7999 4586 9145 29338 1279 1714 1759
Adjusted R-squared 0.131 0.141 0.106 0.105 0.080 0.099 0.127 0.250 0.184 0.095
t statistics in parentheses* p<0.05, ** p<0.01, *** p<0.001
(1) (2) (3) (4) (5) (6) (7) (8) (9) (10)
AllStates Bihar Jharkhand Madhya
Pradesh Orissa Rajasthan Uttar Pradesh
HimachalPradesh Kerala Tamil
Nadu
Focus States Best States
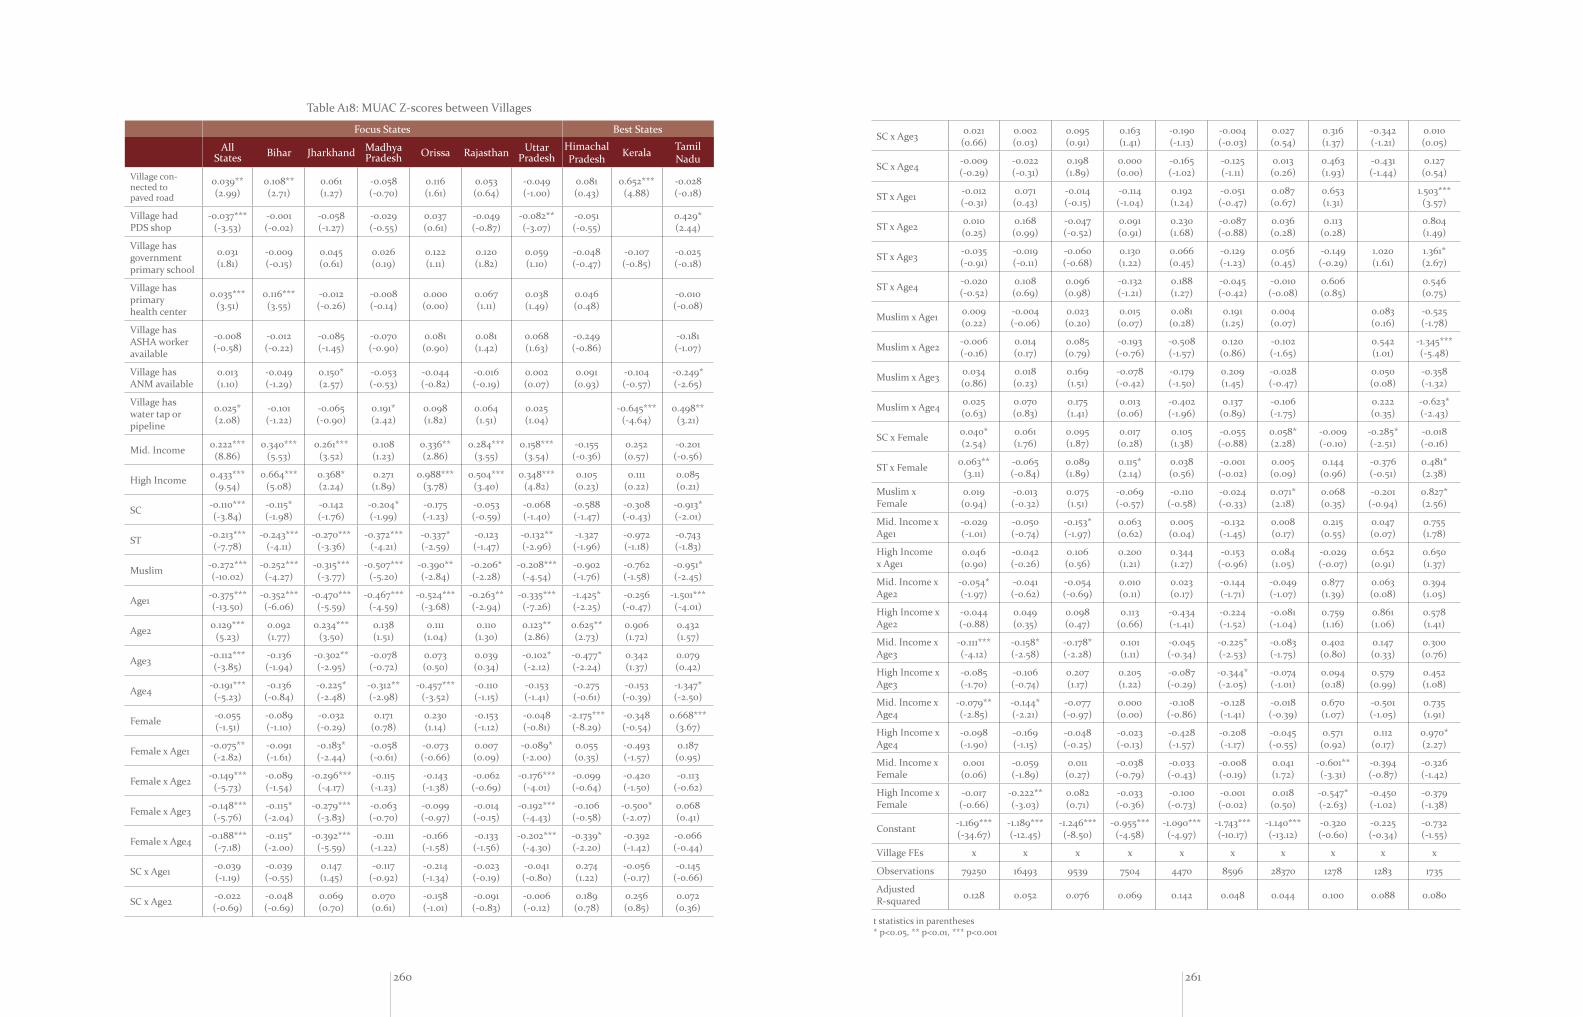
260 261
KeralaAll
States Bihar Jharkhand Madhya Pradesh Orissa Rajasthan Uttar
PradeshHimachalPradesh Kerala Tamil
Nadu
Village con-nected to paved road
0.039**(2.99)
0.108**(2.71)
0.061(1.27)
-0.058(-0.70)
0.116(1.61)
0.053(0.64)
-0.049(-1.00)
0.081(0.43)
0.652***(4.88)
-0.028(-0.18)
Village had PDS shop
-0.037***(-3.53)
-0.001(-0.02)
-0.058(-1.27)
-0.029(-0.55)
0.037(0.61)
-0.049(-0.87)
-0.082**(-3.07)
-0.051(-0.55)
0.429*(2.44)
Village has government primary school
0.031(1.81)
-0.009(-0.15)
0.045(0.61)
0.026(0.19)
0.122(1.11)
0.120(1.82)
0.059(1.10)
-0.048(-0.47)
-0.107(-0.85)
-0.025(-0.18)
Village has primary health center
0.035***(3.51)
0.116***(3.55)
-0.012(-0.26)
-0.008(-0.14)
0.000(0.00)
0.067(1.11)
0.038(1.49)
0.046(0.48)
-0.010(-0.08)
Village has ASHA worker available
-0.008(-0.58)
-0.012(-0.22)
-0.085(-1.45)
-0.070(-0.90)
0.081(0.90)
0.081(1.42)
0.068(1.63)
-0.249(-0.86)
-0.181(-1.07)
Village has ANM available
0.013(1.10)
-0.049(-1.29)
0.150*(2.57)
-0.053(-0.53)
-0.044(-0.82)
-0.016(-0.19)
0.002(0.07)
0.091(0.93)
-0.104(-0.57)
-0.249*(-2.65)
Village has water tap or pipeline
0.025*(2.08)
-0.101(-1.22)
-0.065(-0.90)
0.191*(2.42)
0.098(1.82)
0.064(1.51)
0.025(1.04)
-0.645***(-4.64)
0.498**(3.21)
Mid. Income 0.222***(8.86)
0.340***(5.53)
0.261***(3.52)
0.108(1.23)
0.336**(2.86)
0.284***(3.55)
0.158***(3.54)
-0.155(-0.36)
0.252(0.57)
-0.201(-0.56)
High Income 0.433***(9.54)
0.664***(5.08)
0.368*(2.24)
0.271(1.89)
0.988***(3.78)
0.504***(3.40)
0.348***(4.82)
0.105(0.23)
0.111(0.22)
0.085(0.21)
SC -0.110***(-3.84)
-0.115*(-1.98)
-0.142(-1.76)
-0.204*(-1.99)
-0.175(-1.23)
-0.053(-0.59)
-0.068(-1.40)
-0.588(-1.47)
-0.308(-0.43)
-0.913*(-2.01)
ST -0.213***(-7.78)
-0.243***(-4.11)
-0.270***(-3.36)
-0.372***(-4.21)
-0.337*(-2.59)
-0.123(-1.47)
-0.132**(-2.96)
-1.327(-1.96)
-0.972(-1.18)
-0.743(-1.83)
Muslim -0.272***(-10.02)
-0.252***(-4.27)
-0.315***(-3.77)
-0.507***(-5.20)
-0.390**(-2.84)
-0.206*(-2.28)
-0.208***(-4.54)
-0.902(-1.76)
-0.762(-1.58)
-0.951*(-2.45)
Age1 -0.375***(-13.50)
-0.352***(-6.06)
-0.470***(-5.59)
-0.467***(-4.59)
-0.524***(-3.68)
-0.263**(-2.94)
-0.335***(-7.26)
-1.425*(-2.25)
-0.256(-0.47)
-1.501***(-4.01)
Age2 0.129***(5.23)
0.092(1.77)
0.234***(3.50)
0.138(1.51)
0.111(1.04)
0.110(1.30)
0.123**(2.86)
0.625**(2.73)
0.906(1.72)
0.432(1.57)
Age3 -0.112***(-3.85)
-0.136(-1.94)
-0.302**(-2.95)
-0.078(-0.72)
0.073(0.50)
0.039(0.34)
-0.102*(-2.12)
-0.477*(-2.24)
0.342(1.37)
0.079(0.42)
Age4 -0.191***(-5.23)
-0.136(-0.84)
-0.225*(-2.48)
-0.312**(-2.98)
-0.457***(-3.52)
-0.110(-1.15)
-0.153(-1.41)
-0.275(-0.61)
-0.153(-0.39)
-1.347*(-2.50)
Female -0.055(-1.51)
-0.089(-1.10)
-0.032(-0.29)
0.171(0.78)
0.230(1.14)
-0.153(-1.12)
-0.048(-0.81)
-2.175***(-8.29)
-0.348(-0.54)
0.668***(3.67)
Female x Age1 -0.075**(-2.82)
-0.091(-1.61)
-0.183*(-2.44)
-0.058(-0.61)
-0.073(-0.66)
0.007(0.09)
-0.089*(-2.00)
0.055(0.35)
-0.493(-1.57)
0.187(0.95)
Female x Age2 -0.149***(-5.73)
-0.089(-1.54)
-0.296***(-4.17)
-0.115(-1.23)
-0.143(-1.38)
-0.062(-0.69)
-0.176***(-4.01)
-0.099(-0.64)
-0.420(-1.50)
-0.113(-0.62)
Female x Age3 -0.148***(-5.76)
-0.115*(-2.04)
-0.279***(-3.83)
-0.063(-0.70)
-0.099(-0.97)
-0.014(-0.15)
-0.192***(-4.43)
-0.106(-0.58)
-0.500*(-2.07)
0.068(0.41)
Female x Age4 -0.188***(-7.18)
-0.115*(-2.00)
-0.392***(-5.59)
-0.111(-1.22)
-0.166(-1.58)
-0.133(-1.56)
-0.202***(-4.30)
-0.339*(-2.20)
-0.392(-1.42)
-0.066(-0.44)
SC x Age1 -0.039(-1.19)
-0.039(-0.55)
0.147(1.45)
-0.117(-0.92)
-0.214(-1.34)
-0.023(-0.19)
-0.041(-0.80)
0.274(1.22)
-0.056(-0.17)
-0.145(-0.66)
SC x Age2 -0.022(-0.69)
-0.048(-0.69)
0.069(0.70)
0.070(0.61)
-0.158(-1.01)
-0.091(-0.83)
-0.006(-0.12)
0.189(0.78)
0.256(0.85)
0.072(0.36)
Focus States Best States
Table A18: MUAC Z-scores between Villages
SC x Age3 0.021(0.66)
0.002(0.03)
0.095(0.91)
0.163(1.41)
-0.190(-1.13)
-0.004(-0.03)
0.027(0.54)
0.316(1.37)
-0.342(-1.21)
0.010(0.05)
SC x Age4 -0.009(-0.29)
-0.022(-0.31)
0.198(1.89)
0.000(0.00)
-0.165(-1.02)
-0.125(-1.11)
0.013(0.26)
0.463(1.93)
-0.431(-1.44)
0.127(0.54)
ST x Age1 -0.012(-0.31)
0.071(0.43)
-0.014(-0.15)
-0.114(-1.04)
0.192(1.24)
-0.051(-0.47)
0.087(0.67)
0.653(1.31)
1.503***(3.57)
ST x Age2 0.010(0.25)
0.168(0.99)
-0.047(-0.52)
0.091(0.91)
0.230(1.68)
-0.087(-0.88)
0.036(0.28)
0.113(0.28)
0.804(1.49)
ST x Age3 -0.035(-0.91)
-0.019(-0.11)
-0.060(-0.68)
0.130(1.22)
0.066(0.45)
-0.129(-1.23)
0.056(0.45)
-0.149(-0.29)
1.020(1.61)
1.361*(2.67)
ST x Age4 -0.020(-0.52)
0.108(0.69)
0.096(0.98)
-0.132(-1.21)
0.188(1.27)
-0.045(-0.42)
-0.010(-0.08)
0.606(0.85)
0.546(0.75)
Muslim x Age1 0.009(0.22)
-0.004(-0.06)
0.023(0.20)
0.015(0.07)
0.081(0.28)
0.191(1.25)
0.004(0.07)
0.083(0.16)
-0.525(-1.78)
Muslim x Age2 -0.006(-0.16)
0.014(0.17)
0.085(0.79)
-0.193(-0.76)
-0.508(-1.57)
0.120(0.86)
-0.102(-1.65)
0.542(1.01)
-1.345***(-5.48)
Muslim x Age3 0.034(0.86)
0.018(0.23)
0.169(1.51)
-0.078(-0.42)
-0.179(-1.50)
0.209(1.45)
-0.028(-0.47)
0.050(0.08)
-0.358(-1.32)
Muslim x Age4 0.025(0.63)
0.070(0.83)
0.175(1.41)
0.013(0.06)
-0.402(-1.96)
0.137(0.89)
-0.106(-1.75)
0.222(0.35)
-0.623*(-2.43)
SC x Female 0.040*(2.54)
0.061(1.76)
0.095(1.87)
0.017(0.28)
0.105(1.38)
-0.055(-0.88)
0.058*(2.28)
-0.009(-0.10)
-0.285*(-2.51)
-0.018(-0.16)
ST x Female 0.063**(3.11)
-0.065(-0.84)
0.089(1.89)
0.115*(2.14)
0.038(0.56)
-0.001(-0.02)
0.005(0.09)
0.144(0.96)
-0.376(-0.51)
0.481*(2.38)
Muslim x Female
0.019(0.94)
-0.013(-0.32)
0.075(1.51)
-0.069(-0.57)
-0.110(-0.58)
-0.024(-0.33)
0.071*(2.18)
0.068(0.35)
-0.201(-0.94)
0.827*(2.56)
Mid. Income x Age1
-0.029(-1.01)
-0.050(-0.74)
-0.153*(-1.97)
0.063(0.62)
0.005(0.04)
-0.132(-1.45)
0.008(0.17)
0.215(0.55)
0.047(0.07)
0.755(1.78)
High Income x Age1
0.046(0.90)
-0.042(-0.26)
0.106(0.56)
0.200(1.21)
0.344(1.27)
-0.153(-0.96)
0.084(1.05)
-0.029(-0.07)
0.652(0.91)
0.650(1.37)
Mid. Income x Age2
-0.054*(-1.97)
-0.041(-0.62)
-0.054(-0.69)
0.010(0.11)
0.023(0.17)
-0.144(-1.71)
-0.049(-1.07)
0.877(1.39)
0.063(0.08)
0.394(1.05)
High Income x Age2
-0.044(-0.88)
0.049(0.35)
0.098(0.47)
0.113(0.66)
-0.434(-1.41)
-0.224(-1.52)
-0.081(-1.04)
0.759(1.16)
0.861(1.06)
0.578(1.41)
Mid. Income x Age3
-0.111***(-4.12)
-0.158*(-2.58)
-0.178*(-2.28)
0.101(1.11)
-0.045(-0.34)
-0.225*(-2.53)
-0.083(-1.75)
0.402(0.80)
0.147(0.33)
0.300(0.76)
High Income x Age3
-0.085(-1.70)
-0.106(-0.74)
0.207(1.17)
0.205(1.22)
-0.087(-0.29)
-0.344*(-2.05)
-0.074(-1.01)
0.094(0.18)
0.579(0.99)
0.452(1.08)
Mid. Income x Age4
-0.079**(-2.85)
-0.144*(-2.21)
-0.077(-0.97)
0.000(0.00)
-0.108(-0.86)
-0.128(-1.41)
-0.018(-0.39)
0.670(1.07)
-0.501(-1.05)
0.735(1.91)
High Income x Age4
-0.098(-1.90)
-0.169(-1.15)
-0.048(-0.25)
-0.023(-0.13)
-0.428(-1.57)
-0.208(-1.17)
-0.045(-0.55)
0.571(0.92)
0.112(0.17)
0.970*(2.27)
Mid. Income x Female
0.001(0.06)
-0.059(-1.89)
0.011(0.27)
-0.038(-0.79)
-0.033(-0.43)
-0.008(-0.19)
0.041(1.72)
-0.601**(-3.31)
-0.394(-0.87)
-0.326(-1.42)
High Income x Female
-0.017(-0.66)
-0.222**(-3.03)
0.082(0.71)
-0.033(-0.36)
-0.100(-0.73)
-0.001(-0.02)
0.018(0.50)
-0.547*(-2.63)
-0.450(-1.02)
-0.379(-1.38)
Constant -1.169***(-34.67)
-1.189***(-12.45)
-1.246***(-8.50)
-0.955***(-4.58)
-1.090***(-4.97)
-1.743***(-10.17)
-1.140***(-13.12)
-0.320(-0.60)
-0.225(-0.34)
-0.732(-1.55)
Village FEs x x x x x x x x x x
Observations 79250 16493 9539 7504 4470 8596 28370 1278 1283 1735
Adjusted R-squared 0.128 0.052 0.076 0.069 0.142 0.048 0.044 0.100 0.088 0.080
t statistics in parentheses* p<0.05, ** p<0.01, *** p<0.001

262 263
AllStates Bihar Jharkhand Madhya
Pradesh Orissa Rajasthan Uttar Pradesh
HimachalPradesh Kerala Tamil
Nadu
Village connected to paved road
0.007(0.38)
0.082*(2.08)
0.098*(2.00)
-0.088(-1.34)
0.002(0.02)
-0.178(-1.73)
-0.034(-0.51)
0.033(0.23)
0.336**(3.20)
0.009(0.10)
Village had PDS shop
-0.005(-0.37)
0.071(1.86)
0.057(1.26)
0.045(0.90)
0.090(1.03)
-0.126*(-2.09)
-0.066*(-2.18)
-0.052(-0.48)
0.668***(4.09)
Village has gov-ernment primary school
-0.016(-0.70)
-0.007(-0.11)
0.022(0.47)
0.160(1.65)
0.126(1.12)
-0.133(-1.81)
0.017(0.25)
0.121(1.21)
-1.095***(-11.77)
-0.084(-0.85)
Village has primary health center
-0.020(-1.48)
0.051(1.50)
0.044(0.94)
-0.014(-0.25)
0.018(0.25)
0.092(1.54)
-0.004(-0.15)
-0.119(-1.23)
0.090(1.17)
Village has ASHA worker available
-0.003(-0.17)
0.046(0.85)
-0.122(-1.92)
0.019(0.25)
0.118(0.88)
-0.064(-1.09)
0.044(1.02)
-0.060(-0.21)
-0.046(-0.59)
Village has ANM available
0.013(0.84)
-0.018(-0.49)
-0.000(-0.00)
-0.039(-0.68)
-0.274**(-3.20)
-0.015(-0.20)
0.001(0.04)
0.101(1.08)
-0.129(-0.84)
-0.078(-0.82)
Village has water tap or pipeline
0.008(0.50)
-0.031(-0.41)
0.062(0.75)
0.048(0.83)
0.143*(1.99)
0.118*(2.52)
0.005(0.18)
0.279*(2.07)
0.295**(2.70)
Mid. Income 0.262***(9.79)
0.230***(4.17)
0.359***(5.06)
0.220*(2.50)
0.374*(2.34)
0.554***(6.01)
0.218***(4.81)
-0.896(-1.57)
2.263***(4.98)
0.227(0.56)
High Income 0.511***(10.16)
0.667***(4.39)
0.677**(3.21)
0.719***(4.56)
0.982**(2.92)
0.709***(3.86)
0.530***(6.93)
-0.996(-1.69)
2.507***(4.47)
0.411(0.97)
SC -0.136***(-4.10)
-0.162*(-2.51)
-0.197*(-1.99)
-0.061(-0.56)
-0.039(-0.21)
-0.030(-0.27)
-0.121*(-2.02)
-0.574(-0.78)
1.517(1.33)
-0.061(-0.14)
ST -0.095**(-3.05)
-0.171**(-2.69)
-0.056(-0.57)
0.092(0.87)
-0.080(-0.53)
0.049(0.47)
-0.101(-1.84)
-1.848(-1.83)
1.138(1.23)
-0.312(-0.83)
Muslim -0.103***(-3.40)
-0.187**(-3.11)
-0.038(-0.41)
0.115(1.06)
-0.124(-0.75)
-0.073(-0.69)
-0.104(-1.92)
-1.024(-1.56)
0.579(0.98)
-0.141(-0.30)
Age1 -0.123***(-3.99)
-0.180**(-3.02)
-0.151(-1.57)
0.152(1.51)
-0.177(-0.97)
0.069(0.67)
-0.226***(-4.09)
-2.250**(-3.37)
1.531**(3.20)
-0.105(-0.23)
Age2 0.103***(3.78)
0.091(1.78)
0.094(1.27)
0.244**(2.72)
0.000(0.00)
0.250**(2.80)
0.043(0.89)
0.516(1.21)
0.879(1.46)
0.269(0.88)
Age3 -0.171***(-5.65)
-0.273***(-4.27)
-0.240*(-2.35)
0.044(0.39)
0.072(0.36)
0.034(0.32)
-0.220***(-4.57)
-0.393*(-2.19)
0.058(0.20)
0.253(1.56)
Age4 -0.258***(-6.16)
-0.472**(-3.09)
-0.265**(-2.72)
-0.347**(-3.30)
-0.411**(-2.63)
-0.042(-0.40)
-0.173(-1.36)
0.051(0.14)
0.289(1.06)
-0.432(-0.75)
Female 0.037(0.91)
0.066(0.92)
0.063(0.64)
0.374(1.46)
-0.434(-1.85)
0.005(0.03)
0.055(0.83)
-1.475***(-3.48)
0.113(0.36)
0.089(0.11)
Female x Age1 -0.004(-0.13)
-0.066(-1.02)
0.058(0.70)
-0.176(-1.66)
-0.001(-0.01)
-0.024(-0.25)
0.054(1.05)
0.032(0.17)
-0.008(-0.02)
0.397(1.93)
Female x Age2 -0.146***(-4.90)
-0.165**(-2.66)
-0.139(-1.74)
-0.255**(-2.64)
-0.152(-1.14)
-0.159(-1.62)
-0.099(-1.96)
-0.133(-0.70)
-0.305(-0.98)
-0.010(-0.04)
Female x Age3 -0.195***(-6.80)
-0.175**(-3.03)
-0.266***(-3.40)
-0.245*(-2.44)
-0.184(-1.53)
-0.116(-1.26)
-0.202***(-4.21)
-0.245(-1.09)
-0.159(-0.58)
0.072(0.38)
Female x Age4 -0.251***(-8.60)
-0.224***(-3.68)
-0.271***(-3.59)
-0.445***(-4.35)
-0.214(-1.86)
-0.227*(-2.55)
-0.201***(-4.03)
-0.210(-1.02)
0.033(0.10)
-0.279(-1.36)
SC x Age1 -0.086*(-2.30)
-0.131(-1.60)
0.013(0.11)
-0.356*(-2.41)
-0.341(-1.49)
-0.055(-0.43)
-0.031(-0.51)
-0.107(-0.42)
-0.182(-0.42)
-0.492*(-2.65)
SC x Age2 -0.064(-1.82)
0.010(0.13)
-0.072(-0.61)
-0.235(-1.78)
-0.347(-1.68)
-0.212(-1.77)
-0.010(-0.17)
-0.001(-0.00)
-0.188(-0.46)
-0.273(-1.44)
Focus States Best States
Table A19: Weight-for-Age Z-scores between Villages
SC x Age3 0.020(0.60)
0.054(0.74)
-0.036(-0.31)
-0.080(-0.63)
-0.183(-0.83)
-0.060(-0.48)
0.102(1.89)
0.188(0.94)
-0.266(-0.80)
-0.354(-1.82)
SC x Age4 -0.031(-0.90)
-0.054(-0.76)
0.069(0.56)
-0.087(-0.70)
-0.186(-0.94)
-0.210(-1.72)
0.072(1.26)
0.326(1.44)
-0.257(-0.74)
-0.431(-1.80)
ST x Age1 -0.058(-1.14)
0.301(1.48)
-0.103(-0.92)
-0.047(-0.40)
-0.215(-1.02)
-0.144(-1.08)
0.068(0.44)
-0.603(-0.92)
0.524(0.64)
ST x Age2 -0.021(-0.45)
0.328(1.64)
-0.070(-0.63)
0.051(0.40)
-0.160(-0.95)
-0.188(-1.57)
-0.075(-0.48)
-0.440(-1.50)
0.302(0.78)
ST x Age3 -0.010(-0.21)
0.248(1.47)
-0.040(-0.35)
-0.050(-0.39)
-0.137(-0.76)
-0.112(-0.94)
0.171(1.24)
0.001(0.00)
1.747**(2.85)
0.025(0.04)
ST x Age4 0.047(1.02)
0.417*(2.17)
0.085(0.78)
-0.058(-0.51)
-0.036(-0.20)
-0.126(-0.97)
0.092(0.66)
0.181(0.31)
-0.687(-1.30)
Muslim x Age1 -0.102*(-2.10)
-0.129(-1.43)
-0.114(-0.99)
-0.188(-0.56)
0.181(0.32)
-0.152(-0.63)
-0.031(-0.40)
-0.512(-1.62)
0.804(1.02)
Muslim x Age2 -0.210***(-4.52)
-0.212*(-2.47)
-0.122(-0.99)
-0.331(-1.05)
0.410(1.38)
-0.273(-1.17)
-0.237**(-3.10)
-0.055(-0.15)
-0.494(-0.53)
Muslim x Age3 -0.087(-1.94)
-0.131(-1.50)
0.064(0.59)
-0.520(-1.67)
0.434(1.30)
0.069(0.33)
-0.154*(-2.10)
0.168(0.48)
0.721(0.83)
Muslim x Age4 -0.154***(-3.40)
-0.145(-1.75)
0.024(0.21)
-0.462(-1.30)
0.249(0.57)
-0.172(-0.85)
-0.231**(-3.04)
-0.073(-0.18)
-0.190(-0.22)
SC x Female 0.047*(2.22)
0.113*(2.48)
0.120(1.60)
0.052(0.61)
0.089(0.93)
0.018(0.23)
0.013(0.38)
0.210(1.65)
-0.179(-1.17)
0.067(0.57)
ST x Female 0.128***(4.48)
-0.030(-0.21)
0.233***(3.50)
0.168*(2.13)
0.217*(2.56)
-0.083(-1.09)
0.009(0.12)
0.084(0.34)
-1.101*(-2.03)
0.387(1.68)
Muslim x Female 0.024(0.85)
-0.046(-0.85)
0.088(1.35)
0.096(0.48)
0.072(0.41)
-0.024(-0.23)
0.047(1.02)
0.635*(2.38)
-0.177(-0.91)
0.748*(2.20)
Mid. Income x Age1
-0.020(-0.60)
-0.039(-0.55)
-0.142(-1.60)
0.052(0.49)
0.093(0.47)
-0.311**(-2.74)
0.012(0.22)
0.640(0.88)
-1.645(-1.52)
-0.070(-0.16)
High Income x Age1
0.189**(3.14)
0.017(0.10)
-0.018(-0.07)
-0.121(-0.58)
1.009*(2.41)
-0.086(-0.42)
0.237*(2.54)
1.013(1.39)
-1.794(-1.52)
0.098(0.23)
Mid. Income x Age2
-0.056(-1.81)
0.032(0.47)
-0.148(-1.65)
-0.187(-1.69)
-0.026(-0.15)
-0.335**(-3.08)
-0.002(-0.04)
1.742(1.69)
-1.630(-1.80)
0.066(0.18)
High Income x Age2
-0.007(-0.12)
0.168(1.03)
0.103(0.42)
-0.397*(-2.00)
-0.104(-0.32)
-0.440*(-2.35)
0.048(0.53)
1.984(1.98)
-1.383(-1.43)
0.388(0.96)
Mid. Income x Age3
-0.123***(-4.12)
-0.037(-0.59)
-0.243**(-2.82)
-0.170(-1.58)
-0.093(-0.51)
-0.450***(-4.31)
-0.013(-0.26)
0.867(1.38)
-1.348*(-2.34)
-0.393(-0.83)
High Income x Age3
-0.043(-0.78)
-0.033(-0.20)
-0.068(-0.29)
-0.319(-1.55)
0.389(1.39)
-0.342(-1.73)
-0.007(-0.09)
0.901(1.39)
-0.932(-1.45)
-0.009(-0.02)
Mid. Income x Age4
-0.103***(-3.38)
-0.038(-0.59)
-0.171*(-2.17)
-0.274*(-2.59)
-0.077(-0.43)
-0.303**(-2.92)
0.024(0.45)
1.623*(2.37)
-2.417***(-5.08)
-0.186(-0.40)
High Income x Age4
-0.122*(-2.08)
-0.071(-0.41)
-0.069(-0.32)
-0.576**(-2.92)
0.057(0.17)
-0.251(-1.26)
-0.037(-0.41)
1.722*(2.50)
-2.240***(-3.89)
-0.177(-0.33)
Mid. Income x Female
0.005(0.25)
-0.017(-0.43)
0.015(0.30)
0.066(1.01)
-0.004(-0.05)
-0.214***(-3.53)
0.035(1.11)
-0.574(-1.61)
-0.566(-1.05)
-0.169(-0.64)
High Income x Female
-0.027(-0.79)
-0.233*(-2.40)
0.087(0.66)
0.056(0.45)
-0.247(-1.22)
-0.219*(-2.03)
0.052(1.00)
-0.432(-1.18)
-0.969(-1.69)
-0.336(-1.15)
Constant -1.654***(-40.88)
-1.783***(-17.51)
-1.862***(-13.75)
-1.960***(-10.81)
-1.740***(-7.12)
-1.562***(-8.07)
-1.600***(-14.59)
0.046(0.08)
-2.168***(-4.32)
-2.120***(-4.48)
Village FEs x x x x x x x x x x
Observations 85459 18082 10309 7590 4755 9126 30994 1416 1330 1878
Adjusted R-squared 0.070 0.032 0.041 0.037 0.113 0.034 0.035 0.062 0.078 0.050
t statistics in parentheses* p<0.05, ** p<0.01, *** p<0.001

264 265
AllStates Bihar Jharkhand Madhya
Pradesh Orissa Rajasthan Uttar Pradesh
HimachalPradesh Kerala Tamil
Nadu
Village connected to paved road
0.029(1.27)
0.063(1.11)
0.134(1.72)
-0.128(-1.44)
-0.054(-0.47)
-0.207(-1.48)
-0.007(-0.09)
0.617(1.81)
-0.566(-1.83)
-0.028(-0.12)
Village had PDS shop
0.023(1.26)
0.027(0.52)
0.095(1.30)
-0.089(-1.33)
0.132(1.32)
0.087(0.96)
-0.026(-0.61)
0.041(0.25)
0.167(0.43)
Village has government primary school
-0.040(-1.31)
-0.083(-0.95)
0.026(0.31)
0.527*(2.08)
-0.138(-0.35)
-0.093(-1.15)
0.049(0.55)
-0.079(-0.48)
-0.185(-0.71)
-0.045(-0.18)
Village has primary health center
-0.011(-0.64)
0.080(1.72)
-0.033(-0.40)
-0.012(-0.16)
0.201*(2.08)
0.108(1.37)
-0.018(-0.49)
-0.255(-1.46)
0.032(0.24)
Village has ASHA worker available
-0.095***(-3.76)
0.059(0.77)
-0.469***(-4.28)
-0.063(-0.51)
-0.063(-0.42)
-0.059(-0.79)
0.116*(2.06)
-0.762(-1.50)
-0.081(-0.57)
Village has ANM available
0.087***(4.25)
0.051(0.99)
0.077(0.86)
-0.012(-0.13)
-0.230*(-2.21)
0.180*(2.26)
0.029(0.68)
0.418*(2.66)
0.719***(5.35)
0.543**(2.94)
Village has water tap or pipeline
0.012(0.58)
-0.093(-0.77)
0.327*(2.38)
0.046(0.55)
0.128(1.36)
0.045(0.71)
-0.006(-0.15)
-0.182(-0.64)
0.250(1.52)
Mid. Income 0.220***(6.37)
0.203**(2.70)
0.249*(2.32)
0.284*(2.58)
0.199(1.12)
0.383***(3.50)
0.227***(3.92)
0.110(0.25)
1.874(1.64)
-0.094(-0.23)
High Income 0.502***(7.69)
0.696***(4.18)
0.394(1.18)
1.002***(4.95)
0.416(1.32)
0.590***(3.40)
0.581***(5.85)
0.335(0.72)
1.397(1.07)
-0.017(-0.04)
SC -0.526***(-11.93)
-0.350***(-3.62)
-0.644***(-4.32)
-0.445**(-3.22)
-0.500*(-2.24)
-0.227(-1.70)
-0.634***(-8.48)
-1.355**(-2.88)
-0.739(-0.62)
-1.188(-1.73)
ST -0.752***(-18.16)
-0.807***(-9.36)
-0.718***(-5.12)
-0.443**(-3.14)
-0.534*(-2.50)
-0.482***(-3.76)
-0.873***(-12.18)
0.603(0.52)
2.412(1.61)
-0.807(-1.57)
Muslim -0.730***(-18.54)
-0.859***(-10.50)
-0.708***(-5.48)
-0.283*(-2.06)
-0.566**(-2.68)
-0.599***(-4.60)
-0.794***(-11.57)
-1.117(-1.69)
0.465(0.39)
-1.033*(-2.06)
Age1 -0.621***(-15.49)
-0.652***(-7.93)
-0.609***(-4.32)
-0.144(-1.11)
-0.390(-1.68)
-0.314*(-2.46)
-0.859***(-12.13)
-1.963**(-3.10)
1.597(1.41)
-1.434*(-2.16)
Age2 0.171***(4.82)
0.163*(2.52)
0.175(1.68)
0.218(1.96)
0.005(0.03)
0.250*(2.32)
0.141*(2.37)
0.299(0.47)
1.032(1.31)
0.626(1.85)
Age3 -0.143***(-3.65)
-0.216**(-2.64)
-0.333*(-2.24)
0.218(1.47)
0.129(0.58)
-0.009(-0.07)
-0.179**(-2.90)
0.010(0.03)
-1.013(-1.85)
0.156(0.62)
Age4 -0.296***(-5.32)
-0.307(-1.40)
-0.162(-0.98)
-0.293*(-2.37)
-0.628**(-3.21)
0.177(1.21)
-0.166(-0.97)
-0.765(-1.02)
0.544(0.84)
-0.530(-0.31)
Female -0.029(-0.57)
-0.047(-0.46)
-0.046(-0.31)
0.018(0.07)
0.338(0.70)
-0.119(-0.63)
-0.033(-0.38)
-0.692(-1.24)
-2.266***(-7.40)
Female x Age1 -0.058(-1.40)
-0.164*(-2.01)
-0.087(-0.77)
-0.032(-0.24)
0.155(0.97)
-0.202(-1.68)
-0.025(-0.38)
-0.122(-0.40)
0.698(0.95)
0.580(1.98)
Female x Age2 -0.144***(-3.68)
-0.119(-1.52)
-0.149(-1.29)
-0.236(-1.89)
-0.130(-0.93)
-0.237*(-1.99)
-0.079(-1.21)
-0.245(-0.81)
0.052(0.08)
-0.594*(-2.35)
Female x Age3 -0.206***(-5.49)
-0.141(-1.89)
-0.277**(-2.65)
-0.216(-1.65)
-0.059(-0.41)
-0.254*(-2.11)
-0.199**(-3.17)
-0.554(-1.72)
0.029(0.05)
-0.189(-0.61)
Female x Age4 -0.246***(-6.54)
-0.243**(-3.15)
-0.231*(-2.23)
-0.329**(-2.68)
-0.199(-1.30)
-0.251*(-2.28)
-0.262***(-4.11)
-0.356(-1.14)
0.250(0.39)
-0.091(-0.30)
SC x Age1 -0.043(-0.87)
-0.044(-0.43)
0.268(1.49)
-0.450*(-2.47)
-0.283(-1.23)
-0.128(-0.79)
0.017(0.21)
-0.230(-0.60)
1.347(1.99)
-0.300(-1.00)
SC x Age2 -0.101*(-2.18)
-0.004(-0.04)
0.124(0.70)
-0.344(-1.87)
-0.486(-1.81)
-0.149(-0.89)
-0.081(-1.05)
-0.319(-0.78)
1.386*(2.06)
-0.133(-0.46)
Focus States Best States
Table A20: Length-for-Age Z-scores between Villages
SC x Age3 -0.020(-0.45)
0.120(1.22)
0.070(0.45)
-0.271(-1.69)
-0.308(-1.30)
-0.041(-0.25)
0.001(0.02)
-0.161(-0.41)
0.741(1.43)
-0.250(-0.88)
SC x Age4 -0.072(-1.58)
-0.085(-0.91)
0.106(0.65)
-0.327(-1.83)
-0.324(-1.31)
-0.105(-0.68)
0.082(1.13)
-0.099(-0.28)
0.374(0.67)
-0.110(-0.34)
ST x Age1 0.004(0.06)
0.263(0.96)
0.037(0.21)
0.077(0.48)
-0.101(-0.44)
-0.325(-1.77)
0.066(0.36)
0.857(0.54)
1.052(0.64)
ST x Age2 0.006(0.09)
0.317(0.90)
-0.133(-0.76)
0.017(0.11)
-0.200(-0.89)
-0.227(-1.32)
0.036(0.20)
0.436(0.65)
-0.292(-0.20)
ST x Age3 0.046(0.74)
0.113(0.41)
0.090(0.52)
-0.089(-0.57)
-0.100(-0.48)
-0.343(-1.96)
0.021(0.12)
1.554*(2.12)
3.518***(4.47)
-0.099(-0.07)
ST x Age4 0.142*(2.31)
0.289(1.08)
-0.034(-0.18)
-0.046(-0.29)
-0.038(-0.17)
-0.127(-0.77)
0.086(0.48)
1.503(1.93)
-0.379(-0.28)
Muslim x Age1 -0.116(-1.81)
-0.198(-1.67)
-0.057(-0.32)
-0.022(-0.06)
-0.642(-0.77)
-0.305(-1.35)
-0.027(-0.28)
1.173(1.06)
4.039***(6.01)
Muslim x Age2 -0.197**(-3.27)
-0.123(-0.98)
-0.057(-0.31)
-0.228(-0.65)
-1.254(-1.57)
-0.025(-0.10)
-0.269**(-2.83)
0.329(0.45)
3.005***(5.80)
Muslim x Age3 -0.110(-1.87)
-0.144(-1.20)
0.191(1.12)
-0.029(-0.08)
-0.449(-1.31)
0.218(0.98)
-0.212*(-2.23)
0.284(0.46)
3.375***(6.12)
Muslim x Age4 -0.137*(-2.33)
-0.144(-1.21)
0.084(0.52)
-0.130(-0.37)
-0.422(-0.89)
0.006(0.03)
-0.192*(-2.04)
0.626(0.92)
2.387***(5.96)
SC x Female 0.022(0.78)
0.058(0.98)
0.136(1.41)
-0.084(-0.84)
0.157(1.20)
0.058(0.55)
-0.007(-0.17)
0.168(1.10)
0.260(1.09)
-0.010(-0.07)
ST x Female 0.132***(3.57)
0.065(0.33)
0.265**(3.02)
0.127(1.41)
0.276*(2.16)
-0.034(-0.39)
0.036(0.32)
-0.015(-0.04)
-1.477*(-2.14)
1.272*(2.10)
Muslim x Female -0.008(-0.21)
-0.103(-1.44)
0.073(0.77)
0.031(0.14)
0.074(0.18)
0.011(0.07)
0.041(0.69)
-0.503(-1.36)
-0.825(-1.47)
Mid. Income x Age1
0.016(0.36)
-0.171(-1.85)
0.023(0.16)
-0.011(-0.08)
0.325(1.43)
-0.210(-1.48)
0.051(0.70)
0.956*(2.04)
0.496(0.41)
0.791(1.15)
High Income x Age1
0.247**(3.04)
0.024(0.11)
0.148(0.38)
-0.167(-0.62)
1.552***(4.32)
0.019(0.08)
0.395**(3.27)
0.970(1.74)
0.695(0.50)
0.405(0.51)
Mid. Income x Age2
0.042(1.02)
0.096(1.13)
0.065(0.50)
-0.199(-1.42)
0.132(0.62)
-0.262(-1.91)
0.082(1.18)
-1.278(-1.11)
-2.685(-1.77)
0.489(0.96)
High Income x Age2
0.183*(2.38)
0.202(0.96)
0.664(1.79)
-0.338(-1.40)
0.940*(2.55)
-0.248(-1.13)
0.187(1.58)
-1.185(-0.96)
-1.740(-1.08)
1.167(2.00)
Mid. Income x Age3
-0.009(-0.22)
0.096(1.11)
0.060(0.48)
-0.269(-1.91)
0.265(1.21)
-0.193(-1.49)
0.014(0.20)
0.398(0.58)
-1.070(-0.84)
0.299(0.62)
High Income x Age3
0.056(0.75)
0.159(0.78)
0.405(1.13)
-0.641*(-2.50)
0.971**(2.87)
-0.100(-0.42)
0.088(0.77)
0.266(0.34)
-0.367(-0.27)
0.496(0.95)
Mid. Income x Age4
-0.055(-1.39)
0.048(0.57)
-0.004(-0.03)
-0.380**(-2.77)
0.082(0.39)
-0.215(-1.66)
0.050(0.72)
0.790(1.18)
-2.228(-1.92)
0.601(0.94)
High Income x Age4
-0.016(-0.21)
0.122(0.62)
0.365(1.02)
-0.930***(-3.73)
0.706*(2.14)
0.089(0.41)
0.054(0.46)
0.900(1.17)
-1.626(-1.18)
1.059(1.52)
Mid. Income x Female
-0.004(-0.18)
-0.007(-0.13)
-0.037(-0.53)
0.068(0.84)
-0.040(-0.35)
-0.063(-0.81)
0.008(0.18)
-0.115(-0.20)
-1.135*(-2.39)
-0.389(-1.14)
High Income x Female
0.003(0.06)
-0.149(-1.30)
0.210(1.11)
-0.035(-0.22)
-0.181(-0.80)
-0.166(-1.27)
0.035(0.48)
-0.069(-0.11)
-0.727(-1.37)
-0.269(-0.69)
Constant -1.668***(-32.04)
-1.806***(-12.78)
-1.628***(-7.23)
-2.154***(-6.94)
-1.426**(-3.07)
-1.965***(-8.36)
-1.923***(-14.38)
-1.808**(-3.07)
-2.438*(-2.03)
-1.870**(-3.23)
Village FEs x x x x x x x x x x
Observations 82710 16962 9879 7788 4382 9127 30354 1282 1253 1701
Adjusted R-squared 0.091 0.049 0.053 0.039 0.105 0.043 0.063 0.118 0.054 0.052
t statistics in parentheses* p<0.05, ** p<0.01, *** p<0.001

266 267
AllStates Bihar Jharkhand Madhya
Pradesh Orissa Rajasthan Uttar Pradesh
HimachalPradesh Kerala Tamil
Nadu
Village connected to paved road
-0.045*(-2.43)
0.052(1.00)
-0.070(-1.05)
0.052(0.69)
0.008(0.10)
-0.106(-1.10)
0.010(0.14)
-0.785*(-2.09)
0.767**(2.77)
-0.269(-0.63)
Village had PDS shop
0.001(0.09)
0.133*(2.55)
0.048(0.83)
0.096(1.58)
0.021(0.30)
-0.159*(-2.20)
-0.056(-1.73)
0.023(0.10)
0.564(1.31)
Village has government primary school
0.026(1.08)
0.034(0.39)
0.032(0.40)
-0.423(-1.11)
0.189(0.76)
-0.048(-0.53)
-0.019(-0.27)
0.189(0.98)
-1.611***(-7.53)
-0.090(-0.39)
Village has primary health center
-0.016(-1.15)
0.013(0.30)
0.111(1.80)
-0.020(-0.25)
-0.139(-1.51)
0.037(0.53)
0.009(0.30)
-0.156(-0.75)
0.121(0.74)
Village has ASHA worker available
0.052**(2.61)
0.033(0.46)
0.146(1.86)
0.006(0.07)
0.100(0.86)
-0.086(-0.93)
-0.066(-1.20)
0.802*(2.09)
0.052(0.27)
Village has ANM available
-0.049**(-3.07)
-0.081(-1.50)
-0.106(-1.64)
-0.125(-1.51)
-0.128(-1.75)
-0.109(-1.14)
0.002(0.05)
-0.064(-0.31)
-0.814***(-4.55)
-0.665**(-2.75)
Village has water tap or pipeline
0.025(1.51)
0.002(0.02)
-0.129(-1.80)
-0.054(-0.76)
0.162**(2.72)
0.129*(2.32)
0.010(0.31)
0.765**(3.33)
0.143(0.56)
Mid. Income 0.114***(3.76)
0.057(0.82)
0.272**(3.07)
0.056(0.58)
0.198(1.32)
0.183*(1.98)
0.087(1.76)
-0.638(-0.65)
-0.676(-0.69)
0.144(0.43)
High Income 0.173**(3.08)
0.248(1.46)
0.485(1.58)
-0.158(-0.84)
0.722*(2.25)
0.318(1.81)
0.179*(2.20)
-0.942(-0.96)
0.052(0.05)
0.102(0.21)
SC -0.249***(-6.80)
-0.290***(-3.72)
-0.415***(-3.69)
-0.263*(-2.37)
-0.086(-0.53)
-0.446***(-3.83)
-0.139*(-2.14)
0.027(0.03)
-0.497(-0.46)
0.086(0.17)
ST 0.064(1.86)
-0.010(-0.13)
0.012(0.11)
-0.016(-0.14)
0.102(0.63)
-0.018(-0.17)
0.188**(3.23)
-1.036(-0.79)
-2.195(-1.67)
-0.409(-1.12)
Muslim 0.127***(3.71)
0.137(1.91)
0.165(1.48)
-0.041(-0.37)
-0.018(-0.12)
-0.021(-0.17)
0.212***(3.55)
-0.416(-0.35)
-1.354(-1.15)
0.275(0.63)
Age1 0.054(1.52)
0.099(1.30)
-0.055(-0.48)
-0.177(-1.52)
-0.060(-0.37)
-0.102(-0.91)
0.142*(2.33)
-0.495(-0.43)
-0.848(-0.75)
0.281(0.57)
Age2 -0.029(-0.94)
-0.034(-0.52)
0.066(0.73)
0.106(1.09)
0.057(0.39)
0.023(0.22)
-0.113*(-2.25)
0.208(0.21)
1.193(1.70)
-0.188(-0.52)
Age3 -0.029(-0.84)
-0.080(-1.13)
-0.065(-0.53)
-0.064(-0.49)
-0.045(-0.25)
0.015(0.14)
-0.052(-0.96)
-0.502(-1.84)
0.759(1.20)
0.499*(2.20)
Age4 -0.012(-0.24)
0.105(0.45)
-0.144(-1.15)
-0.221(-1.73)
-0.086(-0.51)
-0.109(-0.87)
-0.010(-0.07)
0.124(0.30)
-0.195(-0.54)
-1.741(-1.49)
Female 0.006(0.14)
0.101(1.12)
0.002(0.02)
0.327(1.28)
-0.257(-0.99)
0.128(0.68)
0.070(1.02)
1.298(1.56)
1.327(1.06)
Female x Age1 0.093**(2.75)
0.065(0.92)
0.092(1.04)
-0.039(-0.37)
-0.099(-0.66)
0.233*(2.17)
0.129*(2.42)
0.359(1.16)
-0.843(-1.70)
0.263(0.90)
Female x Age2 0.074*(2.26)
0.093(1.35)
-0.030(-0.31)
0.097(0.94)
-0.132(-0.87)
0.117(1.06)
0.083(1.58)
0.282(0.90)
-0.906*(-2.41)
0.521(1.92)
Female x Age3 0.057(1.78)
0.061(0.89)
-0.102(-1.13)
0.086(0.84)
-0.143(-1.01)
0.157(1.43)
0.054(1.08)
0.383(1.23)
-0.624(-1.67)
0.474(1.82)
Female x Age4 -0.008(-0.23)
0.004(0.05)
-0.170(-1.76)
-0.087(-0.83)
-0.127(-0.87)
0.052(0.49)
0.074(1.37)
0.311(1.09)
-0.414(-1.04)
0.076(0.25)
SC x Age1 -0.141***(-3.50)
-0.264**(-3.16)
-0.117(-0.83)
-0.153(-0.96)
-0.170(-0.80)
0.093(0.63)
-0.141*(-2.19)
0.134(0.43)
-1.266(-1.87)
-0.423(-1.53)
SC x Age2 -0.075(-1.95)
-0.102(-1.18)
-0.215(-1.56)
0.047(0.29)
-0.128(-0.61)
-0.105(-0.76)
-0.050(-0.84)
0.296(0.92)
-0.811(-1.22)
-0.550(-1.93)
Focus States Best States
Table A21: Weight-for-Length Z-scores between Villages
SC x Age3 -0.024(-0.64)
-0.124(-1.55)
-0.132(-0.96)
0.151(1.01)
-0.010(-0.05)
-0.052(-0.39)
0.053(0.88)
0.461(1.39)
-0.858(-1.29)
-0.521(-1.81)
SC x Age4 -0.041(-1.04)
-0.155(-1.93)
0.028(0.18)
0.240(1.51)
-0.028(-0.14)
-0.190(-1.29)
-0.051(-0.79)
0.513(1.42)
-0.533(-0.73)
-0.555(-1.41)
ST x Age1 -0.089(-1.57)
-0.309(-1.20)
-0.015(-0.11)
0.074(0.50)
-0.206(-1.13)
0.190(1.33)
-0.195(-1.12)
-0.921(-1.49)
1.381(1.09)
ST x Age2 -0.150**(-2.78)
-0.192(-0.73)
-0.117(-0.85)
-0.037(-0.27)
-0.012(-0.07)
-0.173(-1.14)
-0.181(-1.15)
-0.471(-0.87)
1.858*(2.01)
ST x Age3 -0.177***(-3.35)
-0.242(-0.98)
-0.207(-1.48)
-0.042(-0.31)
0.012(0.07)
-0.044(-0.32)
0.096(0.64)
-0.746(-0.89)
0.159(0.19)
1.217(1.52)
ST x Age4 -0.200***(-3.72)
-0.146(-0.51)
-0.004(-0.03)
-0.028(-0.19)
0.006(0.03)
-0.186(-1.34)
-0.014(-0.08)
-0.676(-1.17)
0.385(0.31)
Muslim x Age1 -0.032(-0.62)
0.023(0.20)
0.042(0.32)
-0.114(-0.41)
0.258(0.54)
0.087(0.43)
-0.052(-0.66)
-2.343*(-2.03)
-1.266(-0.92)
Muslim x Age2 -0.057(-1.15)
-0.042(-0.40)
0.037(0.28)
-0.217(-0.80)
-0.153(-0.23)
-0.131(-0.59)
-0.080(-1.03)
-1.122(-1.26)
-2.637(-1.78)
Muslim x Age3 0.024(0.49)
0.048(0.46)
0.057(0.49)
-0.322(-1.38)
-0.183(-0.50)
-0.227(-0.97)
0.013(0.16)
-0.873(-1.02)
-1.367(-0.99)
Muslim x Age4 -0.022(-0.42)
0.049(0.40)
0.111(0.79)
-0.151(-0.61)
0.044(0.09)
-0.081(-0.46)
-0.136(-1.63)
-0.949(-0.74)
-2.215(-1.64)
SC x Female 0.040(1.81)
0.124*(2.56)
0.043(0.52)
-0.035(-0.42)
0.095(0.83)
0.058(0.74)
0.047(1.41)
-0.029(-0.21)
-0.512*(-2.35)
-0.154(-0.96)
ST x Female 0.074*(2.42)
-0.192(-1.40)
0.077(1.08)
0.066(0.83)
0.107(1.08)
-0.038(-0.44)
0.070(0.87)
0.185(0.42)
-0.714(-1.12)
-0.071(-0.15)
Muslim x Female 0.043(1.50)
0.013(0.23)
0.051(0.74)
-0.008(-0.04)
0.213(0.58)
-0.207(-1.72)
0.066(1.47)
0.391(0.92)
1.747*(2.30)
Mid. Income x Age1
0.028(0.77)
0.081(0.96)
-0.095(-0.95)
0.032(0.27)
-0.032(-0.18)
-0.039(-0.33)
0.031(0.52)
-0.295(-0.29)
1.035(1.06)
-0.412(-0.83)
High Income x Age1
0.208**(3.14)
0.015(0.07)
0.197(0.59)
0.251(1.19)
0.487(1.37)
0.112(0.53)
0.097(1.03)
0.112(0.11)
1.101(1.04)
0.294(0.50)
Mid. Income x Age2
-0.041(-1.19)
0.073(1.00)
-0.222*(-2.14)
0.003(0.02)
-0.014(-0.08)
-0.077(-0.73)
-0.065(-1.17)
0.915(0.70)
2.593*(2.08)
0.095(0.28)
High Income x Age2
-0.041(-0.63)
0.215(1.18)
-0.169(-0.51)
0.226(0.97)
-0.666*(-1.98)
-0.290(-1.45)
-0.092(-0.95)
0.993(0.76)
2.099(1.51)
0.277(0.74)
Mid. Income x Age3
-0.102**(-3.04)
-0.045(-0.57)
-0.356***(-3.48)
0.058(0.54)
-0.172(-1.04)
-0.198(-1.78)
-0.063(-1.14)
0.299(0.25)
1.608(1.43)
-0.615(-1.52)
High Income x Age3
-0.006(-0.09)
-0.103(-0.55)
-0.305(-0.97)
0.390(1.84)
-0.133(-0.42)
-0.264(-1.26)
-0.065(-0.69)
0.543(0.46)
1.573(1.40)
-0.010(-0.02)
Mid. Income x Age4
-0.028(-0.80)
-0.050(-0.64)
-0.238*(-2.31)
0.098(0.81)
-0.176(-1.05)
-0.002(-0.02)
0.008(0.13)
0.158(0.14)
0.963(0.92)
-0.140(-0.30)
High Income x Age4
-0.062(-0.95)
-0.217(-1.19)
-0.354(-1.09)
0.329(1.41)
-0.472(-1.58)
-0.267(-1.30)
-0.089(-0.89)
0.160(0.13)
0.754(0.69)
-0.411(-0.70)
Mid. Income x Female
-0.024(-1.23)
-0.072(-1.60)
0.037(0.70)
-0.088(-1.28)
0.002(0.02)
-0.161*(-2.38)
0.027(0.85)
-0.598(-0.66)
-0.324(-0.53)
-0.008(-0.03)
High Income x Female
-0.067(-1.86)
-0.256*(-2.44)
-0.096(-0.60)
0.031(0.24)
-0.023(-0.11)
-0.120(-1.17)
0.007(0.13)
-0.410(-0.45)
-0.978(-1.48)
-0.164(-0.49)
Constant -0.586***(-13.24)
-0.740***(-5.28)
-0.772***(-4.27)
-0.184(-0.45)
-0.928**(-2.95)
-0.194(-0.87)
-0.338**(-2.82)
1.597(1.83)
0.772(0.60)
-0.135(-0.19)
Village FEs x x x x x x x x x x
Observations 80521 16773 9751 7018 4321 8582 29829 1286 1259 1719
Adjusted R-squared 0.060 0.021 0.027 0.019 0.027 0.015 0.013 0.062 0.066 0.026
t statistics in parentheses* p<0.05, ** p<0.01, *** p<0.001

268 269
AllStates Bihar Jharkhand Madhya
Pradesh Orissa Rajasthan Uttar Pradesh
HimachalPradesh Kerala Tamil
Nadu
Village connected to paved road
-0.039*(-2.09)
0.061(1.24)
-0.075(-1.05)
0.068(0.90)
0.039(0.46)
-0.103(-1.01)
0.011(0.17)
-0.824*(-2.11)
0.824**(2.70)
-0.178(-0.43)
Village had PDS shop
-0.001(-0.04)
0.132*(2.53)
0.036(0.59)
0.105(1.70)
-0.018(-0.24)
-0.176*(-2.09)
-0.049(-1.43)
-0.030(-0.14)
0.205(0.45)
Village has government primary school
0.026(1.04)
0.063(0.73)
0.034(0.43)
-0.585(-1.43)
0.141(0.49)
-0.055(-0.57)
-0.049(-0.65)
0.201(1.04)
-1.621***(-6.67)
-0.155(-0.56)
Village has primary health center
-0.020(-1.39)
0.019(0.43)
0.122(1.81)
0.006(0.07)
-0.177(-1.74)
0.021(0.26)
0.006(0.18)
-0.094(-0.45)
0.030(0.17)
Village has ASHA worker available
0.077***(3.70)
0.005(0.08)
0.183*(2.18)
0.014(0.14)
0.092(0.77)
-0.067(-0.68)
-0.051(-0.86)
0.909*(2.31)
0.035(0.19)
Village has ANM available
-0.063***(-3.83)
-0.071(-1.34)
-0.095(-1.35)
-0.120(-1.39)
-0.077(-1.02)
-0.124(-1.20)
-0.017(-0.50)
-0.144(-0.68)
-0.932***(-4.99)
-0.577*(-2.62)
Village has water tap or pipeline
0.023(1.38)
0.018(0.16)
-0.160*(-2.16)
-0.070(-0.99)
0.142*(2.24)
0.136*(2.29)
0.008(0.25)
0.870**(3.35)
-0.045(-0.17)
Mid. Income 0.134***(4.49)
0.126(1.95)
0.269***(3.37)
0.076(0.83)
0.221(1.25)
0.180(1.80)
0.073(1.50)
-0.796(-0.87)
-0.753(-0.73)
0.142(0.45)
High Income 0.247***(4.41)
0.371*(2.22)
0.635*(2.27)
0.025(0.13)
0.860**(2.93)
0.283(1.68)
0.202*(2.47)
-1.173(-1.23)
0.150(0.14)
0.208(0.45)
SC 0.341***(9.27)
0.320***(4.23)
0.202(1.84)
0.304**(2.84)
0.204(1.18)
0.082(0.66)
0.477***(7.41)
0.782(0.78)
-0.402(-0.34)
0.435(0.87)
ST 0.702***(20.09)
0.669***(9.61)
0.645***(5.94)
0.591***(5.09)
0.353*(2.09)
0.546***(4.70)
0.863***(14.39)
-0.624(-0.45)
-1.734(-1.50)
-0.093(-0.26)
Muslim 0.705***(20.51)
0.751***(10.98)
0.757***(6.95)
0.487***(4.53)
0.199(1.24)
0.500***(3.83)
0.829***(13.68)
0.211(0.17)
-1.307(-1.02)
0.174(0.39)
Age1 0.542***(15.55)
0.615***(8.53)
0.450***(4.00)
0.253*(2.26)
0.118(0.72)
0.309*(2.49)
0.672***(10.77)
-0.936(-1.01)
-0.932(-0.75)
0.483(1.02)
Age2 -0.037(-1.23)
-0.016(-0.25)
0.005(0.06)
0.162(1.71)
-0.048(-0.31)
-0.003(-0.03)
-0.117*(-2.28)
-0.604(-0.84)
1.165(1.84)
-0.084(-0.25)
Age3 -0.091**(-2.75)
-0.158*(-2.40)
-0.081(-0.68)
-0.160(-1.32)
-0.103(-0.57)
-0.011(-0.09)
-0.120*(-2.29)
-0.710*(-2.47)
0.778(1.06)
0.439*(2.07)
Age4 -0.042(-0.90)
-0.221(-1.11)
-0.149(-1.32)
-0.299**(-2.66)
-0.223(-1.30)
-0.176(-1.38)
-0.110(-0.77)
0.082(0.18)
-0.092(-0.26)
-1.484(-1.11)
Female 0.013(0.30)
0.138(1.71)
0.062(0.54)
0.225(0.98)
-0.354(-1.39)
-0.135(-0.76)
0.134*(2.02)
1.243(1.66)
0.927(0.68)
Female x Age1 0.051(1.49)
-0.009(-0.13)
0.092(1.13)
-0.121(-1.18)
-0.065(-0.40)
0.169(1.62)
0.089(1.65)
0.290(0.85)
-0.740(-1.36)
0.233(0.82)
Female x Age2 -0.005(-0.15)
-0.011(-0.17)
-0.032(-0.34)
-0.026(-0.25)
-0.059(-0.37)
0.016(0.14)
-0.019(-0.35)
0.116(0.35)
-0.762(-1.81)
0.543(1.97)
Female x Age3 -0.042(-1.31)
-0.073(-1.07)
-0.144(-1.65)
-0.099(-0.99)
-0.139(-0.96)
0.033(0.31)
-0.038(-0.74)
0.270(0.86)
-0.509(-1.28)
0.441(1.63)
Female x Age4 -0.113***(-3.48)
-0.113(-1.54)
-0.223*(-2.45)
-0.234*(-2.31)
-0.120(-0.78)
-0.053(-0.53)
-0.045(-0.82)
0.088(0.29)
-0.471(-1.11)
0.034(0.10)
SC x Age1 -0.054(-1.35)
-0.160(-1.96)
-0.087(-0.63)
-0.008(-0.05)
-0.146(-0.68)
0.178(1.16)
-0.045(-0.69)
0.338(1.12)
-1.436(-1.84)
-0.396(-1.44)
SC x Age2 0.021(0.55)
0.005(0.06)
-0.196(-1.48)
0.171(1.07)
0.025(0.12)
-0.132(-0.91)
0.073(1.22)
0.548(1.56)
-0.865(-1.20)
-0.590*(-2.12)
Focus States Best States
Table A22: BMI Z-scores between Villages
SC x Age3 0.062(1.67)
0.016(0.21)
-0.082(-0.59)
0.278*(1.99)
0.032(0.16)
0.000(0.00)
0.126*(2.12)
0.608(1.70)
-0.882(-1.16)
-0.385(-1.39)
SC x Age4 0.048(1.24)
-0.010(-0.13)
0.060(0.39)
0.363*(2.44)
0.006(0.03)
-0.135(-0.89)
0.023(0.36)
0.687(1.91)
-0.440(-0.53)
-0.511(-1.42)
ST x Age1 -0.049(-0.87)
-0.018(-0.08)
-0.023(-0.18)
0.166(1.19)
0.003(0.01)
0.224(1.51)
-0.058(-0.32)
-0.904(-1.14)
1.052(0.79)
ST x Age2 -0.066(-1.22)
0.212(0.88)
-0.070(-0.54)
0.107(0.83)
0.227(1.27)
-0.065(-0.42)
0.038(0.24)
-0.328(-0.56)
1.593(1.51)
ST x Age3 -0.123*(-2.34)
0.126(0.53)
-0.181(-1.34)
0.091(0.70)
0.241(1.36)
-0.015(-0.11)
0.241(1.48)
-0.862(-1.04)
0.098(0.13)
1.214(1.40)
ST x Age4 -0.144**(-2.74)
0.172(0.66)
0.026(0.19)
0.131(0.97)
0.172(0.96)
-0.118(-0.83)
0.102(0.56)
-0.617(-1.09)
0.311(0.22)
Muslim x Age1 -0.000(-0.00)
0.002(0.02)
0.040(0.30)
0.040(0.15)
0.048(0.09)
0.408(1.89)
-0.083(-1.07)
-1.587(-1.60)
-1.225(-0.77)
Muslim x Age2 -0.007(-0.13)
-0.101(-1.00)
0.036(0.26)
-0.051(-0.17)
0.153(0.23)
0.142(0.67)
-0.033(-0.43)
-0.813(-0.97)
-2.492(-1.52)
Muslim x Age3 0.037(0.73)
-0.022(-0.24)
0.014(0.11)
-0.155(-0.71)
-0.098(-0.24)
0.015(0.07)
-0.012(-0.15)
-0.566(-0.69)
-1.144(-0.75)
Muslim x Age4 -0.015(-0.29)
-0.008(-0.07)
0.068(0.48)
-0.006(-0.02)
0.213(0.44)
0.183(1.10)
-0.140(-1.69)
-1.486(-1.71)
-1.862(-1.24)
SC x Female 0.028(1.24)
0.078(1.66)
0.028(0.35)
-0.035(-0.41)
0.099(0.85)
0.056(0.67)
0.044(1.29)
0.085(0.63)
-0.529*(-2.29)
-0.214(-1.53)
ST x Female 0.049(1.55)
-0.188(-1.30)
0.037(0.49)
0.030(0.39)
0.078(0.75)
-0.002(-0.02)
0.011(0.14)
0.241(0.51)
-0.770(-1.37)
-0.282(-0.51)
Muslim x Female 0.021(0.70)
0.060(0.98)
-0.017(-0.24)
-0.069(-0.43)
0.132(0.33)
-0.137(-1.15)
0.027(0.57)
-0.057(-0.18)
1.745*(2.15)
Mid. Income x Age1
-0.026(-0.72)
0.008(0.09)
-0.136(-1.39)
-0.011(-0.10)
-0.119(-0.60)
-0.072(-0.57)
0.014(0.24)
-0.762(-0.77)
1.076(1.02)
-0.390(-0.76)
High Income x Age1
0.015(0.22)
-0.172(-0.81)
-0.046(-0.14)
0.004(0.02)
-0.082(-0.24)
0.077(0.36)
-0.069(-0.73)
-0.324(-0.32)
0.925(0.80)
0.086(0.14)
Mid. Income x Age2
-0.128***(-3.71)
-0.059(-0.84)
-0.327***(-3.34)
-0.048(-0.43)
-0.130(-0.66)
-0.135(-1.21)
-0.108(-1.89)
0.783(0.57)
2.284*(2.21)
0.175(0.50)
High Income x Age2
-0.262***(-4.02)
-0.112(-0.59)
-0.526(-1.63)
-0.120(-0.50)
-1.039**(-3.08)
-0.293(-1.49)
-0.263**(-2.67)
0.955(0.68)
1.585(1.37)
0.104(0.28)
Mid. Income x Age3
-0.171***(-5.10)
-0.173*(-2.25)
-0.431***(-4.54)
0.034(0.32)
-0.226(-1.20)
-0.236*(-2.01)
-0.097(-1.73)
-0.057(-0.05)
1.692(1.41)
-0.277(-0.66)
High Income x Age3
-0.204**(-3.23)
-0.400*(-2.16)
-0.612*(-2.01)
0.106(0.51)
-0.479(-1.41)
-0.297(-1.39)
-0.219*(-2.31)
0.122(0.10)
1.447(1.20)
0.199(0.37)
Mid. Income x Age4
-0.091**(-2.66)
-0.168*(-2.23)
-0.289**(-2.95)
0.099(0.85)
-0.268(-1.39)
-0.053(-0.43)
-0.022(-0.37)
0.871(0.91)
1.167(1.05)
-0.074(-0.17)
High Income x Age4
-0.228***(-3.52)
-0.453*(-2.53)
-0.636*(-2.10)
0.060(0.26)
-0.800**(-2.80)
-0.330(-1.62)
-0.224*(-2.25)
0.956(0.96)
1.003(0.89)
-0.434(-0.76)
Mid. Income x Female
-0.011(-0.55)
-0.058(-1.33)
0.075(1.32)
-0.079(-1.09)
-0.014(-0.13)
-0.131(-1.86)
0.030(0.91)
0.238(0.36)
-0.404(-0.77)
-0.091(-0.39)
High Income x Female
-0.044(-1.17)
-0.199(-1.96)
-0.069(-0.45)
0.066(0.50)
0.091(0.39)
-0.093(-0.86)
0.030(0.55)
0.405(0.57)
-1.136(-1.92)
-0.301(-0.95)
Constant -0.820***(-18.45)
-1.033***(-7.33)
-1.036***(-5.78)
-0.312(-0.72)
-0.830*(-2.34)
-0.326(-1.39)
-0.550***(-4.33)
1.817*(2.23)
0.920(0.65)
0.226(0.35)
Village FEs x x x x x x x x x x
Observations 80509 16765 9741 7011 4323 8608 29845 1280 1247 1707
Adjusted R-squared 0.078 0.040 0.030 0.033 0.024 0.019 0.048 0.079 0.059 0.014
t statistics in parentheses* p<0.05, ** p<0.01, *** p<0.001

270
Fighting Hunger & Malnutrition
There are people in the world so hungry, that God cannot appear to them except in the form of bread.
Mohandas Karamchand Gandhi

1008569_Cover_F.pdf 2 12/5/2011 6:36:09 PM

Fighting Hunger & Malnutrition
The HUNGaMA Survey Report – 2011
The HU
NG
aMA
Survey Report – 2011
Naandi Foundation
502, Trendset Towers
Road 2, Banjara Hills
Hyderabad 500 034
India
Phone: 91 40 2355 6491/2
Fax: 91 40 2355 6537
www.naandi.org
www.hungamaforchange.orgFor further information, contact [email protected]
Supported by http://www.realhcgdropsguide.com
The HUNGaMA Survey Report has been compiled & published by Naandi Foundation with primary grant support from Avantha Foundation, Soma Enterprise Ltd. and Mahindra & Mahindra Ltd.While photographs are copyright Naandi Foundation, data and information are open source.
1008569_Cover_Corr.pdf 1 12/6/2011 1:17:49 PM