Embed Size (px)
Citation preview
LUND UNIVERSITY
PO Box 117221 00 Lund+46 46-222 00 00
The human L-type calcium channel Ca(v)1.3 regulates insulin release andpolymorphisms in CACNA1D associate with type 2 diabetes.
Reinbothe, Thomas; Alkayyali, Sami; Ahlqvist, Emma; Tuomi, Tiinamaija; Isomaa, Bo;Lyssenko, Valeriya; Renström, ErikPublished in:Diabetologia
DOI:10.1007/s00125-012-2758-z
2013
Link to publication
Citation for published version (APA):Reinbothe, T., Alkayyali, S., Ahlqvist, E., Tuomi, T., Isomaa, B., Lyssenko, V., & Renström, E. (2013). Thehuman L-type calcium channel Ca(v)1.3 regulates insulin release and polymorphisms in CACNA1D associatewith type 2 diabetes. Diabetologia, 56(2), 340-349. https://doi.org/10.1007/s00125-012-2758-z
General rightsCopyright and moral rights for the publications made accessible in the public portal are retained by the authorsand/or other copyright owners and it is a condition of accessing publications that users recognise and abide by thelegal requirements associated with these rights.
• Users may download and print one copy of any publication from the public portal for the purpose of private studyor research. • You may not further distribute the material or use it for any profit-making activity or commercial gain • You may freely distribute the URL identifying the publication in the public portalTake down policyIf you believe that this document breaches copyright please contact us providing details, and we will removeaccess to the work immediately and investigate your claim.

1
Article
The human L-type calcium channel Cav1.3 regulates insulin release and polymorphisms
in CACNA1D associate with type 2 diabetes
T. M. Reinbothe1, S. Alkayyali2, E. Ahlqvist2, T. Tuomi3,4, B. Isomaa4,5, V. Lyssenko2, E.
Renström1
1. Department of Clinical Sciences, Islet Patophysiology, Lund University Diabetes Centre,
CRC 91-11, Jan Waldenströms gata 35, SE-20502 Malmö, Sweden
2. Department of Clinical Sciences, Diabetes and Endocrinology, Lund University Diabetes
Centre, Malmö, Sweden
3. Department of Medicine, Helsinki University Central Hospital, and Research Program for
Molecular Medicine, University of Helsinki, Helsinki, Finland
4. Folkhälsan Research Center, Biomedicum Helsinki, Helsinki, Finland
5. City of Jakobstad, Department of Social Services and Public Health, Jakobstad, Finland
Corresponding author: T. M. Reinbothe, Department of Clinical Sciences, Islet
Patophysiology, Lund University Diabetes Centre, Jan Waldenströms gata 35, CRC 91-11,
SE-20502 Malmö, Sweden
email [email protected]
Received: 25 May 2012 / Accepted: 2 October 2012
The final publication is available at Springer via http://dx.doi.org/10.1007/s00125-012-2758-z
Abstract
Aims/hypothesis Voltage-gated calcium channels of the L-type have been shown to be
essential for rodent pancreatic beta cell function, but data about their presence and regulation

2
in humans are incomplete. We therefore sought to elucidate which L-type channel isoform is
functionally important and its association with inherited diabetes-related phenotypes.
Methods Beta cells of human islets from cadaver donors were enriched using FACS to study
the expression of the genes encoding voltage-gated calcium channel (Cav)1.2 and Cav1.3 by
absolute quantitative PCR in whole human and rat islets, as well as in clonal cells. Single-cell
exocytosis was monitored as increases in cell capacitance after treatment with small
interfering (si)RNA against CACNA1D (which encodes Cav1.3). Three single nucleotide
polymorphisms (SNPs) were genotyped in 8,987 non-diabetic and 2,830 type 2 diabetic
individuals from Finland and Sweden and analysed for associations with type 2 diabetes and
insulin phenotypes.
Results In FACS-enriched human beta cells, CACNA1D mRNA expression exceeded that of
CACNA1C (which encodes Cav1.2) by approximately 60-fold and was decreased in islets
from type 2 diabetes patients. The latter coincided with diminished secretion of insulin
in vitro. CACNA1D siRNA reduced glucose-stimulated insulin release in INS-1 832/13 cells
and exocytosis in human beta cells. Phenotype/genotype associations of three SNPs in the
CACNA1D gene revealed an association between the C allele of the SNP rs312480 and
reduced mRNA expression, as well as decreased insulin secretion in vivo, whereas both
rs312486/G and rs9841978/G were associated with type 2 diabetes.
Conclusion/interpretation We conclude that the L-type calcium channel Cav1.3 is important
in human glucose-induced insulin secretion, and common variants in CACNA1D might
contribute to type 2 diabetes.
Keywords Beta cell • CACNA1D • Calcium • Cav1.3 channel • Diabetes • Exocytosis •
Human • Insulin • Islets
Abbreviations
AU Arbitrary unit
Cav Voltage-gated calcium channel
GSIS Glucose-induced insulin secretion
GWAS genome-wide association studies

3
L-VGCC L-type voltage-gated calcium channel
PPP Prevalence, Prediction and Prevention of Diabetes study
qPCR Quantitative PCR
siRNA Small interfering RNA
SNP Single nucleotide polymorphism
VGCC Voltage-gated calcium channel
Introduction
Insulin secretion requires the presence and activity of voltage-gated calcium channels
[VGCCs; 1]. Various VGCC subclasses are described and the L-type class (L-VGCC) has
been considered essential for insulin secretion [2]. However, which of the two main L-type
isoforms (Cav1.2 and Cav1.3) is most important appears to be species dependent and to differ
between rodents and humans [3]. Conclusive data showing gene expression in human beta
cells has not previously been available.
In mice, global knockout of Cacna1c (which encodes Cav1.2) is lethal [4], whereas beta cell-
specific disruption has demonstrated that Cav1.2 is critical for insulin release [5, 6], especially
during the first phase [7]. Cav1.3, on the other hand, has been proposed to play a central role
during murine postnatal beta cell generation and proliferation [8], but is also differentially
regulated in a diabetogenic diet mouse model [9]. This isoform is characterised by a more
negative activation threshold [10] and decreased calcium-channel blocker sensitivity [11]
compared with Cav1.2, and has been suggested to be the main L-VGCC responsible for
insulin release in rat beta cells [12, 13].
In humans, perturbed L-VGCC expression and function can cause disease, as exemplified by
Timothy syndrome (caused by alterations in Cav1.2, encoded by CACNA1C) and congenital
stationary night blindness (caused by dysfunctional Cav1.4, encoded by CACNA1F [14]). For
human islets, mRNA expression of CACNA1D (encoding Cav1.3 protein) has been reported
to exceed that of CACNA1C by tenfold [15]. Human genetic studies also point to CACNA1D
being the most significant isoform for type 2 diabetes mellitus. A comparison between DNA
from healthy individuals and those with type 2 diabetes revealed that, in the latter, CACNA1D
carried an additional methionine-encoding triplet immediately downstream of the 5′

4
untranslated region [16, 17]. Although the functional consequences were not clarified, this
finding supports the hypothesis of a causal link between genetic variations in the Cav1.3-
encoding gene CACNA1D and risk for type 2 diabetes.
To evaluate this idea, we analysed data from genome-wide association studies (GWAS) for
type 2 diabetes and quantitative traits [18, 19] in which we detected associations of single
nucleotide polymorphisms (SNPs) in CACNA1D with type 2 diabetes. If and how these SNPs
translate into changes in beta cell function have until now remained unanswered. Using
genetics, molecular biology and electrophysiological approaches, we here present the first
study determining the functional role of Cav1.3 for insulin secretion in the human beta cell
and for human type 2 diabetes.
Methods
Real-time PCR RNA was extracted and reverse transcribed as previously described [20]. For
absolute quantification, we produced standard curves using custom-designed DNA
oligonucleotides (4 nM; idtDNA, Coralville, IA, USA). Transcript numbers are expressed as
transcripts/ng reverse transcribed mRNA. For primer sequences, see electronic
supplementary material (ESM) Table 1.
FACS of beta cells Beta cells from dispersed human islets were enriched using the Zn2+ dye
Newport Green [21]. Apoptotic cells were accounted for (7-AAD staining) and islet cells
were sorted using BD Biosciences FACSAria (BD Biosciences, San Jose, CA, USA). Beta
cell enrichment was verified by immunohistochemistry and insulin-positive cells accounted
for 90±5% of all cells in the beta cell fractions, comparable with previous observations [22].
Microarrays of human pancreatic islet mRNA RNA was isolated and prepared and the
microarrays were performed and analysed as described in [23].
Only non-diabetic individuals were considered for correlations with CACNA1D expression.
The genes that showed positive correlation (cut-off Pearson’s r≥0.8) with CACNA1D
expression (163 genes) were analysed using the DAVID database for functional annotation
(david.abcc.ncifcrf.gov). The gene ontology category with the highest stringency for specific
classification of gene product function (GOTERM_BP_5 in the gene ontology classification
chart) was used and functions were sorted according to Fisher’s exact p value (minimum gene
count threshold of 5). All microarray data are presented as arbitrary log2 units (AUs).

5
Immunocytochemistry and microscopy Islets were treated as previously described [24] and
incubated overnight at 4°C with anti-Cav1.3 (17 µg/ml, Cat. no. ACC-005, Lot no. AN-15,
Alomone Labs, Jerusalem, Israel) and anti-insulin (1:200, Cat. no. 2263B65-1, Lot no.
HS1761, EuroProxima, Arnhem, the Netherlands) or anti-glucagon (1:200, Cat. no. 2263B-
GP310-1, Lot no. LN2051, EuroProxima) antibodies. Incubation with secondary antibodies
anti-rabbit-DyLite488 and anti-guinea pig-Cy5 (1:200; Jackson ImmunoResearch, West
Grove, PA, USA) for 4 h at RT and nuclei staining with Hoechst 33258 (1:1,000) was
followed by visualisation in multitrack mode with a Zeiss 510 LSM confocal microscope
with a C-Apochromat 40×/1.2 WDICIII lens (Carl Zeiss, Oberkochen, Germany).
Human study populations Non-diabetic participants from the Botnia Family Study (IVGTT,
n=766) and the population-based Prevalence, Prediction and Prevention of Diabetes (PPP)-
Botnia Study (OGTT, n=4,671) were used to investigate effects of genetic variants in
CACNA1D on insulin secretion in vivo (Table 1) [25, 26]. First-phase insulin release was
determined as previously described [25]. Insulin and glucose measurements were also
performed as previously described [26]. Insulin readouts were converted (1 µU/ml = 6.945
pmol/l) and loge transformed. The Malmö case–control population contained 2,830 patients
with diabetes from the Malmö Diabetes Registry [27] and 3,550 non-diabetic controls from
the Malmö Diet and Cancer study (Table 1) [28]. All cases were of Scandinavian origin, with
an age at diabetes onset of older than 35 years, C-peptide levels of 0.3 nmol/l or higher and
no GAD antibodies. Controls had fasting blood glucose less than 5.5 mmol/l, HbA1c less than
6.0% (42 mmol/mol) and no known first-degree relatives with diabetes. The diagnosis of type
2 diabetes was based on WHO criteria [29]. All participants gave informed consent and the
protocols were approved by the ethics committees of Jorbruksverket (Human islets and
MCC), Central Hospital Vasa (Botnia) and Helsinki University Hospital (Botnia-PPP).
SNP selection and genotyping Genotyping was performed as previously described [23]. The
SNPs analysed were not in linkage disequilibrium with each other and were chosen based on
nominal associations with risk of type 2 diabetes in the Diabetes Genetics Initiative GWAS
(rs9841978) [18] or the DIAGRAM+ meta-analysis for type 2 diabetes (rs312486 and
rs9841978) [19], or based on their location and functional implication (rs312480 [16, 17, 30];
rs312486 as proxy for rs312481 [31]) (see ESM Table 2 for details). The genotyping success
rate was higher than 97% (5% random replicates) and Hardy–Weinberg equilibrium was met
in all studied populations.

6
In vitro insulin-release measurements, cell and islet culture Human pancreatic islets were
supplied by the Nordic Network for Clinical Islet Transplantation (courtesy of O. Korsgren,
Uppsala University, Uppsala, Sweden). Insulin-release measurements were conducted as
previously described [32]. Culture of INS-1 832/13 cells and tests for glucose-induced insulin
secretion (GSIS) were performed as previously described [20]. Diagnosis of type 2 diabetes
was based on donor history records or as indicated otherwise (i.e. based on WHO criteria).
HbA1c was determined from patient blood samples taken while on life support.
Days in culture had no influence on CACNA1D expression in human islets. Although islet
purity correlated significantly with CACNA1D expression (p<0.01), the mean purity between
islets from control and diabetic participants was not significantly different (68±2% in controls
vs 64±6% in diabetic participants).
Transfection with siRNA The small interfering (si)RNA oligonucleotides (rat siRNA ID
s132089; human s2286) were supplied by Ambion (Austin, TX, USA). The negative control
siRNA was non-targeting siRNA#1 (Cat. no. D-001810-01-05) from Dharmacon (Lafayette,
LA, USA), as was the transfection reagent Dharmacon-1 (Cat. no. T-2001). Transfection was
performed as previously described [20], but a concentration of 25 µM was used in the current
study.
Electrophysiology Human islets were dispersed into single cells by incubation in Ca2+-free
buffer followed by trituration and overnight incubation in RPMI1640 medium containing
5 mmol/l glucose. They were then transfected with siRNA (see above) with additional co-
transfection of a green fluorescent oligonucleotide (Cat. no. 2013; Invitrogen, Carlsbad, CA,
USA) to identify successfully transfected cells. After 48 h, cells were used for
electrophysiological capacity measurements as previously described [15].
Ca2+ imaging Imaging was performed using a Polychrome V monochromator (TILL
Photonics, Graefeling, Germany) on a Nikon Eclipse Ti Microscope (Nikon, Tokyo, Japan).
A ER-BOB-100 trigger, iXON3 camera and software iQ2 (Andor Technology, Belfast, UK)
were used for control and detection. After 24 h culture in poly-L-lysine-coated glass-bottom
dishes in indicated glucose concentrations, human islets were loaded with Fura-2 (2 µmol/l in
KRB buffer containing 5 mmol/l glucose) for 35–40 min, left in the imaging system for 15
min while perfused with 37°C buffer prior to imaging. The exposure time was 50 ms at 2 s
intervals. Islets were exposed to 5 mmol/l glucose for less than 5 min (time interval 1 [ti1]), to
20 mmol/l glucose for 10 min (ti2), 5 mmol/l glucose for 5 min (ti3), 5 mmol/l glucose and

7
70 mmol/l KCl for 5 min (ti4) and 5 mmol/l glucose for 5 min (ti5). The AUC for the above
time intervals was calculated as AUCti = Σ[0.5 × (tn – tn–1) × (Ratio340/380n + Ratio340/380n–
1)].
Statistical analyses Data are presented as means±SEM. Quantitative traits were calculated
using linear regression analysis corrected for age, sex and BMI. Type 2 diabetes risk was
assessed using logistic regression adjusted for age, sex and BMI and is expressed as OR. p
values were adjusted for the number of SNPs tested. All other data were statistically
evaluated using an unpaired two-tailed Student’s t test (unless otherwise indicated) after
verification of equal variances and normal distribution of the data. For human islet
quantitative (q)PCR and microarray data, an unpaired two-tailed t test assuming unequal
variances was used with confirmation by Mann–Whitney U test. p<0.05 was considered
significant.
Results
CACNA1C and CACNA1D expression in islets and beta cells Reports on L-VGCC gene
expression are not conclusive and we therefore quantified expression of Cacna1c and
Cacna1d in rat islets, INS-1 832/13 cells and CACNA1C and –D in human islets with qPCR.
In whole rat islets, we found 998±197 Cacna1c mRNA transcripts (given as transcripts per
ng reverse-transcribed RNA) and 9,727.9±2,629.8 Cacna1d transcripts (Fig. 1 a). Expression
in INS-1 832/13 cells was similar to that observed in rat islets, with 1,580±337 transcripts for
Cacna1c and 4,266±749 copies of Cacna1d (Fig. 1 b). We then enriched beta cells from three
islet donors by FACS using dispersed human islet cells and the Zn2+ dye Newport Green
DCF [21]. For comparison, transcripts were also quantified in undispersed human islets of the
same individuals, and for CACNA1C they amounted to 7±2 (Fig. 1 c) compared with 19±1 in
beta cells alone (Fig. 1 d). The number of CACNA1D mRNA molecules amounted to 550±30
in islets (Fig. 1 c) and 1,130±23 in human beta cells (Fig. 1 d), suggesting CACNA1D
transcripts to be mainly localised to beta cells. Staining for Cav1.3 protein in whole islets
revealed Cav1.3 immunoreactivity not only in insulin-positive (beta) cells (Fig. 1 i, k), but
also in alpha cells (Fig. 1 j).
We then asked if CACNA1D expression was different in the islets of type 2 diabetes patients
compared with controls. In microarrays CACNA1D mRNA was reduced in type 2 diabetes
islets compared with controls (7.27±0.16 AU in 10 cases vs 7.69±0.55 AU in 66 controls;
p=0.03; t test; Fig. 1 e). CACNA1C expression was not significantly changed but

8
directionality was the same (6.22±1.39 AU in cases vs 6.47±0.04 in controls; Fig. 1 h).
Interestingly, the expression of Cav1.2 and CACNA1D showed strong covariation (Pearson’s
r=0.9; p=2.5×10⁻²⁸; not shown). The downregulation of CACNA1D in type 2 diabetes islets
was confirmed with absolute qPCR (1,235±64 CACNA1D transcripts in 63 controls vs
754±93 in seven cases; p=2×10⁻⁴, t test; Fig. 1 f). Similar results were obtained using HbA1c
levels to define diabetic status, with CACNA1D expression being 50% lower in individuals
with HbA1c of 6.5% (=48 mmol/mol) or higher (626±133 vs 1,250±88 transcripts when
HbA1c<6.5% [48 mmol/mol]; p=0.008, t test; Fig. 1 g). We found no significant change in
INS expression in type 2 diabetes islets as compared with controls ( tC2 Δ− INS relative to beta-
actin 3.4×10⁻⁵±1.5×10⁻⁵ in cases vs 4.6×10⁻⁵±6.7×10⁻⁶ in controls, p=0.25). This suggests
that the reduced CACNA1D expression in islets from hyperglycaemic/type 2 diabetes donors
cannot be attributed to reduced islet mass or reduced beta cell fraction within the islets, in
agreement with previous thorough investigations of the same islet donor cohort ([33, 34]).
Effect of genetic variants in CACNA1D on insulin secretion and type 2 diabetes The
expression of the related L-VGCC gene CACNA1C has been shown to be genetically
determined by SNPs [35], giving a functional explanation for associations of CACNA1C
genotypes with neurological disorders [36, 37]. Similarly, to determine if the changes in
expression of the Cav1.3 Ca2+ channel gene CACNA1D that we observed in human pancreatic
islets also are influenced by genetic variations, we studied SNPs in CACNA1D and their
associations with gene expression as well as with insulin release and type 2 diabetes.
We used literature searches and previously published GWAS studies to select the best
candidate SNPs in CACNA1D ±50 kb (see Methods and ESM Table 2 for details).
The first marker analysed was rs312480 and the C allele associated with decreased 30 min
insulin concentration (IVGTT; β=–0.103; p=0.036, Table 2 and Fig. 2 a). The same
directionality (β) was observed for 30 min insulin during the Botnia-OGTT Study (Table 2),
although values were not statistically significant. This suggests that the additional
mechanisms of insulin release that are in operation when administering glucose via the oral
route (e.g. the incretin effect) may obscure the direct effects of rs312480 on 30 min insulin
values observed during IVGTT. Although we found no significant effect on fasting insulin in
the smaller Botnia-OGTT Study, we detected decreased fasting insulin values in the OGTT of
the larger PPP-Botnia Study (β=–0.047; p=0.048) due to the larger sample size and therefore
increased power.

9
In line with these in vivo findings, rs312480/C showed reduced in vitro insulin release in
batch incubations at high glucose (16.7 mmol/l; CC 1.4±0.1 vs CT 2.2±0.3 ng/islet×h,
p=0.04; T/T n.a.; Fig. 2 b). Microarray data from islets of the same individuals revealed a
concomitant reduction in CACNA1D mRNA in the carriers of CC genotypes (CC 7.6±0.1 vs
CT 8.0±0.2 AU, p=0.03; Fig. 2 c).
Neither the variant rs9841978 nor rs312486 showed a significant association with insulin
secretion (ESM Table 3) or with changes in gene expression. However, we next wanted to
examine if any of these SNPs in CACNA1D that were previously suggested to be associated
with disease would also have an effect on risk of type 2 diabetes. In the Malmö case–control
population, including 6,570 individuals (2,830 type 2 diabetes cases and 3,740 controls),
rs9841978/G (OR 1.16, 95% CI 1.06, 1.27; p=0.003) and rs312486/G (OR 1.17, 95% CI 1.06,
1.3; p=1.9×10⁻⁴) were indeed associated with an increased risk of type 2 diabetes. The
genotype frequencies for control (type 2 diabetes) individuals for rs312486 were 61.9%
(66.9%) for G/G, 33.7% (29.4%) for G/C and 4.4% (3.7%) for C/C. For rs9841978, they
amounted to 48.1% (53.4%) for G/G, 41.9% (38.2%) for G/A and 10.1% (8.4%) for A/A
genotype carriers. We verified our findings by meta-analysis of DIAGRAM+ (see ESM
Table 2) and our own results. For rs312486/G, we found an OR of 1.11 (95% CI 1.06, 1.16
p=1.1×10⁻⁵) and for rs9841978/G the OR was 1.08 (95% CI 1.04, 1.12; p=1.1×10⁻⁴). The
reason why the markers rs9841978 and rs312486 exhibited no significant association with
insulin secretion or gene expression, but an increased risk of type 2 diabetes, remains unclear,
but may be because the risk of type 2 diabetes is not solely related to impaired beta cell
function or because of confounding effects on survival.
Glucose effects Given that CACNA1D transcript numbers were decreased in islets of
individuals with type 2 diabetes, we next investigated the possible direct effects of glucose on
CACNA1D expression in human islets. After 24 h incubation, insulin concentrations in the
medium were 5.5-fold higher at 20 mmol/l glucose as compared with 5 mmol/l glucose, but
in the presence of the L-type calcium-channel blocker isradipine the islets failed to release
insulin (p=0.02, ESM Fig. 1), as also reported elsewhere [15].
After 24 h islets were rested at 5 mmol/l glucose for 1 h then stimulated with 20 mmol/l
glucose. Islets that had been cultured for 24 h in 20 mmol/l glucose now released
significantly more insulin than islets cultured at basal (5 mmol/l) glucose (4.2±0.4-fold vs
2.6±0.4-fold, p<0.01; Fig. 3 a). The presence of isradipine in the 24 h incubation medium

10
completely abolished GSIS in subsequent batch incubations. We next asked what effect this
L-type channel inhibition had on CACNA1D mRNA expression. Absolute quantification
revealed that high glucose increased CACNA1D transcript numbers approximately twofold,
whereas expression levels remained unaffected in the presence of isradipine (Fig. 3 b).
Increased CACNA1D expression coincided with elevated basal [Ca2+]i levels (2.14±0.04
AUCi for islets cultured for 24 h at 20 mmol/l vs 1.68±0.04 when tested at 5 mmol/l glucose;
p=8×10⁻⁴; Figs. 3c, d), an exaggerated response to 20 mmol/l glucose (6.09±0.09 for
20 mmol/l glucose vs 4.5±0.05 for 5 mmol/l; p=1×10⁻⁵) and higher levels during (6.51±0.39
vs 5.53±0.16; p=0.046) and after 70 mmol/l KCl stimulation (1.84±0.05 vs 1.44±0.05;
p=2×10⁻³). Typical [Ca2+]i oscillations during high-glucose stimulation were absent in the
islets that had been incubated at 20 mmol/l glucose for 24 h (Fig. 3 d). The elevated
expression of CACNA1D by long-term 24 h glucose treatment is thus functionally important
and clearly affects [Ca2+]i homeostasis.
As we detected decreased CACNA1D expression in the islets of individuals with type 2
diabetes, we wanted to examine whether the presence of CACNA1D transcripts was a
prerequisite for appropriate glucose-induced insulin release. We used siRNAs against human
CACNA1D (siCACNA1D), rat Cacna1d (siCacna1d) and the rat beta cell line INS-1 832/13, a
model for the study of GSIS [38]. The two siRNAs tested (designed for human and rat
CACNA1D, but both targeting rat Cacna1d) were comparably efficient and after 48 h
Cacna1d expression in INS-1 832/13 cells was decreased by 72±6% (Fig. 3 e, shown only for
siRNA against rat Cacna1d; p=0.02) compared with the non-targeting siRNA. Cav1.3 protein
was also decreased (Fig. 3 i). We then tested for effects on GSIS. While basal release was not
affected (Fig. 3 f; 1.5±0.1 ng insulin/mg protein×h in siCacna1d-treated vs 1.8±0.3 ng
insulin/mg protein×h in control cells), the response to high glucose was significantly reduced
in cells treated with siCacna1d (Fig. 3 f; 3.8±0.4 ng/mg protein×h in siCacna1d vs 6.7±0.7
ng/mg protein×h in control; p=0.0026). Human beta cells responded in a similar manner.
After 48 h incubation with siCACNA1D, depolarisation-evoked single-cell exocytosis was
significantly reduced when compared with control cells (Fig. 3 g, h; 41±4 fF in siCACNA1D
vs 68±8 fF in control cells; p=0.009). The difference was significant for each of the ten
depolarisations (not shown). Exocytosis was reduced by about 40%, comparable with the
reduction of GSIS in the rat beta cell line.

11
CACNA1D and the exocytotic microdomain Our data indicate that the appropriate expression
of CACNA1D and function of Cav1.3 are important determinants of GSIS. To further examine
the role of Cav1.3 in the exocytotic process, we extended our microarray studies by exploring
the genes that positively correlate with CACNA1D expression (cut-off Pearson’s r≥0.8, 163
genes). We found that genes coexpressed with CACNA1D were significantly enriched for
particular cellular functions (Table 3) and the top-ranked category was exocytosis (p=9×10⁻⁴).
This is in agreement with the functional results and underlines the relevance of these findings.
Discussion
The L-type calcium channels of the beta cell have been extensively studied, but mostly in
rodents. It therefore remains unclear which isoform is expressed and operational in the human
beta cell. In this study, we set out to determine this, as well as possible associations between
genetic variations and phenotypes related to type 2 diabetes. We demonstrate that Cav1.3
dominates over the related Cav1.2 channel on the mRNA level, and that Cav1.3 mRNA and
protein are mainly localised to human beta cells. Second, we have shown that a SNP
(rs312480) in CACNA1D, the gene encoding Cav1.3, can influence gene expression of the
channel and affect insulin release, and that other SNPs (rs312486 and rs9841978) associate
with type 2 diabetes. Furthermore, our data illustrate that the expression of CACNA1D
mRNA is reduced in islets of patients with type 2 diabetes (Fig. 1) and that pharmacological
or RNA interference-mediated inhibition of CACNA1D expression and/or Cav1.3 operation
decreases GSIS and, on a single-cell level, exocytosis (Fig. 3).
Animal studies designed to investigate which L-type channel isoform is expressed and
functional in beta cells have revealed that insulin release in the mouse mainly depends on
Cav1.2 [6, 7, 39, 40], with a diminished first phase after ablation of the channel [7]. However,
a compensatory upregulation of Cav1.2 upon Cacna1d knockout, as detected by another
group [8], could not be ruled out [39]. Studies in rats claimed Cav1.3 to be the major L-
VGCC involved [12], which is similar to what is proposed for humans [15], although neither
study quantified protein levels. We detected Cav1.3 transcripts and protein not only in whole
islets, but also found both to be enriched in beta cells, although some protein was also
detected in alpha cells. We also identified a common variant in CACNA1D (SNP rs312480)
to be associated with reduced fasting insulin and putatively also with 30 min insulin levels,
indicating that this isoform might not strictly participate in phasic but also in basal insulin
secretion. In fact, Cav1.3, with its lower activation threshold compared with Cav1.2 [10], has

12
been suggested to be involved in pacemaking in the heart [41] and in the neuroendocrine
chromaffin cell [42]. Considering that the neuroendocrine beta cell also fires action potentials
in the physiological resting (or preprandial) condition [43], Cav1.3, with its low activation
threshold, might be a good candidate for these events. In the glutamate-releasing inner-ear
hair cell, Cav1.3 has been shown to be responsible for the generation of spontaneous action
potentials, important for the maturation of synaptic connections within the developing
cochlea [44]. In a remarkable analogy, the postnatal maturation of mouse beta cells has also
been suggested to be dependent on the presence of Cav1.3 [8], although spontaneous spiking
during this process has never been investigated. Reflecting on our finding that a
polymorphism in the gene encoding for Cav1.3 leads to decreased expression and reduced
insulin release, our present data suggest that this is not related to a decrease in islet mass or
beta cell proportion. The possibility that the genotype is associated with the capacity for
postnatal human beta cell expansion, for instance in insulin resistance, requires live
determination and longitudinal studies of beta cell mass, techniques that remain to be
developed for application in humans [45]. Nevertheless, we here demonstrate that in beta
cells of adult humans, Cav1.3 is important for insulin exocytosis as knockdown of its
expression also reduced insulin vesicle fusion events (Fig. 3 f, g). This is in accordance with
findings from Braun and colleagues [15], where the L-type blocker isradipine abolished
glucose-induced insulin release in human islet batch incubations and reduced exocytosis in
patch experiments, although the latter was even more suppressed by P/Q-type channel
blockers. Nevertheless, isradipine completely inhibited glucose-induced action potentials,
suggesting that a single depolarisation in voltage-clamp mode strongly underestimates the
pharmacological effect of L-type channel blockage on beta cell function.
We also found that Cav1.3 knockdown reduced insulin release in INS-1 832/13 cells. A
previous study suggested that Cav1.2 knockdown diminished GSIS [46] but as we did not test
siRNA against Cav1.2, it may well be that both channels are crucial for appropriate insulin
release in these cells.
Our study also reveals that human CACNA1D expression responds to a change in glucose
levels, a phenomenon that has previously been observed in rats [13]. No data on the effects of
glucose on Cacna1d expression in mice are available, but a several-week-long diabetogenic
high-fat diet has been shown to decrease rather than increase Cacna1d expression [9].
However, we found increased levels after a high-glucose episode of just 24 h, whereas after

13
48 h Iwashima and colleagues detected a decline (in rats) [13]. Although another species and
time frame, this indicates a putative time- and activity-dependent regulation of CACNA1D
expression. Indeed, for the related Cav1.2 channel, a mechanism has been put forward
whereby calpain Ca2+ dependently cleaves an (among L-type VGCC well conserved [47])
autoinhibitory C-terminal domain of the channel. The cleaved C-terminus disinhibits the
channel and acts as a transcription factor that controls expression of the Cav1.2 encoding gene
CACNA1C [48]. Interestingly, when we pharmacologically inhibited Ca2+ influx through L-
type channels and consequentially also insulin release by isradipine (Fig. 2 a), CACNA1D
expression was no longer augmented (Fig. 2 b). This suggests suppression of the activity-
dependent positive-feedback loop that otherwise would drive the rise in channel expression
analogous to that proposed for Cacna1c (Cav1.2). We have indeed observed that calpain
inhibitor-1 can reduce the level of CACNA1D mRNA in the high-glucose condition back to
isradipine levels (not shown). The observed glucose-induced activity-dependent rise in
CACNA1D expression correlated with increased basal Ca2+ levels, as well as higher levels
under stimulation (Fig. 3 c, d). Human islets cultured under high-glucose conditions for 48 h
have previously been described to be desensitised due to increased basal Ca2+ levels and
diminished slow [Ca2+]i oscillations, and thus to respond poorly to glucose stimulation [49].
Interestingly, after 24 h we also found diminished Ca2+ oscillations but hypersensitisation
rather than desensitisation (Fig. 3 d). It has been suggested that glucose causes
hypersensitisation first, followed later by desensitisation and Ca2+-induced apoptosis
[glucotoxicity; 50] and the two findings may thus be in line with each other.
It is tempting to speculate that pharmacological inhibition of excessive Ca2+ influx in
prediabetic islets, in order to prevent Ca2+ induced hypersensitisation, may be an option for
early-stage intervention that might at least delay the onset of type 2 diabetes.
Acknowledgements
We thank B.-M. S. Nilsson and A.-M. Veljanovska Ramsay (both Dept. of Clinical Sciences
Malmö, Islet Pathophysiology, Lund University, Sweden) for their technical expertise and C.
Ladenvall (Dept. of Clinical Sciences Malmö, Diabetes and Endocrinology, Lund University,
Sweden) for advice on statistical analysis. INS-1 832/13 cells were kindly provided by H.
Hohmeier (Department of Medicine, Duke University, Durham, NC, USA).
The final publication is available in Diabetologia, 2013, Vol. 56, Issue 2 or at Springer via
http://dx.doi.org/10.1007/s00125-012-2758-z
14
Funding
Imaging and qPCR equipment were financed by the Knut and Alice Wallenberg Foundation.
T.R. was funded by the EU research training network Cavnet (MRTN-CT-2006-035367). E.R.
is a Swedish Research Council senior researcher.
Contribution statement
TMR conducted research and wrote the manuscript. SA conducted research and contributed
to revision of the manuscript. EA, TT and BI conducted research and reviewed the
manuscript. VL and ER contributed to the concept and design of the study, and reviewed and
edited the manuscript. All authors approved the final version of the manuscript.
Duality of interest
The authors declare that there is no duality of interest associated with this manuscript.
References
[1] Rorsman P (1997) The pancreatic beta-cell as a fuel sensor: an electrophysiologist's viewpoint. Diabetologia 40: 487-495
[2] Davalli AM, Biancardi E, Pollo A, et al. (1996) Dihydropyridine-sensitive and -insensitive voltage-operated calcium channels participate in the control of glucose-induced insulin release from human pancreatic beta cells. The Journal of endocrinology 150: 195-203 [3] Drews G, Krippeit-Drews P, Dufer M (2010) Electrophysiology of islet cells. Adv Exp Med Biol 654: 115-163 [4] Seisenberger C, Specht V, Welling A, et al. (2000) Functional embryonic cardiomyocytes after disruption of the L-type alpha1C (Cav1.2) calcium channel gene in the mouse. The Journal of biological chemistry 275: 39193-39199
[5] Barg S, Eliasson L, Renstrom E, Rorsman P (2002) A subset of 50 secretory granules in close contact with L-type Ca2+ channels accounts for first-phase insulin secretion in mouse beta-cells. Diabetes 51 Suppl 1: S74-82 [6] Vignali S, Leiss V, Karl R, Hofmann F, Welling A (2006) Characterization of voltage-dependent sodium and calcium channels in mouse pancreatic A- and B-cells. The Journal of physiology 572: 691-706
[7] Schulla V, Renstrom E, Feil R, et al. (2003) Impaired insulin secretion and glucose tolerance in beta cell-selective Ca(v)1.2 Ca2+ channel null mice. The EMBO journal 22: 3844-3854 [8] Namkung Y, Skrypnyk N, Jeong MJ, et al. (2001) Requirement for the L-type Ca(2+) channel alpha(1D) subunit in postnatal pancreatic beta cell generation. The Journal of clinical investigation 108: 1015-1022

15
[9] Dreja T, Jovanovic Z, Rasche A, et al. (2009) Diet-induced gene expression of isolated pancreatic islets from a polygenic mouse model of the metabolic syndrome. Diabetologia [10] Koschak A, Reimer D, Huber I, et al. (2001) alpha 1D (Cav1.3) subunits can form l-type Ca2+ channels activating at negative voltages. The Journal of biological chemistry 276: 22100-22106
[11] Sinnegger-Brauns MJ, Huber IG, Koschak A, et al. (2009) Expression and 1,4-dihydropyridine-binding properties of brain L-type calcium channel isoforms. Mol Pharmacol 75: 407-414 [12] Seino S (1995) CACN4, the major alpha 1 subunit isoform of voltage-dependent calcium channels in pancreatic beta-cells: a minireview of current progress. Diabetes research and clinical practice 28 Suppl: S99-103
[13] Iwashima Y, Pugh W, Depaoli AM, et al. (1993) Expression of calcium channel mRNAs in rat pancreatic islets and downregulation after glucose infusion. Diabetes 42: 948-955 [14] Striessnig J, Bolz HJ, Koschak A (2010) Channelopathies in Ca(v)1.1, Ca (v)1.3, and Ca (v)1.4 voltage-gated L-type Ca (2+) channels. Pflugers Arch 460: 361-374 [15] Braun M, Ramracheya R, Bengtsson M, et al. (2008) Voltage-gated ion channels in human pancreatic beta-cells: electrophysiological characterization and role in insulin secretion. Diabetes 57: 1618-1628
[16] Yamada Y, Masuda K, Li Q, et al. (1995) The structures of the human calcium channel alpha 1 subunit (CACNL1A2) and beta subunit (CACNLB3) genes. Genomics 27: 312-319 [17] Yamada Y, Kuroe A, Li Q, et al. (2001) Genomic variation in pancreatic ion channel genes in Japanese type 2 diabetic patients. Diabetes/metabolism research and reviews 17: 213-216
[18] Saxena R, Voight BF, Lyssenko V, et al. (2007) Genome-wide association analysis identifies loci for type 2 diabetes and triglyceride levels. Science (New York, NY 316: 1331-1336 [19] Voight BF, Scott LJ, Steinthorsdottir V, et al. (2010) Twelve type 2 diabetes susceptibility loci identified through large-scale association analysis. Nature genetics 42: 579-589
[20] Reinbothe TM, Ivarsson R, Li DQ, et al. (2009) Glutaredoxin-1 mediates NADPH-dependent stimulation of calcium-dependent insulin secretion. Molecular endocrinology (Baltimore, Md 23: 893-900 [21] Lukowiak B, Vandewalle B, Riachy R, et al. (2001) Identification and purification of functional human beta-cells by a new specific zinc-fluorescent probe. The journal of histochemistry and cytochemistry : official journal of the Histochemistry Society 49: 519-528
[22] Kirkpatrick CL, Marchetti P, Purrello F, et al. (2010) Type 2 diabetes susceptibility gene expression in normal or diabetic sorted human alpha and beta cells: correlations with age or BMI of islet donors. PLoS ONE 5: e11053 [23] Jonsson A, Isomaa B, Tuomi T, et al. (2009) A variant in the KCNQ1 gene predicts future type 2 diabetes and mediates impaired insulin secretion. Diabetes 58: 2409-2413

16
[24] Lyssenko V, Eliasson L, Kotova O, et al. (2011) Pleiotropic effects of GIP on islet function involve osteopontin. Diabetes 60: 2424-2433
[25] Groop L, Forsblom C, Lehtovirta M, et al. (1996) Metabolic consequences of a family history of NIDDM (the Botnia study): evidence for sex-specific parental effects. Diabetes 45: 1585-1593 [26] Pyykkönen A-J, Räikkönen K, Tuomi T, Eriksson JG, Groop L, Isomaa B (2010) Stressful Life Events and the Metabolic Syndrome. Diabetes Care 33: 378-384 [27] Lindholm E, Agardh E, Tuomi T, Groop L, Agardh CD (2001) Classifying diabetes according to the new WHO clinical stages. European journal of epidemiology 17: 983-989 [28] Berglund G, Elmstahl S, Janzon L, Larsson SA (1993) The Malmo Diet and Cancer Study. Design and feasibility. J Intern Med 233: 45-51 [29] World Health Organisation (2006) Definition and Diagnosis of Diabetes Mellitus and Intermediate Hyperglycemia: Report of a WHO/IDF Consultation. Available from http://www.who.int/entity/diabetes/publications/, accessed 11June 2011
[30] Pickering BM, Willis AE (2005) The implications of structured 5' untranslated regions on translation and disease. Semin Cell Dev Biol 16: 39-47
[31] Kamide K, Yang J, Matayoshi T, et al. (2009) Genetic polymorphisms of L-type calcium channel alpha1C and alpha1D subunit genes are associated with sensitivity to the antihypertensive effects of L-type dihydropyridine calcium-channel blockers. Circ J 73: 732-740
[32] Rosengren AH, Jokubka R, Tojjar D, et al. (2010) Overexpression of alpha2A-adrenergic receptors contributes to type 2 diabetes. Science (New York, NY 327: 217-220
[33] Taneera J, Jin Z, Jin Y, et al. (2012) gamma-Aminobutyric acid (GABA) signalling in human pancreatic islets is altered in type 2 diabetes. Diabetologia
[34] Taneera J, Lang S, Sharma A, et al. (2012) A systems genetics approach identifies genes and pathways for type 2 diabetes in human islets. Cell metabolism 16: 122-134
[35] Bigos KL, Mattay VS, Callicott JH, et al. (2010) Genetic variation in CACNA1C affects brain circuitries related to mental illness. Arch Gen Psychiatry 67: 939-945
[36] Sklar P, Smoller JW, Fan J, et al. (2008) Whole-genome association study of bipolar disorder. Mol Psychiatry 13: 558-569
[37] Green EK, Grozeva D, Jones I, et al. (2009) The bipolar disorder risk allele at CACNA1C also confers risk of recurrent major depression and of schizophrenia. Mol Psychiatry [38] Hohmeier HE, Mulder H, Chen G, Henkel-Rieger R, Prentki M, Newgard CB (2000) Isolation of INS-1-derived cell lines with robust ATP-sensitive K+ channel-dependent and -independent glucose-stimulated insulin secretion. Diabetes 49: 424-430
[39] Platzer J, Engel J, Schrott-Fischer A, et al. (2000) Congenital deafness and sinoatrial node dysfunction in mice lacking class D L-type Ca2+ channels. Cell 102: 89-97
[40] Sinnegger-Brauns MJ, Hetzenauer A, Huber IG, et al. (2004) Isoform-specific regulation of mood behavior and pancreatic beta cell and cardiovascular function by L-type Ca 2+ channels. The Journal of clinical investigation 113: 1430-1439

17
[41] Mangoni ME, Nargeot J (2008) Genesis and regulation of the heart automaticity. Physiological reviews 88: 919-982
[42] Comunanza V, Marcantoni A, Vandael DH, et al. (2011) CaV1.3 as pacemaker channels in adrenal chromaffin cells: Specific role on exo- and endocytosis? Channels (Austin, Tex 4: 440-446 [43] Misler S, Dickey A, Barnett DW (2005) Maintenance of stimulus-secretion coupling and single beta-cell function in cryopreserved-thawed human islets of Langerhans. Pflugers Arch 450: 395-404
[44] Brandt A, Striessnig J, Moser T (2003) CaV1.3 channels are essential for development and presynaptic activity of cochlear inner hair cells. J Neurosci 23: 10832-10840 [45] Ahlgren U, Gotthardt M (2010) Approaches for imaging islets: recent advances and future prospects. Adv Exp Med Biol 654: 39-57 [46] Nitert MD, Nagorny CL, Wendt A, Eliasson L, Mulder H (2008) CaV1.2 rather than CaV1.3 is coupled to glucose-stimulated insulin secretion in INS-1 832/13 cells. Journal of molecular endocrinology 41: 1-11
[47] Hulme JT, Konoki K, Lin TW, et al. (2005) Sites of proteolytic processing and noncovalent association of the distal C-terminal domain of CaV1.1 channels in skeletal muscle. Proceedings of the National Academy of Sciences of the United States of America 102: 5274-5279
[48] Satin J, Schroder EA, Crump SM (2011) L-type calcium channel auto-regulation of transcription. Cell calcium
[49] Bjorklund A, Lansner A, Grill VE (2000) Glucose-induced [Ca2+]i abnormalities in human pancreatic islets: important role of overstimulation. Diabetes 49: 1840-1848
[50] Cnop M, Welsh N, Jonas JC, Jorns A, Lenzen S, Eizirik DL (2005) Mechanisms of pancreatic beta-cell death in type 1 and type 2 diabetes: many differences, few similarities. Diabetes 54 Suppl 2: S97-107

18
Figures and tables
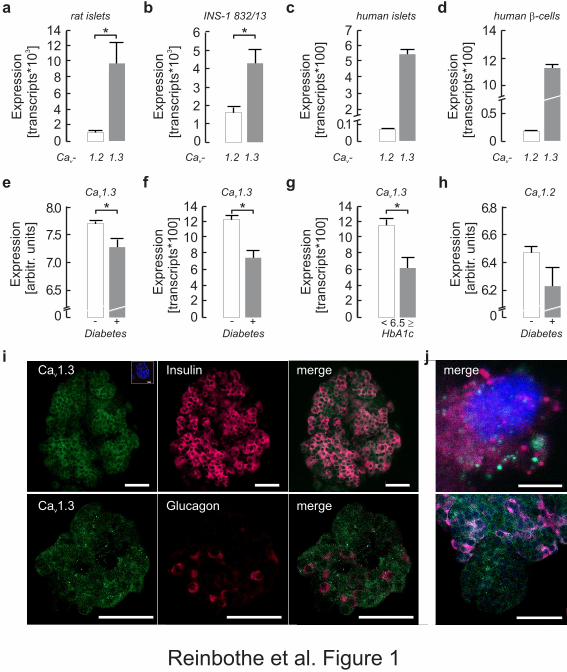
Fig. 1 Expression of Cacna1c/CACNA1C (encoding rat/human Cav1.2) and
Cacna1d/CACNA1D (rat/human Cav1.3). (a, b) mRNA expression of Cacna1d (grey bar)
exceeds that of Cacna1c (white bar) in rat islets (a) as well as in INS-1 832/13 cells (b). The
same relationship, but with greater difference, is found in human islets (c) and in human beta
cells (d), where CACNA1D (grey bar) dominates over CACNA1C (white bar). (e, f)
Microarray studies revealed that expression of CACNA1D (e) is reduced in islets of
individuals with type 2 diabetes (grey bars) compared with controls (white bars), confirmed
by qPCR (f). (g) Expression of CACNA1D is also reduced in islets from human organ donors
with high HbA1c (≥6.5% [48 mmol/mol]; n=6) as compared with those with low HbA1c
(<6.5% [48 mmol/mol]; n=42). (h) Expression of CACNA1C is not significantly changed but
directionality is the same as for CACNA1D. (i,j) Cav1.3 immunoreactivity (green) is detected
in insulin-positive cells (red, i) and in glucagon-positive cells of control islets (red, j). Note
that only a few glucagon-positive cells are detected. (i) Inset: control with omitted primary
antibody and final Hoechst 33258 staining. Scale bars 50 µm. (k) A single cell showing
distinct staining for insulin (red) and Cav1.3 (green). Scale bar 5 µm. (l) Some small islets are
Cav1.3 positive but lack insulin protein. Scale bar 50 µm. All data are means±SEM. *p<0.05.
AU, arbitrary units. Expr., expression.
Fig. 2 (a) rs312480 has effects on in vivo and in vitro insulin levels and on mRNA
expression. Thirty minute insulin levels (standardised residual corrected for age, sex and BMI
shown) are reduced in rs312480/C allele carriers of the Botnia IVGTT Study (a) as well as in
human islet batch incubations (b). (c) CACNA1D expression is decreased in the same
individuals as in (b). All data are means±SEM. *p<0.05. AU, arbitrary units. Expr.,
expression.
Fig. 3 CACNA1D expression changes upon incubation with 20 mmol/l glucose (Glc.).
Incubation of control human islets in medium with 20 mmol/l glucose for 24 h resulted in an
increased fold insulin release (a, light grey bars) in a batch incubation and increased
CACNA1D expression (b, light grey bars), compared with the 5 mmol/l glucose condition
(white bars), unless the L-type Ca2+ channel inhibitor isradipine (Isr.) had been present for 24

19
h (a, b; dark grey bars). No isradipine was added during the batch incubation. In parallel,
intracellular Ca2+ levels were increased after 24 h in 20 mmol/l glucose (c, grey bars, given as
the sum of the AUC [AUCti] in the given time intervals [5 or 10 min]) compared with 24 h in
5 mmol/l glucose (white bars). The example shown in (d) with inset depicts the absence of
[Ca2+]i oscillations during high-glucose stimulation in the islets incubated for 24 h at 20
mmol/l glucose (black traces) compared with 24 h in 5 mmol/l glucose (grey traces). (e)
siRNA against Cacna1d reduced Cacna1d mRNA expression (grey bars) but not Cacna1c
expression (white bars). (f) Glucose-induced insulin release (16.7 mmol/l) was reduced in
siCav1.3-treated INS-1 832/13 cells (grey bars), whereas basal release was unaffected (2.8
mmol/l; white bars). (g) In analogy, in human beta cells, exocytosis was reduced after
siCav1.3 treatment (white bar) compared with siContr (grey bar). A typical example is shown
in (h), with the stimulation protocol being illustrated. (i) Cav1.3 knockdown (siCav1.3) in
INS-1 832/13 cells also reduced Cav1.3 protein (Cav1.3) without an effect on insulin protein
expression (Insulin) when compared with controls (siContr). Absence of Cav1.3
immunoreactivity upon pre-incubation with Cav1.3 peptide (i, siContr+peptide) verifies the
specificity of the antibody. The intensity profiles depict the intensity of the red lines drawn in
the corresponding left panels (Cav1.3). All data are means±SEM. *p<0.05 (Student’s t test);
siContr, control siRNA.
rat islets
0 0
0.5
10
12
14
a
e f g h
i
c
1.2 1.2 1.21.3 1.3 1.3Ca -v Ca -v Ca -v
INS-1 832/13 human b-cells
0
2468
101214 * *
b d
merge
- -+ +
Ca 1.3v Ca 1.2v
Diabetes Diabetes
E
xpre
ssio
n[a
rbitr
. units
]
E
xpre
ssio
n[a
rbitr
. units
]
*
- < 6.5 ³+
Ca 1.3v Ca 1.3v
Diabetes HbA1c
E
xpre
ssio
n[tra
nsc
ripts
*100]
E
xpre
ssio
n[tra
nsc
ripts
*100]* *
0 0
2 24 46 68 8
10 1012 1214 14
E
xpre
ssio
n3
[tra
nsc
ripts
*10
]
E
xpre
ssio
n3
[tra
nsc
ripts
*10
]
E
xpre
ssio
n[tra
nsc
ripts
*100]
E
xpre
ssio
n[tra
nsc
ripts
*100]
2
1
3
4
5
6
0 0
6.5 6.2
7.5 6.6
7.0 6.4
8.0 6.8
j
human islets
1.2 1.3Ca -v
0
0.1234567
InsulinCa 1.3v merge
mergeGlucagonCa 1.3v
Reinbothe et al. Figure 1

TT CC
rs312480 rs312480
TC TCCC
30 m
in in
sulin
2[R
esi
dual*
10
]
Insu
lin [ng/is
let*
h]
0
0.5
1.0
1.5
2.0
2.5
a b
*
CC
rs312480
TC
C
a1.3
Exp
r.v
[arb
itr. units
*100] **
c
0 0
7
8
9
5
10
15
20
Reinbothe et al. Figure 2

E
xocy
tosi
sD
Capaci
tance
[fF
]
E
xocy
tosi
sD
Capaci
tance
[fF
]
human
Ca 1.2v
2.8mmol/l glcCa 1.3v
16.7mmol/l glc
*
* * **
*
*
c d
siCa 1.3v
siCa 1.3v
siC
a1.3
v
siCa 1.3v
siCa 1.3vsiContr
siContr
siC
ontr
siC
ontr
+p
eptid
e
siContr
2s
siContr
E
xpre
ssio
n3
[tra
nsc
ripts
*10
]
Insu
lin r
ele
ase
[ng/m
g p
rote
in*h
]
INS-1 832/13 INS-1 832/13
00
1
2
3
4
5
0
0 0
2
20 20
4
4040
6
60
60
8
80
80
100
e f
2+
[Ca
] as
A.U
.C.
iti
g
i
h
0
1234567
-700V [mV]
0
100
Inte
nsi
ty
0
100
Inte
nsi
ty
0
100
Inte
nsi
ty
5gluctime 5 10 5 5
20 5 +5+70K 55
human
5mmol/l glc
5mmol/l
20m glcmol/l
20mmol/l
20m glc+10µmol/l isr.
mol/l
a b
E
xpre
ssio
n[t
ransc
ripts
*100]
*
00
2
4
6
8
1024h in
24h in glc
human
Insu
lin in
batc
h[f
old
of
20/5
glu
c]
*
00
1
2
3
4
5
5m glcmol/l
20m glcmol/l
20m glc+10µmol/l isr.
mol/l
24h in
0
0.2
0.4
0.6
0.8
500 1000 1500 2000
5mmol/l20mmol/l
time [sec]
Ratio
340/3
80
24h in glc
mmol/l5 20 5 5 5
70
per-fusion
0
0.1
1200
*
*
[mmol/l][min]
glc+K
mergeInsulinCa 1.3v Ca 1.3 intensity profilev
Distance
Distance
Distance
Reinbothe et al. Figure 3

20
Table 1 Clinical characteristics of the study participants.
Characteristic Botnia population PPP-Botnia population Malmö case–control population
Controls Controls Controls Cases
n (male/female) 766 (358/408) 4,671 (2,173/2,498) 3,550 (1,340/2,210) 2,830 (1,667/1,163)
Age (years) 49±12 48±15 57±6 63±11
BMI (kg/m2) 28±4 26±4 25±4 28±9
Data are means±STDEV

21
Table 2 Effects of CACNA1D SNP rs312480 on insulin secretion during IVGTT
and OGTT analysed by linear regression.
Study rs312480 (C allele)
β SE p Corr pa
Botnia Family Study
IVGTT
Fasting insulin (pmol/l)b –0.590 0.146 0.027 0.081
30 min insulin (pmol/l)b –0.715 0.160 0.012 0.036
60 min insulin (pmol/l)b –0.583 0.194 0.038 0.114
First-phase insulin
releaseb
0.479 0.201 0.089 0.267
OGTT
Fasting insulin (pmol/l)b –0.486 0.118 0.071 0.213
30 min insulin (pmol/l)b –0.153 0.160 0.578 1.734
60 min insulin (pmol/l)b –0.472 0.160 0.083 0.249
120 min insulin (pmol/l)b –0.257 0.194 0.342 1.026
PPP-Botnia Study
Fasting glucose (mmol/l) 0.005 0.018 0.748 2.244
30 min glucose (mmol/l) 0.013 0.051 0.378 1.134
120 min glucose (mmol/l) –0.010 0.052 0.524 1.572

22
Fasting insulin (pmol/l)b –0.250 0.056 0.001 0.003
30 min insulin (pmol/l)b 0.090 0.056 0.405 1.215
120 min insulin (pmol/l)b 0.042 0.083 0.686 2.058
β indicates directionality
ap value corrected for the number of SNPs analysed
bLoge transformed

23
Table 3 Gene ontology analysis of the genes positively correlating with CACNA1D
expression in control human islets (Pearson’s r≥0.8; 163 genes). The three highest
scoring categories of gene product functions are depicted
Term Fold enrichment p
Exocytosis 5.3 9×10⁻⁴
Axonogenesis 5.3 2×10⁻⁵
Cell morphogenesis
involved in neuron
differentiation
4.9 4×10⁻⁵
Fisher’s exact corrected p values are shown
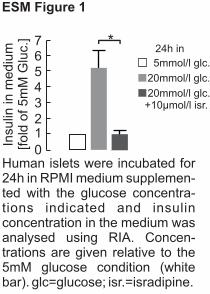
5mmol/l glc.
20mmol/l glc.
20mmol/l glc.+10µmol/l isr.
Insu
lin in
mediu
m[fold
of 5m
M G
luc.
] *
0
1234567
24h in
Human islets were incubated for 24h in RPMI medium supplemen-ted with the glucose concentra-tions indicated and insulin concentration in the medium was analysed using RIA. Concen-trations are given relative to the 5mM glucose condition (white bar). glc=glucose; isr.=isradipine.
ESM Figure 1

ESM Table 1. Primers used for quantitative realtime PCR. SG denotes the realtime PCR method using SYBR Green and TM denotes the Taqman® gene expression assays (Cat. no. of Life Technologies, Carlsbad, CA, USA is given). All were designed across one or two exon-exon boundaries to ensure amplification only of cDNA and not gDNA. Insulin primers were those described previously*. Similar efficiencies (>0.95) and sensitivities were tested for.
mRNA Species Forward primer Reverse primer System
Cacna1c Rat Rn00709287_m1 TM
Cacna1d Rat Rn01453378_m1 TM
CACNA1C Human CTCCTTCAGGAACCATATTCTGTT
GCATTGCCTAGGATCTTCAGAG SG
CACNA1D Human AGGGTAACTCGTCCAACAGC
TGTCAAATGGTTTCCATTCC SG
INS Human GCAGCCTTTGTGAACCAACA
TTCCCCGCACACTAGGTAGAGA SG
ACTB/Actb Human/Rat
TGACCCAGATCATGTTTGAGA
CAGGTCCAGACGCAGGAT SG
References: *Kirkpatrick et al.; PLoS One 5(6), 2010

ESM Table 2: Rationale for selection of SNPs and relevance to previous studies and phenotypes. The 3 SNPs chosen were not in LD with each other. The region analysed was +/-50kbp from CACNA1D. Rs312480 is located in the 5’UTR of exon 1, close to a reported trinucleotide repeat occurring in type 2 diabetes patients1,2. The 5’UTR is a major site for post-transcriptional regulation and has a strong disease relevance3. Rs312486 is positioned in intron 3 and is used as a proxy for rs312481 as assay design for rs312481 failed (LD=1). Rs312481 associates with L-type Ca2+ channel blocker sensitivity in hypertensive subjects5, indicating a genetic effect on Cav1.3 channel function. Both rs312486 and rs312481 exhibit nominal type 2 diabetes association in the DIAGRAM+ study4. Marker rs9841978 is found in intron 8, associates with type 2 diabetes and is in strong LD with other SNPs that associate with type 2 diabetes4,6. Interestingly, the adjacent exon 8 is alternatively spliced (8a/8b). Some of the GWAS data cited is no longer available as supplementary material online, but is available on request from the publishers. DHP, L-type Ca2+ channel blockers of the Dihydropyridine class. T2D, Type 2 diabetes.
SNP ID Study (or name) Associated phenotype p-value Reference rs312480 Functional+Genetic ATG repeat in T2D in exon1;
5’UTR role in disease - 1,2,3
rs312486 DIAGRAM+ Type 2 diabetes 9x10⁻⁴ 4
Kamide et al. Reduced DHP sensitivity in hypertensive subjects
3x10⁻² 5
rs9841978 DIAGRAM+ Type 2 diabetes 6x10⁻³ 4
DGI Type 2 diabetes 1x10⁻² 6
References: 1Yamada et al., Genomics 27(2), 1995; 2Yamada et al., Diabetes Metab Res Rev. 17(3), 2001; 3Pickering and Willis, Semin Cell Dev Biol. 16(1), 2005; 4Voight et al., Nat Genet. 42(2), 2010; 5Kamide et al., Cir J. 73(4), 2009; 6Saxena et al., Science 316(5829), 2007.

ESM Table 3: Effects of CACNA1D SNP rs312486 and rs9841978 on insulin secretion during IVGTT and OGTT. β indicates directionality. SE, Standard error. Corr p, p-value corrected for number of SNPs analysed.
rs312486 (C-allele) rs9841978 (A-allele)
Botnia β SE p corr p β SE p corr p IVGTT
fasting insulin (µU/l)* -0.653 0.153 0.085 0.255 -0.431 0.146 0.27 0.810
30 min insulin (µU/l)* 0.361 0.181 0.369 1.107 -0.403 0.167 0.324 0.972
60 min insulin (µU/l)* -0.097 0.201 0.799 2.397 -0.069 0.188 0.859 2.577
FPIR* -0.097 0.229 0.825 2.475 0.174 0.181 0.7 2.100
OGTT β SE p β SE p
fasting insulin (µU/l)* 0.465 0.139 0.231 0.693 0.271 0.132 0.51 1.530
30 min insulin (µU/l)* -0.021 0.194 0.959 2.877 -0.257 0.174 0.552 1.656
60 min insulin (µU/l)* -0.042 0.188 0.917 2.751 -0.069 0.174 0.874 2.622
120 min insulin (µU/l)* 0.076 0.243 0.86 2.580 0.583 0.222 0.171 0.513
PPP-Botnia β SE p β SE p
fasting glucose (mmol/l) 0.000 0.015 0.976 2.928 -0.014 0.012 0.333 0.999
30 min glucose (mmol/l) -0.004 0.042 0.783 2.349 -0.017 0.035 0.240 0.720
120 min glucose (mmol/l) 0.007 0.043 0.605 1.815 -0.002 0.035 0.892 2.676
fasting insulin (µU/l)* -0.035 0.042 0.728 2.184 0.028 0.035 0.764 2.292
30 min insulin (µU/l)* -0.188 0.049 0.057 0.171 0.063 0.042 0.535 1.605
120 min insulin (µU/l)* -0.069 0.069 0.491 1.473 0.063 0.265 0.531 1.593
*loge transformed


![Regulation of Insulin Secretion II MPB333_Ja… · 2 Glucose stimulated insulin secretion (GSIS) [Ca2+] i V m ATP ADP K ATP Ca V GLUT2 mitochondria GK glucose glycolysis PKA Epac](https://img.dokumen.tips/doc/110x75/5aebd7447f8b9ae5318e3cc6/regulation-of-insulin-secretion-ii-mpb333ja2-glucose-stimulated-insulin-secretion.jpg)