Embed Size (px)
Citation preview

Draft version September 14, 2010Preprint typeset using LATEX style emulateapj v. 03/07/07
THE HST/ACS COMA CLUSTER SURVEY. II. DATA DESCRIPTION AND SOURCE CATALOGS1
Derek Hammer2,3, Gijs Verdoes Kleijn4, Carlos Hoyos5, Mark den Brok4, Marc Balcells6,7, Henry C.Ferguson8, Paul Goudfrooij8, David Carter9, Rafael Guzman10, Reynier F. Peletier4, Russell J. Smith11,
Alister W. Graham12, Neil Trentham13, Eric Peng14,15, Thomas H. Puzia16, John R. Lucey11, Shardha Jogee17,Alfonso L. Aguerri6, Dan Batcheldor18, Terry J. Bridges19, Kristin Chiboucas20, Jonathan I. Davies21, Carlosdel Burgo22,23, Peter Erwin24,25, Ann Hornschemeier3, Michael J. Hudson26, Avon Huxor27, Leigh Jenkins3, ArnaKarick9, Habib Khosroshahi28, Ehsan Kourkchi28, Yutaka Komiyama29, Jennifer Lotz30, Ronald O. Marzke31,
Irina Marinova17, Ana Matkovic8, David Merritt18, Bryan W. Miller32, Neal A. Miller33,34, BahramMobasher35, Mustapha Mouhcine9, Sadanori Okamura36, Sue Percival9, Steven Phillipps26, Bianca M.
Poggianti37, James Price26, Ray M. Sharples11, R. Brent Tully38, Edwin Valentijn4
Draft version September 14, 2010
ABSTRACT
The Coma cluster, Abell 1656, was the target of a HST-ACS Treasury program designed for deepimaging in the F475W and F814W passbands. Although our survey was interrupted by the ACSinstrument failure in early 2007, the partially-completed survey still covers ∼50% of the core high-density region in Coma. Observations were performed for twenty-five fields that extend over a widerange of cluster-centric radii (∼1.75 Mpc or 1 deg) with a total coverage area of 274 arcmin2. Themajority of the fields are located near the core region of Coma (19/25 pointings) with six additionalfields in the south-west region of the cluster. In this paper we present reprocessed images and SEx-tractor source catalogs for our survey fields, including a detailed description of the methodologyused for object detection and photometry, the subtraction of bright galaxies to measure faint un-derlying objects, and the use of simulations to assess the photometric accuracy and completeness ofour catalogs. We also use simulations to perform aperture corrections for the SExtractor Kronmagnitudes based only on the measured source flux and its half-light radius. We have performedphotometry for ∼73,000 unique objects; approximately one-half of our detections are brighter thanthe 10σ point-source detection limit at F814W=25.8 mag (AB). The slight majority of objects (60%)are unresolved or only marginally resolved by ACS. We estimate that Coma members are 5-10% ofall source detections, which consist of a large population of unresolved compact sources (primarilyglobular clusters but also ultracompact dwarf galaxies) and a wide variety of extended galaxies from acD galaxy to dwarf low surface brightness galaxies. The red sequence of Coma member galaxies has acolor-magnitude relation with a constant slope and dispersion over nine magnitudes (-21<MF814W <-13). The initial data release for the HST-ACS Coma Treasury program was made available to thepublic in August 2008. The images and catalogs described in this study relate to our second datarelease.Subject headings: galaxies: clusters – instrument: HST: ACS
1 Based on observations with the NASA/ESA Hubble SpaceTelescope obtained at the Space Telescope Science Institute,which is operated by the association of Universities for Researchin Astronomy, Inc., under NASA contract NAS 5-26555. Theseobervations are associated with program GO10861.
2 Department of Physics and Astronomy, Johns Hopkins Uni-versity, 3400 North Charles Street, Baltimore, MD 21218, USA.
3 Laboratory for X-Ray Astrophysics, NASA Goddard SpaceFlight Center, Code 662.0, Greenbelt, MD 20771, USA.
4 Kapteyn Astronomical Institute, University of Groningen, POBox 800, 9700 AV Groningen, The Netherlands.
5 School of Physics and Astronomy, The University of Notting-ham, University Park, Nottingham, NG7 2RD, UK.
6 Instituto de Astrofısica de Canarias, 38200 La Laguna, Tener-ife, Spain.
7 Isaac Newton Group of Telescopes, Apartado 321, 38700 SantaCruz de La Palma, Spain.
8 Space Telescope Science Institute, 3700 San Martin Drive,Baltimore, MD 21218, USA.
9 Astrophysics Research Institute, Liverpool John MooresUniversity, Twelve Quays House, Egerton Wharf, BirkenheadCH41 1LD, UK.
10 Department of Astronomy, University of Florida, PO Box112055, Gainesville, FL 32611, USA.
11 Department of Physics, University of Durham, South Road,Durham DH1 3LE, UK.
12 Centre for Astrophysics and Supercomputing, Swinburne
University of Technology, Hawthorn, VIC 3122, Australia.13 Institute of Astronomy, Madingley Road, Cambridge CB3
0HA, UK.14 Department of Astronomy, Peking University, Beijing 100871,
China.15 Kavli Institute for Astronomy and Astrophysics, Peking
University, Beijing 100871, China.16 Plaskett Fellow, Herzberg Institute of Astrophysics, National
Research Council of Canada, 5071 West Saanich Road, Victoria,BC V9E 2E7, Canada.
17 Department of Astronomy, University of Texas at Austin, 1University Station C1400, Austin, TX 78712, USA.
18 Department of Physics, Rochester Institute of Technology, 85Lomb Memorial Drive, Rochester, NY 14623, USA.
19 Department of Physics, Engineering Physics and Astronomy,Queen’s University, Kingston, Ontario K7L 3N6, Canada.
20 Gemini Observatory, 670 N. A’ohoku Pl, Hilo, HI 9672021 School of Physics and Astronomy, Cardiff University, The
Parade, Cardiff CF24 3YB, UK.22 UNINOVA-CA3, Campus da Caparica, Quinta da Torre,
Monte de Caparics 2825-149, Caparica, Portugal.23 School of Cosmic Physics, Dublin Institute for Advanced
Studies, Dublin 2., Ireland.24 Max-Planck-Institut fur Extraterrestrische Physik, Giessen-
bachstrasse, D-85748 Garching, Germany.25 Universitatssternwarte, Scheinerstrasse 1, 81679 Munchen,
Germany.

2 Hammer et al.
1. INTRODUCTION
The Coma cluster has been the subject of numeroussurveys from X-ray to radio owing to its richness (AbellClass 2; Abell et al. 1989), proximity (z ∼ 0.023), and ac-cessibility at high Galactic latitude (b ∼ 88 deg). Comamember galaxies have been critical to our understand-ing of galaxy formation and evolution in dense environ-ments, and provide a local benchmark for comparativestudies of galaxy evolution in different environments andat higher redshift (e.g. the morphology-density relationand the Butcher-Oemler effect; Dressler 1980; Butcher& Oemler 1984). However, the properties of intrinsi-cally faint objects in the Coma cluster are not yet wellcharacterized compared to other local clusters such asVirgo and Fornax. The resolution and sensitivity af-forded by the Hubble Space Telescope-Advanced Camerafor Surveys (HST-ACS; Ford et al. 1998) has allowed fordetailed studies of faint and compact systems in Coma(Carter et al. 2008, hereafter Paper I), such as measur-ing the structural parameters of dwarf galaxies (Hoyos etal. 2010, in prep, hereafter Paper III), constraining theglobular cluster population (Peng et al. 2010, submitted,hereafter Paper IV), studying the nature of compact el-liptical galaxies (Price et al. 2009, hereafter Paper V)and ultra-compact dwarf galaxies (UCDs), and estab-lishing membership for faint cluster member galaxies bymorphology.
The ACS Coma Cluster Treasury survey was initiatedin HST Cycle 15 following the success of the ACS clustersurveys performed in Virgo (Cote et al. 2004) and Fornax(Jordan et al. 2007). In contrast to the Virgo and Fornaxsurveys that targeted individual early-type galaxies, theComa fields were arranged to maximize spatial coverageat the cluster core as well as provide targeted observa-tions at an off-center region of Coma. The advantageof this observing strategy is that it allows for statisticalmeasurements of faint cluster members (e.g. the lumi-nosity function; Trentham et al. 2010, in prep, hereafterPaper VI) while also probing the effects of the cluster en-
26 Department of Physics and Astronomy, University of Water-loo, 200 University Avenue West, Waterloo, Ontario N2L 3G1,Canada.
27 Astrophysics Group, H. H. Wills Physics Laboratory, Univer-sity of Bristol, Tyndall Avenue, Bristol BS8 1TL, UK.
28 School of Astronomy, Institute for Research in FundamentalSciences (IPM), P.O. Box 19395-5531, Tehran, Iran.
29 Subaru Telescope, National Astronomical Observatory ofJapan, 650 North A‘ohoku Place, Hilo, HI 96720, USA.
30 Leo Goldberg Fellow, National Optical Astronomy Observa-tory, 950 North Cherry Avenue, Tucson, AZ 85719, USA.
31 Department of Physics and Astronomy, San Francisco StateUniversity, San Francisco, CA 94132-4163, USA.
32 Gemini Observatory, Casilla 603, La Serena, Chile.33 Department of Astronomy, University of Maryland, College
Park, MD, 20742-2421, USA34 Jansky Fellow of the National Radio Astronomy Observatory.
The National Radio Astronomy Observatory is a facility ofthe National Science Foundation operated under cooperativeagreement by Associated Universities, Inc.
35 Department of Physics and Astronomy, University of Califor-nia, Riverside, CA, 92521, USA
36 Department of Astronomy, University of Tokyo, 7-3-1 Hongo,Bunkyo, Tokyo 113-0033, Japan.
37 INAF-Osservatorio Astronomico di Padova, Vicolodell’Osservatorio 5, Padova I-35122, Italy.
38 Institute for Astronomy, University of Hawaii, 2680 Wood-lawn Drive, Honolulu, HI 96822, USA.
vironment across a wide range of cluster-centric distance.Although the Coma cluster is located at a distance of 100Mpc (5-6 times more distant than Virgo and Fornax),the spatial resolution afforded by HST-ACS is similar tocurrent ground-based observations of Virgo and Fornax(∼50 pc).
The ACS Coma Cluster Treasury survey was awarded164 orbits (82 fields), although the survey was only 28%complete when interrupted by the ACS failure in early2007. A description of the observing program and im-age reductions is provided in Paper I. In this paper, thesecond in the series, we present SExtractor catalogsfor our ACS observations. The catalogs include astro-metric and photometric data for ∼73,000 source detec-tions, as well as basic object classifications (i.e. extendedgalaxy or point source). The majority of detections arebackground galaxies, although we detect several thou-sand globular clusters (GCs) and several hundred galax-ies that are likely members of the Coma cluster. Thecatalogs do not provide an exhaustive list of extendedgalaxies in Coma, especially for the faintest low surfacebrightness (LSB) galaxies, for which visual inspection ofthe images is more successful than automated detection.
This paper is organized as follows: imaging data andcalibrations in Section 2, the methodology for creatingsource catalogs, including a treatment of bright galax-ies in Section 3, and simulations to estimate the com-pleteness and photometric accuracy of the source cat-alogs in Section 4. As described in Paper I, we assumethat the Coma cluster is located at a distance of 100 Mpc(z = 0.0231), which corresponds to a distance modulusof 35.00 mag and angular scale of 0.463 kpc arcsec−1 forH0= 71 km s−1Mpc−1, ΩΛ=0.73, and ΩM =0.27.
2. DATA
We refer the reader to Paper I for a detailed descrip-tion of the observing strategy, science objectives, and theimage pipeline for the HST-ACS Coma Cluster TreasurySurvey. Here we provide only a brief summary of thesurvey. The ACS Wide Field Camera, with a field ofview of 11.3 arcmin2, imaged the Coma cluster in 25fields with the F475W and F814W filters. The footprintof our ACS observations is shown in Figure 1 (rvir=2.9Mpc or 1.7 deg; Lokas & Mamon 2003). The major-ity of the survey fields (19 of 25) are located within 0.5Mpc (0.3 deg) of the center of Coma39, mainly coveringthe regions around the two central galaxies NGC 4874and NGC 4889 (although NGC 4889 was not observed).Six additional fields are located between 0.9-1.75 Mpc(0.5-1.0 deg) south-west of the cluster center. The coreand south-west regions of the Coma cluster are some-times referred to as ‘Coma-1’ and ‘Coma-3’, respectively(Komiyama et al. 2002).
Processed images and initial source catalogs for theACS Coma Cluster Treasury program were released inAugust 2008 (Data Release 1)40. This paper describesthe images and source catalogs provided in Data Release2.1 (DR2.1), which includes several enhancements to theinitial release such as: (a) improved alignment betweenF814W and F475W images and thus aperture-matched
39 The center of the Coma cluster is taken as the location of thecentral cD galaxy, NGC 4874 (α=194 .89874 and δ = 27.95927).
40 Available from Astro-WISE (www.astro-wise.org/projects/COMALS/ACSdata.shtml).

The HST/ACS Coma Cluster Survey. II. 3
color information, (b) more reliable photometry for ex-tended galaxies, (c) refinement of the image astrometry,(d) application of aperture corrections to the SExtrac-tor photometry, and (e) subtraction of bright galaxiesto recover faint underlying objects.
2.1. Drizzled Images
The nominal observing sequence for each field consistsof four dither positions (‘DITHER-LINE’ pattern type)each having an exposure time of 350 s and 640 s forthe F814W and F475W filters, respectively. Only twodither positions are available across the ACS inter-CCDchip gap resulting in a degraded 3′′ band that runs hor-izontally across the center of every image. Four fieldswere observed with less than four dither positions dueto the failure of the ACS instrument while the sequencewas partially complete. In Table 1 we list the details foreach field including a unique identifier given by the HSTvisit number, coordinates, image orientation, number ofdithers, and the integrated exposure time in each band.
The dithered exposures were individually dark- andbias-subtracted, and flat-fielded through the standardHST-CALACS pipeline software. The MultiDrizzle soft-ware (Koekemoer et al. 2002) was used to combinethe dither positions and create a final image. Thesteps in the MultiDrizzle process include (a) aligningthe dithered exposures, (b) identifying cosmic rays us-ing a median filter and ‘cleaning’, (c) weighting pixelsfrom the individual dithers by the inverse variance ofthe background/instrumental noise, and (d) mapping theweighted exposures to an output grid with a pixel size of0.′′05 (pixfrac=0.8 and scale = 1.0).
The identification of cosmic rays by the MultiDrizzlesoftware was inefficient in regions of the image not cov-ered by the full dither pattern. The lacosmic routine(van Dokkum 2001) was therefore used to assist withcosmic ray identification within the ACS chip gap andalso across the full image for fields with less than fourdither positions. A side effect of the lacosmic routineis that pixels associated with extreme surface brightnessgradients in the image may be erroneously assigned large(negative or positive) values. Although this affects onlya small number of pixels, we have corrected these pixelsin the DR2 images by replacing their values with the lo-cal median. Owing to erratic behavior, we do not applylacosmic to regions at the image edge not covered by thefull dither pattern, thus the majority of remaining cosmicrays found in DR2 images are located in these regions.
2.2. Relative Astrometry
A slight spatial offset between F475W and F814W im-ages (∼0.3 pixels) was discovered soon after the initialdata release. This offset has a non-negligible effect onthe aperture-matched color measurements of unresolvedor marginally resolved objects. Images were realignedby measuring the residual shift between the F475W andF814W frames using compact sources as a reference, andthen re-drizzling the F475W band to match the originalF814W image. For three fields (visits 3, 10, and 59), itwas necessary to re-drizzle the images in both filters to acommon pixel position. The DR2 images are now alignedto within ∼0.05 pixels along each axis.
2.3. Absolute Astrometry
A two-step process was used to calculate the astrome-try for each ACS image, starting with the solution calcu-lated by MultiDrizzle and then performing a fine adjust-ment using the Scamp software (v1.4; Bertin 2006). Theinitial spatial registration of images was calculated withMultiDrizzle using reference stars in the HST Guide StarCatalog. Astrometry solutions were reliable to only ∼1′′
(1σ rms offset, as compared to the SDSS coordinate sys-tem) owing to the dearth of reference stars in the Comafields, which are located at high Galactic latitude (b ∼ 88deg).
Second pass solutions for the image astrometry wereperformed using Scamp with the goal of aligning ACSimages to the Sloan Digital Sky Survey (SDSS) coordi-nate system. Both stars and galaxies from SDSS DR6were selected as reference objects, which increased theACS and SDSS matched sample to 18-36 objects foreach field. We excluded saturated stars, ACS objectsthat were blended with nearby sources, or objects lo-cated in regions of the ACS image with reduced ex-posure time. Astrometry solutions were calculated foreach field using a range of values for the Scamp in-put parameters CROSSID RADIUS, ASTRCLIP NSIGMA, andFWHM THRESHOLDS. We forced Scamp to solve the ACSastrometry without using higher order distortion terms(DISTORT DEGREES = 1) as these values are well con-strained by the HST-ACS pipeline (Meurer et al. 2003).We chose the Scamp configuration that gave the ‘best’reduced chi-squared fit (between 0.9 <
∼χ2 <
∼1.2) and the
smallest final offset between ACS and SDSS referenceobjects.
This procedure was performed in the F814W band andthe astrometry solutions were applied to images in bothfilters. The ACS images are now aligned to the SDSSsystem with a 1σ rms spread of 0.1-0.2′′ for each coordi-nate, which is consistent with the precision of the SDSSastrometry for extended objects (Pier et al. 2003).
2.4. RMS Maps
We created RMS maps for every image that are used toestablish the detection threshold for source identificationand to derive photometric errors. The RMS maps wereconstructed from the inverse-variance maps produced byMultiDrizzle, which are stored in the [WHT] extensionof the fits images. The WHT maps estimate the back-ground and instrumental uncertainties related to the flat-field, dark current, read noise, and the effective exposuretime across the image.
We must, however, apply a correction to the RMSmaps in order to derive accurate photometric errors,i.e., the single-pixel RMS values cannot be summed inquadrature because MultiDrizzle introduces a correlationof the noise in neighboring pixels (see Fruchter & Hook2002). We therefore apply a scaling factor to the RMSmap to recover its uncorrelated value over length scaleslarger than a few pixels (e.g. Casertano et al. 2000). Thecorrected RMS map is given by:
RMS =1√
WHT × f, (1)
where f is the scalar correction for correlated noise, com-monly referred to as the ‘variance reduction factor’.
We have measured the variance reduction factor fora subset of our images by selecting a relatively empty
4 Hammer et al.
512x512 pixel region inside each image, then we performthe following steps: (a) normalization of the pixels by theeffective exposure time, (b) masking of real objects iden-tified using a median filter, (c) measurement and sub-traction of the background, and (d) photometry on itsautocorrelation image in order to measure the peak pixelflux relative to the total flux, e.g. the correlation factoris f=peak/total, where a value of 1 indicates that theimage is uncorrelated at any pixel scale. We have mea-sured the correction factor for a subset of images in bothfilters, recovering an average value of f=0.77 ± 0.08 (1σrms). The average value is applied to all WHT mapsas the correction factor depends primarily on the choiceof MultiDrizzle parameters pixfrac and scale (which areconstants in our image pipeline).
2.5. Flag Maps
Flag maps were created for every image in order toidentify pixels with low effective exposure time. The ef-fective exposure time varies abruptly across each imageowing to regions that are only partially covered by thedither pattern. These regions include the ACS chip gapand the image border, which cover 5-10% of the totalimage area. We have added additional flags to identifypixels that may be affected by very bright galaxies (de-scribed in §3.1) and for pixels in close proximity to theimage edge. We have assigned a single binary-coded flagvalue to each pixel that indicate the following: [1] as-sociated with a bright galaxy, [2] located within 32 pix-els of the image edge, [4] an effective exposure time lessthan 2/3 the total integration time, and [8] zero effectiveexposure. The order was chosen such that higher flagscorrespond to regions of the image where object detec-tion and photometry are more likely to have systematiceffects.
The main purpose of the flag maps is to identify largeregions of each image with similar completeness limits.We note that cosmic rays cleaned by MultiDrizzle oftenleave a few pixels with low effective exposure, but havelittle impact on the ability to detect underlying sources.To avoid flagging these pixels, we applied a 7-pixel me-dian filter to the effective exposure map prior to imposingthe low-exposure criteria. A few heavily-cleaned cosmicray events remain flagged in each map.
3. SOURCE CATALOGS
The DR2.1 source catalogs were created using theSExtractor software (version 2.5; Bertin & Arnouts1996). SExtractor was operated in ‘dual-image mode’which uses separate images for detection and photome-try. Dual-image mode allows for a straightforward con-solidation of multi-band photometry into a single sourcecatalog, and allows for aperture-matched color measure-ments. The F814W band was chosen as the detection im-age for both filters because it offers higher S/N for mostsources, and results in less galaxy ‘shredding’ (i.e. a sin-gle source is deblended into multiple objects) as galaxystructure tends to be less ‘clumpy’ in F814W as com-pared to the F475W band. Object detection was per-formed on a convolved version of the detection image(gaussian kernel of FWHM=2.5 pixels) to limit the num-ber of spurious detections. We used the background RMSmaps (§2.4) to weight the detection threshold across the
convolved image, which allows for more reliable detec-tions at faint magnitudes.
SExtractor performs source detection using a ‘con-nected pixel’ algorithm, i.e., a detection is registeredwhen a specified number of contiguous pixels satisfiesthe detection threshold (set by the DETECT MINAREA andDETECT THRESH parameters). It then performs a sec-ond pass analysis of source detections to identify anddeblend objects that are connected on the sky (set pri-marily by the DEBLEND MINCONT and DEBLEND NTHRESH
parameters). Values for the detection and deblend pa-rameters were chosen after testing a wide range of valuesand verifying by visual inspection that obvious sourceswere detected while minimizing the number of spuriousdetections. We used a two-fold approach for estimat-ing the background: a LOCAL background estimate (per-formed inside a 64-pixel thick annulus around each ob-ject) is taken for the majority of sources, and a GLOBAL
background estimate with a large mesh (BACK SIZE=256)is used for extended galaxies with half-light radii largerthan 1′′. The LOCAL background estimate avoids smooth-ing over local fluctuations in the background, while theGLOBAL background calculation prevents an overestimateof the background owing to flux in the wings of bright ex-tended galaxies (primarily Coma member galaxies). Thefull set of SExtractor parameters adopted for this studyare presented in Table 1 of the Appendix.
Two sets of flags are provided for each object detec-tion: the internal SExtractor flags and the expo-sure/location flags described in §2.5. The latter flag val-ues are calculated by using the bitwise inclusive OR op-eration across pixels in the flag map that satisfied thedetection threshold. The resulting flag values are givenby the IMAFLAGS ISO field in the source catalogs, and thetotal number of flagged pixels is given by NIMAFLAGS ISO.A description of these flags is provided in Table 2 of theAppendix.
SExtractor photometry was performed using a va-riety of apertures, such as (a) isophotal apertures whichmeasure the flux only in pixels that satisfy the detectionthreshold (i.e. MAG ISO magnitudes, which are recom-mended for color measurements), (b) adjustable ellipticalapertures that are scaled according to the isophotal lightprofile (e.g. MAG AUTO Kron apertures and MAG PETRO
Petrosian apertures), and (c) a set of nine fixed cir-cular apertures with radii extending between 0.′′06-6.0.Magnitudes are reported in the instrumental F475Wand F814W AB magnitude system. We use magni-tude zeropoints of 26.068 and 25.937 for the F475W andF814W bands, respectively, which were calculated sepa-rately for each visit (but resulting in identical zeropoints)following the procedure in the ACS Data Handbook(their Section 6.1.1). SExtractor estimates the pho-tometric errors by adding in quadrature both the back-ground/instrumental errors taken from the RMS mapsand the Poisson errors for the measured source counts.Although we do not correct the SExtractor magni-tudes for Galactic extinction, the catalogs include theGalactic E(B − V ) color excess for each source as takenfrom the Schlegel et al. (1998) reddening maps. TheSExtractor photometry is limited at bright magni-tudes by saturated pixels which may be identified usingthe internal SExtractor flags. The majority of pointsources brighter than F814W=19 mag (F475W=20)

The HST/ACS Coma Cluster Survey. II. 5
have saturated pixels, while extended galaxies may besaturated at magnitudes brighter than F814W=15 (noextended galaxies have saturated pixels in the F475Wband).
Source catalogs were created separately for each visit.The ACS fields in the central region of Coma have smalloverlap (see Figure 1), thus there are duplicate detec-tions near the edges of these images. For the purposeof discussing properties of the total source population,we have concatenated source catalogs from the individ-ual visits using a 0.′′6 search radius to identify duplicatedetections (0.′′6 roughly corresponds to the 3σ rms un-certainty of our image astrometry); for each match, wekeep the source with a more reliable exposure flag, elsewe keep the source with the highest S/N. The duplicatedetections (∼1500 object pairs), unfortunately, do notprovide a reliable check of the SExtractor photome-try as 95% of pairs have edge and/or low-exposure flags,and the remaining objects occupy only a small magni-tude range at F814W >
∼ 25.5 mag.After removing duplicate detections, the catalog con-
sists of ∼73,000 unique objects with a magnitude distri-bution as shown in Figure 2. The raw number countspeak at F814W≈27 and F475W≈27.5 mag, and fall offrapidly at fainter magnitudes. The average signal-to-noise (S/N) ratio for the SExtractor detections is pro-vided in Figure 3, shown as contours on a magnitude-sizediagram. Object size is taken as the SExtractor half-light radius in the F814W band (FLUX RADIUS 3), whichis the size of the circular aperture that encloses 50% ofthe flux in the Kron aperture. The S/N spans a widerange at a given magnitude owing to intrinsic differencesbetween LSB galaxies detected in the foreground Comacluster and the background galaxies detected at highersurface brightness. We estimate that ∼5-10% of all de-tection are located inside the Coma cluster (discussed in§5.0). Point sources extend horizontally along the bot-tom of Figure 3, which have a 10σ (5σ) point-source de-tection limit at F814W≈25.8 (26.8) mag, respectively.
3.1. Bright Galaxy Subtraction
We have subtracted the light distribution from brightgalaxies in DR2 images in order to improve object de-tection and photometry for faint underlying sources(e.g. dwarf galaxies, GCs). The candidates for lightsubtraction are the 31 Coma member galaxies thathave magnitudes brighter than F814W=15.0. We mod-eled their light distribution using the software packageGALPHOT (Franx et al. 1989) within the Astro-WISEsystem (Valentijn et al. 2007). GALPHOT was chosenbecause it is a well-defined standard for isophote fitting(e.g. Jorgensen et al. 1995) and has provided reliable fitsfor galaxies in HST images (e.g. Sikkema et al. 2007; Bal-cells et al. 2007). GALPHOT uses harmonic fitting forelliptical and higher-order isophotal light models whichhas the advantage of not requiring an initial guess (e.g. ascompared to the IRAF task ELLIPSE); note that we fitbright galaxies in visit-19 using both GALPHOT andELLIPSE and visually confirmed that only negligible dif-ferences exist between their residual images.
Objects located inside the light distribution of the tar-get galaxy were masked prior to performing our fittingprocedure and fits were performed inside image cutoutsof each galaxy. We selected the optimal light model by
visual inspection of the residual images, and truncatedthe best-fitting model at the location where it is indistin-guishable from the background noise. The best-fit lightmodel was subtracted and the cutout was inserted backinto the original image. We could not obtain a satisfac-tory solution for three bright galaxy candidates: one spi-ral galaxy was too irregular to be modeled with ellipticalisophotes, and the other two galaxies were overlappingthus preventing a good solution. Basic properties of theremaining 28 galaxies are listed in Table 2.
In order to perform reliable source detection withinregions of galaxy subtraction, we have corrected the RMSmaps to account for photon noise from the bright galaxyand fitting errors. Specifically, we added the followingterm σ2
GSub to the variance map:
σ2GSub = 1.05 × σ2
poisson, (2)
where σpoisson is the Poisson noise taken from the lightdistribution model, and we have added an additional 5%error to account for an imperfect fit (e.g. Del Burgo et al.2008). We ran SExtractor on the galaxy-subtractedimages (with the updated RMS maps) using a config-uration that is otherwise identical to that used for theoriginal images.
New source detections were merged with the originalsource catalog using the following procedure. We de-fined a circular annulus for each subtracted galaxy withan inner and outer radius (rmin, rmax) as listed in Ta-ble 2. We added to our final source catalog all sourcesfrom the galaxy-subtracted catalog that are located inthe annulus. For duplicate detections in the annulus, weadopt photometry from the galaxy-subtracted analysis.Objects located within the inner radius were removed aslarge systematic residuals prevent the reliable detectionof sources. At locations beyond the outer radius, we re-tain the original measurements as both methods includevirtually the same real sources. Figure 4 shows a pairoverlapping galaxies both before and after performinggalaxy subtraction, including the location of original andnew source detections. As a result of subtracting brightgalaxies, we have recovered 3291 additional sources thatwere detected out to 45′′ from the centers of the brightgalaxies.
3.2. Object Classification
In the following section we present an initial attemptto classify objects, real or otherwise, in the DR2 sourcecatalogs. Object classifications are stored in the catalogFLAGS OBJ parameter. A thorough description of theseclassifications is given below, and a summary of the flagvalues is also provided in the Appendix. We also dis-cuss spurious sources in our catalogs owing to inaccurategalaxy separation and the chance alignment of randomnoise.
3.2.1. Extended Galaxies and Point Sources
The SExtractor CLASS STAR parameter, or stellar-ity index, is a dimensionless value that classifies objectsas extended or point-like based on a neural network anal-ysis that compares the object scale and the image PSF.The parameter varies between 0-1, such that extendedobjects have values near 0 and point-like objects arecloser to 1; less reliable classifications are assigned mid-range values. The galaxy/point source classification is

6 Hammer et al.
improved by also considering the 50% light radius mea-sured in the F814W band. Specifically, we classify asextended galaxies those objects with CLASS STAR<0.5and FLUX RADIUS 3>2.5 pixels (2.5 pix=0.′′125, or 61 pcat the distance of Coma). These objects are assignedFLAGS OBJ=0. Objects that do not meet this criteria areconsidered point sources and are assigned FLAGS OBJ=1.From visual inspection we estimate that this classifica-tion scheme is ∼95% reliable for objects brighter thanF814W=24.0 mag. The CLASS STAR parameter is notreliable at fainter magnitudes, thus we use the 50% lightradius criteria alone to classify these objects. Accordingto this classification scheme, the slight majority of alldetections are unresolved (60%).
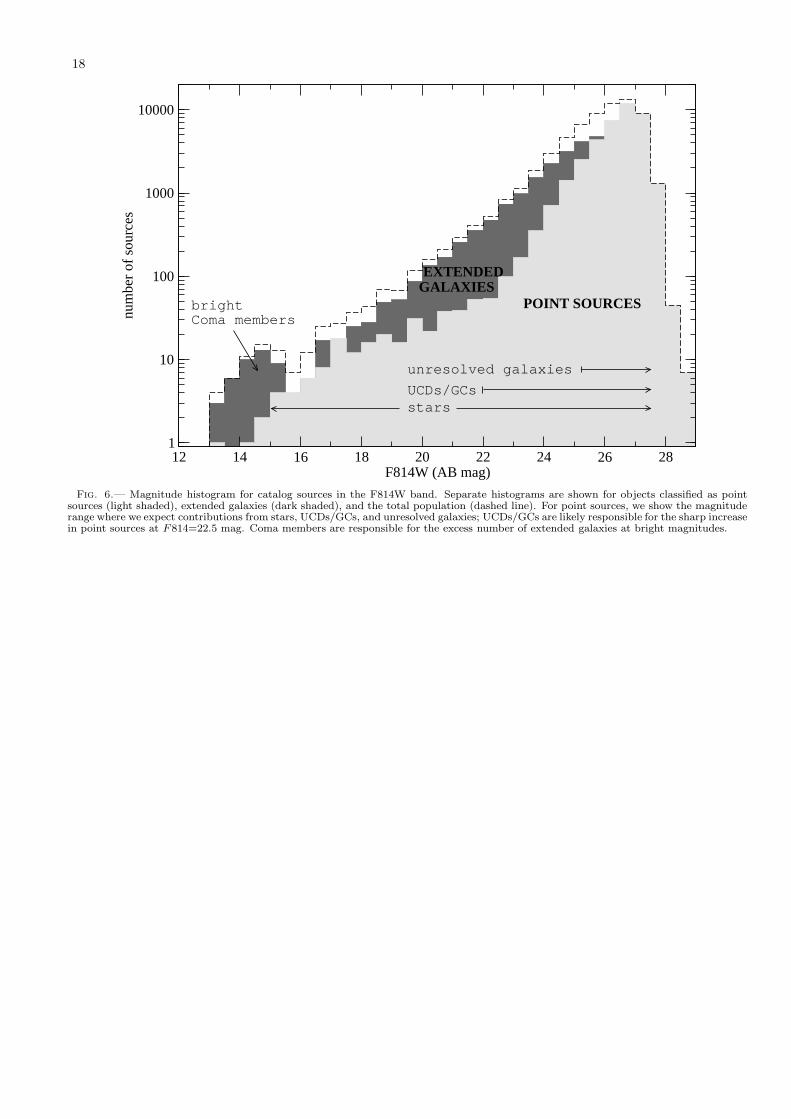
In Figure 5, we have plotted catalog sources in amagnitude-size diagram separated as extended galax-ies and point sources. We have visually inspected ob-jects that lie outside their typical magnitude-size pa-rameter space, and adjusted FLAGS OBJ for sources thatwere obviously misclassified. Our classification schemeclearly separates extended galaxies and intrinsically com-pact sources at magnitudes brighter than F814W≈25; atfainter magnitudes, the point source class includes an in-creasing population of unresolved galaxies. This can beseen more clearly from the magnitude histogram for ex-tended galaxies and point sources shown in Figure 6. Thehistogram for the extended galaxy population flattens atF814W=25 mag, or ∼1-1.5 mag brighter than the totalsource population, owing to a higher fraction of unre-solved galaxies. The relatively sharp increase in the pointsource population at magnitudes fainter F814W=22.5may initially reflect the UCD population in the Comacluster (Chiboucas et al. 2010, in press), and then thelarge number of GCs in the cluster with F814W >
∼ 24 mag(Paper IV).
3.2.2. Cosmic Rays
Although the majority of cosmic rays were removedduring assembly of the final images, a small fraction re-main in our catalogs, especially in areas not covered bythe full dither pattern. Cosmic rays typically appear ascompact detections that are bright in the F814W imagebut with no counterpart in the F475W band. As such,we found that cosmic rays may be identified by select-ing candidates with characteristic sizes smaller than theACS point-spread function (FWHM IMAGE < 2.4 pixels),and then selecting objects with MAG ISO colors redderthan F475W -F814W=3. Since we perform source de-tection in the F814W band alone, our catalogs are notwell suited for identifying cosmic rays in the F475W im-ages.
Using the above criteria, we identified 18-619 cosmicray candidates per ACS image at magnitudes brighterthan F814W=26.5. We visually inspected the cosmicray candidates and identified 2-10 real objects per image(primarily stars); the remaining cosmic ray candidatesare flagged in our source catalogs (FLAGS OBJ = 2). Wefound that cosmic rays are 12-25% of all detections inthe border regions not covered by the full dither pattern,but are only ∼1% of objects detected in other regions ofthe image; one notable exception is visit-12 where ∼50%(6%) of objects are cosmic rays in these regions of theimage, respectively.
3.2.3. Image Artifacts
We have visually identified a small number of detec-tions in our source catalogs that correspond to imageanomalies such as diffraction spikes and ‘ghost’ imagesfrom bright stars. For instance, a diffraction spike ex-tends horizontally across the entire image for visit-13 dueto a bright star located just outside the field of view. Wehave flagged detections that are a direct consequence ofimage artifacts or real sources whose photometry may besignificantly affected by these features (FLAGS OBJ=3).
3.2.4. Galaxy Shredding
We selected values for the SExtractor deblendingparameters that minimize the fraction of shredded galax-ies, and also result in roughly the same number of shred-ded objects as false blended objects for faint field galaxiesin ACS images (∼5-10% of detections across F814W=23-27 mag are affected by object shredding or blending;Benıtez et al. 2004). The balance between shredded andblended objects does not apply to the regions near brightextended galaxies in the Coma cluster, which tend to in-clude more galaxy shreds; this is especially the case in-side the extended halos of the bright early-type galaxies,where we observe the largest fraction of galaxy shreds.Such galaxy shreds have little impact on the photometryof the much brighter parent galaxy but result in spuriousdetections in our catalogs. We have limited the numberof spurious detections by subtracting the light distribu-tion of the 28 brightest galaxies. This procedure, how-ever, did not remove all galaxy shreds associated withthe bright galaxy sample, and many examples remain inour catalogs near galaxies with intermediate magnitudes.
3.2.5. Random Noise
Spurious detections may result from the chance align-ment of random noise fluctuations. We have estimatedthe fraction of such detections by running SExtractor oninverted images, which should give a reasonable estimateprovided that the noise is symmetrical. This analysis ap-plies to empty regions of the image, as it was necessary tomask sources prior to running SExtractor on the in-verted image. We found that <
∼ 1% of detections are ran-dom noise at magnitudes brighter than F814W=27.0,but with a rapid increase at fainter magnitudes. Theexception occurs within regions not covered by the fulldither pattern for images with fewer than 4 dither po-sitions (visits 3,12,13,14); in these cases, >
∼ 10% of de-tections are random noise at magnitudes fainter thanF814W=25.0.
3.3. Magnitude Comparison with Previous Surveys
We have compared our catalog to previous optical sur-veys as a check on the accuracy of the SExtractorphotometry. Several optical photometric surveys havebeen performed in the Coma cluster (e.g. Godwin et al.1983; Terlevich et al. 2001; Komiyama et al. 2002), butwe limit this comparison to the surveys with I-band ob-servations that closely match the ACS F814W band, suchas the CFHT deep-field coverage of the central region inComa (Adami et al. 2006a) and SDSS DR6 wide-fieldcoverage of Coma (Adelman-McCarthy et al. 2008). Wematched ACS-CFHT galaxies using a 3′′ search radiusand ACS-SDSS galaxies with a 0.′′6 radius, and limited

The HST/ACS Coma Cluster Survey. II. 7
the comparison to ACS regions with nominal exposuretime and objects with no SExtractor flags.
In Figure 7, we show the magnitude offset betweenour photometry and both CFHT and SDSS as a func-tion of F814W magnitude. The Adami et al. (2006a)CFHT observations are significantly deeper and havebetter spatial resolution than SDSS, resulting in less scat-ter at a given ACS magnitude. The ACS-CFHT magni-tude comparison shows systematic offsets at both brightand faint magnitudes. From visual inspection, the faintmagnitude offset results from both blended objects inthe Adami et al. (2006a) catalog or shredded galaxiesin our catalog. The offset at bright magnitudes likelyresults from saturated galaxies in the CFHT observa-tions, which Adami et al. (2006a) had replaced withmeasurements from previous studies. In contrast, theACS-SDSS photometry have good agreement at brightmagnitudes (F814W≤17), but the systematic offset atfainter magnitudes indicates that the SDSS flux maybe slightly underestimated. For objects with unreliableACS measurements, we therefore recommend adoptingthe SDSS photometry at bright magnitudes (F814W≤17mag; F814WAB=SDSSi−0.01 ± 0.05) and CFHT pho-tometry for fainter sources (17<F814W<22.75 mag;F814WAB=CFHTI+0.47 ± 0.06-0.20 across this mag-nitude range).
4. SIMULATIONS
We have tested the reliability of the SExtractorphotometry and assessed the completeness limits of oursource catalog by injecting synthetic sources onto theACS images and re-running our photometry pipeline.Specifically, we used the galfit software (Peng et al.2002) to generate a suite of synthetic Sersic models thatuniformly span a large range in magnitude (F814=20-29,F475=21-30), effective radius (Reff =0.5-60 pix), Sersicindex (nSer=0.8-4.2), and ellipticity (e=0.0-0.8). Themodels were convolved with a DrizzlyTim/TinyTim PSF(e.g. Krist 1993) truncated to 63×63 pixels to increaseexecution speed, and Poisson noise was added to matchthe noise characteristics of the data. For each ACS fil-ter, we randomly inserted a total of ∼200,000 modelsacross four fields that cover the cluster core and out-skirt regions (visits 1,15,78, and 90), then SExtractorwas run in a configuration identical to our pipeline asdescribed in §2. The artificial sources were considereddetected if SExtractor found a source within 4 pixels(∼2 PSF FWHM) of the known position.
In this section, we describe the results of our simu-lations as it relates to detection efficiency and catalogdepth (§4.1), and the missing-light problem associatedwith SExtractor photometry (§4.2).
4.1. Detection Efficiency
It is well known that the SExtractor detection ef-ficiency is a function of object size and magnitude (e.g.Bershady et al. 1998; Cristobal et al. 2003; Eliche-Moralet al. 2006). As such, we have measured the detection ef-ficiency separately for models with similar size and mag-nitude, as well as Sersic index and ellipticity, and discusshow the detection efficiency depends on these parame-ters.
Figure 8 shows the detection efficiency versus magni-tude for our models. We have separated the models into
four subsets based on Sersic index and ellipticity, whichthroughout this section are referred to as models FC, FE,PC, and PE: flat (F) and peak (P) models have Sersicindices that are smaller/larger than nSer=2.25, respec-tively; circular (C) and elliptical (E) models have elliptic-ities smaller/larger than e=0.4, respectively. The panelsin Figure 8 show the detection efficiency for each modelsubset, which we further separate into six equally-spacedbins in logarithmic effective radius that span the rangeReff=0.5-60 pixels. The left-most curves in each paneltrace the largest Reff , which for a given magnitude rep-resent galaxies with the lowest surface brightness. Allefficiency curves show the same pattern: at the brightend efficiencies are near 100%, and then fall to zero witha similar slope. None of the curves reaches 100% effi-ciency (maximum rates are ∼96-98%) owing to artificialsources that were injected near relatively brighter galax-ies. We note that our SExtractor catalogs reach 100%efficiency for moderately bright objects upon subtractingthe brightest 28 galaxies from our images prior to sourcedetection (§3.1). For a given magnitude, the detection ef-ficiency depends primarily on object size (small Reff giveshigher efficiency), followed by Sersic index (models withlarge nSer have higher efficiencies), and to lesser extent onthe ellipticity (high-ellipticity models have slightly higherdetection rates), i.e. the detection efficiency is positivelycorrelated with any model parameter that increases thecentral surface brightness.
In Table 2 we list the expected 80% completeness lim-its for our SExtractor catalogs based on our simu-lations. The completeness limits are given for the fourmodel subgroups (FC, FE, PC, and PE) separated intothe six logarithmically-spaced bins in Reff (F814W re-sults are shown in Cols 2-7, and F475W in Cols 8-13).The 80% completeness limits for point sources occursat F475W=27.8 and F814W=26.8 mag for images withthe nominal four dither positions (corresponding to anaverage S/N=5). The F814W 80% completeness limitis consistent with the peak in the magnitude histogramshown earlier in Figure 2.
4.2. Corrections to SExtractor Kron Photometry
Next we have tested the accuracy of the SExtrac-tor photometry by comparing its flux measurements tothe magnitudes of the artificial objects. The SExtrac-tor Kron photometry (Kron 1980) is known to capturea varying fraction of the total light, which is a functionof both the Sersic profile and S/N, e.g. the SExtractorKron apertures capture relatively less light for galaxieswith high Sersic index or low surface brightness (see Gra-ham & Driver 2005). In this section, we derive correc-tions for the SExtractor Kron magnitudes that pro-vide a better estimate of total magnitudes. The followinganalysis is performed for F814W measurements alone, asSExtractor apertures were not defined in the F475Wband.
In Figure 9 we show the difference between the SEx-tractor Kron magnitude and the input magnitudeplotted against the SExtractor mean effective surfacebrightness in the F814W band. The mean effective sur-face brightness (mag arcsec−1) is defined as

8 Hammer et al.
〈µ〉SEe ≡MAG AUTO + 1.995 +
+ 5 log(PSCALE × FLUX RADIUS 3), (3)
where MAG AUTO and FLUX RADIUS 3 are the SExtrac-tor catalog entries for Kron magnitude and the 50%light radius (in pixels), respectively, and PSCALE=0.05arcsec pix−1 is the plate scale of our ACS images. Wehave separated the comparison into four subsets basedon Sersic index and ellipticity (models FC, FE, PC, andPE as described in §4.1). We have trimmed the suite ofmodels used in this analysis to include only those thatoverlap in Reff - magnitude space with galaxies detectedin other deep HST surveys, e.g. the Hubble Ultra DeepField (Beckwith et al. 2006), the Groth Strip Survey(Simard et al. 2002; Vogt et al. 2005), and the GalaxyEvolution through Morphology and SEDs (GEMS; Rixet al. 2004) surveys. This was done so that correctionsare estimated from models that are representative of theobjects potentially detectable in our survey; the parame-ter space covered by these models includes the dwarf LSBgalaxy population in the Coma cluster (e.g., Graham &Guzman 2003).
The four panels in Figure 9 show a similar pattern,viz. photometric errors increase toward fainter surfacebrightness, with a systematic bias of the recovered mag-nitudes toward fainter values. We also note the following:
1. Despite that objects with large Sersic indices (“P”models) have a higher detection efficiency, theirSExtractor photometry have both large system-atic offset in magnitude and large scatter as com-pared to other models.
2. The systematic magnitude offset for models withlow Sersic index (“F” models) is relatively insensi-tive to surface brightness (i.e. does not exceed 0.1mag) for models brighter than 〈µ〉SE
e =23.0.
3. The magnitudes of high-ellipticity objects (“E”models) are better recovered than the magnitudesfor objects with low ellipticity (“C” models). Thetypical magnitude residual of a high-ellipticitymodel is similar to the magnitude residual of a low-ellipticity model around 0.5 mags brighter in 〈µ〉SE
e .
4. The surface brightness detection limits are thesame for all four models (〈µ〉SE
e =24.75).
In order to correct the SExtractor photometry formissing light we require the true effective radius (Reff)and the Sersic index of the galaxy (e.g. Graham & Driver2005). The SExtractor half-light radius is a proxyfor Reff but is often underestimated at faint magnitudes,and also for low surface brightness objects, owing to rel-atively fewer pixels that satisfy the detection threshold.Instead, we derive an empirical relation between the in-put effective radius of our models and the output SEx-tractor half-light radius (FLUX RADIUS 3), which is afunction of the Sersic profile, ellipticity, and 〈µ〉SE
e . Thisrelationship is shown in Figure 10, which was fit with afifth-order polynomial in 〈µ〉SE
e for each of the four modelgroups. It is seen that the FLUX RADIUS 3 parameter pro-vides a better estimate of the true Reff for flat (FE or FC)galaxy models than those with higher Sersic indices. The
best-fit conversion factor is also more or less constant forflat models brighter than 〈µ〉SE
e =23, while it is a steadilygrowing function of 〈µ〉SE
e for high-Sersic peak models(PC or PE). This is consistent with the systematic mag-nitude offsets seen in Figure 9. There are also secondaryeffects for the galaxy ellipticity, such that SExtractorrecovers the true effective radius slightly better for low-ellipticity models. We conclude that we are able to esti-mate the true effective radius with good accuracy (∼20%rms error in the Reff/FLUX RADIUS 3 ratio) based on theSExtractor measurements alone, and thus perform avariable aperture correction to our catalog sources.
We have tested the reliability of performing a variableaperture correction on our suite of galaxy models. Thefraction of missing light is calculated based on the ratio ofthe SExtractor Kron radius and the derived effectiveradius, and taking the known Sersic index of the models(e.g. see Figure 9 in Graham & Driver 2005). The re-sults are shown in Figure 11, which shows the magnitudedifference between the aperture-corrected SExtractormagnitudes and the input magnitude as a function of〈µ〉SE
e . The magnitude residuals now follow a well-defined“trumpet” diagram and are not nearly as dependent ongalaxy structure/shape as shown in the raw magnitudecomparison in Figure 9. There still exists a small sys-tematic offset for all models at low surface brightness(especially for PE models), for which we will apply afine correction based on the average residuals measuredin bins of surface brightness. Our aperture correctionis reliable for objects with surface brightness brighterthan 〈µ〉SE
e =23.25 in the F814W band. This limit corre-sponds to our ability to recover the total magnitude witha 1σ rms error of 0.2 mag, but the uncertainties increaserapidly for fainter objects.
We have applied this variable aperture correction toall sources in our SExtractor catalogs. We do nothave prior knowledge of the Sersic profile, thus we haveperformed two aperture corrections for every object us-ing the following values for the Sersic profile: (1) a flatprofile (nSer=1.525) that is representative of the major-ity of objects in our catalog (MAG AUTO CORRA), and (2)a variable Sersic profile given by Graham & Guzman(2003) that scales with absolute B-band magnitude andis applicable to early-type galaxies in the Coma clus-ter (MAG AUTO CORRB); specifically, we use the formulaF475W=-9.4 log nSer + 20.6, assuming a color offsetF475W=B-0.1 for early-type galaxies in Coma and adistance modulus of 35.00 mag. The first correction isa statistical estimate of the total magnitude and is notmeant for accurate measurements of individual galaxies.The second correction provides a reliable estimate of thetotal magnitude for individual early-type galaxies in theComa cluster that are brighter than F814W=20; fainterComa member galaxies have surface brightness valuesthat are lower than the reliable limit of our aperture cor-rection (〈µ〉SE
e =23.25). The errors for the SExtractorcorrected magnitudes are taken directly from the mea-sured rms scatter shown in Figure 11. These errors ac-count not only for the counting errors that are measuredaccurately by SExtractor, but now include uncertain-ties related to our ability to recover the true magnitude.We include an additional 0.05 mag error for both meth-ods to account for the uncertainty of the Sersic profile.

The HST/ACS Coma Cluster Survey. II. 9
The corrections for F475W Kron magnitudes may be es-timated indirectly by adding the F475W-F814W colorto the corrected F814W Kron magnitude (assuming thegalaxy has a negligible color gradient across the SEx-tractor Kron aperture).
5. OBJECTS IN THE COMA CLUSTER
GCs are the majority of Coma members in our cat-alogs as several thousand are detected at magnitudesfainter than F814W≈24 (MF814W =-11; Paper IV). GCs(and most UCDs) are unresolved at the distance of Comathus their detection efficiency is relatively high as com-pared to the LSB galaxies that dominate the clustergalaxy population at faint magnitudes. The high den-sity of GCs in the Coma cluster is visible from the insetin Figure 1, which shows the GC population associatedwith the cD galaxy NGC 4874. Our catalogs also includeseveral hundred galaxies in the Coma cluster based on:(1) published redshifts for bright galaxies in our fields(r <
∼19; e.g., Colless & Dunn 1996; Mobasher et al. 2001;
Adelman-McCarthy et al. 2008), and deeper spectro-scopic redshift surveys performed by team members withMMT-Hectospec (r <
∼21; R. Marzke et al., in prep) and
Keck-LRIS (r <∼ 24; K. Chiboucas et al. 2010, in press),
and (2) lists of morphology-selected candidates assem-bled by team members H. Ferguson and N. Trenthamthat provide reliable membership assessments as shownwith follow-up spectroscopy (K. Chiboucas et al. 2010,in press).
SExtractor, however, performs poorly for galaxieswith very low surface brightness, and hence our catalogsare not exhaustive for the cluster dwarf galaxy popula-tion. From visual inspection, we found that SExtrac-tor detection and photometry is reliable for the major-ity of dwarf LSB galaxies brighter than F814W≈22 mag.The exception is for dwarf LSB galaxies located near rel-atively bright objects, for which SExtractor tends toshred the galaxy into multiple objects, or does not regis-ter a detection. We have mitigated the fraction of shred-ded/missing dwarf LSB galaxies by subtracting the lightdistribution of the 28 brightest cluster member galaxies(§3.1). We have identified ∼230 galaxies brighter thanF814W=22.5 mag that have both reliable SExtractorphotometry and a near 100% probability of being clustermembers. Although our morphology assessment suggestshundreds more cluster LSB galaxies may exist at faintermagnitudes, these galaxies appear as amorphous struc-tures just visible above the background noise and theirdetection/photometry is poor regardless of their proxim-ity to other objects. We will address the nature of thesegalaxies and their photometry in a future paper.
Cosmological dimming, K-corrections, and Galacticextinction have important effects on the photometricmeasurements of cluster members. Cosmological (1 +z)−4 dimming (Tolman 1930) affects Coma memberssuch that the observed surface brightness in both ACSbands is 0.1 mag fainter than restframe measurements.In Table 2 we derived K-corrections for galaxy SED tem-plates that were redshifted to the distance of Coma andspan a wide range of galaxy morphology and star forma-tion activity (Coleman et al. 1980; Kinney et al. 1996;Poggianti 1997). The K-corrections for Coma membersdetected in the F475W (F814W) filter span 0.02-0.09(0.00-0.02) mag for late-type and early-type galaxies, re-
spectively. These K-corrections are consistent with val-ues derived with the ‘K-corrections calculator’41 (Chilin-garian et al. 2010). We calculated the Galactic extinctionfor the SED templates in Table 2 following the formal-ism in Cardelli et al. (1989) with RV =3.1, and adoptingthe full range of E(B-V ) color excess values for our fieldsfrom Schlegel et al. (1998). The reddening is relativelyinsensitive to shape of the galaxy SED at the distanceof Coma but varies slightly with color excess, e.g. theGalactic extinction for Coma members is AF475W =0.03-0.05 and AF814W =0.01-0.03 mag for color excess valuesbetween E(B-V )=0.008-0.014, respectively.
5.1. Color Magnitude Diagram
In Figure 12, we show the color-magnitude diagram(CMD) for all point sources and extended galaxies in ourcatalog, including members of the Coma cluster. Colorsare measured inside the SExtractor isophotal aper-tures as defined in the F814W band. The GC popula-tion is identified as the concentration of point sourcesat magnitudes fainter than F814W=24 mag with colorvalues near F475W−F814W≈1 (Paper IV). We suspectthat unresolved background galaxies are responsible forthe extension of point sources to bluer colors at magni-tudes fainter than F814W=25. Stars are scattered acrossother regions of the CMD.
The cluster red sequence (RS) is easily identified as thedense horizontal band of cluster galaxies that stretchesbetween 13 <
∼ F814W <∼ 22.5 mag. It is well known that
the cluster RS consists primarily of quiescent early-typegalaxies, and that massive RS galaxies (as traced by lu-minosity) have redder colors owing to their deep potentialwells that are able retain metals for future generationsof stars with cooler main sequence turnoffs (e.g., Boweret al. 1992; Kodama & Arimoto 1997). In contrast, RSdwarf galaxies have bluer colors owing to both feedbackmechanisms that remove processed elements (e.g., su-pernovae winds; Dekel & Silk 1986) and more extendedstar formation histories (e.g., Smith et al. 2008; Sanchez-Blazquez et al. 2009).
Figure 13 shows a separate CMD for objects in theComa cluster. Magnitudes and colors are adjusted forGalactic reddening and K-corrections, and we use theKron magnitudes corrected for missing light (Section4.2). Colors were measured inside fixed circular aper-tures with sizes that were selected to match the typi-cal Reff of cluster RS galaxies: a 3.′′0 radius (1.4 kpc)for galaxies brighter than F814W=16 mag, a 2.′′25 ra-dius (1.0 kpc) for galaxies between 16<F814W<20 mag,and a 1.′′5 radius (0.7 kpc) for fainter galaxies (e.g. Gra-ham et al. 2003; Ferrarese et al. 2006). Fixed aperturesavoid color bias owing to variable apertures that may notsample the same physical regions in galaxies (Scodeggio2001). The slope of the red sequence appears constantacross the full magnitude range, which confirms the re-sults of previous studies (e.g., Secker et al. 1997; Lopez-Cruz et al. 2004; Adami et al. 2006a), but extends therelation to a few magnitudes fainter. A robust bisectorfit to the full red sequence gives the relation F475W-F814W=-0.060 × F814W + 2.12 mag, with a 1σ disper-sion of 0.06 mag. This relation is not affected by therelatively large errors for the corrected Kron photometry
41 http://kcor.sai.msu.ru/

10 Hammer et al.
at faint magnitudes, e.g., we obtain an identical fit to theRS for galaxies brighter than F814W=20 mag.
Interestingly, the RS dispersion remains roughly con-stant (0.06 mag) when measured in discrete magnitudeintervals across the full RS. This result is in contrast tothe relatively large 0.3 mag dispersion in B-R color re-ported for faint (R∼22 mag) dwarf galaxies of both theComa cluster (Adami et al. 2009a) and Perseus cluster(Conselice et al. 2003), which were attributed to eithervaried star formation histories or effects from dynamicalinteractions. Large uncertainties for their color measure-ments, or contamination from background galaxies, mayhave obscured an underlying tighter relation with theRS. Other possible explanations for the low dispersionreported here are: (1) our redshift coverage and visualclassification scheme may preferentially select faint Comamember galaxies that lie near the red sequence, and (2)our ACS fields do not cover the regions of the Comacluster where many faint dwarf galaxies were reportedto be offset from the RS (e.g., west of the cluster cen-ter, and in the immediate vicinity of NCG 4889; Adamiet al. 2009b). Future studies will provide a more accurateanalysis of the RS using magnitudes and colors obtainedby fitting the light distribution of each individual Comamember galaxy.
In Figure 13, we have separated Coma members intobroad morphology classes based on visual inspection andfollowing the galaxy templates of Sandage & Binggeli(1984). This classification scheme is only meant to pro-vide a cursory description of the Coma cluster morpholo-gies and to identify large-scale trends. Future paperswill provide less subjective classifications based on multi-component fits to the light distributions of Coma mem-ber galaxies. As expected, early-type galaxies (E/S0)are the majority of bright RS galaxies and most arelocated in the central ACS fields, while spiral galaxies(Sa-Sd) are located below the red sequence and were de-tected primarily in the outer ACS fields. Although wedid not consider the SExtractor measurements as partof our classification, our E/S0 and dE galaxy classescan be reproduced with a separation in surface bright-ness at 〈µ〉SE
e =22 mag arcsec−1 in the F814W band.Galaxies classified as dEs all have magnitudes fainterthan F814W≈18 (MF814W =-17), which corresponds toa B-band magnitude of MB≈-16. The dE galaxies weresubdivided into two classes: (1) nucleated dE galaxies(dE,N) have unresolved central nuclei and are the domi-nant subclass, especially among bright dE galaxies, and(2) non-nucleated dE galaxies (dE,NN) lack a visible cen-tral nucleus but are otherwise similar in appearance todE,N galaxies, and are an increasing fraction of total dEpopulation at fainter magnitudes. Compact galaxies arelocated primarily above the RS and consist of the sevencE candidates discussed in Price et al. (2009) and anotherthree UCD-like objects that have redshifts. Ten galaxieshave irregular morphology but are conservatively classi-fied as Im/dE as it is difficult to differentiate betweenthese galaxy types at faint magnitudes.
Analysis of the subgroups of early-type galaxies re-quires more detailed measurements than presented here,but we note that our classes show no obvious trendsin the CMD shown in Figure 13. The exception, how-ever, relates to the RS outliers at intermediate magni-tudes (17.5 <
∼F814W <
∼21) as: (1) several E/S0 and dE,N
galaxies are located above the 1σ RS but are rare belowthe RS, and (2) there is a relative lack of dE,NN galaxiesoutside the 1σ RS. Interestingly, the majority of theseoutliers occupy the same region of the CMD as cEs andUCDS, which are thought to originate from the tidally-stripped nuclei of E/S0 and dE,N galaxies (e.g. Bekkiet al. 2001, 2003; Price et al. 2009). It is intriguing tospeculate that the outliers above the RS may have expe-rienced at least low-level tidal interactions, or represent aphase in cE/UCD creation, but such analysis is beyondthe scope of this paper and will be explored in futureworks.
Nearly all galaxies classified as Im/dE (9/10) are lo-cated either above or below the 1σ RS. These galaxiesmay be analogs of the scattered population of faint dwarfLSB galaxies detected in the Coma and the Perseus clus-ters (Adami et al. 2009b; Conselice et al. 2003), albeitas a much smaller fraction of the total galaxy popula-tion than reported in these other studies. Adami et al.(2006b) suggested that tidal stripping may be responsi-ble for similar faint red galaxies in their sample, whilethe galaxies blueward of the 1σ RS may be tidal dwarfgalaxies formed from the stripped disk material. Ourobservations are somewhat consistent with this scenariosuch that, unlike the bright blue spirals that are foundprimarily in the outer ACS fields, all of the Im/dE galax-ies (blue or red) were detected in the central ACS fieldswhere interactions are more common. The nature ofthese galaxies will be studied in future papers of thisseries.
A graphical representation of the CMD is presented inFigure 14, which shows two-color postage-stamp imagesfor a subset of our Coma member galaxies. The coloraxis is normalized to the RS and color intervals are instandard deviations of the measured dispersion (1σ=0.06mag). This diagram demonstrates the wide range of mor-phology, star formation activity, and evolution of clustermembers detected in our survey, such as: bright E/S0galaxies and barred disk galaxies that follow the RS andextend to the dE galaxy population at fainter magnitudes(middle row); compact galaxies located above the 3σ RS(top row) that include cEs at intermediate magnitudesand a UCD at the extreme faint end; star forming galax-ies located below the 3σ RS (bottom row); and more raregalaxies in our sample such as possible interacting galax-ies (row 1, col 2), an anemic spiral (row 2,col 2), and afaint dwarf irregular galaxy located well below the RS(bottom-right corner).
6. SUMMARY
We have improved our image pipeline and createdSExtractor catalogs for 25 fields observed for theHST-ACS Coma Cluster Treasury survey. The pro-cessed images and source catalogs are publicly avail-able for download as part of our second data release(DR2.1)42. The source catalogs include photometry for∼73,000 unique objects that were detected in F814Wimages, and color measurements for the F475W band.We performed simulations that indicate our source cata-logs are 80% complete for point sources at F814W=26.8mag; the simulations were also used to establish aperturecorrections to the SExtractor Kron photometry. The
42 http://www.astro-wise.org/projects/COMALS/ACSdata.shtml

The HST/ACS Coma Cluster Survey. II. 11
majority of catalog sources are background galaxies, andwe estimate that ∼5-10% of objects are located insidethe Coma cluster.
The majority of Coma members are unresolved globu-lar clusters, but also include a wide range of cluster mem-ber galaxies such as UCDs, compact elliptical galaxies,dwarf early-type galaxies (nucleated and non-nucleated),dwarf irregular and spiral galaxies, barred disk galaxies(Marinova et al. 2010), and a cD galaxy (NGC 4874).Preliminary analysis of the color-magnitude relation indi-cates that the red sequence of Coma member galaxies hasa flat slope that extends to the faintest dE galaxy detec-tions at MF814W =-13.0 mag (AB), and has constant dis-persion across the full magnitude range (1σ=0.06 mag).Early-type galaxies that are offset from the red sequenceat magnitudes between -17.5<MF814W<-14 tend to haveboth redder optical colors than expected and visible nu-clear light components. These relations will be studied inmore detail using galaxy properties derived from multi-component fits to the light distribution of Coma mem-ber galaxies. Additional analysis of the Coma memberpopulation is ongoing, including but not limited to thefollowing:
• Hoyos et al. (Paper III; 2010, in prep) measure the struc-tural parameters (e.g. Sersic index, effective radius) for∼50,000 objects selected from the Paper II photometriccatalogs. Fits are performed using both GALFIT andGIM2D, and and a detailed comparison of the useful lim-its for both methods is explored.
• Peng et al. (Paper IV; 2010, submitted) identify a largepopulation of intracluster globular clusters (IGCs) thatare not associated with individual galaxies, but fill thecore of the Coma cluster and make up ∼40% of its to-tal GC population. The majority of IGCs are blue andmetal-poor, suggesting they were ejected from the tidaldisruption of dwarf galaxies, although 20% of IGCs mayoriginate from the halos of L∗ galaxies.
• Price et al. (Paper V; 2009) investigate a sample of com-pact galaxies that consists of old intermediate-metallicitycompact elliptical (cE) galaxies, and fainter compactgalaxies with properties that reside somewhere betweencEs and UCDs. The measured light profiles, velocitydispersions, and stellar populations are consistent witha formation mechanism owing to tidal mass-loss fromgalaxy-galaxy interactions.
• Trentham et al. (Paper VI; 2010, in prep) measure thegalaxy luminosity function (LF) to very faint magnitude(MF814W =-12). The cluster LF is measured at differ-ent cluster-centric radii and separated by morphologicalclass in order to study the environmental dependence ofthe galaxy population. Cluster membership is estimatedprimarily by morphology, and also using deep redshiftcoverage with MMT-Hectospec (Marzke et al., in prep)and dedicated follow-up spectroscopy with Keck-LRIS(Chiboucas et al. 2010; in press).
We thank the referee for their helpful comments,Panayiotis Tzanavaris for assistance with the SCAMPsoftware, Antara Basu-Zych for useful science discus-sion, Karen Levay for implementing the data release
on MAST, and Zolt Levay for constructing the two-color images. This research and associated EPO pro-gram are supported by STScI through grants HST-GO-10861 and HST-E0-10861.35-A, respectively. Partialsupport is also provided for the following individuals:Carter and Karick are supported by UK STFC rollinggrant PP/E001149/1; Erwin is supported by DFG Pri-ority Programme 1177; Balcells is supported by the Sci-ence Ministry of Spain through grants AYA2006-12955and AYA2009-11137; Hudson is supported by NSERC;Guzman is supported by Spanish MICINN under theConsolider-Ingenio 2010 Programme grant CSD2006-00070; Merritt is supported by grants AST-0807910(NSF) and NNX07AH15G (NASA).

12 Hammer et al.
REFERENCES
Abell, G. O., Corwin, H. G., Jr., & Olowin, R. P. 1989, ApJS, 70,1
Adami, C., et al. 2009a, A&A, 507, 1225Adami, C., Pello, R., Ulmer, M. P., Cuillandre, J. C., Durret, F.,
Mazure, A., Picat, J. P., & Scheidegger, R. 2009b, A&A, 495,407
Adami, C., et al. 2006a, A&A, 451, 1159Adami, C., et al. 2006b, A&A, 459, 679Adelman-McCarthy, J. K., et al. 2008, ApJS, 175, 297Balcells, M., Graham, A. W., & Peletier, R. F. 2007, ApJ, 665,
1084Beckwith, S. V. W., et al. 2006, AJ, 132, 1729Bekki, K., Couch, W. J., Drinkwater, M. J., & Gregg, M. D. 2001,
ApJ, 557, L39Bekki, K., Couch, W. J., Drinkwater, M. J., & Shioya, Y. 2003,
MNRAS, 344, 399Benıtez, N., et al. 2004, ApJS, 150, 1Bershady, M. A., Lowenthal, J. D., & Koo, D. C. 1998, ApJ, 505,
50Bertin, E. 2006, in Astronomical Society of the Pacific Conference
Series, Vol. 351, Astronomical Data Analysis Software andSystems XV, ed. C. Gabriel, C. Arviset, D. Ponz, & S. Enrique,112
Bertin, E., & Arnouts, S. 1996, A&AS, 117, 393Bower, R. G., Lucey, J. R., & Ellis, R. S. 1992, MNRAS, 254, 601Butcher, H., & Oemler, A., Jr. 1984, ApJ, 285, 426Cardelli, J. A., Clayton, G. C., & Mathis, J. S. 1989, ApJ, 345, 245Carter, D., et al. 2008, ApJS, 176, 424Casertano, S., et al. 2000, AJ, 120, 2747Chilingarian, I., Melchior, A., & Zolotukhin, I. 2010, ArXiv e-printsColeman, G. D., Wu, C.-C., & Weedman, D. W. 1980, ApJS, 43,
393Colless, M., & Dunn, A. M. 1996, ApJ, 458, 435Conselice, C. J., Gallagher, J. S., III, & Wyse, R. F. G. 2003, AJ,
125, 66Cote, P., et al. 2004, ApJS, 153, 223Cristobal, D., Prieto, M., Balcell, M., Guzman, R., Cardiel, N.,
Serrano, A., Gallego, J., & Pello, R. 2003, in Revista Mexicana deAstronomia y Astrofisica Conference Series, ed. J. M. RodriguezEspinoza, F. Garzon Lopez, & V. Melo Martin, Vol. 16, 267
Dekel, A., & Silk, J. 1986, ApJ, 303, 39Del Burgo, C., Carter, D., & Sikkema, G. 2008, A&A, 477, 105Dressler, A. 1980, ApJ, 236, 351Eliche-Moral, M. C., Balcells, M., Prieto, M., Garcıa-Dabo, C. E.,
Erwin, P., & Cristobal-Hornillos, D. 2006, ApJ, 639, 644Ferrarese, L., et al. 2006, ApJS, 164, 334Ford, H. C., et al. 1998, in Society of Photo-Optical
Instrumentation Engineers (SPIE) Conference Series, ed. P. Y.Bely & J. B. Breckinridge, Vol. 3356, 234
Franx, M., Illingworth, G., & Heckman, T. 1989, AJ, 98, 538Fruchter, A. S., & Hook, R. N. 2002, PASP, 114, 144Godwin, J. G., Metcalfe, N., & Peach, J. V. 1983, MNRAS, 202,
113Graham, A. W., & Driver, S. P. 2005, Publications of the
Astronomical Society of Australia, 22, 118
Graham, A. W., & Guzman, R. 2003, AJ, 125, 2936Graham, A. W., Jerjen, H., & Guzman, R. 2003, AJ, 126, 1787Jordan, A., et al. 2007, ApJS, 169, 213Jorgensen, I., Franx, M., & Kjaergaard, P. 1995, MNRAS, 273,
1097Kinney, A. L., Calzetti, D., Bohlin, R. C., McQuade, K., Storchi-
Bergmann, T., & Schmitt, H. R. 1996, ApJ, 467, 38Kodama, T., & Arimoto, N. 1997, A&A, 320, 41Koekemoer, A. M., Fruchter, A. S., Hook, R. N., & Hack, W.
2002, in The 2002 HST Calibration Workshop : Hubble afterthe Installation of the ACS and the NICMOS Cooling System,ed. S. Arribas, A. Koekemoer, & B. Whitmore, 337
Komiyama, Y., et al. 2002, ApJS, 138, 265Krist, J. 1993, in Astronomical Society of the Pacific Conference
Series, Vol. 52, Astronomical Data Analysis Software andSystems II, ed. R. J. Hanisch, R. J. V. Brissenden, & J. Barnes,536
Kron, R. G. 1980, ApJS, 43, 305 Lokas, E. L., & Mamon, G. A. 2003, MNRAS, 343, 401Lopez-Cruz, O., Barkhouse, W. A., & Yee, H. K. C. 2004, ApJ,
614, 679
Marinova, I., et al. 2010, ArXiv e-printsMeurer, G. R., et al. 2003, in Society of Photo-Optical
Instrumentation Engineers (SPIE) Conference Series, ed. J. C.Blades & O. H. W. Siegmund, Vol. 4854, 507
Mobasher, B., et al. 2001, ApJS, 137, 279Peng, C. Y., Ho, L. C., Impey, C. D., & Rix, H.-W. 2002, AJ, 124,
266Pier, J. R., Munn, J. A., Hindsley, R. B., Hennessy, G. S., Kent,
S. M., Lupton, R. H., & Ivezic, Z. 2003, AJ, 125, 1559Poggianti, B. M. 1997, A&AS, 122, 399Price, J., et al. 2009, MNRAS, 397, 1816Rix, H.-W., et al. 2004, ApJS, 152, 163Sanchez-Blazquez, P., et al. 2009, A&A, 499, 47Sandage, A., & Binggeli, B. 1984, AJ, 89, 919Schlegel, D. J., Finkbeiner, D. P., & Davis, M. 1998, ApJ, 500, 525Scodeggio, M. 2001, AJ, 121, 2413Secker, J., Harris, W. E., & Plummer, J. D. 1997, PASP, 109, 1377Sikkema, G., Carter, D., Peletier, R. F., Balcells, M., Del Burgo,
C., & Valentijn, E. A. 2007, A&A, 467, 1011Simard, L., et al. 2002, ApJS, 142, 1Smith, R. J., et al. 2008, MNRAS, L52Terlevich, A. I., Caldwell, N., & Bower, R. G. 2001, MNRAS, 326,
1547Tolman, R. C. 1930, Proceedings of the National Academy of
Science, 16, 511Valentijn, E. A., et al. 2007, in Astronomical Society of the
Pacific Conference Series, Vol. 376, Astronomical Data AnalysisSoftware and Systems XVI, ed. R. A. Shaw, F. Hill, & D. J. Bell,491
van Dokkum, P. G. 2001, PASP, 113, 1420Vogt, N. P., et al. 2005, ApJS, 159, 41

The HST/ACS Coma Cluster Survey. II. 13
30′ = 0.88 Mpc
NGC 4874
NGC 4839
NGC 4889
Fig. 1.— DSS wide-field image of the Coma cluster showing the location of 25 fields observed as part of the HST-ACS Coma ClusterTreasury survey (small boxes). The large circle extends 1.1 deg (1.9 Mpc) from the center of the Coma cluster, or two-thirds the clustervirial radius (rvir=2.9 Mpc; Lokas & Mamon 2003). The locations of the three largest galaxies in the Coma cluster (NGC 4889, 4874, 4839)are indicated. The large inset at top shows a two-color ACS image (F475W=blue and F814W=red) that spans 6 ACS fields; a subregionof this image (white dashed box) is shown in the small inset, which includes a nucleated dwarf early-type galaxy that is a member of theComa cluster (upper-right corner). The large inset at bottom left shows the entire visit-19 field at the center of the Coma cluster, includingthe central cD galaxy NGC 4874; a subregion of this image (located inside the light distribution of NCG 4874; white dashed box) showsthe large number of unresolved GCs observed in the galaxy halo. North is top and East is left.

14 Hammer et al.
14 16 18 20 22 24 26 28 30magnitude (AB)
1
10
100
1000
10000nu
mbe
r of
sou
rces
F475W
F814W
Fig. 2.— Magnitude histogram for catalog sources in both the F814W (dark shaded) and F475W (light shaded) bands. The F814Wmagnitudes are taken from the SExtractor Kron photometry and F475W magnitudes are measured within the same F814W Kronapertures. We do not include F475W sources with S/N<3 to avoid unreliable measurements. The arrow indicates the 80% completenesslimit for point-sources detected in the F814W band as determined by our simulations (Section 4.1).

The HST/ACS Coma Cluster Survey. II. 15
21 22 23 24 25 26 27 28F814W (AB mag)
−1.2
−1.0
−0.8
−0.6
−0.4
−0.2
0.0
0.2
log(5
0%
lig
ht
radiu
s [
arc
sec])
20 10 5
3
0
10
20
30
40
50
60
70
80
90
100
Fig. 3.— Average signal-to-noise (S/N) for catalog sources in the magnitude-size parameter space: size is taken as the logarithm of theSExtractor half-light radius in arcsec, magnitudes are the MAG AUTO Kron magnitudes, and S/N is given for the Kron photometry. Thecolors correspond to S/N values as defined in the color bar, and white regions of the diagram are void of source detections. The thin whitelines show the contours for average S/N values of 3,5,10, and 20. Point sources extend roughly horizontal across the bottom of the diagramat log sizes smaller than ∼-1.0.

16 Hammer et al.
Fig. 4.— Example of galaxy subtraction performed for two nearby galaxies in visit-15 (left panel shows the original image and the rightpanel shows the residual image after galaxy subtraction). Blue circles show objects that were detected in the original image, and red circlesshow objects detected after performing galaxy subtraction. The concentric circles indicate the annuli used for merging the original andnew sources as described in §3.1; the inner/outer radius that define the annulus for each subtracted galaxy are listed in Table 3. Galaxysubtraction was performed by modeling the light distribution using the GALPHOT software wrapped inside Astro-WISE. This residualimage has the highest noise among all subtracted galaxies owing to the overlapping light profiles.

The HST/ACS Coma Cluster Survey. II. 17
Fig. 5.— Magnitude-size diagram for catalog sources in the F814W band. Size is taken as the logarithm of the SExtractor half-light radius in arcsec, and we use the MAG AUTO Kron magnitudes. Gray dots identify extended galaxies and black dots show unresolvedsources based on our classification scheme (§3.3.1). The dashed line is the half-light radius used to separate galaxies/point sources atF814W>24 mag; both the SExtractor CLASS STAR parameter and the half-light radius are used at brighter magnitudes. Saturated starsare responsible for the extension of point sources at bright magnitudes to larger size. The unresolved sources that lie above the dashed linebetween 22<F814W<24 mag were identified as bright point sources superposed on faint background galaxies.
18 Hammer et al.
12 14 16 18 20 22 24 26 28F814W (AB mag)
1
10
100
1000
10000nu
mbe
r of
sou
rces
GALAXIESEXTENDED
POINT SOURCES
starsUCDs/GCs
brightComa members
unresolved galaxies
Fig. 6.— Magnitude histogram for catalog sources in the F814W band. Separate histograms are shown for objects classified as pointsources (light shaded), extended galaxies (dark shaded), and the total population (dashed line). For point sources, we show the magnituderange where we expect contributions from stars, UCDs/GCs, and unresolved galaxies; UCDs/GCs are likely responsible for the sharp increasein point sources at F814=22.5 mag. Coma members are responsible for the excess number of extended galaxies at bright magnitudes.

The HST/ACS Coma Cluster Survey. II. 19
12 14 16 18 20 22 24 26F814W (AB mag)
-2
-1
0
1
2
3
∆ m
agACS-CFHT detectionsACS-SDSS detections
Fig. 7.— Magnitude comparison for galaxies detected in our HST-ACS observations and previous optical surveys with I-band coverage:dark circles show galaxies detected in the SDSS i-band (instrumental asinh magnitudes; Adelman-McCarthy et al. 2008), and light circles areCFHT I-band measurements with the CFH12K camera (instrumental Vega magnitudes; Adami et al. 2006a). We limited this comparisonto objects brighter than the SDSS and CFHT completeness limits. The brightest ACS-SDSS detection is the central CD galaxy NGC 4874,which is too faint in our catalog owing to its large halo that extends outside the ACS FOV.
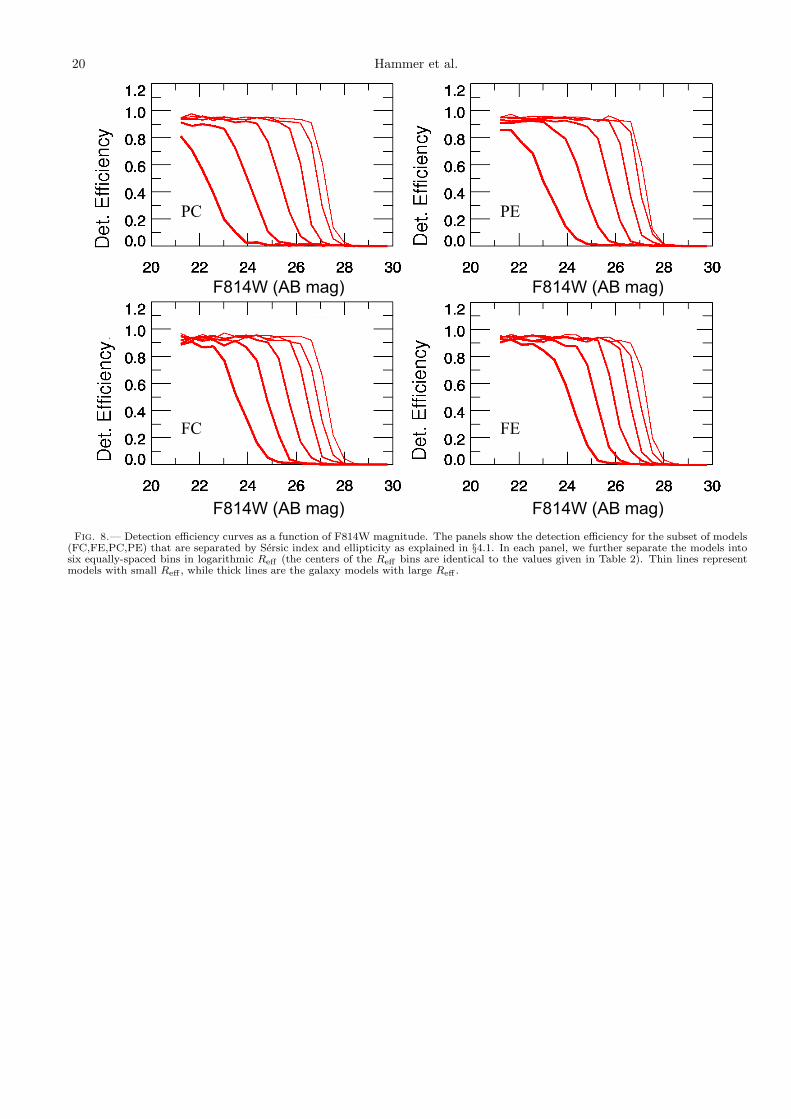
20 Hammer et al.
F814W (AB mag) F814W (AB mag)
F814W (AB mag) F814W (AB mag)
PC PE
FC FE
Fig. 8.— Detection efficiency curves as a function of F814W magnitude. The panels show the detection efficiency for the subset of models(FC,FE,PC,PE) that are separated by Sersic index and ellipticity as explained in §4.1. In each panel, we further separate the models intosix equally-spaced bins in logarithmic Reff (the centers of the Reff bins are identical to the values given in Table 2). Thin lines representmodels with small Reff , while thick lines are the galaxy models with large Reff .

The HST/ACS Coma Cluster Survey. II. 21
Fig. 9.— The magnitude residuals for models detected by SExtractor in the F814W band (MAG AUTO minus input magnitude) plottedagainst 〈µ〉SE
e (mag arcsec−2 in the F814W band), for models injected into the visit-01 image. The comparison is performed for the subsetof models (FC,FE,PC,PE) that are separated based on Sersic index and ellipticity as described in §4.1. The solid gray lines show thebinned median offset; dashed lines show the zero magnitude offset.

22 Hammer et al.
Fig. 10.— The ratio of the input effective radius and the output SExtractor half-light radius (FLUX RADIUS 3) plotted against 〈µ〉SEe
(mag arcsec−2 in the F814W band) for models injected into the visit-01 F814W image. The comparison is performed for the subset ofmodels (FC,FE,PC,PE) that are separated based on Sersic index and ellipticity as described in §4.1. Solid gray lines show 5th-orderpolynomial fits that are used to estimate the true effective radius from the SExtractor half-light radius and surface brightness.

The HST/ACS Coma Cluster Survey. II. 23
Fig. 11.— Same as Figure 9 except the magnitude residuals are plotted for the aperture-corrected SExtractor Kron photometry.

24 Hammer et al.
Fig. 12.— Color-magnitude diagram for catalog sources separated into extended galaxies (gray dots) and point sources (black dots).Large filled circles show the location of 233 Coma member galaxies that were identified from spectroscopic redshifts (196/233) and alsobased on morphology (37/233). Magnitude is taken as the F814W Kron magnitude, and F475W-F814W color is measured using theSExtractor MAG ISO isophotal photometry. We do not plot sources with S/N<3 in the F475W band.
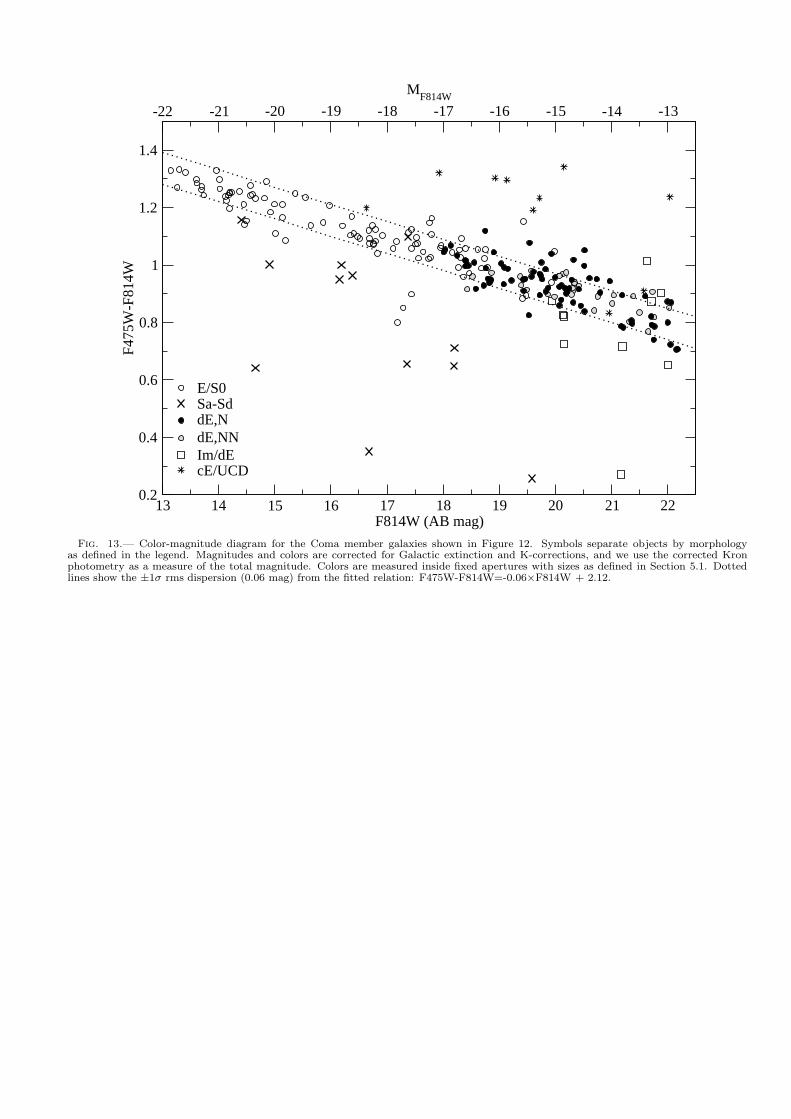
The HST/ACS Coma Cluster Survey. II. 25
13 14 15 16 17 18 19 20 21 22F814W (AB mag)
0.2
0.4
0.6
0.8
1
1.2
1.4
F475
W-F
814W
-22 -21 -20 -19 -18 -17 -16 -15 -14 -13
MF814W
E/S0Sa-SddE,NdE,NNIm/dEcE/UCD
Fig. 13.— Color-magnitude diagram for the Coma member galaxies shown in Figure 12. Symbols separate objects by morphologyas defined in the legend. Magnitudes and colors are corrected for Galactic extinction and K-corrections, and we use the corrected Kronphotometry as a measure of the total magnitude. Colors are measured inside fixed apertures with sizes as defined in Section 5.1. Dottedlines show the ±1σ rms dispersion (0.06 mag) from the fitted relation: F475W-F814W=-0.06×F814W + 2.12.

26 Hammer et al.
Fig. 14.— Color-magnitude diagram for a subset of Coma member galaxies shown as two-color image cutouts (F475W=blue andF814W=red). The y-axis is the difference in color between galaxies and the cluster red sequence (1σ=0.06 mag) such that the middle rowis the spine of the red sequence. Coma member detections are not available in the two upper-left panels of the diagram.

The HST/ACS Coma Cluster Survey. II. 27
TABLE 1Fields Observed for the HST-ACS Coma Treasury Program
Field R.A. Dec Orient Dither Exposure (sec)(visit no.) (J2000) (J2000) (deg) Positions F814W F475W
(1) (2) (3) (4) (5) (6) (7)
01 13 00 45.90 28 04 54.0 282 4 1400 267702 13 00 30.30 28 04 54.0 282 4 1400 267703 13 00 14.70 28 04 54.0 282 2 700 139708 13 00 42.30 28 01 43.0 282 4 1400 267709 13 00 26.70 28 01 43.0 282 4 1400 2677
10 13 00 11.10 28 01 43.0 282 4 1400 267712 12 59 39.90 28 01 43.0 282 3 1050 201213 12 59 24.30 28 01 43.0 282 2 700 137214 12 59 08.70 28 01 43.0 282 3 1050 203715 13 00 38.70 27 58 32.0 282 4 1400 2677
16 13 00 23.10 27 58 32.0 282 4 1400 267718 12 59 51.90 27 58 32.0 282 4 1400 267719 12 59 36.30 27 58 32.0 282 4 1400 267722 13 00 35.10 27 55 21.0 282 4 1400 256023 13 00 19.50 27 55 21.0 282 4 1400 2677
24 13 00 03.90 27 55 21.0 282 4 1400 256025 12 59 48.30 27 55 21.0 282 4 1400 256033 12 59 29.10 27 52 10.0 282 4 1400 267745 12 58 21.58 27 27 40.7 318 4 1400 267746 12 58 34.00 27 22 58.8 280 4 1400 2677
59 12 58 31.15 27 11 58.5 270.05 4 1400 267763 12 56 29.80 27 13 32.8 265 4 1400 251275 12 58 47.75 27 46 12.7 280 4 1400 267778 12 57 10.80 27 24 18.0 314.52 4 1400 267790 12 57 04.22 27 31 34.5 299.10 4 1400 2677

28 Hammer et al.
TABLE 2Bright Galaxies Subtracted from ACS Images
Field Galaxy Name R.A. Dec F814W Magnitude (AB) F475W Magnitude (AB) rmin rmax
(visit no.) (GMP ID) (J2000) (J2000) MAG AUTO MAG ISO MAG AUTO MAG ISO (arcsec) (arcsec)(1) (2) (3) (4) (5) (6) (7) (8) (9) (10)
01 2440 195.20269 28.09075 13.55 13.51 14.90 14.87 7.5 20.003 2861 195.05362 28.07549 14.66 14.63 15.94 15.91 9.0 30.008 2417 195.21444 28.04302 13.45 13.41 14.81 14.78 4.0 20.008 2551 195.16151 28.01454 14.39 14.38 15.63 15.62 2.5 12.009 2727 195.09238 28.04703 14.28 14.26 15.54 15.53 4.5 15.0
10 2839 195.06144 28.04130 14.34 14.31 15.63 15.60 6.0 15.010 2940 195.02665 28.00443 14.77 14.81 16.04 16.08 5.3 15.013 3390 194.88106 28.04656 14.34 14.34 15.63 15.62 3.8 20.015 2535 195.17016 27.99661 14.33 14.31 15.63 15.62 3.0 25.015 2516 195.17819 27.97150 13.74 13.72 15.10 15.08 5.0 20.0
15 2510 195.17847 27.96304 14.52 14.51 15.82 15.82 5.5 15.016 2815 195.06890 27.96754 14.58 14.56 15.75 15.74 9.0 15.016 2654 195.11653 27.95599 14.70 14.69 16.00 15.99 4.5 22.016 2651 195.11821 27.97240 14.65 14.65 15.94 15.94 1.5 20.018 3170 194.94493 27.97389 14.21 14.20 15.53 15.53 4.2 25.0
19 3367 194.88655 27.98362 13.88 13.86 15.18 15.17 6.0 35.019 3329 194.89874 27.95927 13.38 13.36 14.76 14.74 0.0 45.019 3414 194.87482 27.95646 14.15 14.13 15.51 15.50 9.6 22.019 3213 194.93219 27.99469 14.71 14.68 16.02 15.99 3.05 20.022 2541 195.16564 27.92396 13.80 13.78 15.12 15.11 3.5 25.0
25 3201 194.93503 27.91246 13.89 13.87 15.21 15.19 4.5 20.025 3222 194.92626 27.92477 14.93 14.89 16.20 16.16 4.5 10.033 3423 194.87252 27.85013 14.06 14.02 15.42 15.38 8.0 25.033 3400 194.87843 27.88418 13.78 13.73 15.09 15.05 7.0 35.045 4206 194.63355 27.45635 14.79 14.77 16.07 16.05 5.5 31.0
46 4192 194.63806 27.36437 14.65 14.65 15.87 15.89 8.0 33.075 3958 194.71707 27.78504 14.26 14.23 15.54 15.51 5.0 34.078 5038 194.29484 27.40483 14.68 14.67 15.88 15.89 4.2 42.0

The HST/ACS Coma Cluster Survey. II. 29
TABLE 3K-corrections for Galaxy SEDs at the Distance of Coma
Ellipticals (E) S0 Sa Sb Sbc Sc Scd Im SB4 SB1Band (K96) (P97) (C80) (K96) (K96) (P97) (K96) (C80) (K96) (P97) (C80) (C80) (K96) (K96)(1) (2) (3) (4) (5) (6) (7) (8) (9) (10) (11) (12) (13) (14) (15)
F475W 0.09 0.08 0.08 0.08 0.05 0.06 0.05 0.03 0.04 0.03 0.02 0.04 0.05 0.10F814W 0.02 0.01 0.01 0.00 0.01 0.01 0.01 0.02 · · · 0.00 0.00 0.00 0.02 0.00

30 Hammer et al.
TABLE 4Simulated 80% Completeness Limits Derived for a Range of Structural Parameters
F814W Logarithm(effective radius [arcsec]) F475W Logarithm(effective radius [arcsec])Model Pt Src -1.08 -0.74 -0.39 -0.05 0.30 Pt Src -1.08 -0.74 -0.39 -0.05 0.30
(1) (2) (3) (4) (5) (6) (7) (8) (9) (10) (11) (12) (13)
FC 26.8 26.5 26.0 24.9 23.5 21.5 27.8 27.5 27.0 25.5 24.5 22.0FE 26.8 26.8 26.0 25.3 24.0 22.0 27.8 27.5 27.0 26.0 25.0 23.0PC 26.8 26.8 26.3 25.5 24.5 23.0 27.8 27.5 27.0 26.3 25.5 23.9PE 26.8 26.8 26.1 25.5 24.7 23.5 27.8 27.7 27.2 26.5 25.5 24.5
Note. — F/P (flat/peak) models have Sersic indices smaller/larger than nSer=2.25, and C/E (circu-lar/elliptical) models have ellipticity smaller/larger than e=0.4; logarithmic effective radii are given at thecenter of each bin, which are equally-spaced in dex over the range Reff=0.5-60 pixels.

The HST/ACS Coma Cluster Survey. II. 31
APPENDIX
APPENDIX A: SEXTRACTOR CONFIGURATION AND CATALOG DESCRIPTION
We ran SExtractor in dual-image mode using the F814W band as the detection image for both ACS filters.The SExtractor input parameters are given below in Table 1. The SExtractor source catalogs provide over 100measurements for each object. In Table 2 we describe the three sets of flags given for each object, and Table 3 definesall other catalog entries.
TABLE 1Parameters for SExtractor version 2.5
Parameter Value
ANALYSIS THRESH . . . . . . . . 0.9BACK FILTERSIZE . . . . . . . . . 3BACK SIZE . . . . . . . . . . . . . . . . . 128 (256 for extended galaxies)BACKPHOTO THICK . . . . . . 64BACKPHOTO TYPE. . . . . . . . LOCAL (GLOBAL for extended galaxies)CLEAN . . . . . . . . . . . . . . . . . . . . . . YCLEAN PARAM. . . . . . . . . . . . . 1.0DEBLEND MINCONT . . . . . . 0.03DEBLEND NTHRESH. . . . . . . 32DETECT MINAREA . . . . . . . . 5DETECT THRESH . . . . . . . . . . 0.9FILTER. . . . . . . . . . . . . . . . . . . . . . YFILTER NAME. . . . . . . . . . . . . . gauss 2.5 5x5.convGAIN . . . . . . . . . . . . . . . . . . . . . . . . median exposure time (sec)MAG ZEROPOINT . . . . . . . . . . 26.068 (F475W), 25.937 (F814W)MASK TYPE . . . . . . . . . . . . . . . . CORRECTPHOT APERTURES . . . . . . . . 2.4,8,20,30,60,90,120,180,240PHOT AUTOPARAMS . . . . . . 2.5, 3.5PHOT PETROPARAMS. . . . . 2.0, 3.5PHOT FLUXFRAC. . . . . . . . . . 0.2,0.3,0.5,0.8,0.9PIXEL SCALE. . . . . . . . . . . . . . . 0.05SATUR LEVEL. . . . . . . . . . . . . . 85,000/GAINSEEING FWHM . . . . . . . . . . . . . 0.12WEIGHT GAIN . . . . . . . . . . . . . YWEIGHT TYPE . . . . . . . . . . . . . MAP RMS, MAP RMSWEIGHT THRESH . . . . . . . . . . 1000000, 1000000
TABLE 2Description of Source Catalog Flags
Flag Value Description
SExtractor Internal Flags (FLAGS)
0 . . . . . . . . . . . . . . . . . . . . . . . . . . . . . no flags1 . . . . . . . . . . . . . . . . . . . . . . . . . . . . . MAG AUTO photometry may be biased by nearby neighbors (>10% of area is affected)2 . . . . . . . . . . . . . . . . . . . . . . . . . . . . . object was originally blended with another source4 . . . . . . . . . . . . . . . . . . . . . . . . . . . . . one or more pixels is saturated8 . . . . . . . . . . . . . . . . . . . . . . . . . . . . . object is truncated at image boundary16. . . . . . . . . . . . . . . . . . . . . . . . . . . . aperture data are incomplete or corrupted
Exposure and Image Location Flags (IMAFLAGS ISO)
0 . . . . . . . . . . . . . . . . . . . . . . . . . . . . . object pixels have nominal exposure time and location1 . . . . . . . . . . . . . . . . . . . . . . . . . . . . . object pixel(s) are located within region of subtracted bright galaxy2 . . . . . . . . . . . . . . . . . . . . . . . . . . . . . object pixel(s) are located within 32 pixels of the image edge4 . . . . . . . . . . . . . . . . . . . . . . . . . . . . . object pixel(s) have an effective exposure less than two-thirds the nominal exposure8 . . . . . . . . . . . . . . . . . . . . . . . . . . . . . object pixel(s) have zero effective exposure (e.g. object is truncated by image edge)
Object Flags (FLAGS OBJ)
0 . . . . . . . . . . . . . . . . . . . . . . . . . . . . . extended galaxy1 . . . . . . . . . . . . . . . . . . . . . . . . . . . . . point source (e.g. star, GC, UCD, or unresolved background galaxy)2 . . . . . . . . . . . . . . . . . . . . . . . . . . . . . cosmic ray3 . . . . . . . . . . . . . . . . . . . . . . . . . . . . . image artifact

32 Hammer et al.
TABLE 3Description of Source Catalog Fields
Parameter Description
COMA ID . . . . . . . . . . . . . . . . . . . Unique ID assigned to each object (filter+ra+dec).NUMBER. . . . . . . . . . . . . . . . . . . . SE sequential value assigned to sources in each catalog (corresponds to value in segmentation map).
Photometric Parameters
BACKGROUND . . . . . . . . . . . . . SE background at centroid position [e-/sec].BACK METHOD . . . . . . . . . . . . SE background method (LOCAL or GLOBAL).FLUX[ERR] AUTO . . . . . . . . . . SE flux measured within elliptical Kron aperture [e-/sec].FLUX[ERR] ISO . . . . . . . . . . . . . SE F475W color flux measured across F814W isophotal pixels [e-/sec].FLUX MAX . . . . . . . . . . . . . . . . . SE peak flux (above background) measured across isophotal pixels [e-/sec].FLUX RADIUS [1-5] . . . . . . . . . SE radius of circular aperture that encloses 20,30,50,80, & 90% of FLUX AUTO [pix].KRON RADIUS . . . . . . . . . . . . . SE Kron radius in units of A IMAGE and B IMAGE [pix].MAG[ERR] APER [1-9] . . . . . . SE magnitude measured within fixed circular apertures (0.12,0.4,1,1.5,3,4.5,6,9,12” diam) [AB].MAG[ERR] APER [1-9] F475 SE F475W color magnitude measured in F814W fixed circular apertures [AB].MAG[ERR] AUTO. . . . . . . . . . . SE magnitude measured within elliptical Kron aperture [AB].MAG[ERR] AUTO CORRA . Corrected Kron magnitude for a typical galaxy (nSer=1.525) [AB].MAG[ERR] AUTO CORRB. . Corrected Kron magnitude for early-type Coma member (nSer from Graham & Guzman (2003)) [AB].MAG[ERR] AUTO F475 . . . . . SE F475W color magnitude measured in F814W Kron aperture [AB].MAG[ERR] ISO. . . . . . . . . . . . . . SE isophotal magnitude measured across pixels that satisfy detection threshold [AB].MAG[ERR] ISOCOR. . . . . . . . . SE corrected isophotal magnitude assuming Gaussian profile [AB].MAG[ERR] ISO F475 . . . . . . . . SE F475W color magnitude measured across F814W isophotal pixels [AB].MAG[ERR] PETRO . . . . . . . . . SE magnitude measured within elliptical Petrosian aperture [AB].MU MAX . . . . . . . . . . . . . . . . . . . . SE peak surface brightness (above background) measured across isophotal pixels [mag arcsec−1].MU THRESHOLD . . . . . . . . . . . SE detection threshold in surface brightness above BACKGROUND [mag arcsec−1].PETRO RADIUS . . . . . . . . . . . . SE Petrosian radius in units of A IMAGE and B IMAGE [pix].THRESHOLD . . . . . . . . . . . . . . . SE detection threshold above BACKGROUND [e-/sec].
Geometric Parameters
A[ERR] IMAGE . . . . . . . . . . . . . SE RMS profile of isophotal pixels along major axis [pix].AWIN[ERR] IMAGE . . . . . . . . SE windowed (Gaussian) RMS profile of isophotal pixels along major axis [pix].B[ERR] IMAGE . . . . . . . . . . . . . SE RMS profile of isophotal pixels along minor axis [pix].BWIN[ERR] IMAGE . . . . . . . . SE windowed (Gaussian) RMS profile of isophotal pixels along major axis [pix].CLASS STAR . . . . . . . . . . . . . . . . SE star/galaxy classification.CXX IMAGE . . . . . . . . . . . . . . . . SE ellipse parameter for isophotal pixels in Cartesian system [pix−2].CXY IMAGE . . . . . . . . . . . . . . . . SE ellipse parameter for isophotal pixels in Cartesian system [pix−2].CYY IMAGE . . . . . . . . . . . . . . . . SE ellipse parameter for isophotal pixels in Cartesian system [pix−2].DEC . . . . . . . . . . . . . . . . . . . . . . . . . SE declination of object barycenter [J2000].FWHM IMAGE. . . . . . . . . . . . . . SE FWHM assuming isophotal pixels have Gaussian light distribution [pix].ISOAREA IMAGE . . . . . . . . . . . SE isophotal area of pixels that satisfy analysis threshold (same as our detection threshold) [pix2].RA. . . . . . . . . . . . . . . . . . . . . . . . . . . SE right ascension of object barycenter [J2000].THETA[ERR] IMAGE . . . . . . . SE ellipse position angle of isophotal pixels (CCW w/r/t x-axis) [deg].THETAWIN[ERR] IMAGE . . SE windowed (Gaussian) ellipse position angle of isophotal pixels (CCW w/r/t x-axis) [deg].X IMAGE. . . . . . . . . . . . . . . . . . . . SE object barycenter of isophotal pixels along x axis [pix].XWIN IMAGE. . . . . . . . . . . . . . . SE windowed (Gaussian) barycenter of isophotal pixels along x axis [pix].Y IMAGE. . . . . . . . . . . . . . . . . . . . SE object barycenter of isophotal pixels along y axis [pix].YWIN IMAGE. . . . . . . . . . . . . . . SE windowed (Gaussian) barycenter of isophotal pixels along y axis [pix].
Ancillary Data
ADAMI B[ERR] . . . . . . . . . . . . . Adami et al. (2006a) CFHT CFHK12 B-band magnitude (corrected for Gal. extinction) [instr. Vega].ADAMI V[ERR] . . . . . . . . . . . . . Adami et al. (2006a) CFHT Mould V-band magnitude (corrected for Gal. extinction) [instr. Vega].ADAMI R[ERR] . . . . . . . . . . . . . Adami et al. (2006a) CFHT Mould R-band magnitude (corrected for Gal. extinction) [instr. Vega].ADAMI I[ERR] . . . . . . . . . . . . . . Adami et al. (2006a) CFHT Mould I-band magnitude (corrected for Gal. extinction) [instr. Vega].E BV . . . . . . . . . . . . . . . . . . . . . . . . Color excess from Schlegel et al. (1998) reddening maps [mag].SDSS RA . . . . . . . . . . . . . . . . . . . . SDSS DR6 right ascension [J2000].SDSS DEC. . . . . . . . . . . . . . . . . . . SDSS DR6 declination [J2000].SDSS PETROMAG U[ERR] . SDSS DR6 u-band Petrosian magnitude (not corrected for Gal. extinction) [asinh mag].SDSS PETROMAG G[ERR] . SDSS DR6 g-band Petrosian magnitude (not corrected for Gal. extinction) [asinh mag].SDSS PETROMAG R[ERR] . SDSS DR6 r-band Petrosian magnitude (not corrected for Gal. extinction) [asinh mag].SDSS PETROMAG I[ERR] . . SDSS DR6 i-band Petrosian magnitude (not corrected for Gal. extinction) [asinh mag].SDSS PETROMAG Z[ERR] . . SDSS DR6 z-band Petrosian magnitude (not corrected for Gal. extinction) [asinh mag].


![arXiv:0801.3745v1 [astro-ph] 24 Jan 2008researchonline.ljmu.ac.uk/4802/1/0801.3745v1.pdf · arXiv:0801.3745v1 [astro-ph] 24 Jan 2008 The HST/ACS Coma Cluster Survey: I - Survey Objectives](https://img.dokumen.tips/doc/110x75/5ae494d57f8b9a495c8ec15c/arxiv08013745v1-astro-ph-24-jan-08013745v1-astro-ph-24-jan-2008-the-hstacs.jpg)