Embed Size (px)
Citation preview

HAL Id hal-00296431httpshalarchives-ouvertesfrhal-00296431
Submitted on 6 Feb 2008
HAL is a multi-disciplinary open accessarchive for the deposit and dissemination of sci-entific research documents whether they are pub-lished or not The documents may come fromteaching and research institutions in France orabroad or from public or private research centers
Lrsquoarchive ouverte pluridisciplinaire HAL estdestineacutee au deacutepocirct et agrave la diffusion de documentsscientifiques de niveau recherche publieacutes ou noneacutemanant des eacutetablissements drsquoenseignement et derecherche franccedilais ou eacutetrangers des laboratoirespublics ou priveacutes
The high Arctic in extreme winters vortextemperature and MLS and ACE-FTS trace gas
evolutionG L Manney W H Daffer K B Strawbridge K A Walker C D BooneP F Bernath T Kerzenmacher M J Schwartz K Strong R J Sica et al
To cite this versionG L Manney W H Daffer K B Strawbridge K A Walker C D Boone et al The high Arcticin extreme winters vortex temperature and MLS and ACE-FTS trace gas evolution AtmosphericChemistry and Physics European Geosciences Union 2008 8 (3) pp505-522 hal-00296431
Atmos Chem Phys 8 505ndash522 2008wwwatmos-chem-physnet85052008copy Author(s) 2008 This work is licensedunder a Creative Commons License
AtmosphericChemistry
and Physics
The high Arctic in extreme winters vortex temperature and MLSand ACE-FTS trace gas evolution
G L Manney12 W H Daffer3 K B Strawbridge4 K A Walker 56 C D Boone6 P F Bernath76T Kerzenmacher5 M J Schwartz1 K Strong5 R J Sica8 K Kr uger9 H C Pumphrey10 A Lambert1M L Santee1 N J Livesey1 E E Remsberg11 M G Mlynczak11 and J R Russell III12
1Jet Propulsion Laboratory California Institute of Technology Pasadena CA USA2Department of Physics New Mexico Institute of Mining and Technology Socorro NM USA3Columbus Technologies Inc Pasadena CA USA4Science and Technology Branch Environment Canada Ontario Canada5Department of Physics University of Toronto Toronto Ontario Canada6Department of Chemistry University of Waterloo Waterloo Ontario Canada7Department of Chemistry University of York Heslington York UK8Department of Physics and Astronomy The University of Western Ontario London Ontario Canada9Leibniz-Institute for Marine Sciences at Kiel University (IFM-GEOMAR) Kiel Germany10School of Geosciences University of Edinburgh Edinburgh UK11NASA Langley Research Center Hampton VA USA12Atmospheric and Planetary Sciences Hampton University Hampton VA USA
Received 21 June 2007 ndash Published in Atmos Chem Phys Discuss 17 July 2007Revised 28 November 2007 ndash Accepted 11 December 2007 ndash Published 6 February 2008
Abstract The first three Arctic winters of the ACE mis-sion represented two extremes of winter variability Strato-spheric sudden warmings (SSWs) in 2004 and 2006 wereamong the strongest most prolonged on record 2005 wasa record cold winter Canadian Arctic Atmospheric Chem-istry Experiment (ACE) Validation Campaigns were con-ducted at Eureka (80 N 86 W) during each of these win-ters New satellite measurements from ACE-Fourier Trans-form Spectrometer (ACE-FTS) Sounding of the Atmosphereusing Broadband Emission Radiometry (SABER) and AuraMicrowave Limb Sounder (MLS) along with meteorologicalanalyses and Eureka lidar temperatures are used to detail themeteorology in these winters to demonstrate its influenceon transport and to provide a context for interpretation ofACE-FTS and validation campaign observations During the2004 and 2006 SSWs the vortex broke down throughout thestratosphere reformed quickly in the upper stratosphere andremained weak in the middle and lower stratosphere Thestratopause reformed at very high altitude near 75 km ACEmeasurements covered both vortex and extra-vortex condi-tions in each winter except in late-February through mid-March 2004 and 2006 when the strong pole-centered vor-tex that reformed after the SSWs resulted in ACE samplingonly inside the vortex in the middle through upper strato-
Correspondence toG L Manney(manneymlsjplnasagov)
sphere The 2004 and 2006 Eureka campaigns were duringthe recovery from the SSWs with the redeveloping vortexover Eureka 2005 was the coldest winter on record in thelower stratosphere but with an early final warming in mid-March The vortex was over Eureka at the start of the 2005campaign but moved away as it broke up Disparate temper-ature profile structure and vortex evolution resulted in muchlower (higher) temperatures in the upper (lower) stratospherein 2004 and 2006 than in 2005 Satellite temperatures agreewell with lidar data up to 50ndash60 km and ACE-FTS MLSand SABER show good agreement in high-latitude tempera-tures throughout the winters Consistent with a strong coldupper stratospheric vortex and enhanced radiative cooling af-ter the SSWs MLS and ACE-FTS trace gas measurementsshow strongly enhanced descent in the upper stratosphericvortex in late January through March 2006 compared to thatin 2005
1 Introduction
The Atmospheric Chemistry Experiment (ACE) has beenproviding daily atmospheric measurements with a particu-lar focus on the polar winter middle atmosphere since early2004 (Bernath et al 2005) The Canadian Arctic ACE Val-idation Campaigns (herein called Eureka campaigns) com-prise an extensive set of ground-based measurements at
Published by Copernicus Publications on behalf of the European Geosciences Union
506 G L Manney et al High Arctic in extreme winters
the Polar Environment Atmospheric Research Laboratory(PEARL ndash formerly Environment Canadarsquos Arctic Strato-spheric Ozone AStrO Observatory) at Eureka Nunavut(80 N 86 W) during each late winter since the launch ofACE eg Walker et al 2005 Kerzenmacher et al 2005Fraser et al 2007 Sung et al 2007a Sung et al (2007b1)Fu et al 20082 Data from the 2004 through 2006 cam-paigns are currently available and being used extensively forACE validation Together with the ACE-Fourier TransformSpectrometer (ACE-FTS) measurements from the Sound-ing of the Atmosphere using Broadband Emission Radiom-etry (SABER since early 2002) and Aura Microwave LimbSounder (MLS since August 2004) instruments provide anunprecedented wealth of temperature and trace gas data cov-ering the upper troposphere through the mesosphere for sev-eral years enough to begin providing important advances inour ability to examine seasonal and interannual variability inmeteorological conditions transport and chemistry
The first three winters of the ACE mission (2003ndash20042004ndash2005 and 2005ndash2006) provide an ideal ldquolaboratoryrdquofor examining the extremes of Arctic winter middle atmo-sphere variability including the effects of unusual meteo-rological conditions on transport and chemistry A ldquoma-jorrdquo stratospheric sudden warming (SSW) beginning in lateDecember 2003 was the most prolonged on record (Man-ney et al 2005) it was followed by recovery to an un-usually strong vortex in the upper stratosphere while themiddle and lower stratospheric vortices remained very weakfor the rest of the winter the final warming was unusuallylate (Manney et al 2005) The 2004ndash2005 winter was thecoldest on record in the lower stratosphere (eg Manneyet al 2006b) with arguably the most chemical ozone (O3)loss ever recorded in the Arctic (WMO 2007 and refer-ences therein) the winter ended early in a major final warm-ing The 2005ndash2006 winter was similar in many ways tothe 2003ndash2004 winter with a very strong prolonged majorSSW beginning in early to mid January a rapid recovery toan unusually strong vortex in the upper stratosphere whilethe lower and middle stratospheric vortices remained weakand a very late final warming (eg Braathen et al 2006WMO 2007 Hoffmann et al 2007) Manney et al(2007)3
1 Sung K Strong K Mittermeier R L et al Ground-based column measurements at Eureka Nunavut made using twoFourier transform infrared spectrometers in spring 2004 and 2005and comparisons with the Atmospheric Chemistry Experiment At-mos Chem Phys to be submitted 2007b
2Fu D Walker K A Mittermeier R Strong K Sung KFast H Bernath P F Boone C D Daffer W H Fogal PKolonjari F Loewen P Manney G L and Mikhailov O Si-multaneous atmospheric measurements using two Fourier transforminfrared spectrometers at the Polar Environment Atmospheric Re-search Laboratory during spring 2006 and comparisons with theAtmospheric Chemistry Experiment-Fourier Transform Spectrom-eter Atmos Chem Phys Discuss in review 2008
3Manney G L Kruger K Pawson S Minschwaner K
These three winters thus cover the extremes of recorded in-terannual variability during Arctic winter and the ACE-FTSMLS and SABER data allow us to study them in a detailnever before possible The Eureka campaigns provide ad-ditional data for focusing in on local variations includinghigh-resolution lidar temperature data and for intercompari-son with and validation of the satellite data
In the following we use the global daily temperature andtrace gas data from MLS and SABER ACE-FTS data andgridded meteorological analyses from operational assimila-tion systems to contrast the meteorology of the upper tropo-sphere through lower mesosphere in these winters We focuson the meteorological conditions using satellite data and me-teorological analyses to provide context for ACE measure-ments and the Eureka campaigns Data from long-lived tracegases measured by MLS and ACE-FTS allow exploration ofthe implications of the extreme meteorological conditions fortransport The results shown here are used to provide a me-teorological context for measurement interpretation and vali-dation presented in other papers in this Special Issue on ACEValidation
2 Data descriptions
21 Eureka lidar temperature data
Environment Canada operated a stratospheric ozone and tem-perature lidar AStrO DIfferential Absorption Lidar (AStrO-DIAL) at PEARL during the winters of 2004 TO 2006
The AStrO DIfferential Absorption Lidar (AStrO-DIAL)at PEARL has made measurements since 1993 focusing onthe polar sunrise period it was operated by EnvironmentCanada during the Eureka campaigns in 2004 through 2006Carswell et al (1996) give a detailed description of the in-strument which uses a XeCl Excimer laser (Lumonics 600)with 50 W output power at 308 nm (300 Hz) and a hydro-gen Raman cell to convert some of the energy to 353 nmThe data acquisition system provides five minute averagedprofiles with different chopper and filter combinations (tominimize non-linearity effects in the photomultiplier tubesand screen out optically thick cloud events) these profilesare pasted together and averaged to provide nightly profileswith 300 m vertical resolution Rayleigh temperature pro-files are calculated at 353 nm (which is much less sensitiveto ozone absorption than the 308 nm channel) using the idealgas law and assuming hydrostatic equilibrium as describedby Hauchecorne and Chanin (1980) Initially a constant ini-tial temperature seed at 70 km of 220 K was used this isconsistent with lower lidar than ACE temperatures near the
Schwartz M J Daffer W H Livesey N J Mlynczak M GRemsberg E E Russell III J M and Waters J W The evo-lution of the stratopause during the 2006 major warming SatelliteData and Assimilated Meteorological Analyses J Geophys Ressubmitted 2007 Available at httpmlsjplnasagov 2007b
Atmos Chem Phys 8 505ndash522 2008 wwwatmos-chem-physnet85052008
G L Manney et al High Arctic in extreme winters 507
top of average lidar profile comparisons for Eureka in 2004and 2006 (when 70-km temperatures were much higher than220 K Sect 41) and slightly higher lidar than ACE valuesin 2005 (when 70-km temperatures were often lower than220 K) shown in Sica et al (2007) Large temperature vari-ability at Eureka makes selection of the seed problematic toreduce biases in the top 10ndash15 km of the profiles the SABER(Sect 24) temperatures interpolated to Eurekarsquos location and70 km were used for the seed in the profiles shown here Afinal calibration factor is applied based on temperature datafrom the top three kilometres of Eureka radiosonde profilesLidar temperature profiles typically extend below 30 km de-pending on aerosolcloud conditions
The statistical error in the temperature profiles shown hereabovesim50 km altitude can be significant (sim20 K) due to thelimited statistics from the low signal strength However asshown by Duck and Greene (2004 and references therein)even at the highest altitudes lidar temperature profiles cancapture gravity waves and other small vertical scale structurethat is absent in lower resolution profiles from satellites
22 ACE-FTS data
SCISAT-1 the satellite carrying the ACE mission (Bernathet al 2005) was launched in August 2003 The primaryinstrument is the ACE-FTS a Fourier transform spectrom-eter featuring high resolution (002 cmminus1 corresponding to aplusmn25 cm maximum optical path difference) and broad spec-tral coverage in the infrared (750ndash4400 cmminus1) ACE-FTSworks primarily in the solar occultation mode collecting at-mospheric limb measurements using the sun as a radiationsource Latitudes of ACE-FTS measurements vary over anannual cycle with coverage as high asplusmn85 and an emphasison the polar regions in winter and spring vertical resolutionis sim3ndash4 km Version 22 (including updates for O3 HDOand N2O5) of the ACE-FTS retrievals (Boone et al 2005) isused here ACE-FTS temperatures are retrieved only above12 km below that they are constrained to values from Cana-dian Meteorological Center (CMC) analyses Temperatureprecision is typicallysim2ndash4 K through the stratosphere andsim4ndash7 K in the mesosphere Initial validation studies usingACE-FTS version 10 (McHugh et al 2005 Kerzenmacheret al 2005) and version 21 (Froidevaux et al 2006) temper-atures showed agreement to withinsim25 K or better with cor-relative measurements from 10ndash45 km ACE-FTS v22 tem-peratures are validated by Sica et al (2007 this issue) Initialvalidation of v10 ACE-FTS temperature and trace gases waspresented in a 2005 special section of Geophysical ResearchLetters (eg Walker et al 2005 McHugh et al 2005 Pe-telina et al 2005 Fussen et al 2005 Mahieu et al 2005Jin et al 2005 Clerbaux et al 2005) Detailed validationstudies of the baseline ACE-FTS v22 trace gases includingCO (Clerbaux et al 2007) and N2O (Strong et al 2007)are presented in papers in this special issue of AtmosphericChemistry and Physics
23 Aura MLS data
NASArsquos Aura satellite launched in July 2004 carriesthe Earth Observing System Microwave Limb Sounder(MLS) instrument which has been taking daily global datasince mid-August 2004 MLS measures millimeter- andsubmillimeter-wavelength thermal emission from the limb ofEarthrsquos atmosphere Detailed information on the measure-ment technique and the Aura MLS instrument is given byWaters et al (2006) The Aura MLS fields-of-view point inthe direction of orbital motion and vertically scan the limb inthe orbit plane leading to data coverage from 82 S to 82 Nlatitude on every orbit Vertical profiles are measured every165 km along the suborbital track
MLS data are currently being reprocessed with version 22(v22) algorithms reprocessing will be complete within ayear Most of data during the 2004ndash2005 and 2005ndash2006Arctic winters have been reprocessed and are used hereSchwartz et al (2007) validated MLS v22 temperaturesVertical resolution for MLS v22 temperature issim5 km inthe upper troposphere and near the tropopausesim4 km inthe stratosphere andsim8ndash9 km near the stratopause and inthe lower mesosphere precision is better thansim1 K throughthe upper stratosphere degrading to 2ndash25 K above that(Schwartz et al 2007) Detailed validation of v22 MLStrace gases shown here is given by Lambert et al (2007) forN2O and H20 Pumphrey et al (2007) for CO
Quality control recommendations given in Livesey et al(2007) and in the Aura Validation Issue papers cited aboveare used to screen the MLS data
24 SABER data
The Sounding of the Atmosphere using Broadband Emis-sion Radiometry (SABER) (Mlynczak and Russell 1995) in-strument launched on the Thermosphere Ionosphere Meso-sphere Energetics and Dynamics satellite in December 2001measures profiles of kinetic temperature using 15-microm and43-microm CO2 limb-emission radiance measurements Pres-sure is measured from spectral contrast and temperature isthen inferred from pressure and pointing heights assuminghydrostatic equilibrium The effective vertical resolution ofSABER temperature issim2 km although it is retrieved on ahigher-resolution fixed set of pressure surfaces (Remsberget al 2003) Version 106 (v106) SABER temperaturesare used here Precision of the SABER temperatures is oforder 1 K or better in the stratosphere but becomes some-what larger (sim15 K) by the middle mesosphere Test daysof the Version 106 (v106) SABER temperatures comparevery well with correlative profiles and with profiles fromthe Upper Atmosphere Research Satellite (UARS) HALOE(see also Remsberg et al 2002) Non-local-thermodynamicequilibrium effects in the very cold conditions (sim 130 K) ofthe summer polar mesopause (near 85 km) are not modeledwell in SABER v106 leading to a mesopause that issim3 km
wwwatmos-chem-physnet85052008 Atmos Chem Phys 8 505ndash522 2008
508 G L Manney et al High Arctic in extreme winters
too low compared to climatological and falling spheres data(Kutepov et al 2006) that discrepancy has been correctedin v107 The v106 bias in that region is not a factor for thewintertime conditions shown here
25 Meteorological datasets
The Goddard Earth Observing System Version 403(GEOS-4) analyses are the primary gridded meteorologi-cal dataset used here We show a comparison of upperstratosphericlower mesospheric temperatures with GEOS-5 (GEOS Version 501) and European Centre for Medium-Range Weather Forecasts (ECMWF) analyses the otheroperational systems that now provide analyses extendingthrough the lower mesosphere (to 001 hPa) neither of thelatter two datasets is currently available for all of the threeyears discussed here Manney et al (2007b)3 show tempera-ture comparisons between GEOS-5 ECMWF and the MLSand SABER satellite measurements during the 2005ndash2006Arctic winter The analyses shown here are briefly describedbelow
The GEOS-4 analyses are described by Bloom et al(2005) the assimilation procedure uses a Physical SpaceStatistical Analysis Scheme GEOS-4 data are providedon 55 hybrid (σpressure) model levels from the surface to001 hPa The horizontal grid is 10 latitude by 125 lon-gitude six-hourly average fields are provided centered at0000 0600 1200 and 1800 UT Besides the standard me-teorological variables GEOS-4 products include potentialvorticity (PV) calculated internally in the model GEOS-5 analyses (Reinecker et al 2007) have been produced forthe period of the Aura mission from August 2004 throughthe present and have now replaced GEOS-4 as the ongoingoperational system GEOS-5 uses the Gridpoint StatisticalAnalysis method of Wu et al (2002) a 3-D-Var system anda six-hour analysis window GEOS-5 analyses are providedon 72 model levels from the surface to 001 hPa and a 05
latitude by 23 longitude grid Both GEOS-4 and GEOS-5use a simple non-orographic gravity-wave parameterization(Garcia and Boville 1994) to represent waves with non-zerophase speed that are important in the upper stratosphere andmesosphere
ECMWF analyses are from a 4-D-Var system based ona spectral general circulation model (eg Simmons et al2005) ECMWF data shown here are from the T79991-level system with a top at 001 hPa that became operational inFebruary 2006 (eg Untch et al 2006 and other ECMWFnewsletters available at httpwwwecmwfintpublicationsnewsletters) for which we have obtained pre-operationaldata for several months prior to that Data from the T79991-level system were provided on model levels up to 001 hPaon a 25times25horizontal grid ECMWF uses Rayleigh fric-tion at altitudes above 5 hPa to slow down the otherwise toostrong polar night jet ECMWF analyses prior to the 2005ndash
2006 winter were from a system with a lower top and are notavailable above 01 hPa
26 Data handling for Eureka and ACE-FTS comparisons
For examination of data at specific locations either at Eu-reka or those coincident with ACE-FTS measurements grid-ded meteorological analyses and products derived from themare interpolated bi-linearly to the locations in question ForACE-FTS and some Eureka comparisons pre-calculatedldquoDerived Meteorological Productsrdquo (DMPs) are availablefrom GEOS-4 andor GEOS-5 analyses (Manney et al2007a)
For Eureka comparisons and overviews all ACE MLSand SABER profiles taken on the same day within 2 lat-itude and 8 longitude of Eureka are used For ACE-FTSand SABER this is no more than one profile per day forMLS it is typically four to eight profiles per day which areaveraged (with each given equal weight) to get the daily pro-files shown The same geographic criteria are used to deter-mine whether a SABER or MLS profile is coincident withACE-FTS but data are constrained to within 12 h before orafter each ACE-FTS measurement again MLS profiles co-incident with an ACE-FTS occultation are averaged to get asingle profile for each day
ldquoVortex-averagesrdquo of ACE-FTS and MLS data colocatedwith ACE are calculated as described by Manney et al(2007a) The GEOS-4 ACE DMPs and GEOS-5 MLS DMPsprovide the ldquoscaledrdquo PV (sPV in ldquovorticity unitsrdquo Dunkertonand Delisi 1986 Manney et al 1994) that is used to definethe vortex boundary for these calculations MLS data takenwithin plusmn1 latitudeplusmn8 longitude and 12 h of all ACE pro-files inside the vortex are included in the averages
3 Synoptic overview of the 2004 2005 and 2006 latewinters
Figures 1 through 3 show maps of sPV in the upper middleand lower stratosphere The same three days chosen duringthe Eureka campaigns and to coincide with specific compar-isons shown below are described in each year to contrastthe meteorological conditions Locations of Eureka and ofACE-FTS measurements are indicated
After the major warmings in January 2004 and 2006 theupper stratospheric vortex (Fig 1) redeveloped to be unusu-ally large and strong by 24 February (Fig 1) in contrastin 2005 the upper stratospheric vortex had weakened by thistime (as is more common for late February) and was distortedand shifted off of the pole by strong wave activity leadingto the final warming By 6 March the 2004 and 2006 up-per stratospheric vortices were still very strong while the2005 vortex was breaking down at the start of the major fi-nal warming and moved away from Eureka as it decayedBy 18 March 2005 the vortex breakup had progressed so
Atmos Chem Phys 8 505ndash522 2008 wwwatmos-chem-physnet85052008
G L Manney et al High Arctic in extreme winters 509
Fig 1 Maps of scaled potential vorticity (sPV 10minus4 sminus1) from GEOS-4 on the 1700 K isentropic surface (sim15 hPasim50 km) on (left toright) 24 February 6 March and 18 March in (top to bottom) 2004 through 2006 Contours are GEOS-4 temperatures of 240 250 260 and270 K (lower two white higher two red) Black dots show ACE-FTS observation locations and white triangles show the location of EurekaProjection is orthographic from 0 to 90 N with 0 longitude at the bottom and 90 E to the right
that there was an anticyclone (low sPV) over the pole withan elongated vortex remnant surrounding it The 2004 and2006 vortices were still strong and positioned over Eureka on18 March but had started to weaken and shrink Most ACEmeasurements were inside the vortex in the middle and up-per stratosphere in 2004 and 2006 while in 2005 many wereoutside or in vortex remnants The upper stratosphere thuspresents an apparently contrary picture in the high Arctic inFebruary and March wherein the so-called warm disturbedyears had colder stronger vortices in the upper stratospherein late winter and spring than the ldquounusually coldrdquo year
In the middle stratosphere (Fig 2) the 2004 and 2006vortices were still recovering and strengthening slowly afterthe prolonged SSWs during 24 February through 18 Marchthe vortex redeveloped more strongly in 2004 than in 2006such that during the early part of the 2006 Eureka campaignthe middle stratospheric vortex was still very weak in both
years the vortex was over Eureka in March with lowest tem-peratures over the pole and the vortex edge over Eureka inlate February During the 2005 campaign the vortex wasweakening and shifted off the pole as the major final warm-ing started ndash that SSW qualified as major (that is easterlywinds north of 60 N down to 10 hPa) on 10 March 2005 By18 March 2005 the final warming had progressed so that alarge elongated vortex remnant was located well off the poleequatorward of 60 N and high temperatures were over thepole (and Eureka) ACE measurements covered both vortexand extravortex conditions in all three years but were primar-ily inside the vortex in early March 2004 and 2006 Thuslike the upper stratosphere the Arctic during the period ofthe Eureka campaigns in the disturbed 2004 and 2006 win-ters had a stronger colder more pole-centered vortex thanthe overall much colder 2005 winter
wwwatmos-chem-physnet85052008 Atmos Chem Phys 8 505ndash522 2008
510 G L Manney et al High Arctic in extreme winters
In the lower stratosphere (Fig 3) because radiative cool-ing is much slower and the effects of the SSW propagatedown later the 2004 and 2006 vortices never recovered sub-stantially more after the SSWs The 2006 vortex in late win-ter was even smaller and weaker than that in 2004 In 2005the lower stratospheric vortex was strong but distorted andvariable throughout the winter (eg Manney et al 2006b) asseen here on 24 February and 6 March By 18 March 2005with the major final warming in progress the vortex was be-coming even more active a few days after this it broke intotwo fragments and continued to decay The vortex edge wasover Eureka in 2005 untilsim8 March 2005 ACE measure-ments sampled both vortex and extravortex conditions in allthree years
4 The 2004 2005 and 2006 late winters at Eureka
41 Overview from MLS SABER and meteorologicalanalyses
An overview of the temperature evolution in relation to thevortex at Eureka is shown in Fig 4 using temperatures fromMLS and SABER measurements coincident with Eureka andfrom GEOS-4 analyses interpolated to Eurekarsquos locationThe sPV contours on the GEOS-4 panels demark the posi-tion of the vortex edge in the stratosphere (sim200ndash07 hPa)In the early winter Eureka was well inside the vortex in eachyear (black contour farther into the vortex was last to passover Eureka) In the cold 2004ndash2005 winter with no strongmidwinter SSWs the vortex remained over Eureka until lateFebruary to early March (depending on the altitude) when itbegan its early springtime breakup The decreasing sPV val-ues (black then white contour over Eureka) show the vortexedge crossing Eurekarsquos location as it moved away from thepole during its final breakup In 2003ndash2004 the prolongedmajor SSW began in late December at which time the vor-tex moved away from Eureka Similar behavior was seen in2005ndash2006 but beginning in early to mid-January In theseyears a pole-centered upper stratospheric vortex redevelopedstrongly and quickly after the SSW (cf Fig 1) remainingover Eureka for the duration of the 2004 and 2006 validationcampaigns That the sPV contours suggest extravortex airover Eureka in the lower stratosphere during the campaignsdoes not necessarily indicate a vortex located away from Eu-reka but reflects how weak and ill-defined the vortex wasduring these periods Thus because of the different extremesin the meteorological conditions the Eureka campaigns in2004 and 2006 were conducted within the Arctic vortex ataltitudes where it had redeveloped while that in 2005 wasconducted primarily outside or at the edge of the vortex
The sPV scaling used becomes inappropriate near thestratopause since the static stability there becomes very dif-ferent from the value assumed in the PV scaling the con-tours shown typically lie just below the stratopause as defined
by the temperature maximum and thus provide another in-dication of the stratopause altitude In early winter in eachyear the stratopause at Eureka lies near 55ndash60 km consis-tent with previous studies (eg Hitchman et al 1989) thatshow it to be at higher altitude and separated from the mid-latitude stratopause as a result of gravity wave driven pro-cesses In 2004ndash2005 the stratopause altitude remains nearthat level throughout the winter dropping slightly in springand its position as represented in MLS SABER and GEOS-4 agrees well As reported by Manney et al (2007)3 duringthe 2006 major SSW the stratopause dropped to near 30 kmand then became ill-defined in late January similar behav-ior has been seen during previous strong SSWs (eg Lab-itzke 1972) In early February it reformed at very high alti-tude near 80 km over Eureka and began dropping and warm-ing rapidly during the strong vortex recovery in the upperstratospherelower mesosphere Siskind et al (2007) showedmodel simulations indicating that the very high stratopausein early February 2006 resulted from filtering by the dis-turbed stratospheric flow at lower altitudes of gravity wavesthat would normally break near 50 km and that are criticalin determining the climatological polar stratopause structure(Hitchman et al 1989 Siskind et al 2007 and referencestherein) The 2006 Eureka campaign began just after the ref-ormation of the stratopause at very high altitude As dis-cussed by Manney et al (2007)3 GEOS-4 and other opera-tional analyses (including GEOS-5 and ECMWF see below)which are not constrained by data abovesim50 km use modelswith tops no higher than 001 hPa (near 80 km) and includevery simplified parameterizations of non-orographic gravity-wave drag underestimate the variations in stratopause alti-tude and show it reforming much too low The SABER datain 2004 donrsquot cover the Arctic during the SSW or at the be-ginning of the recovery but the GEOS-4 data and the sub-sequent SABER evolution suggest that very similar behavioroccurred during the 2003ndash2004 winter
The evolution of the coldpoint the temperature mini-mum in the stratosphere is quite distinct from that of thetropopause (the latter is the shallow local minimum near250ndash400 hPa seen in GEOS-4) During most of the cold2004ndash2005 winter and before the SSWs in 2004ndash2005 and2005ndash2006 the deepest temperature minimum is between100 and 30 hPa After the SSWs started in 2004 and 2006that temperature minimum became very shallow and droppedin altitude As the stratopause reformed at very high altitudea strong temperature minimum formed below it near 3 hPa(sim45 km) and gradually moved down Thus the coldpointwas near 10ndash3 hPa during the 2004 and 2006 Eureka cam-paigns but near 30ndash60 hPa in 2005 We detail stratopauseand tropopause evolution more quantitatively below
Figure 5 show the time evolution of the stratopause atEureka from MLS SABER and GEOS-4 GEOS-5 andECMWF values are also shown for periods when theyare available (ECMWF values are shown after values areavailable up to 001 hPa) While the analyses cannot
Atmos Chem Phys 8 505ndash522 2008 wwwatmos-chem-physnet85052008
G L Manney et al High Arctic in extreme winters 511
Fig 2 As in Fig 1 but at 850 K (sim10 hPasim30 km) and with temperature overlays of 210 220 230 and 240 K (lower two white highertwo red)
accurately capture the stratopause behavior during the after-math of the 2004 and 2006 SSWs they do capture the be-havior in 2006 fairly accurately as the stratopause drops andcools during the SSW suggesting that GEOS-4 gives a rea-sonable representation of the similar period period in 2004when MLS had not yet been launched and SABER was view-ing high southern-hemisphere latitudes Before and duringthe major SSWs and throughout the 2004ndash2005 winter theGEOS-4 stratopause is slightly warm compared to the satel-lite data as discussed in more detail by Manney et al 20073this failing is alleviated to some degree in GEOS-5 andECMWF early winter stratopause temperatures agree wellwith MLS and SABER After the 2004 and 2006 SSWs dif-ferences between the analyses and the satellite data increasedramatically The GEOS-4 stratopause becomes much too
warm even after the stratopause has dropped to typical al-titude and its position is once again accurately capturedby GEOS-4 in contrast the ECMWF stratopause becomesmuch too cool until mid-March and the GEOS-5 stratopausetoo cool when the stratopause is highest but too warm afterlate February 2006 As discussed by Manney et al 20073both the low model tops (near 001 hPa very close the high-est level of the stratopause) and the simplified gravity-wavedrag parameterizations are thought to play important roles inthe failure of the analyses to capture the stratopause evolu-tion under extreme conditions MLS and SABER stratopausealtitudes and evolution typically agree very well when thestratopause altitude is very high after the 2006 SSW MLStemperatures are lower than SABER but agree quite wellwhen it is near 50ndash60 km in 2005 before the stratopause
wwwatmos-chem-physnet85052008 Atmos Chem Phys 8 505ndash522 2008
512 G L Manney et al High Arctic in extreme winters
Fig 3 As in Fig 1 but at 490 K (sim50 hPasim18 km) and with temperature overlays of 215 220 225 and 230 K (lower two white highertwo red)
breakdown after the SSW in 2006 and after it has droppedin late February through March 2006 Schwartz et al (2007)reported an MLS global-mean low bias of up to 8 K betweensim03 and 001 hPa (largest between 03 and 01 hPa) andnear-zero bias near 1 hPa with respect to several correlativedatasets the coarsening MLS vertical resolution may alsotend to result in an underestimate of stratopause temperatureat higher altitudes
The evolution of the tropopause at Eureka is shown inFig 6 using GEOS-4 analyses Because the analyses arequite well-constrained by data belowsim10 hPa and the atmo-spheric processes parameterized in the models are better un-derstood than those near and above the stratopause GEOS-4should provide an accurate picture of this region GEOS-4GEOS-5 ECMWF and other analyses (such as those fromthe Met Office) all indicate very similar behavior in each
year and agree closely with radiosonde observations at Eu-reka (not shown) SABER measurements do not and MLSoften do not extend low enough to capture the polar win-ter tropopause We show the tropopause calculated from theWMO (temperature gradient) definition using the algorithmof Reichler et al (2003) and a ldquodynamicalrdquo definition usingthe 35 PVU PV contour (which Highwood and Berrisford(2000) and Schoeberl (2004) have shown to be appropriatefor the extratropics) the coldpoint is also shown The searchfor a tropopause is halted if it is not found at a pressurehigher than 10 hPa (altitude less thansim30 km) the searchfor the coldpoint extends to 1 hPa The WMO and dynam-ical tropopause altitudes and temperatures agree quite wellthroughout and the PV at the WMO tropopause typicallyranges fromsim2 to sim5 PVU fairly symmetrically aroundthe dynamical value the tropopause thus defined coincides
Atmos Chem Phys 8 505ndash522 2008 wwwatmos-chem-physnet85052008
G L Manney et al High Arctic in extreme winters 513
Fig 4 Cross-sections of temperature (K) at Eureka as a function of time from December through April in (left to right) 2003ndash2004 through2005ndash2006 from (top to bottom) MLS SABER and GEOS-4 MLS and SABER are averages of all profiles within 2 latitude and 8
longitude of Eureka on each day GEOS-4 values are bilinearly interpolated to Eurekarsquos location Overlays on GEOS-4 plots are 12 and16times10minus4 sminus1sPV contours these values are typically in the vortex edge region in the stratosphere (see text) so going from white to blackin time shows the vortex moving over Eureka and black to white shows it moving away from Eureka Magenta lines show periods of Eurekacampaigns each year
2003-2004
30
45
60
75
Alti
tude
km
230
250
270
290
Tem
pera
ture
K
1 Dec 1 Jan 1 Feb 1 Mar 1 Apr
MLS SABER GEOS-4 GEOS-5 ECMWF
2004-2005
1 Jan 1 Feb 1 Mar 1 Apr
MLS SABER GEOS-4 GEOS-5 ECMWF
2005-2006
30
45
60
75
1 Jan 1 Feb 1 Mar 1 Apr
230
250
270
290
MLS SABER GEOS-4 GEOS-5 ECMWF
Fig 5 Timeseries in (left to right) 2003ndash2004 2004ndash2005 and 2005ndash2006 of MLS SABER and GEOS-4 stratopause (top) altitude (km)and (bottom) temperature (K) at Eureka MLS values are in black SABER in red GEOS-4 in blue Values from GEOS-5 (cyan) are includedon the 2004ndash2005 and 2005ndash2006 panels and from ECMWF (green) on the 2005ndash2006 panels Magenta lines show periods of Eurekacampaigns
with the shallow temperature minimum near 250ndash400 hPa(5ndash8 km) mentioned above In contrast (note radically dif-ferent altitude scales) the coldpoint value varies fromsim8to over 40 km in 2004 and 2006 During 2004 and 2006the temperature minimum is near 3 hPa at the beginning ofthe recovery from the SSWs during the first part of the Eu-reka campaigns dropping to near 10 hPa (sim30 km) in March
During most of the 2005 winter the coldpoint was near 20ndash25 km and up tosim25 K colder than the tropopause Afterthe final warming in 2005 the coldpoint coincided with theWMO and dynamical tropopauses As shown in more detailbelow (Sect 42) the variations in temperature extrema inthe winters with prolonged SSWs are reflected in very un-usual temperature profiles throughout the stratosphere
wwwatmos-chem-physnet85052008 Atmos Chem Phys 8 505ndash522 2008
514 G L Manney et al High Arctic in extreme winters
2003-2004
5
7
9
11
Alti
tude
km
190
200
210
220
230
Tem
pera
ture
K
1 Dec 1 Jan 1 Feb 1 Mar 1 Apr
2004-2005
1 Dec 1 Jan 1 Feb 1 Mar 1 Apr
2005-2006
5
15
25
35
1 Dec 1 Jan 1 Feb 1 Mar 1 Apr
190
200
210
220
230
Fig 6 Timeseries in (left to right) 2003ndash2004 2004ndash2005 and 2005ndash2006 of GEOS-4 tropopause (top) altitude (km) and (bottom) tempera-ture (K) at Eureka Tropopause from WMO (temperature gradient) definition is in black from dynamical definition (35 PVU) in green andldquocoldpointrdquo value in blue The left-hand y-axis scale is for WMO and dynamical definitions right-hand scale for cold point (ranges are thesame only for temperature) dotted lines show the WMO tropopause altitude on the coldpoint scale Magenta lines show periods of Eurekacampaigns
Fig 7 Lidar profiles taken at Eureka on selected days in February and March 2004 and 2005 and February 2006 compared with coincidentprofiles from SABER (red lines with triangles) ACE-FTS (orange lines with squares) and MLS (blue lines with dots)
While tropopause variations during the SSWs are not asdramatic as those of the stratopause the tropopause at Eu-reka was distinctly higher and colder in the 2004ndash2005 win-
ter than the other two winters Day-to-day variations dom-inate the variability but it appears that the tropopause atthe very high latitude of Eureka drops and warms during
Atmos Chem Phys 8 505ndash522 2008 wwwatmos-chem-physnet85052008
G L Manney et al High Arctic in extreme winters 515
Fig 8 Cross-sections of temperature from (top) SABER and (bottom) MLS around the 80 N latitude circle on (left) 24 February 20046 March 2005 and 26 February 2006 Vertical black line is at longitude of Eureka
the SSWs at the same time the stratopause is dropping andcooling Examination of hemispheric tropopause structure(not shown) indicates a higher colder tropopause prior to theSSWs at lower latitudes nearsim60 N consistent with forc-ing of the warming related to upper tropospheric wave activ-ity The parallel evolution of the stratopause and tropopauseclearly demonstrates coupling of the entire troposphere-stratosphere-mesosphere system
We show below profile comparisons of temperatures fromACE-FTS MLS and SABER satellite data with Eureka lidardata during the Eureka campaigns These provide a close-upview of the striking differences in meteorological conditionsin the high Arctic between the warmest and the coldest Arcticwinters and how those differences and local variations inmeteorology can affect interpretation of the Eureka data
42 Comparisons with Eureka lidar
Figure 7 shows selected lidar temperature profiles recorded atEureka during the three winters compared with MLS (2005and 2006) SABER and ACE-FTS
Comparing the profiles in late February of 2004 2005and 2006 (Fig 7 top row) shows the striking differencein temperature structure at Eureka for the two types of ex-treme conditions represented in these winters In 2005 theprofiles show a broad temperature minimum betweensim300and 30 hPa (sim10ndash25 km) and a sharp temperature maxi-mum near 1 to 03 hPa (sim55ndash60 km) this is a characteris-tic wintertime temperature structure in the Arctic In con-trast in February 2004 and 2006 there was a shallow tem-perature minimum near 300ndash400 hPa (below 10 km not seen
here) followed by a gradual decrease in temperature up to3 to 1 hPa (sim35ndash45 km) with a strong temperature max-imum between 01 and 001 hPa (sim65ndash80 km) Thus theconditions during the recovery from the prolonged SSWsled to temperatures that decreased with altitude throughmost of the stratosphere (commonly defined as the regionwhere temperature increases with altitude) The profile inMarch 2004 shows the stratopause and coldpoint altitudesbeginning to drop but still much higher than the more typi-cal profile for March 2005 (no Eureka lidar data were takenin March 2006)
There is quite good agreement between the lidar profilesand those from each of the satellite instruments belowsim55ndash60 km (01 to 06 hPa) and usually higher with the satellitedata nearly always falling within the lidar uncertainty esti-mates A more detailed look at the temperature structure inthe region surrounding Eureka from MLS and SABER datashows that many features where lidar and satellite profilesappear to disagree may be explained by local temperaturevariations
On 24 February 2004 lidar ACE-FTS and SABER pro-files all show a notch near the stratopause this feature ap-pears in some or all of the instrumentsrsquo profiles on some butnot other surrounding days Figure 8 (left panels) shows across-section of SABER temperature at 80 N on 24 Febru-ary 2004 with the longitude of Eureka indicated Thereis a double-peak in stratopause temperature extending overEureka this is the root of the secondary temperature max-imum that extends upward and equatorward from the pri-mary stratopause during this period discussed by Manney et
wwwatmos-chem-physnet85052008 Atmos Chem Phys 8 505ndash522 2008
516 G L Manney et al High Arctic in extreme winters
al20073 Note also that Eureka is at the edge of a regionwith very strong gradients in stratopause temperature andaltitude This suggests that the temperature differences be-tween instruments at this time are real atmospheric featureswith small horizontal extent such that they may be capturedby some but not other instruments on any given day depend-ing on the exact measurement location The stratopause al-titude as seen in SABER data is fairly constant in the regionaround Eureka on 24 February 2004 consistent with this thestratopause altitude in the lidar profile appears to agree wellwith that in SABER and ACE-FTS
On 6 March 2005 there is a laminar structure in the pro-files with a local temperature minimum near 45 km and max-imum near 35 km with some variation in the representationin different datasets Cross-sections of MLS and SABERtemperatures (Fig 8) center panels show a double-peak inthe temperatures over Eureka in this region that it is broaderin MLS is likely related to MLSrsquo coarser vertical resolutionand may explain the more pronounced maximum in SABER(in closer agreement with the lidar profile) which has thehighest vertical resolution of the satellite instruments Thesharper local minimum in the lidar profile could also be re-lated to its high resolution being able to capture local struc-ture in this region of very strong temperature gradients
The profiles on 26 February 2006 (Fig 7) show large vari-ations in stratopause altitude between the instruments Fig-ure 8 (right panels) shows significant differences in structurebetween MLS and SABER at Eureka the analyses (althoughstill not representing the stratopause well at its highest al-titudes) have structure more similar to MLS in the regionwest of Eureka where the stratopause dips suggesting thatthe coarser horizontal resolution of SABER may result in un-dersampling of that transition region In this region there arevery strong vertical and horizontal temperature gradients asthe narrow stratopause tilts sharply downward thus smalldifferences in position could very well result in significantchanges in stratopause altitude
The above examples not only detail the dramatic differ-ences in profile structure resulting from the extreme con-ditions in the three winters but also show how the detailsof those meteorological conditions in the region immedi-ately surrounding Eureka may be critical to interpreting tem-perature measurements and intercomparisons of temperaturemeasurements there In all three years but particularly in2004 and 2006 the very large atmospheric variability aroundEureka can lead to real differences in nearly-coincident pro-files
43 MLS Trace Gases at Eureka
One of the important questions that arises from the disparateconditions in these three extreme winters is how these con-ditions affect transport in and around the polar vortex Ran-dall et al (2005 2006) showed unusually strong descent inthe late winters of 2004 and 2006 with mesospheric air de-
scending into the unusually strong vortex that reformed afterthe major SSWs in those years Model simulations (Siskindet al 2007) indicate the filtering of gravity waves by thedisturbed stratospheric flow responsible for the very high al-titude stratopause after the SSW also resulted in enhancedradiative cooling not only making the upper stratospherecolder than usual and strengthening the redeveloping vor-tex but also producing enhanced descent of mesospheric airinto the upper stratospheric vortex Unusual trace gas evo-lution may also be expected as a result of strong mixing ofvortex and extra-vortex air during the SSWs For measure-ments at Eureka its position relative to the vortex also addsto the complexity of observed trace gas evolution Numeroustrace gas measurements were made during the Eureka cam-paigns Walker et al 2005 Kerzenmacher et al 2005 Sunget al 2007a Sung et al 2007b1 Frase et al 2007 Fu etal 2007 and their interpretation is facilitated by knowledgeof the overall patterns of transport in the region We use time-series of MLS long-lived trace gas evolution at Eureka to il-lustrate how transport in the three winters controls trace gasevolution at Eureka
Figure 9 shows timeseries of the long-lived tracers COH2O and N2O from MLS data coincident with Eureka dur-ing the 2004ndash2005 and 2005ndash2006 winters As noted in(Sect 41) the position of the top of the sPV contours givesan indication of the location of the stratopause (Sect 41)while the Eureka crossings of those contours in time showwhen the stratospheric vortex was over Eureka The vortexwas over Eureka during most of the 2004ndash2005 winter andCO and H2O show the signatures of strong confined descentin the lower mesosphere through midstratosphere throughlate March (descending high COlow H2O contours) Thevortex moved away from Eureka in early March 2005 atthe beginning of the major final warming but its remnantsmoved back over Eureka twice later in the month Duringthose periods the high CO in the vortex over Eureka indi-cates that it had descended from the mesosphere to well be-low 10 hPa (sim30 km) over the course of the 2004ndash2005 win-ter the peak H2O mixing ratio initially in the upper strato-sphere descended tosim40 hPa (sim22 km) When the vortexwas over Eureka during the 2005 campaign that signaturewas seen in high CO high H2O belowsim10 hPa (sim30 km)and very low N2O Aftersim10 March the vortex had brokenup abovesim3ndash7 hPa (sim35ndash40 km) and thus tracer values sim-ilar to those typical of midlatitudes were seen since air fromvortex remnants has been diluted by mixing with extravortexair (eg Manney et al 2006a 2007a)
In contrast in 2005ndash2006 the signature of strong descentin CO and H2O is interrupted by the SSW The disappearanceof that signature is not only because the vortex (or its rem-nant) moves away from Eureka but also because the near-complete break up of the vortex resulted in extensive mixingof midlatitude and vortex air When the vortex moved backover Eureka in early February (at which point it was reform-ing only in the upper stratosphere) there is little indication of
Atmos Chem Phys 8 505ndash522 2008 wwwatmos-chem-physnet85052008
G L Manney et al High Arctic in extreme winters 517
Fig 9 Timeseries in (left) 2004ndash2005 and (right) 2005ndash2006 of trace gas measurements from MLS near Eureka (top) CO (center) H2Oand (bottom) N2O Values on each day are averages of all observations coincident (see text) with Eureka on that day Overlaid contours aresPV in the vortex edge region with the black contour towards the vortex interior Vertical red lines show periods of Eureka measurementcampaigns Vertical range for CO and H2O is into the lower mesosphere vertical range for N2O is into the upper stratosphere
Fig 10 Timeseries for 1 December through 15 April (left to right) 2003ndash2004 2004ndash2005 and 2005ndash2006 of sPV (10minus4 sminus1) fromGEOS-4 at ACE observation locations (colors) as a function of EqL Overlaid contours are GEOS-4 sPV of 12 16 and 20times10minus4 sminus1
trace gas values similar to those in the vortex before the SSWHowever near the stratopause as the vortex redevelopedthere was also strong descent from the lower mesosphere intothe stratospheric vortex in an echo of the behavior typical ofthe fall vortex development Consistent with the argumentsgiven above and the simulations of Siskind et al (2007) thisdescent is much stronger than that at high altitudes in the
2005 late winter when the upper stratospheric vortex wasweakening and warming The redeveloping vortex is overEureka throughout the 2006 campaign with correspondingevidence of enhanced descent The lower ldquovortex edgerdquosPV contour indicates that the vortex had not redevelopedenough to be well-defined at lower altitudes the descent ofthis contour over the course of the campaign accompanied
wwwatmos-chem-physnet85052008 Atmos Chem Phys 8 505ndash522 2008
518 G L Manney et al High Arctic in extreme winters
by that of vortex-like trace gas values reflects the redevel-opment of the vortex while day-to-day variations indicateprimarily changes in position of the vortex with respect toEureka The lower stratospheric vortex remained very weakand never redeveloped the strong tracer gradients across itsedge that were seen before the SSW thus N2O (H2O) be-lowsim20 hPa (sim27 km) during the campaign are considerablyhigher (lower) than those in the vortex before the warming
5 ACE-FTS Meteorological Context and MLSSABERComparisons
ACE-FTS provided measurements covering the high Arc-tic in February through March 2004 and January throughMarch 2005 and 2006 The ACE observation locationsshown in Figs 1 through 3 (Sect 3) indicate that ACE sam-pled both vortex and extra-vortex air on many days Thepatterns and extent of vortex and extra-vortex sampling arecritical to interpretation of ACE measurements and dependstrongly on the meteorological conditions
Figure 10 shows sPV at all ACE measurement locationswith equivalent latitude (EqL the latitude that would en-close the same area as a given PV contour eg Butchartand Remsberg (1986)) greater than 20 N as a function ofEqL and time in the upper (1700 Ksim2 hPa) middle (850 Ksim10 hPa) and lower (490 Ksim50 hPa) stratosphere illustrat-ing ACE coverage of the vortex The overlaid sPV contoursare typically (especially in the middle to lower stratosphere)in the region of strong gradients demarking the vortex edgeduring winter ndash for example in January through early to mid-March 2005 at 490 and 850 K (a period with a strong coldvortex) In contrast in 2004 and 2006 the gradients at thehigher two values tighten in the middle stratosphere goinginto the SSWs (until early January 2004 late January 2006)and then weaken dramatically reflecting the vortex break-down In the upper stratosphere (1700 K) the SSWs are char-acterized by rapid shrinking of the vortex area (late Decem-ber 2003 mid-January 2006) with sPV gradients remainingstrong followed immediately by a rapid increase in that areaas enhanced radiative cooling leads to reformation of a largestrong vortex In 2005 and other winters without strongSSWs the upper stratospheric vortex is never as strong asthat after the 2004 and 2006 SSWs and begins to breakdown in late February a few weeks before the breakdownin the middle and lower stratosphere During each winterACE sampling patterns lead to relatively complete coverageof the vortex in the middle stratosphere except during thevortex breakdown in late January 2006 A significant differ-ence related to the meteorology is seen in early March whenACE sampled at very high latitudes in 2005 the vortex isbreaking up in the middle stratosphere and thus very highlatitude sampling includes extravortex air whereas in 2004and 2006 the vortex has reformed and is relatively pole-centered after the SSWs (Fig 2) so ACE sampled almost en-tirely well inside the vortex A similar effect is seen in the
upper stratosphere from late February to mid-March 2004and from mid-February to late March 2006 Upper strato-spheric ACE measurements in 2005 do not cover the vortexcore region as well as in the more disturbed winters In thelower stratosphere ACE measurements typically cover theextravortex and vortex edge regions well but extend to high-est equivalent latitudes (vortex core) only when the vortex isweak and ill-defined after the SSWs in 2004 and 2006
Comparison of ACE-FTS high-latitude temperatures withthose from MLS and SABER at locations coincident withACE (Fig 11) demonstrates that the evolution seen at Eu-reka (Sect 41) is characteristic of the high Arctic Fig-ure 11 shows timeseries of ACE-FTS temperatures at lati-tudes above 60 N averaged over all measurements for eachday compared with daily averages of coincident MLS andSABER measurements The top panels show the latitudeand number of ACE-FTS profiles included on each day Ex-cept on days with few ACE-FTS measurements this is sim-ilar to a zonal mean with latitude varying from day to dayACE-FTS captured the main features of temperature evo-lution during each winter with a low stratopause after theSSWs in 2004 and 2006 redeveloping at very high altitudeaccompanied by an unusually high-altitude coldpoint The2005 stratopause remained near 50ndash60 kmsim02ndash10 hPa)throughout the winter with a coldpoint near 15ndash25 km (sim30ndash100 hPa) ACE-FTS temperatures show good agreement withMLS and SABER throughout the periods with coincidentmeasurements with some small biases consistent with thosereported by Schwartz et al (2007) and Sica et al (2007) indetailed quantitative comparisons for statistical samples
Because of generally good coverage of the vortex through-out the stratosphere (Fig 10) ldquovortex averagesrdquo of ACE-FTSdata are expected to be representative in January throughMarch and reflect interannual differences in meteorologyFigure 12 shows ACE-FTS vortex-averaged CO and N2Ocompared to coincident MLS data Steady descent is seenin January through March 2005 from the mesosphere to themidstratosphere with similar (but stronger) descent in Jan-uary 2006 interrupted by the SSW then followed by a ldquore-playrdquo with enhanced descent from the mesosphere in Febru-ary and March 2006 similar to the patterns that were appar-ent at Eureka (Fig 9) when the vortex was over it CO in themiddle and upper stratosphere shows the signature of mixingand vortex breakup during the SSW in late January 2006 inthe dissipation of very high values characteristic of the vortexas they are mixed with midlatitude air with near-zero CO Inthe lower stratosphere in 2005 N2O shows the dominant sig-nature of confined descent in the overall downward progres-sion of the contours through early March after mid-Marchwhen the lower stratospheric vortex is breaking up large in-creases in N2O indicate not only a signature of mixing butalso the difficulty in defining the vortex edge appropriatelyat such times (Manney et al 2007a) In contrast in 2006there was an abrupt increase in vortex N2O at the time of theSSW as the vortex broke down the vortex remained weak
Atmos Chem Phys 8 505ndash522 2008 wwwatmos-chem-physnet85052008
G L Manney et al High Arctic in extreme winters 519
Fig 11 Timeseries of average temperatures north of 60 N (colored panels) from (top to bottom) ACE-FTS MLS and SABER ACE-FTSvalues are the average of all occultations on each day north of 60 N MLS and SABER values are averages of all observations coincident(see text) with the ACE-FTS observations used on each day Top panels show average latitude of ACE-FTS observations (black) and numberof ACE-FTS profiles included (blue) on each day Time period covered is 5 January through 25 March in (left to right) 2004 2005 and 2006
and ill-defined for the remainder of the winter and N2O re-mained relatively constant ACE-FTS and coincident MLSCO and N2O agree quite well consistent with more quan-titative comparisons (Clerbaux et al 2007 Lambert et al2007 Manney et al 2007a Pumphrey et al 2007 Stronget al 2007)
6 Summary and conclusions
The winters of the first three years of ACE observationsand Canadian Arctic ACE Validation Campaigns at Eureka(ldquoEureka campaignsrdquo) represented the two extremes of Arc-tic winter variability New satellite datasets available duringthese winters from ACE-FTS MLS and SABER provide anunprecedented wealth of temperature and trace gas data cov-ering the upper troposphere through the mesosphere We useACE-FTS MLS and SABER satellite data along with me-teorological analyses and high-resolution ground-based tem-perature data to detail the dramatic contrasts in the meteo-rology during extremely cold and extremely disturbed Arcticwinters and relate these differences to variations in transportand chemistry We focus on conditions over Eureka and onthe effects of the extreme meteorology on ACE sampling andinterpretation of ACE-FTS data these results provide con-text for interpretation of validation results presented in otherpapers in this special issue
There were unusually strong and prolonged major strato-spheric sudden warmings (SSWs) in January in both 2004and 2006 Temperature and vortex evolution was verysimilar in the two years with the vortex breaking downthroughout the stratosphere reforming quickly in the upperstratosphere while remaining weak in the middle and (espe-cially) lower stratosphere In both years the satellite datashow that the stratopause (temperature maximum) reformedat very high altitude (near 80 km) during recovery fromthe SSWs Parallel changes in tropopause and stratopausedemonstrate troposphere-stratosphere-mesosphere couplingAssimilated meteorological analyses do not capture the ex-treme stratopause variations The 2004 and 2006 Eurekacampaigns were during the recovery from the SSWs with theredeveloping vortex over Eureka Consistent with this 2004and 2006 temperatures at Eureka show a sharp shallow lowtropopause near 400 hPa a local temperature maximum near200 hPa decreasing temperatures up tosim10ndash3 hPa (wheretemperatures were as much assim25 K below tropopause val-ues in February to early March) and stratopause above001 hPa near 75ndash80 km The strong symmetric vortex fol-lowing the SSWs resulted in ACE measurements that wereentirely inside the vortex in the middle and upper strato-sphere in mid-February through mid-March during theseyears
wwwatmos-chem-physnet85052008 Atmos Chem Phys 8 505ndash522 2008
520 G L Manney et al High Arctic in extreme winters
Fig 12Timeseries in (left) 2005 and (right) 2006 of (top set) CO and (bottom set) N2O averaged within the vortex (defined by 14times10minus4 sminus1
contour) from ACE-FTS (top) and from MLS observations coincident with ACE (bottom) Vertical range for CO is from 400 through 3200 Kfor N2O from 400 through 1600 K
In contrast the 2005 winter was the coldest on recordin the lower stratosphere but with an early final warm-ingvortex breakup in mid-March the upper stratosphericvortex began weakening and warming by February ACEsampling of the upper stratospheric vortex core was lesscomplete than that of the strong upper stratospheric vorticesin 2004 and 2006 At the start of the 2005 Eureka cam-paign through early March 2005 the vortex was over Eu-reka and temperature structure was typical of a cold wintervortex with a weak tropopause near 200ndash300 hPa coldpointbetweensim100 andsim30 hPa and the stratopause near 05ndash01 hPa Upper stratospheric temperatures over Eureka wereup tosim50 K lower in 2004 and 2006 (when a strong coldvortex reformed after the SSW) than in 2005 (when the upperstratospheric vortex was already breaking down) while mid-dle and lower stratospheric temperatures were up tosim20 Khigher in 2004 and 2006 than in 2005
ACE-FTS and coincident MLS and SABER measure-ments representing average high-latitude conditions reflectsimilar temperature structure and evolution to that seen at Eu-reka in all three winters Temperature profiles from the Eu-reka lidar show very good agreement with coincident MLSACE-FTS and SABER measurements up to 50ndash60 km withmost differences in small vertical-scale structure consistentwith the changing meteorological conditions around Eureka
and the instrumentsrsquo sampling patterns and resolution ACE-FTS daily average high-latitude temperatures agree well withcoincident MLS and SABER daily averages
MLS trace gas distributions over Eureka highlight the ef-fects of differing vortex conditions on transport and single-station sampling Consistent with the strong cold upperstratospheric vortex and the enhanced radiative cooling driv-ing its redevelopment after the 2004 and 2006 SSWs MLSCO and H2O measurements show enhanced vortex descentover Eureka in 2006 compared to that in 2005 when theupper stratospheric vortex (and associated descent) was al-ready weakening Since the vortex was over Eureka duringthe 2006 campaign whereas it was breaking up and movingaway from Eureka during the 2005 campaign MLS observedlower (higher) H2O and CO (N2O) near Eureka in 2005 thanin 2006 in and above the middle stratosphere Since thelower stratospheric vortex was warm and ill-defined in 2006but over Eureka and still cold at the start of the 2005 cam-paign N2O (H2O) at Eureka was low (high) in late Febru-ary 2005 compared to the same time in 2006 ACE-FTSvortex-averaged tracers compared with coincident MLS val-ues show similar patterns of vortex transport
The ACE-FTS MLS and SABER datasets along withhigh-resolution temperatures recorded at Eureka during the2003ndash2004 2004ndash2005 and 2005ndash2006 Arctic winters have
Atmos Chem Phys 8 505ndash522 2008 wwwatmos-chem-physnet85052008
G L Manney et al High Arctic in extreme winters 521
allowed us to compare in detail the meteorology during thesedisparate winters to demonstrate how these conditions af-fected transport and to provide a meteorological context forinterpretation of ACE-FTS measurements and those takenduring the Canadian Arctic ACE Validation Campaigns
AcknowledgementsWe thank the MLS Science Team espe-cially L Froidevaux R P Thurstans R Fuller B W KnospB J Mills D T Cuddy C Vuu A Mousessian P A Wagner andX Sabounchi and the ACE Science Team especially S McLeodR Skelton and R Hughes for their continuing support andassistance Thanks to GMAO and S Pawson for GEOS data andadvice on their usage and ECMWF for their products shown hereResearch at the Jet Propulsion Laboratory California Institute ofTechnology is done under contract with the National Aeronauticsand Space Administration Funding for the ACE mission wasprovided primarily by the Canadian Space Agency (CSA) and theNatural Sciences and Engineering Research Council of Canada(NSERC) The Canadian Arctic ACE Validation campaign projecthas been supported by CSA Environment Canada (EC) NSERCthe Northern Scientific Training Program and the Centre for GlobalChange Science at the University of Toronto Logistical andon-site technical support for the 2006 campaign was provided bythe Canadian Network for the Detection of Atmospheric Change(CANDAC) CANDAC and PEARL are funded by the CanadianFoundation for Climate and Atmospheric Sciences NSERC theCanadian Foundation for Innovation the Ontario Innovation Trustand the Atlantic Innovation FundNova Scotia Research InnovationTrust
Edited by A Richter
References
Bernath B F McElroy C T Abrams M C et al AtmosphericChemistry Experiment (ACE) mission overview Geophys ResLett 32 L15S01 doi1010292005GL022386 2005
Bloom S C McElroy C T Abrams M C et al The GoddardEarth Observing Data Assimilation System GEOS DAS Version403 Documentation and Validation Tech Rep 104606 V26NASA 2005
Boone C D Nassar R Walker K A Rochon Y McLeodS D Rinsland C P and Bernath P F Retrievals for the Atmo-spheric Chemistry Experiment Fourier-Transform SpectrometerAppl Opt 44 7218ndash7231 2005
Braathen G Grunow K Kivi R Kyro E Raffalski U KoppG Urban J Hochschild G Goutail F Manney G LRosevall J and Murtagh D Joint WMOEU Arctic ozonebulletin winterspring summary Tech Rep 2006-1 World Me-teorological OrganizationEuropean Ozone Research Coordinat-ing Unit available at httpwwwwmointpagesprogarepgawozoneindexhtml 2006
Butchart N and Remsberg E E The area of the stratosphericpolar vortex as a diagnostic for tracer transport on an isentropicsurface J Atmos Sci 43 1319ndash1339 1986
Carswell A I Donovan D P Bird J C Duck T J Pal S Rand Whiteway J A Measurements at the Eureka Arctic NDSCstation with a Raman DIAL system in Advances in atmospheric
remote sensing with lidar edited by Ansmann A and NeuberR 521ndash524 Springer-Verlag Berlin 1996
Clerbaux C Coheur P-F Hurtmans D Barret B CarleerM Semeniuk K McConnell J C Boone C and BernathP Carbon monoxide distribution from the ACE-FTS solaroccultation measurements Geophys Res Lett 32 L16S01doi1010292005GL022394 2005
Clerbaux C George M Turquety S et al CO measurementsfrom the ACE-FTS satellite instrument data analysis and valida-tion using ground-based airborne and spaceborne observationsAtmos Chem Phys Discuss 7 15 277ndash15 340 2007
Duck T J and Greene M D High Arctic observations ofmesospheric inversion layers Geophys Res Lett 31 L02105doi1010292003GL018481 2004
Dunkerton T J and Delisi D P Evolution of potential vorticityin the winter stratosphere of JanuaryndashFebruary 1979 J GeophysRes 91 1199ndash1208 1986
Fraser A Goutail F Strong K and Others UV-Visible mea-surements of ozone and NO2 at PEARL Eureka Nunavut 2004ndash2007 Atmos Chem Phys Discuss 7 16 283ndash16 347 2007
Froidevaux L Livesey N J Read W G et al Early Validationanalyses of atmospheric profiles from EOS MLS on the AuraSatellite IEEE Trans Geosci Remote Sens 44 1106ndash11212006
Fussen D Vanhellemont F Dodion J Bingen C Walker K ABoone C D McLeod S D and Bernath P F Initial intercom-parison of ozone and nitrogen dioxide number density profiles re-trieved by the ACE-FTS and GOMOS occultation experimentsGeophys Res Lett 32 L16S02 doi1010292005GL0224682005
Garcia R R and Boville B A ldquoDownward controlrdquo of the meanmeridional circulation and temperature distribution of the polarwinter stratosphere J Atmos Sci 51 2238ndash2245 1994
Hauchecorne A and Chanin M L Density and temperature pro-files obtained by lidar between 35 and 70 km Geophys ResLett 8 565ndash569 1980
Highwood E J and Berrisford P Properties of the Arctictropopause Q J Roy Meteorol Soc 126 1515ndash1532 2000
Hitchman M H Gille J C Rodgers C D and Brasseur GThe separated polar stratopause A gravity wave driven climato-logical feature J Atmos Sci 46 410ndash422 1989
Hoffmann P Singer W Keuer D Hocking W K Kunze Mand Murayama Y Latitudinal and longitudinal variability ofmesospheric winds and temperatures during stratospheric warm-ing events J Atmos Sol-Ter Phys 69 2355ndash2366 2007
Jin J J Semeniuk K Jonsson A I et al Co-located ACE-FTS and OdinSMR stratospheric-mesospheric CO 2004 mea-surements and comparison with a GCM Geophys Res Lett 32L15S03 doi1010292005GL022 433 2005
Kerzenmacher T E Walker K A Strong K et al Measure-ments of O3 NO2 and Temperature During the 2004 Cana-dian Arctic ACE Validation Campaign Geophys Res Lett 32L16S07 doi1010292005GL023032 2005
Kutepov A Feofilov A Marshall B Gordley L Pesnell WGoldberg R and Russell III J SABER temperature observa-tions in the summer polar mesosphere and lower thermosphereImportance of accounting for the CO2 ν2 quanta VndashV exchangeGeophys Res Lett 33 L21809 doi1010292006GL0265912006
wwwatmos-chem-physnet85052008 Atmos Chem Phys 8 505ndash522 2008
522 G L Manney et al High Arctic in extreme winters
Labitzke K Temperature changes in the mesosphere and strato-sphere connected with circulation changes in winter J AtmosSci 29 756ndash766 1972
Lambert A Read W G Livesey N J et al Validation of theAura Microwave Limb Sounder stratospheric water vapor andnitrous oxide measurements J Geophys Res J Geophys Res112 D24S36 doi1010292007JD008724 2007
Livesey N J Read W J Filipiak M J et al Validation of AuraMicrowave Limb Sounder O3 and CO observations in the uppertroposphere and lower stratosphere J Geophys Res in press2007 Available at httpmlsjplnasagov2007
Mahieu E Zander R Duchatelet P et al Comparisons betweenACE-FTS and ground-based measurements of stratospheric HCland ClONO2 loadings at northern latitudes Geophys Res Lett32 L15S08 doi1010292005GL022396 2005
Manney G L Zurek R W OrsquoNeill A and Swinbank R Onthe motion of air through the stratospheric polar vortex J AtmosSci 51 2973ndash2994 1994
Manney G L Kruger K Sabutis J L Sena S A and PawsonS The remarkable 2003ndash2004 winter and other recent warmwinters in the Arctic stratosphere since the late 1990s J Geo-phys Res 110 D04107 doi1010292004JD005367 2005
Manney G L Livesey N J Jimenez C J Pumphrey H CSantee M L MacKenzie I A Froidevaux L and Wa-ters J W EOS MLS observations of ldquofrozen-inrdquo anticy-clonic air in Arctic summer Geophys Res Lett 33 L06810doi1010292005GL025418 2006a
Manney G L Santee M L Froidevaux L Hoppel K LiveseyN J and Waters J W EOS MLS observations of ozone loss inthe 2004ndash2005 Arctic winter Geophys Res Lett 33 L04802doi1010292005GL024494 2006b
Manney G L Daffer W H Zawodny J M et al Solar Occul-tation Satellite Data and Derived Meteorological Products Sam-pling Issues and Comparisons with Aura MLS J Geophys Res112 D24S31 doi1010292007JD008709 2007
McHugh M Magill B Walker K A Boone C D BernathP F and Russell III J M Comparison of atmospheric retrievalsfrom ACE and HALOE Geophys Res Lett 32 L15S10doi1010292005GL022403 2005
Mlynczak M and Russell J An overview of the SABER experi-ment for the TIMED mission NASA Langley Research CenterOptical Remote Sensing of the Atmosphere 2 5ndash7 1995
Petelina S V Llewellyn E J Walker K A Degenstein D ABoone C D Bernath P F Haley C S von Savigny C LloydN D and Gattinger R L Validation of ACE-FTS stratosphericozone profiles against OdinOSIRIS measurements GeophysRes Lett 32 L15S06 doi1010292005GL022377 2005
Pumphrey H C Filipiak M J Livesey N J et al Valida-tion of the Aura Microwave Limb Sounder stratospheric andmesospheric CO measurements J Geophys Res 112 D24S38doi1010292007JD008723 2007
Randall C E Harvey V L Singleton C S Bernath P FBoone C D and Kozyra J U Enhanced NOx in 2006 linkedto strong upper stratospheric Arctic vortex Geophys Res Lett33 L18811 doi1010292006GL027160 2006
Randall C E Harvey V L Manney G L et al Stratospheric ef-fects of energetic particle precipitation in 2003ndash2004 GeophysRes Lett 32 L05802 doi1010292004GL022003 2005
Reichler T Dameris M and Sausen R Determining the
tropopause height from gridded data Geophys Res Lett 302042 doi1010292003GL018240 2003
Reinecker M M Suarez M J Todling R et al The GEOS-5 Data Assimilation System A Documentation of GEOS-50Tech Rep 104606 V27 NASA 2007
Remsberg E E Lingenfelser G Harvey V L Grose WIII J R Mlynczak M Gordley L and Marshall B TOn the verification of the quality of SABER temperaturegeopotential height and wind fields by comparison with MetOffice assimilated anylyses J Geophys Res 108 4628doi1010292003JD003720 2003
Remsberg E E Deaver L Wells J et al An assessment ofthe quality of HALOE temperature profiles in the mesospherebased on comparisons with Rayleigh backscatter lidar and inflat-able falling sphere measurements J Geophys Res 107 4447doi1010292001JD001521 2002
Schoeberl M R Extratropical stratosphere-tropospheremass exchange J Geophys Res 109 D13303doi1010292004JD004525 2004
Schwartz M J Lambert A Manney G L et al Validation ofthe Aura Microwave Limb Sounder temperature and geopotentialheight measurements J Geophys Res in press 2007 Availableat httpmlsjplnasagov 2007
Sica R J Izawa M Petelina S V et al Validation of ACE tem-perature using ground-based and space-based meassurementsAtmos Chem Phys 8 35ndash62 2008
Simmons A J Hortal M Kelly G McNally A Untch A andUppala S ECMWF analyses and forecasts of stratospheric win-ter polar vortex break-up September 2002 in the southern hemi-sphere and related events J Atmos Sci 62 668ndash689 2005
Siskind D E Eckermann S D Coy L and McCormack J POn recent interannual variability of the Arctic winter meso-sphere Implications for tracer descent Geophys Res Lett 34L09806 doi1010292007GL029293 2007
Strong K Wolff M A Kerzenmacher T E et al Validationof ACE-FTS N2O measurements Atmos Chem Phys Discussaccepted 2007
Sung K Skelton R Walker K A Boone C D Fu D andBernath P F N2O and O3 Arctic column amounts from PARIS-IR observations Retrievals characterization and error analysisJ Quant Spectrosc Ra 107 (3) 385ndash406 Oct 2007 a
Untch A Miller M Hortal M Buizza R and Janssen P To-wards a global meso-scale model The high resolution systemT799L91 and T399L62 EPS ECMWF Newsletter 108 6ndash132006
Walker K A Randall C E Trepte C R Boone C D andBernath P F Initial validation comparisons for the AtmosphericChemistry Experiment (ACE) Geophys Res Lett 32 L16S04doi1010292005GL022388 2005
Waters J W Froidevaux L Harwood R S et al The Earth Ob-serving System Microwave Limb Sounder (EOS MLS) on theAura satellite IEEE Trans Geosci Remote Sens 44 1075ndash1092 2006
WMO Scientific assessment of stratospheric ozone depletion2006 U N Environ Program Geneva Switzerland 2007
Wu W-S Purser R J and Parish D F Three-dimensional varia-tional analyses with spatially inhomogeneous covariances MonWeather Rev 130 2905ndash2916 2002
Atmos Chem Phys 8 505ndash522 2008 wwwatmos-chem-physnet85052008
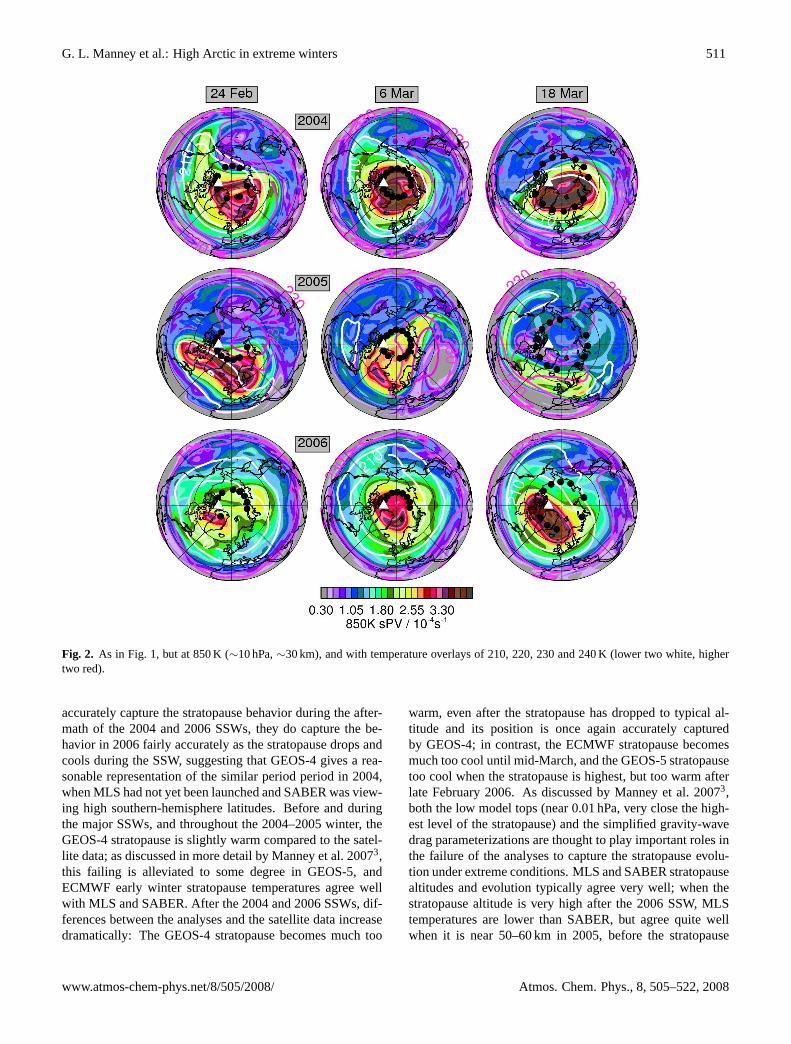
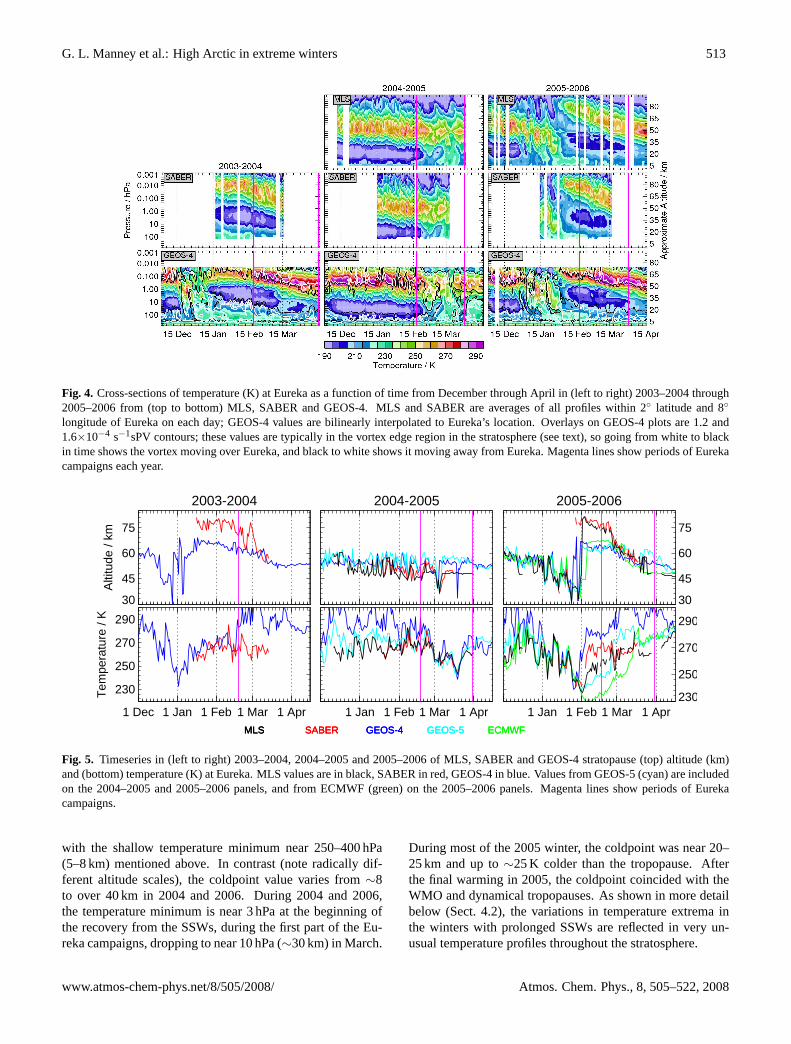
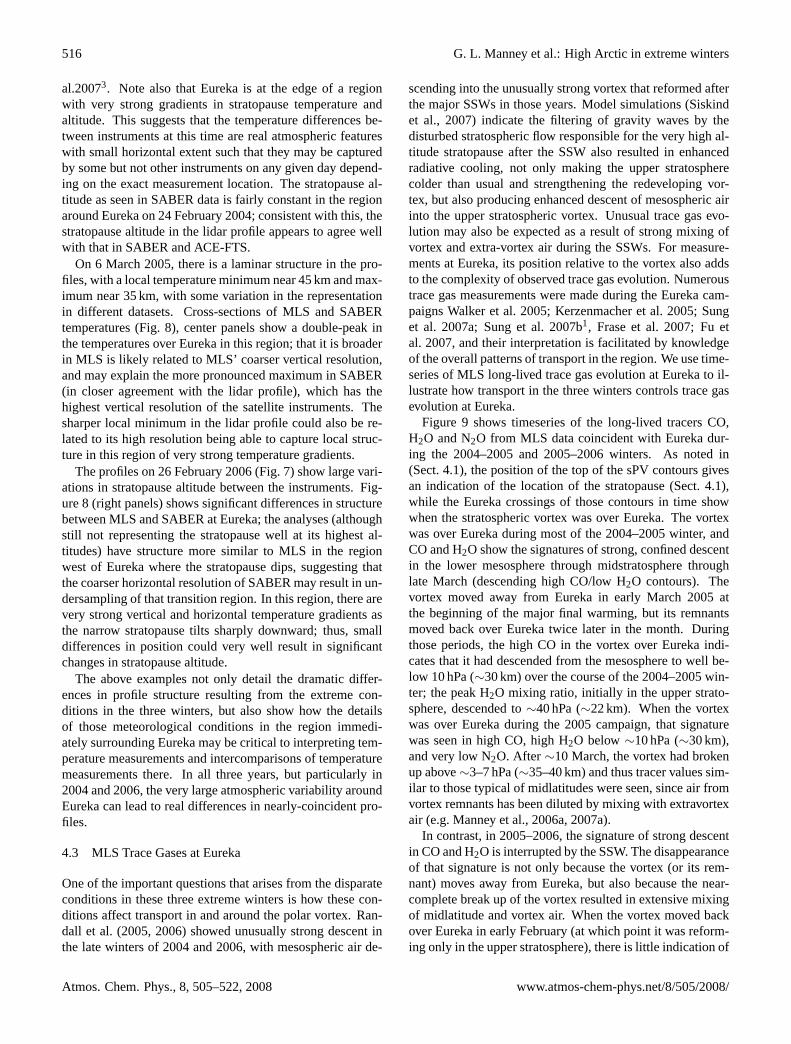
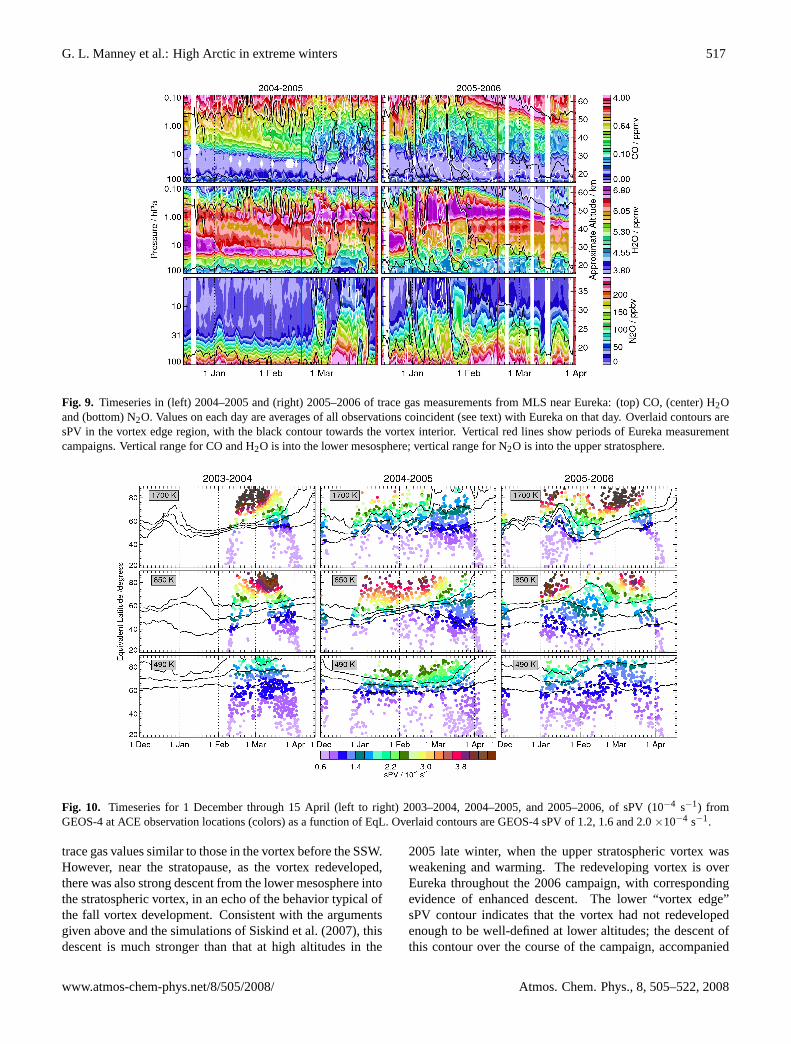
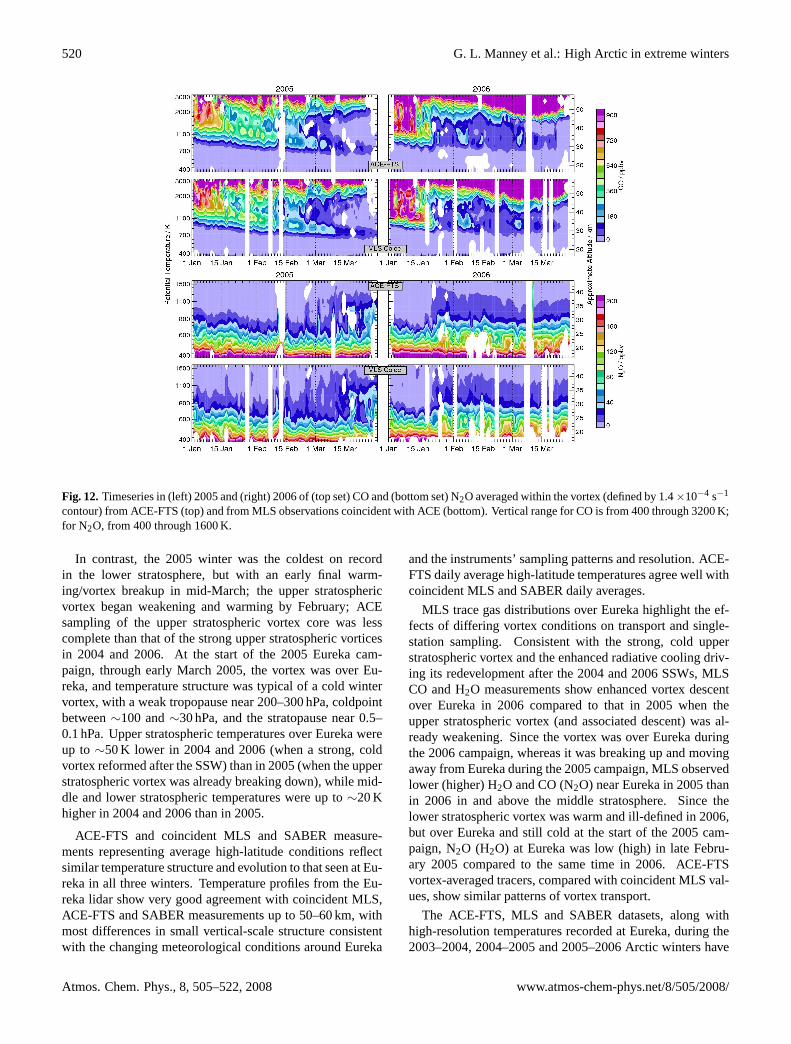