Embed Size (px)
Citation preview
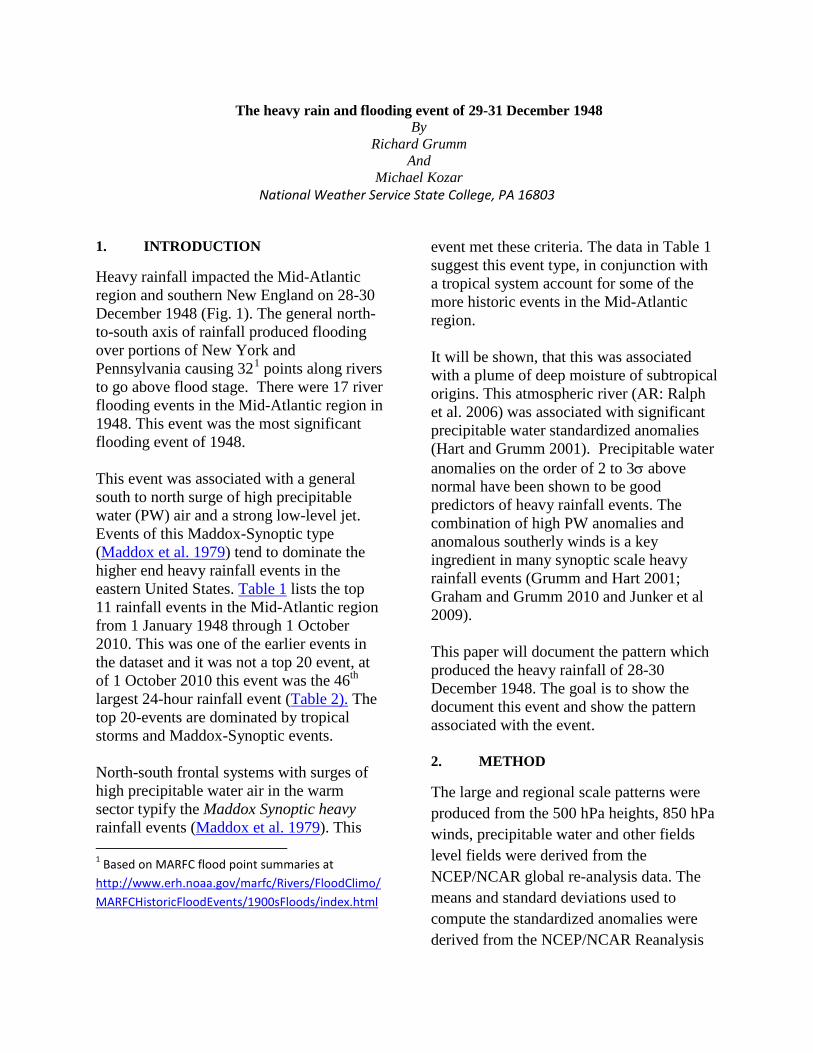
The heavy rain and flooding event of 29-31 December 1948 By
Richard Grumm And
Michael Kozar National Weather Service State College, PA 16803
1. INTRODUCTION
Heavy rainfall impacted the Mid-Atlantic region and southern New England on 28-30 December 1948 (Fig. 1). The general north-to-south axis of rainfall produced flooding over portions of New York and Pennsylvania causing 321
points along rivers to go above flood stage. There were 17 river flooding events in the Mid-Atlantic region in 1948. This event was the most significant flooding event of 1948.
This event was associated with a general south to north surge of high precipitable water (PW) air and a strong low-level jet. Events of this Maddox-Synoptic type (Maddox et al. 1979) tend to dominate the higher end heavy rainfall events in the eastern United States. Table 1 lists the top 11 rainfall events in the Mid-Atlantic region from 1 January 1948 through 1 October 2010. This was one of the earlier events in the dataset and it was not a top 20 event, at of 1 October 2010 this event was the 46th largest 24-hour rainfall event (Table 2). The top 20-events are dominated by tropical storms and Maddox-Synoptic events. North-south frontal systems with surges of high precipitable water air in the warm sector typify the Maddox Synoptic heavy rainfall events (Maddox et al. 1979). This 1 Based on MARFC flood point summaries at http://www.erh.noaa.gov/marfc/Rivers/FloodClimo/MARFCHistoricFloodEvents/1900sFloods/index.html
event met these criteria. The data in Table 1 suggest this event type, in conjunction with a tropical system account for some of the more historic events in the Mid-Atlantic region. It will be shown, that this was associated with a plume of deep moisture of subtropical origins. This atmospheric river (AR: Ralph et al. 2006) was associated with significant precipitable water standardized anomalies (Hart and Grumm 2001). Precipitable water anomalies on the order of 2 to 3σ above normal have been shown to be good predictors of heavy rainfall events. The combination of high PW anomalies and anomalous southerly winds is a key ingredient in many synoptic scale heavy rainfall events (Grumm and Hart 2001; Graham and Grumm 2010 and Junker et al 2009). This paper will document the pattern which produced the heavy rainfall of 28-30 December 1948. The goal is to show the document this event and show the pattern associated with the event. 2. METHOD
The large and regional scale patterns were produced from the 500 hPa heights, 850 hPa winds, precipitable water and other fields level fields were derived from the NCEP/NCAR global re-analysis data. The means and standard deviations used to compute the standardized anomalies were derived from the NCEP/NCAR Reanalysis

data as described by Hart and Grumm (2001). Anomalies were displayed in standard deviations from normal, as standardized anomalies. All data were displayed using GrADS (Doty and Kinter 1995).
The standardized anomalies are computed as:
SD = (F – M)/σ (1)
Where F is the value from the reanalysis data at each grid point, M is the 21-day running mean for the specified date and time
at each grid point and σ is the value of 1 standard deviation at each grid point.
The precipitation images and the ranking of the top 20 rainfall events in Table 1 were based on the UPD data from 1 January 1948-1 September 2010. The maximum rainfall in Table 1 over the 24 hour rainfall ending at 1200 UTC daily were used to find these data. These data are heavily biased toward COOP data, but they represent the longest running continuous record from which these records can be easily estimated. This event will clearly be in the top 10. The classification of events in Table 1 was conducted using the re-analysis data and
Figure 1. Total accumulated rainfall (mm) from the unified precipitation data for the period of 1200 UTC 28 to 1200 UTC 31 December 1948. Return to text.
determining the frontal orientation and winds. The comments were removed, but most of the tropical storms were named storms. The classic Maddox classification was used. However Synoptic events which interacted with tropical systems were termed hybrids. Where applicable the tropical storm name was identified. Since 1948 34 of the top 56 heavy rainfall were associated with named tropical storms.
3. RESULTS
i. Large scale pattern
The large pattern over the United States is shown in Figure 2. The key feature at 500 hPa was a progressive trough with attendant 500 hPa negative height anomalies. Initially a weak ridge was present over the eastern United States (Figs. 2a-c) which grew in strength and had 2 to 3SD above normal height anomalies associated with it after 31/0000 UTC (Fig. 2f).
As the trough moved eastward it pulled a plume of deep moisture northward (Fig. 3). The evolutions of the 12-hour PW fields show 1 to 3 SD PW anomalies. These data show a deep surge of high PW air into the southern plains and into the eastern United States. The later times show an occluded look to the PW field as the low moved beneath the building ridge (Fig. 2).
ii. Regional pattern
Figures 4-7 show the pattern over the eastern United States and include 250 hPa winds, 850 hPa winds, mean sea-level pressure and the PW fields. At 29/0000 UTC a surge of high PW air with strong southerly winds was present in the Mississippi Valley (Fig. 4). This strong LLJ and PW surge were over the Mid-Atlantic region at 29/1200 UTC (Fig. 5) and swept into New England by 30/0000 UTC.
A wave developed along the frontal zone and brought a second surge of rain from New Jersey into southern New England as shown in Figure 6 & 7.
iii. Regional rainfall
Figure 1 showed the event total rainfall. The key rainfall intervals are shown in Figures 8. Heavy rainfall was observed from the southern Appalachians to New England from 28/1200 to 31/1200 UTC (Fig. 8-left). Over 96 mm fell over southern New York with areas of 64 to 96mm in Pennsylvania and New York. The 32 mm contour covered a large expanse of the eastern United States from Georgia to western New England (Fig. 8).
The 24-hour period of 29/1200 through 30/1200 UTC is shown in Figure 8-right. These data show that the heaviest 24-hour period of rainfall was during this period with 48 mm over Pennsylvania and over 96 mm in the southern Catskills of New York.
The surge of heavy rainfall in western New England came after 30/1200 UTC with over 128 mm (Fig. 9) in this period associated with the wave along the front alluded to in the previous section and shown in Figures 7 & 8. Figure 10 highlights the 850 hPa low and surge of strong 850 hPa winds into western New England between 31/0000 and 31/1200 UTC.
4. CONCLUSIONS
A Maddox-Synoptic rainfall event produced heavy rainfall from the southern Appalachians into western New England from 29-31 December 1948. Over 128 mm of rainfall was observed in western New England for the 24 hours ending at 31/1200 UTC. Locally heavy rainfall in eastern Pennsylvania and southern New York produced flooding.
This event was the largest flood event in the Mid-Atlantic region during 1948. This is not surprising as there was a widespread area of over 48 mm of rainfall with locally heavier amounts in excess of 96 mm of rainfall. Most f the rain fell in a 24 hour period likely contributing to the fast response and flooding.

This is just one of many events where the typical plume of high PW air with over 2SD PW anomalies and a strong southerly jet produced flooding and heavy rainfall in the eastern United States.
This storm set the 24-hour record rainfall in Torrington, CT when 8.91 inches was observed for the 24 hours ending at 1200 UTC 31 December 1948. This storm was also locally known in eastern New York and western New England as the ice storm and flood of December
1948. The storm triggered flooding to include record flooding along the Hoosic River in New York near Kinderhook, NY. The precipitation fell as both sleet and rain.
5. Acknowledgements
We would like to thank the NWS SCEP program. The precipitation typing project was part of the local SCEP training program.
6. References
Figure 2. The Global re-analysis of 500 hPa heights (m) and 500 hPa height anomalies (standard deviations) for the period a-i) of 1200 UTC 28 December 1948 through 1200 UTC 01 January 1949 in 12-hour increments. Return to text.

Graham, Randall A., Richard H. Grumm, 2010: Utilizing Normalized Anomalies to Assess Synoptic-Scale Weather Events in the Western United States. Wea. Forecasting, 25, 428-445
Grumm, R.H. and R. Hart. 2001: Standardized Anomalies Applied to Significant Cold Season Weather Events: Preliminary Findings. Wea. and Fore., 16,736–754.
Hart, R. E., and R. H. Grumm, 2001: Using normalized climatological anomalies to rank synoptic scale events objectively. Mon. Wea. Rev., 129, 2426–2442.
Junker, N.W, M.J.Brennan, F. Pereira,M.J.Bodner,and R.H. Grumm, 2009:Assessing the Potential for Rare Precipitation Events with Standardized Anomalies and Ensemble Guidance at the Hydrometeorological Prediction Center. Bulletin of the American Meteorological Society,4 Article: pp. 445–453
Maddox, R. A., C. F. Chappell, L. R. Hoxit, 1979: Synoptic and Meso-α Scale Aspects of Flash Flood Events1. Bull. Amer. Meteor. Soc., 60, 115–123.
Ralph, F. M., G. A. Wick, S. I. Gutman, M. Dettinger, C. R. Cayan, and A. B. White, 2006: Flooding on California’s Russian River: The role of atmospheric rivers. Geophys.Res. Lett., 33, L13801, doi:10.1029/2006GL026689.

Rank Start Time End Date Max Precip
(mm) Classification TC Names
1 12Z11AUG1955 12Z12AUG1955 193.849 Tropical Connie 2 12Z08OCT2005 12Z09OCT2005 191.179 Hybrid TS Tammy 3 12Z30SEP2010 12Z01OCT2010 182.574 Hybrid 4 12Z20AUG2007 12Z21AUG2007 181.347 Frontal
5 12Z18SEP2003 12Z19SEP2003 180.953 Tropical Isabel 6 12Z06OCT2006 12Z07OCT2006 178.549 Hybrid TS Tammy 7 12Z14OCT2005 12Z15OCT2005 176.117 Hybrid 8 12Z26SEP1985 12Z27SEP1985 171.699 Hybrid Gloria 9 12Z29SEP2010 12Z30SEP2010 171.421 Hybrid
10 12Z17OCT1999 12Z18OCT1999 170.322 Hybrid Irene 11 12Z16SEP1999 12Z17SEP1999 168.881 Hybrid Floyd
Table 1. Largest 24-hour rain events based on the Unified Precipitation data from 1948 to 2010. The period of the rainfall, the maximum rainfall amount (mm) and event classification are shown. Tropical events were pure tropical cyclones, frontal events involved an east-west frontal boundary, Synoptic events involved a north-south boundary, and mesoscale events were unique locally heavy rainfall events. Hybrid events represent the interaction of a tropical system with a north-south oriented frontal boundary. Known tropical storms are listed. Return to text.
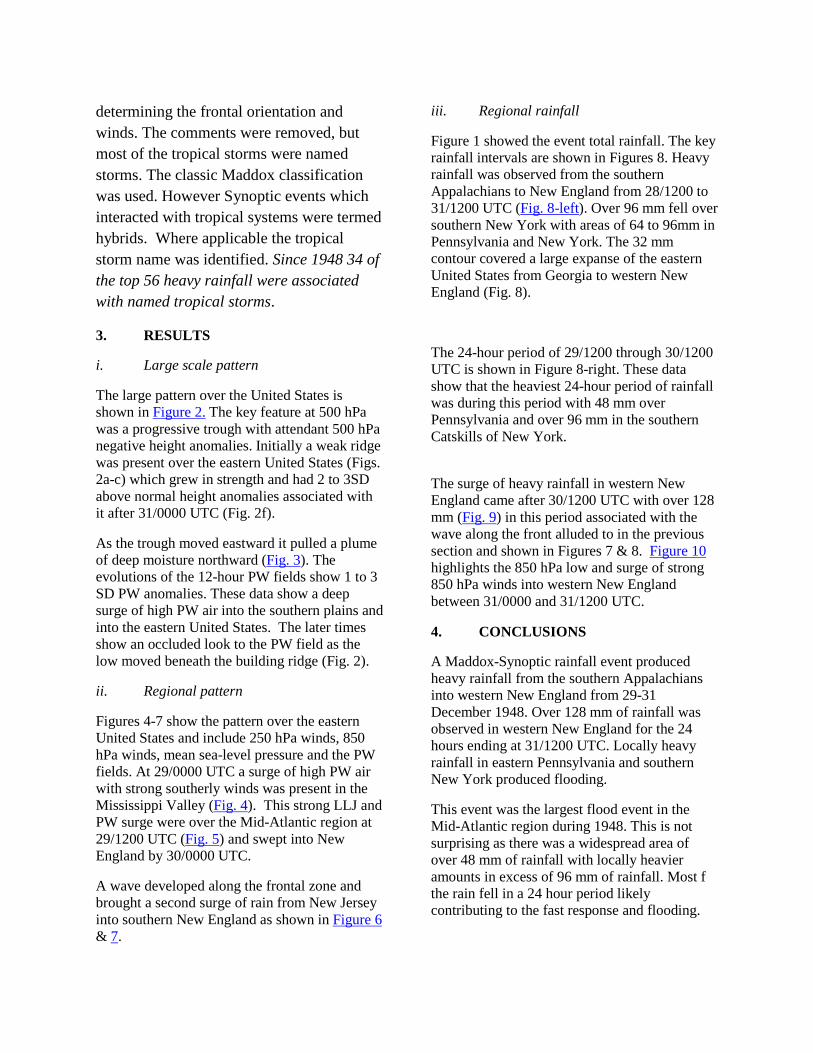
Rank Start Time End Date Max Precip
(mm) Classification TC Names
1 12Z11AUG1955 12Z12AUG1955 193.849 Tropical Connie 2 12Z08OCT2005 12Z09OCT2005 191.179 Hybrid TS Tammy 3 12Z30SEP2010 12Z01OCT2010 182.574 Hybrid
43 12Z21SEP1979 12Z22SEP1979 127.842 Synoptic 44 12Z25JUN2006 12Z26JUN2006 127.74 Synoptic
45 12Z10SEP1954 12Z11SEP1954 125.554 Hybrid Edna 46 12Z30DEC1948 12Z31DEC1948 124.669 Synoptic 47 12Z20JUL2010 12Z21JUL2010 123.29 Frontal
48 12Z07JUL2005 12Z08JUL2005 123.275 Hybrid TS Cindy 49 12Z16AUG1994 12Z17AUG1994 123.131 Hybrid TS Beryl 50 12Z23JUL2004 12Z24JUL2004 122.101 Synoptic
Table 2. As in Table 1 except showing the top 3 events and then the bottom of the top 50 events such that the event of 1948 can be seen in context relative to other event. Return to text.

Figure 3. As in Figure 2 except for precipitable water and precipitable water anomalies. Return to text.

Figure 4. As in Figure 2 except valid at 0000 UTC 29 December 1948 showing a) 250 hPa winds and v-wind anomalies, b) 850 hPa winds and v-wind anomalies, c) mean sea level pressure (hPa) and pressure anomalies and d) precipitable water and precipitable water anomalies. Return to text..

Figure 5. As in Figure 4 except valid at 1200 UTC 29 December 1948. Return to text.

Figure 6. . As in Figure 4 except valid at 1200 UTC 29 December 1948. Return to text.

Figure 7. As in Figure 4 except valid at 1200 UTC 29 December 1948. Return to text.

Figure 8. Accumulated rainfall (mm) as in Figure 1 except for (left) 1200 UTC 28-30 December 1948 and (right) the 24 hour period ending at 1200 UTC 30 December 1948. Return to text.

Figure 9. As in Figure 8 except for the 24 hour period ending at 1200 UTC 31 December 1948. Return to text.

Figure 10. As in Figure 2 except for 850 hPa total winds (kts) and total wind anomalies. Return to text.
![The Employees State Insurance Act 1948 - ... State Insurance Act 1948... · THE EMPLOYEES' STATE INSURANCE ACT, 1948 ACT NO. 34 OF 1948 1* [19th April, 1948.] An Act to provide for](https://img.dokumen.tips/doc/110x75/5aa59b087f8b9ab4788d5d44/the-employees-state-insurance-act-1948-state-insurance-act-1948the-employees.jpg)


![THE FACTORIES ACT, 1948 - dgms.gov.indgms.gov.in/writereaddata/UploadFile/The_Factories_Act-1948.pdf · THE FACTORIES ACT, 1948 ACT NO. 63 OF 19481 [23rd September, 1948.] An Act](https://img.dokumen.tips/doc/110x75/5e1b97b4234b685756734d0d/the-factories-act-1948-dgmsgov-the-factories-act-1948-act-no-63-of-19481.jpg)