Embed Size (px)
Citation preview

TTThhheee HHHeeeaaalllttthhh SSSyyysssttteeemmmsss RRReeessspppooonnnsssiiivvveeennneeessssss AAAnnnaaalllyyytttiiicccaaalll
GGGuuuiiidddeeellliiinnneeesss fffooorrr SSSuuurrrvvveeeyyysss iiinnn ttthheee MMMuuullltttiii---cccooouuunnntttrrryyy SSSuuurrrvvveeeyyy SSStttuuudddyyy
DDDeeeccceeemmmbbbeeerrr 222000000555
h
CCOONNTTEENNTTSS AUTHOR PAGE ..................................................................................................................................................4 LIST OF TABLES ................................................................................................................................................6 LIST OF FIGURES ..............................................................................................................................................8 CHAPTER ONE: INTRODUCTION ...............................................................................................................9
1.1 WHY RESPONSIVENESS IS RELATED TO HEALTH OUTCOMES ..........................................................................9 1.2 HOW RESPONSIVENESS IS MEASURED ............................................................................................................9 1.3 HOW RESPONSIVENESS DATA IS ANALYSED .................................................................................................11
CHAPTER TWO: RESPONSIVENESS QUESTIONS AND IMPLEMENTATION OF THE MCSS ...13 2.1 THE MCSS RESPONSIVENESS MODULE .......................................................................................................13 2.2 DESCRIPTIONS OF RESPONSIVENESS: REPORTING AND RATING QUESTIONS ................................................14 2.3 IMPORTANCE (VALUATION) OF RESPONSIVENESS DOMAINS .......................................................................17 2.4 RESPONSIVENESS EXPECTATIONS ...............................................................................................................19 2.5 THE MCSS RESPONSIVENESS MODULE DEVELOPMENT AND TESTING .......................................................20 2.6 MCSS IMPLEMENTATION ............................................................................................................................24 2.7 EVALUATION OF THE MCSS RESPONSIVENESS MODULE.............................................................................24
CHAPTER THREE: DATA MANAGEMENT, QUALITY CONTROLS, AND PREPARATION FOR ANALYSIS ..........................................................................................................................................................27
3.1 SURVEY IMPLEMENTATION..........................................................................................................................27 3.2 STANDARD QUESTIONNAIRE TRANSLATIONS ..............................................................................................27 3.3 STANDARD SURVEY DATA CHECKS .............................................................................................................29
3.3.1 Supervisor's check ....................................................................................................................................29 3.3.2 Data coding and entry...............................................................................................................................30 3.3.3 Data transfer ..........................................................................................................................................30 3.3.4 Data checking algorithms ..........................................................................................................................30
3.4 PROCESSING RESPONSIVENESS DATA AND ANALYTICAL CHECKS .................................................................31 3.4.1 Variable recoding and renaming..................................................................................................................31 3.4.2 Valid observations on health system responsiveness..........................................................................................32 3.4.3 Consistency .............................................................................................................................................32
3.5 FINAL RESPONSIVENESS DATASETS..............................................................................................................33 CHAPTER FOUR: PRESENTING RESULTS ..............................................................................................34
4.1 KEY QUESTIONS THAT SHOULD BE ANSWERED ............................................................................................34 4.2 HOW TO DO THE ANALYSIS..........................................................................................................................35 4.3 SUMMARY OF PATIENT RESPONSIVENESS ....................................................................................................39 4.4 PERCEPTIONS OF HOSPITAL INPATIENT CARE RESPONSIVENESS.................................................................41 4.5 PERCEPTIONS OF AMBULATORY CARE RESPONSIVENESS.............................................................................43 4.6 PERCEIVED FINANCIAL BARRIERS AND DISCRIMINATION ...........................................................................45 4.7 IMPORTANCE OF RESPONSIVENESS DOMAINS .............................................................................................47 4.8 USER PROFILE .............................................................................................................................................49
CHAPTER FIVE: USING RESULTS TO IMPROVE POLICY AND PRACTICE ....................................58 5.1 FROM SURVEY RESULTS TO POLICY AND PRACTICE ......................................................................................58
5.1.1 Principles for generating and disseminating evidence .........................................................................................58 5.1.2 A framework for evidence-based policy and practice .........................................................................................59
5.2 WHAT COUNTS AS EVIDENCE? .....................................................................................................................60 5.2.1 Results and information ............................................................................................................................60 5.2.2 Appraisal of results - Case study from Australia............................................................................................61
2

5.3 EVIDENCE FOR POLICY................................................................................................................................65 5.3.1 Presenting evidence ...................................................................................................................................65 5.3.2 Audiences for reports ................................................................................................................................66
5.4 REVIEW OF EVIDENCE-BASED INTERVENTIONS...........................................................................................68 5.4.1 Example - issues regarding the choice domain.................................................................................................68 5.4.2 Evidence for changed practice ......................................................................................................................69
5.5 DEVELOPING POLICY RESPONSES ................................................................................................................71 5.6 PUTTING POLICY INTO PRACTICE ................................................................................................................72
5.6.1 Features of good practice ............................................................................................................................72 5.6.2 Processes for improving policy and practice .....................................................................................................73
5.7 MONITORING AND EVALUATION.................................................................................................................73 APPENDIX 1: THE MCSS ON HEALTH AND HEALTH SYSTEM RESPONSIVENESS (2000-2001) BACKGROUND .................................................................................................................................................75
A1.1 GOALS OF THE MCSS ...............................................................................................................................75 A1.2 MODES USED IN THE MCSS ......................................................................................................................76
A1.2.1 Household Long Face-to-Face Questionnaire Interviews ................................................................................76 A1.2.2 Household Brief Face-to-Face Questionnaire Interviews.................................................................................76 A1.2.3 Brief Computer Assisted Telephone Interview (CATI) Questionnaire Interviews ................................................76 A1.2.4 Brief Postal/Drop - off Questionnaire Interviews .........................................................................................77
A1.3 DEVELOPMENT OF RESPONSIVENESS MODULE.........................................................................................77 A1.4 RESPONSIVENESS MODULE CONTENT ......................................................................................................82 A1.5 TWO TYPES OF RESPONSIVENESS MODULES .............................................................................................82 A1.6 CONCLUSION ............................................................................................................................................83
APPENDIX 2: RESPONSIVENESS MODULE AND RELATED QUESTIONS......................................84 APPENDIX 3: COUNTRIES PARTICIPATING IN THE MCSS................................................................95 APPENDIX 4: TECHNICAL SKILLS NECESSARY TO ANALYSE THE MCSS DATA.........................96
A4.1 STATISTICAL SKILLS ..................................................................................................................................96 A4.2 AN UNDERSTANDING OF SAMPLE MEANS, SAMPLING VARIANCE, CONFIDENCE INTERVAL, AND MEASURE OF ASSOCIATION ...............................................................................................................................................96 A4.3 AN UNDERSTANDING OF SAMPLE SURVEYS, SAMPLE DESIGN, VARIANCE OF COMPLEX SURVEY DESIGN, DESIGN EFFECTS ETC ......................................................................................................................................100 A4.4 A BASIC UNDERSTANDING OF DATA WEIGHTS ........................................................................................102 A4.5 AN UNDERSTANDING OF MISSING DATA .................................................................................................103 A4.6 AN UNDERSTANDING OF STANDARDIZATION .........................................................................................103 A4.7 USE OF COMPUTER PACKAGES SUCH AS SAS, SPSS, OR STATA, AND EXCEL.........................................107
APPENDIX 5: PSYCHOMETRICS ...............................................................................................................108 A5.1 VALIDITY...............................................................................................................................................108
A5.1.1 Construct Validity of the MCSS responsiveness module ..............................................................................109 A5.1.2 How to test the construct validity using your own country data ......................................................................113
A5.2 RELIABILITY ...........................................................................................................................................118 A5.3 FEASIBILITY ............................................................................................................................................125
A5.3.1 Response Rates...................................................................................................................................125 A5.3.2 Missing Values ..................................................................................................................................128
A5.4 PSYCHOMETRIC PROPERTIES OF OTHER SURVEY INSTRUMENTS...............................................................133 A5.5 CONCLUDING REMARKS ON THE PSYCHOMETRIC PROPERTIES OF THE MCSS RESPONSIVENESS MODULE.......................................................................................................................................................................140
3

AUTHOR PAGE
AAuutthhoorr ppaaggee
The Health Systems Responsiveness Analytical Guidelines were written by contribution of the following authors. The affiliation for all authors is as follows: Evidence and Information for Policy Cluster (EIP) Equity Team World Health Organization Avenue Appia 20 CH-1211 Geneva 27 Switzerland Hana Letkovicova Amit Prasad René La Vallée Nicole Valentine Consumer Research Section, MDP 85 Australian Department of Health and Ageing GPO Box 9848 Canberra ACT 2601 Australia Pramod Adhikari George W van der Heide
The authors acknowledge with special thanks to Yunpeng Huang who has designed and technically supported the development of the MCSS Analytical Guidelines web page.
4

ACKNOWLEDGEMENTS
AAcckknnoowwlleeddggeemmeennttss
The authors would like to express sincere appreciation to the following experts for their valuable comments, review, and approval of the document. These experts reviewed whether "The Health Systems Responsiveness Analytical Guidelines for Surveys in the Multi-country Survey Study" is a useable document that presents the rationale behind responsiveness clearly, covers all responsiveness domains well, is easily understandable, and is readily applicable by field workers. Dr. Amala de Silva Senior Lecturer Department of Economics University of Colombo Colombo Sri Lanka
Dr. Amala de Silva has mainly been involved in research relating to Macroeconomics and Health since 2000. Her recent publications include Poverty, Transition and Health: A rapid health system analysis (2002), Investing in Maternal Health: Learning from Malaysia and Sri Lanka (2003), and an Overview of the Health Sector in Economic Policy in Sri Lanka: Issues and Debates (2004). She also contributed to Health System Responsiveness: Concepts, Domains and Operationalization in Health Systems Performance Assessment: Debates, Methods and Empiricism (2003). Mr. Charles Darby Social Science Administrator Agency for Healthcare Research and Quality 540 Gaither Road Rockville, Maryland 20850 United States of America
Mr. Darby assisted WHO staff in developing the Responsiveness Questionnaire and survey protocol. Since that time he has been involved in expanding the development of patient experience surveys beyond the Health Plan version of the CAHPS® survey to include hospitals, nursing homes and physician individual and group practices. He has also been working with a group of investigators to develop new approaches to assessing the comparability of CAHPS surveys across different cultures. Dr. Dave Whittaker General Practitioner 64 Islip Road Oxford OX21 7SW England United Kingdom
With a background in medical education at the University of Cape Town and in the clinical care of patients with TB and Aids in Cape Town, Dave now works as an NHS general practitioner in Oxford. He is interested in: responsiveness viewed from the provider’s standpoint, family medicine’s contribution to the provision of good primary care, and in the training of mid-level health workers for South Africa.
5

LIST OF TABLES
LLiisstt ooff TTaabblleess
Table 1.1 Domain names and questions used in the MCSS Table 2.1 Topics covered in the MCSS questionnaires Table 2.2 Exact question wording, the MCSS responsiveness questions Table 2.3 Vignette wording example, the MCSS Table 2.4 Other questionnaires with items on the responsiveness domains Table 2.5 Questions from the AHRQ CAHPS questionnaire included in the responsiveness module with
little or no change Table 2.6 Summary of key psychometric properties of the responsiveness module Table 3.1 List of terms used for back-translations Table 4.1 Overall responsiveness: percentage rating service as poor Table 4.2 Hospital inpatient responsiveness: percentage rating service as poor Table 4.3 Percentage rating hospital inpatient responsiveness as poor by health, income, and sex Table 4.4 Ambulatory care responsiveness: percentage rating service as poor Table 4.5 Percentage rating ambulatory care responsiveness as poor by health, income, and sex Table 4.6 Average number of visits to a General Physician (GP) in last 30 days (multiplied by 12 to give
a rough annual average) Table 1 Self-reported utilization on health services and unmet need in the previous 12 months Table 2 Characteristics of patient interaction with the health system in the previous 12 months Table 3 Patient assessed responsiveness of ambulatory care services: percentage reporting "moderate",
"bad" or "very bad" Table 4 Patient assessed responsiveness of hospital inpatient health services: percentage reporting
"moderate", "bad" or "very bad" Table 5 Population assessment of the relative importance of responsiveness domains: percentage reporting
domain to be the "most important" Table 6 Patient expectations: averages of vignette sets for different social groups
Table 5.1 Examples of levers for change in Australia Table 5.2 Examples of levers for action in the Choice domain Table A1.1 Responsiveness modules used in different WHO surveys Table A2.1 Mapping of questions common to the long and brief forms of the responsiveness module Table A3.1 Countries participating in the MCSS Table A4.1 Mean autonomy score by age group and gender, unadjusted for difference in age structure, two
hypothetical populations—Population A and Population B Table A4.2 WHO World Standard Population weights by age group, WHO, 2000 Table A4.3 Mean autonomy score by age group and gender, age standardized to adjust for difference in age
structure Table A5.1 Summary of types of validity and their characteristics Table A5.2 Confirmatory Factor Analysis Standardised Coefficients – Ambulatory care Table A5.3 Confirmatory Factor Analysis Standardised Coefficients, Australia Table A5.4 Cronbach’s alpha Coefficients, Australia Table A5.5 Number of interviews completed for retest by country Table A5.6 Kappa rates for sections of the responsiveness module, calculated from retests in eight countries Table A5.7 Hypothetical example on test-retest reliability: listing results Table A5.8 Hypothetical example of test-retest reliability: a cross tabulation
6

LIST OF TABLES
Table A5.9 Hypothetical example of test-retest reliability: agreement by chance Table A5.10 Hypothetical example of test-retest reliability: alternate results Table A5.11 Hypothetical example on test-retest reliability: cross-tabulating alternate results Table A5.12 Response rates, household survey, MCSS, 2000-2001 Table A5.13 Response rates, brief face-to-face survey, MCSS 2000-2001 Table A5.14 Response rates, postal survey, MCSS, 2000-2001 Table A5.15 Average item missing values for responsiveness module across 65 surveys Table A5.16 Item missing values and survey modes by country MCSS, 2001 Table A5.17 Missing values analysis for q6113, Australia Table A5.18 Summary of the surveys used for comparison of psychometric properties with the MCSS Table A5.19 Published test statistics from recent studies of patient satisfaction and health-related quality of
life Table A5.20 Threshold/Criterion values used for Psychometric Tests
7

LIST OF FIGURES
LLiisstt ooff FFiigguurreess
Figure 2.1 Text of the question, the layout and the description of domains used in short form questionnaire Figure 2.2 Literature supporting different responsiveness domains (in order of search) Figure 3.1 Generic Data Quality Assurance Steps Figure 5.1 A framework for evidence-based policy and practice Figure 5.2 Information flows and actions
8

CHAPTER ONE
CChhaapptteerr OOnnee:: IInnttrroodduuccttiioonn The Health Systems Responsiveness Guidelines is an easy-to-use, hands-on user’s manual
to analyse the data on responsiveness from the 2000 - 2001 WHO Multi-country Survey Study on Health and Health System's Responsiveness (MCSS). The responsiveness module included questions on health usage, a question on the importance of the different domains, a suite of questions on how these domains performed in a country and a set of vignettes. The responsiveness domains are the non-therapeutic aspects of health related activities that affect a person’s experience of health care. They do not refer to medical procedures, but none the less impact on health outcomes.
1.1 Why responsiveness is related to health outcomes We define non-clinical aspects related to the way individuals are treated and the
environment in which they are treated as responsiveness 1 . WHO’s review of the patient satisfaction and quality care literature 2 led to the identification of eight domains of responsiveness. These domains or broad areas of non-clinical care quality are relevant for all types of health care including personal and non-personal health services, as well as the population’s interaction with insurers and other administrative arms of the health system. There is empirical evidence to suggest that there is a positive association between health outcomes and responsiveness. Notwithstanding this relationship, human rights law argues that these domains of health systems are important in their own right3.
1.2 How responsiveness is measured Responsiveness of health systems to the legitimate expectations of populations regarding
how they are treated is recognized as an important part of health systems performance. As such, WHO recommends measuring responsiveness by asking people about their experiences with the health system4. To materialize this concept and measure it meaningfully in different settings, a questionnaire containing a responsiveness module was fielded in household surveys in different countries. 1 Valentine NB, de Silva A, Kawabata K, Darby C, Murray CJL, Evans DB (2003) Health system responsiveness: concepts, domains and measurement. In Murray CJL, Evans DB (Eds) Health systems performance assessment: debates, methods and empiricism. Geneva: World Health Organization. 2 de Silva A. A framework for measuring responsiveness. Global Programme on Evidence for Health Policy Discussion Paper Series: No. 32. Geneva: World Health Organization. URL http://www3.who.int/whosis/discussion_papers/pdf/paper32.pdf 3 Gostin L, et al. The domains of health responsiveness: a human rights assessment. Geneva, World Health Organization, 2002. URL: http://snow.who.int/whosis_stage/menu.cfm?path=hsr 4 Darby C, Valentine N, Murray C, de Silva A. WHO strategy on measuring responsiveness (GPE discussion paper no 23). Geneva: WHO, 2000.
9

CHAPTER ONE
The responsiveness module was developed for the MCSS by WHO, with input from questionnaire experts, ethicists and health care professionals. Eight domains of responsiveness were identified and appropriate questions developed for all eight domains for hospital inpatient visits, but only for seven domains for ambulatory visits5. The MCSS used the following domain names and item (question) descriptions (Table 1.1). The actual wording of questions and how the responses were reported is explained in Chapter 2. Table 1.1 Domain names and questions used in the MCSS
Domain name User-friendly domain
name Short item (question) description
Dignity Respectful treatment and communication
being shown respect having physical examinations conducted in privacy
Autonomy Involvement in decision making; respect for the right to make informed choices
being involved in deciding on your care or treatment if you want to having providers ask your permission before starting treatment or tests
Confidentiality Confidentiality of personal information
having conversations with health care providers where other people cannot overhear having your medical history kept confidential
Clear communication Clarity of communication
having health care providers listen to you carefully having health care providers explain things so you can understand giving patients and family time to ask health care providers questions
Prompt attention Convenient travel and short waiting times
getting care as soon as wanted having short waiting times for having tests done
Access to social support networks
Access to family and community support
being able to have family and friends bring personally preferred foods, soaps and other things to the hospital during the patient’s hospital stay being able to observe social and religious practices during hospital stay access to newspapers and TV interacting with family and friends during hospital stay
Quality basic amenities Quality basic amenities
having enough space, seating, furniture, clean water and fresh air in the waiting room or wards having a clean facility
Choice of health care provider
Choice of health care provider
being able to get to see a health care provider you are happy with being able to choose the institution to provide your health care
5 Access to social support networks was the domain for which questions were developed only for inpatient hospital care. More questions could have been developed for ambulatory care settings but this would have lengthened the questionnaire as it would require more details on each patient’s illness. At this stage of the study, more detailed questions for the domain of prompt attention were prioritized over questions for access to social support networks.
10

CHAPTER ONE
1.3 How responsiveness data is analysed
We have already explained that a measure of responsiveness can inform us how well the health system interacts with the population. The health system can be defined as all actors, institutions or resources that undertake health actions whose primary intent is to improve health6. This means that we might include traditional medical practices or alternative medical practices. In countries such as Nepal and India, for example, traditional healers may be considered as part of the health system and it is not uncommon in these countries for persons to seek help from them before seeking help from the more formal health system. Therefore, what is considered part of the health system may vary from country to country.
The principle of measuring health system responsiveness is to find out what happens when an individual interacts with the health system. Since an individual is expressing his/her experience with the encounter with the health system, the measurement takes place from the perspective of the person seeking services from the system. Therefore, the self report on experience with the health system is dependent to a degree upon what expectations a person has regarding that experience. Responses regarding the same experience of care may vary across respondents, if their expectations vary substantially.
To reduce the effect of expectations in the survey, respondents were asked to report and rate their encounters with the health system, but not their satisfaction with the encounter. From aggregating individuals’ experiences of the health system, it is possible to make a national estimate of health system responsiveness. To do this, the individuals that are included in the survey (who make up the survey sample) need to be representative of the country as a whole.
However, there will be instances where policy makers in a country want to compare how sub-populations evaluate responsiveness. For example, health systems may vary their level of responsiveness to people from rural areas compared with those who are living in urban centres. In addition to sub-population and sub-regional analysis, a country might like to compare its responsiveness with other countries in the same region or at the same stage of development.
Returning to the issue of expectations, we note that measuring people’s experiences can become problematic if differences in expectations for those experiences are based on factors unrelated to the legitimate need a person has for responsiveness. For example, a person from a low social class whose health condition and social background necessitates more responsiveness from the health system, may evaluate the same experience better than a person from a higher social class with less need. If the evaluation of the person from the lower class was influenced by fear or resignation because of previous bad experiences, then we say that expectations are distorting the measurement of responsiveness.
Expectations related distortions are particularly prevalent across groups with different income levels and may arise at both a sub-national and cross-country levels. When
6 Murray CJL, Evans DB (2003) Health systems performance assessment: goals, framework and overview. In Murray CJL, Evans DB (Eds) Health systems performance assessment: debates, methods and empiricism. Geneva: World Health Organization.
11

CHAPTER ONE
responsiveness is measured by self-report questionnaire items, cross-population comparability becomes a major issue. Numerous studies have reported that people from different cultures, political systems, languages, beliefs and levels of resources report and evaluate similar experiences of health system differently7. Wide-spread poor practices, which are unacceptable in some countries, may be rendered acceptable in others by virtue of their being commonplace e.g. crowded waiting rooms, rude staff. WHO has led the development of a method to adjust for expectations using the Hierarchical Ordered Probit (HOPIT) Model and Compound Hierarchical Ordered Probit (CHOPIT) Model. The effectiveness of the technique has been demonstrated with respect to self-report health questions and testing is under way on responsiveness questions8. This second stage of analysis is not discussed further in this guideline but it will be addressed in a later edition. This guideline shows the first stage of responsiveness data analysis, which involves recording the population’s perceptions, valuations (importance) and expectations of health system responsiveness. A detailed description of how responsiveness data is analysed is given in Chapter 4.
7 Murray CJL, Kawabata K, Valentine N (2001) People’s experience versus people’s expectations. Health Affairs 20 (3): 21-24. 8 Salomon JA, Tandon A, Murray CJL. Comparability of self assessed health: cross sectional multi-country survey using anchoring vignettes. BMJ [Online First], doi:10.1136/bmj.37963.691632.44 (published 23 January 2004). Available at: www.bmj.com. Accessed 3 February 2004.
12

CHAPTER TWO
CChhaapptteerr TTwwoo:: RReessppoonnssiivveenneessss QQuueessttiioonnss aanndd IImmpplleemmeennttaattiioonn ooff tthhee MMCCSSSS
2.1 The MCSS Responsiveness Module
The MCSS contained questions about a wide range of issues relating to health system performance. The MCSS questionnaire (instrument) was arranged in separate modules on the topics listed in Table 2.1. Table 2.1 Topics covered in the MCSS questionnaires Short form of questionnaire Long form of questionnaire
Demographics X X Health State Descriptions X X Chronic Health Conditions X Mental Health & Substance Use X Health State Valuations X Health Systems Responsiveness X X Adult Mortality X Environmental Factors X Health Financing X
This guideline mainly deals with the Health Systems Responsiveness module, which covered health care usage including: • respondents’ use of health care services in the last 12 months; • the frequency of visits to various types of health care professional in the past 30 days; • main reason for the last visit to the health care professional (only in long version); • which services were provided (only in long version); • whether respondents were unfairly treated because of their background or social status; • respondents’ ratings of their experiences of the health care system over the past 12 months
in terms of responsiveness domains (termed “responsiveness descriptions”); • respondents’ ranking of the relative importance of the responsiveness domains (termed
“responsiveness valuations/importance”; and • vignettes describing hypothetical scenarios about other peoples’ experiences with the health
system (termed “responsiveness expectations”).
In the following sections, we consider the last three of these in more detail as they focus on components specifically developed to assess responsiveness of health systems:
13

CHAPTER TWO
2.2 Descriptions of Responsiveness: reporting and rating questions
This section of the responsiveness module contained questions on all 8 domains of
responsiveness: autonomy, choice of health care provider, clear communication, confidentiality, dignity, prompt attention, quality basic amenities and access to social support networks. The questions focused on people’s encounters with two types of health care providers: • encounters with health care providers occurring at ambulatory health services (broadly
defined to include any place outside the home where people sought information or advice or interventions with respect to improving their health) and encounters with health care providers at home; and
• encounters with hospital inpatient services (broadly defined to include all places where the respondents stayed overnight for their health care).
The question wording for the responsiveness domains is presented in Table 2.2. All
domains included a summary “rating” question scaled 1 (very good) to 5 (very bad). In addition, every domain included “report” questions on particular experiences with the health system scaled 1 (never) to 4 (always). Report questions are noted by the way they ask for the patients to report whether a certain event happened or not, or how frequently it happened.
Note that the q61xx series of questions refer to ambulatory experience, the q62xx series to home care experience and the q63xx series to hospital inpatient experience.
14

CHAPTER TWO
Table 2.2 Exact question wording, the MCSS responsiveness questions
Domain Item
number Question wording
Type of response scale
Q6101 Q6201 Q6303
In the last 12 months, when you wanted care, how often did you get care as soon as you wanted?
Frequency Reporting (Always - Never)
Q6103 Q6203
Generally, how long did you have to wait before you could get the laboratory tests or examinations done?
Other Reporting (number of days)
Prompt attention
Q6104 Q6204 Q6304
Now, overall, how would you rate your experience of getting prompt attention at the health services in the last 12 months?
Rating (Very Good - Very Bad)
Q6110 Q6210
In the last 12 months, when you sought health care, how often did doctors, nurses or other health care providers treat you with respect?
Frequency Reporting (Always - Never)
Q6111 Q6211
In the last 12 months, how often did the office staff, such as receptionists or clerks there, treat you with respect?
Frequency Reporting (Always - Never)
Q6112 Q6212
In the last 12 months, how often were your physical examinations and treatments done in a way that your privacy was respected?
Frequency Reporting (Always - Never)
Dignity
Q6113 Q6213 Q6305
Now, overall, how would you rate your experience of being treated with dignity at the health services in the last 12 months?
Rating (Very Good - Very Bad)
Q6120 Q6220
In the last 12 months, how often did doctors, nurses or other health care providers listen carefully to you?
Frequency Reporting (Always - Never)
Q6121 Q6221
In the last 12 months, how often did doctors, nurses or other health care providers, explain things in a way you could understand?
Frequency Reporting (Always - Never)
Q6122 Q6222
In the last 12 months, how often did doctors, nurses, or other health care providers give you time to ask questions about your health problem or treatment?
Frequency Reporting (Always - Never)
Clear commun-ication
Q6123 Q6223 Q6306
Now, overall, how would you rate your experience of how well health care providers communicated with you in the last 12 months?
Rating (Very Good - Very Bad)
Q6131 Q6231
In the last 12 months, how often did doctors, nurses or other health care providers involve you as much as you wanted in deciding about the care, treatment or tests?
Frequency Reporting (Always - Never ever)
Q6132 Q6232
In the last 12 months, how often did doctors, nurses or other health care providers ask your permission before starting the treatment or tests?
Frequency Reporting (Always - Never)
Autonomy
Q6133 Q6233 Q6307
Now, overall, how would you rate your experience of getting involved in making decisions about your care or treatment as much as you wanted in the last 12 months?
Rating (Very Good - Very Bad)
Confidentiality Q6140 Q6240
In the last 12 months, how often were talks with your doctor, nurse or other health care provider
Frequency Reporting
15

CHAPTER TWO
done privately so other people who you did not want to hear could not overhear what was said?
(Always - Never)
Q6141 Q6241
In the last 12 months, how often did your doctor, nurse or other health care provider keep your personal information confidential? This means that anyone whom you did not want informed could not find out about your medical conditions.
Frequency Reporting (Always - Never)
Q6142 Q6242 Q6308
Now, overall, how would you rate your experience of the way the health services kept information about you confidential in the last 12 months?
Rating (Very Good - Very Bad)
Q6150 Q6250
Over the last 12 months, with the doctors, nurses and other health care providers available to you how big a problem, if any, was it to get a health care provider you were happy with?
Other Reporting (Level of problem)
Q6151 Q6251
Over the last 12 months, how big a problem, if any, was it to get to use other health services other than the one you usually went to?
Other Reporting (Level of problem)
Choice of health care provider
Q6152 Q6309
Now, overall, how would you rate your experience of being able to use a health care provider or service of your choice over the last 12 months?
Rating (Very Good - Very Bad)
Q6160
Thinking about the places you visited for health care in the last 12 months, how would you rate the basic quality of the waiting room, for example, space, seating and fresh air?
Rating (Very Good - Very Bad)
Q6161 Thinking about the places you visited for health care over the last 12 months, how would you rate the cleanliness of the place?
Rating (Very Good - Very Bad)
Quality basic amenities
Q6162 Q6310
Now, overall, how would you rate the quality of the surroundings, for example, space, seating, fresh air and cleanliness of the health services you visited in the last 12 months?
Rating (Very Good - Very Bad)
Q6311
In the last 12 months, when you stayed in a hospital, how big a problem, if any, was it to get the hospital to allow your family and friends to take care of your personal needs, such as bringing you your favourite food, soap etc?
Other Reporting (Level of problem)
Q6312
During your stay in the hospital, how big a problem, if any, was it to have the hospital allow you to practice religious or traditional observances if you wanted to?
Other Reporting (Level of problem)
Access to social support networks
Q6313
Now, overall, how would you rate your experience of how the hospital allowed you to interact with family, friends and to continue your social and/ or religious customs during your stay over the last 12 months?
Rating (Very Good - Very Bad)
16

CHAPTER TWO
Response scale options Report (Frequency) scales: Always, Usually, Sometimes, Never Rating scales: Very good, Good, Moderate, Bad, Very bad Other reporting (number of days): Same day, 1-2 days, 3-5 days, 6-10 days, More than 10 days Other rating (problems): No problem, Mild, Moderate, Severe, Extreme Problem
The questions in Table 2.2 clearly indicate that the focus of responsiveness measurement in the MCSS was on asking people questions about their experiences. In the case of health everyone can be asked questions on their health as everyone experiences some departure from complete health at some point in time. However, in responsiveness, not everyone has experiences of ambulatory and hospital inpatient interactions with the health system in a defined period of time. As personal interactions with the health providers were used as the basis for reporting on the health system’s responsiveness, the sample of respondents to questions on experiences was limited by the extent of these contacts over the last 12 months - which was considered to be a balance between a realistic recall period and the necessity to obtain a sufficient sample size.
This approach to the measurement of responsiveness is one difference between responsiveness and many of the population satisfaction or public opinion surveys. These other surveys often simply ask about the respondent’s satisfaction with the system in general, and whether they were in contact with it recently, without referring to specific experiences. By focusing on an actual experience the respondent has a specific referent that is likely to be a more accurate representation of their health care experience and more specific about a service that can be improved. WHO is firmly of the view that focusing on actual experiences will produce better quality data about how health systems are actually performing than the general opinions of users and non-users9.
2.3 Importance (Valuation) of Responsiveness Domains All respondents, regardless of system usage, were asked the responsiveness importance, or
valuation, question. One finding from a review of all the survey data was that not all responsiveness domains are equally important to individuals. Generally, prompt attention was rated as the most important domain, followed by communication and dignity.
Respondents to the MCSS were asked to rank the eight responsiveness domains in terms
of perceived importance to them personally. The full text of the question, the layout, and the description of domains that were used in the short form questionnaire are reproduced below. 9 Murray CJ, Kawabata K, Valentine N. People's experience versus people's expectations. Health Affairs, 2001, 20(3): 21-4.
17

CHAPTER TWO
Figure 2.1 Text of the question, the layout and the description of domains used in short form questionnaire
Read the cards below. These provide descriptions of some different ways the health care
services in your country show respect for people and make them the centre of care. Thinking about what is on these cards and about the whole health system, which is the most important and the least important to you? PLEASE WRITE IN AT THE BOTTOM OF THE PAGE DIGNITY1 ● being shown respect ● having physical examinations conducted in privacy
AUTONOMY2
● being involved in deciding on your care or treatment if you want to ● having the provider ask your permission before starting treatments or tests
CONFIDENTIALITY OF INFORMATION3
● having your medical history kept confidential ● having talks with health providers done so that other people who you don’t want to have hear you can’t overhear you
SURROUNDINGS OR ENVIRONMENT4● having enough space, seating and fresh air in the waiting room ● having a clean facility (including clean toilets) ● having healthy and edible food
CHOICE5 ● being able to choose your doctor or nurse or other person usually providing your health care ● being able to go to another place for health care if you want to
SOCIAL SUPPORT6 ● being allowed the provision of food and other gifts by relatives ● being allowed freedom of religious practices
PROMPT ATTENTION7 ● having a reasonable distance and travel time from your home to the health care provider ● getting fast care in emergencies ● having short waiting times for appointments and consultations, and get tests done quickly ● having short waiting lists for non-emergency surgery
COMMUNICATION8 ● having the provider listen to you carefully ● having the provider explain things so you can understand ● having time to ask questions
MOST IMPORTANT ________________________ LEAST IMPORTANT_______________________ Source: WHO MCSS 2000 - 2001 Brief Questionnaire
Using the survey responses, a single variable for each domain was created in which the survey responses are summarized using the following coding: 1 = least important 2 = neither least or most important 3 = most important.
18

CHAPTER TWO
Information on the importance of different domains can assist policy makers to understand which improvements of health system responsiveness to prioritize.
2.4 Responsiveness Expectations
All questionnaires on responsiveness included vignettes, which are short descriptions of hypothetical scenarios about people’s experiences with the health system as they relate to the different domains of responsiveness. Respondents were asked to rate using the same rating scale used in the responsiveness description questions (“very good” to “very bad”).
For example, respondents were asked to report the level of dignity, with which the person in the vignette was treated, answering on a scale of “very good”, “good”, “moderate”, “bad”, and “very bad”. This information provides a record of differences in the way people use verbal categories to evaluate a common stimulus. For example, one person might categorise the scenario described in a vignette as “good”, while another might consider that the same scenario is “very good”. An example of two vignettes is found in Table 2.3. In the analysis of the results, the different use of response categories by different individuals in different countries can be used to adjust respondents’ responses regarding their own experiences onto a common response scale.
Having a mechanism to address cross-population measurement comparability issues is essential, as discussed earlier (section 1.3). The vignettes potentially address cross-population measurement comparability, as they provide a means of adjusting self-reported ordinal responses by taking into account the effects of different cultures, languages, beliefs and so on. The approach WHO has used to analyse the data using information derived from the vignettes is not described in this guideline. It is planned to include this material in a later edition of the guidelines. Table 2.3 Vignette wording example, the MCSS Vignette wording Question wording
Rose is an elderly woman who is illiterate. Lately, she has been feeling dizzy and has problems sleeping. The doctor did not seem very interested in what she was telling him. He told her it was nothing and wrote something on a piece of paper, telling her to get the medication at the pharmacy.
How would you rate Rose’s experience of how the health care provider communicated with her? 1 Very good 2 Good 3 Moderate 4 Bad 5 Very bad
Conrad is suffering from AIDS. When he enters the health care unit the doctor shakes his hand. He asks him to sit down and inquires what his problems are. The nurses are concerned about Conrad. They give him advice about improving his health.
How would you rate Conrad’s experience of how the health care provider treated him with dignity? 1 Very good 2 Good 3 Moderate 4 Bad 5 Very bad
19

CHAPTER TWO
2.5 The MCSS Responsiveness Module Development and Testing Literature Review
The responsiveness module is characterized by questions grouped around various aspects
of people’s encounters with health systems, also known as responsiveness “domains”. The domains were identified after a broad literature review undertaken between September 1999 and June 2000. The literature review involved database searches, covering Medline, the Social Science Citation Index and Psychlit Journals for the full period covered by the databases. The bibliographies of prominent articles, identified as such by the prominence of their authors, their international scope and their focus on several domains of patient experiences, were reviewed to identify other important articles. The literature review resulted in the identification of 7 domains but subsequent discussions with patient experience survey experts led to the extraction of “communication” as a distinct domain rather than subsumed under dignity and autonomy. Prominent papers from the literature review are classified by domain and shown in Figure 2.2 (page 21)10.
Key words used in the database searches in addition to words such as “dignity” and
“autonomy” included “patient decision making”, “politeness”, “privacy”, “ fresh air” “clean linen”. The purpose of the literature review was to find questions and topics that captured all the important non-clinical aspects of health system encounters and then to try to combine as many concepts related to good care (treating persons as individuals rather than merely as patients) into one domain as possible so as to produce a parsimonious domains structure for the conceptual framework. Selection criteria for domains included:
• previous validation in other studies as important attributes that individuals seek in their
interaction with the health system; • amenable to self report; • comprehensive, when taken together, to capture all important aspects of responsiveness that
people value; • able to be measured in a way that is comparable within and across populations.
Table 2.4 shows how many of the responsiveness domains were found in well-known patient questionnaires and studies. As none of the existing questionnaires and studies captured all of the dimensions emerging from the literature review, WHO considered it important to develop an instrument (questionnaire) for responsiveness that did in fact cover all domains.
10 de Silva A. A framework for measuring responsiveness. Global Programme on Evidence for Health Policy Discussion Paper Series: No. 32. Geneva: World Health Organization. URL http://www3.who.int/whosis/discussion_papers/pdf/paper32.pdf
20

CHAPTER TWO
Figure 2.2: Literature supporting different responsiveness domains (in order of search) Dignity (and communication) Prompt attention Ali and Mahmoud (1993) Collins (1996) Avis, Bond and Arthur (1997) Etter et al (1996) Bassett, Bijlmakers and Sanders (1997) Grol et al (1999) Cleary et al (1991) Lim, Tan, Goh and Ling (1998) Collins (1996) McIver (1991)
Etter et al (1996) Pascoe and Attkisson (1983) Grol et al (1999) Ware et al (1983) Gross et al (1998) Access to social support networks during care
Kenagy, Berwick and Shore (1999) Cleary et al (1991) Lim, Tan, Goh and Ling (1998) Quality of basic amenities Morris (1997) Abramowitz et al (1987)
Rurnbull and Hembree (1996) Baker (1991) Rylance (1999) Collins (1996) Wensing et al (1998) McIver (1991) Autonomy (and communication) Ware et al (1983) Avis, Bond and Arthur (1997) Minnick et al (1997) Charles, Gafni and Whelan (1997) Choice of Care Provider
Cleary et al (1991) Collins (1996) Coulter, Entwistle and Gilbert(1999) Campbell (1994) Meredith et al (1993) Hall et al (1994) Confidentiality Meredith et al (1993) Grol et al (1999) Rylance (1999)
Denley and Smith (1999) Source: de Silva (2000: 24)
21

CHAPTER TWO
Table 2.4 Other questionnaires with items on the responsiveness domains
Responsiveness domains
Patient Survey Quest.
1
Adult Core
Quest. 2
Comm. Tracking Study 3
20 Item Scale
4
Evaluating Ranking Scale 5
Picker Patient
Experience Quest. 6
Quote Rheumatic
Patients Quest. 7
Respect for autonomy X X X Choice of care provider X X X X X Confidentiality X X Communication X X X X X X X Dignity X X X X X X X Prompt attention X X X X X X Quality basic amenities X X X Access to family and community support X X
Source: Murray CJL, Evans DB (Eds) Health systems performance assessment: debates, methods and empiricism. Geneva (2003:576) 1 Ware Jr JE et al. Defining and measuring patient satisfaction with medical care. Evaluation and Program Planning, 1983, 6:247–263. 2 Ottosson B et al. Patients’ satisfaction with surgical care impaired by cuts in expenditure and after interventions to improve nursing care at a surgical clinic. International Journal for Quality Health Care, 1997, 9(1): 43–53. 3 Center for Studying Health System Change. Design and methods for the community tracking study. Washington, DC, Center for Studying Health System change, 2003. 4 Pascoe GC, Attkisson CC. The evaluation ranking scale: a new methodology for assessing satisfaction. Evaluation and Program Planning, 1983, 6:335–347. 5 Haddad S, Fournier P, Potvin P. Measuring lay perceptions of the quality of primary health care services in developing countries. Validation of a 20 item scale. International Journal for Quality in Health Care, 1998, 10:93–104. 6 Jenkinson C, Coulter A, Bruster S. The Picker Patient Experience Questionnaire: development and validation using data from in-patient surveys in five countries. International Journal for Quality in Health Care, 2002, 14:353–358 and Cleary PD et al. Patients evaluate their hospital care: a national survey. Health Affairs, 1991, 10:254–267. 7 Van Campen C et al. Assessing patients' priorities and perceptions of the quality of health care. The development of the QUOTE-Rheumatic patient's instrument. British Journal of Rheumatology, 1998, 37:362–368.
22

CHAPTER TWO
Expert advice After the literature review, the next strongest influence on the design of the
responsiveness module was the survey work of the Agency for Health Research and Quality (AHRQ), a United States Government policy research agency. Since 1995, AHRQ had undertaken work in collaboration with researchers from the Harvard Medical School, the Research Triangle Institute and RAND, to develop questionnaires for reporting consumer’s assessments of health plans. By 1997 AHRQ had developed and funded the Consumer Assessment of Health Plans survey and reporting kit to capture patient experiences through patient reports rather than their satisfaction with these experiences. The instrument they developed became known as the Consumer Assessment of Health PlanS (CAHPS) survey. WHO used and adapted a number of items relevant to the domains of responsiveness. Commonalities between the MCSS and CAHPS questions are shown in Table 2.5. Table 2.5 Questions from the AHRQ CAHPS questionnaire included in the responsiveness module with little or no change Domain Question Response scale Prompt attention
In the last 12 months, when you wanted care, how often did you get care as soon as you wanted?
always(1), usually(2), sometimes(3), never(4)
In the last 12 months, how long did you usually have to wait from the time that you wanted care to the time you received care?
units of time
Dignity In the last 12 months, when you sought care, how often did doctors, nurses or other health care providers treat you with respect?
always(1), usually(2), sometimes(3), never(4)
In the last 12 months, when you sought care, how often did the office staff, such as receptionists or clerks there, treat you with respect?
always(1), usually(2), sometimes(3), never(4)
Clear communication
In the last 12 months, how often did doctors, nurses or other health care providers listen carefully to you?
always(1), usually(2), sometimes(3), never(4)
In the last 12 months, how often did doctors, nurses or other health care providers there, explain things in a way you could understand?
always(1), usually(2), sometimes(3), never(4)
In the last 12 months, how often did doctors, nurses or other health care providers give you time to ask questions about your health problem or treatment?
always(1), usually(2), sometimes(3), never(4)
Autonomy
In the last 12 months, how often did doctors, nurses or other health care providers there involve you as much as you wanted to be in deciding about the care, treatment or tests?
always(1), usually(2), sometimes(3), never(4)
Choice of care provider
In the last 12 months, with the doctors, nurses and other health care providers available to you, how big a problem, if any, was it to get to a health care provider you were happy with?
no problem(1), mild problem(2), moderate problem(3), severe problem(4), extreme problem(5)
Source: Murray CJL, Evans DB (Eds) Health systems performance assessment: debates, methods and empiricism. Geneva (2001:613)
23
CHAPTER TWO
2.6 MCSS Implementation A number of survey instruments were fielded to test the responsiveness questions prior to
launch of the MCSS in 2000-2001.
In 1999 the WHO conducted the first pilot –household surveys in 3 countries: Tanzania, Colombia and the Philippines, using the face-to- face mode. The questionnaire contained 6 responsiveness domains: dignity, autonomy, confidentiality, prompt attention, quality basic amenities and the choice of the health care provider).
Also in 1999, WHO ran a key informant survey in 35 countries. It focused on 7 domains of responsiveness (dignity, autonomy, confidentiality, prompt attention, access to social support networks, quality basic amenities and the choice of the health care provider). The questionnaire was administered in face-to-face, telephone and self-administered modes.
In 2000, WHO ran a pilot for the multi-country household questionnaire on health and health system's responsiveness. This second pilot was also a face-to-face household survey and used a much longer questionnaire compared with the first 3-country pilot. It covered all the 8 domains (dignity, autonomy, confidentiality, clear communication, prompt attention, access to social support networks, quality basic amenities and choice of care provider) with questions adapted from the key informant survey, the 3-country pilot and the CAHPS survey. It was implemented in 8 countries (China, Colombia, Egypt, Georgia, India, Nigeria, Slovakia and Turkey).
The final responsiveness module was launched towards the end of 2000 and in 2001 as a part of MCSS household surveys in 60 countries, completing 70 surveys in different modes (in total 13 long face-to-face surveys, 27 brief face-to-face surveys, 28 postal surveys and 2 telephone surveys). The long survey had 126 items in the responsiveness module (extended form) and all other surveys had 87 items in the responsiveness module (short form). Both forms covered all 8 domains of responsiveness.
A Key Informant Survey (KIS) containing similar responsiveness questions was launched at the same time but is not discussed further here. It was administered to “key informants” (e.g. providers, consumers, policy makers, media workers). Key informants gave their opinions of their health system responsiveness of the public and private sectors, the extent of unequal treatment and experiences for different population groups within their country, how they measure and value different states of inequality in responsiveness, and how they value the importance of the different responsiveness domains within the overall construct. For more information on KIS refer to web page: http://www.who.int/responsiveness
2.7 Evaluation of the MCSS Responsiveness Module Apart from the goal of measuring health system responsiveness in different countries, the
goal of the MCSS was to develop questions and techniques, which could be recommended to countries as reliable and valid ways to measure health system responsiveness. Psychometrics, a branch of survey research, examines the quality of survey instruments and has developed
24

CHAPTER TWO
methods to address errors in measurement. We examined the responsiveness module’s feasibility, reliability (including internal consistency) and validity in detail and compared the instrument’s properties with those of other similar, though smaller scale, surveys.
Appendix 5 discusses this evaluation in detail. The results of this evaluation and a comparison with test thresholds used in other similar surveys are shown in Table 2.6. Table 2.6 Summary of key psychometric properties of the responsiveness module Psychometric
property Test statistic
Threshold/ criterion
values used in other studies
No. of studies using threshold
MCSS test statistics (range across
countries)
MCSS test statistics (total or average across
countries)
Validity Factor analysis no strict cut off 0.302-0.943* 0.8105*
0.6
1 0.226 - 0.898* 0.7531*
0.7 8
Internal consistency reliability
Cronbach's Alpha
0.8 3
Internal consistency
reliability and a weak
measure of content validity
Item total correlation
0.4
10
0.127-0.786* 0.559*
0.6
2
0.43 - 0.87 0.67 Test-retest
(temporal) reliability
Kappa 0.7 1
Item missing rates 20% 1 1% - 54% 6%
Feasibility Survey response rates
30%
1 24% - 99% 58.5%
Source on MCSS results: Murray CJL, Evans DB (Eds) Health systems performance assessment: debates, methods and empiricism. Geneva: (2001:.597-796), results from 65 surveyed countries, see Appendix 4 for more details and references *responsiveness module (hospital inpatient and ambulatory care only)
The MCSS instrument, and its responsiveness module, in spite of some problems with implementation related mostly to feasibility, meets classical quality criteria. We used the set of tests that validated the instrument quality. For example the MCSS instrument construct validity, that was one of the greatest survey interests, was proved by Confirmatory Factor Analysis. Factor loadings confirmed the theoretical assumption that a set of questions measuring people’s experience with the health systems could be expressed in a small number of responsiveness domains (0.8105 on average). We assessed that all responsiveness items could be summarised in
25

CHAPTER TWO
a single latent construct (that the MCSS data is one-dimensional) (internal consistency testing, Cronbach’s Alpha value 0.7531 on average).
Reliability testing used the MCSS data to estimate the portion of the variance that is true or non-random, and this proportion was expressed as a Kappa coefficient between 0 and 1.Test-retest interviews confirming instrument reliability was conducted on a small proportion of the original sample (on 9 countries completing the household long questionnaire), providing information on how reliable the survey data is. Kappa coefficients ranged from 0.43 to 0.87, and were 0.67 on average. Given the range of Kappa values the MCSS confirmed fair reproducibility, the degree to which an instrument measures the same way each time it is used under the same conditions with the same respondents.
The instrument feasibility was tested by analysing the response rate (58.5% on average) and missing values. The MCSS wanted to maximise the response rates, as incomplete responses contribute to uncertainty about the generalisability of the findings from the survey sample to the population from which the survey is drawn. Nevertheless, the response rates varied widely across countries, which is another sign of difficulties with survey implementation rather than inherent problems with the responsiveness module. The missing value cut off was set at 20%11, the values over 20% should not be accepted at face value. Analysing the MCSS item missing values we can conclude, that the instrument in general addressed the issues of the cross-population and country feasibility of most questions (6% on average across countries).
11 Murray CJL, Evans DB (2003) Health systems performance assessment: goals, framework and overview. In Murray CJL, Evans DB (Eds) Health systems performance assessment: debates, methods and empiricism. Geneva: World Health Organization.
26

CHAPTER THREE
CChhaapptteerr TThhrreeee:: DDaattaa mmaannaaggeemmeenntt,, qquuaalliittyy ccoonnttrroollss,, aanndd pprreeppaarraattiioonn ffoorr aannaallyyssiiss
3.1 Survey implementation Monitoring the quality of survey implementation in the MCSS was challenging because of
the large number of participating survey operators (more than 20) and countries (60). While details on survey implementation are documented elsewhere12, as background information we summarize the procedures involved, before focusing on data quality assurance for most of this chapter.
All survey operators were requested to conduct nationally representative surveys in their countries, except in a few cases in countries with large populations where national surveys were too expensive for the MCSS budget. All survey operators were also asked to submit information on sampling frame and technical reports assessing non-response rates and the representativeness of the sampled population. While surveys were under way, WHO staff completed more than a dozen site visits, but not all countries were covered. In cases where sub-contractors covered more than one country (INRA, GALLUP), they too organized site visits to check the quality of survey implementation.
A large component of the quality assurance related to data involved checking how data was captured, coded, entered and transferred to WHO. This section of the guidelines focuses on these data quality assurance measures, with reference to translations as these formed an important component of the overall quality assurance procedures and the final analytical checks
.
3.2 Standard Questionnaire Translations WHO provided its standard translation protocol to countries where questionnaires had to
be translated into the local language. This protocol had been developed during earlier work on instrument development. Expert groups in each country were expected to document key problems experienced in the translation process. For example, there could be some words in English that do not have an equivalent in another language and hence required approximate phrases in the local language to express the concept. The terms listed in Table 3.1 were back-translated for the responsiveness module.
12 More detailed description available in Bedirhan Ustun, T. et al., Health System Performance Assessment. Debates, Methods and Empiricism; Christopher JL Murray and David B Evans (eds), in chapter WHO Multi-country Survey Study on Health and Responsiveness 2000-2001, 2003, WHO, Geneva
27

CHAPTER THREE
Table 3.1. List of terms used for back-translations
Rate Pharmacist Space, seating, fresh air and cleanliness
How much difficulty Prompt attention Conditions in the waiting room
How much a problem Right away To get something as soon as you wanted
Very Good Appointment allow your family and friends to Good Dignity take care of your personal needs Moderate Respect allow you to practice religious Bad Privacy or traditional observances Very bad Communication Home health care None Autonomy Social support Mild Making decisions about health care Emergency surgery
Moderate Health care providers treat you (with respect) Non-emergency surgery
Severe The privacy of your body was respected Family planning services
Extreme Tests Emergency health services Health care provider Treatment Outpatient health care Doctor Confidentiality Nationality Nurse Personal information Social class Midwife Choice of providers Ethnicity Traditional healer Surroundings Health status
Environment Treated worse (because you are a woman)
Translation and back-translation were reviewed by WHO using in-house experts. All issues
flagged by countries were considered and any additional problems were then communicated back to the country.
Specific translations of responsiveness questions were double-checked by the WHO responsiveness team. A copy of all questionnaires was obtained and back translations were checked using a software program. In case of errors the questions were further referred to in-house language experts in WHO.
28

CHAPTER THREE
3.3 Standard Survey Data Checks
The figure below summarizes the steps in the quality assurance process for data collection. Figure 3.1 Generic Data Quality Assurance Steps
Source: Murray CJL, Evans DB (Eds) Health systems performance assessment: debates, methods and empiricism. Geneva (2001:.776) 3.3.1 Supervisor's check
In order to monitor the quality of the data and ensure that countries complied with WHO
guidelines in all household surveys, the conditions under which the interviews were conducted and the problems that survey teams encountered were observed by supervisors first hand.
According to the technical reports, supervisors reviewed anywhere between 0-40% of completed questionnaires to check if options had been recorded appropriately and if questions were skipped correctly. Generally, they checked at least a few completed questionnaires from each interviewer to ensure standards were maintained across interviewers.
Some countries re-contacted a certain number of respondents while others recontacted a certain proportion of respondents. Supervisors for the 13 countries using the long form of the questionnaire repeated some interviews within a period of one week to check interview completeness and correctness. Supervisors in a number of countries using the brief questionnaire also repeated portions of the questionnaire by telephone within a few days of the interview.
29

CHAPTER THREE
3.3.2 Data coding and entry
At each site the data was coded by investigators to indicate the respondent status and the selection of the modules for each respondent within the survey design. After the interview was edited by the supervisor and considered adequate, it was entered locally.
A data entry program was developed in WHO specifically for the survey study and provided to the sites. It was developed using a database program called the I-Shell (short for Interview Shell), a tool designed for easy development of computerized questionnaires and data entry. This program allows for easy data cleaning and processing.
The data entry program checked for inconsistencies and validated the entries in each field by checking for valid response categories and range checks. For example, the program did not accept an age greater than 120. For almost all of the variables there existed a range or a list of possible values that the program checked for. A number of countries used their own coding format for the education variable which was then mapped to the WHO categories provided in the MCSS questionnaire.
In addition, the data was entered twice to capture other data entry errors. The data entry program was able to warn the user whenever a value that did not match the first entry was entered at the second data entry. In this case the program asked the user to resolve the conflict by choosing either the 1st or the 2nd data entry value before being able to continue. After the second data entry was completed successfully, the data entry program placed a mark in the database in order to enable the checking of whether this process had been completed for each and every case. 3.3.3 Data transfer
The I-Shell data entry program was capable of exporting the data into one compressed database file which could be easily sent to WHO using email attachments or a file transfer program onto a secure server.
Countries were allowed the use of as many computers and as many data entry personnel as they wanted. Computers used for this purpose produced one file each. The files were merged once they were delivered to WHO.
In accordance with the protocol, all countries were expected to send the data periodically as they collected it enabling checking procedures and preliminary analyses in the early stages of the data collection. 3.3.4 Data checking algorithms
Quality controls involved two main procedures. The first related to checking the data for missing information, validity, and representativeness.
Once the data was received by WHO, the records were checked for inconsistencies between the two entries entered on site. Data was analyzed for missing variables, invalid
30

CHAPTER THREE
responses and representativeness in terms of age and sex. Inconsistencies were also noted and reported back to the countries concerned. The main types of incorrect information checked were wrong use of center codes, duplicated IDs, missing age, sex and education variables. In the case of the long questionnaires, the detailed household rosters were checked for completeness.
3.4 Processing responsiveness data and analytical checks Once the incoming data went through standard checking procedures, all datasets were
cleaned and prepared for analysis. The following procedures were used to process the data: 3.4.1 Variable recoding and renaming
All categorical variables in the datasets were recoded to read in a positive direction: from
the worst to the best possible level: • 1 "very good" 2 "good"... 5 "very bad" - recoded to 1 "very bad" 2 "bad" .. 5 "very good", • 1 "always".. 4 "never" - recoded to 1 "never"..4 "always", • 1 "no problem" .. 5 "extreme problem" - recoded to 1 "extreme problem" .. 5 "no problem".
Variables were renamed across datasets to provide a common codebook for all countries. A few variables were also created from existing variables to facilitate analysis: • The variable "patient" was created with the following categories: 1 "Outpatient only", 2
"Inpatient only" 3 "Both" 4 "Neither". • A variable called "discrim" was created to represent the total number of people who
reported discrimination (from any of the categories mentioned in the question "In the last 12 months were you treated badly by the health system or services in your country because of your: nationality, social class, etc ..?"
• The variable "utilis" represents the number of people who reported using any facility in the last 30 days. This variable includes all categories from the question "There are different types of places you can get health services listed below. Please can you indicate the number of times you went to each of them in the last 30 days for your personal medical care."
• Another variable for utilization called "sumuse" shows the total number of visits made by individuals to health care providers in the last 30 days (using the same question mentioned above).
• Separate variables for each domain were created from the questions on importance of domains - "aut", "ch", "com", "con", "dig", "pa", "qba", and "ss". These variables were coded as 1 "in most important", 2 "not mentioned", and 3 "in least important".
The vignette variables were also recoded and renamed. Recoding of vignettes involved
ranking the vignettes across all surveys (by taking a mean score for each vignette), and then naming them according to their domain and rank. In each domain there were 7 vignettes. Renaming of vignettes was undertaken to represent the name of the domain as well as the ordering from the vignette representing the best scenario to the one representing the worst. For example, all dignity domains were renamed vdig1-vdig7, with the postscript "1" representing the best vignette and "7" the worst vignette from the instrument developers/researchers perspective.
31

CHAPTER THREE
Errors in coding of questions were rectified. In some countries, Yes/No questions requiring 1="Yes" and 5="No", had coded "No" as "2" instead of "5". All questions were subsequently double checked to ensure that a feasible range of values had been entered. 3.4.2 Valid observations on health system responsiveness
The fundamental idea behind the measurement of responsiveness is that it is based on people's experiences with the health system, rather than just on their opinion's based on hearsay, media etc. With this in mind, it was necessary to screen survey respondents for those who had used a health services within some defined period, and in the MCSS the period was the 12 months prior to the interview.
Patient experiences were judged to have taken place only if the respondent answered at least
four of the domain questions and answered yes to the first screening question on having used health services in the previous 12 months. Relevant skip patterns were then adjusted according and the "patient" variable was recoded as "4" to reflect ineligibility of observations for responsiveness analysis. 3.4.3 Consistency
Several analyses were run to check the data for consistency in coding, labeling and ordering - both within one country's dataset as well as across datasets for all countries. We expected problems with consistency as there were 3 types of surveys instruments (long, brief 60 minute and brief 30 minute), in 4 different modes: face-to-face interviewer-administered, postal, telephone and drop-and-collect. Also, these surveys were conducted by a number of different operators, including survey companies like INRA and GALLUP, as well as independent, single-country operators.
A first check for internal consistency was undertaken by checking variables recorded in both the household roster and individual questionnaire. For example, if the age of the respondent recorded in the two sections was different, we considered the true value to be the one in the individual questionnaire (as household rosters were more likely to be unreliable). If, however, the value in the individual questionnaire was invalid (e.g. age>120), a valid value from the household roster was considered true. This check was conducted for variables including age, sex, and education.
A second check was to review tabulations of all variables. The questions on responsiveness experiences were found to be coded and ordered consistently across countries. The labeling of the responses to questions on responsiveness importance differed slightly across questionnaires, so it was necessary to recode these questions, going back to the original questionnaires. Tabulations of question on sex, education, income showed that these questions had been coded differently in some countries. Graph of the vignettes by average country rank, also revealed some strange patterns. On investigation of a few outliers, it appeared that some questions had, for example, used education categories instead of years of education. Furthermore, some countries had changed the ordering of the vignettes. As a response to these findings, the original questionnaires were obtained for all surveys and the translation and coding of the questions for
32

CHAPTER THREE
sex, age, education, income, and all the vignettes were back-translated to establish the categories used for these questions, as well as their ordering in the case of the vignettes.
3.5 Final responsiveness datasets
WHO is providing cleaned and analyzed datasets for each country on the responsiveness section of the MCSS. The data has been prepared in Stata format and can be downloaded from the following website: http://www.who.int/responsiveness/mcss/analytical_data
Do files for further categorizing variables, running responsiveness analysis or psychometrics are also provided from this website. In case offered Stata do files are not running properly, please adjust your do files according to variables related to your country (e.g. delete part of the do file dealing with questions not relevant to your country or empty variables).
33

CHAPTER FOUR
CChhaapptteerr FFoouurr:: PPrreesseennttiinngg rreessuullttss
The results presented here focus on health system responsiveness in ambulatory and hospital inpatient care in particular with reference to how different population sub-groups perceive the health services. We focus on the frequency of respondents reporting positive and negative perceptions of the health care facility.
The aim of the chapter is to give you a framework of how responsiveness should be evaluated and what basic questions need to be answered prior to improving policy and practice in your own country. We have analysed the data using Stata 8.0 but you can use any other statistical package you are familiar with to produce the same results.
4.1 Key questions that should be answered We hope to provide you with the information and tools you need to conduct an analysis of
the responsiveness data for your country by providing you with some ideas about graphical representations and interesting comparisons. As part of this exercise we will address the following questions regarding the outcome of analysis of responsiveness data:
• Which aspects of responsiveness work well and which work less well? • Are there any differences between the responsiveness of hospitals and
ambulatory/primary health care services? • What are the perceptions of responsiveness among different socio-demographic groups,
in particular vulnerable groups, within a country? • What are the main reported financial barriers and discrimination to access health care? • Which responsiveness domains are most important to people? Are these ones with good
or poor performance?
Note that the frequency of respondents reporting positive and negative perceptions are measures of perceived responsiveness because while the MCSS asks about actual experience, it is possible that expectations give a misleading view of actual health system responsiveness. Thus some respondents may have unrealistically high expectations while others may have expectations lowered in response to a poor performing health system. For example, wealthy and poor people may receive the same treatment but wealthy people may complain more.
Survey results themselves cannot tell you what to do to improve the responsiveness of your health care system or tell you how to generate and implement policy changes to achieve desired improvements. However, answers to the above questions can become an invaluable information source for improving policy and practice in your own country. This chapter provides advice on the best way to present results. It is the precursor to the next chapter on how to use these reported results to improve policy and practice.
34

CHAPTER FOUR
4.2 How to do the analysis
In this chapter we will use data from the MCSS conducted in a Sample Country in 2001 to demonstrate how to report the data. To obtain your own country’s results simply use your country data stored under the website link Data13, and follow the suggested strategy, explanation of results and Stata do files (use "1. Categorization.do" followed by "2. Analysis of FINAL Dataset.do" and "3. Health and Sex Tables.do"). Alternatively, develop your own programs using other computer software.
The first unit of analysis includes data tables generated by running the Stata do files mentioned above. It is important to consider sample sizes (provided in tables) when interpreting results since the data have not been either weighted or standardized. For example, caution should be exercised when considering the rating of hospital inpatient care responsiveness by people in the 18-29 year age group (in Australia), since there are only 13 respondents in this category. Tables for Sample Country's MCSS data have been provided at the end of the analyst report.
A selection of graphs, considered to be the most illustrative, have been constructed for the report. However, it is possible to make more graphs from the data in tables depending on their relevance for the country. All graphs for the report have been created in MS Excel though other software could also be used to achieve similar results.
Information from the tables and graphs have then been incorporated to present two sample reports - one for the analyst (Ch 4.3-4.9), and a shorter one for policy makers (Appendix 6).
Our approach to presenting results is based upon respondents’ reported experience and their assessment of the responsiveness of the health care they have received. The results for reporting questions are presented in terms of the problems people encountered. The results for responsiveness are presented using the rating questions, which were asked of people only after they had answered a series of detailed "report" questions. The rating questions act as a summary score for each domain.
Respondents evaluated their experiences with the health services. Negative perceptions or just a "problem" was defined somewhat differently according to the response options used for specific questions. For report questions using the response categories "never, sometimes, usually, always", a problem was defined as the percentage of people responding in the "never" or "sometimes" categories. For questions using the response categories "no problem, mild problem, moderate problem, severe problem and extreme problem", the bottom three categories were used to indicate a problem. For rating questions using the response categories "very bad, bad, moderate, good and very good", a problem was defined as the percentage of people responding "very bad", "bad" or "moderate". We find that using two categories from questions rating from "never" to "always" provide comparable results to using three categories from
13 See Chapter 3, Section 3.5 Final responsiveness datasets
35
CHAPTER FOUR
questions rating from "very bad" to "very good". Vignettes analysis is also based on ratings where higher scores indicate higher expectations.
Responsiveness results are presented according to key socio-demographic indicators, namely sex, area of residence, age groups, income distribution, self-assessed/reported health and education. All eight domains of responsiveness (seven in the case of ambulatory care and an additional one for hospital inpatient care) were assessed through summary hospital inpatient and ambulatory care ratings, by averaging across the domains. A further summary rating for "overall responsiveness" was composed by taking the raw unweighted average of the hospital and ambulatory care ratings.
WHO has developed another method of analyzing responsiveness data in which we conduct a latent variable analysis adjusted for expectations using the Hierarchical Ordered Probit (HOPIT) Model and Compound Hierarchical Ordered Probit (CHOPIT) Model. This method involves the use of vignettes that provide a means of adjusting self-reported ordinal responses for expectations. In the current version of this document we do not use an expectations adjustment technique for measurement of the domains of responsiveness. However, the novel statistical technique developed by WHO will be available in an update of these Guidelines.
36

37
Percentage rating responsiveness as poor, by sex
11
8
Male Female
Percentage rating responsiveness as poor, by self-assessed health
13
8
Bad Health Good Health
Percentage rating responsiveness as poor, by age group
2 6
1311
86
3
18-29y 30-44y 45-59y 60-69y 70-79y 80+y
Percentage rating responsiveness as poor, by education level
8 8
11
Inco mple teP rimary
P rimary Higher Educa tio n
Percentage rating responsiveness as poor, by income quintile
10 10 10
14
9
Q1 Q2 Q3 Q4 Q5
74% of respondents used health services in the last 12 months
10% of respondents did not seek care due to unaffordability
14% of respondents reported discrimination during their last visit
10% of respondents waited 6 days or more for test results
90% of people using health services report good responsiveness
SAMPLE REPORT
10% of people using health services report responsiveness poor
Percentage of patients reporting..
85
86
87
88
89
94
95
96
Respect for their right to make informedchoices
Access to social support
Prompt attention
Choice of health care providers
Clarity of communication
Being treated respectfully
Clean and well maintained facilities
Privacy and confidentiality of records
Prompt Attention
Confidentiality
Basic Amenities
Dignity
Communication
Choice
Social Support
Autonomy

Summary of Patient Experiences
38
Percentage rating overall responsiveness as poor,by sex
15
8
13
16
5
13
6
16
12
4
9
14
5
10
5
9
Prompt Attention
Dignity
Communication
Autonomy
Confidentiality
Choice
Basic Amenities
Social Support
Male Female
Percentage rating overall responsiveness as poor,by age groups
25
14
18
25
7
21
8
26
8
2
8
11
3
6
3
11
Prompt Attention
Dignity
Communication
Autonomy
Confidentiality
Choice
Basic Amenities
Social Support
Below 60 years 60+ years
Percentage rating overall responsiveness as poor,by education levels
13
6
10
8
3
11
4
5
16
8
12
17
6
14
6
16
Prompt Attention
Dignity
Communication
Autonomy
Confidentiality
Choice
Basic Amenities
Social Support
Less than 12 years Higher education
Percentage rating overall responsiveness as poor,by self-assessed health
16
9
15
19
8
15
6
18
12
4
9
13
3
9
5
9
Prompt Attention
Dignity
Communication
Autonomy
Confidentiality
Choice
Basic Amenities
Social Support
Bad Health Good Health
Percentage rating overall responsiveness as poor,by income groups
14
7
12
15
5
13
3
11
14
7
14
17
5
13
7
17
Prompt Attention
Dignity
Communication
tonomy
Confidentiality
Choice
Basic Amenities
Social Support
Q1 & Q2 Q3, Q4, & Q5
Au
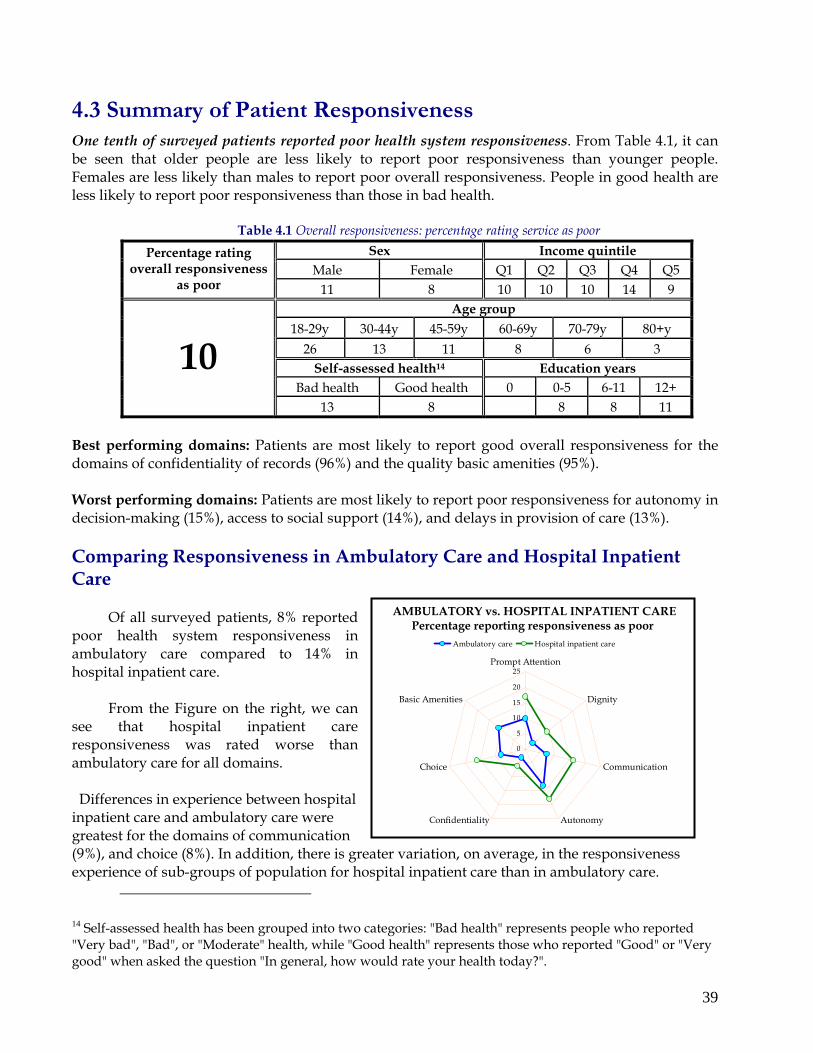
4.3 Summary of Patient Responsiveness One tenth of surveyed patients reported poor health system responsiveness. From Table 4.1, it can be seen that older people are less likely to report poor responsiveness than younger people. Females are less likely than males to report poor overall responsiveness. People in good health are less likely to report poor responsiveness than those in bad health.
Table 4.1 Overall responsiveness: percentage rating service as poor Sex Income quintile
Male Female Q1 Q2 Q3 Q4 Q5 Percentage rating
overall responsiveness as poor 11 8 10 10 10 14 9
Age group 18-29y 30-44y 45-59y 60-69y 70-79y 80+y
26 13 11 8 6 3 Self-assessed health14 Education years
Bad health Good health 0 0-5 6-11 12+
10 13 8 8 8 11
Best performing domains: Patients are most likely to report good overall responsiveness for the domains of confidentiality of records (96%) and the quality basic amenities (95%). Worst performing domains: Patients are most likely to report poor responsiveness for autonomy in decision-making (15%), access to social support (14%), and delays in provision of care (13%). Comparing Responsiveness in Ambulatory Care and Hospital Inpatient Care
Of all surveyed patients, 8% reported poor health system responsiveness in ambulatory care compared to 14% in hospital inpatient care.
From the Figure on the right, we can see that hospital inpatient care responsiveness was rated worse than ambulatory care for all domains.
Differences in experience between hospital inpatient care and ambulatory care were greatest for the domains of communication (9%), and choice (8%). In addition, there is greatexperience of sub-groups of population for hosp
14 Self-assessed health has been grouped into two cat"Very bad", "Bad", or "Moderate" health, while "Goodgood" when asked the question "In general, how wou
AMBULATORY vs. HOSPITAL INPATIENT CARE Percentage reporting responsiveness as poor
0
5
10
15
20
25Prompt Attention
Dignity
Communication
AutonomyConfidentiality
Choice
Basic Amenities
Ambulatory care Hospital inpatient care
er variation, on average, in the responsiveness ital inpatient care than in ambulatory care.
egories: "Bad health" represents people who reported health" represents those who reported "Good" or "Very ld rate your health today?".
39

40
Percentage rating hospital inpatient care responsiveness as poor, by sex
20
11
18
19
6
17
0
16
13
5
12
16
8
13
0
9
Prompt Attention
Dignity
Communication
Autonomy
Confidentiality
Choice
Basic Amenities
Social Support
Male Female
FemalesFemales
Social Support
Basic Amenities
Choice
Confidentiality
Autonomy
Communication
Dignity
Prompt Attention
Bad health
Less educated
Q1 & Q2 (poor)
60+ years
Social Support
Basic Amenities
Choice
Confidentiality
Autonomy
Communication
Dignity
Prompt Attention
Bad health
Less educated
Q1 & Q2 (poor)
60+ years
Percentage rating hospital inpatient care responsiveness as poor, by self-assessed health
19
12
19
21
10
19
0
18
16
6
13
15
3
12
0
9
Prompt Attention
Dignity
Communication
Autonomy
Confidentiality
Choice
Basic Amenities
Social Support
Bad Health Good Health
Percentage rating hospital inpatient care responsiveness as poor, by age groups
36
22
26
32
10
31
0
26
11
4
12
14
4
8
0
11
Prompt Attention
Dignity
Communication
tonomy
Confidentiality
Choice
Basic Amenities
Social Support
Au
Below 60 years 60+ years
Percentage rating hospital inpatient care responsiveness as poor, by education levels
10
3
13
8
2
9
0
5
21
12
17
21
8
20
0
16
Prompt Attention
Dignity
Communication
Autonomy
Confidentiality
Choice
Basic Amenities
Social Support
Less than 12 years Higher education
Percentage rating hospital inpatient care responsiveness as poor, by income groups
18
10
16
18
7
15
0
11
19
11
20
21
7
18
0
17
Prompt Attention
Dignity
Communication
Autonomy
Confidentiality
Choice
Basic Amenities
Social Support
Q1 & Q2 Q3, Q4, & Q5
Hospital Inpatient Care Experiences
Coloured circles represent worse perceptions of responsiveness by vulnerable groups

4.4 Perceptions of Hospital Inpatient Care Responsiveness Of all respondents who sought hospital inpatient care, 14% reported poor responsiveness. This was a higher proportion than that reporting poor ambulatory care responsiveness (8%).
Percentage of respondents rating hospital inpatient care
responsiveness as poor
0
5
10
15
20Prompt Attention
Dignity
Communication
Autonomy
Confidentiality
Choice
Basic Amenities
Social Support
Best performing domains: In hospital inpatient care services, patients are most likely to report good responsiveness for confidentiality (97%) and dignity (91%). Worst performing domains: Patients report poor responsiveness most often for the domains of autonomy (18%), communication (16%) and choice (16%). Responsiveness perceptions of vulnerable groups: Females are more likely to report lack of confidentiality than males. Elder people are less likely to report poor responsiveness on any
domain than younger people. Poorer people are less likely (than richer people) to report poor responsiveness for any domain. Less educated people are less likely (than higher educated people) to perceive poor responsiveness for any domain. People in bad health are more likely to rate responsiveness as poor for every domain, except for the quality basic amenities, than people in good health.
Table 4.2 Hospital inpatient responsiveness: percentage rating service as poor
Table 4.3 Percentage rating hospital inpatient responsiveness as poor by health, income, and sex
From Table 4.3: males in every category are more likely to report poor responsiveness in health systems than females. Non-poor males in bad health are most likely to rate responsiveness as poor (26%), while poor females in good health are least likely to perceive poor responsiveness (2%).
Sex Income quintile Male Female Q1 Q2 Q3 Q4 Q5
Percentage rating hospital inpatient
responsiveness as poor 13 10 13 10 13 19 11 Age group
18-29y 30-44y 45-59y 60-69y 70-79y 80+y 38 16 14 11 8 5
Self-assessed health Education years Bad health Good health 0 0-5 6-11 12+
12 15 9 4 8 14
Female Male
Poor15 (Q1&Q2)
Non-poor (Q3, Q4 & Q5)
Bad Health 11 14
14 26
Good Health 2 15
9 10
15 "Poor" has been defined here as the combination of the first and second income quintiles (Q1 & Q2) representing the bottom 40% of the population. This construct is purely for convenience to compare less wealthy to more wealthy population perceptions of responsiveness. It does not represent any pre-defined level of being "poor".
41

42
FemalesFemales
Basic Amenities
Choice
Confidentiality
Autonomy
Communication
Dignity
Prompt Attention
Bad health
Less educated
Q1 & Q2 (poor)
60+ years
Basic Amenities
Choice
Confidentiality
Autonomy
Communication
Dignity
Prompt Attention
Bad health
Less educated
Q1 & Q2 (poor)
60+ years
Percentage rating ambulatory care responsiveness as poor, by sex
9
4
8
13
3
9
12
11
2
6
12
2
6
9
Prompt Attention
gnity
Communication
Autonomy
Confidentiality
Choice
Basic Amenities
Di
Male Female
Percentage rating ambulatory care responsiveness as poor, by age groups
13
6
9
18
3
11
16
5
1
4
8
1
4
5
Prompt Attention
ignity
Communication
Autonomy
Confidentiality
Choice
Basic Amenities
D
Below 60 years 60+ years
Percentage rating ambulatory care responsiveness as
Ambulatory Care Experiences
Percentage rating ambulatory care responsiveness as poor, by self-assessed health
12
6
11
17
5
10
11
8
2
5
11
2
6
10
Prompt Attention
Dignity
Communication
Autonomy
Confidentiality
Choice
Basic Amenities
Bad Health Good Health
poor, by education levels
15
9
8
9
5
14
8
10
3
7
13
3
8
12
Prompt Attention
Dignity
Communication
Autonomy
Confidentiality
Choice
Basic Amenities
Less than 12 years Higher education
Percentage rating ambulatory care responsiveness as poor, by income groups
10
4
13
3
10
6
10
3
13
3
7
13
Prompt Attention
Dignity
Communication
Autonomy
Confidentiality
Choice
Basic Amenities
97
Q1 & Q2 Q3, Q4, & Q5
Coloured circles represent worse perceptions of responsiveness by vulnerable groups

4.5 Perceptions of Ambulatory Care Responsiveness
Of all survey respondents using ambulatory care services, 8% reported poor responsiveness. This is less than the percentage of respondents that rated inpatient care responsiveness as poor (12%).
Percentage of respondents rating ambulatory care responsiveness as poor
0
5
10
15Prompt Attention
Dignity
Communication
AutonomyConfidentiality
Choice
Basic Amenities
Best performing domains: In ambulatory care services, patients are most likely to report good responsiveness for dignity (97%) and confidentiality (97%). Worst performing domains: Patients report poor responsiveness most often for the domains of autonomy (13%) and basic amenities (11%). Responsiveness perceptions of vulnerable groups: Females are more likely to report delays in provision of care than males. Elder people are less likely to report poor responsiveness on any domain than younger people. Poorer people are more likely (than richer people) to report poor responsiveness for the
domains of prompt attention, dignity, communication and choice. Less educated people are more likely (than higher educated people) to perceive poor responsiveness for prompt attention, dignity, communication, confidentiality and choice. People in bad health are more likely to rate responsiveness as poor for every domain than people in good health.
Table 4.4 Ambulatory care responsiveness: percentage rating service as poor Sex Income quintile
Male Female Q1 Q2 Q3 Q4 Q5 Percentage rating ambulatory care
responsiveness as poor 8 7 6 9 8 8 8 Age group
18-29y 30-44y 45-59y 60-69y 70-79y 80+y 13 10 9 6 4 2
Self-assessed health Education years Bad health Good health 0 0-5 6-11 12+
8 10 6 12 7 8
Table 4.5 Percentage rating ambulatory care responsiveness as poor by health, income, and sex
Non-poor men in bad health are most likely (17%),
while poor females in good health are least likely (5%) to rate responsiveness as poor. On average, males are at least as likely to report poor responsiveness as females. Non-poor females in good health are most likely to perceive poor responsiveness among female sub-groups.
Female Male Poor (Q1&Q2) Non-poor
(Q3, Q4 & Q5)
Bad Health 9 9
10 17
Good Health 5 7
6 7
43

Specific Case of Prompt Attention in Ambulatory Care: Waiting for Test Results The survey queried respondents on the number of days it took to receive their test results. For the country as a whole, 10% of people using health services waited 6 days or more for test results. Eight percent of females reported receiving their test results at least 6 days later, while 10% of males reported the same. Variation in results by income quintiles does not show a systematic pattern. However, people with lower education are more likely to receive late test results. Older people, in general, are less likely to report receiving test results late than younger people (except for the youngest age group).
By sex
10
8
Male Female
By self-assessed health
11
9
Bad Health Good Health
By age groups
7
14
11
87
4
18-29y 30-44y 45-59y 60-69y 70-79y 80+y
By income quintile
11 11
3
13
8
Q1 Q2 Q3 Q4 Q5
By education level
17
10 9
IncompletePrimary
Primary Higher Education
Percentage of respondents who waited 6 days or more for test results
44
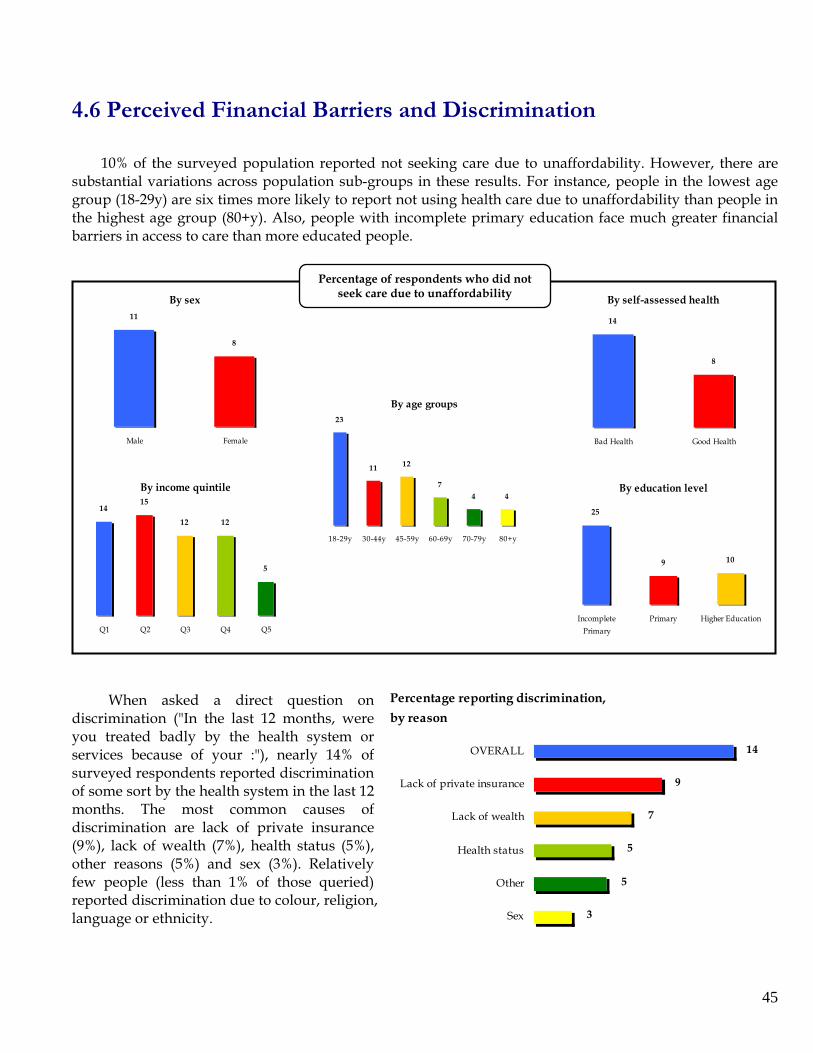
4.6 Perceived Financial Barriers and Discrimination
10% of the surveyed population reported not seeking care due to unaffordability. However, there are substantial variations across population sub-groups in these results. For instance, people in the lowest age group (18-29y) are six times more likely to report not using health care due to unaffordability than people in the highest age group (80+y). Also, people with incomplete primary education face much greater financial barriers in access to care than more educated people.
By sex11
8
Male Female
By education level
25
9 10
IncompletePrimary
Primary Higher Education
By income quintile
1415
12 12
5
Q1 Q2 Q3 Q4 Q5
By age groups23
11 12
74 4
18-29y 30-44y 45-59y 60-69y 70-79y 80+y
By self-assessed health
14
8
Bad Health Good Health
Percentage of respondents who did not seek care due to unaffordability
PWhen asked a direct question on discrimination ("In the last 12 months, were you treated badly by the health system or services because of your :"), nearly 14% of surveyed respondents reported discrimination of some sort by the health system in the last 12 months. The most common causes of discrimination are lack of private insurance (9%), lack of wealth (7%), health status (5%), other reasons (5%) and sex (3%). Relatively few people (less than 1% of those queried) reported discrimination due to colour, religion, language or ethnicity.
ercentage reporting discrimination,
by reason
14
9
7
5
5
3
OVERALL
Lack of private insurance
Lack of wealth
Health status
Other
Sex
45

Importance of domains,by sex
0%
20%
40%
60%
80%
100%
Male Female
Perc
enta
ge o
f res
pond
ents
rati
ng
dom
ain
to b
e th
e m
ost i
mpo
rtan
t
Social Support
Basic Amenities
Choice
Confidentiality
Autonomy
Communication
Dignity
Importance of domains,by self-assessed health
0%
20%
40%
60%
80%
100%
Bad Health Good Health
Perc
enta
ge o
f res
pond
ents
rati
ng
dom
ain
to b
e th
e m
ost i
mpo
rtan
t
Social Support
Basic Amenities
Choice
Confidentiality
Autonomy
Communication
Dignity
Importance of domains,by age groups
0%
20%
40%
60%
80%
100%
18-29y 30-44y 45-59y 60-69y 70-79y 80+y
Perc
enta
ge o
f res
pond
ents
rati
ng
dom
ain
to b
e th
e m
ost i
mpo
rtan
t
Social Support
Basic Amenities
Choice
Confidentiality
Autonomy
Communication
Dignity
Importance of domains,by education level
0%
20%
40%
60%
80%
100%
Inco mple teP rimary
P rimary HigherEducatio n
Perc
enta
ge o
f res
pond
ents
rati
ng
dom
ain
to b
e th
e m
ost i
mpo
rtan
t
Social Support
Basic Amenities
Choice
Confidentiality
Autonomy
Communication
Dignity
FemalesFemales
Social Support
Basic Amenities
Choice
Confidentiality
Autonomy
Communication
Dignity
Prompt Attention
Bad health
Less educated
Q1 & Q2 (poor)
60+ years
Social Support
Basic Amenities
Choice
Confidentiality
Autonomy
Communication
Dignity
Prompt Attention
Bad health
Less educated
Q1 & Q2 (poor)
60+ years
Importance of domains,by income quintile
0%
20%
40%
60%
80%
100%
Q1 Q2 Q3 Q4 Q5
46
Perc
enta
ge o
f res
pond
ents
rati
ng
dom
ain
to b
e th
e m
ost i
mpo
rtan
t
Social Support
Basic Amenities
Choice
Confidentiality
Autonomy
Communication
Dignity
Importance of Responsiveness Domains
Coloured circles represent domains considered more important by vulnerable groups, relative
to their comparison groups

4.7 Importance of Responsiveness Domains
40% of survey respondents consider prompt attention to be the most important responsiveness domain. Every population sub-group also considers prompt attention to be most important of all eight domains, ranging from 31% of people in the lowest income quintile (Q1) and with incomplete primary education, to 44% of people in the highest income quintile (Q5).
Percentage of respondents rating a responsiveness domain to be most important
P rompt Attention40%
Dignity19%
Communication19%
Choice13%
Basic Amenities0%
Autonomy6%
Confidentiality3%
Social Support0%
Given the undisputed importance of prompt attention as a domain, we have focused on presenting results for the remaining 7 domains (on facing page). Of the 7 remaining domains, communication is rated
as the most important (19%) followed by dignity (19%) and choice (13%). The least important domains include quality basic amenities (0%), social support (0%), and confidentiality (3%).
Overall responsiveness and importance of domains
00.10.20.3
0 0.1 0.2 0.3 0.4 0.5 0.6 0.7 0.8 0.9 1 1.1
Overall responsiveness (on a 0-1 scale)
Confidentiality
DignityCommunication
Social SupportBasic Amenities
ChoiceAutonomy
Prompt Attention
0.40.50.60.70.80.9
11.1
Impo
rtan
ce (o
n a
0-1
scal
e)
There are divergences in people's
perception of the relative importance of domains. For example, dignity and choice are considered more important on an average with increasing age groups (see facing page).
We can now relate the relative importance of all domains to their ratings by patients. This will help us consider the priorities for action with respect to domains. The percentage of respondents rating a domain as most important has been rescaled to a 0-1 interval with "1" representing the relatively most important domain and "0" the relatively least important one. Similarly, perceptions of responsiveness as poor (%) has been rescaled to a 0-1 interval with "0" representing the domain most likely to be perceived as poor performing and "1" representing the domain least likely to be perceived as poor performing.
Although prompt attention is rated as the most important domain, its responsiveness performance is reported as relatively poor. Also, the domain of communication is rated as important but is perceived as poor performing. However, dignity, one of the most important domains, is seen to be performing relatively well. Other domains performing well include confidentiality and basic amenities though they are perceived to be relatively less important domains.
47

16
48
Percentage reporting utilization and non-use, by sex
71
14
29
20
25
Ambulatory Care
Hospital InpatientCare
Non Use
74
Female Male
Percentage reporting utilization and non-use,by self-assessed health
81
31
17
69
12
30
Ambulatory Care
Hospital InpatientCare
Non Use
Bad Health Good Health
Percentage reporting utilization and non-use,by age groups
69
13
30
80
27
19
Ambulatory Care
Hospital InpatientCare
Non Use
Below 60 years 60+ years
Percentage reporting utilization and non-use,by education levels
72
35
28
72
16
27
Ambulatory Care
Hospital InpatientCare
Non Use
Less than 12 years Higher education
Percentage reporting utilization and non-use,by income groups
80
25
20
72
14
28
Ambulatory Care
Hospital InpatientCare
Non Use
Q1 & Q2 Q3, Q4, & Q5
Health Services Utilization
16 NOTE: The bars for the three categories (ambulatory care, hospital inpatient care, and non use) add up to more than 100%. This is because people using both ambulatory and hospital inpatient care are counted twice.

4.8 User Profile
74% of the survey respondents reported having utilized health services in the last 12 months. Of this, 17% used both inpatient and ambulatory services, 56% used only ambulatory services, and 1% used only inpatient services. Utilization by sub-group is presented on the facing page. Approximately, 74% of males and 71% of females used health services over the past 12 months. Poorer and less educated people reported greater utilization of hospital inpatient services than richer or higher educated ones, respectively.
Average number of visits per person to health provider in last 12 months
11
1 1
3
12
GP HospitalAmbulatory
Hospital Inpatient Pharmacy Other*
Other* includes dentists, specialists, chiropractors, traditional healers, clinics, and other providers
From the Figure above we can see that, on an average, people visit a general physician 11 times a year (see Table 4.6 for distribution by population sub-group), other health care providers 12 times a year, and are likely to go to a pharmacy thrice a year. Men are more likely than women to visit other health care providers - 14 visits in the past year compared to 9 for women.
Table 4.6 shows the average number of visits in the last 12 months to a general physician by population sub-group. We can see that the number of visits to a doctor increase with age, and decreases with higher education and rising income. People with incomplete primary education visit physicians, on an average, nearly four times more than those with higher education.
Table 4.6 Average number of visits to a General Physician (GP) in last 30 days
(multiplied by 12 to give rough annual average) Sex Income quintile
Male Female Q1 Q2 Q3 Q4 Q5 Average number of
visits to a physician in last 12 months 11 10 17 15 12 8 6
Age group 18-29y 30-44y 45-59y 60-69y 70-79y 80+y
7 7 9 11 19 18 Self-assessed health Education years
Bad health Good health 0 0-5 6-11 12+
11 19 7 34 14 9
49

4.9 Expectations17
17 This section explores expectations of various population sub-groups based on their rating of seven vignettes for each domain. Vignette scores were computed by summing the vignette ratings (1-5) by domain for each individual; and then taking an average by population sub-group. The minimum possible vignette score is 7 (all vignettes being marked as the best outcome suggesting low expectations), while the maximum possible score is 35 (all vignettes being marked as the worst outcome suggesting high expectations). Therefore, all scores are out of a maximum of 35 with higher scores representing higher expectations.
By sex
2 3 2 3
Male Female
By age group
2 3
2 2
2 3
2 2 2 2
2 1
18-2 9 y 30 -4 4y 45-59 y 60 -6 9y 70 -79y 8 0 +y
By education level
2 5 2 5
2 6
Inco mp lete Primary Primary Hig her Ed ucat io n
By age group
2 6 2 6 2 6
2 5 2 5
2 6
18 -29 y 30 -4 4y 4 5-59 y 6 0 -6 9 y 70 -79y 80 +y
By education level
2 5 2 5
2 6
Inco mp lete Primary Primary Hig her Educat io n
By age group
2 4 2 4 2 4 2 4
2 3
2 4
18 -29 y 30 -4 4y 4 5-59 y 6 0 -6 9 y 70 -79y 80 +y
By education level
2 22 3
2 4
Inco mp lete Primary Primary Hig her Educat io n
By age group
2 1 2 1 2 1
2 0 2 0
19
18 -29 y 30 -4 4y 4 5-59 y 6 0 -6 9 y 70 -79y 80 +y
By education level
2 1
2 0 2 0
Inco mp lete Primary Primary Hig her Educat io n
Vignette scores for Prompt Attention
Vignette scores for Dignity
Vignette scores for Communication By sex
2 3
2 4
Male Female
By sex
2 0 2 0
Male Female
By sex
2 5
2 6
Male Female
Vignette scores for Autonomy
50
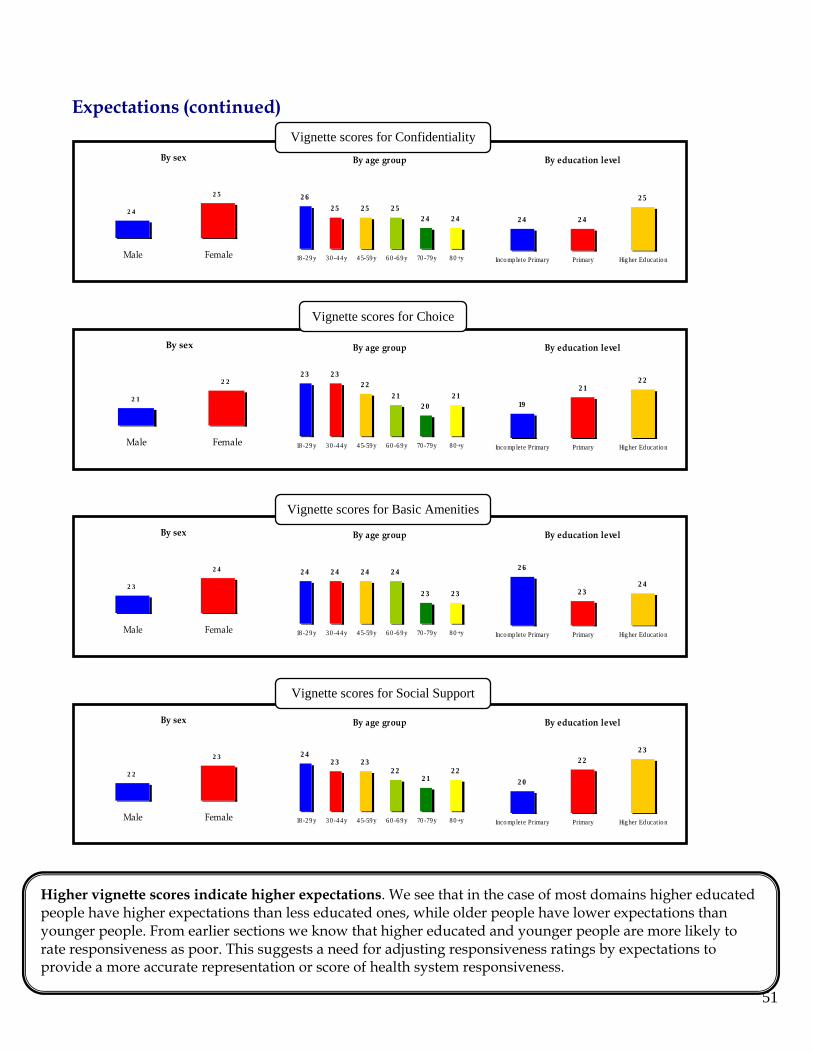
(continued)
Expectations
51
By age group
2 62 5 2 5 2 5
2 4 2 4
18 -29 y 30 -4 4y 4 5-59 y 6 0 -6 9 y 70 -79y 80 +y
By education level
2 4 2 4
2 5
Inco mp lete Primary Primary Hig her Educat io n
By age group
2 3 2 32 2
2 12 0
2 1
18 -29 y 30 -4 4y 4 5-59 y 6 0 -6 9 y 70 -79y 80 +y
By education level
19
2 12 2
Inco mp lete Primary Primary Hig her Educat io n
By age group
2 4 2 4 2 4 2 4
2 3 2 3
18 -29 y 30 -4 4y 4 5-59 y 6 0 -6 9 y 70 -79y 80 +y
By education level
2 6
2 32 4
Inco mp lete Primary Primary Hig her Educat io n
By age group
2 42 3 2 3
2 2
80 +y
2 22 1
18 -29 y 30 -4 4y 4 5-59 y 6 0 -6 9 y 70 -79y
By education level
2 22 3
er Educat io n
2 0
Inco mp lete Primary Primary Hig h
Vignette scores for Confidentiality
Vignette scores for Choice
Vignette scores for Basic Amenities
Vignette scores for Social Support
Higher vignette scores indicate higher expectatpeople have higher expectations than less educated onyounger people. From earlier sectio
iveness as poor. This suggests rate representati
ions. We see that in the case of most domains higher educated es, while older people have lower expectations than
ns we know that higher educated and younger people are more likely to rate respons a need for adjusting responsiveness ratings by expectations to provide a more accu on or score of health system responsiveness.
By sex
2 4
2 5
Male Female
By sex
2 1
2 2
Male Female
By sex
2 3
2 4
Male Female
Male Female
By sex
2 2
2 3

52
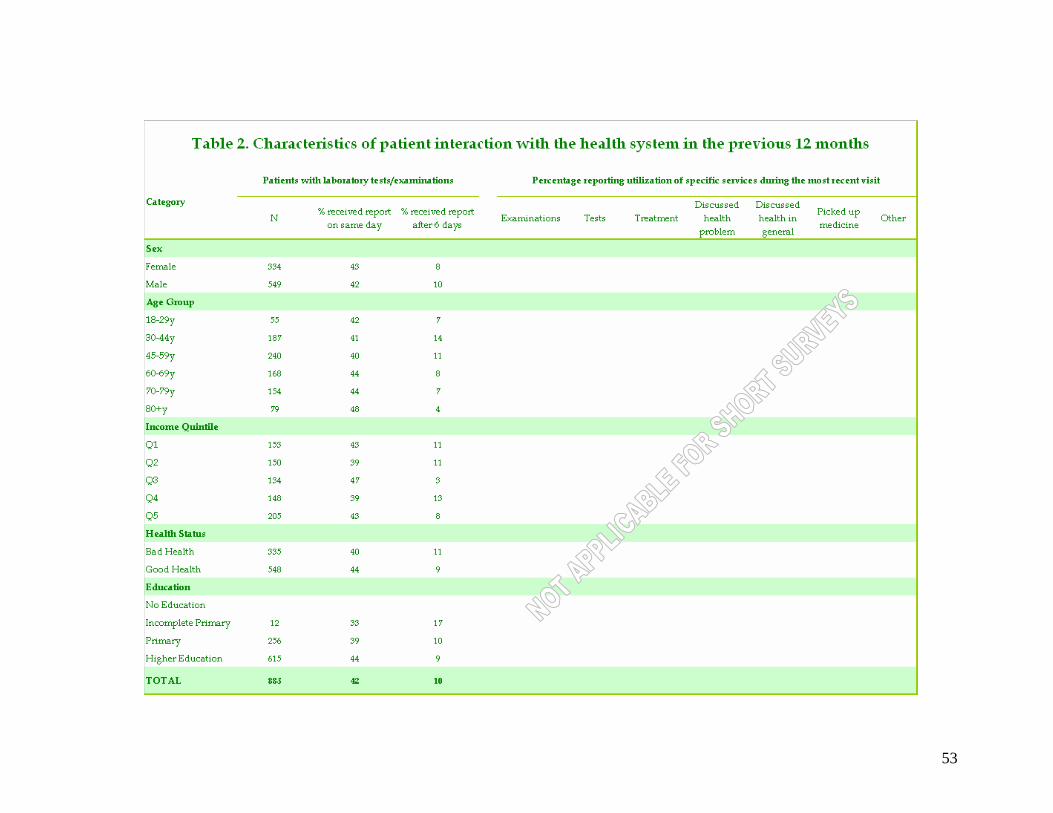
53

54

55

56
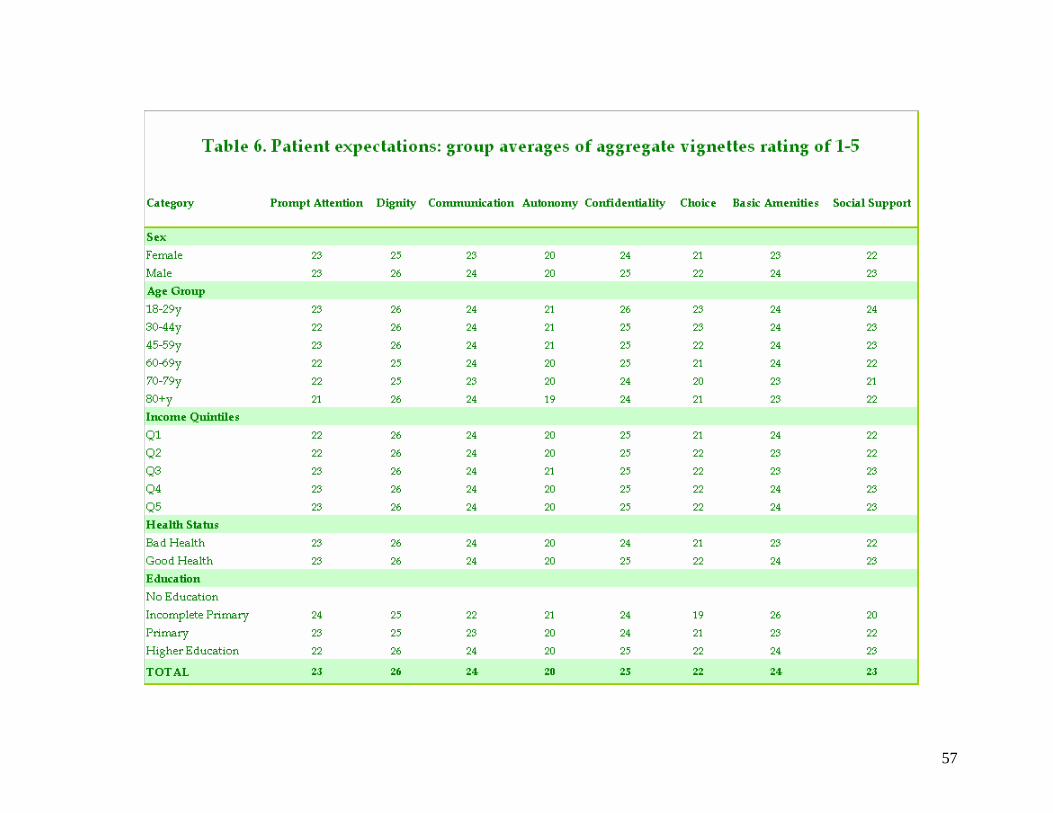
57

CHAPTER FIVE
Chapter Five: Using Results to Improve Policy and Practice
Purpose of this chapter
The results of surveys provide information about what is happening but usually not why it is happening. While the results are relevant to improving policy and practice, they alone cannot tell you what to do to improve the responsiveness of your health care system or how to generate and implement policy changes to achieve desired improvements.
Results about responsiveness should be seen in the context of the situation of your country in terms of its social, political and economic development, especially their impacts on health and health care. Other highly relevant information comes from the overall results of the Multi-country Survey Study (MCSS) and any additional data available within your health care system on its performance.
The purpose of this chapter is to provide a framework to help countries to use the responsiveness results for evidence-based policy and practice improvement.
5.1 From survey results to policy and practice 5.1.1 Principles for generating and disseminating evidence
WHO has formulated five basic principles to inform the generation and dissemination
of evidence in its approach to health systems performance assessment.18 They are: • a measure should have proven validity (a measurement is valid if it measures the
construct that it was intended to measure), • a measure should possess quantified reliability (the extent to which a quantity is free
from random error), • a measure should demonstrate comparability (over time, across communities within a
population and across populations), • a measure should be developed through consultation with those most centrally involved
in the collection, collation, analysis and use of primary data, and • a measure should provide an explicit data audit trail (the trail from primary data
collection, adjustments for known biases and statistical modelling should be replicable).
18 Murray CJL, Mathers CD and Salomon JA. (2003) Towards evidence-based public health. In Murray CJL and Evans DB (Eds) Health Systems Performance Assessment: Debates, Methods and Empiricism. Geneva: World Health Organization.
58

CHAPTER FIVE
The application of these principles to the measurement of responsiveness, especially the first three on technical measurement considerations, has been thoroughly documented in WHO publications and will not be further discussed here. As responsiveness is a relatively recent concept, methodological issues remain a matter of argument and further research. Nonetheless, in practical terms you can present your MCSS survey results to policy makers with confidence that they are rigorous, robust and defensible. It is recommended that you do not overstate the strengths or overlook the weaknesses of responsiveness measurement at this stage of its development. However, the body of work published by WHO means that if your data and/or the concepts of responsiveness and its domains are questioned in your country, you have ready access to detailed justifications.
Your country may have other routines of one-off data collection efforts that are relevant as supporting evidence when you present your evidence to policy makers. You may be able to show that the MCSS self-reported data on health status and other demographics, for example, are comparable to data from other surveys using similar sampling approaches. This can lend credibility to the relevance of MCSS to your country in general and the data on responsiveness in particular. 5.1.2 A framework for evidence-based policy and practice
Figure 5.1 illustrates the steps involved in using the MCSS responsiveness results to
develop, implement and evaluate evidence-based policy and practice. Figure 5.1 A framework for evidence-based policy and practice
59
MCSS results
Policy response
Policy into practice
Appraisal of results for
implications for patients,
health professionals
Evidence for policy
Health-social-political-economic context
Health-social-political-economic context
Monitoring
Evaluation
Effects: Intended & unintended
Review of evidence-based
interventions

CHAPTER FIVE
The diagram shows that the process for producing evidence, policy, practice, and evaluation takes place in the health, social, political and economic context of your country. This context is a major determinant of what is and is not possible in any framework, taking into account, for example, the conditions of economic development, the availability of funds for health care from national and regional budgets, the level of integration of medical and traditional health care, and the policy levers available at different levels within the health system. The context influences what one is able to do at every step from considering the survey results to putting policy into practice.
The MCSS results are the starting point in our framework. They are vital and have a lasting effect in the framework as they are highly relevant to putting policy into practice and to monitoring and evaluation. However, the results are ‘only’ information at this stage. They need to be contextualised and appraised for implications for patients, health care professionals and services. The appraisal process turns results into usable evidence relevant to the situation in your country.
The next step is to develop policy responses to the evidence. It is necessary to review the relevant literature to be sure that any actions or interventions are soundly based on evidence. The stage is now clear for developing policy initiatives and the programs that will put the policy into action. The final step is monitoring and evaluation in which the effects of the policies are tracked in order to determine how well outcomes have been achieved.
The solid lines and arrows joining the steps in our framework indicate the primary links from one step to another. The dotted lines and arrows, on the other hand, indicate secondary links.
5.2 What counts as evidence? 5.2.1 Results and information
For health service researchers it is necessary for the results to be technically sound in
terms of sampling, survey construct validity, psychometrics, and statistical analysis, including acceptable confidence intervals and so on. However, policy makers should be assured about technical soundness but they will be more concerned with what it is possible to do within the real-world constraints of the health and social system of a country.
You will be interested in significant results first; for example, the rankings of the domains according to importance, showing that prompt attention is a major issue (most likely the major issue) in the health care that people want to see improve. There will also be significant results for regional areas and specific groups in the population such as low-income groups, especially those living in rural and remote areas.
In some cases you may be concerned about the absence of significant results where you might expect to find them. An example would be if the health ministry in one region of your country has been increasing the number of doctors and nurses working in community health
60

CHAPTER FIVE
centres in rural areas but no difference was found in the performance of the prompt attention domain for that region compared to others.
In the world of health policy the results also must be context sensitive, that is,
compatible with local culture and local customs. Not only will context sensitivity be likely to vary from one country to another but also quite possibly from one region to another as well. For example, in Australia some remote areas have sizeable Indigenous populations that are quite distinct from major population areas in terms of health outcomes and health service needs. 5.2.2 Appraisal of results - Case study from Australia
Responsiveness results can be appraised from the perspective of the opportunities for
action to improve health system responsiveness in policy and practice in a country. Opportunities can be seen as levers for action, that is, points in the health system that have the potential to influence change. To demonstrate this Table 5.1 shows examples from Australia of the potentially available opportunities for change. A very brief overview of the structure of the Australian health system will help to put the examples into context.
Major sectors in the Australian health system19
The following provides an explanation of the major sectors in the Australian health
system, the columns in Table 5.1. National
Australia is a federation in which the national government funds rather than provides health services and has assumed a health-policy leadership role. It has some specific constitutional powers in relation to health matters. State/territory
The six state and two territory governments have responsibility for administering public health services which account for approximately one third of their recurrent budgets. Regional arrangements
Most state health departments (or equivalent) have regional administrative arrangements for operating the publicly funded health system. Local government
Local governments (municipal and shire councils) engage in a limited range of health-related services, such as monitoring food safety. Private sector
19 Adapted from the European Observatory on Health Care Systems Health Care Systems in Transition series - Australia 2001.
61
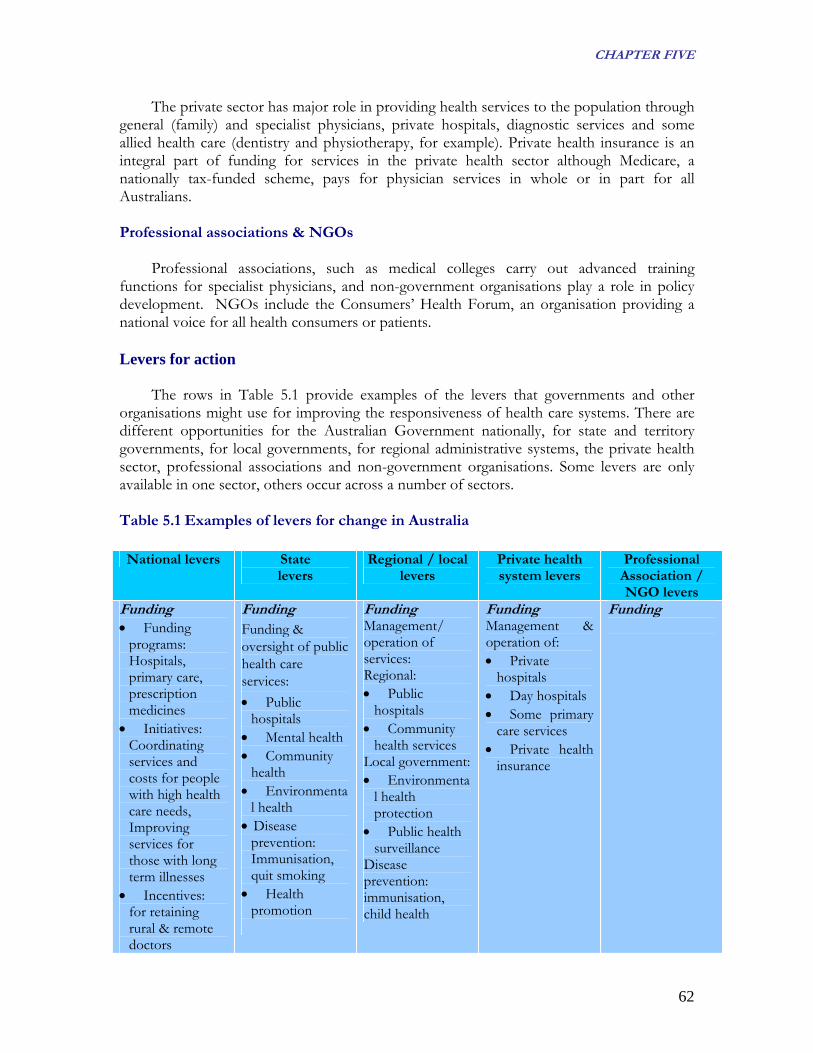
CHAPTER FIVE
The private sector has major role in providing health services to the population through general (family) and specialist physicians, private hospitals, diagnostic services and some allied health care (dentistry and physiotherapy, for example). Private health insurance is an integral part of funding for services in the private health sector although Medicare, a nationally tax-funded scheme, pays for physician services in whole or in part for all Australians.
Professional associations & NGOs
Professional associations, such as medical colleges carry out advanced training functions for specialist physicians, and non-government organisations play a role in policy development. NGOs include the Consumers’ Health Forum, an organisation providing a national voice for all health consumers or patients. Levers for action
The rows in Table 5.1 provide examples of the levers that governments and other
organisations might use for improving the responsiveness of health care systems. There are different opportunities for the Australian Government nationally, for state and territory governments, for local governments, for regional administrative systems, the private health sector, professional associations and non-government organisations. Some levers are only available in one sector, others occur across a number of sectors. Table 5.1 Examples of levers for change in Australia National levers State
levers Regional / local
levers Private health system levers
Professional Association / NGO levers
Funding • Funding
programs: Hospitals, primary care, prescription medicines
• Initiatives: Coordinating services and costs for people with high health care needs, Improving services for those with long term illnesses
• Incentives: for retaining rural & remote doctors
Funding Funding & oversight of public health care services: • Public
hospitals • Mental health • Community
health • Environmenta
l health • Disease
prevention: Immunisation, quit smoking
• Health promotion
Funding Management/ operation of services: Regional: • Public
hospitals • Community
health services Local government: • Environmenta
l health protection
• Public health surveillance
Disease prevention: immunisation, child health
Funding Management & operation of: • Private
hospitals • Day hospitals • Some primary
care services • Private health
insurance
Funding
62

CHAPTER FIVE
Policy leadership • Partnerships
to improve public health services
• National council to promote action on national health priorities
Policy leadership • Programs to
improve health care quality and safety
• Partnerships to coordinate and improve primary care services
Policy leadership Local government: • Projects to
increase shaded areas for protection from harmful UV sunlight
Policy leadership • Developing,
monitoring & evaluating standards of care
Policy leadership • Workforce
issues: training of medical specialists
• Professional development
Peer assessment & review
Regulation • Public health
protection for communicable diseases
• Workforce supply issues university places for medical & nursing students
Regulation • Workforce
registration for doctors & some allied health professions
• License & regulate private hospitals
Regulation Local government: • Environmenta
l health • Public health
surveillance such as for food safety
Regulation • Voluntary
regulation of standards, safety and accreditation
Regulation • Voluntary
regulation of standards, codes of ethics for health professionals
Informat on & iresearch • HealthInsite –
a web-based service for quality-assured information on health conditions
National funding program for health research
Informat on & iresearch • Health service
information Research funding
Informa on & tiresearch Local government:
Environmental health education
Informa on & tiresearch • Health service
information Health education
Informa on & tiresearch • NGO
research funding (e.g., National Heart Foundation)
Public education
Below is an explanation of the major levers in the Australian health system, the
columns in Table 5.1. Funding
One of the most powerful levers lies in the money needed to pay for programs. The funder is often in a position to require action, standards and so on. Policy leadership
Leadership in developing policy is another lever that can lead to national or state-based service frameworks, standards or demonstration programs. Policy leadership together with funding carries much weight. Regulation
Through legislation and associated regulations governments put in place requirements often backed by the power of law.
63

CHAPTER FIVE
Information and research Information includes information made available to the general public as well as
professional health workers in the health care system. Change to evidence-based practice is based upon health research. Levers in the Choice domain – Australian example
A specific example in the choice domain is illustrated in Table 5.2. There are levers in all of the sectors for workforce planning and the actions that can be taken vary considerably from sector to sector. Table 5.2 Examples of levers for action in the Choice domain
Choice issues Australian Government
levers
State levers
Regional / local levers
Professional Association / NGO levers
Workforce supply Especially for health care professionals in short supply
Number of training places in medical & nursing schools
Number of training places for specialists in teaching hospitals Workforce demand for public hospitals Workforce demand for primary care services
Workforce demand for local hospitals
Specialist medical training programs – entry & examination Workforce demand for private hospitals
Workforce distribution Incentives for health care professionals to practice in under-serviced areas
Rural retention program for primary care doctors and nurses Continuing education and training program for isolated health care professionals
Infrastructure to support health care professionals
Local government incentives to GPs
Peer support approaches
Information Information about health care choices
Private health insurance information including costs, options
Publicly funded health care options
Pamphlets describing local health services
Pamphlets on private health insurers, health professionals
The first row in Table 5.2 is concerned with workforce issues. This falls within the
choice domain because without an adequate health workforce (especially doctors and nurses) demand outstrips supply. In this situation consumers have little opportunity to choose between health professionals or services. So the first column deals with training health care professionals to ensure a workforce that will allow choice by patients, carers and families.
64
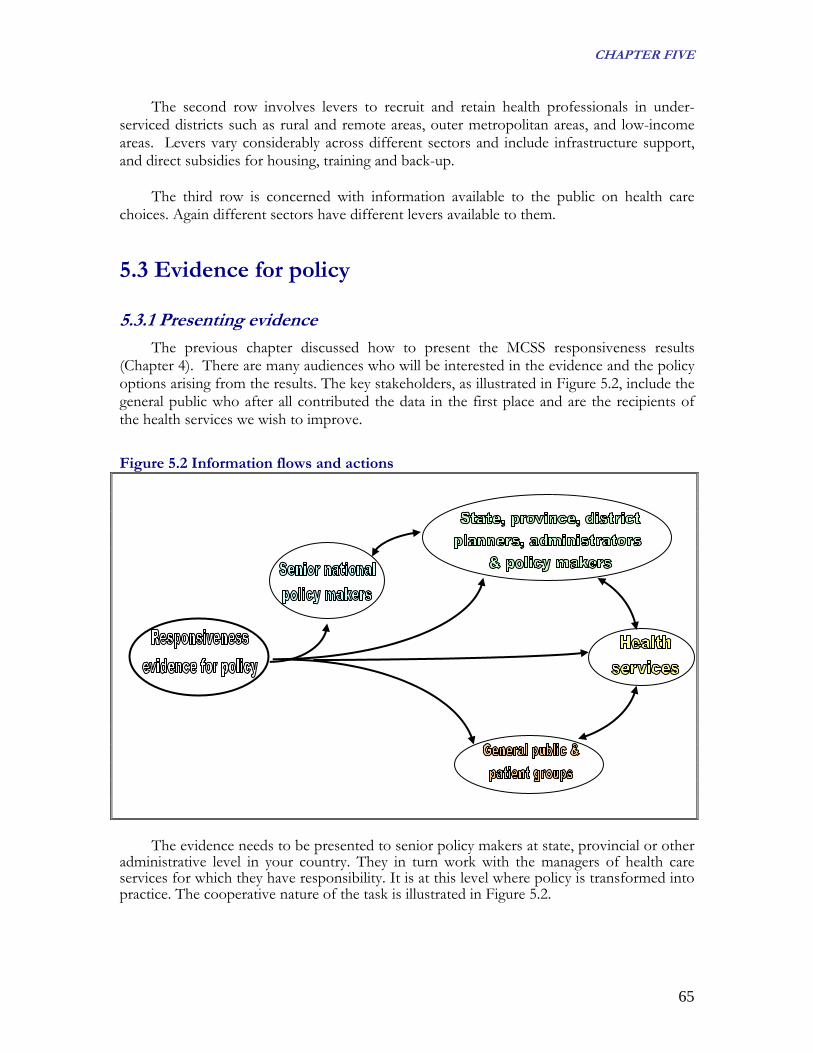
CHAPTER FIVE
The second row involves levers to recruit and retain health professionals in under-serviced districts such as rural and remote areas, outer metropolitan areas, and low-income areas. Levers vary considerably across different sectors and include infrastructure support, and direct subsidies for housing, training and back-up.
The third row is concerned with information available to the public on health care choices. Again different sectors have different levers available to them.
5.3 Evidence for policy 5.3.1 Presenting evidence
The previous chapter discussed how to present the MCSS responsiveness results (Chapter 4). There are many audiences who will be interested in the evidence and the policy options arising from the results. The key stakeholders, as illustrated in Figure 5.2, include the general public who after all contributed the data in the first place and are the recipients of the health services we wish to improve.
Figure 5.2 Information flows and actions
The evidence needs to be presented to senior policy makers at state, provincial or other
administrative level in your country. They in turn work with the managers of health care services for which they have responsibility. It is at this level where policy is transformed into practice. The cooperative nature of the task is illustrated in Figure 5.2.
65

CHAPTER FIVE
5.3.2 Audiences for reports There are three key audiences20 for reports about the responsiveness of a country’s
health system: ·senior policy makers, such as health Ministers and senior ministry officials; ·managers, particularly those implementing policy decisions; and ·citizens or the general public and patient or consumer organisations.
For each report, you will need to develop specific reporting aims for each audience,
about the key messages that the report is to communicate, concerning the responsiveness results, what they mean and what needs to be done. The overall message may be similar but different audiences will require different emphases and levels of detail. The design elements for the reports also have to be tailored to audience needs and expectations, including formatting, amount of text, tables, graphs, charts, font size and colour. Senior policy makers
Senior policy makers generally prefer reports that are brief and to the point as they are typically bombarded with a great volume of information. Checklist for the report to senior managers follows. Checklist for the report to senior policy makers
20 Anand S, Ammar W, Evans T, et al (2003) Report of the Scientific Peer Review Group on Health Systems Performance Assessment. In Murray CJL and Evans DB (Eds) Health Systems Performance Assessment: Debates, Methods and Empiricism. Geneva: World Health Organization.
Purpose & context: • The reason for presenting the report is clear (defining the problem); • The report and its policy implications are relevant to the government, the ministry
and the health care system; • The policy advice is clear, well-argued and carefully targeted; • The costs of implementing the new policy and any savings it will generate are
explained; and • The policy implementation issues are clearly described.
Contents:
• An executive summary succinctly expressing the case in approximately one page (this may be the only part of the report senior policy makers have time to read);
• A brief explanation of responsiveness, its domains, how it differs from satisfaction and how it is measured;
• Highlights of the survey results (what is happening now); • Major achievements and major problems in priority order; • Implications for policy and practice improvement; • Financial implications; • What will happen if policy and practice improvements are implemented; and • What will happen if things remain the same.
66

CHAPTER FIVE
Ministers and senior officials are likely to have preferences for graphic presentation, colour, spacing and font size. Understanding this is useful in guiding content, format and style for reports. It is a good idea to pre-test reports on a sub-set of the report’s audience.
Managers
Managers will have the responsibility for implementing changes decided upon by the senior policy makers. They will need reports that explain the reasons for the changes and enable them to develop implementation plans, often in collaboration with other managers, health care health professionals and representatives of the public. The reports can contain more detail than those for senior policy makers but should be very clear about the areas of action.
Checklist for the report to managers
Purpose & context: • The reason for presenting the report is clear (defining the problem); • The report and its policy implications are relevant to managers in the health care
system; • The policy is clear, well-argued and carefully targeted; • The costs of implementing the new policy and any savings it will generate are
explained; and • The areas of action arising out of implementing the policy are clearly described.
Contents:
• An introduction to responsiveness, including its conceptual basis, the eight domains, how it differs from satisfaction and how it is measured;
• The survey results, including major methodological specifications (e.g. where the interview took place, type of users interviewed);
• Major achievements and major problems in priority order; • Implications for policy and practice improvement; • Policy actions to be taken; • Expected consequences of implementation; • Effect on health care institutions of costs and savings generated from
implementation of policy; and • Tracking changes by collecting responsiveness data.
Citizens or general public and patient or consumer organizations The general public needs to be involved in improving responsiveness beyond
completing survey forms every year or two. To be consistent with the domains of autonomy, dignity and communication the public needs to be informed about how responsive the health care system is and about any plans to address areas needing improvement. Citizens can be persuasive allies in achieving change if information is presented in a readily accessible way, perhaps in the form of a pamphlet or newsletter. Checklist for the report to the general public follows.
67

CHAPTER FIVE
Checklist for the report to citizens/the general public
Purpose & context: • The reason for presenting the report is clear (defining the problem); • The report and its implications for action are relevant to the general public; • The document is clear, well-argued and carefully targeted; • Any costs or savings to the public as individuals or as tax payers are explained;
and • The areas of action are clearly described.
Contents:
• A very brief explanation of responsiveness, its domains, and how it is measured; • Key messages from the survey results; • What will happen as a result of the survey; and • How changes will be tracked and reported.
5.4 Review of evidence-based interventions If the survey results have flagged the choice domain as a problem area, it is likely that
people find they are able to make only limited or ineffectual choices about their own health care. This section reviews some of the major issues around choice, evidence in the professional literature for changing practices, and a selection of evidence-based options for action. 5.4.1 Example - issues regarding the choice domain
To a large degree the amount of choice available to people in choosing their health care professionals and health services will depend upon where they live. Different countries are able to offer different amounts of choice and in some countries choice may seem to be an unattainable luxury and be limited to one source of health care or no health care at all. However, people living in rural and remote areas of developed countries like Australia can also have very limited choice or no choice at all. The ability to pay for health care and treatment, including medications and travel costs, is a critical choice factor. It is for these reasons that choice is related to access to services.
Just because choice may be constrained does not mean that people do not wish to exercise it. Attending a city hospital for cancer treatment, for example, may be preferred to a local, rural hospital because of perceived superior knowledge, competence and technology at health professionals and service levels. Cultural, religious and gender reasons are major choice factors. Continuity of care through consulting the same medical practitioner on a regular basis is another choice factor. On the other hand sometimes being able to consult a different doctor for specific health care treatments or a second opinion may be as important as having a regular doctor. There are yet other people who are content to use health care health professionals and services that are simply readily accessible.
68

CHAPTER FIVE
In countries where private health care and private health insurance are available, choice may be extended to a greater range of health professionals. Conversely, it may in fact be restricted if insurers have contracted with preferred professionals and services to deliver ambulatory and/or hospital inpatient health care and treatment. The insurer-preferred doctor or hospital may be available at a cost advantage or may be the only permitted service-provider for given services covered by the insurance agreement.
A crucial element in choice is information. Economic models of competition tend to make the theoretical assumption that consumers have perfect information when making choices. This is rarely the case in health care. Typically choice is greatly constrained because people do not have access to information about the available services, their cost and their effectiveness. An economic perspective on information use holds that people will search for and utilise information to the extent that the benefits of doing so outweigh the costs. However, information seeking is normally not as proactive as economic models would suggest. Making decisions about choosing a medical practitioner is habitual in many countries and often reflects loyalty to individual doctors rather than lack of available choices.
Even if a large amount of information is available, it is hard to predict how people will
use it or trust it. What information is relevant, to whom and for what purpose remains obscure. Different people in different circumstances will also have different motivations to use available information.
In some countries considerable limits are placed on medical practitioners’ ability to advertise their services. This puts patients, carers and families at a considerable disadvantage in exercising choice and this means that there may be the appearance rather than the reality of choice.
As for all goods and services, choice in the health setting is closely connected to supply and distribution – the greater the supply, usually the greater the choice. This goes beyond primary care services to include medical specialists and specific services such as imaging, obstetric care and complementary, alternative or traditional health care. 5.4.2 Evidence for changed practice
What is the relationship between choice and empowerment? It is hypothesised that on
the basis “… choice can make people feel like they can have control over their care and power over a situation that may be life threatening, embarrassing, or stressful, or for which they feel inadequate.”21
The ability to choose a health care professional appears to be highly valued. The experience of enabling choice of family doctors in health care reforms in Central and Eastern Europe, where choice was previously restricted, has led to high degree of
21 Bernstein AB & Gauthier AK (1999) Choices in health care: what are they and what are they worth? Medical Care Research and Review 56 Supplement 1: 5-23.
69

CHAPTER FIVE
satisfaction with the health care system22. On the other hand other evidence23 of people’s reluctance to change established arrangements has been found in other health care systems where choice has recently been introduced.
Patients regard continuity of care, that is, seeing the same health care professionals regularly, as desirable but not if it results in delays of more than two days in seeing the preferred health professionals24. Hence, there will often be a basic tension between proactive choice based on either information or trial and error and continuity of care. Attempts to adjust or restrict the range of choices people can make in selecting a health care professional are generally resisted by patients. When they have been asked to consider the trade offs necessary for them to accept choice restrictions, they indicate a preparedness to trade off choice for quality improvements but at such a high level that the trade-offs become prohibitively expensive and unrealisable25.
Evidence26,27 about the information that people want to help them choose a primary
care physician suggests the importance of the following in the US health care system where high levels of choice are typical: Availability: • contact details (address, phone); • services offered; • hours of service; • after hours care; and • valuing patient opinion. Professional standing and qualifications: • reputation; • experience/record; • training and qualifications; and • memberships of professional organisations. Payment: • method of payment; and • fees (if applicable).
22 Resnik J (2001) Determinants of customer satisfaction with the health care system, with the possibility to choose a personal physician and with a family doctor in a transition country. Health Policy 57 (2): 155-64. 23 Salisbury CJ (1989) How do people choose their doctor? BMJ 299: 608-10. 24 Freeman GK & Richards SC (1993) Is personal continuity of care compatible with free choice of doctor? Patients’ views on seeing the same doctor. British Journal of General Practice 43: 493-97. 25 Harris KM (2002) Can high quality overcome consumer resistance to restricted health professionals access? Evidence from a health plan choice experiment. Health Services Research 37 (3): 551-71. 26 For example, Butler DD & Abernathy AM (1996) Yellow pages advertising by physicians: Are doctors providing the information consumer want most? Journal of Health Care Marketing 16 (1): 45-50. 27 McGlone TA, Butler ES & McGlone VL (2002) Factors influencing consumers’ selection of a primary care physician. Health Marketing Quarterly 18 (3): 21-37.
70

CHAPTER FIVE
Essentially this type of information lets people know what they can expect from a primary care service as input to making choices about which services and which health care professionals they wish to consult.
5.5 Developing policy responses Policy options in the choice domain for increasing the informed capacity of patients,
their carers and families to choose aspects of their health care fall into two main categories. Firstly, there are those concerned with increasing access people have to health services in an objective sense. In the second category there are policy options directed at increasing the extent to which people are aware of the set of available choices and have available to them adequate and appropriate information to boost and harness their motivation to take advantage of these opportunities.
Making choices requires alternatives from which patients can choose. Therefore, there needs to be sufficient expenditure on the supply and distribution of health care professionals and health services to make choice possible. For some countries this may require increased expenditure, for others a redistribution of existing resources. Sub-national analysis can assist decision-makers to identify jurisdictions and/or population subgroups where choice is most limited and a priority for action. Policy examples for increasing access and choice but maintaining affordability for local people include:
• increasing professional training places for health care professionals, especially for those
committing themselves to future practice in under-serviced areas; • introducing incentives for professionals to practise in these areas, such as higher rebates
for services (in relevant countries) and special entitlements for relocation, respite arrangements and hardship posting allowances, including tax breaks;
• subsidising service costs in the most under-serviced areas; and • involving people at the local level to build ownership of the issue through analysing
service shortages, planning to address them and playing a role in implementing plans.
Technology can make an important contribution to addressing the information asymmetry between health professionals and patients. Information can be delivered to people via a range of technologies from printed documents to video clips to the Internet. Web based approaches have been promoted as the best option in developed countries for altering the information asymmetry and empowering patients28.
Information about performance greatly assists making choices. At the national or sub-national level health ministries can remove administrative obstacles to patients’ receiving service information to the degree that they wish. Health ministries can also minimise
28 Hertzberg J (2002) The linchpin of patient choice, defined contribution and patient empowerment. Managed Care Interface 15 (10): 48-49.
71

CHAPTER FIVE
obstacles and encourage the release of information on how well health care services are operating:
• national or sub-national reports, such as one on health system responsiveness, can
inform patients about the system as a whole and suggest criteria useful in making choices about health care; and
• reports about specific health services such as hospitals and health centres allow patients to make informed choices about the quality of care they can expect to receive and/or demand to see improved.
Patients need information about services as well as information about performance: • health services can provide their patients, carers and families with a pamphlet describing
the service and the doctors and other health care professionals who work there, possibly using the approach of Butler and Abernathy29 as a starting point; and
• changes should be made to address local needs.
5.6 Putting policy into practice 5.6.1 Features of good practice
Policy should be put into practice through well-targeted and evidence-based programs.
Four key features of sound programs are that they are appropriate to the context, affordable, effective and sustainable.
• Appropriate
Programs need to be in sympathy with the context. From a patient perspective, for example, easy access to a cancer diagnostic test as well as rapid availability of the test results is important from a psychological perspective. While new technology is increasingly a feature of cancer diagnosis, it may be irrelevant to patients without swift access. Therefore, an appropriate policy and practice response in this example needs to address the prompt attention domain to be appropriate.
Another aspect of appropriateness is that there is a capacity within the health system
to implement the proposed action. Capacity may include human resources, financial resources, how services are organised, acceptability to health care professionals and services and patients. This does not imply that proposed policy and practice should be comfortable and unchallenging for everybody. Rather it means that proposed action should not be incompatible with the country or regional health, social, political and economic context. Sometimes services continue to operate in the way that they do just because that is the way they have always been organised even if there is evidence that it is counter productive.
29 Op cit.
72

CHAPTER FIVE
• Affordable Proposed actions must be cost effective. It is hard to convince policy makers to
support actions that will increase implementation costs without clear evidence of compensating savings being made elsewhere. There are exceptions, of course, such as strategies to deal with new communicable diseases. In addition, costs have to be compatible with budgetary constraints.
• Effective
The review of evidence-based interventions should provide support for the effectiveness of what is proposed. The notion of being effective incorporates the proposed actions being measurable so that effectiveness (or the lack of it) can be established. This means that not only are objectives important but so are clear statements of outcomes against which actions can be monitored and evaluated
. • Sustainable
Finally, proposed actions must be sustainable so that they become part of the mainstream.
5.6.2 Processes for improving policy and practice
The policy development and implementation process should be a cooperative one in which stakeholders have a voice. Participation breeds a sense of ownership and the greater the ownership, the more likely it is that changes will be successfully implemented.
At the level at which policy is to be implemented it is recommended that a policy and practice steering group is established. The steering group will need clear terms of reference and a timeframe (including a sunset clause). It needs to be accountable. Its membership should include those with access to resources as well as those at the service interface. Tasks for the steering group will include:
• consulting with people who are important to the change process; • establishing leadership for the change process; • defining the objectives of the policy and the changed practice and the intended outcomes; • developing methods and tools to allow health services to improve their responsiveness in
the desired direction; • developing ways to monitor and evaluate implementation; and • developing reporting and feedback mechanisms.
5.7 Monitoring and evaluation Good practice requires that procedures for monitoring and evaluating policy and
practice should be incorporated and costed into the policy process from the start. If we monitor and evaluate policies and programs only in terms of the outcomes and objectives that were established before the program started, we may not be measuring what
73

CHAPTER FIVE
has actually been happening. When policies are put into practice, there are many modifications to the 'real world' of health services. Some are substantial and obvious, others can be subtle, easily undetected but nonetheless entail a shift in outcomes and objectives. In other words, outcomes change as policies are implemented30. We want to measure real events and phenomena not those that were proposed but never quite happened.
30 Ovretveit J (1999) Evaluating health interventions: Introduction to evaluation of health treatments, services, policies and organizational interventions. Buckingham UK; Open University Press.
74

APPENDIX 1
AAppppeennddiixx 11:: TThhee MMCCSSSS oonn HHeeaalltthh aanndd HHeeaalltthh SSyysstteemm RReessppoonnssiivveenneessss ((22000000--
22000011)) BBaacckkggrroouunndd31
WHO launched the Multi-country Survey Study on Health and Health System's
Responsiveness (MCSS) in 2000–2001 in order to develop various methods of comparable data collection on health and health system responsiveness. This study has used a common survey instrument in nationally representative populations with modular structure for assessing health of individuals in various domains, health system responsiveness, household health care expenditures and additional modules in other areas such as adult mortality and health state valuations.
WHO contracted out the surveys to two types of survey operators: multi-country survey and single country survey operators. The multi-country survey operators were international commercial survey companies INRA and GALLUP. Independent survey operators covered a single country each and were from universities, private commercial survey companies, governmental central statistical offices and government health departments.
A1.1 Goals of the MCSS The MCSS was launched in order to develop instruments that would allow the
measurement of health, responsiveness and other health-related parameters in a comparable manner and would provide useful information to refine this methodology. The Study focused on the way populations report their health and value different health states, the reported responsiveness of health systems and the modes and extent of payment for health encounters through a nationally representative general population-based survey.
The first goal was the assessment of health in different domains using self-reports by people in the general population. The survey also included vignettes and some measured tests on selected domains, intended to calibrate the way respondents categorized their own health. This part of the survey allowed for direct comparisons of the health of different populations across countries. A related objective of the MCSS was to measure the value that individuals assign to descriptions of health states and to test if these varied across settings.
31 More detailed description available in book Health System Performance Assessment. Debates, Methods and Empiricism; Christopher JL Murray and David B Evans (eds), in chapter WHO Multi-country Survey Study on Health and Responsiveness 2000-2001, Bedirhan Ustun, T. et al., 2003, WHO, Geneva
75

APPENDIX 1
The second goal of the MCSS was to test instruments to measure the responsiveness of health systems. The concept of responsiveness is different from people’s satisfaction with the care they receive, examines what actually happens when the system comes in contact with an individual. For that purpose 8 responsiveness domains were identified. They can be grouped into two major categories:
• respect for persons (consists of domains dignity, confidentiality, clear
communication and autonomy) • client orientation (consists of domains prompt attention, quality basic amenities,
access to social support networks and the choice of health care provider).
A1.2 Modes used in the MCSS The study was implemented in 61 countries completing 71 surveys. Two different
questionnaire modes were intentionally used for comparison purposes in 10 countries. This has allowed the data from the different modes to be compared in order to estimate the effect of the mode of the survey. Surveys were conducted in different modes: in-person household interviews in 14 countries, brief face-to-face interviews in 27 countries, computerized telephone interviews in 2 countries and postal surveys in 28 countries. A1.2.1 Household Long Face-to-Face Questionnaire Interviews
Interviews for the household survey were conducted face-to-face using paper and
pencil questionnaires. In each household a single adult individual (> 18 years) was selected by a random process (i.e. Kish Table) after completing a full household roster. The survey protocol specified that all interviews should be conducted in privacy. Completing the questionnaire took approximately 90 minutes. A1.2.2 Household Brief Face-to-Face Questionnaire Interviews
In view of the costs of carrying out a full face-to-face interview and the need to carry
out the survey in as many countries as possible, a briefer version of the questionnaire was carried out in a face-to-face interview in several countries (completing the questionnaire took approximately 60 minutes). This version too focused on all domains of health and responsiveness. A1.2.3 Brief Computer Assisted Telephone Interview (CATI) Questionnaire Interviews
In two countries where telephone coverage is extensive, the brief survey described
above was administered using this format. The telephone interviews use computer technology to automatically sequence and branch questions, which eliminates interviewer error in failing to ask questions. They can achieve a better sampling coverage because of the known sampling frame and random digit dialing. Completing that questionnaire took approximately 30 minutes.
76

APPENDIX 1
77
A1.2.4 Brief Postal/Drop - off Questionnaire Interviews Since it is relatively inexpensive to carry out a postal survey in countries where literacy
levels are high and the reach of the postal system is good, the brief survey questionnaire was used in a mail format in many countries. In two countries (Turkey and Egypt), the survey was hand-couriered to the respondents and collected back from them. Completing the questionnaire took approximately 30 minutes.
A1.3 Development of Responsiveness module
WHO is offering you the Health Systems Responsiveness Analytical Guidelines that analyse the data from the 2001 WHO MCSS Responsiveness Module, thus the next paragraph would deal only with the development of responsiveness module and not the whole MCSS instrument. Nevertheless, responsiveness of the health systems to the legitimate expectations of populations is recognized as an important element of health systems performance. To operationalize this concept and measure it meaningfully in different settings, a survey instrument was developed and tested prior to launch of the MCSS in 2000-2001. In 1999 WHO conducted the first country pilot household surveys in Tanzania, Colombia and the Philippines in face-to-face mode, where 6 responsiveness domains were included (dignity, autonomy, confidentiality, prompt attention, quality basic amenities and the choice of health care provider). As part of the development of the existing questionnaire, a key informant survey was run initially in 35 countries (launched in 1999) and focused on 7 elements of responsiveness (dignity, autonomy, confidentiality, prompt attention, access to social support networks, quality basic amenities and the choice of health care provider). The questionnaire was administered in face-to-face, telephone and self - administered mode. Based on prior experience and in consultation with several international experts, a new questionnaire was developed and launched in 2000 as the multi-country pilot household questionnaire on health and health system's responsiveness. The second face-to-face household survey pilot was implemented in 8 countries (China, Colombia, Egypt, Georgia, India, Nigeria, Slovakia and Turkey) and included all 8 responsiveness domains (dignity, autonomy, confidentiality, clear communication, prompt attention, access to social support networks, quality basic amenities and the choice of health care provider). The final responsiveness module resulting from all those different testing phases was launched in 2000-2001 as a part of MCSS instrument in 60 countries, completing 70 surveys in different modes (in total 13 household surveys32, 27 brief face-to-face surveys, 28 postal surveys and 2 telephone surveys). See Table 1.1 for more details.
32 Survey for Singapore did not contain the Responsiveness module

APPENDIX 1
Table A1.1 Comparing responsiveness questionnaire "modules" and surveys
Surveys Module Characteristics
1 (1999): 3 country household health survey
2 (1999): key informant survey for the 2000 World Health Report
3 (2000): 8 country household survey -(multi-country study pilot) on health and health system responsiveness
4 (2000): key informant survey on health and health system responsiveness
5 (2000-2001): WHO Multi-country Survey Study on Health and Health System Responsiveness
No. of countries/surveys
3 countries/3 surveys 35 countries /35 surveys 8 countries /8 surveys 41 countries/41 surveys 60 countries /70 surveys (71 countries including Singapore but Singapore excluded the responsiveness module)
No. of respondents
150 per country
24- 72 per country totalling 1,791
59-152 per survey totalling 811
Minimum of 70 respondents per ctotalling 17,200
348- 9,952 per survey totalling 14
Survey mode and sampling
Face-to-face household survey; Kish tables selection of household respondent; convenience samples; respondents over 18 years old
A mixture of face-to-face, telephone and self-administered modes. Respondents were selected using qualitative methods (snow-balling), on the basis of their knowledge about the health system. An attempt was made to have equal representation from females and males, and from the public and private sectors
Face-to-face household survey; Kish tables used for selection of household respondent in some cases; in other cases, whoever was home and would answer the questionnaire. Convenience sample of respondents from sampling frame to be used for main survey. Sites purposively selected respondents to get an even distribution across different population sub-groups: urban/ rural, sex, high and low education, age groups.
Snow-balling technique used in qualitative survey designs. WHO country representatives asked to distribute the questionnaire. Distribution from a WHO public website was also used and identified with a separate code.
Face-to-face, telephone, and postal/drop-and-collect household surveys; extended and brief versions of the module; used in long and brief questionnaires Kish tables or “last birthday” methods most commonly used for selection of respondents from within households. Sampling designs: generally stratified, multi-stage random sampling for face-to-face surveys – see details below.
Translation and testing
Translated into 1 official language per country. Key word translation and back-translation. Cognitive
Translated into 1 official language per country. Translated questionnaires were checked by WHO. Focal persons ran the surveys in each country.
Translated into 1 official language per country according to the WHO Translation Guidelines. Translations and back-translations of key terms checked by WHO.
Translation organized by the local WHO representative (WR) into 1 official language per country. WR office checked translation and administered the
Revised questions were translated into at least 1 official language per country according to the WHO Translation Guidelines. Translations and
78

APPENDIX 1
debriefing of 5-10 people at WHO headquarters was performed before finalization of the questionnaire.
They were selected based on previous experience in health systems research and identified by surveying the literature on patient satisfaction, through web sites on health care quality, and with the help of WHO headquarters and regional office staff. A meeting of all survey focal points was convened to discuss the interpretation of the results.
Cognitive interviews (delayed retrospective probing) were conducted in 7 sites (China, Egypt, Georgia, India, Nigeria, Slovakia,) with poor completion in 1 site (Indonesia, only 5 interviews). The remaining 6 sites interviewed 20-33 respondents per site. After the pilot phase, unclear questions and translation problems were revised and more suitable terms were substituted.
survey. Official WHO translations provided for 6 official languages. Key terms back-translated and checked. Testing in a convenience sample of 40 staff at the WHO headquarters and regional offices, as well as several survey experts used as consultants to WHO.
back-translations of key terms checked by the national expert group. Test-retests for 10 countries: 2854 (58-686) ambulatory care interviews; 183 (0-56) home care interviews; 457 (6-82) inpatient interviews.
Q by Q No No Yes No Yes Domains of patient experience (labels in questionnaire order – for item handles, see below)
6: dignity (one of questions linked to communication as defined later), autonomy, choice, confidentiality, prompt attention, quality basic amenities
7: dignity, autonomy, confidentiality, prompt attention, access to social support, quality basic amenities, choice
8: dignity, autonomy, confidentiality, communication, prompt attention, access to social support, quality basic amenities, choice
8: dignity, autonomy, confidentiality, communication, prompt attention, access to social support, quality basic amenities, choice
8: dignity, autonomy, confidentiality, communication, prompt attention, access to social support, quality basic amenities, choice
Module Introduction
Ambulatory care: "Now I would like to ask you some questions about where you go for health care. First, I will ask you about places you visit for care, but where you do not stay overnight."
Whole questionnaire: “This questionnaire is trying to find out what you think about the non-medical aspects of the health system in your country as a whole. The health system includes any aspect of health related activity in public and private, organised and traditional sectors and
Whole module: "Now I would like to ask you some questions about where you go for health care. First, I will ask you about places you go for health care, where you do not stay overnight to receive care. I will also ask you about the doctors or other health care providers you see there. I will also ask you about health care you receive in your home." Ambulatory: Please tell me the
Key informant evaluates the health system: This section asks you about different aspects of responsiveness of the health system you are most familiar with. We would like you to think about what you know about the responsiveness of the whole health system, and not just your own personal experiences. Please try to answer all questions for both the public and private
Whole module: These questions are about your experiences in getting health care in the last 12 months. This may be from a doctor’s consulting room, a clinic, a hospital or a health care provider may have visited you at home. Ambulatory: no specific introduction, flows from questions about last visit to
79

APPENDIX 1
involves the entire population in your country.”
name of the place or person you visit most often for health care. This may be a clinic, hospital or a person you go to for care. The person may be a medical doctor, nurse, pharmacist or person who practices traditional medicine. We need this information to follow up with the health care provider to find out more about their facility and services. You will not be identified to the provider in any way. Inpatient: “Now I would like to ask you some questions about getting health care from a place where you stay over night, which in most cases are hospitals. “
health sectors. ambulatory care setting Home care: Now for all the following questions on health care you receive at home, I would like you to think about all the health care providers who visited you at home over the last 12 months. Inpatient: Now I would like to ask you some questions about getting health care from a place where you stay over night, which in most cases are hospitals.
Responsiveness descriptions/ responsiveness valuations (importance) / responsiveness expectations
Responsiveness descriptions only
Responsiveness descriptions, and valuations (importance)
Responsiveness descriptions, valuations and expectations (measured with vignettes)
Responsiveness descriptions, valuations and expectations (measured with vignettes)
Responsiveness descriptions, valuations and expectations (measured with vignettes)
Type of health services covered: ambulatory, inpatient, home care, other; (recall)
Mostly ambulatory care; 1 question on inpatient care about food (recall of 6 months)
No distinction in questions between inpatient and ambulatory care (recall of 6 months)
Ambulatory care, home care, inpatient care, and the “whole health system” – all dealt with separately (recall: ambulatory care: 6 months; inpatient: 12 months; whole health system: 12 months)
Descriptions of the key informants own experiences (as in the MCSS long questionnaire) and their opinions of the health system for public and private health sectors (no recall – asked to evaluate “now” based on their knowledge)
Ambulatory care, home care, inpatient care, and the “whole health system” (discrimination and financial barriers to care) (recall: 12 months)
Responsiveness descriptions:
6 questions with a “never”, "sometimes", "usually", “always”
19 questions with 4 point “never” to “always” Likert response scale; 7 questions
Questions with responses measured in units of time: 4 (ambulatory), 1 (home care), 1
On the health system, the questions pertaining to each domain were rotated through 4
Questions with responses measured in units of time: 2 (ambulatory care – 1
80

APPENDIX 1
81
number of questions and response options
Likert response scale; 6 questions with a "very good", "good", "poor", "very poor" scale; 6 questions with a "strongly agree", "agree", "disagree", "strongly disagree" scale
with 5 point “very poor” to “very good”; 2 with 5 point “less than 25%”- “above 75%”; 8 summary questions with a 0 to 10 scale ( 1 per domain and 1 overall health system), with 0 being the poorest score and 10 being the best
(inpatient); questions with "never" to "always" responses: 12 (ambulatory), 9 (home care) and 2 (whole health system); rating from 0-10: 8 (ambulatory), 7 (home care), 3 inpatient, 3 whole health system; "yes"-"no" questions 2 (ambulatory), 1 (inpatient); "not a problem", "somewhat of a problem", "quite a problem" responses: 2 (ambulatory), 1 (home care), 2 (hospital); "very poor", "poor", "good", "very good": 2 (ambulatory), 3 (inpatient)
sets, with 2 domains per set (i.e. 25 percent of sample responded to each set). Response options distinguished between the public and private sectors. Set A: communication and dignity (7 “never”-“always”, 4 “very bad”-“very good”). Set B: confidentiality and quality basic amenities (2“never”-“always”, 4 “very bad”-“very good”). Set C: social support and choice (7 “never”-“always”, 2“very bad”-“very good”). Set D: prompt attention and autonomy 7 “never”-“always”, 2 “very bad”-“very good”).
categorical, 1 continuous) 2 (home care*); questions with "never" to "always" responses: 11 (ambulatory), 13 (home*); questions with “no problem”, “mild problem”, “moderate problem”, severe problem”, “extreme problem”: 2 (ambulatory), 2 (home*), 2 (inpatient); questions with “very bad”, “bad”, “moderate”, “good”, “very good”: 9 (ambulatory), 6 (home*), 8 (inpatient); "yes"-"no" questions:1 (inpatient) *home care questions in long version (13 countries)
Responsiveness valuations (importance): question and response options
Rank 5 domains by importance (excluding choice) Rate each of 5 domains from 0 to 10 (most important)
Rate the importance of 7 domains between 0 and 10: 0 means not at all important and 10 means extremely important. Domains defined by almost identical items as in patient experience section.
Ranking of all 8 domains from most important to least important (ties permitted)
Ranking of all 8 domains from most important to least important (ties permitted); Ranking of 2 domain groupings: respect of persons(dignity, autonomy, confidentiality, communication,) and client orientation (prompt attention, choice, social supports, quality basic amenities)
Asked to say which is the most and least important domain (ties permitted).
Responsiveness expectations: questions and response options
None
None None 7 questions per domain. 2 domains per set, 4 sets rotated across the sample (i.e. 25 percent of sample responded to each set). Response options: “very bad”- “very good”
7 questions per domain. 2 domains sets of 7 rotated across the sample (i.e. 25 percent of sample responded to each set). Response options: “very bad” to “very good”

APPENDIX 1
A1.4 Responsiveness Module Content Within the responsiveness module of the MCSS, subjects were asked if they had had an
ambulatory care, home care or hospital inpatient contact with the health system. They had to name the last place of care they went to and to identify whether this was their usual place of care. They were then asked to rate their experiences over the past 12 months and about their utilization of health services over the last 30 days. The household long questionnaire included questions on the main reason for the last visit to the health care professional and which services were provided. The responsiveness module also gathered answers whether respondents were unfairly treated because of their background or social status. The questions on responsiveness covered eight domains mentioned earlier, all relevant to hospital inpatient visits, but only seven used for ambulatory visits. Only hospital inpatient care respondents were asked questions pertaining to the domain of access to social support networks. Respondents were asked to rank the responsiveness domains of the relative importance. All questionnaires on responsiveness included vignettes, i.e. descriptions of hypothetical scenarios which respondents are asked to rate using the same rating scale as in the responsiveness questions.
A1.5 Two types of Responsiveness Modules The MCSS responsiveness module is presented in two forms, in a short form and an
extended form. Both form of the responsiveness module shared 3 common responsiveness sections: health care experience description, responsiveness importance valuation and heath service expectations calibration (scenarios/vignettes) and covered all 8 domains of responsiveness. The extended form of the responsiveness module covered additional questions (on discrimination, reasons for using health services and descriptions of health service responsiveness in home care). The extended form of the responsiveness module, known as the “long questionnaire”, was included in a questionnaire that also covered other modules (including health state valuations, adult mortality, mental health, chronic health conditions, environmental factors and financing). The short form of the responsiveness module was used in either a 30 minute or a 60 minute questionnaire. The 30 minute questionnaire included 2 health state description questions and a socio-demographic module, in addition to the responsiveness module. The 60 minute questionnaire included responsiveness and health modules, in addition to the socio-demographic module. International survey company INRA was the only contractor to conduct the 60 minute questionnaire; GALLUP and the independent survey operators used the 30 minute health and responsiveness questionnaires in any one, or more, of three modes: face-to-face, telephone, self-administered postal or self-administered “drop-off” modes (interviewers dropped off the questionnaire at the respondent’s home and picked it up a few days later).
82

APPENDIX 1
A1.6 Conclusion The MCSS attempts to deal with the shortcomings in existing methods and to arrive at
common instrument modules and techniques suited to multiple user needs to measure health system performance outcomes. The data from the surveys can be fed into composite measures such as healthy life expectancy and improve the empirical data input for health information systems around the world. Data from the surveys are also useful to improve the measurement of the responsiveness of health systems to the legitimate expectations of the population. The survey also tested novel techniques to control the reporting bias between different groups of people in various cultures or demographic groups so as to produce comparable estimates across populations.
83

APPENDIX 2
AAppppeennddiixx 22:: RReessppoonnssiivveenneessss MMoodduullee aanndd RReellaatteedd QQuueessttiioonnss
Table A2.1 Mapping of questions common to the long and brief forms of responsiveness modules
LONG MODULE BRIEF MODULE, SELF-ADMINISTERED
Ques. No.
Question Ques. No.
Question Short item (question)
description
BASIC DESCRIPTORS
Q1000 Record sex as observed TO INTERVIEWER 53 Are you female or male? sex
Q1001 How old are you? 52 How old are you? age
Q1007
How many years of school, including higher education, have you completed?
56 What is the highest grade or level of schooling /education that you have completed?
education (yrs)
Q1101
If you don’t know or don’t want to tell me the amount, would you please tell me the income range if I read some options to you? (to substitute 20, 40, 60, 80% of average national income distribution)
Which income bracket does your household fall into (net income): (Country to fill in relevant ranges before survey)
income quintile
Q1101A within top 20 % (1 =yes) I Q1101B within top 40 % (1 =yes) II Q1101C within top 60 % (1 =yes) III Q1101D within top 80 % (1 =yes) IV
V don't know
HEALTH
Q2000 In general, would you rate your health today? 1 In general, how would you rate your health
today? rating of health today
UTILIZATION
These questions are about your experiences in getting health care in the last 12 months. This may be from a doctor’s consulting room, a clinic, a hospital or a health care provider may have visited you at home.
84

APPENDIX 2
Q6000 Have you received any health care in the last 12 months?
3
Have you received any health care in the last 12 months? (Including visits to local doctors and alternative health care providers for any minor reason, any stays in hospitals. If you are a doctor, exclude treating yourself).
visit in last 12 months
Q6001
In the last 12 months, did you get any health care at an outpatient health facility or did a health care provider visit you at home? An outpatient health facility is a doctor's consulting room, a clinic or hospital outpatient unit - any place outside your home where you did not stay overnight.
4
In the last 12 months, did you get any health care at an outpatient health facility or did a health care provider visit you at home? (An outpatient health facility is a doctor's consulting room, a clinic or a hospital outpatient unit - any place outside your home where you did not stay overnight.)
ambulatory visit
Q6002
In the last 12 months, did you get most of your health care at a health facility or most of it from a health provider who visited you in your home?
5
In the last 12 months, did you get most of your health care at a health facility or most from a health provider who visited you in your home?
at facility or at home
Q6003 When was your last visit to a health facility or provider? Was it…
6 When was your last (most recent) visit to a health facility or provider? Was it.. time of last visit
Q6004 What was the name of the health facility or provider?
7
What was the name of the health care facility? (Please fill in the name of facility, e.g., Oxford Clinic. Only fill in the name of the provider if the facility does not have another name.)
name of place of care
Q6005 Was (name of provider) your usual place of care? 8
Was the place you described in Question 7 your usual place of care (if you have a usual place of care for the problem for which you presented)?
was it your usual place of care
Q6500-Q6510
I will read you a list of different types of places you can get health services. Please can you indicate the number of times you went to each of them in the last 30 days.
58
There are different types of places you can get health services listed below. Please can you indicate the number of times you went to each of them in the last 30 days for your personal medical care.
utilization of health services in the last 30 days
85
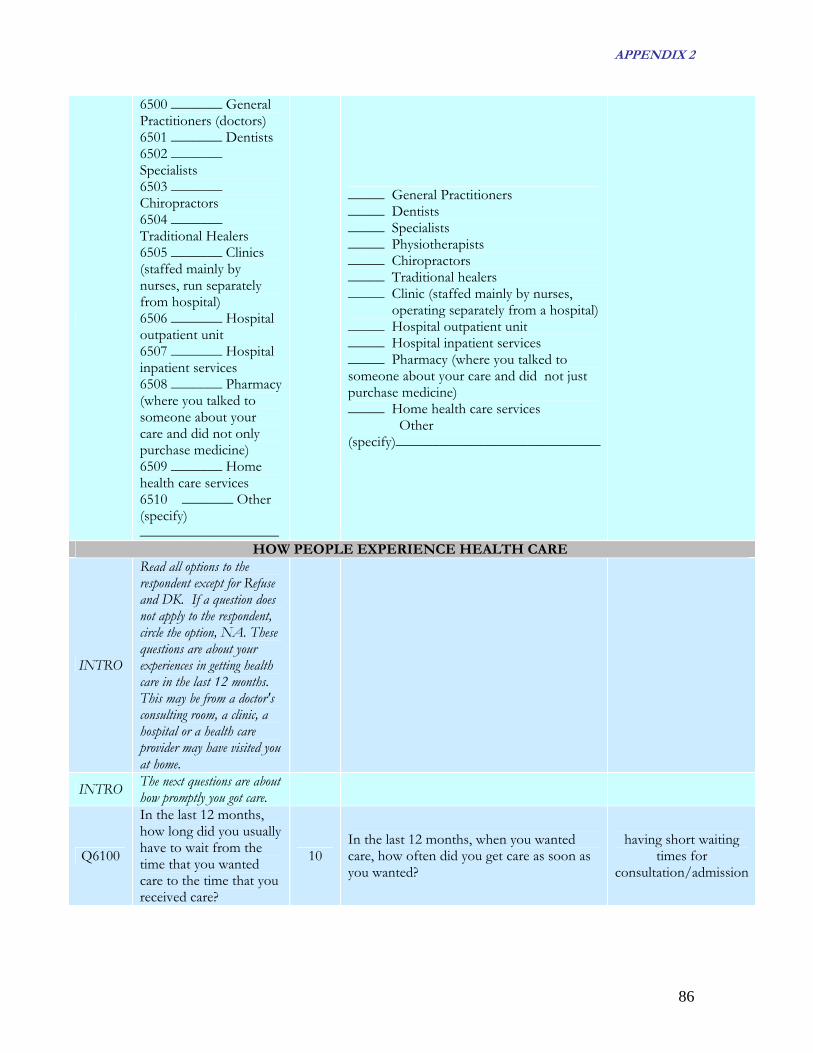
APPENDIX 2
6500 _______ General Practitioners (doctors) 6501 _______ Dentists 6502 _______ Specialists 6503 _______ Chiropractors 6504 _______ Traditional Healers 6505 _______ Clinics (staffed mainly by nurses, run separately from hospital) 6506 _______ Hospital outpatient unit 6507 _______ Hospital inpatient services 6508 _______ Pharmacy (where you talked to someone about your care and did not only purchase medicine) 6509 _______ Home health care services 6510 _______ Other (specify) ___________________
_____ General Practitioners _____ Dentists _____ Specialists _____ Physiotherapists _____ Chiropractors _____ Traditional healers _____ Clinic (staffed mainly by nurses, operating separately from a hospital) _____ Hospital outpatient unit _____ Hospital inpatient services _____ Pharmacy (where you talked to someone about your care and did not just purchase medicine) _____ Home health care services Other (specify)____________________________
HOW PEOPLE EXPERIENCE HEALTH CARE
INTRO
Read all options to the respondent except for Refuse and DK. If a question does not apply to the respondent, circle the option, NA. These questions are about your experiences in getting health care in the last 12 months. This may be from a doctor's consulting room, a clinic, a hospital or a health care provider may have visited you at home.
INTRO The next questions are about how promptly you got care.
Q6100
In the last 12 months, how long did you usually have to wait from the time that you wanted care to the time that you received care?
10 In the last 12 months, when you wanted care, how often did you get care as soon as you wanted?
having short waiting times for
consultation/admission
86

APPENDIX 2
Q6101
In the last 12 months, when you wanted care, how often did you get care as soon as you wanted?
9
In the last 12 months, how long did you usually have to wait from the time that you wanted care to the time that you received care? (Fill in the applicable time in one of the spaces below).
getting care as soon as you wanted
Q6102
In the last 12 months, have you needed any laboratory tests or examinations? Some examples of tests or special examinations are blood tests, scans or X-rays
11
In the last 12 months, have you needed any laboratory tests or examinations? Some examples of these tests or special examinations are blood tests, scans or X-rays.
laboratory test or examination
Q6103
Generally, how long did you have to wait before you could get the laboratory tests or examinations done?
12 Generally, how long did you have to wait before you could get the laboratory tests or examinations done?
having short waiting times for having tests
done
Q6104
Now, overall, how would you rate your experience of getting prompt attention at the health services in the last 12 months? Prompt attention means..
13 Now, overall, how would you rate your experience of getting prompt attention at the health services in the last 12 months?
rate getting prompt attention
INTRO The next questions are about the dignity with which you were treated at [].
Q6110
In the last 12 months, when you sought care, how often did doctors, nurses or other health care providers treat you with respect?
14
In the last 12 months, when you sought health care, how often did doctors, nurses or other health care providers treat you with respect?
being shown respect
Q6111
In the last 12 months, when you sought care, how often did the office staff, such as receptionists or clerks there, treat you with respect?
15 In the last 12 months, how often did the office staff, such as receptionists or clerks there, treat you with respect?
being shown respect
Q6112
In the last 12 months, how often were your physical examinations and treatments done in a way that your privacy was respected?
16 In the last 12 months, how often were your physical examinations and treatments done in a way that your privacy was respected?
having physical examinations
conducted in privacy
Q6113
Now, overall, how would you rate your experience of getting treated with dignity at
17 Now, overall, how would you rate your experience of being treated with dignity at the health services in the last 12 months?
rate being treated with dignity
87

APPENDIX 2
the health services in the last 12 months? Dignity means..
INTRO
The next questions are about how health care providers communicated with you when you sought health care.
Q6120
In the last 12 months, how often did doctors, nurses or other health care providers listen carefully to you?
18 In the last 12 months, how often did doctors, nurses or other health care providers listen carefully to you?
having health care providers listen to you
carefully
q6121
In the last 12 months, how often did doctors, nurses or other health care providers there, explain things in a way you could understand?
19
In the last 12 months, how often did doctors, nurses or other health care providers, explain things in a way you could understand?
having health care providers explain things so you can
understand
Q6122
In the last 6 months, how often did doctors, nurses or other health care providers give you time to ask questions about your health problem or treatment?
20
In the last 12 months, how often did doctors, nurses or other health care providers give you time to ask questions about your health problem or treatment?
giving patients and family time to ask
health care providers questions
Q6123
Now, overall, how would you rate your experience of how well health care providers communicated with you in the last 12 months? Communication means..
21
Now, overall, how would you rate your experience of how well health care providers communicated with you in the last 12 months?
rate having clear communication
INTRO
As part of your care, decisions are made about which treatment or tests to give. The next questions are about your involvement in decisions about the care and treatment you received in the last 12 months.
Q6130
In the last 12 months, when you went for care, were any decisions made about your care, treatment (drugs for example) or tests?
22
In the last 12 months, when you went for health care, were any decisions made about your care, treatment (giving you drugs, for example) or tests?
were decisions made about your care
Q6131
In the last 12 months, how often did doctors, nurses or other health care providers there involve you as much as you wanted to be in
23
In the last 12 months, how often did doctors, nurses or other health care providers involve you as much as you wanted to be in deciding about the care, treatment or tests?
being involved in deciding on your care
or treatment if you want
88

APPENDIX 2
deciding about the care, treatment or tests?
Q6132
In the last 12 months, how often did doctors, nurses or other health care providers there ask your permission before starting tests or treatment?
24
In the last 12 months, how often did doctors, nurses or other health care providers ask you permission before starting the treatment or tests?
having providers ask your permission before
starting treatment or tests
Q6133
Now, overall, how would you rate your experience of getting involved in making decisions about your care or treatment as much as you wanted in the last 12 months? Being involved in decision making means..
25
Now, overall, how would you rate your experience of getting involved in making decisions about your care or treatment as much as you wanted in the last 12 months?
rate getting involved in making decisions as much as you want
INTRO
The next questions are about your experience of confidentiality of information in the health services.
Q6140
In the last 12 months, how often were talks with your doctor, nurse or other health care provider done privately so other people who you did not want to hear could not overhear what was said?
26
In the last 12 months, how often were talks with your doctor, nurse or other health care provider done privately so other people who you did not want to hear could not overhear what was said?
having conversations with health care
providers where other people cannot overhear
Q6141
In the last 12 months, how often did your doctor, nurse or other health care provider keep your personal information confidential? This means that anyone whom you did not want informed could not find out about your medical conditions.
27
In the last 12 months, how often did your doctor, nurse or other health care provider keep your personal information confidential? This means that anyone whom you did not want informed could not find out about your medical conditions.
having your medical history kept confidential
Q6142
Now, overall, how would you rate your experience of the way the health services kept information about you
28
Now, overall, how would you rate your experience of the way the health services kept information about you confidential in the last 12 months?
rate keeping personal information confidential
89

APPENDIX 2
confidential in the last 12 months? Confidentiality means..
INTRO The next questions are about the choice of health care providers you have.
Q6150
In the last 12 months, with the doctors, nurses and other health care providers available to you how big a problem, if any, was it to get to a health care provider you were happy with?
29
Over the last 12 months, with the doctors, nurses and other health care providers available to you how big a problem if any, was it to get a health care provider you were happy with?
being able to get a specific health person to provide your care
Q6151
Over the last 12 months, how bit a problem if any was it to get to use other health care services other than the one you usually went to.
30
Over the last 12 months, how big a problem, if any, was it to get to use other health services other than the one you usually went to?
being able to choose your place of care
Q6152
Now, overall, how would you rate your experience of being able to use a health care provider or service of your choice over the last 12 months? Choice means..
31
Now, overall, how would you rate your experience of being able to use a health care provider or service of your choice over the last 12 months?
rate being able to use health care provider of
your choice
INTRO
The next questions are about the environment or the surroundings at the places you go to for health care.
Q6160
Thinking about out the places you visited for health care in the last 12 months, how would you rate the basic quality of the waiting room, for example, space, seating and fresh air.
32
Thinking about the places you visited for health care in the last 12 months, how would you rate the basic quality of the waiting room, for example, space, seating and fresh air?
having enough space, seating and fresh air in
the waiting room or wards
Q6161
Thinking about the places you visited for health care over the last 12 months, how would you rate the cleanliness of the place?
33 Thinking about the places you visited for health care over the last 12 months, how would you rate the cleanliness of the place?
having a clean facility
90

APPENDIX 2
Q6162
Now, overall, how would you rate the overall quality of the surroundings, for example, space, seating, fresh air and cleanliness of the health services you visited in the last 12 months? Quality of surroundings means..
34
Now, overall, how would you rate the quality of the surroundings, for example, space, seating, fresh air and cleanliness of the health services you visited in the last 12 months?
rate the quality of basic amenities
HOSPITAL CARE
INTRO
Now I would like to ask you some questions about getting health care from a place where you stay over night, which in most cases are hospitals.
Q6300 Have you stayed overnight in a hospital in last 12 months?
35 Have you stayed overnight in a health care centre or hospital in the last 12 months?
have you stayed overnight in the last
12 months
Q6301 What was the name of the hospital you stayed in most recently?
36 What was the name of the hospital you stayed in most recently? name of the hospital
Q6302 Did you get your hospital care as soon as you wanted?
37 Did you get your hospital care as soon as you wanted?
did you get care as soon as you wanted
Q6303
When you were in the hospital, how often did you get attention from doctors and nurses as quickly as you wanted?
38 When you were in hospital, how often did you get attention from doctors and nurses as quickly as you wanted?
how often did you get attention from doctors and nurses as quickly
as you wanted
Q6304
Now, overall, how would you rate your experience of getting prompt attention at the hospital in the last 12 months? Prompt attention means..
39 Now, overall, how would you rate your experience of getting prompt attention at the hospital in the last 12 months?
rate getting prompt attention
Q6305
Overall, how would you rate your experience of getting treated with dignity at the hospital in the last 12 months? Dignity means..
40 Overall, how would you rate your experience of being treated with dignity at the hospital in the last 12 months?
rate being treated with dignity
Q6306
Overall, how would you rate your experience of how well health care providers communicated with you during your stay in the hospital in the last 12 months? Communication means..
41
Overall, how would you rate your experience of how well health care providers communicated with you during your stay in the hospital in the last 12 months?
rate having clear communication
91

APPENDIX 2
Q6307
Overall, how would you rate your experience of getting involved in making decisions about your care or treatment as much as you wanted when you were in hospital in the last 12 months..?
42
Overall, how would you rate your experience of getting involved in making decisions about your care or treatment as much as you wanted when you were in hospital in the last 12 months?
rate getting involved in making decisions as much as you want
Q6308
Overall, how would you rate your experience of the way the hospital kept personal information about you confidential in the last 12 months=..
43
Overall, how would you rate your experience of being able to use a hospital of your choice over the last 12 months? Would you say it was…
rate keeping personal information confidential
Q6309
Overall, how would you rate your experience of being able to use a hospital of your choice over the last 12 months? Choice means..
44 Overall, how would you rate your experience of being able to use a hospital of your choice over the last 12 months?
rate being able to use health care provider of
your choice
Q6310
Overall, how would you rate the overall quality of the surroundings, for example, space, seating, fresh air, and cleanliness of the health services you visited in the last 12 months? Quality of surroundings means..
45
Overall, how would you rate the quality of the surroundings, for example, space, seating, fresh air and cleanliness of the health services you visited in the last 12 months?
rate the quality of basic amenities
Q6311
In the last 12 months, when you stayed in hospital, how big a problem, if any, was it to get the hospital to allow your family and friends to take care of your personal needs, such as bringing you your favorite food, soap etc..)?
46
In the last 12 months, when you stayed in a hospital, how big a problem, if any, was it to get the hospital to allow your family and friends to take care of your personal needs, such as bringing you your favorite food, soap etc..?
how big a problem was it to have your family
and friends to take care of personal needs
Q6312
During your stay in hospital how big a problem, if any, was it to have the hospital allow you to practice religious or traditional observances if you wanted to? Would you say it was..
47
During your stay in the hospital, how big a problem, if any, was it to have the hospital allow you to practice religious or traditional observances if you wanted to?
how big a problem was it to practice religious
observances
92

APPENDIX 2
Q6313
Now, overall, how would you rate your experience of how the hospital allowed you to interact with family, friends and to continue your social and or religious customs during your stay over the last 12 months. Social support means..
48
Now, overall, how would you rate your experience of how the hospital allowed you to interact with family, friends and to continue your social and/ or religious customs during your stay over the last 12 months?
rate experience of how the hospital allowed to
interact with family, friends and to continue social and/ or religious
customs
Q6601
In the last 12 months, did you not seek health care because you could not afford it?
50 In the last 12 months, did you ever not seek health care because you could not afford it?
not seeking health care because you could not afford it in the last 12
months
Q6400
In the last 12 months, were you treated badly by the health system or services in your country because of your. ~ ~ Nationality ~ ~ Social class ~ ~ Lack of private insurance ~ ~ Ethnicity ~ ~ Colour ~ ~ Sex ~ ~ Language ~ ~ Religion ~ ~ Political/other beliefs ~ ~ Health status ~ ~ Lack of wealth or money ~ ~ Other (specify)_____________
49
Please check with either a yes or no for each question. In the last 12 months, were you treated badly by the health system or services in your country because of your ~ ~ Nationality ~ ~ Social class ~ ~ Lack of private insurance ~ ~ Ethnicity ~ ~ Colour ~ ~ Sex ~ ~ Language ~ ~ Religion ~ ~ Political/other beliefs ~ ~ Health status ~ ~ Lack of wealth or money ~ ~ Other (specify)_____________
reason for any discrimination at the health care facility in the last 12 months
IMPORTANCE Ask the respondent to read the cards below or read the cards to the respondent if he/she would prefer. These are descriptions of some
different ways the health care services in your country show respect for people and make them the centre of care. Please write the code in the space provided.
Thinking about what is on these cards and about the whole health system, which is the most important and the least important to you?
51
Read the cards below. These provide descriptions of some different ways the health care services in your country show respect for people and make them the centre of care. Thinking about what is on these cards and about the whole health system, which is the most important and the least important to you?
ranking of importance of domains
Q6602 Most important Most important most important Q6603 Least important Least important least important
93

APPENDIX 2
RESPONSIVENESS SCENARIOS
Q6700 Q6700-6714 in each set (see questionnaires) 61 - 65 in each set a, b, c, d (see
questionnaires) vignettes
94

APPENDIX 3
AAppppeennddiixx 33:: CCoouunnttrriieess PPaarrttiicciippaattiinngg iinn tthhee MMCCSSSS
Table A3.1 Countries participating in the MCSS
Extended Form (long face-to-face) 90 minute questionnaire Responsiveness module: extended form
Short Form (brief face-to-face) 60 minute questionnaire Responsiveness module: short form
Short Form (brief face-to-face) 30 minute questionnaire Responsiveness module: short form
Short Form (telephone) Responsiveness module: short form
Short Form (postal and drop-off) 30 minute questionnaire Responsiveness module: short form
China† Colombia Egypt Georgia India† Indonesia Iran Lebanon Mexico Nigeria† Singapore+ Slovakia Syria Turkey
Belgium Bulgaria Czech Republic Estonia Finland France Germany Iceland Ireland Italy Latvia Malta Netherlands Portugal Romania Russian Federation Spain Sweden
Argentina Bahrain Costa Rica Croatia Morocco Oman Jordan United Arab Emirates Venezuela
Canada (30 min) Luxembourg (60 min)
Australia Austria Canada Chile China Cyprus Czech Republic Denmark Egypt* Finland France Greece Hungary Indonesia Kyrgyzstan Lebanon Lithuania Netherlands New Zealand Poland Rep. of Korea Switzerland Thailand Trinidad and Tobago Turkey* Ukraine United Kingdom USA
14 18 9 2 28
† Not full national sample +Information not collected on responsiveness module * Drop-off questionnaire
95

APPENDIX 4
AAppppeennddiixx 44:: TTeecchhnniiccaall SSkkiillllss NNeecceessssaarryy ttoo AAnnaallyyssee tthhee MMCCSSSS DDaattaa
A4.1 Statistical skills WHO has conducted large national sample surveys across member countries to assess
health system performance and the MCSS is an example of this. The data that we will be analysing using this guideline comes from large sample surveys. It is expected, therefore, that users of this manual will have reasonable exposure to basic statistics that deal with sample surveys. We expect that users of this guideline will have a basic understanding of the mean, variance, confidence interval and correlation.
A4.2 An understanding of sample means, sampling variance, confidence interval, and measure of association
Large scale surveys are increasingly used to assess health system performance. Since
only a small portion of the population is surveyed, a well designed sample will generate a reasonable population estimate. The sample means generated from the survey are just that – sample means. The variance of the sample means tell us how close the estimates are in relation to the population mean. The precision of population estimates depend mainly on two things: sample size and how disperse are the variables we are measuring. By way of an example, the Australian component of the MCSS conducted in 2000-01 interviewed 1,587 persons aged 18 years and over across Australia. The average age of respondents from the sample was found to be 53.96 years. Since only about 1,600 respondents out of approximately 12 million eligible persons were interviewed, the average age of Australians aged 18 and over will be slightly ‘off’ the sample estimate. We can actually calculate how much ‘off’ the sample estimate is by some fairly straightforward mathematical calculation.
First, some sampling notations. Population N Sample n Sample of n elements labelled I = 1, 2, 3, . . . , n and denoted as y1, y2, y3 . . ., yn
Total =�y = y1 + y2 + y3 . . . +yn
96

APPENDIX 4
Mean
Mean = nyy ∑= (1)
The mean is the arithmetic average of observations. Put simply, the mean is the sum of
all the values divided by the number of cases for which the values are added. We can see that the mean is very sensitive to extreme values. If, for example, one value is extremely high, including this value can increase the mean value. In survey data, it is common to obtain extreme values. Therefore, it may be more meaningful to use other measures of central tendency (e.g. median and mode) in such cases. We use the mean when the distribution is approximately symmetric. Standard deviation
Standard deviation =SD= 1
)( 2
−
−∑n
yy (2)
The standard deviation is a measure of spread in the data about the mean. The manual calculation of standard deviation involves three steps. First, we need to find the difference between each observed score from the mean. Second, we square the value obtained from the first step. And finally, we sum all the squares from the second step, divide by the number of scores less one (n-1) and calculate the square root.
The standard deviation has two very important properties. First, for normally
distributed data or if the distribution of data is symmetric, about 68% of all observations fall between the mean and one standard deviation either side of the mean, about 95% of all observations fall between the mean and two standard deviations either side of the mean, and 99% of all observations fall between the mean and three standard deviations either side of the mean. Second, regardless of how the survey data are distributed (highly skewed or not symmetric), at least 75% of the observed scores will fall between the mean and two standard deviations either side of the mean.
Variance The standard deviation squared is called the variance. In the sampling field, sometimes
this variance is called the element variance (as opposed to the sampling variance of the mean).
Element variance = s2 = 2
1)(
11 yy
n
n
ii −− ∑
=
= 2
2 )((1
1nyy
n i∑−∑
−) (3)
Sampling variance of mean = Var(nsy
2
) = (4)
The sampling variance of the mean is the element variance divided by the sample size.
Standard error = se(nsyvary
2
)() == (5)
97

APPENDIX 4
When the square root of the sampling variance of the mean is taken, we get the standard error of the mean. Standard error plays a major role in survey data. Standard error tells us how far the sample mean is likely to be from the population mean. Since, a survey uses only part of the population in its sample to measure certain characteristics, the estimate from the sample will not be identical to the population mean. As the formula for the standard error above shows, the bigger the sample is (regardless of the size of the population), the smaller is the sampling error.
Confidence interval
Confidence interval = )1;21( /)( −−± ntysey α (6)
The confidence interval is one of the widely used forms of statistical inference. With the confidence interval we can make inferences about populations using survey data. There are three things we need to calculate a confidence interval: the sample mean, the standard error and the confidence level. Confidence level is often expressed in terms of a percentage, such as 95% confidence or 99% confidence. Since the MCSS uses reasonably large sample sizes, the t statistics in the formula for the confidence interval can be replaced with Z statistics. Depending upon the confidence limit we aim for, the value of this Z statistic differs. For a 95% confidence level, the value of the Z statistic is 1.96, and for a confidence level of 99%, the Z value is 2.58. As the confidence level increases, the value of the Z statistic also increases. For a given sample, the higher the confidence limit, the wider is the confidence interval.
The above formulae are applicable for numeric continuous variables. For proportions
(or binomial variables) the following formulae apply.
For proportion: p sampling mean = nyy ∑= , where, yi = 1 or 0 (7)
Element variance for proportion = 1
)1()(−−
=n
pppvar (8)
Standard error of proportion = se(n
pppvarp )1()() −== (9)
Confidence interval for proportion = )1;21( /)(
−−±n
tpsep α (10)
Let us return to our example about the mean age of 53.96 years for Australians aged 18
years and over who took part in the MCSS. Since the mean age was obtained from surveying a sample of 1,587 persons and not the whole population, the sampling estimate may be slightly different than if we had collected age for all of the 12 or so million eligible Australians aged 18 years and over. One would ask then, what is the purpose of a sample survey if the sample estimate is ‘off’ the population estimate. As explained already, sample estimates allow us to calculate the confidence intervals for population estimates. To find the confidence interval, first we calculate the element variance. If we look closely, the element variance is the square of the standard deviation. Once we know the element variance, we can
98

APPENDIX 4
easily compute the sampling error of the mean. Dividing the standard deviation by the square root of the sample size (or dividing the element variance by the sample size, and taking a square root) we obtain the standard error of the mean. For a continuous variable, we use formula (6) to calculate the confidence interval.
The Australian data showed that the estimated mean age was 53.96 and its standard
error was 0.427. At a 95% confidence level, using formula (6), we find that the mean age was within a confidence band of 53.12 to 54.79 years. At a 99% confidence level the confidence band for mean age is from 52.85 to 55.06 years.
What does a confidence interval mean? The confidence interval means that for a given
confidence limit (95% in this example) the probability of the true population value falling within this band (53.12 years to 54.79 years) is 95%. One may have noticed that, as the confidence level increases, the Z statistic value gets higher, and the confidence band gets wider. For example, if we want a confidence interval of 99%, the Z value becomes 2.58, and replacing this value for Z, the confidence band becomes 52.85 to 55.06 years.
Measure of association If we want to know whether there is any association between two variables then we
look for a correlation coefficient. This correlation coefficient will give a measure of the closeness of the linear relationship between two variables. If we draw a scatterplot of two variables, say height and weight, we will see that as people get taller, their weights goes up. The correlation coefficient (Pearson’s correlation coefficient, to be exact) tells us how much spread there is in the scatterplot. If all the data points fall on a straight line then the correlation coefficients (denoted by r) will be 1. If the plot shows a cloud of points then probably the r value is close to 0. The r values range from –1 to +1. A –1 value suggests a perfect linear and negative association between two variables. The correlation coefficient only measures linear association. Furthermore, association does not always mean causation. That is, an increase in one variable may not always cause another variable to increase (or decrease). It is just an association and does not prove cause and effect. The manual calculation of a correlation coefficient involves a lot of algebra but is not complex. The formula looks like this:
∑ −−
∑ −−=2)(2)(
))((
YYXX
YYXXr (11)
If we look closely, the above formula resembles the variance formula (3) we noted
earlier. The correlation coefficient measures the covariability between two variables. If change in one variable has no effect on other variable then the covariability is zero and r will be 0.
99

APPENDIX 4
A4.3 An understanding of sample surveys, sample design, variance of complex survey design, design effects etc
The overview presented in section A3.2 relates to simple random sample where each
case is self weighted. When the survey involves complex sampling design, or where there is differential probability of selection of the respondent, a slight modification to the formula is required.
Suppose that the MCSS was conducted using a stratified sampling design. Then the sample notations changes slightly as follows. Users can consult any good books on survey sampling (such as Kish, 196533) for more detail. Sample elements = yh1, yh2, . . . yhn
Stratum total = ∑=
=n
yyh
ihih
1
The stratum total is the sum of all sample values in the stratum.
Stratum mean = ny
yh
hh =
The stratum mean is the stratum total divided by the sample size for that stratum.
Element variance = 2
11
12 )()( hh
ihi
hh y
ny
ns −∑=
=−
The element variance is calculated by taking the variation of the sampled value from the
stratum mean, square it, sum the squared value across the stratum and divide by one less than the sample size of that stratum.
Stratum variance for systematic random sampling (SRS) = nsy
h
hh
2
)var( =
The stratum variance is calculated by dividing the element variance for the stratum by the sample size.
Stratum standard error = )var()( yyse hh =
The stratum standard error is calculated by taking a square root of the stratum variance. The above mathematical notations are for stratum level. The following calculations are
required to combine stratum level values for the population.
33 Kish L (1965) Survey sampling. New York: John Wiley.
100

APPENDIX 4
Population mean from strata value = ∑=h
w yhW hy (where NN
W hh= )
Wh is the stratum weight, and is simply the proportion of the stratum population to the whole population.
And the sampling variance is ⎟⎠⎞⎜
⎝⎛∑=
hw yhW hy var)var( = )var(2∑
hyhW h
Which, for SRS within strata, further simplifies to ∑=hw nh
shW hy2
2)var(
For proportions ∑−
−=
h nh
phphW hpw1
)1(2)var(
If the sample design involves cluster sampling, the formula for variance estimate
becomes further complicated. Luckily, specialised software used in the analysis of complex survey sample data takes care of all these algebraic calculations. The computation of the sampling variance for clustered design involves the following steps.
First some sample notations. Number of clusters sampled a Number of cases in each cluster b Cluster total yαSample total y Cluster mean yα
Sample mean ∑=
=a
yay
1
1
αα
Element variance 1
)( 2
12
−
−=∑=
a
yys
a
aα
α
And the sampling variance =)var(yasa
2
If one looks carefully, the sampling variance formulas for various sampling designs are
similar. The good news for users is that all the manual calculation is performed by specialised software.
101

APPENDIX 4
A4.4 A basic understanding of data weights All the mathematical formulas in the previous section do not involve weights (except
for the strata weights). Since sample surveys interview a subset of the population with varying probabilities of selection, weights are introduced at various stages of sampling. There are different types of weights. The weights are added at the data analysis phase to compensate for things such as unequal probabilities of selection, differential response rates and post-stratification adjustment. Weights are inflation factors that allow the sum of weights to be equal to the population size from which the sample is drawn. Chiefly there are three types of weights that are applied to survey data.
Sample weight: this is the inverse of the probability of selection of a respondent.
Since each respondent is selected with a known probability from a population, cases whose probabilities of selection are higher get smaller weights compared to cases with lower probabilities of selection.
Non-response weight: it is normally the case that not all individuals included in the
sample respond to the survey. Non-response is a potential non-sampling error in surveys. If there are differential response rates by different sub-classes in the sample population, this can add bias to the survey estimates. To minimise this bias surveys, usually incorporate non-response adjustment weights. The non-response adjustment weights are typically similar across the weighting class, and these weights are the inverse of the response rate for the weighting class. For example, suppose, the response rate for a weighting class is 60%, each respondent in that weighting class will be inflated by a factor of 1/0.6 = 1.67.
Post-stratification weight: even after adjusting for the above two weights (sample
selection probabilities weight and non-response weight), the weighted sample distribution of major demographic characteristics may not correspond to the known population distribution. There are many reasons why this might happen, including the distribution of the sample, sample under-coverage, lack of an updated sampling frame, and weights that correct for one source of survey error but might increase other errors. For these reasons, even after adjusting for sample weights and non-response weights, the population distribution of the main demographic variables may not correspond to the known population distribution. Post-stratification weights are adjustments that are designed to make weighted sample frequencies for major demographic sub-groups correspond to population totals from other known sources such as national census data. Generally, gender and age groupings are chosen for the post-stratification weights. The values of the post-stratification factor are computed as the ratio of the estimates from the census population value to the weighted sample total at stratum level.
Although weights are introduced to make the sample as representative as the
population they came from, weighting could increase the variance significantly. If the size and distribution of weights in the sample is reasonably uniform, weighting does not increase the variance that much.
102

APPENDIX 4
Kish (1995)34 defines (1+L) as the ratio of increase in variance due to random weighting. This can be calculated by squaring the individual weight values, summing the squared values and then dividing this by the square of the summed weight.
Mathematically it is:∑
∑==+ 2
1
2
)(1
w
wnL
i
n
ii
A4.5 An understanding of missing data We have already discussed the non-response adjustment weights. If a respondent does
not answer to any of the questions then it is usually referred to as unit-non-response or case-missing. If, however, a respondent answers some questions and does not provide answers to others, then it is a case of missing items. Missing cases are adjusted with non-response weights but missing item values are handled differently depending upon the type of analysis a researcher is interested in. Most of the specialised software excludes missing item values from the analysis.
A4.6 An understanding of standardization In Chapter 4 while presenting results we did not use age-sex standardised
responsiveness results. This section demonstrates the logic of standardisation for countries wanting to proceed with this more complicated analysis. Standardization may be useful when comparing responsiveness for different regions/institutions in a country for two reasons: case-mix and expectations bias correction. You can follow the method described below for obtaining your own country's age-sex standardised responsiveness results.
Standardization is by no means an obvious thing to do. It depends on the questions one is trying to answer. In the context of age-sex standardization presented here, standardized results would answer the questions:
• What would the responsiveness to population A be, if it had the same age-sex structure as population B?
• If expectations differ by age and sex and the age-sex structure of populations A and B differ, then is the difference in the reporting of responsiveness only because of the underlying age-sex structure of the populations?
Answering these questions would have different implications for the actions taken by
health services, compared with an analysis that did not factor this in. If the only reason for 34 Kish L (1995) Methods for Design effects. Journal of Official Statistics 11(1):55-77.
103

APPENDIX 4
differences in responsiveness is due to the age and sex, then new methods will be needed to find out how to respond to the needs of people of different ages, rather than assuming that one set of health services has the answers to responsiveness while another does not.
While other socio-demographic factors can be used in a standardization analysis, age and sex are used here because they are most commonly available pieces of information about users, and are important for both case-mix and expectations adjustment. Firstly, failing other information on a user's health, age can be seen as a proxy for health in a type of case-mix adjustment. The rationale for saying this is that in general older people would present with more complicated illnesses, making greater demands on a health system to be responsive. Secondly, the literature indicates that both, but age in particular, have an impact on expectations.
We will explain the method of using age-sex standardization with an example. The example also demonstrates a scenario where it is advisable to exclude age-standardized weights to calculate the weighted score because one age group is not represented in one of the population samples.
In Table A4.1, we have data on autonomy for hospital inpatient care for two hypothetical populations with access to two different groups of health services. The mean autonomy score (represented by percent of respondents who rated autonomy as "moderate", "bad", or "very bad") differs for the two sets of health services.
Since these two hypothetical populations have different age structures, the results seen in Table A4.1 may not lead to the correct conclusions regarding remedial actions. There is no specific pattern how males of Population A reported mean autonomy according to given age groups. The average autonomy score among males of Population B behave differently, moreover, there were no respondents aged 80+. If we compare only the average scores for those populations, and don’t adjust for the difference in age structure, we will be biasing our results. We would conclude, that males in Population A reported domain autonomy worse than males in Population B. Table A4.1 Mean autonomy score by age group and gender, unadjusted for difference in age structure, two hypothetical populations—Population A and Population B Gender Age Group Age Range Population A Population B
Male 1 18-29y 26 22 2 30-44y 30 36 3 45-59y 12 23 4 60-69y 27 17 5 70-79y 33 25 6 80+y 25 average 25.5 24.6 Female 1 18-29y 27 22 2 30-44y 35 29 3 45-59y 19 11 4 60-69y 27 17 5 70-79y 17 8 6 80+y 25 25 average 25 18.66
104

APPENDIX 4
In order to compare results between Populations A and B, we have to standardize, so differences in the average autonomy scores between these two populations are due solely to difference in performance in term of responsiveness. Only after standardization we will be able to compare the average autonomy scores. Actually, there is more than one standard population that can be used. We have chosen to standardize using the WHO standard population.
The age standardized population weights for different age categories from the WHO standard population are given in Table A4.2. Basically the table shows that based on a standard population of 100,000, the standard population will consist of 24.6% persons aged 18–29 years, 21.3% aged 30–44 years and so on.
Table A4.2 WHO World Standard Population weights by age group, WHO, 2000
Age Group Age Range WHO standard population
weight
1 18-29y 24.62 2 30-44y 21.34 3 45-59y 15.96 4 60-69y 6.68 5 70-79y 3.73 6 80+y 1.54
All ages 73.87
To make average autonomy scores comparable across populations, all we need to do is multiply the mean autonomy scores by the respective age category weights. Since the mean autonomy scores for both populations in this example will be multiplied by the same set of weights (for each age and gender category), the resultant average autonomy score can be compared across these populations. Any difference in responsiveness scores (e.g. in selected example of domain autonomy) due to difference in age structures has now been removed.
Table A4.3 shows how it is done. The sum of weights for all ages is 73.87. In other words, 73.87% of the WHO standard population is aged 18 years or older. For Population A, the age standardized mean autonomy score for males is 24.6, and for females it is 27.0. The gender difference in Population B is 26.0 for males compared to 20.5 for females.
To arrive at a mean autonomy score of 24.6 for all males in Population A, first we multiply the unstandardized score for males by the age standardized population weight. We do the same calculation for each age category. For example, the age standardized mean autonomy score for Population A for people aged 18–29 is the product of multiplying the mean unstandardized score (26, from Table A4.1) and the age standardized weight (24.62, from Table A4.2).
105

APPENDIX 4
A similar product is calculated for all other age categories as well. Then all the products are summed up giving a value of 1813.8. We have already summed all the population weights, and the summed value is 73.87. When we divide the sum of weighted products (1813.8) by the sum of population weights (73.87) we get the weighted average autonomy score of 24.6 for males in Population A.
Table A4.3 Mean autonomy score by age group and gender, age standardized to adjust for difference in age structure
Gender Age Group Age Range WHO standardized population weights
Population A
Population B
Male 1 18-29y 24.62 640.12 541.64 2 30-44y 21.34 640.20 768.24 3 45-59y 15.96 191.52 367.08 4 60-69y 6.68 180.36 113.56 5 70-79y 3.73 123.09 93.25 6 80+y 1.54 38.5
All ages
73.87 24.6
26.0
Female 1 18-29y 24.62 27 22 2 30-44y 21.34 35 29 3 45-59y 15.96 19 11 4 60-69y 6.68 27 17 5 70-79y 3.73 17 8 6 80+y 1.54 25 25
All ages 73.87 27.0 20.5
26 * 24.62
This is the sum of all weights. This is the weighted average for males aged 18-79
years. Since there is no one aged 80 or over, the age standardized weights for males aged 80 years or more is excluded from the denominator (or 1883.8/72.32)
This is the weighted average which equals the sum of all the mean scores for females for country A divided by the sum of weights for all females of country A (1997.2/73.87)
We have demonstrated that to calculate the age standardized average autonomy score for males or for females we divide the sum of weighted product by the sum of weights. However, if in our sample some age groups are not represented, we need to adjust the sum of weights accordingly by excluding the age standardized weights for those age groups from the denominator. Now we can conclude, that males in Population B reported autonomy
106

APPENDIX 4
worse than males in Population A, which is actually the totally opposite conclusion we had made prior to age standardization.
A4.7 Use of computer packages such as SAS, SPSS, or STATA, and EXCEL
Familiarity in the use of computer statistical software that is currently available to
analyse socio-demographic data will be an advantage in analysing the MCSS data. Users may be aware that some software has built in command functions to analyse survey data that use complex sampling designs. SAS and STATA have such capabilities. Users should note that some software may not routinely calculate weighted element variances.
We will be using STATA software for the analysis of sample data throughout this
manual. The syntax that is presented in this manual is applicable only to STATA. Users who use software such as SPSS or SAS should adopt the appropriate command syntax for the software of their choice.
107

APPENDIX 5
AAppppeennddiixx 55:: PPssyycchhoommeettrriiccss This chapter provides you with detailed examples of Stata commands that can be used
to examine the psychometric properties of the responsiveness module as applied in your country. We have used Australian data as for most of our examples and it is a straightforward matter for you to copy the strategy, using the psychometrics “do files” provided in Stata for your own country data.
Psychometrics is described by the open access journal, Wikipedia, as "the science of measuring "psychological" aspects of a person such as knowledge, skills, abilities, or personality. Measurement of these unobservable phenomena is difficult and much of the research and accumulated art of this discipline is designed to reliably define and then quantify." There are two branches to psychometric theory -classical test theory (CTT), and the more recent item response theory (IRT). The methods used to assess psychometrics properties of the responsiveness module in this appendix come largely from test theory.
Test theory recognises two basic elements of observed data - true data and measurement error. Measurement error consists of systematic measurement error and random measurement error. If an instrument is free of random measurement error, we can say that it is highly reliable. If an instrument is free of systematic measurement error, we can say that it is valid (De Vellis, 1991)35.
Known sources of both systematic and random measurement errors include methodological factors, sampling strategies, and irregularities in data collection. They may also be influenced by respondent characteristics (such as age, education and income), expectations, self-interest and gratitude. Psychometrics, a branch of survey research, examines the quality of survey instruments and has developed methods to address errors in measurement. The main objective of this appendix is to assess the properties of feasibility, reliability and validity for the responsiveness module.
The purpose of this Appendix is two-fold: to describe the psychometric properties of the responsiveness module and show the steps for conducting psychometric evaluation; and to describe psychometric properties for surveys comparable to the MCSS and how they compare with the MCSS responsiveness module.
A5.1 Validity
Validity is concerned with the extent to which an instrument actually measures what it is supposed to measure. Validity testing is an attempt to support the measurement assumption that specific items in the instrument are clear representations of the concept under study. In other words, if we designed a survey instrument to measure respondents’ 35 R DeVellis, 1991, Scale Development: Theory and Applications, Sage, Newbury Park
108

APPENDIX 5
assessment of health system responsiveness, then the instrument should measure that and not the respondent’s assessment of effectiveness or some other attribute of the health system. Basic validity concepts are summarised in Table A5.1. Table A5.1 Summary of types of validity and their characteristics Type of validity Characteristics
Face validity Whether an item or survey instrument (often called a scale) appears to
measure what it purports to measure. It is usually assessed by individuals without formal training in the subject under study such as persons from the survey population.
Content validity Whether an item or series of items appears to cover the subject matter or survey topic. It is usually assessed by individuals with expertise in some aspect of the subject under study.
Criterion validity The degree to which the items measure what an independent measure purports to measure.
Concurrent A measure of how well an item or scale correlates with ‘gold standard’ measures of the same variable concurrently assessed. It is calculated as a correlation coefficient between the ‘gold standard’ and the survey item.
Predictive A measure of how well an item or scale predicts expected future observations. It is also calculated as a correlation coefficient between the ‘gold standard’ and the measured item.
Construct validity A theoretical measure of how meaningful a survey instrument is as a measure of the subject under study. It is usually assessed by analysing factor loading.
Source: MS Litwin: How to measure survey reliability and validity (The Survey Kit series). Thousand Oaks, CA: Sage, 1995 and J M Bland and D G Altman, Statistics Notes: Validating scales and indexes. BMJ, March 9, 2002; 324(7337): 606 - 607.
Construct validity is of greatest interest for this manual. Construct validity is the extent to which a new measure is related to specific variables in accordance with a hypothetical construct. It is a theoretical measure that shows how meaningful the scale (the survey instrument) is when in practical use. Measurement of construct validity involves a statistical evaluation of survey data by computing how highly the items are correlated. If such correlations are low, it would suggest that all items are not measuring the same construct. In other words the data will show a multidimensional structure as opposed to a desired one-dimensional structure A5.1.1 Construct Validity of the MCSS responsiveness module
Factor analysis is used to assess the validity of the instrument in terms of its ability to measure the seven domains of ambulatory care responsiveness. Factor analysis is a statistical technique that can be used to uncover and establish common dimensionality between different observed variables. Basically, it allows us to reduce the number of variables to a
109

APPENDIX 5
smaller number of meaningful constructs. These constructs are not measured directly in the survey; instead a series of questions are asked relating to the construct of interest. For example, results from a factor analysis might reveal that although we ask 10 questions about peoples’ perception of the health system, responses to these 10 questions can be expressed in terms of, say, two latent constructs or unobserved dimensions.
Because the concept of a latent construct or unobserved dimension is difficult to explain without giving some empirical examples, we will demonstrate how the sets of questions used in the responsiveness modules of the MCSS can be expressed in a few meaningful constructs or domains. In the examples that follow, we will first assess whether the items in the responsiveness module can be summarised to seven responsiveness domains for experiences in ambulatory settings. Next we will assess whether all the items can be summarised in a single latent construct that we will define as overall responsiveness.
We use Confirmatory Factor Analysis (CFA) to confirm or reject a hypothesis about the underlying dimensionality of a construct. We want to confirm our theoretical assumption that a set of questions measuring people’s experience with the health systems can be expressed in a small number of responsiveness domains. We assume that there are seven domains of responsiveness in relation to experience of ambulatory care services. The purpose of the factor analysis is to test whether each set of questions can explain these seven responsiveness domains. If the purpose of the analysis was to find whether or not the original survey variables could be reduced to a small number of latent constructs, then we would use Exploratory Factor Analysis (EFA). EFA is used when there is no a priori assumption about the underlying dimensionality of the construct.
Table A5.2 presents the results of the CFA on the respondents’ experience with the ambulatory care using the MCSS data from all surveyed countries. MPLUS was used to estimate the factor loadings. More than 51,000 cases pertaining to patient reports of ambulatory care experiences were included in the analysis. Each of the seven responsiveness domains for ambulatory care experience was treated as a separate construct. Only those questions hypothesised to relate to a particular domain were included in the model. The computed numbers are the factor loadings on the latent variables. The factor loadings range from -1 to +1 and represent the amount of variance that responses to an item have in common with the underlying latent variable. There is no strict cut off to describe strong and weak associations of variance, but the closer to +1 or -1, the stronger the association to the construct. For example Gasquet (2004) and Haddad (1998, 2000) set ≥ 0.4 in their studies as the substantial factor loading and Westway (2003) set a loading >0.5.
The CFA results for the MCSS generally confirm the assumed structure of the responsiveness domains. The results supported the assumption that items (questions) that are assumed to represent various responsiveness domains in fact do so. In other words, the validity of the scale where a number of questions were asked to measure each of the responsiveness domains is supported by the data. The factor loading which measures the correlation between the survey responses and the latent constructs (or the domains) was large. Except for two items all loadings were greater than 0.6.
The only 2 items not loading high on the intended domains were q6100 and q6103. Both of these items relate to the promptness domain of responsiveness and are about
110

APPENDIX 5
111
waiting times for required health care. This is not an unexpected finding as the data resulting from these questions are pseudo-numerical. Although the variables are expressed in time units, the response wording specifies minutes, hours, days, weeks and months. Thus two issues emerge: first, these types of data should be transformed using a log function or other alternative transformation so that the data are normally distributed; and second, if the conceptual relationship of these questions to the intended construct is unclear these items should be omitted from a CFA analysis.
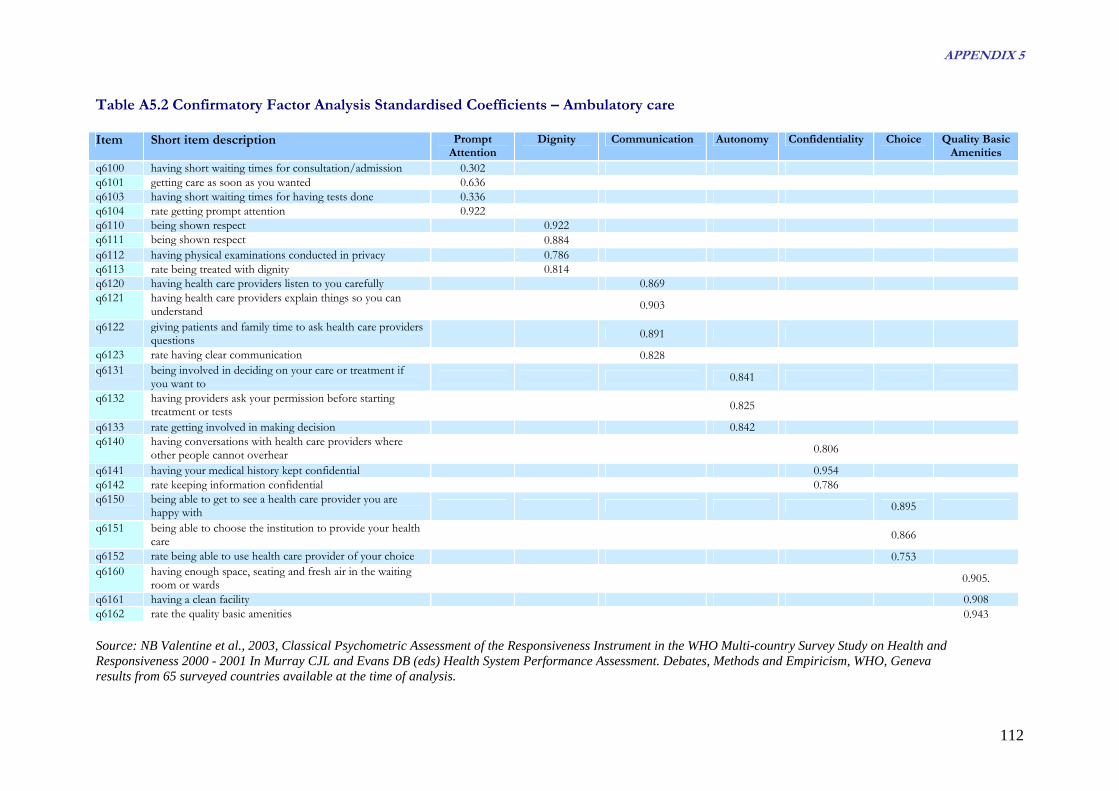
APPENDIX 5
112
Table A5.2 Confirmatory Factor Analysis Standardised Coefficients – Ambulatory care Item Short item description Prompt
Attention Dignity Communication Autonomy Confidentiality Choice Quality Basic
Amenities q6100 having short waiting times for consultation/admission 0.302 q6101 getting care as soon as you wanted 0.636 q6103 having short waiting times for having tests done 0.336 q6104 rate getting prompt attention 0.922 q6110 being shown respect 0.922 q6111 being shown respect 0.884q6112 having physical examinations conducted in privacy 0.786 q6113 rate being treated with dignity 0.814q6120 having health care providers listen to you carefully 0.869 q6121 having health care providers explain things so you can
understand 0.903
q6122 giving patients and family time to ask health care providers questions 0.891
q6123 rate having clear communication 0.828q6131 being involved in deciding on your care or treatment if
you want to 0.841
q6132 having providers ask your permission before starting treatment or tests 0.825
q6133 rate getting involved in making decision 0.842 q6140 having conversations with health care providers where
other people cannot overhear 0.806
q6141 having your medical history kept confidential 0.954 q6142 rate keeping information confidential 0.786q6150 being able to get to see a health care provider you are
happy with 0.895
q6151 being able to choose the institution to provide your health care 0.866
q6152 rate being able to use health care provider of your choice 0.753 q6160 having enough space, seating and fresh air in the waiting
room or wards 0.905.
q6161 having a clean facility 0.908 q6162 rate the quality basic amenities 0.943 Source: NB Valentine et al., 2003, Classical Psychometric Assessment of the Responsiveness Instrument in the WHO Multi-country Survey Study on Health and Responsiveness 2000 - 2001 In Murray CJL and Evans DB (eds) Health System Performance Assessment. Debates, Methods and Empiricism, WHO, Geneva results from 65 surveyed countries available at the time of analysis.
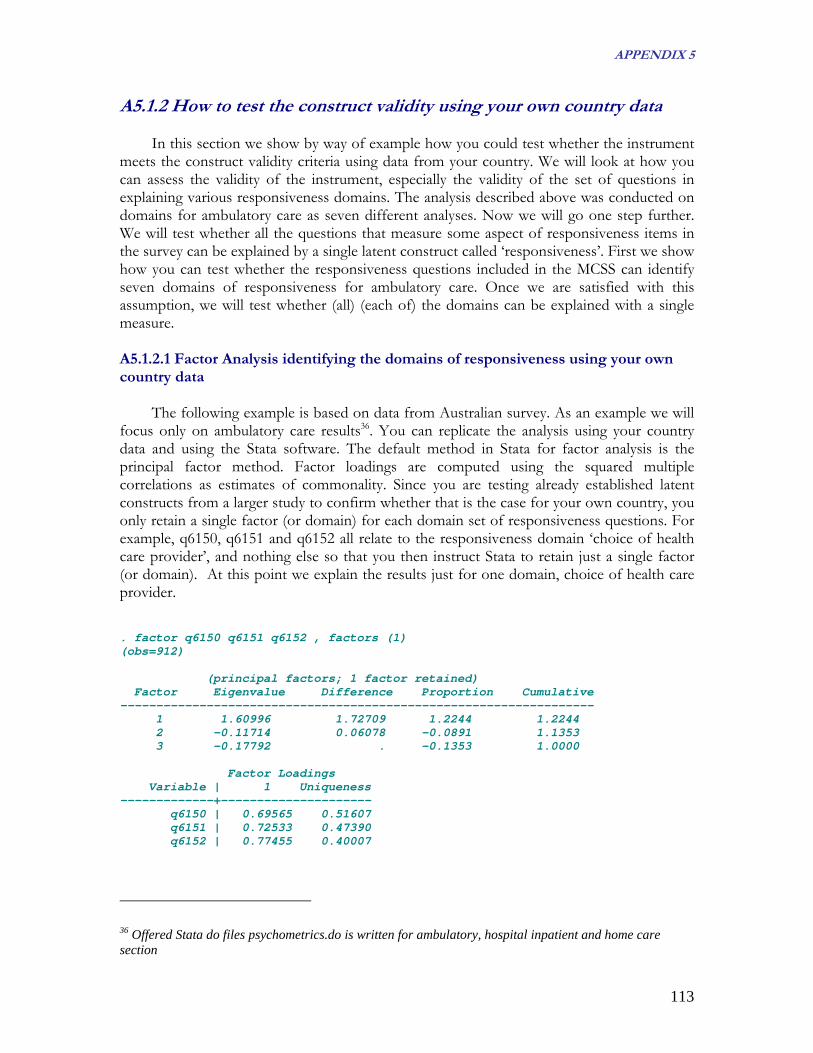
APPENDIX 5
A5.1.2 How to test the construct validity using your own country data In this section we show by way of example how you could test whether the instrument
meets the construct validity criteria using data from your country. We will look at how you can assess the validity of the instrument, especially the validity of the set of questions in explaining various responsiveness domains. The analysis described above was conducted on domains for ambulatory care as seven different analyses. Now we will go one step further. We will test whether all the questions that measure some aspect of responsiveness items in the survey can be explained by a single latent construct called ‘responsiveness’. First we show how you can test whether the responsiveness questions included in the MCSS can identify seven domains of responsiveness for ambulatory care. Once we are satisfied with this assumption, we will test whether (all) (each of) the domains can be explained with a single measure. A5.1.2.1 Factor Analysis identifying the domains of responsiveness using your own country data
The following example is based on data from Australian survey. As an example we will
focus only on ambulatory care results36. You can replicate the analysis using your country data and using the Stata software. The default method in Stata for factor analysis is the principal factor method. Factor loadings are computed using the squared multiple correlations as estimates of commonality. Since you are testing already established latent constructs from a larger study to confirm whether that is the case for your own country, you only retain a single factor (or domain) for each domain set of responsiveness questions. For example, q6150, q6151 and q6152 all relate to the responsiveness domain ‘choice of health care provider’, and nothing else so that you then instruct Stata to retain just a single factor (or domain). At this point we explain the results just for one domain, choice of health care provider. . factor q6150 q6151 q6152 , factors (1) (obs=912) (principal factors; 1 factor retained) Factor Eigenvalue Difference Proportion Cumulative ------------------------------------------------------------------ 1 1.60996 1.72709 1.2244 1.2244 2 -0.11714 0.06078 -0.0891 1.1353 3 -0.17792 . -0.1353 1.0000 Factor Loadings Variable | 1 Uniqueness -------------+--------------------- q6150 | 0.69565 0.51607 q6151 | 0.72533 0.47390 q6152 | 0.77455 0.40007
36 Offered Stata do files psychometrics.do is written for ambulatory, hospital inpatient and home care section
113

APPENDIX 5
The first panel lists the eigenvalues of the correlation matrix, ordered from largest to smallest. The figures in the third column show the difference between each eigenvalue and the next smaller eigenvalue. It is not unusual to find a negative eigenvalue. Whether or not the number of factors is defined, the factor command only retains factors that have 0 or positive eigenvalues. In the example above we specifically asked to retain only one factor. The three variables, q6150, q6151 and q6152, measure aspects of choice of health care provider. The factor that we have named ‘choice of health care provider’ is explained reasonably well by those three variables. The correlation coefficient between the standardised variable q6150 and the choice of health care provider factor is 0.69565. These correlation coefficients are shown as factor loadings. The uniqueness (1 – (factor loading)2), is 0.51607 for q6150. This means that the factor explains 48.4% of the variance in q6150. The lower the uniqueness value of an item, the higher is the explanatory power of the factor.
Table A5.3 shows that all items have very high correlations with the responsiveness domains. Only q6103 loaded lower. We dealt with the same problem when we looked at the CFA results for all countries in the MCSS (question 6103 asks about waiting times for tests). The low factor loading does raise some question regarding whether the item shares the same construct as the other items about waiting times. Table A5.3 Confirmatory Factor Analysis Standardised Coefficients, Australia Item Short item description Domain label Factor
loadingq6101 getting care as soon as you wanted Prompt attention 0.64q6103 having short waiting times for having tests done Prompt attention 0.33q6104 rate getting prompt attention Prompt attention 0.69q6110 being shown respect Dignity 0.66q611 being shown respect Dignity 0.63q6112 having physical examinations conducted in privacy Dignity 0.64q6113 rate being treated with dignity Dignity 0.78q6120 having health care providers listen to you carefully Communication 0.73q6121 having health care providers explain things so you can
understand Communication 0.75
q6122 giving patients and family time to ask health care providers questions
Communication 0.80
q6123 rate having clear communication Communication 0.83q6131 being involved in deciding on your care or treatment if
you want to Autonomy 0.77
q6132 having providers ask your permission before starting treatment or tests
Autonomy 0.65
q6133 rate getting involved in making decision Autonomy 0.80q6140 having conversations with health care providers where
other people cannot overhear Confidentiality 0.65
q6141 having your medical history kept confidential Confidentiality 0.71q6142 rate keeping information confidential Confidentiality 0.69q6150 being able to get to see a health care provider you are
happy with Choice 0.70
q6151 being able to choose the institution to provide your health care
Choice 0.73
q6152 rate being able to use health care provider of your choice Choice 0.77q6160 having enough space, seating and fresh air in the waiting
room or wards Quality basic amenities 0.84
q6161 having a clean facility Quality basic amenities 0.82q6162 rate the quality basic amenities Quality basic amenities 0.91
114

APPENDIX 5
A5.1.2.2 Cronbach’s alpha identifying the domains of responsiveness using your own country data
You can also assess the unidimensionality, or internal consistency of items, by using Cronbach’s alpha37. Cronbach’s alpha measures how well a set of items measures a single unidimensional latent construct, the coefficient measures overall correlation between the items and the scale. Cronbach’s alpha is more a coefficient of reliability than a statistical test. That means the higher the coefficient, the higher is the unidimensionality of the items. The alpha coefficient ranges from 0 (lowest reliability) to 1 (highest reliability) and a value of 0.8 or greater is considered good, meaning that the items measure a single unidimensional construct38. According to the studies of Hagen (2003), Blazeby (2004), Labarere (2001), Verho (2003), Jenkinson (2002, 2003) and Li (2003), it is sufficient to reach the criterion alpha value 0.7 to be confident about unidimensionality. The lowest criterion for alpha was set by Steine (2001) to the value 0.6. On the other hand, Salomon (1999) set the criterion value to 0.8. The formula to calculate Cronbach’s alpha is as follows.
rNrNa
)1(1* −+
=
Where:
ncorrelatio item-intermean
scale in the items ofnumber
=
=
r
N
You can deduce from the formula that you can increase the alpha coefficient by
increasing the number of items in the scale. Alternatively, if a specific item in the scale has a very low correlation with other items, the alpha value will also be low.
In our example, the Cronbach’s alpha value for Australian MCSS responsiveness module data on the choice of health care provider domain questions (q6150, q6151 and q6153) is 0.8082 (results below the paragraph). You can also observe relatively high inter - item correlation (0.5841). Hagen (2003), Blazeby (2004), McGuiness (2003), Westaway (2003), Gasquet (2004), Jenkinson (2002, 2003) and Li (2003) suggest that the inter-item correlation coefficient should be higher than 0.4. According to this criterion, the analysis confirmed that the items measure a single unidimensional construct.
37 J M Bland and D G Altman: Statistics notes: Cronbach's alpha. BMJ, February 22, 1997; 314(7080): 572 - 572. 38 Sitzia, J. 1999, How valid and reliable are patient satisfaction data? An analysis of 195 studies. In: Intl Journal for Quality in Health Care, vol 11, n. 4: 319-28
115

APPENDIX 5
Test scale = mean(standardized items) Average inter item correlation: 0.5841 Number of items in the scale: 3 Scale reliability coefficient: 0.8082
Table A5.4 shows results for inter-item correlations and alpha values for individual domains for ambulatory care experience, computed on Australian data. While you can observe a moderate mean inter - item correlation for the prompt attention domain (0.3361), the alpha coefficient is still quite high at 0.6030. The other alpha coefficients reached values of more than 0.75. The results again indicated that the items we used seem to correspond to a single construct. Table A5.4 Cronbach’s alpha Coefficients, Australia
Domain label Inter - item correlation Cronbach’s Alpha Prompt attention 0.3361 0.6030 Dignity 0.4795 0.7865 Communication 0.6326 0.8732 Autonomy 0.5863 0.8096 Confidentiality 0.5208 0.7653 Choice 0.5841 0.8082 Quality basic amenities 0.7610 0.9052
We introduced two measures to assess construct validity - factor analysis and
Cronbach’s alpha. Cronbach’s alpha assesses whether a set of items measure a single unidimensional construct, whereas factor loadings from a factor analysis assess the explanatory power of the latent construct. Cronbach’s alpha gives a summary measure of the unidimensionality of a latent construct for all the items, whereas factor analysis is an indication of the validity of the latent construct given the information on each item. In theory these two statistical tools are different, however, in practical terms they both convey the same message. If a set of items has a high Cronbach’s alpha coefficient, the factor analysis will also show that the items load very highly on a single factor. Both tests suggest unidimensionality. Although a large alpha coefficient value signifies unidimensionality, it does not necessarily mean that the scale is a valid one. In other words, the reliability of a construct does not mean that the construct is valid. In the responsiveness domains and their associated items in WHO’s MCSS, the results of both tests described above gives us confidence that we the responsiveness scale is both reliable and valid . A5.1.2.3 Confirmatory Factor Analysis identifying a single construct for overall level of responsiveness
The results from factor analysis provide support for the unidimensional constructs (the responsiveness domains) that WHO has developed. We will now go on to explore the data to determine whether the ambulatory care responsiveness items are a measure of a single construct. This time we pre-specify one latent construct. The idea is to find a meaningful construct that is a surrogate for ambulatory care responsiveness from the 23 questions presented in Table A5.3. We will also assess whether all these items have unidimensionality with the help of Cronbach’s alpha coefficient.
116

APPENDIX 5
The Stata output is as follows: . factor q6101-q6162, factors (1) ; (obs=597) (principal factors; 1 factor retained) Factor Eigenvalue Difference Proportion Cumulative ------------------------------------------------------------------ 1 8.49245 7.07423 0.6956 0.6956 2 1.41822 0.38344 0.1162 0.8118 3 1.03478 0.15495 0.0848 0.8965 4 0.87983 0.16695 0.0721 0.9686 5 0.71288 0.28495 0.0584 1.0270 6 0.42793 0.14440 0.0351 1.0620 7 0.28353 0.06115 0.0232 1.0853 8 0.22237 0.12090 0.0182 1.1035 9 0.10147 0.07357 0.0083 1.1118 10 0.02791 0.00400 0.0023 1.1141 11 0.02391 0.03895 0.0020 1.1160 12 -0.01504 0.00247 -0.0012 1.1148 13 -0.01751 0.02944 -0.0014 1.1134 14 -0.04695 0.03239 -0.0038 1.1095 15 -0.07934 0.01633 -0.0065 1.1030 16 -0.09567 0.02571 -0.0078 1.0952 17 -0.12138 0.01692 -0.0099 1.0852 18 -0.13830 0.00522 -0.0113 1.0739 19 -0.14351 0.01009 -0.0118 1.0622 20 -0.15361 0.00850 -0.0126 1.0496 21 -0.16210 0.04549 -0.0133 1.0363 22 -0.20759 0.02803 -0.0170 1.0193 23 -0.23562 . -0.0193 1.0000 Factor Loadings Variable | 1 Uniqueness -------------+--------------------- q6101 | 0.50333 0.74666 q6103 | 0.19782 0.96087 q6104 | 0.65025 0.57718 q6110 | 0.64816 0.57989 q6111 | 0.56484 0.68096 q6112 | 0.57514 0.66921 q6113 | 0.72065 0.48066 q6120 | 0.67429 0.54533 q6121 | 0.65459 0.57152 q6122 | 0.69056 0.52312 q6123 | 0.78952 0.37666 q6131 | 0.65340 0.57307 q6132 | 0.43025 0.81488 q6133 | 0.71930 0.48261 q6140 | 0.46665 0.78223 q6141 | 0.48939 0.76050 q6142 | 0.57562 0.66866 q6150 | 0.63163 0.60104 q6151 | 0.56013 0.68626 q6152 | 0.68946 0.52465 q6160 | 0.62989 0.60324 q6161 | 0.58062 0.66288 q6162 | 0.60375 0.63548
The factor analysis result is based on only 597 observations. Although we have 1,587 observations in the data file for Australia, there were a smaller number who used ambulatory health care services in the previous 12 months - a total of 597 observations that had valid
117

APPENDIX 5
data for all 23 questions. The factor analysis program in Stata by default lists as many factors as there are variables (23 in our case). However, we specified that only a single factor be retained for subsequent results. The numbers in the second panel relate to this single factor (which we term overall ambulatory care responsiveness). When we look at the factor loadings (the standardised correlation coefficients between responses to the questions and the construct or the factor) in the second column, we see that except for 4 questions, items correlate highly (0.5 or higher) to the factor.
The result for q6103 shows quite poor correlation with the latent construct (the factor explains only 4% of the variance in this variable). You will recall that q6103 also showed a low value in the CFA for prompt attention domain. The other questions correlate highly with the single latent construct. Thus we can conclude that the 23 items can be expressed in a single scale, which we refer to as ambulatory care responsiveness. A5.1.2.4 Cronbach’s alpha identifying a single construct for overall level of responsiveness
We can calculate Cronbach’s alpha to assess whether the 23 items on ambulatory care have unidimensionality. The reliability coefficient measured by Cronbach’s alpha applied to the 23 items will show how well they measure a single unidimensional latent construct. The result is shown below. Test scale = mean(standardized items) Average inter item correlation: 0.3471 Number of items in the scale: 23 Scale reliability coefficient: 0.9244
The scale reliability coefficient of 0.9244 is very high, suggesting the unidimensional nature of the data. In other words, the data from 23 items can be expressed as unidimensional, which we have termed overall ambulatory care responsiveness.
A5.2 Reliability
Reliability is a function of random measurement error. Random error is unpredictable error that occurs in all surveys. Reliability testing uses data from a population to estimate the portion of the variance that is true or non-random; this proportion is expressed as a coefficient between 0 and 1. For example, a reliability coefficient of 0.7 tells us that 70% of the variance is due to true differences between individuals and 30% is due to measurement error. Reliability is a statistical measure that tells us how reproducible the data from a survey instrument is39. Reliability is concerned with the consistency of the measurement, the degree to which an instrument measures the same way each time it is used under the same conditions with the same respondents.
39 MS Litwin: How to measure survey reliability and validity (The Survey Kit series). Thousand Oaks, CA: Sage, 1995
118

APPENDIX 5
There are many forms of reliability9:
• Test-retest reliability measures how stable the responses are over time. It involves asking the same respondents the same questions at two different points in time. This measure is vulnerable when differences are observed on variables that measure things that change i.e. when a real change could be misinterpreted as instability.
• Alternate-form reliability involves using differently worded items to measure the same attributes.
• Internal consistency reliability is a measure to assess the scales that are developed in survey instruments. The idea here is to assess whether a group of items that are intended to measure a particular construct are indeed measuring the same thing.
• Inter-observer reliability looks at how well two or more evaluators agree in their assessment of a measure.
• Intra-observer reliability, on the other hand, measures the stability of responses over time in the same individual respondent.
In these guidelines, we will focus on test-retest reliability.
Reliability in social surveys generally refers to the statistical measure of how reproducible the survey instrument’s data are. Test-retest reliability estimates the error component when there is repetition of a measurement by computing Kappa statistics for categorical and intra-class correlation coefficient for continuous variables within and across populations. This gives us estimates of change-corrected agreement rates for concordance between test and retest applications to indicate the stability of the application40 .
If the same question is asked of the same respondent at two different times and produces the same results, then the Kappa statistic will have a value of 1. A score of 1 indicates perfect concordance between the two sets of responses; a score of 0 indicates that the observed concordance was no better than could be expected by chance. A negative score suggests that responses are negatively related. For questions on fact (e.g. a visit to a doctor), Kappa coefficients are expected to be higher than for reports on experiences (e.g. receiving prompt attention). In the studies referred to earlier the satisfactory value of the Kappa coefficient was set at 0.6 by Salomon (1999) and Gasquet (2004)).
To establish the reliability of the responsiveness module, the long version of the MCSS was re-administered in its entirety to respondents who had previously completed the instrument. Respondents in 9 countries were approached one week after the first questionnaire had been administered. A total of 4,625 retest interviews were performed. Of these, 2,174 individuals reported having had ambulatory care experiences in the previous 12 months, 183 had home care, 283 had hospital inpatient care, and the remainder had no care experiences. Table A5.5 presents the number of interviews that were completed for the
40 Ustun, T. et al., 2003, WHO Multi-country Survey Study on Health and Responsiveness 2000-2001, in: Murray CJL and Evans DB (eds) Health System Performance Assessment. Debates, Methods and Empiricism, WHO, Geneva
119

APPENDIX 5
retest 41 . Data where the retest involved less than 30 interviews were omitted from the analysis (shaded in gray). Table A5.5 Number of interviews completed for retest by country
Section China Colombia Egypt Georgia Indonesia India Nigeria Slovakia Turkey TotalOutpatient 412 412 268 254 280 288 58 74 127 2174Home Care 65 0 14 56 34 9 3 2 0 183Inpatient 64 50 32 46 21 36 12 16 6 283Total 858 606 452 940 688 437 353 96 195 4625
Source: Murray CJL, Evans DB (Eds) Health systems performance assessment: debates, methods and empiricism. Geneva (2001:.605)
The country-specific disparities in the number of retest interviews severely limited the opportunities to undertake the section or item specific analysis. In spite of this, some tentative conclusions can be made. As expected, Kappa statistics were larger for factual questions about utilisation rates compared to questions about responsiveness. Few questions used in the calculation of the responsiveness measure have Kappa rates averaging less than κ =0.60.
The figures presented in Table A5.6 are results for Kappa statistics from the MCSS retests in eight countries. Australia hasn't done retest for the MCSS, so we will explain the results in the given table for example for Slovakia. Analysing the given result we can conclude, that the reliability of the instrument in all domains was substantial or almost perfect (using the terminology proposed by Landis and Koch, 197742). The average Kappa for the country was 0.81; that means the level of agreement between the responses to the original survey and the retest interviews was almost perfect. We can see that the ambulatory care domains attained Kappa values higher than 0.8. Slightly lower Kappa values were attained for vignettes, but all coefficients still attained values higher than 0.75. Thus we can conclude that the instrument had high reproducibility in Slovakia. If we compare Kappa values across countries, we can see that China, Egypt and Turkey have excellent reproducibility. The values for Georgia, Columbia and Nigeria were moderate.
The results of test-retest measure on the MCSS have shown that reliability was higher among the more factual questions compared to the more subjective ones. This is what would generally be expected. People’s subjective attitudes and beliefs may change test and retest depending on environmental conditions, such as a government advertising campaign, an epidemic, or an unfortunate experience with respect to health care by the respondent’s family. People could then change their answers in the retest. However, if the Kappa statistic was relatively low for many responses and a plausible explanation of this phenomenon is not found, one should carefully consider whether the respondents had difficulty in understanding the question.
41 While the WHO Multi-country Survey Study countries covered here included long face-to-face surveys in 10 countries, only 9 of these re-tested a proportion of their respondents. 42 Landis, J.R. and Koch G.G., 1977, The measurement of observer agreement for categorical data. Biometrics 33:159–174
120
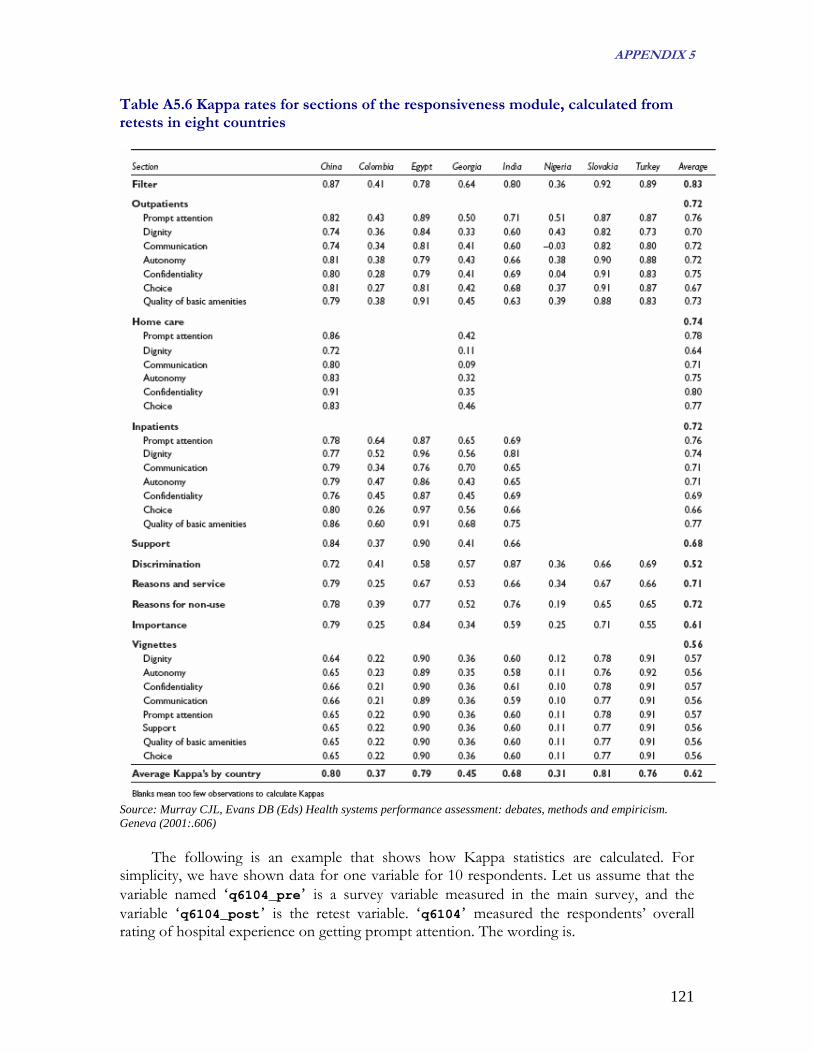
APPENDIX 5
Table A5.6 Kappa rates for sections of the responsiveness module, calculated from retests in eight countries
Source: Murray CJL, Evans DB (Eds) Health systems performance assessment: debates, methods and empiricism. Geneva (2001:.606)
The following is an example that shows how Kappa statistics are calculated. For simplicity, we have shown data for one variable for 10 respondents. Let us assume that the variable named ‘q6104_pre’ is a survey variable measured in the main survey, and the variable ‘q6104_post’ is the retest variable. ‘q6104’ measured the respondents’ overall rating of hospital experience on getting prompt attention. The wording is.
121

APPENDIX 5
Now, overall, how would you rate your experience of getting prompt attention at the health services in the last 12 months? 1 Very bad 2 Bad 3 Moderate 4 Good 5 Very good The hypothetical responses from the 10 respondents in the main survey and the retest are presented in the Table A5.7. In this example all respondents gave the same response in the retest. Table A5.7 Hypothetical example on test-retest reliability: listing results Respondent ID Response on the main survey
(q6104_pre) Response on the retest survey
(q6104_post) 1 Very good Very good 2 Very good Very good 3 Good Good 4 Good Good 5 Moderate Moderate 6 Moderate Moderate 7 Bad Bad 8 Bad Bad 9 Very bad Very bad 10 Very bad Very bad The above data can be reorganised and displayed as follows (Table A5.8). Table A5.8 Hypothetical example of test-retest reliability: a cross tabulation Response on main Response on retest survey (q6104_post) survey (q6104_pre) Very good Good Moderate Bad Very bad Row total Very good 2 0 0 0 0 2 Good 0 2 0 0 0 2 Moderate 0 0 2 0 0 2 Bad 0 0 0 2 0 2 Very Bad 0 0 0 0 2 2 Column total 2 2 2 2 2 10
As we can see, there was perfect concordance between the surveys (Table A5.7). When
there is a perfect concordance, the inter-rater reliability Kappa statistics has a value of 1. In Stata, if we type the commands: kap q6104_pre q6104_post, tab the following results will be displayed.
122
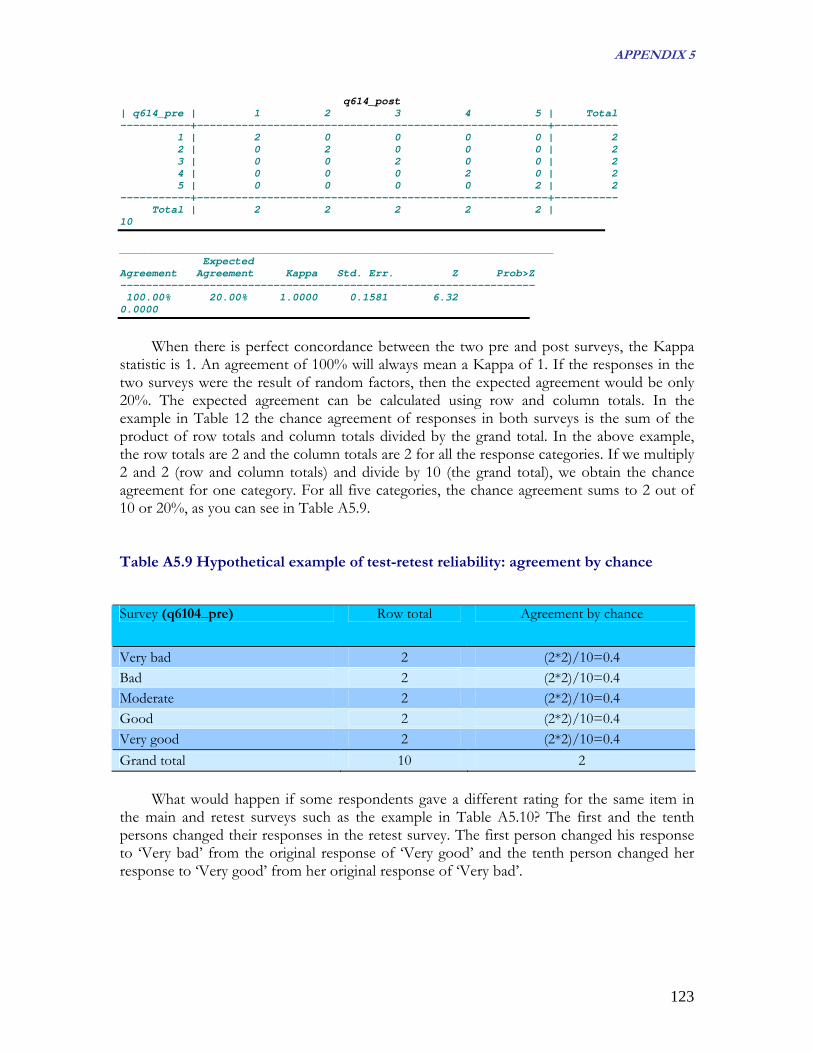
APPENDIX 5
q614_post | q614_pre | 1 2 3 4 5 | Total -----------+-------------------------------------------------------+---------- 1 | 2 0 0 0 0 | 2 2 | 0 2 0 0 0 | 2 3 | 0 0 2 0 0 | 2 4 | 0 0 0 2 0 | 2 5 | 0 0 0 0 2 | 2 -----------+-------------------------------------------------------+---------- Total | 2 2 2 2 2 | 10 ____________________________________________________________________ Expected Agreement Agreement Kappa Std. Err. Z Prob>Z ----------------------------------------------------------------- 100.00% 20.00% 1.0000 0.1581 6.32 0.0000
When there is perfect concordance between the two pre and post surveys, the Kappa
statistic is 1. An agreement of 100% will always mean a Kappa of 1. If the responses in the two surveys were the result of random factors, then the expected agreement would be only 20%. The expected agreement can be calculated using row and column totals. In the example in Table 12 the chance agreement of responses in both surveys is the sum of the product of row totals and column totals divided by the grand total. In the above example, the row totals are 2 and the column totals are 2 for all the response categories. If we multiply 2 and 2 (row and column totals) and divide by 10 (the grand total), we obtain the chance agreement for one category. For all five categories, the chance agreement sums to 2 out of 10 or 20%, as you can see in Table A5.9. Table A5.9 Hypothetical example of test-retest reliability: agreement by chance
Survey (q6104_pre) Row total Agreement by chance
Very bad 2 (2*2)/10=0.4 Bad 2 (2*2)/10=0.4 Moderate 2 (2*2)/10=0.4 Good 2 (2*2)/10=0.4 Very good 2 (2*2)/10=0.4 Grand total 10 2
What would happen if some respondents gave a different rating for the same item in the main and retest surveys such as the example in Table A5.10? The first and the tenth persons changed their responses in the retest survey. The first person changed his response to ‘Very bad’ from the original response of ‘Very good’ and the tenth person changed her response to ‘Very good’ from her original response of ‘Very bad’.
123

APPENDIX 5
Table A5.10 Hypothetical example of test-retest reliability: alternate results Respondent Id Response on the main survey
(q6104_pre) Response on the retest survey
(q6104_post) 1 Very good Very bad 2 Very good Very good 3 Good Good 4 Good Good 5 Moderate Moderate 6 Moderate Moderate 7 Bad Bad 8 Bad Bad 9 Very bad Very bad 10 Very bad Very good The above data can be reorganised as follows. Please note that the row and column totals remain unchanged. Table A5.11 Hypothetical example on test-retest reliability: cross tabulating alternate results
Response on main Response on retest survey (q6104_post)
survey (q6104_pre) Very good Good Moderate Bad Very bad Row total Very good 1 0 0 0 1 2 Good 0 2 0 0 0 2 Moderate 0 0 2 0 0 2 Bad 0 0 0 2 0 2 Very bad 1 0 0 0 1 2 Column total 2 2 2 2 2 10 The command for the Kappa statistic in Stata is: kap q6104_pre q6104_post, tab The results are as follows. _______________________________________________________________ | q614_post | q614_pre | 1 2 3 4 5 | Total -----------+-------------------------------------------------------+---------- 1 | 1 0 0 0 1 | 2 2 | 0 2 0 0 0 | 2 3 | 0 0 2 0 0 | 2 4 | 0 0 0 2 0 | 2 5 | 1 0 0 0 1 | 2 -----------+-------------------------------------------------------+---------- Total | 2 2 2 2 2 | 10 ____________________________________________________________________ Expected Agreement Agreement Kappa Std. Err. Z Prob>Z 80.00% 20.00% 0.7500 0.1581 4.74 0.0000
124

APPENDIX 5
As we can see, if only 2 out of 10 respondents change their response in the retest survey, the value of the Kappa statistic changes from a perfect score of 1 to 0.75. The Kappa statistic is calculated as follows.
Kappa ( )agreement) Expected(1
agreement Expected-agreement Observed−
=
Using the information from Table 11, where the observed agreement is 80% (8 out of
10), and the expected agreement is 20% (2 out of 10), we find a Kappa value of:
Kappa ( ))02.0(102.0-0.80
−= = 0.75
As explained earlier, the Kappa statistic ranges from 0 to 1. A value of 0 represents a
situation where the amount of agreement is no more than chance; a value of 1 represents a situation where there is perfect agreement in both surveys. Landis and Koch (1977)8 provide a guideline for interpreting ranges of Kappa values as follows.
Below 0.0 Poor 0.00–0.20 Slight 0.21–0.40 Fair 0.41–60 Moderate 0.61–0.80 Substantial 0.81–1.00 Almost Perfect
The Kappa statistic from our above example shows that the response agreement was substantial between the main survey and the retest.
A5.3 Feasibility
For a survey to be feasible, it has to actually work in the field. To measure it, we look at the response rates and the missing values of the MCSS instrument.
A5.3.1 Response Rates
Response rates should be maximised, as incomplete responses contribute to uncertainty
about the generalisability of the findings from the survey sample to the population from which the survey is drawn. In their analysis of 210 studies on patient satisfaction Sitzia & Wood (1998)43 conclude that there is no basis for establishing an ‘acceptable’ response rate. They found that the lowest response rate across all modes was 66% achieved for postal recruitment plus postal data collection. It should be noted that by definition former or current patients complete patient satisfaction surveys while the MCSS uses a whole population sampling approach which is likely to lead to lower response rates. 43 Sitzia, J. - Wood, N., 1998, Response rate in patient satisfaction research: an analysis of 210 published studies, Intl Journal for Quality in Health Care, vol 10, number 4: 311-17
125

APPENDIX 5
Let us look at the response rates per type of survey: the long face-to-face, household survey in Table A5.12, the short face-to-face survey in Table A5.13, and the postal survey in
able A5.14. T T able A5.12 Response rates, household survey, MCSS, 2000-2001
Country Response rate (%) China 99 Colombia 82 Egypt 99 Georgia 87 India 98 Indonesia 99 Mexico 96 Nigeria 98 Slovakia 84 Turkey 90 Average response rate for the long face-to-face survey 93 S ource: Murray CJL, Evans DB (Eds) Health systems performance assessment: debates, methods and empiricism. Geneva (2001:.783)
T able A5.13 Response rates, brief face-to-face survey, MCSS 2000-2001
Country Response rate (%) Argentina 36 Bahrain 35 Belgium 48 Bulgaria 88 Costa Rica 37 Croatia 68 Czech Republic 60 Estonia 71 Finland 52 France 77 Germany 80 Iceland 53 Ireland 39 Italy 61 Jordan 74 Latvia 53 Malta 63 Morocco 69 Netherlands 59 Oman 71 Portugal 61 Romania 52 Russian Federation 25 Spain 75 Sweden 53 United Arab Emirates 72 Venezuela 66 Average response rate for the brief face-to-survey 59 Source: Murray CJL, Evans DB (Eds) Health systems performance assessment: debates, methods and empiricism. Geneva (2001:.784)
126

APPENDIX 5
Table A5.14 Response rates, postal survey, MCSS, 2000-2001 Country Response rate (%) Australia 35 Austria 56 Canada 55 Chile 42 China 50 Cyprus 27 Czech Republic 40 Denmark 54 Egypt 92 Finland 54 France 31 Greece 35 Hungary 72 Indonesia 60 Kyrgyzstan 44 Lebanon 44 Lithuania 70 Netherlands 40 New Zealand 68 Poland 34 Rep. of Korea 24 Switzerland 38 Thailand 46 Trinidad & Tobago 52 Turkey 90 Ukraine 31 United Kingdom 40 USA 35 Average response for the postal survey 48 Source: Murray CJL, Evans DB (Eds) Health systems performance assessment: debates, methods and empiricism. Geneva (2001:.785)
As can be seen from the above Tables, response rates vary by modes of implementation, with long face-to-face household surveys reporting the highest overall response rates. Response rates greater than 90% are not very common, but we can observe that such response rates were achieved in some countries. The average response rate for the brief face-to-face surveys was close to 60% and postal surveys generated the average lowest response rate of 48%. It is beyond the scope of this manual to discuss aspects of differential response rates. What the above Tables show is that the MCSS instrument could be adapted readily to run in many countries using different survey modes. It should also be noted, however, that response rates vary across countries using the same mode. It is possible that a given mode could be better suited for some countries than others. Only Canada and Luxembourg carried out interviews using a Computer Assisted Telephone Interview (CATI) technique. Canada reported a response rate of 25% while Luxembourg achieved a response rate of 55%.
127

APPENDIX 5
A5.3.2 Missing Values
There are a number of reasons why data are missing from questionnaires: skip patterns may not be properly followed, filter questions may be inadequately administered, problems may arise with question wording or inaccurate data inputting. The assessment of this kind of problem is known as item missing analysis. Labarere (2001) suggested that the proportion of missing values should not be higher than 20%. WHO has pre-established a cut-off point of 20% for missing rates, meaning that any question that has a missing rate of 20% or more, becomes a problematic question. This means that whatever the reasons, if there is a missing rate 20% or greater for any question, it should not be used for further analysis without a thorough technical explanation. A5.3.2.1 Item missing values in the MCSS Responsiveness Module
A missing rate is defined as the percentage of non-responses to an item, refusals to
answer, and responses of “not applicable” and “don’t know” are recoded as missing. It could be argued that including these responses as missing will raise the missing rate without good reason. However, as a form of sensitivity analysis, missing rates were calculated with and without this recoding and the rates did not differ substantively.
When we applied the 20% cut off to all MCSS questions for all countries, we found that only two questions did not make the cut. The first problematic question (in fact, a series of questions, q6500 to q6510) was about the number of times respondents had used different types of providers in the last 30 days (general practitioner, specialist etc.). This question and its corresponding items had an average missing rate of 40%. Since the respondent had to answer by writing a number, it is difficult to know if a blank response is a missing value or a zero. The second problematic question asked women whether they felt they were treated badly by the health service. This question had a missing rate of 54%. A skip pattern problem could be the explanation here. When we exclude these items, the average unweighted missing rate across all items was 4%. Average item-missing rates for key responsiveness questions in the MCSS are provided in Table A5.15. Table A5.15 Average item missing values for responsiveness module across 65 surveys
Questionnaire Section Item Missing Rate (in %) Filter 6 Ambulatory care 3
Prompt Attention 3 Dignity 1 Communication 1 Autonomy 3 Confidentiality 7 Choice 9 Quality Basic Amenities 1
Home care 6 Prompt Attention 5 Dignity 6
128

APPENDIX 5
Communication 6 Autonomy 5 Confidentiality 7 Choice 5
Hospital inpatient care 5 Prompt Attention 3 Dignity 3 Communication 3 Autonomy 4 Confidentiality 9 Choice 8 Quality of Basic Amenities 4
Social support 4 Discrimination 8 Reason and Services 18 Non-utilisation 5 Importance 12 All Vignettes 3 Set A
Dignity 3 Communication 3
Set B Confidentiality 3 Quality of Basic Amenities 3
Set C Social Support 4 Choice 4
Set D Autonomy 3 Prompt Attention 3
Source: Murray CJL, Evans DB (Eds) Health systems performance assessment: debates, methods and empiricism. Geneva (2001:.603)
At the country level you should check if there are any variables with missing rates of 20% or more. If you find some, can you explain why? Could it be that skip patterns were misunderstood because respondents did not comprehend the filtering question properly? Open ended questions often have a very high rate of missing responses. As an example let us take a question seeking the name of the facility or provider that the respondent last visited. The difficulty with this question is that the respondent might have forgotten the name of the facility or provider, or might have felt uncomfortable about giving it. However, you should note that this question was included for technical reasons, namely to enable subsequent grouping of the providers by public and private sectors, and for developing a proposed sampling frame for a representative facility survey.
In the vignette section, the average missing rate was 3%. Performance across the vignettes is similar, regardless of the domain. This is a promising indication of the feasibility of using vignettes in household surveys, even when questionnaires are self-administered, or when they are administered to people with different cultural and educational backgrounds.
129

APPENDIX 5
Country AverageTurkey-postal 20%Ukraine-postal 18%Trinidad and Tobago-postal 18%Great Britain- postal 17%Austria-postal 16%Hungary-postal 15%Kyrgyzstan-postal 13%Chile-postal 12%Ireland-brief 12%USA-postal 11%United Arab Emirates-brief 10%Thailand-postal 9%France-postal 9%Turkey-long 8%Denmark-postal 7%Colombia-long 7%Egypt-long 7%Italy-brief 6%Slovakia-long 6%Greece-postal 6%Netherlands-postal 5%Poland-brief 5%New Zealand-postal 5%Finland-postal 5%Czech Republic-postal 5%Cyprus-brief 5%Mexico-long 5%Jordan-brief 5%Indonesia-postal 4%Bahrain-brief 4%Sweden-brief 4%Lithuania-postal 4%Croatia-brief 4%Canada-postal 3%Bulgaria-brief 3%Finland-brief 3%China-postal 3%Portugal-brief 3%Romania-brief 3%Iceland-brief 3%Russia-brief 3%Morocco-brief 2%Latvia-brief 2%Luxembourg-telephone 2%India-long 2%France-brief 2%Republic of Korea-postal 2%Egypt-postal 2%Estonia-brief 2%Canada-telephone 2%China-long 2%Oman-brief 2%Indonesia-long 2%Argentina-brief 2%Netherlands-brief 2%Belgium-brief 1%Costa Rica-brief 1%Nigeria-long 1%Spain-brief 1%Georgia-long 1%Malta-brief 1%Average 6%
The analysis showed that, except for two questions, the responsiveness module met the pre-set criteria for a missing rate of less than 20%. The two questions not meeting these criteria did so for technical reasons amenable to correction in future survey rounds. In addition, these items were not crucial to responsiveness analyses, being included for broader crosschecks within the questionnaire. Table A5.16 Item missing values and survey modes by country MCSS, 2001 Source: Murray CJL, Evans DB (Eds) Health systems performance assessment: debates, methods and empiricism. Geneva (2001:.604) A5.3.2.2 Average country missing values
Table A4.16 shows the ranked item missing
values for different survey modes by country. Five countries not include in the Table exceeded the 20% cut-off: Lebanon (54%), Switzerland (30%) Germany (28%), Czech Republic short-form (21%) and Venezuela (21%). On investigation, detailed analysis revealed technical failures as the single reason for these higher rates: text or coding problems with the vignettes for Lebanon, Germany, Czech Republic and Venezuela) and with the hospital inpatient care and discrimination section for Switzerland. Excluding these countries, the average unweighted missing rate across all countries and survey modes was 6%. A5.3.2.3 Missing values analysis using your own country data
The data we provided in the preceding section relate to the average missing values across countries. To assess how items are missing at the country level, we have again used Australian data as an example. To analyse missing data, we use Stata’s command codebook. It is a very useful command and can be used to generate a data dictionary, to analyse missing values and to calculate summary statistics such as mean, standard deviation, and percentiles (if the variables are categorical, then a table is presented). Although the codebook command has many options, we only use option mv for this purpose. Option mv requests a report on the pattern of missing values in the data. Apart
130

APPENDIX 5
from the codebook command we are also offering you the part of Stata do file that compute the missing values remembering the necessary skips for the responsiveness module. As an example let’s look at two variables and interpret the results (using command codebook) country iso 3-digit country code ----------------------------------------------------------------------------------------- type: string (str4) unique values: 1 missing "": 0/1587 tabulation: Freq. Value
1587 "AUSP"
------------------------------------------------------------------------------------------------------------
The first variable in the data set is country. The label to this variable is iso 3-digit country code. The description of this variable type is: type: string (str4). This means that the variable is a string variable, as opposed to numeric, with a length of 4 bytes. Since we have used Australian data, all the cases in the data have one value "AUSP". There are no missing values for that question (missing "": 0/1587), and there is only one observed value of country (unique values: 1). The tabulation of this variable is shown as: tabulation: Freq. Value
1587 "AUSP" This means that there are 1587 cases in the data set, and all 1587 have a value of AUSP. The second presented variable is q6113 related to the dignity domain. ----------------------------------------------------------------------------------------- q6113 rate your experience of getting treated with dignity in last 12 months ----------------------------------------------------------------------------------------- type: numeric (byte) label: q6113 range: [1,5] units: 1 unique values: 5 missing .: 433/1587 tabulation: Freq. Numeric Label 1 1 very bad 5 2 bad 32 3 moderate 263 4 good 853 5 very good 433 . missing values: q6000==mv --> q6113==mv q6001==mv --> q6113==mv q6110==mv <-> q6113==mv q6300==mv --> q6113==mv
The variable q6113 is labelled rate your experience of getting treated with dignity in last 12 months, the variable is numeric, and the values range from 1 (very bad) to 5 (very good). There are 433 cases with missing values for this variable. The pattern of missing values shows that whenever q6113 is missing, q1002 is also missing. The
131

APPENDIX 5
missing rate for this variable (27.28%) is over the 20% cut-off value. We need to further explore why this particular variable has very high missing rates. When we look at the survey instrument we find that there are two questions earlier in the instrument which are filters. Respondents are only required to answer q6113 and rate their experience of getting treated with dignity in the last 12 months if they received any health care in the last 12 months. There are three questions (q6000, q6001 and q6002) which may direct the respondents to skip questions about experiences with health care. That means if a respondent answers ‘No’ to these questions, he/she skips all the questions in the section related to ambulatory care health system responsiveness and thus we will have missing values for q6113.
If we only looked at the missing rate without taking into account the skip pattern we might have decided that the values for variable q6113 were unreliable and cannot be used in the subsequent analysis. However, when we take into account the missing rates among respondents who answered ‘yes’ to q6001 (a filtering question) we find that there were no missing values at all. Let us examine the cross-tabulation of q6001 and q6113 to see what is actually happening with the missing rates.
The command tabulate q6001 q6113, missing generates the following cross-tabulation (Table A5.17). Table A5.17 Missing values analysis for q6113, Australia did you | get any | health | care at an | outpatient | facility | or did a | rate your experience of getting treated with dignity in last 12 months health | care provi | q6001 very bad bad moderate good very good . | Total -----------+------------------------------------------------------------------+---------- yes | 1 5 32 263 851 1 | 1,153 no | 0 0 0 0 2 246 | 248 . | 0 0 0 0 0 186 | 186 -----------+------------------------------------------------------------------+---------- Total | 1 5 32 263 853 433 | 1,587
The cross - tabulation confirms the number of missing values (433). However, the
cross-tabulation also shows that of the 433 cases that did not have valid values for q6113, 186 had a missing value for q6001. This suggests that the filtering question q6001 directed these 186 cases to another section of the instrument. The 248 cases who did not receive any ambulatory health care in the past 12 months could not rate their experiences of getting treated with dignity. Only 1 person who did receive ambulatory health care in the past 12 months failed to provide any valid values. Therefore, the actual number of cases with missing values is 1 or 0.09%. You can obtain the same result just by typing the next Stata command: tabmiss q6113 if q6001==1
When you are analysing missing values, make sure that you carefully check the responses to any filtering questions.
132
APPENDIX 5
A5.4 Psychometric properties of other survey instruments
Before making any concluding remarks about the psychometric properties of the MCSS responsiveness module, we present published psychometric results for other instruments measuring patient satisfaction (13 surveys) or health related quality care (4 surveys). These surveys were identified through a literature review of Pubmed and ISI Web of Knowledge databases between September and November 2004, with the following search criteria: key words – patient (or client, consumer, health) satisfaction, satisfaction survey (or instrument, questionnaire), responsiveness, quality of health (of instrument), psychometric test (or result, method, properties), validity, reliability, feasibility and we used the combination of mentioned key words. We have selected only surveys which measured health or patient satisfaction using “self-reports” and validated the quality of designed instrument.
Table A5.18 describes the studies and survey instruments identified for comparison with the MCSS responsiveness module. Most of the comparison studies used patient satisfaction questionnaires, although some studies using health-related quality of life questionnaires were also included for comparison purposes, given the longer tradition in the assessment of health-related quality of life.
Hagen (2003) examined the quality of SF-36 items instrument in patients in the early post stroke period. Survey was conducted only in Scotland and involved 153 patients. The questionnaire covered 8 domains (general health, physical functioning, role physical, bodily pain, vitality, social functioning, role emotional and mental health). As you might observe, the domain names are not similar to domain names used in the MCSS. Hagen's survey focused on health related quality of life.
Also Blazeby's (2004) article on 22 items questionnaire (QLQ-STO 22) focused on gastric cancer patients' perception on the quality of life. Study involved 267 patient undergoing treatment in 8 countries. Instrument consisted of 5 scales (or domains, eating restriction, anxiety, dysphagia, pain and reflux) and three single items.
McGuiness (2003) described 32 items instrument that surveyed 1193 individuals in Australia, the aim was to describe the development and validation of self-administered questionnaire focused on patient satisfaction. The instrument consisted of six domains addressed across four structurally distinct sections - overall care, GP care, nominated provider care and carers. While domain names differ from the MCSS domain names, from the questionnaire item wording it is clear that they cover the domains of prompt attention, clear communication and autonomy used in the MCSS. Apart from the MCSS, McGuiness involved domain carers.
French hospital inpatient satisfaction questionnaire (Labarere (2001)) surveyed 1000
patients using 93 items instrument. The questionnaire covered 17 topics, from which quality basic amenities, clear communication, prompt attention, dignity, access to social support networks are common to the MCSS responsiveness module. Labarere mentioned the instrument also included the pain management domain.
133

APPENDIX 5
Li (2003) article focused on the Chinese version of SF-36 for use in health related quality of life measurement. The survey involved 1688 respondents and the instrument covered 8 dimensions of health - physical functioning, role limitations due to physical problems, bodily pain, general health, vitality, social functioning, role limitations due to emotional problems, mental health and one single item on health transition.
Verho (2003) objective was to test and validate patients' relative perception of the quality of geriatric care. Survey was conducted in Sweden using 44 items instrument and collecting information about nursing staff, caring processes, activity, contact, social support, participation and work environment. From items wording we can conclude the instrument covers domains clear communication, quality basic amenities, access to social support networks, autonomy and dignity named in the MCSS. 356 respondents answered the questionnaire.
Cross-cultural evaluation of the health related quality of life questionnaire (focused on Parkinson's disease) was done in Jenkinson (2003) article. Five states (USA, Canada, Spain, Italy and Japan) were surveyed using 39 item questionnaire that measured subjective functioning and well-being of 676 respondents. Eight domains - mobility, activities of daily living, emotional well-being, stigma, social support, cognitions, communication, and bodily discomfort were covered.
The next one survey described in Jenkinson (2002) article was conducted in 5 countries (UK, Germany, Sweden, Switzerland and USA) and 62 925 questionnaires returned. The survey instrument covered 15 items comprising of clear communication, autonomy, dignity, access to social support networks, and also questions about the pain control were included.
20 items scale instrument focused on people's perceptions of the quality of primary health care services in developing countries was administered in Upper Guinea (Haddad, 1998). Survey instrument included three subscales related to health care delivery, personnel and facilities. They surveyed 241 people. The questionnaire covered the same domains as in the MCSS - access to social support networks, dignity, clear communication and quality basic amenities. The instrument differs mainly in questions related to personnel.
Haddad (2000) article described 22 items instrument grouped into three subscales referring to the patient - physician relationship, the technical aspects of care and the outcome of the visit. The instrument covered the following domains common to the MCSS - dignity, clear communication and prompt attention, differed mainly in outcome (items such as motivation to follow treatment or return to routine activities) or evaluation of the patient - physician relationship. The survey was conducted in Canada on 473 patients.
The next patient satisfaction survey (Westaway, 2003) was conducted on 263 diabetic patients in South Africa. The instrument covered 25 items that measured provider characteristics and service characteristics. Common domains to the MCSS included - dignity, clear communication, prompt attention, quality basic amenities, access to social support network and confidentiality.
Gigantesco (2003) article described 10 items questionnaire administered to 169 hospital
inpatients covering 10 aspects of care (such as staff availability and quality, information
134

APPENDIX 5
received and physical environment). Two domains - clear communication and quality basic amenities are common to the MCSS. The patient satisfaction instrument was implemented only in Italy.
Paddock (2000) article dealt with 87 items questionnaire organized in 3 sections - patient satisfaction, behavioural change and global satisfaction, the first, 73 items referred to patient's satisfaction. Patient satisfaction part consisted of 14 domains - physical activity, nutrition, glucose monitoring, program amenities, staff, meetings, information taught, acute complication, severe complication, time commitment, conveniences, general program, follow up and treatment. Domains quality basic amenities, dignity, clear communication and prompt attention can be identified from this questionnaire, apart from the MCSS the instrument added items related to patient satisfaction with diabetes management. 242 questionnaires returned and the survey was conducted in the USA.
57 items patient satisfaction instrument addressing 13 aspects of care was administered in the Netherlands - outpatients' clinic, admission procedures, nursing care, medical care, information, patient autonomy, emotional support, quality basic amenities, recreation facilities, miscellaneous aspects, prompt attention, discharge and aftercare (Hendriks, 2002). 275 patients and 83 staff members completed the instrument.
In France (Salomon, 1999), 534 patients completed 59 items patient satisfaction instrument that measured different aspects of health care such as medical practice, information, respect for patients, psychological and social support, staff support, continuity and co-ordination of care and discharge management. The instrument focused on interpersonal aspects of medical and nursing care rather than on non-medical issues (such as quality basic amenities).
Steine (2001) article described an 18 item instrument consisting of five dimensions - communication, emotions, short term outcome, barriers and relation with the auxiliary staff. The questionnaire emphasized interaction, emotions and outcome. Survey was administered on 1092 patients in Norway.
A 27 item questionnaire (or 9 item short version) comprising 4 subscales (appointment making, reception facilities, waiting time and consultation with the doctor) was conducted in France on 248 patients (Gasquet, 2004). The instrument measured patient satisfaction with hospital care. Prompt attention, clear communication, dignity, autonomy and quality basic amenities were common with the MCSS.
Just for comparison, the MCSS instrument consisted of 126 items (extended form) or 87 items (short form). The instrument was administered in 71 countries (70 completed responsiveness module) and covered 8 domains of responsiveness: autonomy, choice of health care provider, clear communication, confidentiality, dignity, prompt attention, quality basic amenities and access to social support networks. Responsiveness module of the MCSS instrument was completed by 141570 respondents.
135

APPENDIX 5
Table A5.18 Summary of the surveys used for comparison of psychometric properties with the MCSS
Reference
Survey focus
Number of respondents/ number of surveyed countries
1
S Hagen, C Bugge, and H Alexander: Psychometric properties of the SF-36 in the early post-stroke phase. J Adv Nurs, Dec 2003; 44(5): 461-8.
health related quality of life instrument 153/1
2
JM Blazeby, T Conroy, A Bottomley, C Vickery, J Arraras, O Sezer, J Moore, M Koller, NS Turhal, R Stuart, E Van Cutsem, S D'haese, C Coens, and On behalf of the European Organisation for Research and Treatment of Cancer Gastrointestinal and Quality of Life Groups Clinical and psychometric validation of a questionnaire module, the EORTC QLQ-STO 22, to assess quality of life in patients with gastric cancer. Eur J Cancer, Oct 2004; 40(15): 2260-8
health related quality of life instrument
267/8
3
C McGuiness and B Sibthorpe: Development and initial validation of a measure of coordination of health care. Int. J. Qual. Health Care, Aug 2003; 15: 309 - 318.
patient satisfaction instrument 1193/1
4
J Labarere, P Francois, P Auquier, C Robert, and Fourny: Development of a French inpatient satisfaction questionnaire. Int. J. Qual. Health Care, Apr 2001; 13: 99 - 108.
patient satisfaction instrument
1000/1
5
L Li, H M Wang, Y Shen: Chinese SF-36 Health Survey: translation, cultural adaptation, validation, and normalisation. J Epidemiol Community Health. 2003 Apr; 57(4):259-63.
health related quality of life instrument 1688/1
6
H Verho and J E Arnetz: Validation and application of an instrument for measuring patient relatives’ perception of quality of geriatric care Int. J. Qual. Health Care, May 2003; 15: 197 - 206.
patient satisfaction instrument 356/1
7
C Jenkinson, R Fitzpatrick, J Norquist, L Findley, and K Hughes: Cross-cultural evaluation of the Parkinson's Disease Questionnaire: tests of data quality, score reliability, response rate, and scaling assumptions in the United States, Canada, Japan, Italy, and Spain. J Clin Epidemiol, Sep 2003; 56(9): 843-7.
health related quality of life instrument 676/5
8
C Jenkinson, A Coulter, and S Bruster: The Picker Patient Experience Questionnaire: development and validation using data from in-patient surveys in five countries Int. J. Qual. Health Care, Oct 2002; 14: 353 - 358.
patient satisfaction instrument 62925/5
136

APPENDIX 5
9
S Haddad, P Fournier, and L Potvin: Measuring lay people's perceptions of the quality of primary health care services in developing countries. Validation of a 20-item scale. Int. J. Qual. Health Care, Apr 1998; 10: 93 - 104.
patient satisfaction instrument 241/1
10
S Haddad, L Potvin, D Roberge, R Pineault, and M Remondin: Patient perception of quality following a visit to a doctor in a primary care unit. Fam. Pract., Feb 2000; 17: 21 - 29.
patient satisfaction instrument 473/1
11
M S Westway, P Rheeder, D G Van Zyl, and J R Seager: Interpersonal and organizational dimensions of patient satisfaction: the moderating effects of health status. Int. J. Qual. Health Care, Aug 2003; 15: 337 - 344.
patient satisfaction instrument 263/1
12
A Gigantesco, P. Morosini, and A. Bazzoni: Quality of psychiatric care: validation of an instrument for measuring inpatient opinion. Int. J. Qual. Health Care, Feb 2003; 15: 73 - 78.
patient satisfaction instrument 169/1
13
LE Paddock, J Veloski, ML Chatterton, FO Gevirtz, and DB Nash: Development and validation of a questionnaire to evaluate patient satisfaction with diabetes disease management. Diabetes Care, Jul 2000; 23: 951 - 956.
patient satisfaction instrument 242/1
14
J Hendriks, F J Oort, M R Vrielink, and E M A Smets: Reliability and validity of the Satisfaction with Hospital Care Questionnaire. Int. J. Qual. Health Care, Dec 2002; 14: 471 – 482
patient satisfaction instrument 275/1
15
L Salomon, I Gasquet, M Mesbah, and P Ravaud: Construction of a scale measuring inpatients' opinion on quality of care. Int. J. Qual. Health Care, Dec 1999; 11: 507 - 516.
patient satisfaction instrument 543/1
16
S Steine, A Finset, E Laerum: A new, brief questionnaire (PEQ) developed in primary health care for measuring patients' experience of interaction, emotion and consultation outcome. Fam Pract. 2001 Aug; 18(4):410-8.
patient satisfaction instrument 1092/1
17
I Gasquet, S Villeminot, C Estaquio, P Durieux, P Ravaud, B Falissard:Construction of a questionnaire measuring outpatients' opinion of quality of hospital consultation departments. Health Qual Life Outcomes. 2004 Aug 04;2(1):43.
patient satisfaction instrument 248/1
All instruments, regardless of what they measure, must demonstrate good performance
with regard to psychometric properties. Over the years, broad standards of what constitute “good performance” have been developed for survey instruments asking for self-reports. Indeed, the evaluation of the MCSS adds to that body of knowledge. In general, criteria and standards in psychometrics are not articulated as black and white rules, but tendencies or ranges within which you would expect certain indicators to fall if the questionnaire is operating correctly.
137

APPENDIX 5
There is no strict limit on which and on how many tests to use to prove the quality of the instrument. Nevertheless, most of the reviewed literature used the same set of tests and vary only in the number of tests used according to which psychometric areas were tested. Table A5.19 presents the test results used to evaluate the psychometric properties of the survey instruments used in the 17 studies listed in Table A5.18. Validity. Validity is concerned with the extent to which an instrument actually measures what it is supposed to measure. Construct validity was the main interest for this guideline, as it is the extent to which a new measure is related to specific variables in accordance with a hypothetical construct. Measurement of construct validity involves a statistical evaluation of survey data by computing how highly the items are correlated. It is usually assessed by analysing factor loading, e.g. Principal Component Analysis (PCA) factor loadings (8 surveys tested construct validity using those statistics that explained at least 42.3% of variance) or using the factor analysis (six studies used this technique, explained at least 50% of variance) to confirm if various questions could be summarised into a single score. Confirmatory Factor Analysis (CFA) was computed in one survey and two surveys mentioned they used Exploratory Factor Analysis (EFA). 3 surveys also tested the concurrent validity using analysis of variance (ANOVA). Reliability. Reliability is a statistical measure that tells us how reproducible the data from a survey instrument is. It is concerned with the consistency of the measurement, the degree to which an instrument measures the same way each time it is used under the same conditions with the same respondents. There are many forms of reliability, the guidelines focused on test-retest reliability. Test-retest reliability estimates the error component when there is repetition of a measurement by computing Kappa statistics for categorical and intra-class correlation coefficient for continuous variables within and across populations. Some of the surveys tested the reliability of instrument by test – retest statistics and the Kappa value. It was reported in 7 of 17 surveys. Kappa ranged from 0.32 to 1 across all surveys. Internal Consistency (reliability). According to the literature review all studies tested internal consistency using Cronbach's alpha, which measures overall correlation between items in a scale. It measures how well a set of items represent a single unidimensional latent construct. Cronbach’s alpha is more a coefficient of reliability than a statistical test. That means the higher the coefficient, the higher is the unidimensionality of the items. Cronbach's alpha ranged from 0.13 to 0.96 across reviewed surveys. Internal consistency can be also determined by computing the item total correlation, and most of the reviewed studies have reported the correlation coefficient (ranged from 0.22 to 0.95). Feasibility. Feasibility, or how the survey instrument works in the field, was specified by response rates in 15 surveys (ranged from 34.10% to 97%) and missing rates noted in 9 surveys (from 0% to 14.8%).
138
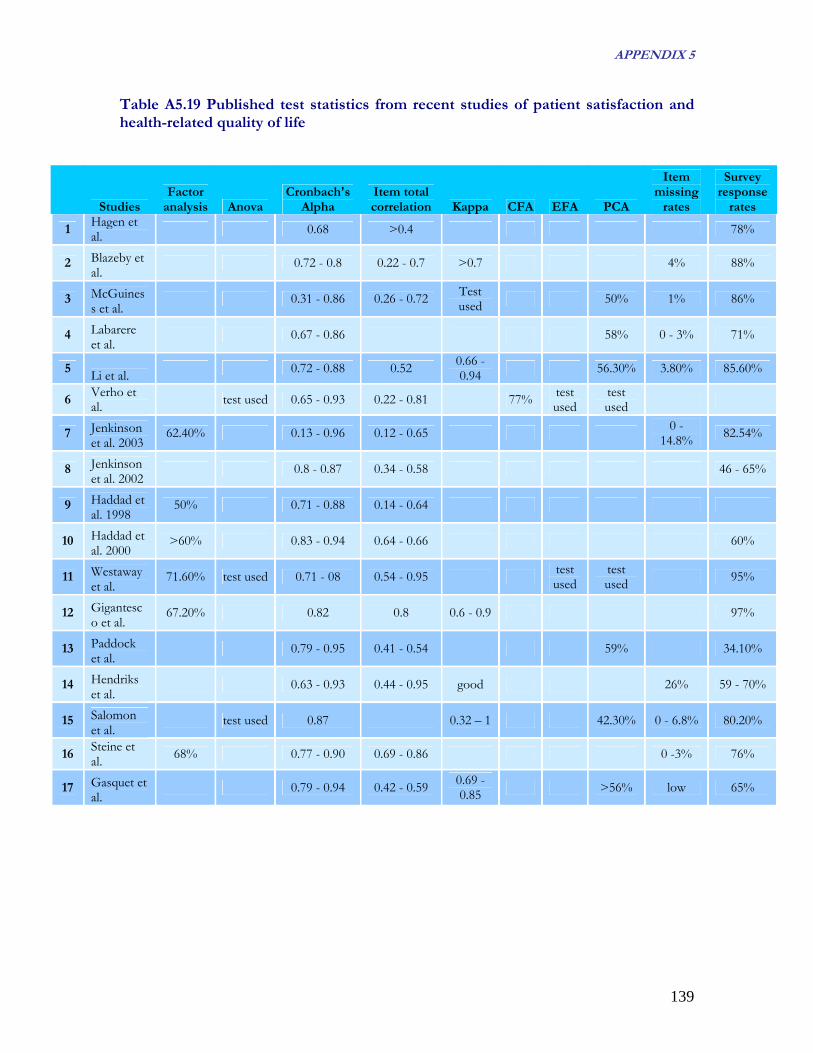
APPENDIX 5
Table A5.19 Published test statistics from recent studies of patient satisfaction and health-related quality of life
Studies Factor
analysis Anova Cronbach's
Alpha Item total correlation Kappa CFA EFA PCA
Item missing
rates
Survey response
rates
1 Hagen et al. 0.68 >0.4 78%
2 Blazeby et al.
0.72 - 0.8 0.22 - 0.7 >0.7 4% 88%
3 McGuiness et al.
0.31 - 0.86 0.26 - 0.72 Test used 50% 1% 86%
4 Labarere et al.
0.67 - 0.86 58% 0 - 3% 71%
5 Li et al. 0.72 - 0.88 0.52 0.66 - 0.94 56.30% 3.80% 85.60%
6 Verho et al. test used 0.65 - 0.93 0.22 - 0.81 77% test
used test used
7 Jenkinson et al. 2003
62.40% 0.13 - 0.96 0.12 - 0.65 0 - 14.8% 82.54%
8 Jenkinson et al. 2002
0.8 - 0.87 0.34 - 0.58 46 - 65%
9 Haddad et al. 1998
50% 0.71 - 0.88 0.14 - 0.64
10 Haddad et al. 2000
>60% 0.83 - 0.94 0.64 - 0.66 60%
11 Westaway et al.
71.60% test used 0.71 - 08 0.54 - 0.95 test used
test used 95%
12 Gigantesco et al.
67.20% 0.82 0.8 0.6 - 0.9 97%
13 Paddock et al.
0.79 - 0.95 0.41 - 0.54 59% 34.10%
14 Hendriks et al.
0.63 - 0.93 0.44 - 0.95 good 26% 59 - 70%
15 Salomon et al.
test used 0.87 0.32 – 1 42.30% 0 - 6.8% 80.20%
16 Steine et al. 68% 0.77 - 0.90 0.69 - 0.86 0 -3% 76%
17 Gasquet et al.
0.79 - 0.94 0.42 - 0.59 0.69 - 0.85 >56% low 65%
139

APPENDIX 5
140
A5.5 Concluding remarks on the Psychometric properties of the MCSS Responsiveness Module
On average, psychometric tests results for the MCSS responsiveness module and survey are fairly consistent with those used in comparable surveys. Table A5.20 summarizes a range of psychometrics tests and the criterion values used for test statistics in those papers. However the variance in psychometric properties across countries is wide. In a few countries in particular the questionnaire performed poorly. This indicates that while the WHO MCSS Responsiveness Module made a bold start in the right direction, there is possibly a need to further develop the question items in local contexts. Table A5.20 Threshold/Criterion values used for Psychometric Tests
Psychometric property
Test statistic
Threshold/criterion
values used in other studies
No. of studies using
threshold
MCSS test statistics (range across
countries)
MCSS test statistics (total or average across
countries)
Validity Factor analysis no strict cut off 0.302-
0.943* 0.8105*
0.6
1
0.226 - 0.898* 0.7531*
0.7 8
Internal consistency reliability
Cronbach's Alpha
0.8 3
Internal consistency
reliability and a weak
measure of content validity
Item total correlation
0.4
10
0.127-0.786* 0.559*
0.6
2
0.43 - 0.87 0.67 Test-retest
(temporal) reliability
Kappa 0.7 1
Feasibility Item missing
rates 20% 1 1% - 54% 6%
Survey response
rates 30%
1 24% - 99% 58.5%
Source: Murray CJL, Evans DB (Eds) Health systems performance assessment: debates, methods and empiricism. Geneva: WHO, p.597-796, results from 65 surveyed countries *responsiveness questions (hospital inpatient and ambulatory care only.

141
0
10
20
30
40Prompt Attention
Dignity
Communication
AutonomyConfidentiality
Choice
Basic Amenities
Ambulatory care Hospital inpatient care
Health System Responsiveness SAMPLE REPORT (2001)
DISCLAIMER: Note that these results are descriptive results for the samples collected in the household surveys of the WHO Multi-country Survey Study of Health and Health Systems Responsiveness (Brief survey, N=803). They are not representative for the country as sampling weights were not used. The WHO World Health Survey, which contained a second iteration of the responsiveness questions, did collect information on sampling weights. Responsiveness reports for these surveys will be made available later in 2005. The aim of this descriptive report of the MCSS samples is to give a flavour of the kinds of responsiveness analyses that are feasible; and to stimulate interest ahead of the release of the World Health Survey Responsiveness reports. These reports are aimed at policy-makers -to give them an overview of health system responsiveness.
I. Perceptions of Responsiveness in Ambulatory Care and Hospital Inpatient Care
HOSPITAL INPATIENT CARE (n=97): 22% of patients reported poor responsiveness in hospital inpatient care. The best performing domains were basic amenities (13%) and social support (14%). The worst performing domains were choice (30%), and autonomy (27%). AMBULATORY CARE (n=368): 25% of patients reported poor responsiveness in ambulatory care. The best performing domains were dignity (17%) and confidentiality (19%). The worst performing domains were autonomy (32%), and choice (30%).
COMPARING RESPONSIVENESS RESULTS: From the figure (on the left), we can see that ambulatory care responsiveness was rated worse than hospital inpatient care for the domains of prompt attention, communication, autonomy and basic amenities. Responsiveness in hospital inpatient care was rated worse than that in ambulatory care for dignity. Differences were most pronounced for basic amenities (10%) which was worse in ambulatory care, and for dignity (6%), which was worse in inpatient care.
II. Perceptions of Responsiveness by Vulnerable Groups
Label in Graphs Question handles
Dignity Respectful treatment
Autonomy Involvement in decision making
Confidentiality Confidentiality of personal information
Communication Listening, enough time for questions, clear explanations
Prompt attention Convenient travel and short waiting times
Social support In hospital: visits, having special foods, religious practice
Quality basic amenities Cleanliness, space, air
Choice Seeing a provider you were happy with
Hospital Inpatient
Ambulatory Care
means worsemeans worse
Percentage rating responsiveness as poor
RES
PON
SIV
ENES
S

RESPONSIVENESS TO VULNERABLE GROUPS: Without specific efforts to accommodate and gear services towards vulnerable groups, we would expect vulnerable groups, especially those forming minorities, to have worse responsiveness. In general, all vulnerable groups, except for the elderly, reported worse responsiveness. The literature shows that elderly populations are more positive raters, and are generally more satisfied with any given level of care compared with other groups.
In INPATIENT SETTINGS, the poor and people in bad health rated responsiveness worse on all domains. Females reported worse responsiveness on all domains except confidentiality and choice. In AMBULATORY CARE SETTINGS, the elderly reported better responsiveness on all domains.
III. Differences in Perceptions of Responsiveness along the Education Gradient
These graphs look at variations in perceptions of responsiveness for people with different years of education. In general, along the education gradient, there are larger differences in responsiveness in ambulatory settings than in inpatient care settings.
For domains, dignity and confidentiality show the least differences across the education gradient, while choice shows the largest difference on average.
IV. Variations in Perceptions of Responsiveness by Sex and Health Status
The above graphs look at variations in perceptions of responsiveness by sex and self-reported health. In general, all people in bad health are more likely to rate responsiveness poorly for all domains. Related to sex, females in good health are in general the most positive raters of responsiveness.
For domains, the biggest difference between the sick and the healthy were for the domains of confidentiality and autonomy, while the smallest differences were for basic amenities.
142

143
V. Perceived Financial Barriers and Discrimination
BARRIERS TO CARE: In Sample Country, 16% of the surveyed population reported not seeking care due to unaffordability. There are also substantial differences across various population sub-groups in these results. For instance, 24% of people in the lowest income quintile (Q1) report not using health care due to unaffordability while 9% of people in the highest income quintile (Q5) report the same. Older people (60+ years) were also more likely not to seek care as they were unable to afford it.
DISCRIMINATION: Nearly 22% of surveyed respondents reported discrimination of some sort by the health system. The most common causes of discrimination were lack of wealth (11%), social class (10%), lack of private insurance (7%), sex (4%) and health status (4%). Relatively few people (less than 1% of those queried) reported discrimination due to ethnicity, political/other beliefs or other reasons.
VI. Importance of Responsiveness Domains
Percentage of respondents rating a responsiveness domain to be most important
Prompt Attention
41%
Dignity36%
Communication9%
Social Support0%
Confidentiality5%
Autonomy3%
Basic Amenities2%
Choice4%
IMPORTANCE: Survey respondents in Sample Country consider prompt attention to be the most important responsiveness domain (41%) followed by dignity (36%). However, dignity was rated more important than prompt attention by older people (60+ years) and people in the middle income quintile (Q3). IMPORTANCE AND PERFORMANCE: We can compare the health systems performance in the different domains of responsiveness with the importance of these domains to the population. In the figure on the right (above), the percentage of respondents rating a domain as most important has been rescaled to a 0-1 interval with "1" representing the relatively most important domain and "0" the relatively least important one. Prompt attention and communication were regarded as important domains but can be seen to be relatively poor performing. Although autonomy and choice were the worst performing domains on the whole, they were not considered to be important by the people. Dignity, the second most important, is seen to be performing relatively well.
Percentage of respondents who did not seek care due to unaffordability


