Embed Size (px)
Citation preview
The Health of Staten Island and New York City
Thomas R. Frieden, M.D., M.P.H.Commissioner, New York City
Department of Health and Mental HygieneApril 24, 2003
Community Health Survey
• First ever NYC health survey– 10,000 New Yorkers interviewed on health status
and lifestyle– Largest survey of its kind ever in NYC
• Data reported and broken down into many different categories– More than just traditional demographic information
(sex, age, ethnicity)
• Detail will allow us to target services at the community level on a neighborhood-by-neighborhood basis, as needed
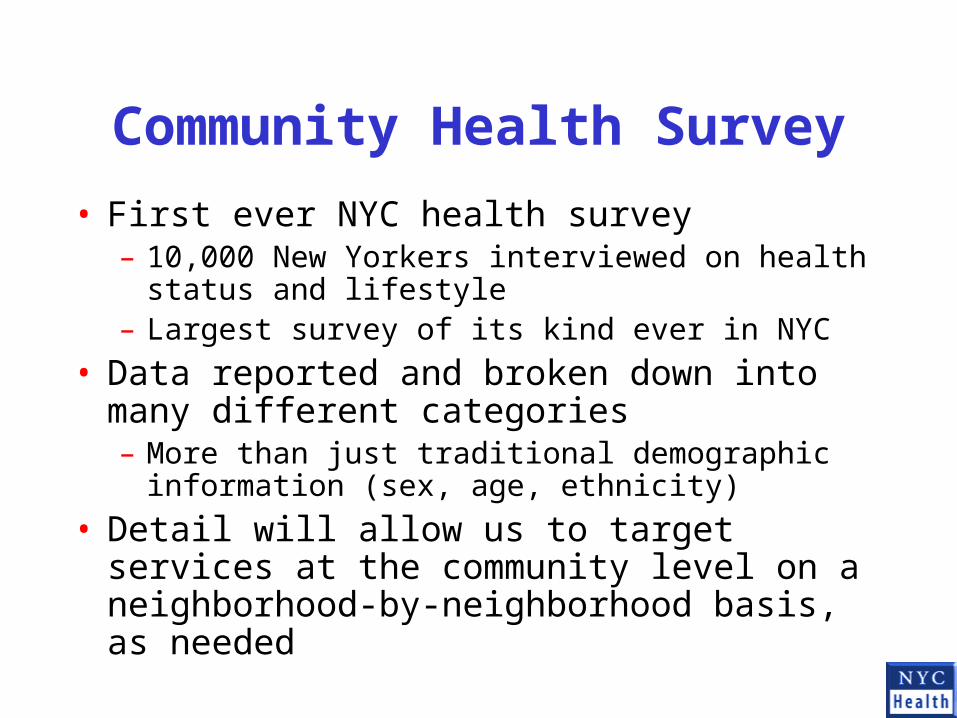
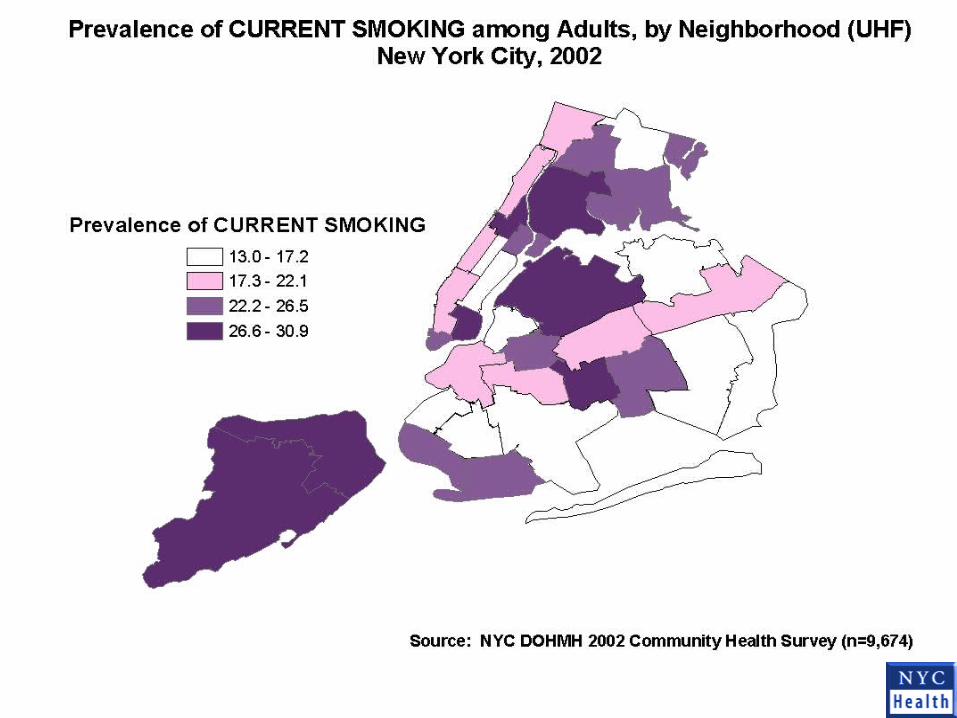
Neighborhoods Most in Need:Harlem, So. Bronx, Central Brooklyn
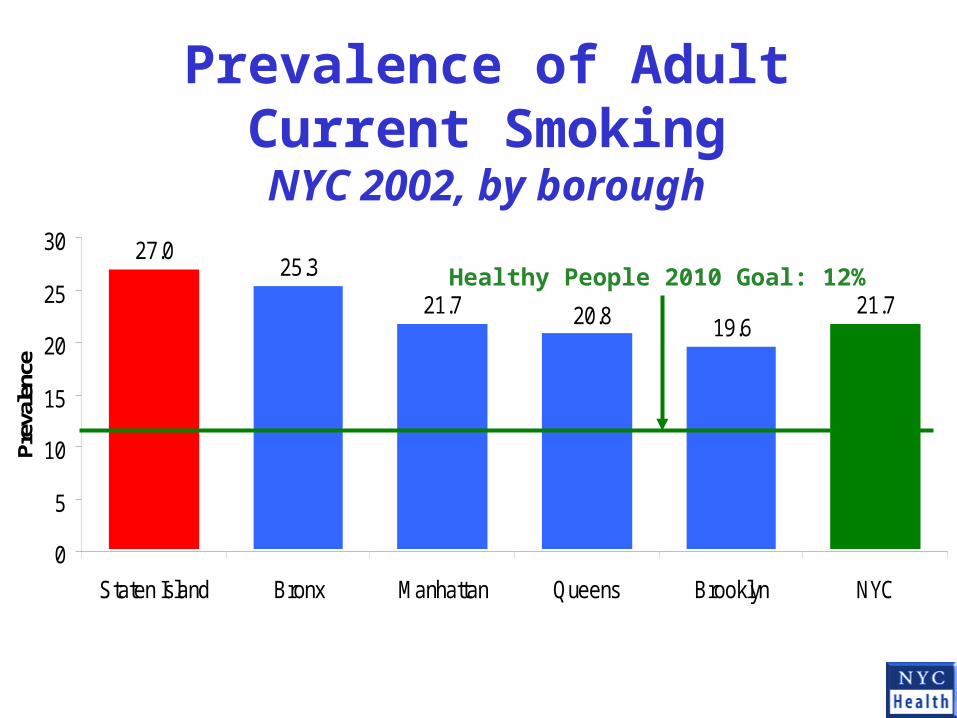
25.3
21.719.6
21.7
27.0
20.8
0
5
10
15
20
25
30
Staten Island Bronx Manhattan Queens Brooklyn NYC
Pre
vale
nce
Prevalence of AdultCurrent SmokingNYC 2002, by borough
Healthy People 2010 Goal: 12%

Annual Deaths from Smoking Compared with Other Causes
NYC, 2001
0
2000
4000
6000
8000
10000
* Total includes smoking-related deaths# Total includes 265 AA587 deaths+ Total does not include 2,743 WTC deaths

Cancer Screening in Staten Island vs. NYC
8180
50
8077
50
0
20
40
60
80
100
Colon Screening Mammogram PAP Smear
Staten Island NYCHP 2010: 90%

Colon CancerDetection & Cure Rates
0
20
40
60
80
Colorectal Cancer Breast Cancer Prostate Cancer
Early-Stage Detection Rates Colorectal Cancer Cure Rates
0
20
40
60
80
100
Early stage Late-stage

HIV & AIDS Cases in Staten Island
Calendar Year 2001
108
1189
0
200
400
600
800
1000
1200
1400
# Living w/HIV & AIDS # New HIV Diagnoses
Figures as of 12/31/01
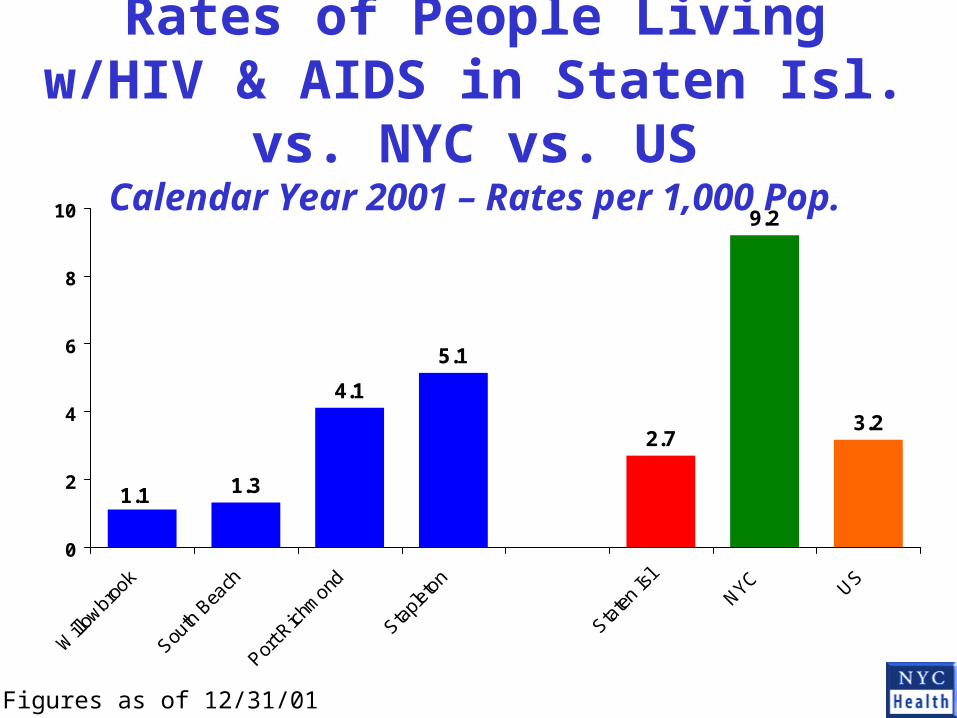
Rates of People Living w/HIV & AIDS in Staten Isl. vs. NYC vs. US
Calendar Year 2001 – Rates per 1,000 Pop.
1.3
4.1
5.1
2.7
9.2
3.2
1.1
0
2
4
6
8
10
Willo
wbroo
k
South
Bea
ch
Port R
ichm
ond
Staple
ton
Staten
Isl
NYC US
Figures as of 12/31/01
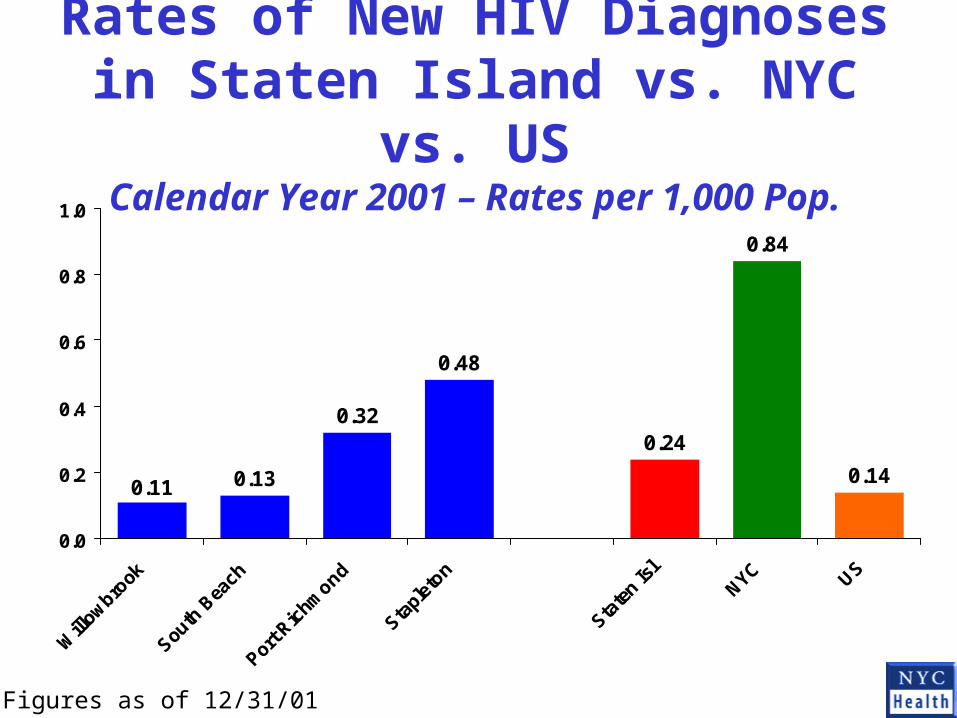
Rates of New HIV Diagnoses in Staten Island vs. NYC vs. US
Calendar Year 2001 – Rates per 1,000 Pop.
0.13
0.32
0.48
0.24
0.84
0.140.11
0.0
0.2
0.4
0.6
0.8
1.0
Will
owbro
ok
South
Bea
ch
Port R
ichm
ond
Stapl
eton
State
n Isl
NYC US
Figures as of 12/31/01

There Has Been a Resurgence of Risky Sexual Behavior
• Syphilis cases more than doubled between 2000 and 2001, increased another 50% in 2002
• Syphilis increase almost entirely among men, especially MSM
• Foreshadowing future rise in HIV rates?
0.51 0.51 0.66
10.75
7.50
3.07
02
468
1012
2000 2001 2002
Rat
e per
100,0
00
Females Males
Reported Primary and Secondary Syphilis Case Rates, NYC, 2000-2002
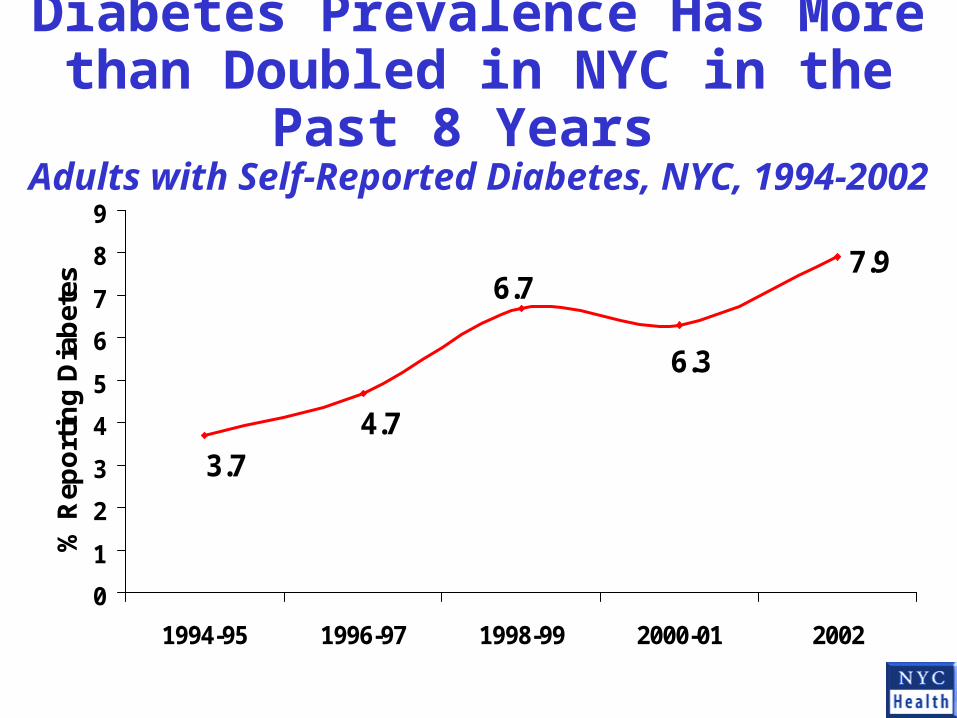
Diabetes Prevalence Has More than Doubled in NYC in the Past 8 Years Adults with Self-Reported Diabetes, NYC, 1994-2002
7.9
6.3
6.7
4.73.7
0
1
2
3
4
5
6
7
8
9
1994-95 1996-97 1998-99 2000-01 2002
% R
epo
rtin
g D
iab
etes
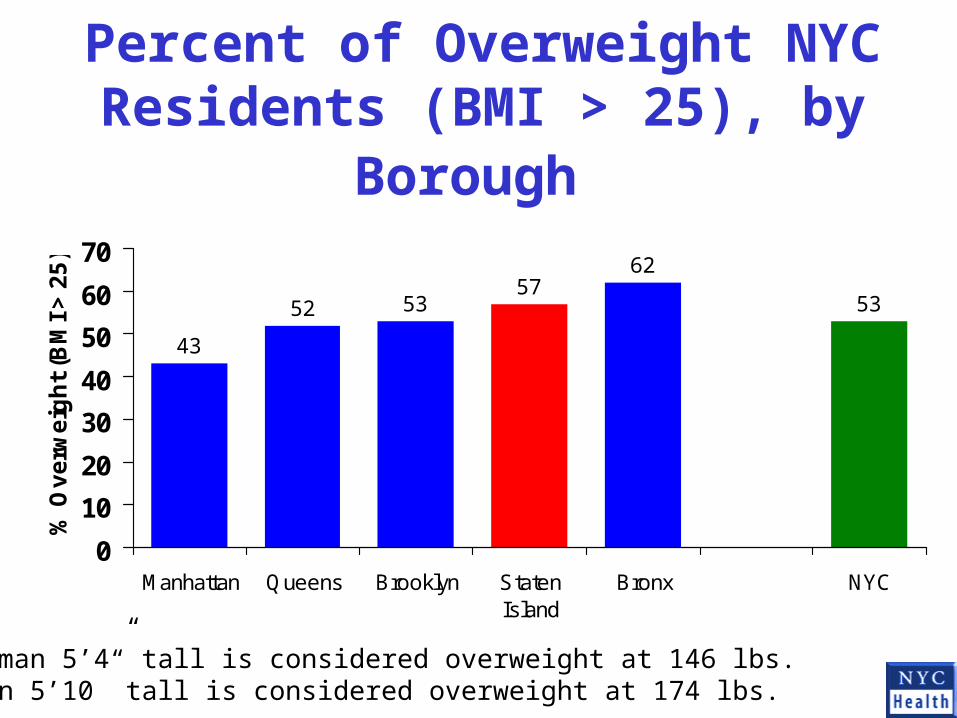
Percent of Overweight NYC Residents (BMI > 25), by Borough
43
52 5357
62
53
0
10
20
30
40
50
60
70
Manhattan Queens Brooklyn StatenIsland
Bronx NYC
% O
ve
rwe
igh
t (B
MI
> 2
5)
A woman 5’4” tall is considered overweight at 146 lbs.A man 5’10” tall is considered overweight at 174 lbs.

Percent of Obese NYC Residents (BMI > 30), by Borough
11.9
15.416.8
18.8
21.8
16.6
0
5
10
15
20
25
% O
bese (
BM
I >
30)
A woman 5’4” tall is considered obese at 175 lbs.A man 5’10” tall is considered obese at 209 lbs.

Percent of NYC Residents with Diagnosed Diabetes, by Borough
4.66.2
7.0
8.8
11.8
7.9
0
2
4
6
8
10
12
14
State
n Isl
and
Man
hatta
n
Queen
s
Brook
lyn
Bronx
NYC
% w
/Dia
gn
ose
d D
iab
etes

Diabetes Prevalence in NYCBy Ethnicity, 2002
5.0
6.8
10.8
12.2
7.9
0
2
4
6
8
10
12
14
White Asian Black Hispanic NYC
Healthy People 2010 Goal: 2.5%
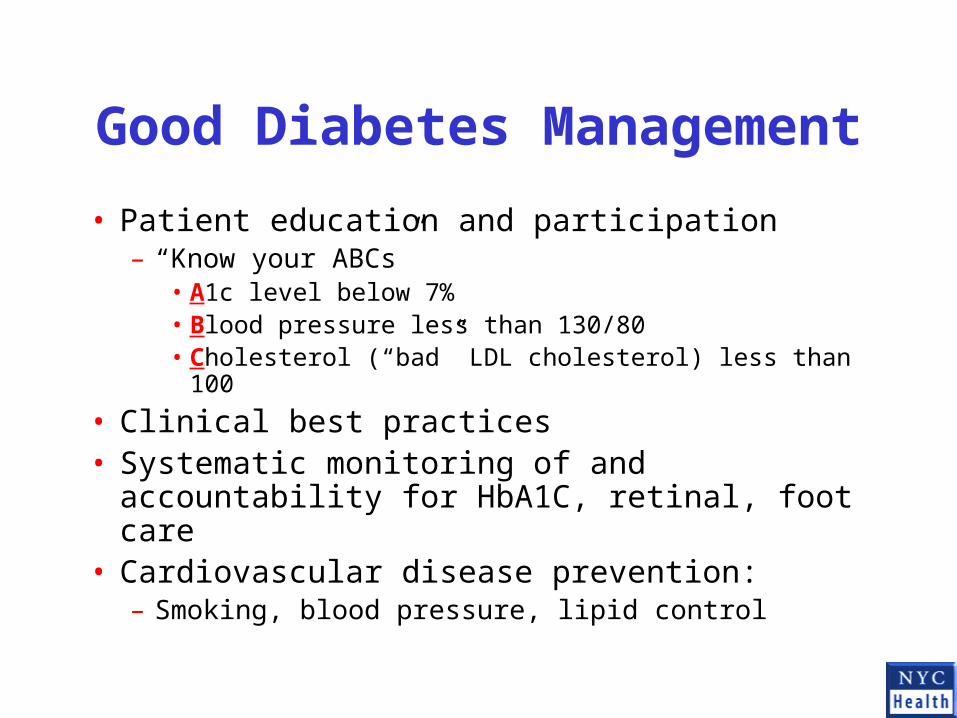
Good Diabetes Management
• Patient education and participation– “Know your ABCs”
• A1c level below 7%• Blood pressure less than 130/80• Cholesterol (“bad” LDL cholesterol) less than 100
• Clinical best practices• Systematic monitoring of and accountability
for HbA1C, retinal, foot care• Cardiovascular disease prevention:
– Smoking, blood pressure, lipid control
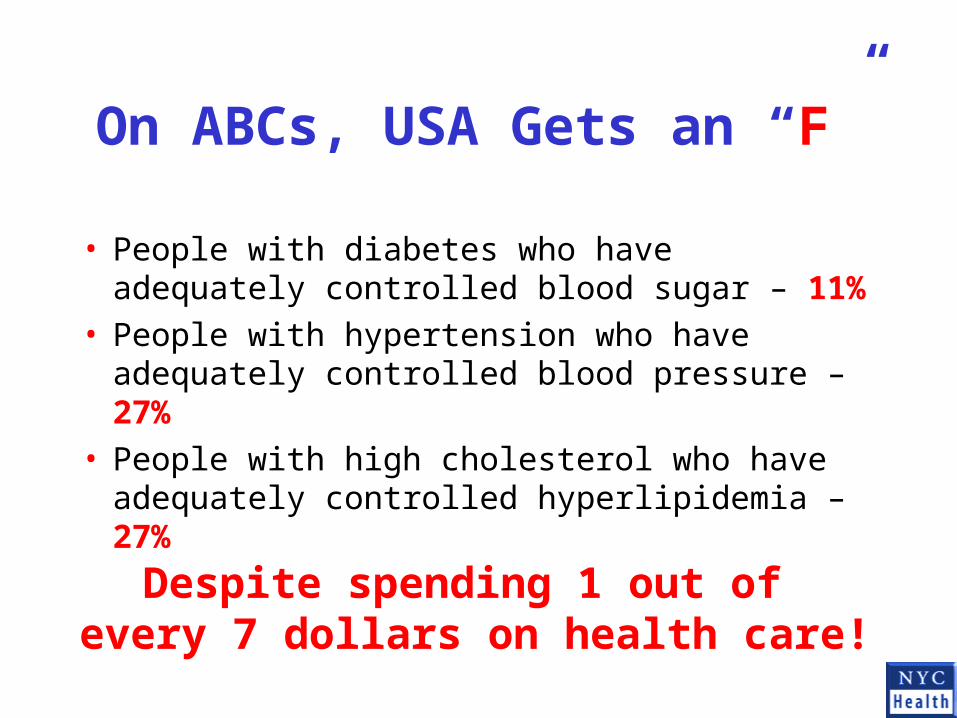
On ABCs, USA Gets an “F”
• People with diabetes who have adequately controlled blood sugar – 11%
• People with hypertension who have adequately controlled blood pressure – 27%
• People with high cholesterol who have adequately controlled hyperlipidemia – 27%
Despite spending 1 out of every 7 dollars on health care!
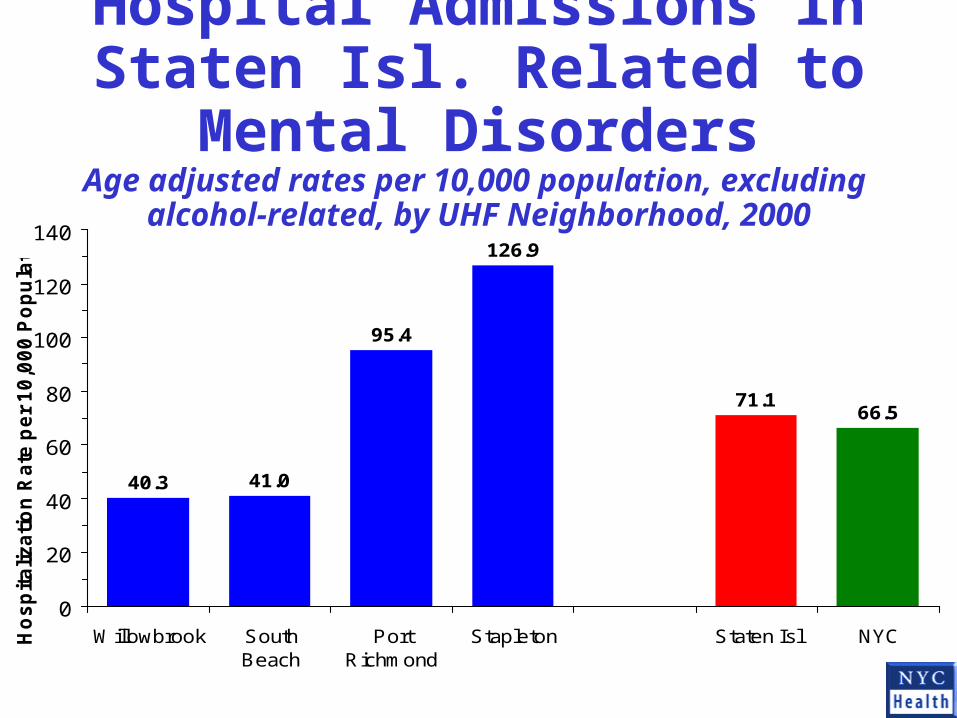
Hospital Admissions in Staten Isl. Related to Mental Disorders
Age adjusted rates per 10,000 population, excluding alcohol-related, by UHF Neighborhood, 2000
40.3 41.0
95.4
126.9
71.166.5
0
20
40
60
80
100
120
140
Willowbrook SouthBeach
PortRichmond
Stapleton Staten Isl NYCHo
sp
ita
liza
tio
n R
ate
pe
r 1
0,0
00
Po
pu
lati
on
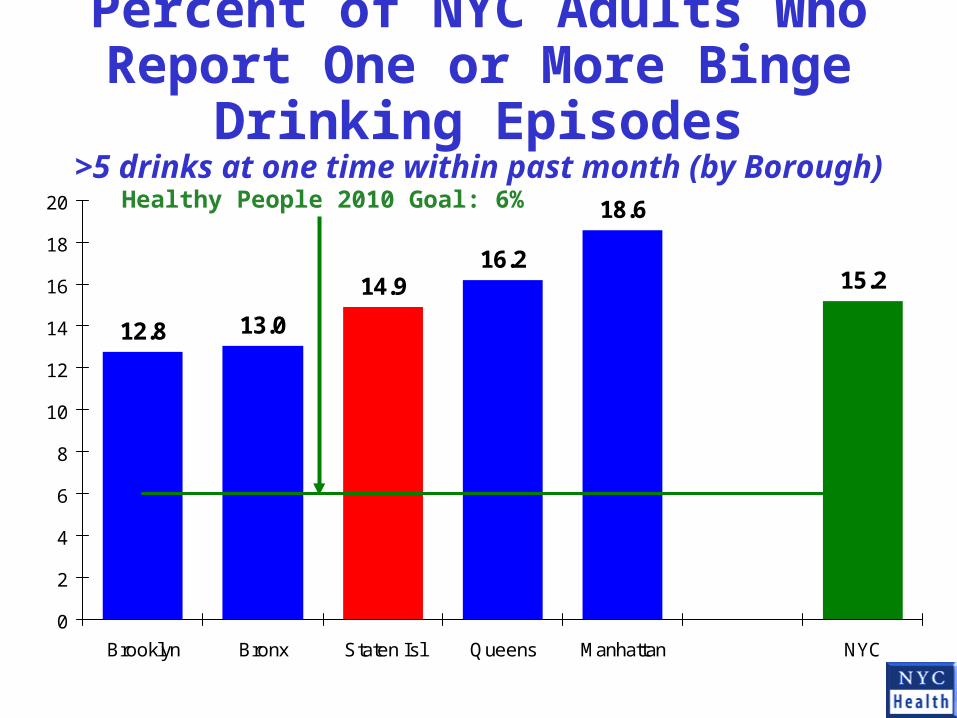
Percent of NYC Adults Who Report One or More Binge Drinking Episodes
>5 drinks at one time within past month (by Borough)
12.8 13.0
14.916.2
18.6
15.2
0
2
4
6
8
10
12
14
16
18
20
Brooklyn Bronx Staten Isl Queens Manhattan NYC
Healthy People 2010 Goal: 6%
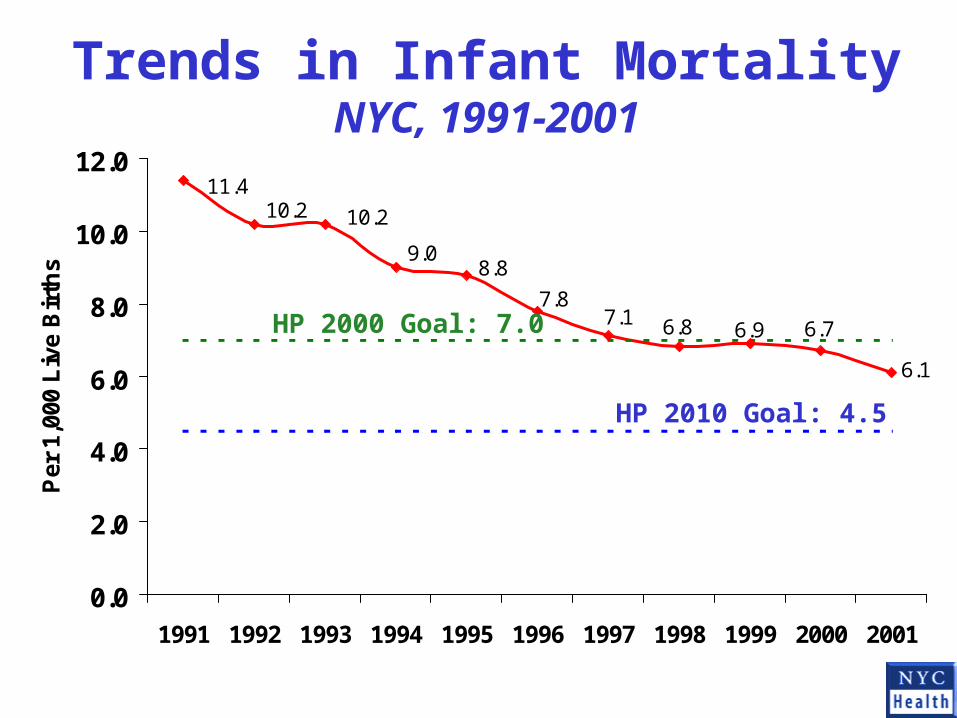
Trends in Infant MortalityNYC, 1991-2001
11.4
6.1
10.2 10.2
9.08.8
7.87.1 6.8 6.9 6.7
0.0
2.0
4.0
6.0
8.0
10.0
12.0
1991 1992 1993 1994 1995 1996 1997 1998 1999 2000 2001
Per
1,0
00 L
ive
Bir
ths
HP 2010 Goal: 4.5
HP 2000 Goal: 7.0
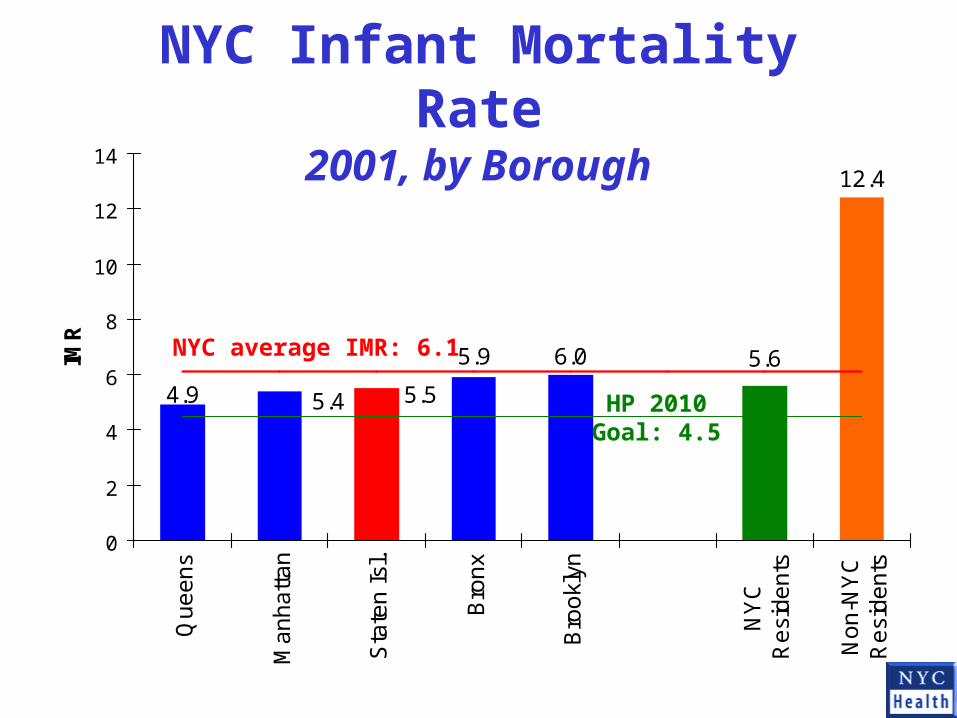
NYC Infant Mortality Rate2001, by Borough
6.0
12.4
5.6
4.9 5.4 5.5
5.9
0
2
4
6
8
10
12
14Q
ue
en
s
Ma
nh
att
an
Sta
ten
Isl
.
Bro
nx
Bro
okl
yn
NY
CR
esi
de
nts
No
n-N
YC
Re
sid
en
ts
IMR
NYC average IMR: 6.1
HP 2010Goal: 4.5
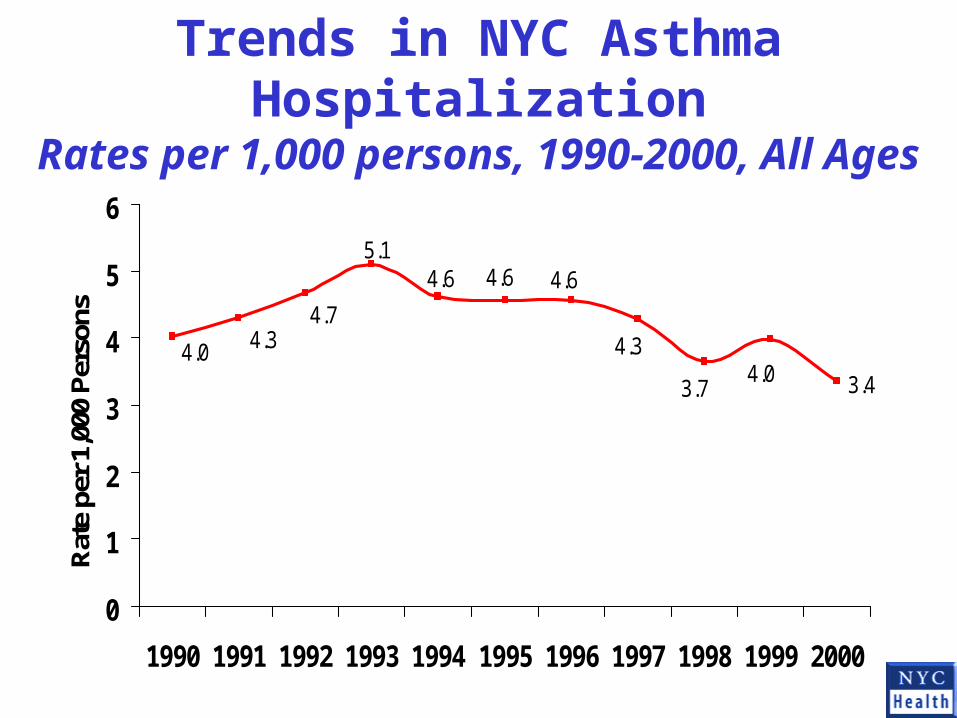
Trends in NYC Asthma HospitalizationRates per 1,000 persons, 1990-2000, All Ages
3.44.03.7
4.3
4.64.64.65.1
4.74.34.0
0
1
2
3
4
5
6
1990 1991 1992 1993 1994 1995 1996 1997 1998 1999 2000
Rat
e pe
r 1,0
00 P
erso
ns
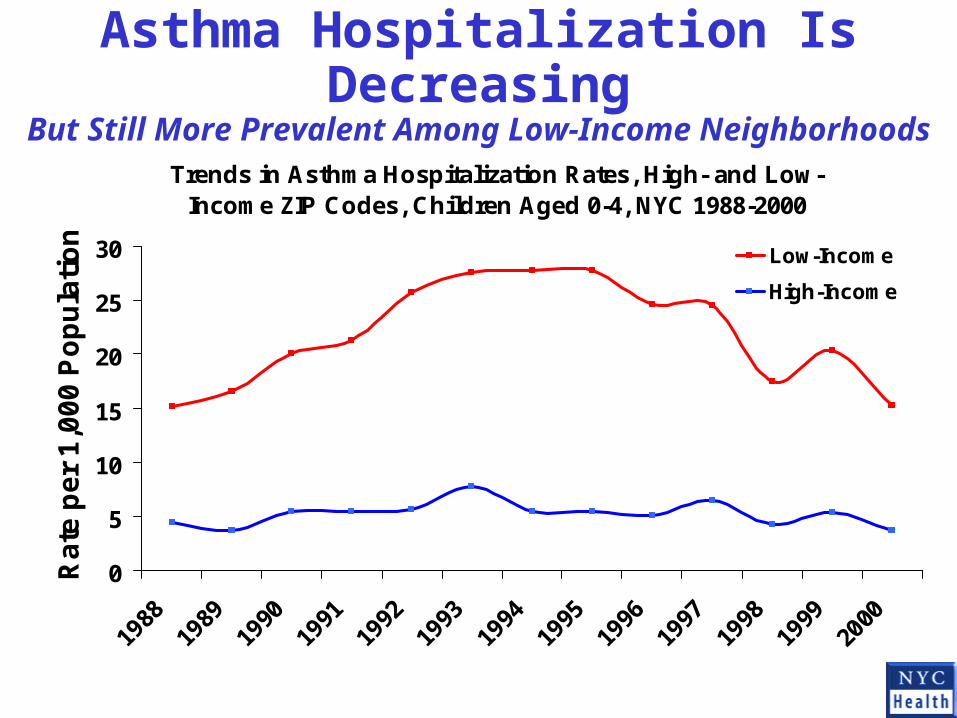
Asthma Hospitalization Is DecreasingBut Still More Prevalent Among Low-Income Neighborhoods
Trends in Asthma Hospitalization Rates, High- and Low-Income ZIP Codes, Children Aged 0-4, NYC 1988-2000
0
5
10
15
20
25
30
Ra
te p
er
1,0
00
Po
pu
lati
on
Low-Income
High-Income
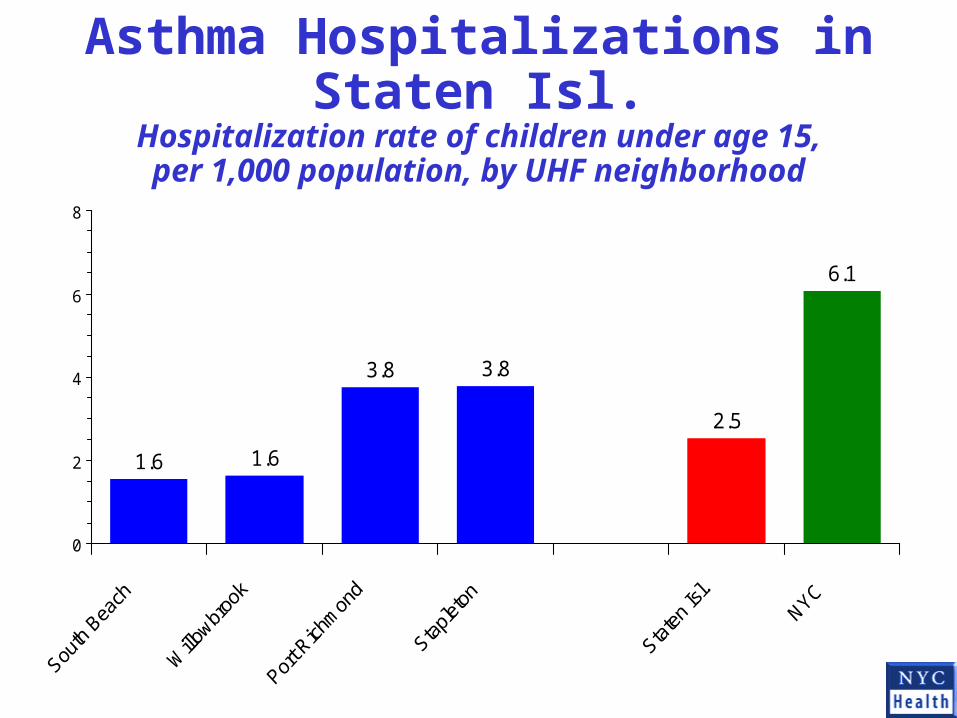
Asthma Hospitalizations in Staten Isl.Hospitalization rate of children under age 15,per 1,000 population, by UHF neighborhood
1.6 1.6
3.8
2.5
6.1
3.8
0
2
4
6
8
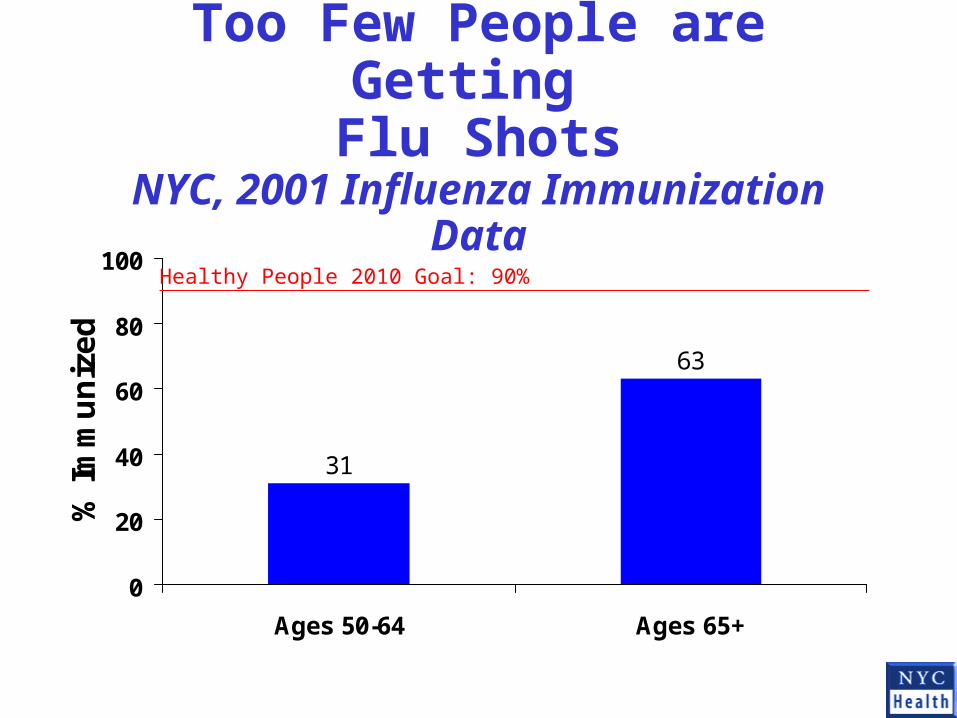
Too Few People are Getting Flu Shots
NYC, 2001 Influenza Immunization Data
31
63
0
20
40
60
80
100
Ages 50-64 Ages 65+
% I
mm
un
ize
d
Healthy People 2010 Goal: 90%
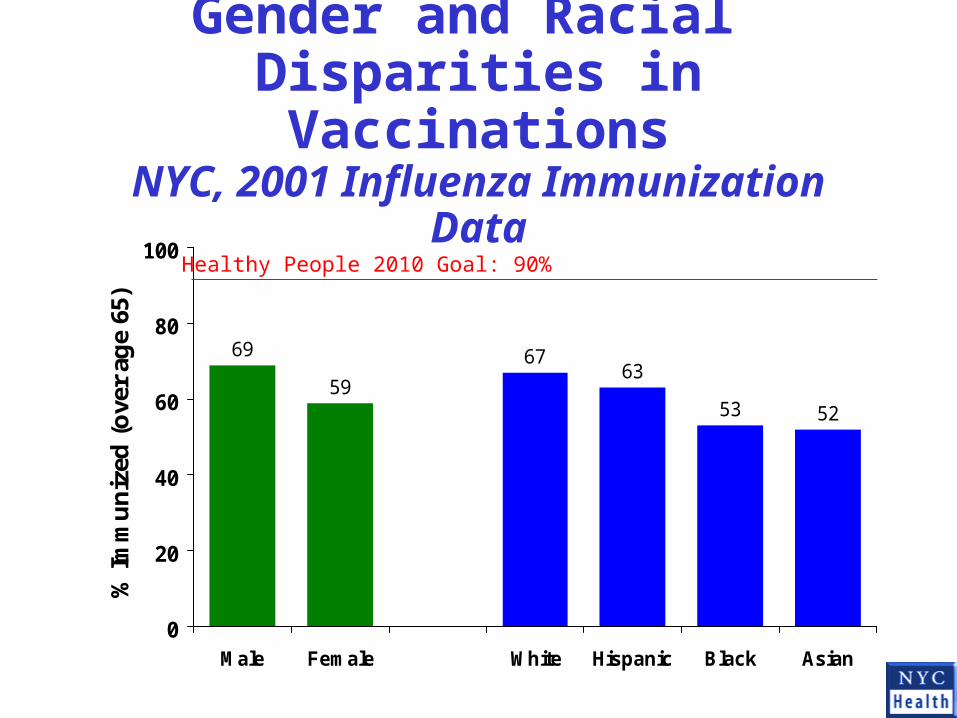
Gender and Racial Disparities in Vaccinations
NYC, 2001 Influenza Immunization Data
59
6763
53 52
69
0
20
40
60
80
100
Male Female White Hispanic Black Asian
% Im
mu
niz
ed (
ove
r ag
e 65
)
Healthy People 2010 Goal: 90%
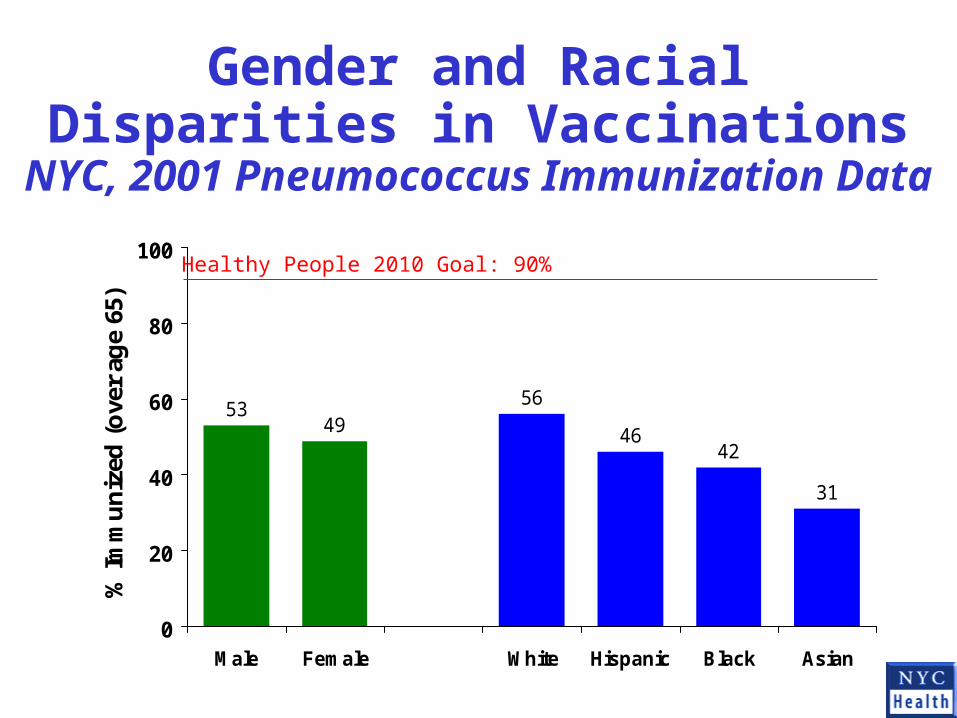
Gender and RacialDisparities in Vaccinations
NYC, 2001 Pneumococcus Immunization Data
4956
4642
31
53
0
20
40
60
80
100
Male Female White Hispanic Black Asian
% Im
mu
niz
ed (
ove
r ag
e 65
)
Healthy People 2010 Goal: 90%

10 Things Everyone Should Do to Stay Healthy
1. Have a regular doctor or nurse practitioner
2. Don’t smoke and don’t accept smoking around you or your children
3. Know your vital signs and keep them healthy (blood pressure, cholesterol, weight)
4. Know your HIV status and use condoms to protect against HIV and other STDs
5. Don’t live with depression – seek help
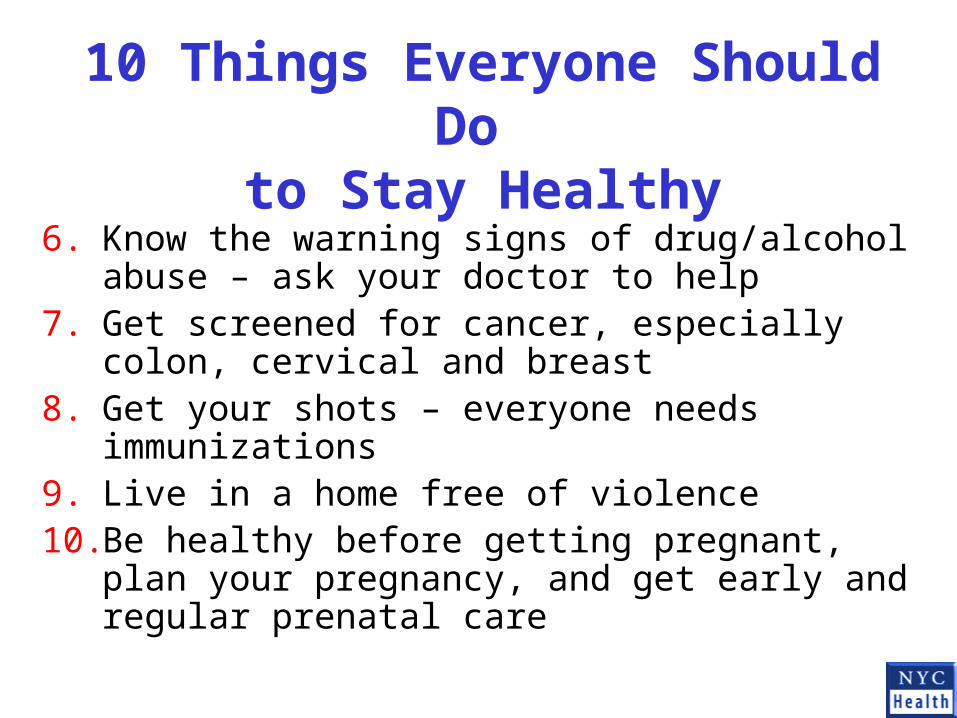
10 Things Everyone Should Do to Stay Healthy
6. Know the warning signs of drug/alcohol abuse – ask your doctor to help
7. Get screened for cancer, especially colon, cervical and breast
8. Get your shots – everyone needs immunizations9. Live in a home free of violence10. Be healthy before getting pregnant, plan your
pregnancy, and get early and regular prenatal care