Embed Size (px)
Citation preview
The Hazard of Mortality Among Aging Retired- and Disabled-Worker Men:
A Comparative Sociodemographic and Health Status Analysis
by John L. McCoy, Howard M. lams, and Timothy Armstrong*
This article reports on the hazard of mortality of aging retired- and disabled-worker men over the decade after they became Social Security bene- ficiaries. Basic patterns of mortality rates are described using data from the 1982 New Beneficiary Survey linked to administrative records. The article examines the association of increasing age, race, socioeconomic status, private health insurance, and other demographic and health characteristics with the duration of life between the two groups of men, using statistical models. Over the decade, the hazard of death for retired workers signifi- cantly increased with aging and with lower socioeconomic status. The ha- zard of death for the disabled was significantly associated with being black.
*John McCoy, formerly with the Office of Research and Statistics’ Program Analysis Staff (PAS), is currently working as a private consultant in the health field; Howard Iams is a statistician with PAS; and Timothy Armstrong, formerly an Intergovernmental Personnel Act employee with PAS, is currently an assistant research professor with the University of California at San Francisco.
This article reports on the results of a hazard analysis of aging retired- and disabled-worker men interviewed in the 1982 New Beneficiary Survey (NBS), whose survival status was monitored over time through linked Social Security administrative records. The purpose is first to describe the basic patterns of mor- tality of these two groups, and second to specify ‘and estimate a model of their duration-dependent transition to mortality. The study compares the relationships of selected sociodemographic, health, and functional status characteristics to survival time over a 9-year period. Since it has been demonstrated in pre- vious research that these two populations differ markedly in overall age structure, functional capacity, and health status (Iams and McCoy 1991; McCoy and Iams 1994), the two groups c(an be expected to demonstrate contrasts in their survival patterns.
We fust provide a brief discussion of the Social Security Old-Age and Survivors Insurance (OASI) and the Social Security Disability Insurance (DI) program. Next, we present a comparative demographic and health status profile. This is followed first by a life table analysis of survival, and then by a discrete exponential proportional h,azard analysis of sociodemographic and health characteristics. Finally, we discuss the results and their implications for social and health care policy.
Old-Age and Survivors Insurance
The Old-Age and Survivors Insurance program, popularly known as “Social Security,” is designed to provide monthly benefits to retired workers, their depen- dents, and their survivors. A person builds protection under OASI through work in employment covered under Social Security; currently, about 95 percent of all jobs in the United States are covered. Actuarially reduced benefits are payable to retired insured workers at age 62, and full benefits are payable at age 65. In 1982, the year in which the NBS wils conducted, there were approximately 20.7 million retired workers receiving Social Security benefits. The median age at first benefit
76 Social Security Bulletin l Vol. 57, No. 3 l Fall 1994

receipt of retired workers interviewed in the NBS was 63 years.
Social Security Disability Insurance
The Social Security Disability Insur- ance program assists primarily the work- ing population under the age of 65 when they meet both the Social Security Ad- ministration’s definition of disability and insured status requirements. To receive benefits, a disabled worker must be un- able to engage in any substantial gainful activity by re(ason of a medically deter- minable physical or mental impairment expected to result in death or to last for a continuous period of at least 12 months. Applicants must also have a recent and substantial attachment to the labor force; in technical terms, they must be fully and currently insured.’ In 1982,2.6 million disabled workers were receiving benefits.
The Dl program requires that dis- abled workers must be unable to work in any job in the national economy, a stan- dard that may be more easily met by persons of blue-collar background with physically demanding work histories and limited educational attaimnent than by their white-collar counterparts whose higher educational attainment levels and clerical/managerial skills may have greater transferability potential. In other words, the more educated an applicant is, the more debilitated he needs to be in order to meet DI acceptance criteria.
Most of what is known about im- paired persons has been obtained from conducting surveys of the noninsti- tutionalized population regarding activi- ties of daily living (ADL), mobility or self-care limitations, or work disability. However, there are substantial health and demographic differences between per- sons interviewed in sample surveys who report functional limitations and those who actually receive Federal DI benefits based on medical and clinical evidence in accordance with Social Security pro- gram criteria. As an illustration of the highly selective nature of the program, in 1981 (the year of NBS sample selection) only 30 percent of <all claims filed with the Social Security Administration (SSA) resulted in (an award of benefits (Com- mittee on Ways and Means 1989).
Demographic Profile
Retired and disabled men differed substantially from each other in both demographic and health characteristics. As shown in the following tabulation, disabled-worker men were younger, less likely to be married, more likely to be black, less educated, and poorer than their retired-worker counterparts:
Characteristic ’ Retired Disabled
Total number
(in thousands) . 690.6 158.3
Age: Median. _. ____ __ __ __ __ ___. _. __ __ 62 54 Mean.. ___. __ ___. __ ____ __ .__ __ __ __. 62 50
Marital status: Married. __ ._ __ __ _._. __. _. _. _. Unmarried _._.___._........__..
84 73 16 27
Race:
Black . . . . 8 15
White . . . 89 81
Other ________._.._____._........... 3 4
Education:
Less than 12 years _______._.
12 years . . . . . More than 12 years .
Income equivalence to poverty:
47 56
28 29
24 15
Less than twice
poverty level . .
Greater than or equal to
twice poverty level .
’ In percents.
32
68
58
43
Relative to the general population measured in national surveys, the NBS cohort has a greater concentration of persons of blue-collar and lower socio- economic status. For example, NBS disabled workers are about half as likely to have been employed in white-collar jobs (28 percent) compared with persons in the civilian labor force (54 percent) (Bureau of the Census 1983). The me- dian income of NBS disabled-worker families with a spouse and minor chil- dren was about half that of a comparable nuclear family in the general population (Packard 1993). Social Security benefits
represented the most important source of income for 40 percent of married benefi- ciaries and 65 percent of unmarried beneficiaries. Although 3 out of 4 NBS disabled workers reported some type of financial asset, the median value of their assets was quite low, and comparatively much lower than that of retired workers (Yeas 1987).
Health and Functional Status Prsfile
We would expect that disabled work- ers are more debilitated and more func- tionally limited than their older, retired counterparts. This is indeed the case. On average, disabled-worker men had 4.1 disorders compared to 2.5 for retired workers (see the following tabulation). Three-fourths of disabled men had 3 or more disorders, compared to one-third for retired workers. Disabled workers manifested a relatively greater burden of specific health disorders. The next tabu- lation gives the percentages for retired- and disabled-worker men with various health disorders:
Health disorder ’ Retired Disabled
Total number (in thousands). ...........
Mean disorders reported.. .....................
Disorder type: Circulatory system.. ........ Digestive system.. ........... Respiratory system.. ....... Nervous system.. ............ Neoplms.. ......................
Functional capacity limitations: None.. ............................. Minor .............................. Moderate ......................... Severe.. ........................... Dependent .......................
Number of limitations: None.. ............................. Two or more.. ................. Three or more.. ...............
’ In percents.
690.6 158.3
3 4
43 66 20 36 16 29 8 33 4 7
51 7 18 8 16 27 8 29 7 28
20 1 56 91 35 75
Disabled men were extremely limited in physical functioning capacity-almost 6 in 10 (56 percent) were severely limi-
Social Security Bulletin l Vol. 57, No.3 l Fall 1994 77

ted or dependent compared to less than 1 in 7 retired workers (13 percent). We expect, therefore, that disabled workers’ patterns of mortality will reflect these striking differences in health and func- tional status.
Patterns of Mortality
The NBS cohort of disabled men did indeed have a high initial mortality; 148 per thousand in the IS-30 month period before interviewing began, and further losses of about 5 percent a year thereafter. These rates sharply contrast to those reported for NBS retired-worker men whose rate averaged 2-3 percent a year between 1982 and 1988 (Iams and McCoy 1991). Disabled-worker men and women were 14 times more likely to die than retired-worker men and women in the first 6 months, 8 times more likely in the second 6 months, and 4 times more likely in the third 6 months (Social Security Administration 1993). Near the end of the decade, however, the death rate of retired men increased and be- came simihar to that of men who were disabled: as is demonstrated later in this article, the rate for retired-worker men eventmally exceeds that of disabled- worker men.
Data Sources
Data used in the analysis were compiled from three merged sources- (1)survey responses of the retired- and disabled-worker men interviewed in the New Beneficiary Survey (NBS), (2) date of death recorded in the Master Beneficiary Record (MBR) of the Social Security Administration, and (3) inpa- tient data from the Medicare Automated Data Retrieval System (MADRS).* The samples consist of noninstitutionalized men at the time of the 1982 survey who received initial benebs for at least a month during a one-year period (mid- 1980 to mid-1981). Interviewing oc- curred in October-December of 1982. Final interviews were conducted with 5,287 retired-worker men and 3,593 disabled-worker men. For further de- tails about the design of the NBS, see Maxfield (1983). Most of our covariates are from the 1982 NBS and reflect con- ditions at that point in time. We would
like to have yearly measures for covariates that may change over the years, such as marital status, health sta- tus, private health insurance, and family income, but our data restrict us. The measures of inpatient status from the MADRS and survival status from the MBR were available each year of the study period.
Methods of Analysis
We utilized two sets of interrelated methods. First, using the SAS procedure LIFETEST we developed a set of life tables that describe the summary rela- tionship between benefit type, duration in that status, and mortality. The life table is useful for describing mortality as a function of time and is often used to evaluate, nonparametrically, the effect of the hazard rate (instantaneous proba- bility) of death on the survival function.
The data were used to construct mor- tality histories for 8,864 men (5,287 retired workers and 3,577 disabled work- ers) who were alive at the beginning of 1983. These histories indicate the year- specific mortality status and the values of all covariates (generally values reported for 1982) for each year of survival be- tween 1983 and 1992 and for the year of death. This resulted in the creation of 75,359 records that represented the man- years of exposure for the entire sample. Records for persons surviving the entire period of observation (through 1992) were necessarily right-censored because we could not follow them until their death.
The focus of this analysis is on the year-specific mortality hazard rate--the conditional probability that a beneficiary who was alive at the beginning of a year X will have died by year X + I, given that he is at risk. In formal terms, the hazard rate is interpreted as the instanta- neous probability that a mortality event will occur during time interval t, given that the event has not yet occurred. This can be expressed as:
h (t) = lim P (t, t + s) I S (I)
where
s = the width of the time interval t = beginning year.
This is referred to as the instantaneous probability of a mortality exit or the number of mortality events that occur in a given year.
The hazard rate can also be expressed as a function of a set of covariates de- fined as:
h (t) = h It, zl
where
z is a vector of measured explana- tory variables.
As noted earlier, a discrete-time exponential proportional hazard model was used to estimate the hazard rate for this analysis because of our interest in correctly parameterizing the year- specific mortality rates. Because the hazard for disabled-worker beneficiaries was irregular during the first 2 years of observation, it was decided that a dis- crete-time exponential proportional haz- ard model rather than a continuous-time model would be best suited for the data analysis. In addition, these models allow for the multivariate identification of the different waiting times to mortality in various demographic, socioeconomic, and health states. The models were estimated using the S AS LIFEREG procedures. The hazard rate was obtained by exponentiating the para- meter estimates:
h (t) = cup (bx)
Model Specification
A combined multivariate model was specified to test the effects of the “aging process” defined as DURATION in combination with sociodemographic and health indicators. The sociodemographic variables included: age; 1982 marital status (married, not married); race (black, white), years of education (less than 12, 12, 13 or more); 1982 family income equivalence to poverty; and 1982 private health insurance coverage. The health indicators were the number of health conditions reported, the occur- rence of circulatory, digestive, respira- tory, nervous, or neoplasm conditions:
78 Social Security Bulletin l Vol. 57, No. 3 l Fall 1994

the presence of severe functional limita- tions; and whether or not a Medicare- reported hospitalization (from the MADRS) occurred at any time in a year from 1984 to 1991.
Age
The effects of aging, as well as the correlates of the aging process-declin- ing health and imp‘aired functional status on mortality-are widely known and documented in the research literature. What is less evident is how the aging process in combination with other select- ed variables impacts on the waiting time of death. We expect age, considered both as a chronological “marker vari- able” ‘and as a “process variable,” to have a substantial impact on the interval to death for both aging retired- and disabled-worker cohorts.
Race
Several studies have documented the relationship between health status, sur- vival status, and race. In general, per- sons of the black race have higher mor- tality than their white counterparts for most causes of death (Keith and Smith 1988). Keith and Smith collapsed causes of death into medical and nonmedical categories ‘and concluded that medical reasons accounted for most of the higher black mortality among those aged 65 or older. Black persons are known to have higher death rates due to heart disease, stroke, cancer, diabetes, homicide, acci- dents, ‘and substance abuse (Department of Health <and Human Services 1985). Some have suggested that once socioeco- nomic, frunilial status, and certain demo- graphic characteristics are controlled, these apparent race effects on mortality should disappear (Rogers 1992).
In their ‘analysis of risk factors affect- ing mortality among persons 35-54 years of age, Otten and his co-workers found that about 3 1 percent of the excess of mortality in the black race could be accounted for by six well-established risk factors (Otten 1990). An additional 38 percent could be accounted for by family income. However, they concluded that
approximately 3 1 percent of the excess remained unexplained. We do not ex- pect race effects to be as salient <among the disabled population primarily be- cause of the mitigating influence of a constrained lower income distribution-
An important issue that can ‘affect survival time concerns the severity of
which is generally low among both black
impairment at the time of disability ben- efit award. If, for example, persons in the
and white individuals and the fact that
black cohort have a greater degree of impairment and generally poorer health
the entire population has passed screen-
when they are awarded disability bene- fits, we should expect them to have a
ing by a uniform health standard.
significantly shorter survival time. In- deed, when the General Accounting Oflice (GAO 1992) was asked to analyze and interpret the observed lower black DI acceptance rate, it found that a larger proportion of those in the black group than white were severely impaired, ac- counting for their higher application rate, and that they were receiving bene- fits at a rate comparable with that of white individuals within the severely impaired population. Thus, we antici- pate that after controlling for the com- bined effects of socioeconomic (SES) and health variables, disabled black and white persons should have similar sur- vival times; in other words, there should be no significant race effects on life- expectancy, other things being equal.
Socioeconomic Status
The inverse relationship of SES status and mortality is well known- persons of lower SES have higher rates of mortality. The literature also suggests that persons of lower SES are generally more susceptible to illness and injury (Syme and Berkman 1976). We used two measures of SES: years of education, and the ratio of current family income to poverty. Years of education is a common measure of SES and is stable over the life cycle (Feinstein 1992). Kitagawa and Hauser (1973), in their analysis of SES and mortality, found evidence that high- er income and greater educational attain- ment were associated with lower morta-
lity rates ‘and longer life expectancy among persons under age 65. But they found little relationship of education to mortality among aged persons, except for white women. The null hypothesis of no
As noted e‘arlier, we used the ratio of
relationship between SES and mortality
family income to the poverty threshold as a measure of SES.3 Additional persons
has generally been supported in analyses
with earned income who provide support represent an intervening variable that
based on the National Longitudinal
could mitigate the presumed influence of SES on mortality. Unfortunately, in-
Study and the Retirement History Survey
come is partly endogenous with health impairment because the impairment may cause a loss of income (Feinstein 1992).
(Feinstein 1992).
The mortality literature suggests that we should find little relationship between mortality and SES, particularly educa- tion, among aged beneficiaries, but an inverse relationship among younger disabled-worker men.
Private Health Insurance
Because private health insurance is often associated with better access to care, it was used to test the assumption that retired- and disabled-worker men who have coverage should live longer than those who do not.4 In a separate investigation of NBS disabled workers, private health insurance was found to be associated with inpatient hospital usage (McCoy and Iams 1993). The Rand Health Insurance Experiment found that those with private health insurance had greater access to care (Newhouse 1987).
Marital Status
The research literature reports that the unmarried generally have higher mortality rates than those who are married (Gove 1973; Hu and Goldman 1990). Suggested reasons for this difference include: higher risk behavior among the unmarried, healthier life-styles among the married, and the possibility for better care and social sup- port by a spouse at home following acute or chronic illness.
Social Security Bulletin l Vol. 57, No.3 l Fall 1994 79
Health Status
In 1982, health status was assessed by: (1) number of disorders, an altema- tive indicator of multiple morbidity; (2) physical functioning capacity, measured by the Functional Capacity Limitation Index (Haber 1974);’ and (3) incidence of circulatory, respiratory, digestive, and nervous6 disorders, and the report of neoplasms regardless of their site. These health indicators have been found in previous studies to be positively associat- ed with subsequent mortality (Iams and McCoy 199 1). Administrative records of hospitalization during the observation period of 1984 through 1991 were also used as an alternate measure of poor health.
Results
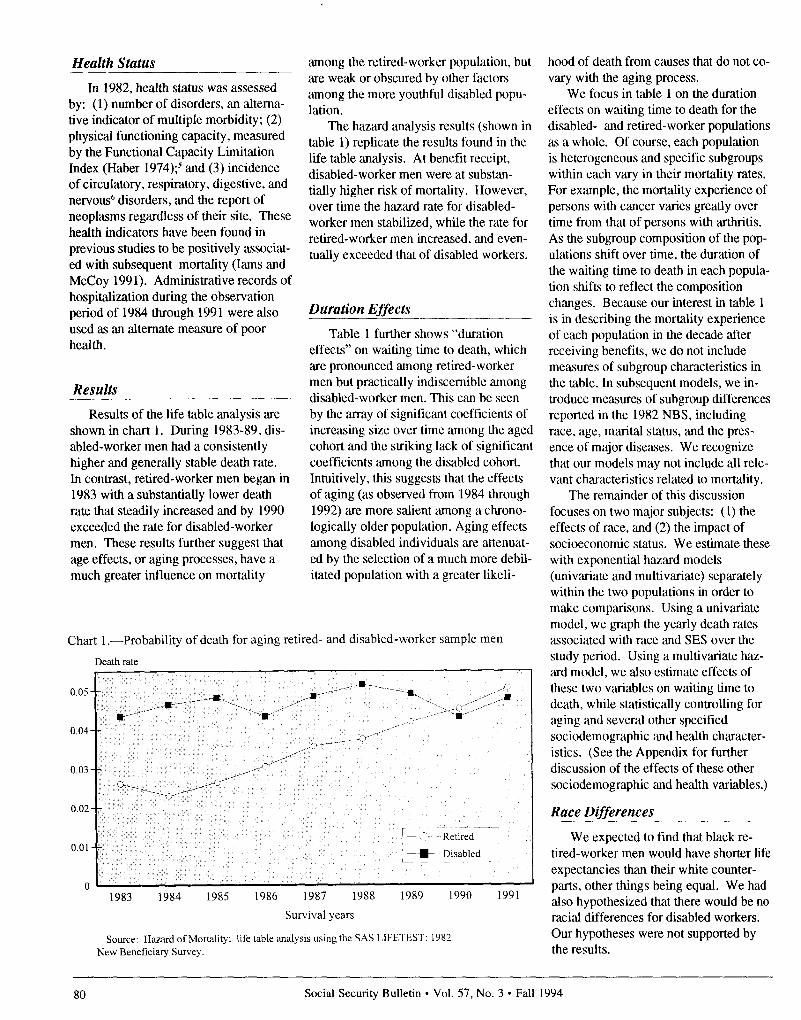
Results of the life table analysis are shown in chart 1. During 1983-89, dis- abled-worker men had a consistently higher and generally stable death rate. In contrast, retired-worker men began in 1983 with a substantially lower death rate that steadily increased and by 1990 exceeded the rate for disabled-worker men. These results further suggest that age effects, or aging processes, have a much greater influence on mortality
among the retired-worker population, but are weak or obscured by other factors among the more youthful disabled popu- lation.
The hazard analysis results (shown in table 1) replicate the results found in the life table analysis. At benefit receipt, disabled-worker men were at substan- tially higher risk of mortality. However, over time the hazard rate for disabled- worker men stabilized, while the rate for retired-worker men increased, and even- tually exceeded that of disabled workers.
Duration Effects .__ Table 1 further shows “duration
effects” on waiting time to death, which are pronounced among retired-worker men but practically indiscernible among disabled-worker men. This can be seen by the array of significant coefficients of increasing size over time among the aged cohort and the striking lack of significant coefficients among the disabled cohort. Intuitively, this suggests that the effects of aging (as observed from 1984 through 1992) are more salient among a chrono- logically older population. Aging effects among disabled individuals are attenuat- ed by the selection of a much more debil- itated population with a greater likeli-
Chart 1 .-Probability of death for aging retired- and disabled-worker sample men
Death rate
0.05 - -
O.Ol--
,---- --- ~ + ~Retired 1
L-p l m Disabled
n 1983 1984 1985 1986 1987 1988 1989 1990 1991
Survival years
Source: Hazard of Mortality: life table analysis using the SAS LIFETEST: 1982 New Beneficiary Survey.
hood of death from causes that do not co- vary with the aging process.
We focus in table 1 on the duration effects on waiting time to death for the disabled- and retired-worker populations as a whole. Of course, each population is heterogeneous and specific subgroups within each vary in their mortality rates. For example, the mortality experience of persons with cancer varies greatly over time from that of persons with arthritis. As the subgroup composition of the pop- ulations shift over time, the duration of the waiting time to death in each popula- tion shifts to reflect the composition changes. Because our interest in table 1 is in describing the mortality experience of each population in the decade after receiving benefits, we do not include measures of subgroup characteristics in the table. In subsequent models, we in- troduce measures of subgroup differences reported in the 1982 NBS, including race, age, marital status, and the pres- ence of major diseases. We recognize that our models may not include all rele- vant characteristics related to mortality.
The remainder of this discussion focuses on two major subjects: (1) the effects of race, and (2) the impact of socioeconomic status. We estimate these with exponential hazard models (univ‘ariate and multivariate) separately within the two populations in order to make comparisons. Using a univariate model, we graph the yearly death rates associated with race ‘and SES over the study period. Using a multivariate haz- ‘ard model, we also estimate effects of these two variables on waiting time to death, while statistically controlling for aging and several other specified sociodemographic and health character- istics. (See the Appendix for further discussion of the effects of these other sociodemographic ‘and health variables.)
Race Differences
We expected to find that black re- tired-worker men would have shorter life expectancies than their white counter- parts, other things being equal. We had also hypothesized that there would be no racial differences for disabled workers. Our hypotheses were not supported by the results.
80 Social Security Bulletin l Vol. 57, No. 3 l Fall 1994

We found strong race differences in death rates and waiting time to death among disabled-worker men. With rare exception, in the univatiate model, the black disabled-worker men had much higher death rates than their white counterparts (chart Z).’ Black disabled- worker men also have statistically signi- ficant shorter waiting times to death in the multivariate models when aging, health status, SES, and other demo- graphic characteristics are controlled (table 2). We conclude that black dis- abled-worker men have a significantly shorter survival time than other disabled men.
Although black retired-worker men also have higher death rates than similar white men in the univariate model (chart 2), the rates appear to converge over time. Race, however, fails to have a significant effect on w‘aiting time to death in the multi- v(ariate analysis. Contrary to expecta- tions, when other variables are statisti- cally controlled, no significant racial effects were found among retired-worker men.
Socioeconomic Differences
Based on the literature review noted earlier, we had hypothesized that SES would have a significant effect on sur- vival time among disabled workers, but not for retired workers. Thus, we had expected that higher status disabled- worker men would have had longer sur- vival times than lower status disabled- worker men. Our findings do not support our hypotheses.
Contrary to expectations, we found no differences in the death rates of dis- abled men, based on the univariate find- ings pertaining to the ratio of family income to poverty (chart 3). In general, we found no SES differences in waiting time to death based on the multivariate analysis (table 2).
The hypothesis that SES would have no significant effect on the mortality experience of retired-worker men was also not supported by our findings. In the univariate models, higher status men appear to have the lowest death rates of any group, although the rates appear to increase over time and con-
Table 1 .-Parameter estimates of an exponential model of mortality, 1984-92: Aging retired- and disabled-worker men interviewed in the 1982 New Beneficiary Survey
1985 . . . . . . . . . . . . . . . . . .
1986 .,................
1988 .,................
1989 ,,................
1991.,................
1992 .,............_... ~~~ ~~~~
’ Duration of life in years was computed using the Exponential Hazard Analyis of the LIFEREG
statistical procedure of SAS.
Note: Significance levels: *=p<.o5 ** = p < .01
verge toward the end of the observation period (chart 3). Controlling for the effects of other variables, all SES mea- sures have statistically significant associ- ations with waiting time to death. Re- tired men with less than college education had shorter times to death: those with higher income-to-poverty ratios survived longer. Thus, we find convincing and statistically significant differentials in the mortality experience of aging retired-worker men.
Private Health Insurance
Private health insurance was signifi- cantly associated with reducing the haz- ,ard of mortality for both retired ‘and disabled men, but the difference was more salient for the retired (table 2). It is interesting to note that the probabil- ity of death among disabled men is simi- lar up until 1989 regardless of their health insurance coverage (chart 4). The role of health insurance in buffering the effects of emerging health problems for men, whether retired or disabled, appears to have an important impact not only in providing greater access to necessary health services but, more importantly, in postponing the waiting time to death.
Implications for Research and Policy
This research has demonstrated some striking contrasts in the mortality experi- ence of a cohort of retired- and disabled- worker men. Our major findings con- vincingly show that there is (1) a racial difference in mortality among disabled men, but not the retired and (2) a socio- economic difference in mortality among those who are retired, but not for dis- abled individuals.
We had expected to find racial differ- ences in the mortality experience of the retired but not for disabled men. We found the opposite. In accordance with the “social characteristics hypothesis,” we had reasoned that once SES and certain demographic characteristics were controlled, racial influences would disap- pear (Rogers 1992). Our findings
Social Security Bulletin l Vol. 57, No.3 l Fall 1994 81

strongly demonstrate the presence of a link between race and waiting time to death after controlling for other demo- graphic, health status, and SES vari- ables. Black disabled-worker beneficia- ries have a shorter time to death than white disabled-worker beneficiaries in the first years after starting benefits.
We propose the following explana- tions for these observed racial differ- ences. Our survey variables may not adequately measure differences in the health and functional status of severely disabled black men, especially shortly after they (are screened into the program. It is possible that they are more debilitat- ed than white men at the time of award and thus are quicker to experience mor- tality. As reported earlier, black men are known to have higher death rates due to heart disease, stroke, cancer, diabetes, homicide, accidents, and substance abuse (DHHS 1985). Black persons within the sample had probably experienced a rela- tively deprived and perhaps more stress- ful life prior to award of disability bene- fits.
We attempted to control for health conditions by including circulatory, digestive, respiratory, nervous disorders, and neoplasms in our model: we also attempted to control for functional limi- tations by including reports of severe
impairment of activities, which were linked to records of inpatient hospitaliza- tion. However, these may not be suffi- cient to reflect cumulative stresses over a lifetime. On the other hand, we cannot rule out an alternative possibility-that in one or another respect, the Social Security DI program may not be as uni- versally objective as had been assumed by the General Accounting Office (1992). Therefore, we suggest that it would be prudent for future research to focus attention on racial differences in health and mortality outcomes.
We had also hypothesized that we would find no effects of SES on mortality among retired-worker men. For the most part, we found the opposite. A strong relationship of lower status, par- ticularly lower educational attainment, to a shorter waiting time to death remained after adjusting for other characteristics. This is inconsistent with the literature on demography of the aged. The classic study by Hauser and Kitagawa reported that educational differentials in mortality were not present among black men and their white counterparts aged 65 or older. This null relationship was supported by analyses of the Retirement History Sur- vey (RHS) and the National Longitudinal Survey (NLS) (Feinstein 1992).
Several possibilities may explain our
Chart 2.-Race differences: Probability of death for aging retired- and disabled- worker sample men
Death rate 0.07 -
0.06--
O.Oj--
~~ It Disabled white O.Ol--
n
1 - - -~~ Retired black
1 i- Disabled black
”
1983 1984 1985 1986 1987 1988 1989 1990 1991
Survival years
Source: Hazard of Mortality: life table analysis using the SAS LIFETEST: 1982 New Beneficiary Survey.
surprising findings. We may have a more complete measure of mortality- one that is based on administrative records of death followed for almost a decade. Hauser and Kitagawa examined death certificates in a short period after the 1960 Census, and the RHS and NLS followed death over a longer time period as part of the survey process. However, our measure of death is derived from reports made to the Social Security Ad- ministration as part of the award of bene- fits to widows and as a result of adminis- trative reporting by funeral homes and States. Although SSA’s death reporting system is not free from criticism, analy- sis by GAO (1992) indicates it is 90- percent accurate in the short run, and the remaining cases mainly result in delayed but accurate reporting.
Alternatively, the NBS sample repre- sents a specialized population that began receiving SSA benefits in a one-year period. We dismiss this as a likely source of differences because, though the sample is not nationally representative of the complete U.S. population of aged and disabled persons, it does represent the major components of the U.S. male pop- ulation. Most American men collect Social Security retirement benefits and all types of men are represented in a sample of retirees drawn over a one-year period. The aged retirees exclude those aged men who were disabled workers. Because the disabled men have lower SES, this would result in a higher SES group of retirees compared to the general aged population. The convergence of mortality rates between the retired and disabled populations is quite striking given their different SES backgrounds.
Another possibility is that the better educated disabled-worker beneficiaries may be more severely disabled, reflecting the vocational factors used in the deter- mination process. If so, the more severe disability of the better educated could result in higher death rates, which offset the lesser mortality usually tied to higher SES through greater human capital and economic resources. The end result would be no SES effects among disabled men. We believe a closer examination of SES-related mortality differentials is currently merited.
82 Social Security Bulletin l Vol. 57, No. 3 l Fall 1994

In sum, this article follows in the served in her review of the literature, mainstream of current mortality re- “...currently the emphasis is placed on search. As Crimmins (1993) has ob- describing differences according to race,
Table 2.-Combined sociodemographic and health status models of length of life among aging retired- and disabled-worker men beneficiaries, 1984-92
Retired Disabled
Characteristic ~ i
Intercept.. .....................
Duration
1985.. ..................................
1986.. ..................................
1987.. .................................. ,
1988.. ...................................
1989.. ...................................
1990.. ...................................
1991....................................’
1992. ...................................
Sociodemographic
Chronological age ................
Married ................................
Race: Black.. .......................
Education: 0-I 1 years.. ........
Education: 12 years.. ........... Poverty ratio ‘. .....................
Private health insurance ......
Health assessment
Number of disorders.. .........
Type or disorder:
Circulatory.. ......................
Digcstivc.. .........................
Respiratory.. ...................... ~ Nervous.. ........................... Neoplasms.. .......................
Severly limited ‘. ...............
Hospital inpatient ..............
Estimate’ ~
I Standard ~
error 1
0.639
I
Estimate’ ~
7.987** 5.648***
,142 .106 .198*
-.02 I ,101 .302**
-.I25 ,099 ,166
-.230 ,098 ,068
-.221 ,098 ,109
-.316** ,096 .227*
-.366*** ,096 ,132
-1.218*** ,099 -.750***
-.063*** ,010 -.043***
.266*** ,064 .196**
-.099 ,087 -.299***
-.217** ,066 ,135
-.245** ,069 ,019
.208** ,061 ,063
.249*** ,060 .131*
,010 ,022 .070**
-.171* ,060 -.343***
-.145* ,068 -.252***
-.295*** ,069 -.464***
-.012 ,100 -.I04
-.584*** ,100 -.616***
-.147 ,089 ,819
-2.021*** ,054 .1.650***
Standard error
0.198
.099
,105
,102
.I02
,105
,112
,110
,107
,003
,068
,080
,084
,089
,063
,062
,020
,073
,063
,061
,007
,090
.060
,059
’ Duration ofwaiting time to death (life years) was computed using the Discrete Time Exponential Hazard Modelling I.II~l:liEG statistical procedure from SAS. Note: Negative coefficients represent
shorter waiting time
2 Family income ratio to poverty.
‘Computed using I laher Functional Capacity Index
Note: StatIstical significance levels: *= p< 05
** = p < 01
*** = p < .OOl
Source: 1982 NW Ikncficiary Survey.
ethnicity, and social class.” We have analyzed the standard variables: in addi- tion, we have taken private health insur- ance and marital status into account, and found private health insurance decreases mortality among the aged and those who are disabled.
Crimmins further noted that addi- tional independent variables are needed to measure the effects of social support. Our inclusion of marital status among the independent variables in our analysis was introduced to reflect a related dimension of social and emotional sup- port. We found that married persons tended to live longer, that having a spouse acted as a buffer effect on mortal- ity. Consequently, further research on the role of social support as suggested by Crimmins seems a promising possibility. The Social Security Administration com- pleted a follow-up survey in 199 1 with the 1982 sample persons and surviving spouses, which contained several mea- sures of social support, including receipt and sources of assistance for the activi- ties of daily living ‘and the instrumental activities of daily living. Additional information was also obtained conccm- ing contacts with and proximity to chil- dren and parents, and reasons for migra- tion (including the need to be near family members and to obtain better social services). These longitudinal data promise to be an excellent means to cl,arify the role of social support in diffcr- ential mortality.
Appendix
In the first tabulation on p. 77, a negative coefficient indicates that there is a shorter waiting time to death, and statistical significance indicates that the effects are unlikely due to chance.
In agreement with published life tables, older persons had a significantly shorter waiting time to death. Consistent with our review of the literature, married persons had a significantly longer wait- ing time to death. Having a spouse ap- pears to have an important buffering effect associated with extending the probabilities of longer life expectancy for both disabled and retired men.
As expected, persons in worse health had significantly shorter waiting times to
Social Security Bulletin l Vol. 57, No.3 l Fall 1994 83

Chart 3.-Income differences: Probability of death for aging retired- and disabled- worker sample men
Death rate
0.06
1986 1987 1988 1989 1990 1991
Survival years
Source: Hazard of Mortality: life table analysis usingthe SAS LIFETEST: 1982 New Beneficiary Survey.
Chart 4.-Differences in private health insurance coverage: Probability of death for retired- and disabled-worker sample men
Death rate
Retired without insurance /
Retired with insurance
Disabled with insurance
1983 1984 1985 1986 1987 1988 1989 1990 1991
Survival years
Source: Hazard of Mortality: life table analysis using the SAS LIFETEST: 1982 New Beneficiary Survey.
death. The effects associated with Medi- care inpatient expenses, as found in the Medicare Automated Dam Retrieval System, deserve special comment. This measure, derived from administrative filing of medical bills, is highly signifi- cant. Although it is well-known that Medicare expenses are concentrated in the year of death, it is instructive to show the pattern of hospitalization and year of death (see charts Al and A2). For both retired and disabled men, the probability of inpatient hospitalization remains relatively stable across time until just before the year of death, when it rapidly increases. Interestingly, the likelihood of hospitalization was similar in the last yeCars of life for both groups of men. This suggests that in the United States, death is closely connected to hospitaliza- tion.
Age appears to have a strong impact on the “press of mortality” in both groups. Aging (shown by the year coef- ficients in the multivariate model), fur- ther suggested by the significance levels and the increasing size of the negative coefficients in later years, has its most important impact on the waiting time to death among retired workers. The coef- ficients were particularly large from 1990 through 1992. In contrast, among disabled workers, the most significant impact is for the first 2 years (1985 and 1986) and the last year (1992). It is important to note that the 1992 death information may be incomplete in our SSA records from March 1993 to present-and thus somewhat understates mortality for that year-but should be very complete for earlier years (GAO 1992).
84 Social Security Bulletin l Vol. 57, No. 3 l Fall 1994

Chart A 1 .--Aging retired-worker men with Medicare inpatient expenses
PlXWlt
100
80
60
1984 1985 1986 1987 1988
Year of expenses
1989 1990 1991
X~ Diedin 1987
0 Died in 1988
1 A~ Diedin 1989
~ 0 Died in 1990
t- Died in 1991
cl Survivor
Chart A2.-Aging disabled-worker men with Medicare inpatient expenses
PtXCUll
1987 1988
Year of expenses
Died in lY87
Died in 1988
Died in 1989
Died in 1990
Died in 1991
Survivor
Notes dividing this total by the adjusted family ’ It should be noted that the MADRAS poverty guidelines.
’ Those aged 31 or older must have at does not reflect some services for which 4 In general, higher income persons have least one quarter of coverage for each year Medicare is secondary to another insurer. private health insurance. However, many after a8e21,and must have at least20 quar- 3 The ratio of family income to poverty persons who have moderate to lower incomes ters of coverage in the last 40 (5 of the last 10 was created by compiling the total sources of and who work under union contracts also years. quarterly family income reported in 1982 and have health insurance.
Social Security Bulletin l Vol. 57, No.3 l Fall 1994 85

’ Functional status is treated as a separate health-status dimension based on response to a series of physical functioning questions. Items include ability to walk, lift varying weights, stoop, bend, crouch or kneel, reach or grasp, and use the fingers. Concerned with work disability, Haber (1973) proposed an index of Functional Capacity Limitation with these measures providing a rational scale for ranking respondents on the index. The original classification included no limita- tions; minor limitations (manual or body movement limitations other than walking or using hands); moderate limitations (limits in walking or in using hands, but not both); and severe limitations (both walking and using hands). In the present analysis, dependent persons are included with the severely im- paired.
6 The NBS identified the presence of 14 major disease conditions. The number of diseases is the count of categories with a condition present. Circulatory, digestive, and respiratory conditions are important clusters associated with mortality and with inpatient utilization of services. Musculoskeletal conditions, such as arthritis, are a frequent source of disability, but rarely fatal.
’ The much lower death rate of black disabled-worker men after 1989 is the excep- tion. We cannot fully explain this, but a small sample size could partly account for this outlier. The NBS proportionately sam- pled aging black disabled-workers so that the initial sample size was not large, and it had decreased substantially by 1991 due to death.
References
Advisory Council on Social Security. 1991. Report on Medicare Projections by the Health Technical Panel to the 1991 Advisory Council on Social Security. Washington, DC.
Cleary, P. D. and R. Angel. 1984. “The Analysis of Relationships Involving Dichotomous Dependent Variables.” Journul of Health and Social Behavior, Vol. 25 (September), pp. 334-338.
Committee on Ways and Means. 1989. Back- ground Material and Data on Programs Within the Jurisdiction of the Committee on Ways and Means. Washington, DC: U.S. House of Representatives.
Crimmins, E. 1993. “Demography: The Past 30 Years, the Present, and the Future.” Demography, Vol. 30, No. 4.
Department of Health and Human Services. 1990. Task II: Federal Programs For Persons With Disabilities. Department of Health and Human Services. Assistant Secretary for Planning and Evaluation. Washington, DC.
Duleep, H. 1986. “Incorporating Longitudi- nal Aspects Into Mortality Research Using Social Security Administrative Record Data.” Journal of Economic and Social Measurement, Vol. 14, No. 2, pp. 121-133.
Duleep, H. 1986. “Measuring the Effect of Income on Adult Mortality Using Longitu- dinal Administrative Record Data.” Jour- nul of Human Resources, Vol. 21, No. 2 (Spring), pp. 238-25 1.
Duleep, H. 1989. “Measuring Socioeconomic Mortality Differentials Over Time.” Demography, Vol. 26, No. 2 (May), pp. 345-35 1.
Feinstein, J. F. 1993. “The Relationship Between Socioeconomic Status and Health: A Review of the Literature.” The Milbank Quarterly, Vol. 71, No. 2, pp. 279-322.
Gove, W. R. 1973. “Marital Status and Mortality.” American Journal of So- ciology, Vol. 79, No.1 (July), pp. 45-67.
Haber, L. 1973. “Disabling Effects of Chronic Disease and Impairment-II- Functional Capacity Limitation.” Journal of Chronic Disorders, Vol. 26, pp. 127-151.
Hennessey, John C. and Janice M. Dykacz. 1992. “Comparison of Individual Charac- teristics and Death Rates of Disabled- Worker Beneficiaries Entitled in 1972 and 1985.” Social Security Bulletin, Vol. 55, No. 3 (Fall), pp. 24-40.
Hu, Y. and N. Goldman. 1990. “Mortality Differentials by Marital Status: An Inter- national Comparison.” Demography, Vol. 27, No. 2 (May), pp. 223-250.
Iams, H. M. and J. L. McCoy. 1991. “Predic- tors of Mortality Among Newly Retired Workers.” Social Security Bulletin, Vol. 54, No. 3 (March), pp. 2-11.
Keith, V. M. and D. P. Smith. 1990. “The Current Differential in Black and White Life Expectancy,” Demography, Vol. 25, No. 4 (May), pp. 625-632.
Kitagawa, E. M. and Hauser, P. M. 1973. Differential Mortality in the United States: A Study in Socioeconomic Epide- miology. Cambridge, MA: Harvard Uni- versity Press.
LaPlante, M. 1988. Data on Disability from the National Health Interview Survey: 1983-85. Nationai Institute on Disability and Rehabilitation Research. U.S. Depart- ment of Education. Washington, DC.
Luft, H.S. 1978. Poverty and Health: Eco- nomic Causes and Consequences of Health Problems. Cambridge, MA: Ballenger.
Maxfield, L. D. 1983. “The New Beneficiary Survey: An Introduction.” Social Security Bulletin, Vol. 46, No. 3. (November), pp. 3-11.
McCoy, J. L. and H. M. Iams. 1991. “Hospi- tal Care Among Retired-Worker Benefi- ciaries: Effects of Health, Mortality, and Personal Characteristics.” (Paper Pre- sented to the Annual Meeting of the American Public Health Association: Atlanta, GA).
McCoy, J. L. and H. M. Iams. 1994. “Disabled Workers’ Risk of Hospitaliza- tion and Death.” Health Care and Financing Review, Vol. 15, No. 4 (Summer), pp. 61-76.
Muller, L. S. 1989. “Health Insurance Cover- age Among Recently Entitled Disability Insurance Beneficiaries: Findings From the New Beneficiary Survey.” Social Security Bulletin, Vol. 52, No. 11 (November), pp. 2-17.
National Center for Health Statistics/U.S. Public Health Service. Vital and Health Statistics of the United States-1980. Vol. II. Section 6. Life Tables. Washington, DC.
Otten, M. W.; S.M.Teutsch, D.F. Williamson, and J.S. Marks. 1990. “The Effect of Known Risk Factors on the Excess Mortality of Black Adults in the United States.” Journal of the American Medical Association, Vol. 263, No. 6.
Packard, M. 1993. “Health Status of New Disabled-Worker Beneficiaries: Findings From the New Beneficiary Survey.” Social Security Administration’s Compila- tion of Reports form the 1982 New Bene- ficiary Survey, Office of Research and Statistics, Social Security Administration, pp. 37-58.
86 Social Security Bulletin l Vol. 57, No. 3 l Fall 1994
Packard, M. 1987. “Income of New Dis- abled-worker Beneficiaries and Their Families.” Sociul Security Bulletin, Vol. 50, No. 3 (March), pp. 5-23.
Riley, G. F.; J. Lubitz; and E. Rabey. 1991. “Enrollee Health Status Under Medicare Risk Contracts: An Analysis of Mortality Rates.” He&h Services Research, Vol. 26, No. 2, pp. 137-164.
Rogers, R. G. 1992. “Living and Dying in the U.S.A.: Sociodemographic Determinants of Death Among Blacks and Whites.” Demopzphy, Vol. 29, No.2 (May), pp. 287-304.
Rubin. J. I. and V. Wilcox-Gok. 1991. “Health Insurance Coverage Among Disabled Medicare Enrollees.” Health Cure Financing Review, Vol. 12, No.4 (Summer), pp. 27-38.
Social Security Administration. 1993. Statis- tical Notes, from the new Beneficiary Data System, Social Security Bulletin, Vol. 3, No. 56, pp. 88-94.
Social Security Administration. 1986. The 1982 New Beneficiary Survey: User’s Manual. U. S Government Printing Of- fice. Office of Research and Statistics. Washington, DC.
Social Security Administration. 1990. Social Security Bulletin. Annual Supplement. U.S. Government Printing Office. Washington, DC.
Syme, S. L. and L. .F. Berkman. 1976. “So- cial Class, Susceptibility and Sickness.” American Journul of Epidemiology, Vol. 104 , pp. 11-8.
Ware. J. E. Jr.; W. H. Rodgers; J. P. Newhouse; W. G. Manning; M. S. Marquis; C. N. Morris; E. B. Keeler; A. Leibowitz; K. N. Lohr; N. Duan; A. R. Davis; and R. H. Brooks. 1987. “The Findings of the Rand Health Insurance Experiment-A Response to Welch et al.” Medical Care, Vol. 25, No. 2, pp. 157-159.
Yeas, M. A. 1986. “Asset Holdings of the Newly Disabled.” Social Security Bulletin, Vol. 49. No. 12 (December), pp. 5-12.
Announcement of Public-Use Xape
The Social Security Administration encourages researchers to utilize the data in the New Beneficiary Data System. A public-use file of the New Beneficiary Followup data-which can be linked to the public use New Beneficiary Survey and administrative files of benefits, earnings, SSI participation and Medicare expenditures-is now available. All data meet rigorous standards for the protec- tion of individuals privacy and confidentiality.
For further information contact:
Howard M. Iams Program Analysis Division Office of Research and Statistics Social Security Administration 430 1 Connecticut Ave., N.W. Washington, DC 20008
Dr. Iams may also be reached by phone: 202-282-7092
Social Security Bulletin l Vol. 57, No.3 l Fall 1994 87