Embed Size (px)
Citation preview
European Review of Economic History , –. Printed in the United Kingdom C© Cambridge University Press
The growth of the Italian economy,–: Preliminarysecond-generation estimatesSTEFANO FENOA LTEAFacolta di Economia, Universita di Roma, ‘Tor Vergata’ via Columbia , Roma, Italy
This article presents new estimates of aggregate production in post-unification Italy: the first since the original Istat-Vitali estimates of someforty years ago not to recombine their component series, and to be basedentirely on new research. The new -price GDP series incorporates therecent Federico series for agriculture, the author’s recent series forindustry, and newly derived series for services that extrapolate the recentZamagni estimates of their value added in . The new time series forthe sectors specified by the original estimates often differ widely fromtheir predecessors. The new aggregate yields a long-term growth rate wellabove that of the original series, but not as high as that of Maddison’srevision. The end-of-the-century acceleration that characterised all theearlier aggregates disappears: total production followed in muted form thelong swing in industrial production, which in turn reflected a simpleinvestment cycle. The implications of the new series in the context of theongoing debates in the literature are also briefly discussed.
Italy was among the very first countries to boast a complete set ofhistorical national accounts, from Unification () on. As was soonpointed out, however, the estimates for the initial half-century were basedon very poor data, and appeared seriously to misrepresent the path of totalproduct. Quantitative historians have devoted considerable effort to thereconstruction of the national accounts’ basic building blocks; and enoughmaterial is now available to permit the first thoroughgoing recalculation ofItaly’s aggregate product from Unification to the First World War.
. The time series and the historians’ debates
Italy’s historical national accounts were compiled in the mid-s by Istat,the Istituto Centrale di Statistica. These estimates included a detailedreconstruction of both the production side and the expenditure side atcurrent prices, and of the latter alone at constant () prices; -priceproduct series were however also provided for core agriculture (cultivationand herding) and for manufacturing industry (Istat ). A decade later,

European Review of Economic History
40
60
80
100
120
65 70 75 80 85 90 95 00 05 10
gross domestic productaggregate value added(demographic trend)private consumption
Figure . Istat-Vitali aggregate estimates (bn lire at prices).
Source: Table .
-price estimates of the production side consistent with the Istat serieswere compiled by Ornello Vitali, the statistician of the ‘Ancona group’organised by Giorgio Fua under the auspices of the SSRC (Ercolani ;Fua , ; Vitali ). The ‘Istat-Vitali’ estimates of production (andprivate consumption) in – are collected in Table .
The message of these estimates was that growth accelerated sharply inthe mid-s; up to that point real per capita output barely drifted up,while real per capita consumption actually drifted down (Figures and ).Vitali’s sector-specific figures locate this discontinuity in commodityproduction (Figure ). Agriculture (dominated by the Istat cultivation-and-herding series) grows in rough step with population until , thenstagnates through the mid-s; it then pops back up to its previous trendline, and in the last decade before the Great War again grows (on average)about as fast as population. Industry (dominated by the Istat manufacturingseries) grows somewhat faster than population into the mid-s, stagnates
Vitali’s estimates were based in so far as possible on Istat’s own data and estimates; minordiscrepancies survived the attempt to reconcile the aggregates, but for present purposesthese can be ignored.
The sources of the series in Table are described in Appendix A. The value added seriesin cols. , and exclude the otherwise double-counted non-final component ofbanking and insurance services.

The Italian economy, –
1.6
1.8
2.0
2.2
2.4
2.6
2.8
3.0
3.2
65 70 75 80 85 90 95
gross domestic productprivate consumption
00 05 10
Figure . Istat-Vitali per capita estimates (thousand lire at prices).
Source: Table .
10
20
30
40
65 70 75 80 85 90 95 00 05 10
(demographic trend)agricultureservicesindustrymanufacturing
Figure . Istat-Vitali value added estimates, by major sector (bn lire at prices).
Source: Table .

European Review of Economic History
for a decade, and then grows significantly faster than before. The path ofservices (estimated by deflating the Istat series at current prices) insteaddisplays a relatively smooth acceleration, surpassing the rate of populationgrowth from about .
These time series were immediately drawn into the historians’ debate. Onthe one hand, the production estimates fit Alexander Gerschenkron’s viewthat Italy’s industrial take-off was due to the foundation of the German-stylemixed banks in : so much so that Gerschenkron himself was willingto consider Istat’s industrial index superior to his own, which indicatedsignificant growth in – as well as after . On the other hand, theconsumption estimates suggested that the ‘crisis of the s’ due to the fallin world grain prices was not merely a crisis of the grain-growing sector in anotherwise prosperous economy, as the earlier literature had it, but a generalcrisis, marked by widespread hardship. Gino Luzzatto, who had claimed asmuch, was apparently vindicated; Rosario Romeo was reluctantly convincedby the quantitative evidence.
The Istat-Vitali edifice was in fact challenged as soon as it was completed.The present writer’s dissertation included a revision of Gerchenkron’s indexof industrial production that made use of the new material presented byIstat in its abstract of historical statistics, and its excellent guide to Italy’sdata sources (Istat –, Istat ; Gerschenkron , Fenoaltea ).Following Gerschenkron’s example, the new index represented the millingindustry by the human consumption of wheat and corn. The correspondingIstat series, which incorporate the historical data used by Gerschenkron andextend them back to the s and ’s, yielded the graph here reproducedas Figure . The figures for the s were confirmed by the grist tax, thosefor the s were based on the crop estimates generated by an entirely newstatistical service; and these point to very similar per capita figures. The datafor the s and early s were also derived from current crop estimates,but these were so notoriously unreliable that their publication was suspendedin (Istat –, vol. VII, p. ). In per capita terms, the decline around is of the order of a fifth, the increase at the turn of the century of theorder of a half (Barberi ): both swings are impossibly large, both aretied to a change in the underlying sources, both are, as far as one can tell,statistical fictions. The production and processing of grain were significantparts of the Italian economy, and even greater parts of its measured subset;in the s and s the Istat series increasingly underestimate bothagricultural and industrial production (and private consumption), and the
See Gerschenkron (), Romeo (), Gerschenkron and Romeo (),Gerschenkron (), and Luzzatto (); for a review of these debates, Fenoaltea(). Luzzatto’s work emerged from a lengthy gestation, and was clearly drafted beforethe Istat series appeared.
The basis for the earliest estimates could not be traced, as Istat described its proceduresonly in very general terms. Vitali’s account is similarly hermetic.

The Italian economy, –
20
40
60
80
100
120140
65 70 75 80 85 90 95 00 05 10
Istat series (1958)Fenoaltea series (1967)
Figure . Wheat and corn for human consumption (m. quintals).
Source: Fenoaltea (), p. .
turn-of-the-century discontinuity in the growth rate is essentially the removalof that error (Fenoaltea , , ).
The author’s own index (with a milling series that assumes constantper capita grain consumption) picked up the manufacturing surge of thes (and the subsequent decline into the mid-s) even better thanGerschenkron’s index, and far more than the Istat series borrowed by Vitali.But that index aimed at tracking recorded output, and did not attempt tobe representative; since it missed most of the traditional, largely artisanalconsumer-goods sectors that presumably grew slowly if at all, it clearlyexaggerated both the cycle and the end-to-end growth rate (Fenoaltea ,). The present author’s own initial correction to obtain a representativeindex for manufacturing assumed that the omitted sectors grew (on average)in step with total population; and that reduced the end-to-end growth rateright back to Istat’s (Fenoaltea , ).
There the numbers essentially rested, for the better part of some thirtyyears. The present author continued to improve his industrial estimatesfor –, occasionally publishing individual series; a separate index ofindustrial production from to was put together by Albert Carreras(Carreras , , ); and that was pretty much the extent of therevision of the national accounts’ basic components. The new series referredto industry alone, and the only set of comprehensive estimates remained theIstat-Vitali series.

European Review of Economic History
The early s saw a flurry of revisions of the aggregate figures, butthese typically limited themselves to reassembling the Istat-Vitali series, withpredictably limited results (Bardini et al. , Cohen and Federico ;also Canullo ).
The only new aggregate measure based at least in part on new timeseries was Angus Maddison’s (Maddison ), here reproduced in Table .Maddison used Istat’s current-price estimates for to combine the Istat-Vitali series for agriculture and services (Table , cols. and –) andindustrial series by the present author: the new series for the extractiveindustries, construction, and utilities (Fenoaltea , , a), and anindex for manufacturing based on the author’s first index (Fenoaltea ),corrected to remove the utilities, and expanded to include the new series forthe silk industry (Fenoaltea b). In this fashion Maddison noticeablyincreased the overall growth rate: his GDP series increases between
and by a factor of ., against just . for the Istat-Vitali estimates. Onthe other hand, that series remains dominated by the Istat components, andapart from a trend correction its path remains extremely close to that of theIstat aggregate (see below, Figure ).
Meanwhile, the literature evolved a curiously schizoid reaction to the earlycritique of the Istat estimates. The general criticism of the Istat series waswidely accepted: these fell into disrepute, to the point that the overhaul ofthe historical accounts was among the projects sponsored by the Bank ofItaly in view of its centenary in . The specific suggestion that the Istatseries badly underestimated industrial growth in the s (because theywere dragged down by the growing downward bias in the grain-productionand consumption data) was also well received, not least because it confirmedthe prevailing impression derived from traditional sources. The conventionalwisdom quickly became that the industrial upsurge of the s was asmeaningful as that of the early s, and such senior scholars as FrancoBonelli and Luciano Cafagna recast Romeo’s stages-of-growth interpretationto encompass a drawn-out take-off with successive ‘waves’ (Bonelli ,Cafagna a, b).
The banking and insurance series used by Maddison is gross of double-counted businessservices, and the construction series he used does not seem to be the appropriate one; butthose sectors are small, and the consequences are not serious. See below, Appendix A.
The heirs of the Ancona group continue however to this day to analyse the cyclicalfluctuations of the original Vitali series, either out of filial piety or – in the absence ofcomprehensive alternative estimates – a Nelsonian talent for exploiting a blind eye; seemost recently Delli Gatti et al. ().
The extant reviews of the literature typically fail to recognise the nature of theBonelli-Cafagna interpretation, and erroneously claim that the stages-of-growth approachhas been abandoned (for example, Zamagni , Cohen and Federico ; seeFenoaltea ).

The Italian economy, –
Table . Istat-Vitali estimates of Italian GDP, – (bn lire at prices).() () () () () () ()
Istat-Vitali: value added in commodity production
IndustryPopulation(millions) Agriculture Extr. Manuf. Constr. Util. Total
. . . . . . . . . . . . . . . . . . . . . . . . . . . .
. . . . . . . . . . . . . . . . . . . . . . . . . . . . . . . . . . .
. . . . . . . . . . . . . . . . . . . . . . . . . . . . . . . . . . .
. . . . . . . . . . . . . . . . . . . . . . . . . . . . . . . . . . .
. . . . . . . . . . . . . . . . . . . . . . . . . . . . . . . . . . .
. . . . . . . . . . . . . . . . . . . . . . . . . . . . . . . . . . .
. . . . . . . . . . . . . . . . . . . . . . . . . . . . . . . . . . .
. . . . . . . . . . . . . . . . . . . . . . . . . . . . . . . . . . .
. . . . . . . . . . . . . . . . . . . . . . . . . . . . . . . . . . .
. . . . . . . . . . . . . . . . . . . . . . . . . . . . . . . . . . .
. . . . . . . . . . . . . . . . . . . . . . . . . . . .

European Review of Economic History
Table . Continued.() () () () () () ()
Istat-Vitali: value added in services
Banking Misc. PublicTransport. Commerce and ins. serv. Buildings admin. Total
. . . . . . . . . . . . . . . . . . . . . . . . . . . .
. . . . . . . . . . . . . . . . . . . . . . . . . . . . . . . . . . .
. . . . . . . . . . . . . . . . . . . . . . . . . . . . . . . . . . .
. . . . . . . . . . . . . . . . . . . . . . . . . . . . . . . . . . .
. . . . . . . . . . . . . . . . . . . . . . . . . . . . . . . . . . .
. . . . . . . . . . . . . . . . . . . . . . . . . . . . . . . . . . .
. . . . . . . . . . . . . . . . . . . . . . . . . . . . . . . . . . .
. . . . . . . . . . . . . . . . . . . . . . . . . . . . . . . . . . .
. . . . . . . . . . . . . . . . . . . . . . . . . . . . . . . . . . .
. . . . . . . . . . . . . . . . . . . . . . . . . . . . . . . . . . .
. . . . . . . . . . . . . . . . . . . . . . . . . . . .
The Italian economy, –
Table . Continued.() () () () () ()
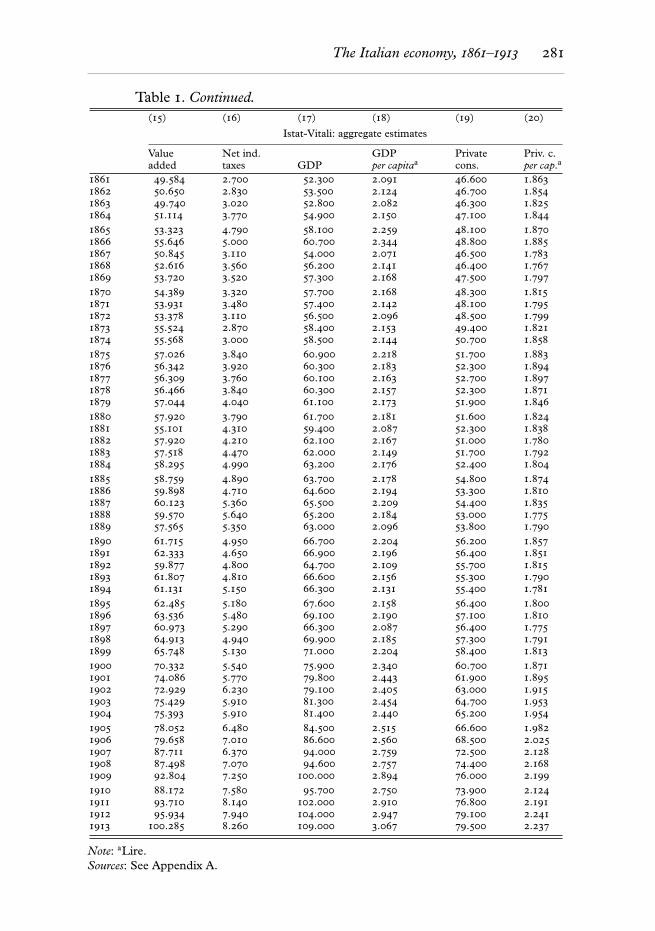
Istat-Vitali: aggregate estimates
Value Net ind. GDP Private Priv. c.added taxes GDP per capitaa cons. per cap.a
. . . . . . . . . . . . . . . . . . . . . . . .
. . . . . . . . . . . . . . . . . . . . . . . . . . . . . .
. . . . . . . . . . . . . . . . . . . . . . . . . . . . . .
. . . . . . . . . . . . . . . . . . . . . . . . . . . . . .
. . . . . . . . . . . . . . . . . . . . . . . . . . . . . .
. . . . . . . . . . . . . . . . . . . . . . . . . . . . . .
. . . . . . . . . . . . . . . . . . . . . . . . . . . . . .
. . . . . . . . . . . . . . . . . . . . . . . . . . . . . .
. . . . . . . . . . . . . . . . . . . . . . . . . . . . . .
. . . . . . . . . . . . . . . . . . . . . . . . . . . . . .
. . . . . . . . . . . . . . . . . . . . . . . .
Note: aLire.Sources: See Appendix A.

European Review of Economic History
Table . Maddison estimates of Italian GDP, – (m. lire at prices).
() () () () () ()Value added in commodity production
Industry
Agriculture Extr. Manuf. Constr. Util. Total , , , , , , , , , , , ,
, , , , , , , , , , , , , , ,
, , , , , , , , , , , , , , ,
, , , , , , , , , , , , , , ,
, , , , , , , , , , , , , , ,
, , , , , , , , , , , , , , ,
, , , , , , , , , , , , , , ,
, , , , , , , , , , , , , , ,
, , , , , , , , , , , , , , ,
, , , , , , , , , , , , , , ,
, , , , , , , , , , , ,

The Italian economy, –
Table . Continued.() () () () () () () () ()
Value added in services
Banking GDPand Misc. Public per capita
Transport. Commerce ins. serv. Buildings admin. Total GDPa (lire) , , , , , , , ,
, , , , , , , , , ,
, , , , , , , , , ,
, , , , , , , , , ,
, , , , , , , , , ,
, , , , , , , , , ,
, , , , , , , , , ,
, , , , , , , , , ,
, , , , , , , , , ,
, , , , , , , , , , , ,
, , , , , , , , , , , , , , , ,
Note: aAt factor cost.Sources: See Appendix A.

European Review of Economic History
On the other hand, the profession at large rejected the further suggestionthat – for exactly the same reason – the Istat series badly underestimatedthe growth of agricultural production and aggregate consumption over thes and early ’s. On this point, the conventional wisdom became theview supported by the Istat series: that the s were a decade of crisis andhardship, with an agricultural collapse that offset the industrial boom, and areduction of consumption that offset the growth of investment. Even Italy’smost numerate historians subscribed to this new interpretation: thus GianniToniolo (Toniolo ) and Vera Zamagni (Zamagni ), even though theonly statistics that can be cited to support it are the very Istat-Vitali seriesthey too criticise in other chapters.
The steady exception here has been Giovanni Federico. He has made thecriticism of the agricultural data his own, and he has taken on the thanklesstask of re-estimating the time series for agricultural production (Federico, a, b; Cohen and Federico, ). He has shared the certaintythat the Istat-Vitali series badly underestimated agricultural production andfood consumption in the s and s, and a deep scepticism of the newconventional wisdom on the ‘crisis of the s’.
The older view that the fall in grain prices in the early s benefitedthe economy at large and the working poor in particular has recentlyreceived very strong statistical support: the newly constructed series fortextile production imply cyclically high consumption levels in the s,and the newly constructed series tracking the wages of unskilled labor showrising nominal wages even as falling grain prices cut the cost of living. Themovements in per capita food consumption over the s recorded by theIstat-Vitali series were not only impossibly large, they were to all accountsof the wrong sign; in the s the crisis was of the landowners alone, thegeneral crisis of those years was so much nonsense (Fenoaltea a, ).
. The state of the art and the new time series
The Bank of Italy’s project on the revision of the historical accounts,entrusted to Guido Rey, led initially to the re-estimation of aggregate productat current prices in ; the calculation of the sectoral value-added estimateswas assigned to Federico (agriculture), the present author (industry), andZamagni (services). These estimates were retouched almost a decade later,when parallel current-price estimates were compiled for , , and
The controversy concerns the s alone, as the s were clearly dismal, and the earlys clearly prosperous. Strictly speaking, the dispute is even narrower than that: the oldview which has now been revived placed the cyclical downturn in , when thereal-estate bubble burst, while the now dominant view places it in the early years of thedecade, when wheat prices collapsed. For an extended critique of the arguments andevidence adduced to support the currently popular interpretation, see Fenoaltea (a).

The Italian economy, –
(Federico , ; Fenoaltea , Fenoaltea and Bardini ;Rey , ; Zamagni , Zamagni and Battilani ).
Meanwhile, as noted, the laborious calculations aimed at re-estimatingthe time paths of industrial and agricultural production were proceeding;they are still proceeding, and still some distance from completion. At acertain point, however, the work is far enough along that the temptationto preview the likely outcome becomes irresistible; and that point has beenreached.
Not long ago the present author published a preliminary index of industrialvalue added at prices, obtained by adding to the numerous sector-specific series carefully compiled over the decades a set of preliminaryestimates for the remaining sectors. The latter include foodstuffs production,provisionally estimated on the assumption that food consumption followednon-food consumption with the per cent elasticity suggested by the newbenchmarks for and (converted to prices) ; in the s foodand non-food consumption are accordingly taken to have grown together,whereas Istat had them going in opposite directions, with the decline in foodconsumption swamping the rise in non-food consumption (Barberi ;Fenoaltea a, b, ).
Soon thereafter Federico published his preliminary estimates of agricul-tural production, again at prices (Federico b; the series presentedthere refers to gross saleable production at current borders, but theconversion to value added at constant borders is straightforward).
A third step is taken here. This article presents preliminary constant-price series for the services sector that extrapolate Zamagni’s value addedestimates for ; and it combines these with the new preliminary estimatesof agricultural and industrial production to estimate the path of aggregatevalue added at prices. The Istat-Vitali estimates are also used, but onlyto set the time path of the relatively trivial correction (for indirect taxes) thatconverts aggregate value added to GDP; even this last series, therefore, is. per cent pure.
The new series are collected in Table ; a brief description of theirderivation can be found in Appendix B. Figures – compare them tothe series they would replace, scaled to interpolate the Istat current-priceestimates for (Appendix A); the joint effect of the new time paths andthe new current-price estimates for is thus immediately apparent.
Figure compares the agricultural series; it strongly resembles Figure ,even though the latter refers to grain consumption alone. In both figures theIstat or Istat-Vitali series collapse after , fail to grow (and vary similarly)for almost twenty years, and then jump back up around the turn of the
The new GDP series is also of course preliminary, because its components are, and also,specifically, because the production estimates for agriculture on the one hand andindustrial foodstuffs on the other have yet to be reconciled.

European Review of Economic History
Table . New estimates of Italian GDP, – (m. lire at prices).
() () () () () () ()
Value added in commodity production
Industry
Agriculture Extr. Manuf. Constr. Util. Total Total , , , , , , , , , , , , , , , ,
, , , , , , , , , , , , , , , , , , , ,
, , , , , , , , , , , , , , , , , , , ,
, , , , , , , , , , , , , , , , , , , ,
, , , , , , , , , , , , , , , , , , , ,
, , , , , , , , , , , , , , , , , , , ,
, , , , , , , , , , , , , , , , , , , ,
, , , , , , , , , , , , , , , , , , , ,
, , , , , , , , , , , , , , , , , , , ,
, , , , , , , , , , , , , , , , , , , ,
, , , , , , , , , , , , , , , ,

The Italian economy, –
Table . Continued.() () () () () () ()
Value added in services
Banking Misc. PublicTransport. Commerce and ins. serv. Buildings admin. Total
, , , ,
, , , , ,
, , , , , ,
, , , , , , , , , ,
, , , , , , , , , ,
, , , , , , , , , , , ,
, , , , , , , , , , , , , , , , , , , ,
, , , , , , , , , , , , , , , , , , , ,
, , , , , , , , , , , , , , , , , , , ,
, , , , , , , , , , , , , , , , , , , , , , , , , ,
, , , , , , , , , , , , , , , , , , , , , , , ,

European Review of Economic History
Table . Continued.() () () ()Total value Net indirect Gross domestic GDP per capitaadded taxes product (lire)
, , , , , , , ,
, , , , , , , , , ,
, , , , , , , , , ,
, , , , , , , , , ,
, , , , , , , , , ,
, , , , , , , , , ,
, , , , , , , , , ,
, , , , , , , , , ,
, , , , , , , , , , , , , ,
, , , , , , , , , , , , , , ,
, , , , , , , , , , , ,
Sources: See Appendix B.

The Italian economy, –
4000
5000
6000
7000
8000
9000
65 70 75 80 85 90 95 00 05 10
new series (Federico)Istat-Vitali series
Figure . Old and new estimates of value added: agriculture (m. lire at prices).
Sources: Table and Appendix A.
century; grain production was a minor part of Italy’s agriculture (Federico), and over those data-poor decades Istat must have used the defectivegrain series to represent a much broader whole. In both figures the alternativeestimates are plausible extrapolations of the limited reliable data, and theytoo are clearly kin. The author’s early grain-consumption series was a simpletrend; Federico’s new series covers all the major products, and it allowscyclical variations by having producers and consumers react appropriatelyto price and income changes (Federico b). But those cycles are short,and mild: the major deviations from trend of the Istat series have not in factresurfaced.
The industrial series are compared in Figures –. As detailed elsewhere(Fenoaltea, , , a), the extractive-industry series differbecause the Istat-Vitali estimates track mining alone, and miss the growth ofquarrying; the construction-industry series seem to differ in the main becausethe Istat-Vitali series miss infrastructure investment not in the ‘public works’
In the s and s, the new estimates grow somewhat faster than the Istat-Vitaliseries; and this may comfort those who see in that growth the source of the accumulationthat had to precede the growth of industry (for example, Pescosolido , heir toRomeo, ).

European Review of Economic History
50
100
150
200
250
65 70 75 80 85 90 95 00 05 10
new seriesIstat-Vitali series
Figure . Old and new estimates of value added: extractive industries(m. lire at prices).
Sources: Table and Appendix A.
1000
1500
2000
2500
3000
3500
4000
4500
65 70 75 80 85 90 95 00 05 10
new seriesIstat-Vitali series
Figure . Old and new estimates of value added: manufacturing (m. lireat prices).
Sources: Table and Appendix A.

The Italian economy, –
200
400
600
800
65 70 75 80 85 90 95 00 05 10
new seriesIstat-Vitali series
Figure . Old and new estimates of value added: construction (m. lire at prices).
Sources: Table and Appendix A.
50
100
150200250300
65 70 75 80 85 90 95 00 05 10
new seriesIstat-Vitali series
Figure . Old and new estimates of value added: utilities (m. lire at prices).
Sources: Table and Appendix A.

European Review of Economic History
2000
3000
4000
5000
6000
65 70 75 80 85 90 95 00 05 10
new seriesIstat-Vitali series
Figure . Old and new estimates of value added: all industry (m. lire at prices).
Sources: Table and Appendix A.
budgets; and the utilities’ series differ because the Istat-Vitali seriestrack gas and power alone, and miss the (relatively slower) growth of waterdistribution. Most of the difference in the aggregate stems of course fromthe difference in the series for manufacturing; but Vitali there borrowedIstat’s own index, and its description is too scanty to be of use (Vitali ,Istat ).
The service-sector series are compared in Figures –. The new seriesare normally indexed by suitable real indicators; where these are lacking(miscellaneous services, government), the present indices simply interpolatecensus-year labour-force benchmarks. The derivation of the Vitali series isdescribed only in the most summary terms. In general, Istat’s current-priceestimates either combine real series and price series, or derive directly fromexpenditure figures; Vitali seems to have attempted to recover the real serieswhere he could, and, failing that, to have deflated the Istat figures by aprice index (Istat , Vitali ). His ‘government’ series, in particular,
For the reasons noted in Appendix B the value added attributed to the extractiveindustries is here adjusted; the other industrial series remain as previously published.
The Istat-Vitali series for credit and insurance yields zero values in the early s; thesehave been dropped from Figure to permit the use of a logarithmic scale.

The Italian economy, –
200
400
600
800
100012001400
65 70 75 80 85 90 95 00 05 10
new seriesIstat-Vitali series
Figure . Old and new estimates of value added: transportation andcommunication (m. lire at prices).
Sources: Table and Appendix A.
500
1000
1500
2000
2500
3000
3500
65 70 75 80 85 90 95 00 05 10
new seriesIstat-Vitali series
Figure . Old and new estimates of value added: commerce (m. lire at prices).
Sources: Table and Appendix A.

European Review of Economic History
20
40
6080
100
65 70 75 80 85 90 95 00 05 10
new seriesIstat-Vitali series
Figure . Old and new estimates of value added: banking and insurance(m. lire at prices).
Sources: Table and Appendix A.
700
800
900
1000
1100
1200
1300
65 70 75 80 85 90 95 00 05 10
new seriesIstat-Vitali series
Figure . Old and new estimates of value added: miscellaneous services(m. lire at prices).
Sources: Table and Appendix A.

The Italian economy, –
600
800
1000
1200
1400
65 70 75 80 85 90 95 00 05 10
new seriesIstat-Vitali series
Figure . Old and new estimates of value added: buildings (m. lire at prices).
Sources: Table and Appendix A.
400
600
800
1000
1200
1400
65 70 75 80 85 90 95 00 05 10
new seriesIstat-Vitali series
Figure . Old and new estimates of value added: government (m. lire at prices).
Sources: Table and Appendix A.

European Review of Economic History
3000
4000
5000
6000
7000
8000
9000
65 70 75 80 85 90 95 00 05 10
new seriesIstat-Vitali series
Figure . Old and new estimates of value added: all services (m. lire at prices).
Sources: Table and Appendix A.
presumably declines over the early decades, even as public employment wasrapidly increasing, because his deflator then grows excessively fast.
In the main, the ex novo recalculation of the service-sector seriesthoroughly alters the time paths of the original Istat-Vitali estimates, whichappear no more reliable than the corresponding series for agriculture andfor industry. This is of course a faint damnation: the initial effort wasproduced under considerable time pressure, and relied perforce as muchas possible on the numbers that were already available; and since it aimed ata reconstruction covering a full century, even medium-term distortions couldbe taken in stride. Progress has come by concentrating on the early decades,and by devoting endless time to the effort: an opening blitzkrieg conquers alot of territory, but the weight of resources eventually gets it back.
. The new aggregate estimates
The new aggregate estimates (Table , cols. –) are compared to therescaled Istat-Vitali series, and to the similarly rescaled Maddison series
The new estimates for the services are also largely built with materials accumulated in therevision of the series for agriculture and for industry (Appendix B).

The Italian economy, –
8000
12000
16000
20000
24000
65 70 75 80 85 90 95 00 05 10
new seriesIstat-Vitali seriesMaddison series
Figure . Old and new estimates of gross domestic product (m. lire at prices).
Sources: Table and Appendix A.
(Appendix A), in Figure and, in per capita terms, in Figure ; thepopulation series differs little from a simple trend, and the second figureis basically a rotation of the first.
The Istat-Vitali and Maddison series differ in their trend growth rates, butthe latter retained the sharp turn-of-the-century acceleration of the former.The new series point to relatively steady growth: as argued over thirty yearsago, the kink in the Istat (and thence Vitali and Maddison) series seemsaltogether bogus.
The new estimates deviate from their fifty-year trend much less than theold from theirs, and in a different way. The dominant feature of the newseries is a long swing, with above-average growth from the late s to the
To avoid clutter the aggregate value added series are omitted; they closely parallel theGDP series (see Figure ).
The new series are strictly speaking excessively smooth, as some components areestimated by interpolating census-year benchmarks, with no short-term fluctuations at all;but these are relatively minor. The culprits are miscellaneous and government services, asseen above, and the leather-working industry (Fenoaltea ). The estimates for the gasindustry similarly interpolate an early benchmark () and the first annual data(ca. : Fenoaltea ).

European Review of Economic History
300
400
500
600
700
65 70 75 80 85 90 95 00 05 10
new seriesIstat-Vitali seriesMaddison series
Figure . Old and new estimates of per capita gross domestic product(lire at prices).
Sources: Table and Appendix A.
late s, followed by a decade of stagnation and then a second upswingeven stronger than the first. Figure collects the new estimates for the mainaggregates, and shows them to scale. Agriculture grew relatively steadily,with short (and presumably natural) cycles; services grew somewhat faster,and even more steadily. The long cycle in the aggregate is that of industry;and within industry, as argued elsewhere, the cycle is in the productionof investment goods, and traceable to the varying supply of foreign capital(Fenoaltea c, ).
The new estimates impinge directly on the contrasting interpretationsof the s. Both the author’s industrial series and Federico’s agriculturalseries assume that food consumption then grew at above-trend rates: becausethe consumption of non-food items clearly did (even according to the Istat-Vitali estimates, which have food and non-food consumption moving inopposite directions), and because nominal wages rose while prices in generalfell, and grain prices fell particularly sharply. That is of course the heart ofthe revisionist view: it is clearly suggested by the more reliable data, and thenew estimates reflect that evidence.
But the new estimates are robust: the bulk of the correction to the Istat-Vitali series stems from the removal of their spurious variations, noted thirtyyears ago and more, and the impact of the recently recovered ‘optimist’

The Italian economy, –
2000
4000
6000
8000
10000
65 70 75 80 85 90 95 00 05 10
agriculture (Federico)servicesindustry
Figure . New estimates of value added, by major sector (m. lire at prices).
Source: Table .
view of the s is altogether minor. Over that decade per capita non-food production and consumption grew strongly. There is every reasonto believe that per capita food consumption also rose, but even if it wereassumed constant, GDP growth would be above trend; a return to the below-trend growth of the Istat series would require a decline in per capita foodconsumption that only a certifiable ‘pessimist’ could endorse.
The new estimates follow a cyclical path very different from thediscontinuous growth common to the Istat-Vitali and Maddison series; butthey yield a cumulative increment between those of the earlier estimates.From end to end the new measure of GDP increases by a factor of .,below Maddison’s ., but far closer to his figure than to the . of theIstat-Vitali series.
In one sense, the downward revision of Maddison’s growth rate wasinevitable. As noted above, the industrial index which he used clearlyexaggerated both the cycle and the end-to-end growth rate (Fenoaltea, ). The present author’s own first estimate for total (and not just‘recorded’) manufacturing grew no faster than the corresponding Istat series(Fenoaltea ); but Maddison chose to ignore it, and purposely selecteda manufacturing series that surely grew too fast.

European Review of Economic History
Moreover, the Istat weights which Maddison used were obtained notfrom data, but by working back from ; the relatively large weightof industry in was the product of the slow growth rate calculated forthe intervening years. The retention of the estimate despite the strongupward revision of the subsequent growth rate is simply illogical; and by thesame token it yields a wildly overstated industrial share of GDP on the eveof the First World War (Bardini et al. ; Tables and ).
Maddison’s statistical legerdemain was not however without a deeperjustification, derived from his international perspective (Maddison ).As he points out, the low growth rate of the Istat series implies, given therelatively reliable figures for the later years, an initial level that is impossiblyhigh, next to that of surely more advanced European countries (Maddison): in reworking the Italian series his purpose was somehow to raisethe growth rate and reduce the initial GDP estimate to a reasonable level,and the end no doubt justified the means. The present estimates approachMaddison’s growth rate, but reach final pre-war levels beyond those of theolder series; the result is that the estimate of GDP in is altogethercloser to the original Istat figure than to Maddison’s (Figure ). The newestimates therefore largely recreate, in international perspective, the veryproblem Maddison sought to eliminate.
The present author’s sense is that Maddison was entirely right in aimingfor a reasonable ratio of united Italy’s initial GDP to that of other countries,but only partly right in putting the burden of the revision entirely on theItalian figures. The Istat series do indeed appear to understate long-termgrowth, but in this they are entirely exceptional; the common feature of suchearly indices as Walter Hoffman’s for Germany or Charles Feinstein’s for theUnited Kingdom (and Gerschenkron’s for Italian industry) is their tendencyto overstate growth rates, for the good and simple reason that unrecordedoutput is taken to have moved with recorded output, and the latter tendseverywhere to be dominated by the new, the growing, the large-scale,the highly visible. Modern factory-based industries are typically over-represented, the traditional activities that grew slowly or declined are under-represented if they appear at all. If this is in fact so, Maddison’s seriesoverstates Italian growth, but for that very reason it remains a better guideto international relatives than the new series presented here.
. Conclusion
The first reconstruction of post-unification Italy’s national accounts showeda sudden increase in the growth rate as the nineteenth century came to
Feinstein (, p. ) actually claims that unrecorded output cannot be estimated inany other way; compare Fenoaltea (). For a discussion of a broad sample of nationalindices see Fenoaltea ().

The Italian economy, –
an end. That discontinuity appeared to derive from the uncritical use ofunreliable data, and was soon denounced as suspect.
The new estimates point to much steadier growth. The medium-termfluctuations in the growth rate appear to derive from the industrial sector, andmore specifically from the production of investment goods. In the first half-century of the Kingdom of Italy the path of the economy seems dominatednot by a sudden transition to sustained growth, but by a garden-varietybusiness cycle.
Acknowledgements
In writing this article the author has benefited from helpful discussions withIsabella Carbonaro, Giovanni Federico, and Fabrizio Mattesini. The usualdisclaimer applies. Ornello Vitali is here much cited: he was a good friend aswell as a highly respected colleague, and his sudden death is deeply mourned.
References
BARBERI, B. (). I consumi nel primo secolo dell’Unita d’Italia. Milan: Giuffre.BARDINI, C., CARRERAS, A. and LAINS, P. (). The National Accounts for
Italy, Spain and Portugal. Scandinavian Economic History Review ,pp. –.
BONELLI, F. (). Il capitalismo italiano. Linee generali di interpretazione.In R. Romano and C. Vivanti (eds), Storia d’Italia. Annali, : Dal feudalesimo alcapitalismo. Turin: Einaudi.
CAFAGNA, L. (a). Protoindustria o transizione in bilico? (A proposito dellaprima onda dell’industrializzazione italiana). Quaderni storici ,pp. –.
CAFAGNA, L. (b). La formazione del sistema industriale: ricerche empiriche emodelli di crescita. Quaderni della Fondazione G. G. Feltrinelli ,pp. –.
CANULLO, G. (). Una nuova stime del PIL italiano di lungo periodo. Moneta eCredito , pp. –.
CARRERAS, A. (). La produccio industrial espanyola i italiana des de mitjansegle XIX fins a l’actualitat. Unpublished Ph.D dissertation, UniversitatAutonoma de Barcelona.
CARRERAS, A. (). La produccion industrial en el muy largo plazo: unacomparacion entre Espana e Italia de a . In L. Prados and V. Zamagni(eds), El desarrollo economico en la Europa del Sur: Espana e Italia en perspectivahistorica. Madrid: Alianza Editorial.
CARRERAS, A. (). Un ritratto quantitativo dell’industria italiana.In F. Amatori, D. Bigazzi, R. Giannetti and L. Segreto (eds), Storia d’Italia.Annali, : L’industria. Turin: Einaudi.
COHEN, J. S. and FEDERICO, G. (). The Growth of the Italian Economy,–. Cambridge: Cambridge University Press.

European Review of Economic History
DELLI GATTI, D., GALLEGATI, M. and GALLEGATI, M. (). On the nature andcauses of business fluctuations in Italy, –. Explorations in EconomicHistory , pp. –.
ERCOLANI, P. (). Documentazione statistica di base. In G. Fua (ed.),Lo sviluppo economics in Italia, vol. . Milan: Franco Angeli.
FEDERICO, G. (). Per una valutazione critica delle statistiche della produzioneagricola italiana dopo l’Unita (–). Societa e storia , pp. –.
FEDERICO, G. (). Il valore aggiunto dell’agricoltura. In G. M. Rey (ed.),I conti economici dell’Italia, vol. . Bari: Laterza.
FEDERICO, G. (). Una stima del valore aggiunto dell’agricoltura italiana. InG. M. Rey (ed.), I conti economici dell’Italia, vol. ∗∗. Rome-Bari: Laterza.
FEDERICO, G. (a). Heights, calories and welfare: a new perspective on Italianindustrialization, –. Economics and Human Biology , pp. –.
FEDERICO, G. (b). Le nuove stime della produzione agricola italiana,–: primi risultati e implicazioni. Rivista di storia economica ,pp. –.
FEINSTEIN, C. H. (). National Income, Expenditure and Output of the UnitedKingdom, –, Studies in the National Income and Expenditure of theUnited Kingdom, vol. . Cambridge: Cambridge University Press.
FENOALTEA, S. (). Public policy and Italian industrial development,–. Unpublished Ph.D dissertation, Harvard University.
FENOALTEA, S. (). Decollo, ciclo e intervento dello Stato. In A. Caracciolo(ed.), La formazione dell’Italia industriale. Bari: Laterza.
FENOALTEA, S. (). Railroads and Italian industrial growth, –.Explorations in Economic History , pp. –.
FENOALTEA, S. (). The growth of the utilities industries in Italy, –.Journal of Economic History , pp. –.
FENOALTEA, S. (). Construction in Italy, –. Rivista di storia economica, International Issue, pp. –.
FENOALTEA, S. (a). The extractive industries in Italy, –: generalmethods and specific estimates. Journal of European Economic History ,pp. –.
FENOALTEA, S. (b). The growth of Italy’s silk industry, –: a statisticalreconstruction. Rivista di storia economica , pp. –.
FENOALTEA, S. (c). International resource flows and construction movementsin the Atlantic economy: the Kuznets cycle in Italy, –. Journal ofEconomic History , pp. –.
FENOALTEA, S. (). Il valore aggiunto dell’industria italiana nel . In G. M.Rey (ed.), I conti economici dell’Italia, vol. . Bari: Laterza.
FENOALTEA, S. (a). Production and consumption in post-unification Italy:new evidence, new conjectures. Rivista di storia economica , pp. –.
FENOALTEA, S. (b). Lo sviluppo dell’industria dall’Unita alla Grande Guerra:una sintesi provvisoria. In P. Ciocca and G. Toniolo (eds.), Storia economicad’Italia, vol. .: Le strutture dell’economia. Rome-Bari: Laterza.
FENOALTEA, S. (). Notes on the rate of industrial growth in Italy, –.Journal of Economic History , pp. –.
The Italian economy, –
FENOALTEA, S. (). Contro tre pregiudizi. Rivista di storia economica ,pp. –.
FENOALTEA, S. and BARDINI, C. (). Il valore aggiunto dell’industria. In G.M. Rey (ed.), I conti economici dell’Italia, vol. ∗∗. Rome-Bari: Laterza.
FUA, G. (). Notes on Italian Economic Growth –. Milan: Giuffre.FUA, G., ed. (). Lo sviluppo economico in Italia, vol. . Milan: Franco Angeli.GERSCHENKRON, A. (). Notes on the rate of industrial growth in Italy,
–. Journal of Economic History , pp. –.GERSCHENKRON, A. (). Description of an index of Italian industrial
development, –. In A. Gerschenkron, Economic Backwardness inHistorical Perspective. Cambridge, MA: Harvard University Press.
GERSCHENKRON, A. (), Continuity in History and Other Essays. Cambridge,MA: Harvard University Press.
GERSCHENKRON, A. and ROMEO, R. (). Lo sviluppo industriale italiano. Norde Sud , pp. –.
ISTAT (ISTITUTO CENTRALE DI STATISTICA). (). Indagine statistica sullosviluppo del reddito nazionale dell’Italia dal al , Annali di statistica,serie VIII, vol. . Rome: ISTAT.
ISTAT (ISTITUTO CENTRALE DI STATISTICA). (–). Le rilevazioni statistichein Italia dal al , Annali di statistica, serie VIII, vols –. Rome:ISTAT.
ISTAT (ISTITUTO CENTRALE DI STATISTICA). (). Sommario di statistichestoriche italiane, –. Rome: ISTAT.
LUZZATTO, G. (). L’economia italiana dal al . Milan: BancaCommerciale Italiana.
MADDISON, A. (). A revised estimate of Italian economic growth, –.BNL Quarterly Review , pp. –.
MADDISON, A. (). Monitoring the World Economy, –. Paris: OECDDevelopment Centre.
PESCOSOLIDO, G. (). Agricoltura e industria nell’Italia unita. Rome-Bari:Laterza.
REY, G. M., ed. (). I conti economici dell’Italia, vol. . Una stima del valoreaggiunto per il . Bari: Laterza.
REY, G. M., ed. (). I conti economici dell’Italia, vol. ∗∗. Il valore aggiunto per glianni , , . Rome-Bari: Laterza.
ROMEO, R. (). Risorgimento e capitalismo. Bari: Laterza.TONIOLO, G. (). An Economic History of Liberal Italy, –. London:
Routledge.VITALI, O. (). La stima del valore aggiunto a prezzi costanti per rami di attivita.
In G. Fua (ed.), Lo sviluppo economico in Italia, vol. . Milan: Franco Angeli.ZAMAGNI, V. (). Il valore aggiunto del settore terziario italiano nel . In
G. M. Rey (ed.), I conti economici dell’ Italia, vol. . Bari: Laterza.ZAMAGNI, V. (). The Economic History of Italy, –: Recovery after
Decline. Oxford: Clarendon Press.ZAMAGNI, V. and BATTILANI, P. (). Stima del valore aggiunto dei servizi.
In G. M. Rey (ed.), I conti economici dell’ Italia, vol. ∗∗. Rome-Bari: Laterza.

European Review of Economic History
Appendix A: The Istat-Vitali and Maddison series
A. The Istat-Vitali estimates
The Vitali series in Table , cols. –, –, –, –, and are transcribedfrom Ercolani (), Tables XII...A (value added, by sector), XII.. (indirectbusiness taxes and GDP), and XII...A (private consumption, identical to theseries in Istat , p. ). For banking and insurance Vitali reports both grossvalue added (Table XII...A, col. ) and its double-counted (non-final) component(Table XII.., col. ); the series in Table , col. refers to net value added,obtained as the difference between the two Vitali series. The series in cols. and
are the sums of cols. – and of cols. –, respectively; col. is the sum of cols. ,, and . Because the published series report only three significant digits, the GDPseries in col. is not the exact sum of cols. and . The per capita figures in cols. and are calculated using the demographic series in Table , col. , obtained asdescribed in Fenoaltea (a), note .
The ‘Istat-Vitali’ series at prices in Figures – are normally the Vitaliseries at prices (and present-day borders) in Table , scaled to interpolatethe corresponding estimate for at current prices (and current borders) in Istat(). The -price estimates are in billions of lire, the -price estimates inmillions.
The conversions of the disaggregated Vitali series are, as a rule, perfectlystraightforward: taking the numerators from Istat () and the denominators fromTable , the ratios used to rescale the series are (,/.) for agriculture (col. ),(/.) for the extractive industries (col. ), (,/.) for manufacturing(col. ), (/.) for construction (col. ), (/.) for the utilities (col. ),(/.) for transportation and communication services (col. ), (,/.)for the services of buildings (col. ), and (,/.) for government services(col. ).
The conversion of the Vitali series for commerce and for miscellaneous servicesis only marginally complicated by the fact that Istat () did not separate the two;in , they are attributed, together, a value added of , million lire at currentprices. The net product that corresponds to that value added is disaggregated,however; in commerce accounts for , m lire out of ,, but probablyaccounted for a larger proportion of total depreciation, equal to m. Zamagni(, p. ) allocates m lire of depreciation to commerce, and million tomiscellaneous services; since that estimate is as good as any, the Vitali series forcommerce (col. ) is here multiplied by ((, + )/.), and the Vitali seriesfor miscellaneous services (col. ) by (((, − ,) + )/.).
In the case of banking and insurance, finally, both Vitali and Istat report notnet value added, but gross value added on the one hand and double-countedbusiness services on the other. The -price net value added series (col. )is accordingly scaled by the ratio of the respective differences, equal to (( − )/(. – .)).
Given the purpose of these illustrations, the -price Istat-Vitali aggregate seriesare also obtained by direct conversion of the corresponding -price series, andnot by summing over their -price components; but there is very little differencebetween these alternative measures. The series for all industry (col. ) is thus

The Italian economy, –
multiplied by (,/.), and that for all services (col. ) by (,/.).The corresponding series for aggregate value added (col. ) would be multipliedby (,/.), and that for indirect business taxes (col. ) by (,/.).
The GDP series (col. ), finally, is multiplied by (,/.). A bit ofuncertainty surrounds the numerator, as Istat () reports not GDP but GNP,and even that on a definition that (logically but unusually) excludes governmentservices supplied to the producing sector. The GDP here attributed to Istat istotal net value added in agriculture, industry, and services (net only of banking andinsurance business services), or , + , + , = , m lire, plus the, m lire estimate of indirect business taxes, net of subsidies. Vitali (, p. ,Table ), instead calculates the Istat estimate of GDP in at . billion lire.The minor difference ( m lire) is the Istat estimate of production subsidies (Istat, p. ), which Vitali adds to the sum of the Istat estimates of value added (ashe explains in a note) before adding net indirect taxes; he accordingly obtains theIstat GDP estimate as the sum of value added and gross (rather than net) indirecttaxes. Vitali (, p. ) reproduces his earlier Istat estimate (. bn lire), butRey (, p. xxxi) reports the figure obtained here (. bn); and Vitali’s owncalculation of the new estimates of GDP in is analogous to that adopted hereto calculate the Istat estimate.
The per capita GDP series in Figure is again obtained from the correspondingaggregate and the population series in Table , col. .
A. The Maddison estimates
The series in Table , cols. –, –, and are transcribed from Maddison (),p. ; cols. and are the sums of cols. – and –, respectively. Maddisonignores indirect business taxes; his measure of GDP (col. ), obtained by summingthe value added series, is ‘at factor cost’. The per capita figures in col. are obtainedfrom col. and the demographic series in Table , col. .
Maddison’s elementary series are scaled to interpolate the current-price valueadded estimates for in Istat (). His series for agriculture and mostservices (cols. , –, –) are scalar transforms of the corresponding Vitali seriesreproduced in Table ; his series for banking and insurance services (col. ) isa rescaling of the Vitali series of -price value added gross of double-countedbusiness services (Ercolani , Table XII...A, col. ). His series for the extractiveindustries and the utilities (cols. and ) rescale the series which reappear, withminor emendations, in Table ; his manufacturing series (col. ) is essentially arescaling of the index described in Fenoaltea (). His construction series(col. ) should be an exact rescaling of the corresponding value-added series inTable (originally Fenoaltea , Table , col. ); in fact, he seems to have usedthe value-of-new-construction series (Fenoaltea , Table , col. , and againFenoaltea, c), which varies more over the business cycle (and grows more fromend to end) because it excludes maintenance. These series, and the resulting totalsfor industry (col. ) and services (col. ), are not separately illustrated here.
Maddison’s own GDP estimate for is moot. Since his GDP series virtuallyreproduces the path of the Istat estimates from c. to c. (Maddison ,Graph ), and the new current-price estimates of aggregate value added in

European Review of Economic History
virtually reproduce the Istat figures (Federico , Fenoaltea and Bardini ,Zamagni and Battilani ), the -price ‘Maddison’ series in Figure is simplyhis GDP series (col. ) multiplied by (,/,) to reproduce the ‘Istat’ figurefor described above. The corresponding per capita series in Figure is againobtained from that aggregate and the population series in Table , col. .
Appendix B: The new estimates
B. Introduction
The present estimate of aggregate real product is a sum of physical output series,weighted by value added at prices. This is not the theoretically correct measure,which deflates the current-price value added of each and every sector by same priceindex, and thus properly reflects changes in relative values (Fenoaltea , Fua); the physical output series are themselves stepping-stones to current-pricevalue added estimates, and with the limited information now available the presentquantity indices are the best that can be generated.
B. Agriculture
The time series in Table , col. is the preliminary Federico estimate of valueadded at prices within constant borders. The corresponding index was kindlyprovided by the author, who himself adjusted the published index of gross saleableproduction at prices within current borders (Federico b); the present seriesis that index of value added, applied to the corresponding estimate of value addedin (Federico , p. ).
Vitali () presents aggregate estimates for based on the revised sector-specific figures in Federico (), Fenoaltea and Bardini (), and Zamagni andBattilani (); the value added figures for industry and services are those in thesource, but the value added attributed to agriculture (pp. , ) is slightly different(. bn lire instead of .). Since no reason (that one could find) is given forthis modification, the present estimate of value added in adheres to Federico’sbenchmark.
B. Industry
The time series for industry in Table , cols. – replicate those in Fenoaltea(), with an adjustment to the figures for the extractive industries (col. ).The series for the latter in Fenoaltea (), transcribed from Fenoaltea (a),measure their value added in the theoretically correct manner: these industries aretaken to transform goods-in-the-ground into goods-above-ground, and the valueof the former is excluded from value added. The conventional measures insteadtreat these industries as if they produced goods-above-ground out of thin air; andsince the present estimates aim at a conventional measure the time series for miningon the one hand and quarrying on the other have each been rescaled to include thecorresponding value of the goods-in-the-ground actually consumed (Fenoaltea ,pp. –, respectively groups , , , and groups , ). The scale factors

The Italian economy, –
are respectively (./.) and (./.), sufficiently similar that the time pathof the inflated aggregate series is virtually identical to that of the original aggregate.
The estimates for in Fenoaltea () and Fenoaltea and Bardini ()already include the above adjustment. The total for industry obtained here ismarginally higher than the later of those (. bn lire, against .); like theseries in Fenoaltea (b, ) it reflects a subsequent adjustment to the estimateof value added in the generation of hydroelectric power (Fenoaltea , p. ).
B. Services
B.. Transportation and communication. The series in Table , col. sumsover the partial estimates in Table B..
B... Inland transportation. Zamagni () and Zamagni and Battilani() allow m lire to rail-guided transportation in : . to railways,. to tramways, and . to minor systems. The present estimates index thesefigures with time series developed to calculate the path of railway rolling-stockmaintenance (Fenoaltea and Fenoaltea, forthcoming). The present series forrailway transportation (Table B., col. ) extrapolates value added in by totalpassenger- and freight-car axle-kilometres. The corresponding series for othermachine-powered tramways and minor systems (Table B., col. ) extrapolatesZamagni’s estimate for the two together by the simple sum of steam tramways’passenger and freight cars, and electric tramways’ passenger cars (rail-cars andtrailers) and freight cars.
Zamagni neglects horse tramways, which were indeed negligible by , butof some significance in earlier years. The present index is an adaptation of thetrack-length series already used to index track maintenance; it is calculated bycumulating the network extensions of urban and suburban horse tramways, netof the lengths converted to machine power (Fenoaltea ). In , suburban andurban horse tramway networks equalled and km, respectively, against ,
and . km, respectively, for their machine-powered counterparts. The -pricetransportation value added then attributed to machine-powered tramways equals. m lire; the fleet of steam (suburban) tramways totalled , cars, that of electric(urban) tramways , vehicles. On the assumption that, per km of track, horsetramways then provided one-quarter of the transportation provided by their machinecounterparts, -price value added in is estimated for urban horse tramwaysas (./)(,/(, + ,))(/.) = . m lire, and for suburban horsetramways as (./)(,/(, + ,))(/,) = . m lire. The resulting-price series for all horse tramways is transcribed in Table B., col. .
The cited elementary series taken from Fenoaltea (forthcoming) are available on request. The freight-car figures assume a constant average number (.) of axles per vehicle; the
corresponding figure for passenger cars grows slightly from . in the early decades to .in the later ones.
The electric-tramway figures include a small number of locomotives, not separatelycounted after .

European Review of Economic History
Zamagni () and Zamagni and Battilani () estimate value added in
at . m lire in road transport proper, and . million lire in auxiliary services;a further . m lire are allowed for inland navigation. The present -price timeseries (Table B., col. ) simply extrapolates the sum of these (. m lire) inproportion to aggregate -price value added in commodity production (Table ,col. ).
B... Maritime transportation. The Zamagni () and Zamagni andBattilani () estimates of value added in allocate . m lire to water-bornetransportation, exclusive of inland navigation. The present time series (Table B.,col. ) simply extrapolates that figure with an index obtained as a weighted sumof the reported total tonnage of Italy’s steam- and sail-powered fleets (Istat ,p. ), assuming zero growth between and . Overall, steam tonnage growsrapidly, sail tonnage soon declines; to allow for technical progress over time, as wellas the steamships’ generally higher operating speed (and, presumably, greater annualutilisation), one steam ton is treated as the equivalent of five sail tons.
B... Communication. Zamagni () and Zamagni and Battilani ()estimate value added in communication at m lire in ; the estimates of netproduct suggest that . per cent of that was in mail and telegraph services, and. per cent in telephones. The present estimates (Table B., col. ) incorporatetime series made available by Istat (, pp. –); for simplicity, the fiscal-year figures for –ff. are referred directly to ff. The reported number ofurban telephone subscribers is used to extrapolate a value added of . m lire in. The residual (. m lire) is indexed by a simple sum of the reported piecesof correspondence and the reported private telegrams; the latter are insignificant(about per cent of the total in ), and their weight is not adjusted.
B.. Commerce. The revised estimates in Zamagni and Battilani ()allow commerce, broadly defined, a value added of , m lire (, in tradeproper, in hotels and restaurants). The present estimates in Table , col.
extrapolate that figure with the aid of the commodity-production estimates in col.
and the transportation estimates in col. . These series are scaled to set = .,and then summed, giving the latter five times the weight of the former. Since col.
grows much faster than col. , their relative weight affects the growth rate of col. ;the weights selected here allow commerce to grow with respect to total commodityproduction, without however growing with respect to industrial production alone,as suggested by the latest current-price estimates for and (Federico ,Fenoaltea and Bardini , Zamagni and Battilani ).
B.. Banking and insurance. The revised estimates in Zamagni andBattilani () allow banking and insurance services a value added of m lire in; of these, m were in double-counted business services, for a net figure of m. The present estimates in Table , col. extrapolate this last figure.
The trend of this new series is set by Vitali’s reconstruction on the correspondingemployment in the census years: , people in , , in , and , in (Vitali ). His own -price estimates imply a declining share of double-counting, for a ratio of net to gross value added near per cent in , per centin , and per cent in (similar to Zamagni and Battilani’s ratio). Together,

The Italian economy, –
these figures yield estimates of ‘net’ employment near , in , , in ,and , in .
Italy’s financial cycle was correlated, not surprisingly, with the construct-ion cycle (Fenoaltea c): major bank expansions occurred in step with theconstruction booms, the periods of construction decline saw a reduction inthe growth rate, if not always in the level, of financial intermediation. In thecircumstances, the useful indices are the construction series (Table , col. ) on theone hand, and the utilities series (Table , col. ) on the other: the first is essentiallya flow variable, the second tracks a stock that essentially cumulates the underlyingconstruction flows.
These series are weighted to interpolate the net-employment benchmarks. From to , the construction and utilities series (rescaled to set = .) receiverelative weights equal to and , respectively; from to the constructionseries and the utilities series (rescaled to set = .) receive relative weightsequal to and .
B.. Miscellaneous services. This group includes the world’s oldestprofessions, ranging from the meanest domestic help to the highest clergy; averagevalue added per person varies significantly from sub-group to sub-group.
The present reconstruction is based on the revised value-added estimates for
in Zamagni and Battilani (), supplemented by the census-year labour forcedata. Vitali () reassembled the census figures from on into homogeneouscategories (identified by the census code). His estimates for , ,and (Vitali , p. ) are transcribed, with some subaggregation, inTable B..
The figures for are estimated. The total (line ) varies very little over time;it is here extrapolated backward on the assumption that the absolute incrementbetween and equalled that over the succeeding intercensal period. Thenumber in the professions (line ) is estimated by applying to Vitali’s figure for
the ratio of the census total for the legal and learned professions (categoriesX and XIV) to the corresponding census total (categories XI and XV). Thenumber in health, entertainment, and private education (line ) in is similarlyestimated by applying to Vitali’s figure for the ratio of the census figurefor the most closely corresponding categories (XI, XIII) to the census figurefor those self-same categories (XII, XIV). The figure for the clergy (line )in is taken directly from the census (category IX), as was Vitali’s figure for (category X). The residual (line ) includes enormous numbers of unskilledpersons (mostly washerwomen in ., domestic servants in .); but the
census includes a large residual category grouping unskilled workers (category XVI),and the numbers attributed to domestic service and the like (category VI) appearseriously underestimated. The residual for is accordingly obtained as such,from the estimates in lines –; it thus inherits the error in the estimated total. Theweighted total in line is obtained very simply as the sum of lines , , , and ,divided respectively by , , , and ; the weights reflect the relative category-specific estimates of average value added per person in Zamagni and Battilani(, p. ).
This weighted total is then extrapolated to an annual index on the assumptionof constant geometric growth between (and beyond) the census years. This index

European Review of Economic History
is then scaled to set = ., and applied to the value-added estimate for
in Zamagni and Battilani (, p. ); the resulting series appears in Table ,col. .
B.. Buildings. Zamagni () and Zamagni and Battilani () allowbuildings a value added of , m lire at prices. The present series in Table ,col. extrapolates this figure in proportion to the estimated maintenance of privatestructures (Fenoaltea , p. ), itself strictly proportional to the estimated realstock to be maintained.
B.. Public administration. The revised estimates in Zamagni and Battilani() allow government services a value added of , m lire in . Vitali (,p. ) calculates the sector-specific labor force (code ) at , in , ,
in , and , in ; the ratio of the census figures (categories VII,VIII, and XII) to the corresponding census figures (categories VIII, IX andXIII) converts Vitali’s total to an estimate of , in . These census-yearfigures are extrapolated into an annual index, again assuming constant geometricgrowth between (and beyond) the available benchmarks; and this index is applieddirectly to Zamagni and Battilani’s estimate. The resulting series is transcribed inTable , col. .
B. Net indirect taxes
The series in Table , col. extrapolates the new estimate of net indirect taxes(, m lire) in obtained by Vitali (, p. ; also p. , Table ) inproportion to the -price Vitali series; it accordingly equals the latter times(,/.).
Vitali (, p. ) reports a revised estimate of GDP in , based on theupdated value added estimates in Federico (), Fenoaltea and Bardini (),and Zamagni and Battilani (). That calculation returns to the original Istatestimate of . bn lire of net indirect taxes; since as far as one could tell noreason is given for this substitution, the present calculations retain the Vitali ()estimate, justified in detail.
B. Gross domestic product
The present estimate of GDP in equals . bn lire. The correspondingfigure in Rey (, p. xxx) and Vitali (, p. ) is . bn. The discrepancy(−. bn lire) is explained as follows: on the one hand, as noted, thepresent estimates reject Vitali’s unexplained adjustment to Federico’s estimate foragriculture (−. bn), and his similarly unexplained return to Istat’s figure for netindirect taxes in place of his own revision (−. bn); on the other, the Rey-Vitaliestimates neglect the recent revision to the estimate for the utilities industries notedabove ( + . bn: compare Fenoaltea , , and Fenoaltea and Bardini ,and Fenoaltea , ).
The per capita series (Table , col. ) is calculated on the basis of the populationseries in Table , col. .

The Italian economy, –
Table B.. New estimates of value added in services, –:transportation and communication (m. lire at prices).
() () () () () () ()Rail transportation
Tramways Tramways Other inland MaritimeRailways (machine) (horse) Total transp. transp. Communication
. . . . . . . . . . . . . . . . . . . . . . . . . . . . . . . . . . . . . . . . . . . . . . . . . . . . . . . . . . . . . . . . . . . . . . . . . . . . . . . . . . . . . . . . . . . . . . . . . . . . . . . . . . . . . . . . . . . . . . . . . . . . . . . . . . . . . . . . . . . . . . . . . . . . . . . . . . . . . . . . . . . . . . . . . . . . . . . . . . . . . . . . . . . . . . . . . . . . . . . . . . . . . . . . . . . . . . . . . . . . . . . . . . . . . . . . . . . . . . . . . . . . . . . . . . . . . . . . . . . . . . . . . . . . . . . . . . . . . . . . . . . . . . . . . . . . . . . . . . . . . . . . . . . . . . . . . . . . . . . . . . . . . . . . . . . . . . . . . . . . . . . . . . . . . . . . . . . . . . . . . . . . . . . . . . .
Sources: See Appendix B.

European Review of Economic History
Table B.. Estimates of the labour force in miscellaneous services, ,, , and (thousands).
() () () () () ()Code Content
. () Miscellaneous services , , , ,. (.) Professions . . . .. (.-) Health, entertainment, . . . .
private education. (.) Clergy . . . .. (.,) Residual . Weighted total
Sources: See Appendix B.
Appendix References
FENOALTEA, S. (). Real value added and the measurement of industrialproduction. Annals of Economic and Social Measurement , pp. –.
FENOALTEA, S. (). Railway construction in Italy, –. Rivista di storiaeconomica , International Issue, pp. –.
FENOALTEA, S. (). La crescita industriale delle regioni d’Italia dall’Unita allaGrande Guerra: una prima stima per gli anni censuari. Quaderni dell’UfficioRicerche Storiche, . Rome: Banca d’Italia.
FENOALTEA, S. (Forthcoming). Italian Industrial Production, –: A StatisticalReconstruction.
FUA, G. (). Crescita economica. Le insidie delle cifre. Bologna: Il Mulino.REY, G. M. (). Novita e conferme nell’analisi dello sviluppo economico
italiano. In G. M. Rey (ed.), I conti economici dell’ Italia, vol. ∗. Il conto risorsee impieghi (, , , ). Rome-Bari: Laterza.
VITALI, O. (). Aspetti dello sviluppo economico italiano alla luce della ricostruzionedella popolazione attiva. Rome: Istituto di Demografia dell’Universita di Roma.
VITALI, O. (). Gli impieghi del reddito nell’anno . In G. M. Rey (ed.),I conti economici dell’ Italia, vol. . Bari: Laterza.
VITALI, O. (). Gli impieghi del reddito negli anni , e . In G. M.Rey (ed.), I conti economici dell’ Italia, vol. ∗. Il conto risorse e impieghi (,, , ). Rome, Bari: Laterza.


![Extra-Digestive GERD [Preliminary Program] GERD... · 2014. 5. 19. · European Society for Primary Care Gastroenterology (ESPCG) Italian Society of Gastroenterology (SIGE) Italian](https://img.dokumen.tips/doc/110x75/5fe7f7973967c8526026f1f9/extra-digestive-gerd-preliminary-program-gerd-2014-5-19-european-society.jpg)


