Embed Size (px)
Citation preview

The Greening of Oregon’s Workforce
.
Jobs, Wages, and Training
Oregon School Boards Association
November 12, 2010
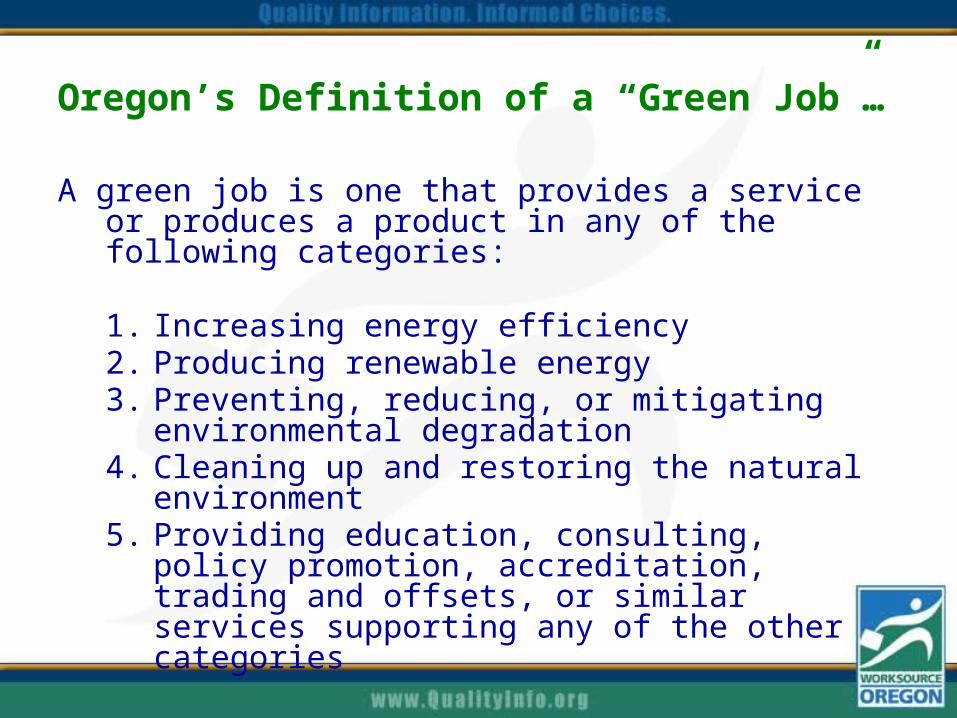
Oregon’s Definition of a “Green Job”…
A green job is one that provides a service or produces a product in any of the following categories:
1. Increasing energy efficiency2. Producing renewable energy3. Preventing, reducing, or mitigating environmental
degradation4. Cleaning up and restoring the natural environment5. Providing education, consulting, policy promotion,
accreditation, trading and offsets, or similar services supporting any of the other categories
Note: we wanted one or more of these things to be an “essential function” of the job.

Key Finding: Oregon had roughly 51,000 green jobs.
• 51,402 green jobs in 2008, spread across... • 5,025 employers• all major industry groups• 226 different occupations
• Represents about 3 percent of the employment in the private sector and state and local government
• To give perspective … this is roughly the same as the number of employees working in Oregon’s private hospitals.

-
50,000
100,000
150,000
200,000
250,000
Wood productmanufacturing
Computer &electronic
manufacturing
Green Jobs Construction Health care &social assistance
Oregon's Green Jobs Relative to Other Industries, 2008
Source: Oregon Employment Department, Quarterly Census of Employment and Wages (QCEW)
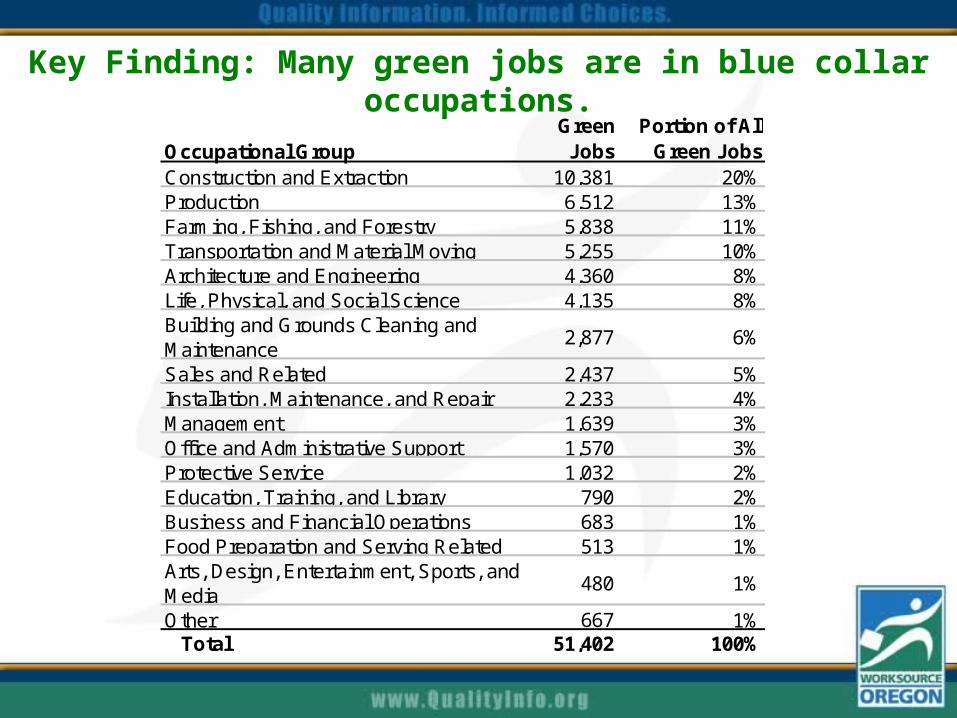
Key Finding: Many green jobs are in blue collar occupations.
Occupational GroupGreen Jobs
Portion of All Green Jobs
Construction and Extraction 10,381 20%Production 6,512 13%Farming, Fishing, and Forestry 5,838 11%Transportation and Material Moving 5,255 10%Architecture and Engineering 4,360 8%Life, Physical, and Social Science 4,135 8%Building and Grounds Cleaning and Maintenance
2,877 6%
Sales and Related 2,437 5%Installation, Maintenance, and Repair 2,233 4%Management 1,639 3%Office and Administrative Support 1,570 3%Protective Service 1,032 2%Education, Training, and Library 790 2%Business and Financial Operations 683 1%Food Preparation and Serving Related 513 1%Arts, Design, Entertainment, Sports, and Media
480 1%
Other 667 1% Total 51,402 100%

Eleven occupations had at least 1,000 green jobs.
Occupation Selected Green Job Description and EmployerCarpenters(4,025 jobs)
"home weatherization" - local community action center"energy efficiency construction" - temp agency
Farmworkers and Laborers(3,189 jobs)
"herbsman" - 100% organic dairy"Assistant grower" - organic nursery
Truck Drivers(2,337 jobs)
"compost truck driver" - waste management company"truck drivers" - biomass company
Hazardous Materials Removal Workers(2,123 jobs)
"asbestos abatement worker" - remediation business"special waste technician" - at county waste center
Landscaping and Groundskeeping Workers(2,044 jobs)
"riparian crew leader" - local watershed restoration"restoration of native plants" - forestry consulting firm
Civil Engineers(1,889 jobs)
"civil inspector" - wind energy firm"LEED AP Project Engineer" - construction company
Production Workers(1,728 jobs)
"paper machine tender" - mill making 100% recycled paper"processing recycling" - oil recycler
Freight, Stock, and Material Movers(1,628 jobs)
"sorter" - recycling company"auto parts dismantler" - auto salvage yard
Retail Salespersons(1,149 jobs)
"sells systems, customer care" - solar panel retailer"retail manager" - organic nursery
Biological Technicians(1,115 jobs)
"Coho life cycle monitoring" - local watershed"fisheries technician" - tribal government
Fire Fighters(1,021 jobs)
"rehab after fires, forest hazard fuel reduction" - environmental consulting firm
Examples of Green Work From the Oregon Green Jobs SurveyTop 11 Occupations with More Than 1,000 Green Jobs

Green wage levels are spread across a wide spectrum, just like wages of all jobs.
Percent of Green Jobs by Wage Group
0%
5%
10%
15%
20%
25%
30%
Under$10.00
$10.00 -$14.99
$15.00 -$19.99
$20.00 -$24.99
$25.00 -$29.99
$30.00 -$49.99
$50.00 ormore
Hourly Wage

But very few green jobs pay very low wages …
Percent of Green Jobs and All Jobs by Wage Group
0%
5%
10%
15%
20%
25%
30%
Under$10.00
$10.00 -$14.99
$15.00 -$19.99
$20.00 -$29.99
$30.00 -$49.00
$50.00 ormore
Average Hourly Wage
All Jobs Green Jobs
Source: Oregon Employment Department

Key Finding: “On average, green jobs tended toward slightly higher wages than jobs across the entire economy.”
• Average wage for all jobs: $19.92 per hour• Average wage for green jobs: $22.61 per hour
• Half of all jobs pay $15.22 or more per hour• About 2/3 of all green jobs pay $15.00 or more per
hour
• Occupation mix explains some of the difference, but not all

Green wage levels depend on the occupation
Top 11 Green Occupations by Hourly Wage
0 500 1,000 1,500 2,000 2,500 3,000 3,500
Fire Fighters
Biological Technicians
Retail Salespersons
Laborers & Freight, Stock,& Material Movers, Hand
Production Workers, All Other
Civil Engineers
Landscaping & Groundskeeping Workers
Hazardous Materials Removal Workers
Carpenters
Truck Drivers, Heavy and Tractor-Trailer
Farmworkers & Laborers, Crop, Nursery, & Greenhouse
Number of Green Jobs
Less Than $15 $15 to $24.99 $25 to $49.99 $50 or More
Where the Wage Level was specified

Key Finding: Two-thirds of green jobs require no education beyond high school.
No Requirement32%
High School Graduate
32%
Associate Degree7%
Some College7%
Bachelor's or Graduate
18%
Other4%
Where the Minimum Education Level was specified
Green Jobs by Minimum Education Level Oregon, 2008

Education requirements vary widely by occupation.Top 11 Green Occupations by Minimum Education
0 500 1,000 1,500 2,000 2,500 3,000 3,500 4,000
Retail Salespersons
Fire Fighters
Biological Technicians
Laborers & Freight, Stock, & Material Movers, Hand
Farmworkers & Laborers, Crop, Nursery, & Greenhouse
Production Workers, All Other
Civil Engineers
Landscaping and GroundskeepingWorkers
Hazardous Materials RemovalWorkers
Truck Drivers, Heavy and Tractor-Trailer
Carpenters
None High School Some College, 2-Year Degree & Other Bachelor's or Higher
Number of Green Jobs
Where the Minimum Education Level was specified

Key Finding: About one-third of green jobs require some kind of special license / certificate.
Green Jobs by Required License or Certificate
0 1,000 2,000 3,000 4,000 5,000 6,000 7,000 8,000
Computer Proficiency orTraining
LEED Accreditation
Prior Experience or SignificantOJT
Equipment Operator Licenseor CDL
Cleanup or AbatementCertification
Occupation Specific Licenseor Certificate
Some jobs have more than one special requirement.

As is true with the whole economy … jobs requiring more education usually pay higher wages.
Green Jobs Requiring Education Pay Higher Wages
0 4,000 8,000 12,000 16,000
No educationrequirement
High school diploma orGED required
Some college, Associatedegree, or Other
Bachelor's or graduatedegree
Number of Green Jobs
Less Than $15 $15 - $24.99 $25 to $49.99 $50 or More
Where the Minimum Education Level was specified

Key Finding: Employers project a 14% increase in green jobs between 2008 and 2010.
Occupational Group
Total Workers
2008
Projected Workers
2010 ChangePercent Change
Farming, Fishing, and Forestry 5,838 7,960 2,122 36%Transportation and Material Moving 5,255 7,025 1,770 34%Production 6,512 7,625 1,113 17%Architecture and Engineering 4,360 5,243 883 20%Construction and Extraction 10,381 11,077 696 7%Protective Service 1,032 1,543 511 50%Life, Physical, and Social Science 4,135 4,338 203 5%Installation, Maintenance, and Repair 2,233 2,402 169 8%Education, Training, and Library 790 952 162 21%Management 1,639 1,791 152 9%Building and Grounds Cleaning and Maintenance 2,877 3,026 149 5%Business and Financial Operations 683 797 114 17%Community and Social Services 157 263 106 68%Computer and Mathematical 244 301 57 23%Healthcare Practitioners and Technical 165 178 13 8%Personal Care and Service 20 27 7 35%Food Preparation and Serving Related 513 514 1 0%Legal 81 81 0 0%Arts, Design, Entertainment, Sports, and Media 480 465 -15 -3%Office and Administrative Support 1,570 1,376 -194 -12%Sales and Related 2,437 1,827 -610 -25% Total 51,402 58,811 7,409 14%
Employer Projections of Green Jobs by Occupation

Oregon’s Green LMI Improvement Grant
• December 2009 – May 2011 (18 months)• $1.25 million• Provided by national Employment and Training
Administration (ETA)• Working with many partners
• Oregon Workforce Investment Board (OWIB)• Department of Community Colleges and Workforce
Development (DCCWD)• Oregon Career Information System (CIS)• Other workforce, education, and training entities

The Green LMI Grant has Five Major Components
1. In-depth Study of Green Occupations
2. Employment Analysis of Companies in Specific Green Sectors
3. Analysis of Agricultural Green Jobs
4. Special Reports and Publications
5. AutoCoder and Green Jobs Extractor for WorkSource Oregon Management Information System (WOMIS)
• DCCWD & CIS will also complete other major components
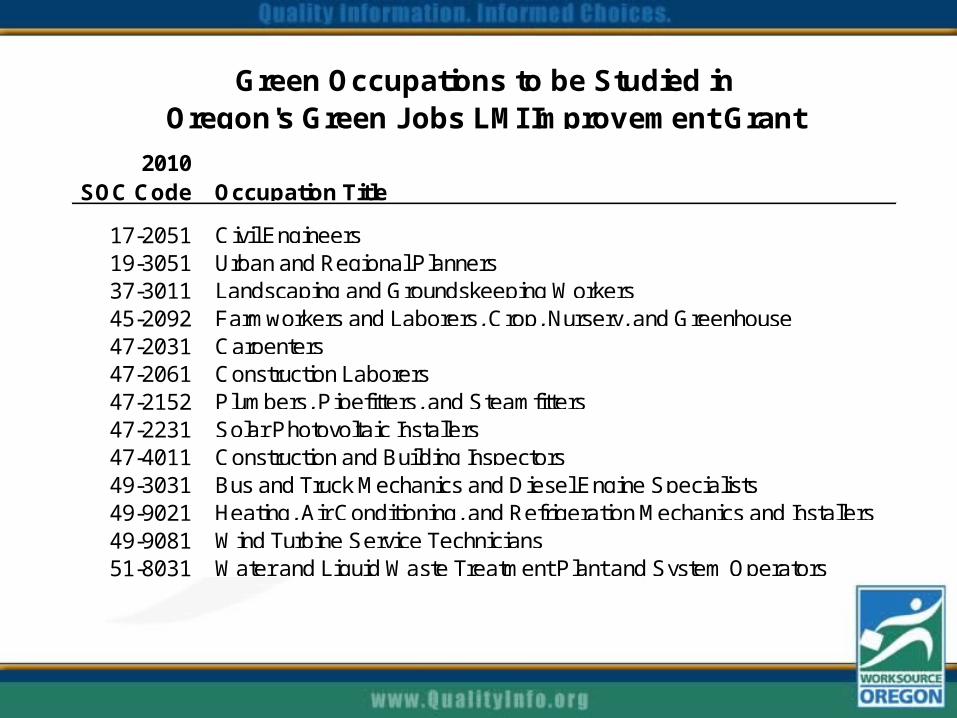
2010SOC Code Occupation Title
17-2051 Civil Engineers19-3051 Urban and Regional Planners37-3011 Landscaping and Groundskeeping Workers45-2092 Farmworkers and Laborers, Crop, Nursery, and Greenhouse47-2031 Carpenters47-2061 Construction Laborers47-2152 Plumbers, Pipefitters, and Steamfitters47-2231 Solar Photovoltaic Installers47-4011 Construction and Building Inspectors49-3031 Bus and Truck Mechanics and Diesel Engine Specialists49-9021 Heating, Air Conditioning, and Refrigeration Mechanics and Installers49-9081 Wind Turbine Service Technicians51-8031 Water and Liquid Waste Treatment Plant and System Operators
Green Occupations to be Studied inOregon's Green Jobs LMI Improvement Grant

In-depth Study of Occupations
1. Compilation of already-known information
2. Gather information through surveys and focus groups
3. Identify skills associated with occupations that have green jobs
4. Analyze the specific skill requirements for green jobs in selected occupations
5. Identify other unique characteristics of an occupation’s green jobs
6. Identify the skill ladders that form green career pathways
7. Conduct WorkKeys assessments on green job tasks in selected occupations

Oregon’s Career Information System (CIS)
• Determine career planners’ needs for information related to green jobs
• Incorporate needed data into the CIS • New occupations and industries files detailing
required skills, training, and credentials• Updated FAQs• Overview articles of new information
• Develop curriculum to help students understand green jobs
• Collaborate with national CIS office

DCCWD – Career Pathways
• Identify and map career paths and skill progressions that lead to green jobs Identify industry and occupation-specific technical
competencies Design career roadmaps (and certificates if appropriate) for
entry-level positions and progressive job advancement
• This project will use a new, statewide approach which links available occupational training at multiple community colleges throughout Oregon

House Bill 3300 & Oregon’s Green Jobs Council
1. Identify high demand green industries
2. Promote development of emerging green technologies and innovations
3. Leverage and align existing public workforce development programs
4. Link adult basic education programs to green jobs training programs
5. Identify skills and competencies necessary for green job career pathways
6. Ensure that support services are integrated into green jobs training programs for targeted populations
7. Define terms related to green jobs and the green economy that are consistent with current workforce development and economic development terminology

Timeline of Green Jobs Council Efforts
• January 14th, 2010: submission of Oregon Green Jobs Growth Plan Draft and Process for Completion
• September 1st, 2010: Completion of Final Draft of Plan:
Delivery of budget requests to the Governor’s office
• January 2011: Submission of final Plan and formal presentation to the Legislature

Green Jobs Growth Plan: K-12 Recommendations
• 33 specific action recommendations in 5 categories
1. Increase the sustainability literacy of each student2. Provide K-12 students with career guidance and
information related to green jobs3. Make hand-on learning opportunities available to middle
and high school students4. Increase readiness of K-12 teachers to provide
education on sustainability5. Convene a working session of relevant stakeholders to
implement strategies put forth in the Green Jobs Growth Plan

Charlie JohnsonGreen Jobs Economist
www.QualityInfo.org/Green