Embed Size (px)
Citation preview

1
The Greater Arab Free Trade Area (GAFTA): An Estimation of the Trade Effects (Preliminary version)
Javad Abedini and Nicolas Péridy1 Introduction In 1997, fourteen Arab countries concluded an agreement, aimed at achieving the Greater Arab Free Trade Area (GAFTA) by 1.1.2007 at the latest. The main provisions concerned the progressive removal of tariff and non tariff barriers (NTBs) on intra-GAFTA trade in manufactures. Agricultural products were provided special treatment: each country could exclude at most 10 agricultural products from the agreement during the harvest season. In addition, rules of origins were set at 40% of the value added. The last provisions provided for the agreement’s conformity with WTO rules as well as special delays for least developed Arab countries. On 1.1.2005, the tariff removal was fully completed, although countries only partially removed NTBs. The great bulk of the existing literature related to the economic effects of GAFTA remains very descriptive (Sekouti, 1999; Tahir, 1999; Zarrouk, 2000; Hadhri, 2001; Bayar, 2005; MINEFI, 2005, etc…). A few ex-ante studies are more analytical, but focus on a small number of countries. For example, Neaime (2005) considers the impact of monetary and financial integration, especially Foreign Direct Investment (FDI) liberalisation across Arab countries. With regard to GAFTA trade provisions, CATT (2005) assesses the GAFTA welfare effect on specific countries, mainly Morocco and Tunisia. This assessment is achieved through computable general equilibrium (CGE) modelling. Results show positive or negative welfare effects, depending on the terms of trade. Bousseta (2004) also relies on CGE models applied to Maghreb countries. Results conclude to a moderate rise in intra-Maghreb trade due to GAFTA. Finally, Péridy (2005a) concentrates on the appraisal of the ex-ante effect of trade liberalisation between Morocco, Tunisia, Egypt and Jordan (Agadir Agreement). Using a modified gravity model, this author shows limited trade effects, mainly because of the lack of trade complementarity between these countries. This paper is aimed at providing additional insight about the GAFTA trade impact by proposing the following contributions. In the first place, it provides a first ex-post appraisal
1 University of Nantes (France) Laboratoire d’Economie de Nantes BP 52231 F-44322 Nantes cedex 3 Corresponding author: [email protected]

2
and covers all the GAFTA members which have implemented the agreement2 as well as the countries which are expected to carry out the agreement in the coming years3. As a second contribution, this paper is based on a theoretical gravity model which accounts for new developments, including the impact of sunk costs and expectations (Abedini, 2005), price effects (Anderson and van Wincoop, 2003) as well as bilateral trade costs effects (Anderson and van Wincoop, 2004; Markusen and Venables, 2005). Third, we estimate a panel data model which covers trade from the 21 GAFTA members (or potential members) to GAFTA countries as well as 35 other reference countries4, over the period 1988-2005. This model with triple heterogeneity requires specific econometric consideration, as stated in the recent literature (Abowd et al., 1999; Wooldridge, 2001 and Wolff, 2006). Consequently, a transformed fixed effect model will be first estimated. Some other estimators will also be proposed, in order to solve endogeneity problems in random effects models (Egger, 2004) or in dynamic models (Arellano and Bond, 1998). Finally, the GAFTA trade impact is assessed in two ways, including the use of time dummies (from 1997 onward), and the comparison of border effects within the GAFTA area and across this area. 1. Integration and trade in the Arab area : an overview As mentioned in the introduction, there is an extensive literature concerning the description of economic integration and trade in the Arab world. Consequently, this section intends at giving an overview and summarising the main features of this South-South integration process. Trade integration in the Arab world is an old story. Starting with the creation of the Arab League in 1945, several attempts have been made to promote regional political and economic integration: the 1950 Treaty for Joint Defence and Economic Cooperation, the 1953 Convention for Facilitating and Regulating Transit Trade, the 1957 Arab Economic Unity Agreement, the 1964 Arab Common Market, the 1981 Gulf Cooperation Council, the 1989 Arab Cooperation Council as well as the 1989 Arab Maghreb Union (Neaime, 2005). However, these agreements have generally not been implemented. As a result, trade barriers have remained high within the Arab region.
2 Bahrain, Egypt, Iraq, Jordan, Kuwait, Lebanon, Libya, Morocco, Oman, Qatar, Saudi Arabia, Syria, Tunisia, United Arab Emirates (UAE) as well as Yemen. 3 These are Algeria, which has signed the agreement in 2002, Sudan as well as Somalia and Mauritania, which have yet not joined the agreement. Djibouti and Comoros are also considered as potential members. However, these two countries are excluded from the current analysis, due to a lack of data. 4 The members of some main other FTAs consist these reference countries. This makes possible a comparative estimation of GAFTA effects on the inside of the model. They are: Argentina, Austria, Brazil, Bulgaria, Canada, Chile, China, Colombia, Denmark, Ecuador, Finland, France, Germany, Greece, Hungary, Iceland, Indonesia, Ireland, Israel, Italy, Malaysia, Mexico, Netherlands, Peru, Philippines, Poland, Portugal, Spain, Sweden, Switzerland, Thailand, Turkey, United Kingdom, United States, and Venezuela.

3
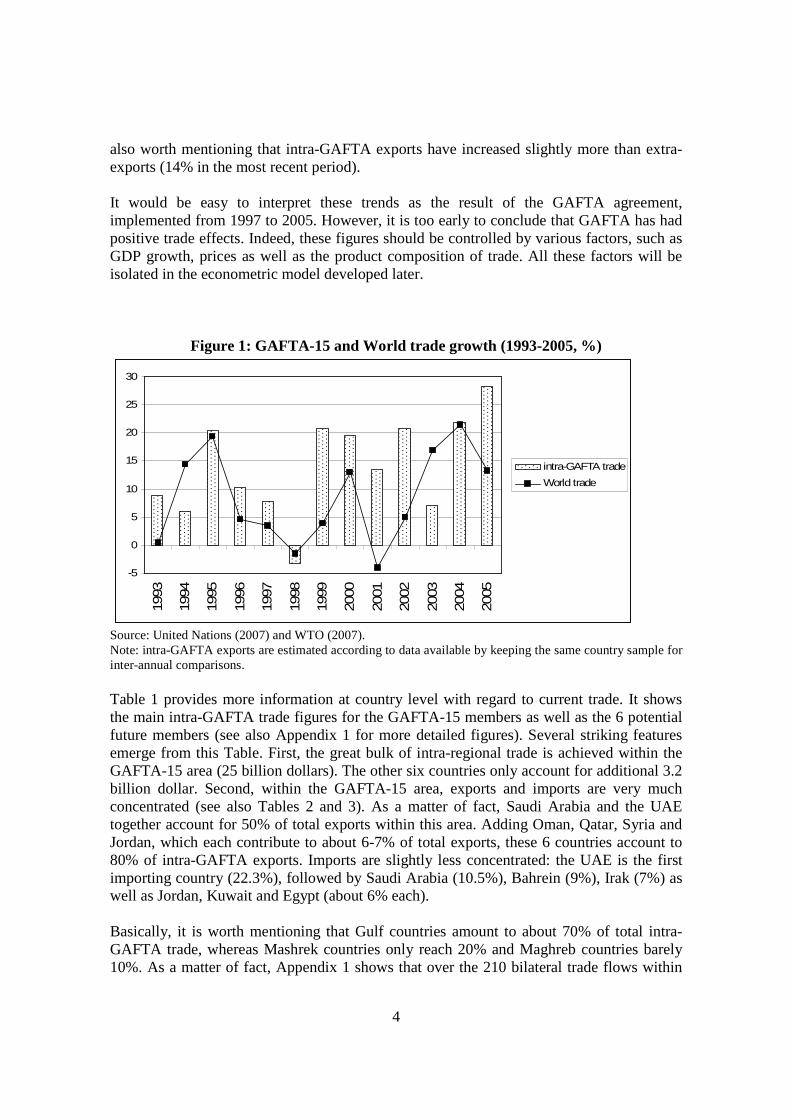
Things started changing in the 90s, when most Arab countries actually implemented trade liberalization process, both at multilateral, bilateral and regional level. Indeed, a significant number of Arab countries signed the GATT agreement from 1990 onward, namely: Tunisia: 1990, United Arab Emirates and Qatar: 1996, Jordan and Oman: 2000, Saudi Arabia: 2005. At the same time, there has been an increase in bilateral free trade agreements: for instance, Egypt concluded agreements first with Libya and Syria in 1990, then with Tunisia, Lebanon and Jordan in 1998, and finally with Iraq in 2001. At the same time, Morocco concluded similar agreements with Turkey (2005) and the USA (2006). Jordan also implemented free trade arrangements with the USA (2002). Finally, at the regional level, the GAFTA was signed in 1997 whereas the Agadir Agreement was signed between Morocco, Egypt, Jordan and Tunisia in 2004. Among these numerous agreements which very often overlap each other in spaghetti regionalism, GAFTA is certainly the most far-reaching one. This is due not only because it covers all countries in the Arab region, but also because it relies on political institutions, such as the Gulf Cooperation Council and the Arab League. Moreover, the contents of the agreement are also far-reaching, first because it not only includes the removal of tariffs, but also monetary, administrative and quantitative NTBs (quotas)5. It also provides for the trade liberalization in agriculture (despite a transition period) as well as a precise set out of rules of origins. Finally, inter-Arab consultation is also expected concerning services, research and technological cooperation as well as intellectual property. Moreover, the agreement encourages Arab countries to go quicker in the integration process through the bilateral or sub-regional agreements (Arab League, 1999). In this regard, the Agadir agreement must be considered in accordance with the GAFTA process and complementary to this process. The economic benefits expected from this far-reaching regional integration are numerous and well-known. GAFTA members are first expected to increase intra-regional trade, thanks to the removal of trade barriers. Second, production efficiency should be enhanced through by exploiting comparative advantage and scale economies. Third, competition within domestic markets will be increased with greater product varieties for consumers as well as lower prices. Fourth, an improvement of terms of trade is expected thanks to the decrease in import prices. Finally, GAFTA should help to increase economic growth through the dynamic effects of regional integration (Baldwin and Venables, 1995; Robson, 1998). Looking at trade statistics at regional level, it is striking to observe that intra-GAFTA exports increased at a faster rate than world exports, especially in the recent period (Figure 1 and 2). As a matter of fact, over the period 1997-2005, intra GAFTA exports have increased by 15.1% at yearly average, whereas world exports have risen by 7.9% only. It is 5 In fact, the GAFTA provisions include two types of exceptions to trade liberalization. The first concerns permanent exceptions related to religious, sanitary, environmental or security reasons. The second relates to temporary exceptions, which cannot account for more than 15% of each country’s total imports from other GAFTA countries. Six Member States implemented these temporary restrictions until 2002. These are Jordan, Tunisia, Syria, Lebanon, Egypt and Morocco. The number of temporarily excluded products ranged from 35 for Egypt to 898 for Morocco. These products amounted respectively to 0.3% and 6.7% of trade (MINEFI, 2005).
4
also worth mentioning that intra-GAFTA exports have increased slightly more than extra-exports (14% in the most recent period). It would be easy to interpret these trends as the result of the GAFTA agreement, implemented from 1997 to 2005. However, it is too early to conclude that GAFTA has had positive trade effects. Indeed, these figures should be controlled by various factors, such as GDP growth, prices as well as the product composition of trade. All these factors will be isolated in the econometric model developed later.
Figure 1: GAFTA-15 and World trade growth (1993-2005, %)
-5
0
5
10
15
20
25
30
1993
1994
1995
1996
1997
1998
1999
2000
2001
2002
2003
2004
2005
intra-GAFTA trade
World trade
Source: United Nations (2007) and WTO (2007). Note: intra-GAFTA exports are estimated according to data available by keeping the same country sample for inter-annual comparisons. Table 1 provides more information at country level with regard to current trade. It shows the main intra-GAFTA trade figures for the GAFTA-15 members as well as the 6 potential future members (see also Appendix 1 for more detailed figures). Several striking features emerge from this Table. First, the great bulk of intra-regional trade is achieved within the GAFTA-15 area (25 billion dollars). The other six countries only account for additional 3.2 billion dollar. Second, within the GAFTA-15 area, exports and imports are very much concentrated (see also Tables 2 and 3). As a matter of fact, Saudi Arabia and the UAE together account for 50% of total exports within this area. Adding Oman, Qatar, Syria and Jordan, which each contribute to about 6-7% of total exports, these 6 countries account to 80% of intra-GAFTA exports. Imports are slightly less concentrated: the UAE is the first importing country (22.3%), followed by Saudi Arabia (10.5%), Bahrein (9%), Irak (7%) as well as Jordan, Kuwait and Egypt (about 6% each). Basically, it is worth mentioning that Gulf countries amount to about 70% of total intra-GAFTA trade, whereas Mashrek countries only reach 20% and Maghreb countries barely 10%. As a matter of fact, Appendix 1 shows that over the 210 bilateral trade flows within

5
the GAFTA-15 area, the five main flows involve Gulf countries, such as Saudi Arabian/UAE (10.4% of total GAFTA trade), Saudi Arabia/Bahrein (8.7%), Oman/UAE (5.6%), Qatar/UAE (4.7%) as well as Saudi Arabia/Kuwait (4.2%).
Figure 2 : Intra and extra GAFTA-15 trade since 1993 (average annual percentage change)
0%
2%
4%
6%
8%
10%
12%
14%
16%
GAFTA exports (intra) GAFTA exports (extra) world exports
1993-1996
1997-2005
Source: United Nations (2007) and WTO (2007) A last striking feature concerns the trade balance within the GAFTA area: Saudi Arabia exhibits a tremendous surplus (7.3 million dollars). Some other countries also enjoy surpluses, though to a lesser extent. These are Oman (0.9 million US$), Qatar (0.8), Syria (0.7), Tunisia (0.6) as well as Algeria (0.3). The other countries face trade deficits, especially for Bahrain, Kuwait, Libya and Morocco. Additional investigations may be given at product level (Tables 2 and 3). Four main product groups are traded within GAFTA. Fuel is the most important (26% of total trade). It is mainly exported by Saudi Arabia, which accounts alone for more than 70% of intra-GAFTA fuel exports. The other export countries are Algeria, Egypt as well as Syria, though to a much lesser extent. Fuel products are mainly imported by Bahrain (1.7 million $), the UAE (1.2), Egypt (1.1) as well as Morocco and Jordan (0.7 each). The second main traded products concern manufactured products, including miscellaneous manufactures. This product group accounts for 23% of GAFTA regional trade. Saudi Arabia and the UAE are the main exporters, since they account for almost half of trade. Egypt, Bahrain and Lebanon are secondary exporters which barely reach 8% of total regional manufactured exports. Finally, Maghreb countries’ share remains below 5%, as these countries are very much more oriented toward the EU for their manufactured product exports. Imports are more diversified. As a matter of fact, though Saudi Arabia and the UAE still absorb one third of manufactured products’ imports, most countries account for between 5% and 10% of regional GAFTA imports, with the notable exception of Morocco and Tunisia, which remain below 1%.

6
Food products (including beverages as well as oils and fats) are the third important product group (15.8% of intra-regional trade). Exports are dominated by Saudi Arabia, Syria, the UAE as well as Jordan. These countries account together for 2/3 of exports. Egypt and Oman supplement these figures by an additional 15%. With regard to imports, Irak represents a significant share (13%), in addition to Saudi Arabia (18%), the UAE (11%) as well as Oman (11%). Again, Gulf countries contribute to the great bulk of trade for this product category. The final product group includes chemicals as well as machinery, which account each to about 12.5% of total regional trade. As far as chemicals are concerned, the main exporters are Saudi Arabia and Jordan, whereas imports are more evenly distributed across countries. Finally, machinery and transport equipment’s trade is again dominated by Saudi Arabia and the UAE, for both imports and exports. Table 4 summarizes the top-20 bilateral trade flows by both countries and commodities. These 20 flows account for more than 10 million US$, i.e. 38% of total intra-GAFTA trade. They mainly involve Mineral fuel as the main export product (50% of the total) as well as Saudi Arabia as the main exporting country (2/3 of the total). This again reflects the extreme concentration of trade flows within GAFTA in terms of products and markets.
Table 1: intra-GAFTA trade: breakdown by countries (2005)
Exports Imports Exp-Imp.million US$ % million US$ % million US$
Algeria 928.1 3.3% 671.1 2.4% 257.0Bahrein 780.4 2.8% 2486.8 9.0% -1706.4Comoros 0.05 0.0% 3.3 0.0% -3.3Djibouti 4.69 0.0% 350.2 1.3% -345.5Egypt 1511.5 5.4% 1915.6 6.9% -404.1Iraq n.a. n.a. 1951.0 7.0% n.a.Jordan 1815.8 6.5% 1725.3 6.2% 90.5Kuwait 514.8 1.9% 1614.6 5.8% -1099.8Lebanon 925.1 3.3% 975.6 3.5% -50.5Lybia 4.27 0.0% 980.0 3.5% -975.7Mauritania 8.4 0.0% 71.3 0.3% -62.9Morocco 374.3 1.3% 1085.3 3.9% -711.0Oman 2130.7 7.7% 1204.9 4.3% 925.8Qatar 1730.1 6.2% 889.6 3.2% 840.5Saudi Arabia 10170.2 36.6% 2919.7 10.5% 7250.5Somalia n.a. n.a. 159.0 0.6% n.a.Sudan 332 1.2% 581.8 2.1% -249.8Syria 1611 5.8% 922.0 3.3% 689.0Tunisia 933.7 3.4% 336.7 1.2% 597.0UAE 3438.8 12.4% 6192.7 22.3% -2753.9Yemen 548 2.0% 716.4 2.6% -168.4Total 27752.9 100.0% 27752.9 100.0% 0.0

7
Note: 2004: Algeria, Egypt, Lebanon, Syria; 2003: Mauritania, Saudi Arabia; 2001: Kuweit, UAE; 1998: Comoros, Lybia; 1991: Djibouti; na: non available Source: United nations (2007)
Table 2: intra-GAFTA imports: breakdown by commodit ies (2005, million US$).
Imports Food and Beverages Crude mater. Fuels Oils Chemicals Manufactured Machin. and Misc. manuf. Non class.live animals and tobacco except fuels and fats products transp. equip. articles articles
Algeria 63.0 0.4 14.0 20.2 3.7 164.3 221.9 98.2 81.3 4.1Bahrein 148.2 9.3 21.3 1708.3 8.9 98.2 225.2 167.7 69.4 30.3Comoros 1.3 0.0 0.0 0.0 0.0 0.1 0.3 1.0 0.2 0.4Djibouti 15.2 1.0 2.3 257.0 0.5 11.5 26.2 21.2 12.7 2.6Egypt 130.2 6.0 78.8 1153.9 0.5 186.7 171.7 110.2 38.1 39.5Iraq 299.8 156.3 13.3 357.4 104.3 189.2 312.8 372.6 111.2 34.1Jordan 240.9 25.7 27.2 700.8 4.1 251.0 226.1 153.3 54.8 41.4Kuwait 296.1 44.1 24.3 153.5 9.2 197.9 472.6 280.6 124.6 11.7Lebanon 139.6 1.1 50.9 448.4 8.2 102.1 143.9 47.7 24.1 9.6Lybia 181.2 13.8 9.6 3.7 56.7 110.1 279.6 165.7 125.2 34.4Mauritania 6.8 2.9 0.5 17.0 0.9 5.2 23.1 8.2 6.2 0.5Morocco 32.0 3.2 11.5 698.2 1.5 173.9 124.1 23.0 14.8 3.1Oman 103.6 370.0 10.7 7.7 8.4 150.0 331.0 154.3 61.1 8.1Qatar 161.8 13.5 44.1 6.8 8.6 98.7 266.7 202.3 65.1 22.0Saudi Arabia 720.1 17.7 101.3 16.4 34.3 375.2 715.3 502.2 220.0 217.2Somalia 50.3 7.2 3.8 1.6 5.4 14.7 32.7 22.1 20.9 0.3Sudan 47.5 0.2 13.2 23.1 3.6 107.1 139.7 159.2 66.0 22.2Syria 175.0 4.5 24.8 88.9 8.2 160.8 241.3 166.5 21.3 30.7Tunisia 23.7 0.6 28.1 134.3 0.1 53.5 63.9 16.4 11.4 4.7UAE 414.6 18.4 112.3 1235.4 51.0 913.7 808.1 710.4 306.9 1621.9Yemen 98.4 7.6 7.6 181.6 2.5 77.1 159.3 104.1 55.3 22.9Total (million US$) 3349.3 703.5 599.6 7214.2 320.6 3441.0 4985.5 3486.9 1490.6 2161.7Total (%) 12.1% 2.5% 2.2% 26.0% 1.2% 12.4% 18.0% 12.6% 5.4% 7.8% Source: United Nations (2007) Note: 2004: Algeria, Egypt Lebanon and Syria; 2003: Mauritania and Saudi Arabia; 2001: UAE.
Table 3: intra-GAFTA exports: breakdown by commodities (2005, million US$).
Exports Food and Beverages Crude mater. Fuels Oils Chemicals Manufactured Machin. and Misc. manuf. Non class.live animals and tobacco except fuels and fats products transp. equip. articles articles
Algeria 10.5 0.6 10.1 786.8 7.0 27.1 62.9 21.1 2.0 0.0Bahrein 21.3 9.3 80.6 0.5 0.4 35.7 472.8 122.7 32.8 4.3Comoros n.a. n.a. n.a. n.a. n.a. n.a. n.a. n.a. n.a. n.a.Djibouti n.a. n.a. n.a. n.a. n.a. n.a. n.a. n.a. n.a. n.a.Egypt 287.7 0.9 46.7 376.4 20.8 137.2 489.1 86.4 62.4 3.9Iraq n.a. n.a. n.a. n.a. n.a. n.a. n.a. n.a. n.a. n.a.Jordan 411.9 75.5 28.7 7.2 94.4 517.9 238.8 303.8 135.5 2.1Kuwait 39.5 8.3 6.0 10.3 2.4 187.6 100.8 102.7 40.8 16.4Lebanon 134.8 19.0 18.4 1.1 6.3 72.7 272.5 216.6 182.3 1.4Lybia n.a. n.a. n.a. n.a. n.a. n.a. n.a. n.a. n.a. n.a.Mauritania 0.0 0.0 7.7 0.0 0.0 0.0 0.0 0.0 0.0 0.7Morocco 128.5 2.8 24.0 15.7 1.0 79.0 94.1 14.7 14.5 0.0Oman 266.6 16.7 47.0 111.0 73.2 105.3 294.9 201.7 86.2 928.1Qatar 23.8 0.8 16.9 33.3 0.5 250.5 81.3 208.8 29.0 1085.2Saudi Arabia 704.3 56.8 94.9 5126.8 40.2 1502.6 1491.6 890.5 260.1 2.4Somalia n.a. n.a. n.a. n.a. n.a. n.a. n.a. n.a. n.a. n.a.Sudan 126.7 0.1 106.2 83.9 0.1 1.3 0.0 0.0 0.2 13.5Syria 627.1 55.2 46.5 375.9 8.4 67.4 213.0 43.1 113.5 60.9Tunisia 179.7 9.6 7.6 14.5 55.5 205.1 277.9 120.8 63.0 0.0UAE 233.6 424.0 50.5 60.9 9.6 188.4 885.0 1082.1 461.9 42.8Yemen 153.2 23.6 7.8 210.0 0.9 63.3 10.6 71.9 6.7 0.0Total (million US$) 3349.2 703.2 599.6 7214.3 320.7 3441.1 4985.3 3486.9 1490.9 2161.7 Source: United Nations (2007) Note: 2004: Algeria, Egypt Lebanon and Syria; 2003: Mauritania and Saudi Arabia; 2001: UAE.

8
Table 4: intra-GAFTA top-20 trade flows: breakdown by countries and commodities
(2005, million US$).
rank exporting importing product million US $1 Saudi Arabia Bahrain Mineral fuels 1 6932 Qatar UAE Non classified articles 9333 Saudi Arabia UAE Mineral fuels 8584 Saudi Arabia Egypt Mineral fuels 7075 Oman UAE Non classified articles 6766 Saudi Arabia UAE Chemicals 6427 Saudi Arabia Jordan Mineral fuels 6158 Saudi Arabia Morocco Mineral fuels 5199 Algeria Egypt Mineral fuels 447
10 Saudi Arabia UAE Manufact goods 42211 UAE Oman Beverages and tobacco 36912 Saudi Arabia UAE Machinery and transport equip. 35013 Syria Iraq Mineral fuels 34314 Saudi Arabia Kuwait Manufact goods 30215 Bahrain Saudi Arabia Manufact goods 26616 Saudi Arabia Djibouti Mineral fuels 25717 Syria Saudi Arabia Food and live animals 24718 UAE Saudi Arabia Machinery and transport equip. 24019 Saudi Arabia Lebanon Mineral fuels 22420 UAE Oman Manufact goods 201
Total 1-20 10 312 Note: 2004: Algeria, Egypt Lebanon and Syria; 2003: Mauritania and Saudi Arabia; 2001: UAE. 2. The model The model proposed here is based on new developments in the gravity equation. In recent years, significant progress has been made with regard to the theoretical derivation of this equation. Indeed, it has been increasingly recognized that the gravity equation could be derived from several theories, including mainly Ricardian, Heckscher-Ohlin and monopolistic competition models (Helpman and Krugman 1985, Bergstrand 1989, Markusen and Wigle 1990, Evenett and Keller 2002, Shelburne 2002), but also the reciprocal-dumping model (Feenstra, Markusen and Rose, 2001). It may also be derived both from complete or incomplete specialization frameworks (Haveman and Hummel 2004). Additional improvement has been made by Anderson and van Wincoop (2003), and Deardorff (2004), who particularly focus on trade costs effects. Finally, Abedini (2005) proposes an extension of these models, through the distinction between recoverable and non recoverable trade costs (sunk costs). This makes it possible to introduce expectations in theoretical gravity models.

9
Since the present paper attempts to explain bilateral trade within the MENA region with a particular emphasis on trade integration, the trade costs specification is of primary importance. As a result, the present model is a modified version of Anderson and van Wincoop (2003)’s model, which can be written as:
σ
µ
γα −
=
1
ejt
eit
eTijt
wt
jtitijt PP
t
Y
YYX (1)
where Xijt corresponds to exports from country i to country j at year t; in equation (1), the first term in brackets corresponds to the mass variables. They include GDP for country i (Yit), for country j (Yjt) and for the rest of the world (Ywt). Contrary to Anderson and van Wincoop (2003) for which income elasticities are constants, we introduce the possibility for non unitary elasticities (α, γ and µ). This can be justified if we assume the possibility for non tradable goods. Indeed, assuming that in countries i and j, only a fraction ϕ of income is spent on tradables, non unitary income elasticities can be easily derived, as already shown in Péridy (2005b). The second term in bracket corresponds to trade costs. In this regard, tijt
eT reflects bilateral trade cost expected from t to T, whereas Pit
e and Pjte measure the expected multilateral trade
resistance in both countries; σ is the constant elasticity of substitution for consumers (σ>1). More precisely, tijt
eT is in turn equal to:
( ) ( )T
ttt
kektij
T
kt
ektijtt
eTijt
δββ )(1
11 +=
+∑ Ω+++= (2)
It may be defined as the average of expected trade costs from the present onward (for T periods). In this case, T represents the number of periods during which the sunk costs of trade can be amortized. In equation (2), trade costs are estimated by the current or expected trade cost growth rate β, given the available information vector Ωt, and given the discount rate δ applied to the k future periods (see Abedini 2005 for more details). In the same way, Pit
e and Pjte can be written as:
( )
jtPPi
ijte
itite
jte ∀=∑
−−−,
111 σσσ θ (3)
( )itPP
j
ijte
jtjte
ite ∀=∑
−−−,
111 σσσ θ (4)
Pit
e and Pjte reflect the implicit expected aggregate equilibrium prices with θi and θj
corresponding to country i and j's income shares. These price indexes reflect in fact expected multilateral trade resistance. Indeed, as prices in the importing country (j) depend

10
on expected trade barriers charged to all exporting countries (i), Pjte reflects the expected
inward multilateral trade resistance. Similarly, Pite reflects expected outward multilateral
trade resistance as it depends on country i's trade barriers from all its import partners. In both cases, an increase in expected multilateral resistance leads a country i to trade more with its bilateral partner j. From the theoretical framework described above, it is now possible to directly derive our empirical model. For that purpose, the direct equation (1) log-linearization leads to:
( ) ( ) ( ) ejt
eit
eTijtwtjtitijt PPtYYYX ln1ln1ln1lnlnlnln −+−+−−−+= σσσµγα (5)
In order to be estimable, equation (5) must be slightly amended. First, the current part of bilateral trade costs can be proxied by several variables, such as bilateral distance between country i and country j (DISTij), the difference in languages between countries (LANGij), information costs (INFOij) as well as border effects (BORDij), which specifically measure the costs of crossing a frontier (McCallum, 1995, Anderson and van Wincoop, 2003). Regional economic integration can also have an influence on current or anticipated trade costs. Indeed, it offers positive prospects related to the decrease in administrative or institutional costs. As a result, the main regional trading arrangements (RTAs) are included in the model as dummies: it first concerns the GAFTA area since 1997 but also the European Union (EU), the Northern American Free Trade Area (NAFTA), the Latin American RTA (MERCOSUR) as well as the Euro-Mediterranean agreement (EUROMED). In addition, the degree of confidence of economic agents with regard to justice and law in on country is another “expectation” variable which is supposed to reduce trade costs in the import market (LAWjt). Multilateral trade resistance can be captured by an inverse proxy, which measures the freedom of each importing country to trade (FREEjt). In other words, it measures the openness of the importing economy with regard to the rest of the exporting world. Finally, price effects in the importing and in the exporting country are captured by specific country effects, which can be fixed or random effect depending on the estimation procedure. This approach is now standard in the empirical literature, because of the lack of reliable international trade price statistics at country level. The final empirical equation becomes:
ijtijtijtijijjtitijt GAFTAEUNAFTALANGDISTYYX 76543210 lnlnlnln αααααααα +++++++=
jtjtijijtijtijt FREELAWBORDINFOEUROMEDMERCOSUR 1312111098 lnln αααααα ++++++
ijtijtji εωϕφδ +++++ (6)
In this equation, the world GDP (Ywt) can be passed on to the constant term, whereas specific exporting country effects (δi), importing country effects (φj), time effects (ϕt) as

11
well as bilateral effects (ωij) are also introduced in the model. These effects are supposed to take into account the heterogeneity biases as well as the omitted variable problem, notably price effects (Egger and Pfaffermayr, 2003). Before estimating the model, data and sources must be briefly described. The dataset includes 56 exporting and importing countries, of which the GAFTA-15 countries, the 6 Arab potential member countries as well as 35 other reference countries. The period taken into consideration stems from 1988 to 2005. Overall, the number of observations amounts to 56,448. Bilateral exports are derived from the United Nation statistic division (COMTRADE). GDP, distance and differences in languages data come from CEPII (dataset CHELEM). In this regard, it must be said that we use a weighted distance variable which takes into account the spatial distribution of the population within each country6. Regional integration is captured by various dummies as described previously. In the same way, the border effect variable is proxied by a dummy which is equal to zero for trade within countries and unity for trade across countries. This variable requires internal trade and distance data. Thus, internal trade is proxied by the difference between GDP and total exports, whereas the internal distance is measured in the same way as international distance (CHELEM). The access to information (INFOijt) is proxied by the minimum of telephone lines between country i and j (source: World Bank, 2006). A positive sign is expected for α10. The LAW variable is captured by several indicators which measure the quality of contract enforcement, the police, the courts as well as the likelihood of crime and violence in the importing country. Data stem from Kaufman et al. (2006). A positive sign is also expected for α12. Finally, the FREE indicator is a composite index which takes into account taxes on international trade (mean tariff rate, revenue from taxes on trade), regulatory trade barriers, actual/expected trade ratio, official/black market exchange rate, international capital controls (source: Economic Freedom Network, 2006).
3. Estimation, results and sensitivity analysis Equation (6) is a three-way panel data equation with quadruple heterogeneity (import country, export country, bilateral and time heterogeneity). In order to ensure the robustness of the result, several estimators have been implemented as sensitivity analysis. The first is the least squares dummy variable (LSDV). This standard fixed-effect model is particularly appropriate in the presence of endogeneity. This presence is confirmed by the Hausmann test. However, one traditional drawback of this estimator is that it does not make it possible to estimate the parameters corresponding to the time-invariant variables. Alternatively, we also use the Feasible Generalised Least Squares estimator (FGLS) which corresponds to a random effect estimator. It provides parameter
6 For more details about the distance measurement, refer to Head and Mayer (2002) as well as Clair and al. (2004).

12
estimates for time invariant variables. However, in the present study, this estimator is biased because of the correlation between some regressors and the error term. The Hausman and Taylor estimator is more interesting. Indeed, it is a random-effect estimator which is corrected from endogeneity (Greene, 2003; Egger, 2004). In order to implement this estimator, equation (6) must be first transformed as follows:
Zhft Zhft hfZhft
m
hf 1vs
s Thf2 v
2 (7)
where Zhft∗ denotes any variable in equation (6) and Zhft
m reflects the group means of these variables. As a second step, deviations from group means are calculated to consistently estimate the parameters corresponding to the time-varying independent variables. This has been implemented with LSDV. The residual variance estimator is a consistent estimator of σv. As a next step, σs is estimated from a 2SLS regression of the bilateral averages of the previous residuals (within) on the time-invariant variables. The instruments used for these steps are the variables which are assumed to be uncorrelated with the residuals. This provides a consistent estimator of the time-invariant variables. This also makes possible to derive an estimator of σµ² (between variance) from the estimation of σs and σv. The final step consists in re-estimating the complete model (with the transformed variables), with instrumental variables (see the detailed computation procedure in Greene, 2003, p.303). The model is only identified if the number of uncorrelated time-varying variables is at least as large as the number of correlated time-invariant variables. From a practical point of view, the choice of the variables which are supposed to be correlated with the residuals is guided by the value of θ. The closer θ to one, the more similar the estimated variance (σs) to the within variance (σv). As a result, the closer the estimated parameters to the within parameters, the smaller the bias due to the correlation of the residuals to the selected independent variables. Consequently, we selected the correlated variables so as to choose a θ value as close to one as possible. This led us to select Yi and Yj as the correlated variables.
One particularity with the proposed empirical model is related to the quadruple heterogeneity. Under the exogeneity assumption, this does not raise major problems since the corresponding random effects can be estimated. Given the problem of endogeneity in our estimation, we used the fixed effects transformation method proposed recently (Abowd et al.1999; Wooldridge, 2001 and Wolff, 2006). Basically, this method amounts to reducing the number of specific effect without loosing any information concerning the effect which has been dropped. More precisely, this transformation method is implemented as follows. We first calculate the group average of each variable. As an example, the export average is given by:
NM
X
X jijt
iijt
∑∑= (8)

13
Where N and M respectively denote the number of exporting and importing countries. As a second step, we calculate the first difference for each variable. For instance, the first difference exports become:
ijtijtijt XXDX −= (9)
Applied for each variable in equation (6), the time effect ϕt is dropped without loosing the time information which is included in the transformed variables. In a last step, the fixed effects model can be reestimated with the transformed variables. Finally, a dynamic estimator has been implemented, through the inclusion of the lagged dependent variable. The main advantage is that it makes it possible to take into account hysteresis in trade flows. Hysteresis may be due to the existence of sunk costs of market entry or exit, which prevent export flows to return immediately to an equilibrium after a shock or a policy. Abedini (2005) shows that in the presence of sunk costs, expectations play a very important role in international trade. Indeed, after its entry on a particular market, the firm will not be able to leave this market because of non recoverable costs. As a result, before entering the market and before exporting, the firm must ensure that this market is profitable. This is why expectations are particularly important in case of sunk costs. From an econometric point of view, the introduction of a lagged dependent variable may introduce a bias due to the correlation of this variable with the composite disturbance term. Due to the likely existence of simultaneity bias, the most appropriate method of estimation appears to be GMM. We used here the Arellano, Bond and Bover's (ABB) Estimator (Arellano and Bond, 1998). Basically, the initial structure of the model is similar to the HT models described in the previous section. It thus distinguishes between time-varying and time-invariant variables, as well as between variables which are potentially correlated or uncorrelated with the residuals. Instrumental variable estimation without the lagged dependent variable is thus identical to an HT-model. In addition, when adding a lagged variable, the ABB approach provides additional efficiency gains through GMM, by using a larger set of moment conditions. Table 5 provides the results of the estimations. All results have been controlled for multicolinearity, heteroskedasticity as well as autocorrelation7. In all the estimations, the mass variables (export and import country’s GDP) show the expected positive sign. In the same way, the variables related to bilateral trade resistance are also clearly significant and
7 Concerning multicolinearity, the Variance Inflation Factor (VIF) has been calculated. We ensured that this statistics remained below 30 (Kennedy, 1998). Similarly, heteroskedasticity has been checked through the White heteroskedasticity correction method. Finally, autocorrelation has been controlled through the estimation of AR(1) models.

14
display the expected sign8. In particular, the border effect parameter is clearly negative and significant, as expected. In addition, the degree of economic confidence of economic agents (LAW) is clearly significant. This confirms the impact of expectations in bilateral trade flows (Abedini, 2006). This result is also reinforced by the positive and significant effect of the lagged export flows in the dynamic model. Such an effect suggests that sunk costs play a significant role in the firm’s decision to export. Finally, multilateral trade resistance, measured by the “freedeom” variable, also shows the expected sign. Table 5: Estimation Results
TFEM
REM FEM HTM
REM FEM
Dynamic model (ABB)
GDPi 1.344*
(.0193)
1.28*
(.0432)
.996*
(.036)
1.399*
(.0193)
1.384*
(.0495)
.633*
(.0318)
GDPj .969*
(.0221)
1.064*
(.0434)
.613*
(.0342)
1.041*
(.0232)
1.179*
(.0529)
.261*
(.0289)
DIST -1.283*
(.0412)
-1.509*
(.0458)
-1.282*
(.041)
-6.436*
(1.022)
-.815*
(.0307)
LANG .559*
(.1065)
-.522*
(.1101)
.575*
(.1056)
-4.412***
(2.3214)
-.206*
(.069)
INFO .08*
(.0138)
.058*
(.0182)
.24*
(.0148)
.124*
(.0156)
.057*
(.0184)
.136*
(.0129)
FREEj .514*
(.0563)
.544*
(.0582)
.516*
(.0576)
.668*
(.0636)
.689*
(.0651)
.239*
(.0552)
LAW j .201*
(.0284)
.196*
(.0413)
.035
(.0294)
.158*
(.0295)
.072***
(.0436)
.065*
(.0213)
BORDER -2.021*
(.3147)
-5.11*
(.3233)
-2.111*
(.3112)
-25.2*
(8.712)
-2.769*
(.2)
EXPlag
.399*
(.0052)
GAFTA .172*
(.053)
.17*
(.0543)
.278*
(.0534)
.121**
(.0521)
.214*
(.0541)
.184*
(.0484)
EU .294*
(.0345)
.292*
(.0352)
.315*
(.0349)
.331*
(.0353)
.305*
(.0366)
.212*
(.0315)
MER .132*
(.2432)
.109
(.2495)
.109
(.2458)
.095
(.2431)
.038
(.2489)
.097
(.2312)
8 The only exception in the language variable which does not present the expected sign in the HT and in the dynamic model.

15
EUROMED -.067***
(.0383)
-.073***
(.0389)
.029
(.0386)
.007
(.0389)
-.029
(.0392)
.03
(.0342)
NAFTA .064
(.2129)
.122
(.22)
.147
(.2154)
.0514
(.2128)
.096
(.219)
.101
(.193)
Constant -13.091*
(.456)
-25.825*
(.5522)
-.322*
(.037)
-.334*
(.069)
Number of obs. 34574 34574 34574 34574 34574 32285
Number of groups 2239 2239 2239 2239 2239 2206
Adj R-squared 0.7271 0.4691 0.7263 0.4110
Auto correlation (rho) .8826 .8087 .7801 .9867 .6669
VIF (in OLS reg.) 1.44
F-test 998.57* F (13,32322)= 248.64*
Wald tests:
Exporter effects (i);
Importer effects (j);
Bilateral effects (ij);
Time effects (t);
273.45*
59.76*
6.21*
238.27*1
53.76*
44.62*
AIC 86769.68
BIC 86862.64
LM test 110000* 110000*
Hausman test (χ2) 34.28* 219.83*
* significant at 1%, ** significant at 5%, *** significant at 10%
1 We tested several specifications of the fixed effect model. The F statistics for the specific effects i, j and ij are stable across various specifications. This enables us to present the all of these statistics in one presentation, without losing the consistency of the model. In this case, we can have a global idea of the relative significance of these fixed effects in our model.
To sum up, the estimation of equation (6) stresses the role of traditional determinants of international trade (GDP, distance) but also new factors, especially border effects, expectations and sunk costs. Turning now to the specific effect to regional integration, it is not surprising to find significant and positive effects for the EU, NAFTA and MERCOSUR. These results correlate those found in many other studies. The impact of the Euromed agreement is much less significant. Again, this correlates some specific studies concerning the euro-Mediterranean area (Péridy, 2005c). This mixed effect is mainly due to the exclusion of agricultural products in the Euromed agreement. Another reason may be found in the decrease in Mediterranean countries’ margin of preference on the EU market, due to the removal of the Multi-Fibre-Agreement after the Uruguay round.

16
The GAFTA agreement appears to be very significant in all specifications. In particular, although the GAFTA coefficient is lower than the EU parameter, it is greater than MERCOSUR and NAFTA. This clearly shows that regional economic integration in the Arab world has increased intra-regional trade. To go further in this analysis, we can calculate the gross trade creation due to the GAFTA regional economic integration. To that end, equation (6) can be rewritten as:
ijtijtijt GAFTAHXX 7lnln α+= (10)
where lnHXijt reflects the hypothetical intra-GAFTA trade without the GAFTA agreement. We then define the gross trade creation as the difference between actual and hypothetical intra-GAFTA exports:
ijtijt HXXG −= (11)
Replacing HXijt from equation (11) into equation (10) and giving GAFTAijt the value corresponding to the preferential case (GAFTAijt =e), we find:
eGXX ijtijt ln)ln(ln 7α+−= (12)
This allows us to derive G:
−=7
11 αe
XG ijt (13)
From this equation and the parameters α7 estimated previously, we can calculate that over the period 1997-2005, the GAFTA regional arrangement increased intra-regional Arab trade by about 16-24% in the static models depending on the estimator. Taking the dynamic estimator, the GAFTA impact is similar (17%). Thus, whatever the estimator, the GAFTA trade impact is significant. 4. Concluding remarks This paper provides a first ex-post appraisal of the GAFTA agreement’s trade effects. A theoretical model is first derived from new developments in the gravity model, concerning especially the impact of sunk costs and expectations, price effects as well as bilateral trade costs effects. This model is subsequently estimated for the GAFTA-15 members, 6 other GAFTA countries as well as 35 other reference countries, over the period 1988-2005. Several estimators are presented, especially transformed fixed-effects, Hausman and Taylor as well as a GMM dynamic estimator.

17
Results first clearly stress the role of both traditional determinants of international trade (GDP, distance) but also new determinants, especially border effects, expectations and sunk costs. Second, the GAFTA agreement provides significant trade effects. The calculation of gross trade creation shows that regional trade has increased by 20% since GAFTA has been implemented. Given these results, it seems that the GAFTA agreement should go deeper and wider. Indeed, a deeper integration should provide the opportunity of consolidating and reinforcing the current gains. In addition, a wider integration (with the 6 Arab countries which are still outside of this agreement) should help future members in their development process through more trade with their partners. 5. References: Abedini J. (2005), “The Gravity Model and Sunk Costs”, 7th ETSG Conference, Dublin, September. Abedini J. (2006), “An Investigation of the Role of Expectations in Trade: The Case of the Gravity Model”, 8th ETSG Conference, Vienna (Austria), September. Abowd J., Kramarz F., Margolis D. (1999), “High Wage Workers and High Wage Firms”, Econometrica, 67(2): 251-333. Anderson J., van Wincoop E. (2003), “Gravity with Gravitas: A Solution to the Border Puzzle”, American Economic Review 93(1): 170-192. Anderson, J., van Wincoop E. (2003), “Gravity with Gravitas: A Solution to the Border Puzzle”, American Economic Review, 93(1), p. 170-192. Anderson, J., van Wincoop E. (2004), “Trade costs”, Journal of Economic Literature, 42(3), p. 691-751. Arab League (1999), “Documents sur la zone arabe de libre-échange”, secrétariat du conseil économique et social, Le Caire. Arellano M., Bond S. (1998), “Dynamic Panel Data Estimation Using DPD98 for Gauss: A Guide for Users” CEMFI, Madrid. Baldwin R., Venables A. (1995), “Regional Economic Integration”, in: G. Grossman and K. Rogoff, Handbook of International Economics, North Holland.

18
Baltagi B. (2006), “Forecasting with panel data” Discussion Paper Series 1: Economic Studies 2006:25, Deutsche Bundesbank, Research Centre. Bayar A. (2005), “An Evaluation of the Benefits and Challenges of the South-South Integration among the Mediterranean Partner countries”, FEMISE Report, FEM-22-27. Bergstrand J.H. (1989), “The Gravity Equation in International Trade: Some Microeconomic Foundations and Empirical Evidence”, Review of Economics and Statistics 23: 143-153. Boussetta M. (2004), “Espace Euro-méditerranéen et Coûts de la Non Intégration Sud-Sud: le cas des pays du Maghreb”, FEMISE Report, FEM-21-43. CATT (2005), “Obstacles to South-South Integration, to Trade and to Foreign Direct Investment: the MENA Countries Case”, FEMISE Report, FEM-22-36. Clair and al. (2004), “Notes on CEPII's distances measures”, www.cepii.fr. Deardorff A. (2004), “Local Comparative Advantage: Trade Costs and the Pattern of Trade”, Research Seminar in International Economics, Discussion Paper n°500, University of Michigan. Egger P. (2004), “On the Problem of Endogenous Unobserved Effects in the Estimation of Gravity Models”, Journal of Economic integration, 19(1): 182-91. Egger P., Pfaffermayr M. (2003), “The Proper Panel Econometric Specification of the Gravity Equation: a Three-Way Model with Bilateral Interaction Effects”, Empirical Economics, 28(3), p. 571-580. Evenett S., Keller W. (2002), “On theories Explaining the Success of the Gravity Equation” Journal of Political Economy, 110(2): 281-316. Feenstra R., Markusen J., Rose A. (2001), “Using the Gravity Equation to Differentiate among Alternative Theories of Trade”, Canadian Journal of Economics, 34(2): 430-447. Greene W. (2003), “Econometric Analysis”. New York: Prentice-Hall International. 5th edition. Hadhri A. (2001), “La Grande Zone Arabe de Libre-Echange et les Perspectives d’Intégration Sud-Sud en Méditerranée”, Conférence FEMISE, mars 2001. Haveman J., Hummels D. (2004), “Alternative Hypotheses and the Volume of Trade: The Gravity Equation and the Extent of Specialization”, Canadian Journal of Economics, 37(1): 199:218.

19
Head K., Mayer T. (2002), “Effet Frontière, Intégration Economique et Forteresse Europe”, Economie et Prévision, 0: 71-92. Helpman E., Krugman P.R. (1985), “Market Structure and Foreign Trade: Increasing Returns, Imperfect Competition and the International Economy”, Cambridge, Mass.: MIT Press. Kaufman D., Kraay A., Mastruzzi M. (2006), “Governance matters V: Governance Indicators for 1996–2005”, The world Bank. Kennedy P. (1998), “A Guide to Econometrics”, The MIT Press, Fourth Edition. Markusen J., Wigle R.M. (1990), “Explaining the Volume of North-South Trade”, Economic Journal, 100(403): 1206-15. McCallum J. (1995), “National Borders Matter: Canada-US Regional Trade Patterns”, American Economic Review, 85(3): 615-623. MINEFI (2005), “La Zone Arabe de Libre-Echange (GAFTA) ”, Ambassade de France en Syrie, Mission Economique. Neaime S. (2005), “South South Trade, Monetary and Financial Integration and the Euro-Mediterranean Partnership: An empirical Investigation”, FEMISE Report, FEM-22-39. Péridy N. (2005a), “Towards a Pan-Arab free trade area: Assessing Trade Potential Effects of the Agadir Agreement”, The Developing Economies, 43(3): 329-345. Péridy N. (2005b), “The New Trade Policy between the USA and MENA Countries: A Quantitative Assessment”, The World Economy. 28(4): 491-518. Péridy N. (2005c), “Assessing the Euro-Mediterranean Partnership: What are the lessons for ASEAN countries?”, Journal of Asian Economics, 16(1): 125-139. Robson P. (1998), “The Economics of International Integration”, London: Routledge. Sekouti N. (1999), “The Arab Free Trade Area (AFTA): Potentialities & Effects”, New economic developments and their impact on Arab economies, pp. 257-81, Amsterdam; New York and Oxford: Elsevier Science, North-Holland. Shelburne R.C. (2002), “Bilateral Intra-Industry Trade in a Multi-Country Helpman-Krugman Model”, International Economic Journal: 16(4): 53-73. Tahir J. (1999), “Free Economic Zones in Arab Countries in the Context of Arab Free Trade Areas and World Trade Organization Arrangements: Trends and Future Prospects”, New economic developments and their impact on Arab economies, pp. 331-403, Amsterdam; New York and Oxford: Elsevier Science, North-Holland.

20
United Nations (2007), Commodity trade statistics, Comtrade database. Wolff F.C. (2006), “Estimation d’un Modèle Linéaire en Présence d’une Erreur Compose Triple”, LEN, Université de Nantes, mimeo. Wooldridge J.M. (2001), “Econometric Analysis of Cross-Section and Panel Data”, The MIT Press. WTO (2007), World Trade Organisation Trade Statistics, Statistics Database, long run time series. Zarrouk J. (2000), “The Greater Arab Free Trade Area: Limits and Possibilities”; Studies in International Economics. Ann Arbor: University of Michigan Press, pp.285-305.

21
Table A.1: intra-GAFTA trade (million US$, 2005)
exp\imp Morocco Tunisia Bahrein Egypt Iraq Jordan Kuwait Lebanon Lybia Oman Qatar Saudi Arabia Syria UAE Yemen GAFTA-15Morocco 46.02 0.77 22.76 0.32 15.70 6.22 18.16 19.24 3.66 1.99 84.54 42.60 28.84 9.32 300.13Tunisia 109.40 10.85 48.03 6.07 10.46 1.14 4.64 472.70 0.19 1.55 50.90 8.28 15.83 1.05 741.08Bahrein 12.66 5.25 11.34 2.46 10.88 49.05 1.90 17.95 29.23 77.52 441.90 9.14 100.10 0.76 770.13Egypt 43.83 19.62 3.19 53.97 159.90 25.67 303.00 71.82 5.78 8.91 233.00 199.70 126.60 40.46 1295.45Iraq na na na na na na na na na na na na na na na naJordan 5.28 9.95 20.62 44.61 733.10 72.52 65.31 25.82 27.62 34.55 240.40 202.50 171.00 33.28 1686.57Kuwait 6.35 4.55 25.54 42.54 6.46 26.09 19.43 0.26 22.36 22.62 163.90 30.46 129.60 7.80 507.96Lebanon 5.50 3.39 14.55 39.53 255.50 62.82 67.33 0.04 1.48 6.49 30.24 145.10 135.20 5.90 773.07Lybia 23.64 303.60 0.00 97.61 0.00 4.69 0.02 4.89 0.00 0.10 0.03 8.78 5.44 0.00 448.80Oman 0.85 7.23 20.49 17.78 40.01 63.21 40.64 4.75 30.86 70.16 258.70 37.52 1395.00 74.59 2061.79Qatar 15.69 5.90 68.73 44.79 2.64 54.42 37.52 11.63 8.41 18.97 225.90 25.28 1176.00 7.80 1703.68Saudi Arabia 639.60 38.18 2161.00 913.80 20.93 1074.00 794.10 265.10 17.29 275.10 368.90 148.00 2605.00 281.40 9602.40Syria 8.84 7.50 3.77 111.00 517.70 152.40 56.44 199.30 36.74 2.50 24.29 356.60 48.70 22.37 1548.15UAE 14.53 18.10 156.20 99.71 294.20 85.00 303.90 63.36 248.10 802.70 244.90 469.60 33.98 222.20 3056.48Yemen 0.06 1.22 0.53 22.37 21.16 1.63 117.10 0.74 0.51 10.25 3.08 128.30 5.11 183.50 495.56GAFTA-15 886.22 470.52 2486.24 1515.87 1954.50 1721.21 1571.64 962.20 949.75 1199.84 865.05 2684.02 896.44 6120.81 706.94 24991.25
Algeria 222.70 163.70 0.00 447.50 2.99 3.77 40.98 0.15 15.93 0.02 0.02 1.67 23.14 0.95 0.26 923.81Comoros 0.01 0.01 0.00 0.00 0.00 0.00 0.00 0.00 0.00 0.02 0.00 0.00 0.00 0.01 0.00 0.05Djibouti 0.01 0.04 0.03 0.00 0.00 0.00 0.00 0.01 0.01 0.00 0.01 0.96 0.00 0.03 2.85 3.95Mauritania 0.04 0.05 0.00 0.26 0.00 0.00 0.00 0.11 0.50 0.00 0.00 0.01 0.13 0.05 0.05 1.19Somalia na na na na na na na na na na na na na na na naSudan 0.06 5.99 0.27 49.68 0.05 4.64 2.06 17.91 1.34 0.08 0.73 151.30 11.38 76.41 9.28 331.17OTHER-6 222.82 169.79 0.30 497.44 3.04 8.41 43.05 18.19 17.78 0.12 0.76 153.94 34.65 77.44 12.44 1260.17GAFTA-22 1109.04 640.31 2486.54 2013.30 1957.54 1729.62 1614.69 980.38 967.54 1199.95 865.82 2837.96 931.09 6198.26 719.38 26251.41
exp\imp Algeria Comoros Djibouti Mauritania Somalia Sudan OTHER-6 GAFTA-21Morocco 50.33 1.35 0.11 21.65 0.05 0.64 74.14 374.27Tunisia 182.90 0.58 0.55 7.12 0.00 1.36 192.52 933.60Bahrein 9.23 0.00 0.13 0.06 0.01 0.81 10.24 780.38Egypt 96.17 0.16 8.82 6.76 0.45 103.60 215.96 1511.41Iraq na na na na na na na naJordan 84.80 0.02 0.21 0.27 0.38 43.61 129.30 1815.87Kuwait 2.34 0.00 0.13 0.24 0.11 10.26 13.08 521.04Lebanon 17.34 0.00 0.29 13.12 112.80 8.52 152.06 925.13Lybia 2.21 0.00 0.00 0.47 0.00 1.59 4.27 453.07Oman 2.39 0.41 7.09 0.34 28.77 29.70 68.69 2130.48Qatar 5.27 0.00 0.01 0.08 0.01 20.86 26.23 1729.91Saudi Arabia 36.09 0.06 281.20 18.74 7.76 223.70 567.56 10169.95Syria 43.25 0.00 0.32 1.47 0.04 19.09 64.17 1612.32UAE 131.20 0.81 41.41 10.14 92.44 106.00 382.00 3438.48Yemen 0.30 0.01 9.44 0.01 29.14 13.72 52.63 548.18GAFTA-15 663.83 3.41 349.72 80.47 271.96 583.46 1952.86 26944.11
Algeria 0.00 0.00 4.31 0.00 0.01 4.32 928.13Comoros 0.00 0.00 0.00 0.00 0.00 0.00 0.05Djibouti 0.00 0.02 0.00 0.71 0.01 0.74 4.69Mauritania 7.70 0.00 0.00 0.00 0.00 0.00 7.70 8.89Somalia na na na na na na na naSudan 0.90 0.00 0.02 0.00 0.49 1.41 332.58OTHER-6 8.60 0.02 0.02 4.31 1.20 0.02 14.17 1274.34GAFTA-22 672.43 3.43 349.74 84.79 273.16 583.48 1967.03 28218.44
Note: 2004: Algeria, Egypt, Lebanon, Syria; 2003: Mauritania, Saudi Arabia; 2001: Kuweit, UAE; 1998: Comoros, Lybia; 1991: Djibouti; na: non available Source: United Nations Statistic Division, COMTRADE, 2007.