Embed Size (px)
Citation preview
R E V I E W & C O M M E N T
THE GREAT OCEAN CONVEYOR
By Wallace S. Broecker
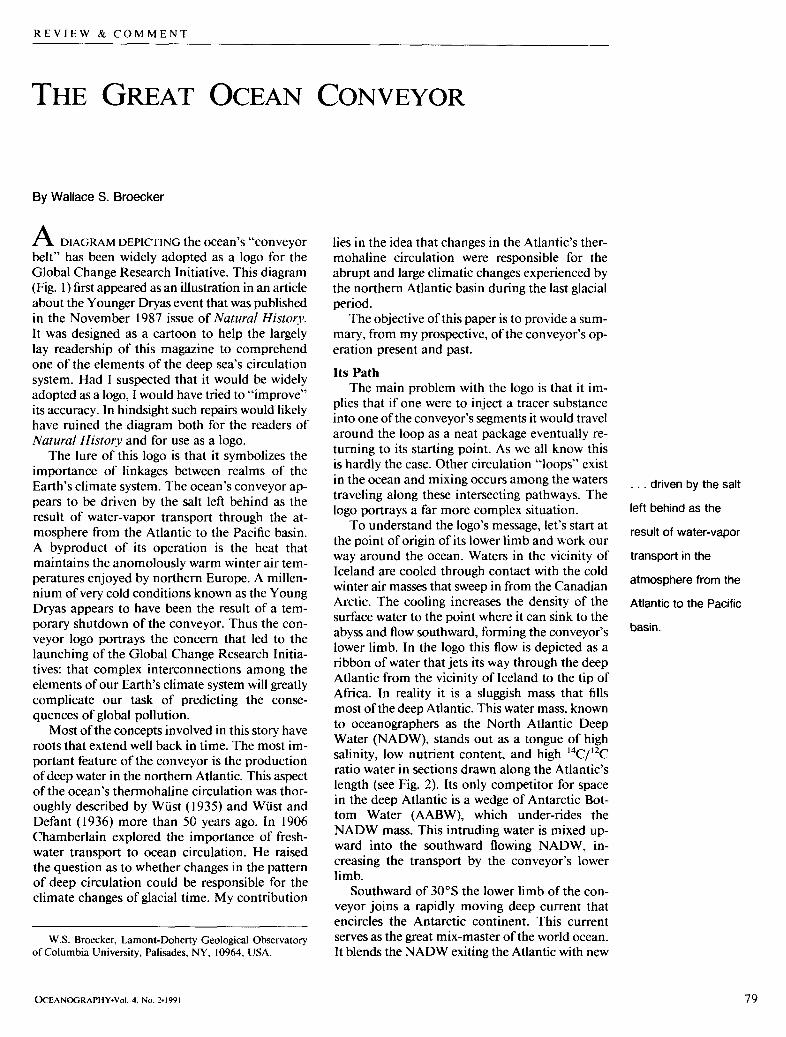
A DIAGRAM DEPICTING the ocean's "conveyor belt" has been widely adopted as a logo for the Global Change Research Initiative. This diagram (Fig. 1) first appeared as an illustration in an article about the Younger Dryas event that was published in the November 1987 issue of Natural History. It was designed as a cartoon to help the largely lay readership of this magazine to comprehend one of the elements of the deep sea's circulation system. Had I suspected that it would be widely adopted as a logo, I would have tried to "improve" its accuracy. In hindsight such repairs would likely have ruined the diagram both for the readers of Natural History and for use as a logo.
The lure of this logo is that it symbolizes the importance of linkages between realms of the Earth's climate system. The ocean's conveyor ap- pears to be driven by the salt left behind as the result of water-vapor transport through the at- mosphere from the Atlantic to the Pacific basin. A byproduct of its operation is the heat that maintains the anomolously warm winter air tem- peratures enjoyed by northern Europe. A millen- nium of very cold conditions known as the Young Dryas appears to have been the result of a tem- porary shutdown of the conveyor. Thus the con- veyor logo portrays the concern that led to the launching of the Global Change Research Initia- tives: that complex interconnections among the elements of our Earth's climate system will greatly complicate our task of predicting the conse- quences of global pollution.
Most of the concepts involved in this story have roots that extend well back in time. The most im- portant feature of the conveyor is the production of deep water in the northern Atlantic. This aspect of the ocean's thermohaline circulation was thor- oughly described by Wrist (1935) and Wrist and Defant (1936) more than 50 years ago. In 1906 Chamberlain explored the importance of fresh- water transport to ocean circulation. He raised the question as to whether changes in the pattern of deep circulation could be responsible for the climate changes of glacial time. My contribution
w.s. Broecker, Lamont-Doherty Geological Observatory of Columbia University, Palisades, NY, 10964, USA.
lies in the idea that changes in the Atlantic's ther- mohaline circulation were responsible for the abrupt and large climatic changes experienced by the northern Atlantic basin during the last glacial period.
The objective of this paper is to provide a sum- mary, from my prospective, of the conveyor's op- eration present and past.
Its Path The main problem with the logo is that it im-
plies that if one were to inject a tracer substance into one of the conveyor's segments it would travel around the loop as a neat package eventually re- turning to its starting point. As we all know this is hardly the case. Other circulation "loops" exist in the ocean and mixing occurs among the waters traveling along these intersecting pathways. The logo portrays a far more complex situation.
To understand the logo's message, let's start at the point of origin of its lower limb and work our way around the ocean. Waters in the vicinity of Iceland are cooled through contact with the cold winter air masses that sweep in from the Canadian Arctic. The cooling increases the density of the surface water to the point where it can sink to the abyss and flow southward, forming the conveyor's lower limb. In the logo this flow is depicted as a ribbon of water that jets its way through the deep Atlantic from the vicinity of Iceland to the tip of Africa. In reality it is a sluggish mass that fills most of the deep Atlantic. This water mass, known to oceanographers as the North Atlantic Deep Water (NADW), stands out as a tongue of high salinity, low nutrient content, and high 14C/12C
ratio water in sections drawn along the Atlantic's length (see Fig. 2). Its only competitor for space in the deep Atlantic is a wedge of Antarctic Bot- tom Water (AABW), which under-rides the NADW mass. This intruding water is mixed up- ward into the southward flowing NADW, in- creasing the transport by the conveyor's lower limb.
Southward of 30°S the lower limb of the con- veyor joins a rapidly moving deep current that encircles the Antarctic continent. This current serves as the great mix-master of the world ocean. It blends the NADW exiting the Atlantic with new
• . . driven by the salt
left behind as the
result of water-vapor
transport in the
atmosphere from the
Atlantic to the Pacific
basin.
OCEANOGRAPHY-Vol. 4. No. 2-1991 79

O C t :
Q
\
Great Ocean Conveyor Belt
~ °' o o ~
PA CtYit~
Fig. 1." The great ocean conveyor logo (Broecker, 1987). (Illustration by Joe Le Monnier, Natural History Magazine.)
• . . N A D W . . . loses its
identity before it
passes even one half
of a revolution around
the Antarctic!
deep water generated along the perimeter of the Antarctic continent and also with old deep waters recirculated back into the Antarctic from the deep Pacific and Indian Oceans. So efficient is this blending that the NADW entering from the At- lantic loses its identity before it passes even one half of a revolution around the Antarctic!
A rough quantification of the contribution of NADW to the deep waters of world ocean is pro- vided by a property called PO$ (Broecker et al., 199 la), which is defined as follows
0 2 PO* = PO4 + ~ - 1.95 #m/kg
where PO4 and 02 are the measured phosphate and dissolved oxygen gas concentrations in a given water sample. The coefficient 175 is the global Redfield coefficient relating 02 consumption to PO4 release during respiration (Broecker et al., 1985), and the coefficient 1.95 is arbitrarily intro- duced in order to bring the values of PO$ into the range of deep water PO4 concentrations. To the extent that the respiration coefficient is a constant, PO* constitutes a conservative property of any given deep water parcel; the increase in PO4 due to the oxidation of organic material is exactly bal- anced by the decrease in 02/175. PO~' is attractive as an indicator of the contribution of NADW be- cause deep waters formed in the northern Atlantic
have much lower PO~ values than those formed in the southern Ocean. Further, the range of PO~ values for the northern source waters (0.73 _ 0.03) and for southern source waters (1.67 + 0.10) is small compared with the difference be- tween the means for these end member values (1.67 - 0.73 = 0.94).
As can be seen in the map in Fig. 3, at a depth of 3 km the contribution of NADW to the deep- water mix remains strong throughout the Atlantic, but after the conveyor's lower limb passes around the southern tip of Africa into the Antarctic it rapidly becomes blended with the high PO~ deep water generated along the edge of the Antarctic continent. In this way an ambient deep water mix with a PO~ value of 1.37 is produced (see histo- grams in Fig. 3). This blend, which consists of one part deep water produced in the northern Atlantic with about two parts of deep water produced in the Antarctic, floods the deep Pacific and Indian Oceans.
As depicted in the logo, the lower limb water returns to the surface in the northern Indian and Pacific Oceans. In reality this upwelling is widely spread with a large amount taking place in the Antarctic. The logo also suggests that the major route for return flow to the Atlantic (i.e., the con- veyor's upper limb) is through the Indonesian ar- chipelago and around the tip of Africa. This view was impressed on me through enthusiastic pre-
80 OCEANOGRAPHY-Vol. 4, No. 2.199!

::2
w c~
60 40 20 0 20 4 0 60 S L A T I T U D E N
60 50 4 0 50 20 I0 0 I0 20 50 40 50 6 0 S L A T I T U D E N
Fig. 2: Sections of radiocarbon and of dissolved silicate in the western Atlantic on the basis of measurements made as part of the Geochemical Ocean Sections (GEOSECS) program (from Broecker and Peng, 1982). In both, the North At- lantic deep water clearly stands out from the over and underlying waters of Antarctic origin. The intermediate and bottom waters that enter the At- lantic from the Antarctic are higher in silica con- centrations and lower 14C/12C ratios than the NAD W that constitutes the conveyor's lower limb.
sentations by The Oceanography Society's presi- dent-elect, who stressed the role of the Agulhas current in global circulation (Gordon and Piola, 1983; Gordon, 1985 and 1986). As discussed be- low, this route probably accounts for only about one quarter of the return flow. A more important pathway is that through the Antarctic via the Drake Passage into the South Atlantic. These ad- ditional upwelling and return flow pathways are portrayed in Fig. 4.
Its Flux It is my view that the magnitude of transport
by the conveyor is best constrained by radiocarbon measurements on samples of deep water from the Atlantic Ocean. Some physical oceanographers might dispute this claim and opt instead for es- timates derived from a combination of current- meter measurements and geostrophic flow cal-
culations. Fortunately the two approaches yield similar answers.
The radiocarbon-based estimate of the flux for NADW into the deep Atlantic is obtained by di- viding the volume of water contained in the deep Atlantic by the radiodecay-based mean residence time. This estimate must be corrected for the con- tribution made by AABW to the conveyor's lower limb. It must also be corrected for the impact of temporal changes in the 14C/~2C ratio for atmo- spheric CO2.
The major obstacle to calculation from radio- carbon measurements of residence times for water in the deep Atlantic is the determination of the initial 14C/12C ratio for each parcel. The reason is that all waters in the deep Atlantic are mixtures of northern component water with a compara- tively high 14C/12C ratio (AI4C = -68%0) and of southern component water with a comparatively low 14C/12C ratio (A14C = -158%o). Because of the large difference in the AI4C values for these end members, much of the variation in 14C/12C ratio within the deep Atlantic is created by differ- ences in the end-member blend. As shown by Broecker et al. (1991a), PO* provides a quite ac- curate means of establishing the proportions of northern and southern component water in the sample analyzed for radiocarbon. The measured radiocarbon concentration is then subtracted from the initial concentration calculated for the mix- ture, yielding the deficiency attributable to radi- odecay. An example of this calculation is shown in Table I. The radiocarbon measurements used in this analysis were made in the laboratories of Gote Ostlund at the University of Miami and Minze Stuiver at the University of Washington.
Water-column averages for radiodecay defi- ciencies are shown in Fig. 5 for stations occupied during geochemical expeditions in the Atlantic. Little information is lost by this vertical averaging because significant trends with depth are not found for any of the stations. However, the ver- tically averaged deficiencies do show a pro- nounced geographic trend. The lowest values (<10%0) are found along the western margin of the Atlantic and the highest values (>30%o) are found along the eastern margin. As radiocarbon decays by 1%0 in 8.27 y, the isolation times cor- responding to these radiocarbon deficiencies range from near zero for the western boundary in North Atlantic to as high as 300 y along the eastern boundary. This suggests rapid ventilation from both ends of the Atlantic along the western boundary coupled with more leisurely dispersion into the interior. The radiocarbon deficiency for the entire deep Atlantic averages ~22%0. This corresponds to a residence time of about 180 y.
The volume of the deep Atlantic reservoir is 1.55 X 10¹⁷ m 3 (i.e., 2500 m mean thickness with an area of 6.2 × l0 j3 m2). Hence, to achieve this residence time requires a ventilation flux of 8.6
T h e radiocarbon
deficiency for the entire
deep Atlantic...
corresponds to a
residence time of
about 180 y.
OCEANOGRAPHY-Vol. 4, No. 2-1991 81

120 160 160 120
b
v " ' MEAN ~ a I 40 ~,.. 1.36
20 m
\ t o
'~ 0 L I .,.'30 1.35 1.40 1.45
P04 ~ (/u, rno l / kg )
6o , ~ 1 . 4
80 40 0 40 80 120
~b 6,~,,o
N A D W 0 . 7 3 .
0 . 9
W S B W 1 . 6 7
M E A N h 3 7
I I 1.3o ~.35 1.4o
P O : (/.¢rnol / kg )
1.5
~o
_o
~" 20 h
=20 iso i6o izo eo 40 b " 4o " ~o " tzo
Fig. 3: Map of PO$ values at 3-kilometers depth. The deep water source in the northern Atlantic has a PO* value of 0.73 #m/kg and that in the Antarctic a value of about 1.67 #m/kg. As shown by the histograms, waters on this depth horizon in the Indian (right-hand histogram) and Pacific (left-hand histogram) Oceans have nearly constant PO'$ values. Although the Pacific GEOSECS stations show a range of PO$ values, the lack of geographic coherence suggests that this spread is the result of station to station shifts in the calibration of the nutrient-analyses system.
X 1014 m3/y or 27 Sv (1 Sverdrup = 106 m3/sec). As the flux of AABW is ~ 4 Sv, the flux of NADW is estimated to be 23 Sv.
This calculation assumes the system to be at steady state. Although we have no way to know
whether this is true for the water fluxes, we do know that the atmosphere's '4C/12C ratio (i.e., the source function) has changed during the past two centuries. When these changes are taken into ac- count, the flux has to be reduced by a factor of
Fig. 4: The green arrows show the location where intense upwelling of deep water occurs. The blue arrows show the upper ocean routes of return flow that balance the outflow from the Atlantic of lower- limb water. The numbers in the arrowheads represent the rough estimates of the magnitude of the fluxes (in Sv). In addition to the features portrayed by the logo, this diagram shows that much of the upwelling occurs in the Antarctic and that much of the return flow occurs through Drake Passage.
8 2 OCEANOGRAPHY-Vol. 4, No. 2.1991

Table 1 Example of radiocarbon-deficiency calculation
GEOSECS Station 113 (1 I°N, 20°W, 4,741 m)
02, um/kg PO4, um/kg A I 4 C , %o
239 0.91 -120
P O * = O---L + P O 4 - 1 . 9 5 1 7 5
2 3 9 = - - + 0 . 9 1 1 . 9 5
1 7 5
- 0 . 9 1 / ~ m / k g
F r a c t i o n o f n o r t h e r n c o m p o n e n t 1 . 6 7 - P O ~
1.67 - 0.73 1.67 - 0.91
1.67 - 0.73 = 0.81
Fraction of southern component = 1 - 0.81 = 0.19
, - ~ t 4 C , n , t , a I : 0.81(-68) + 0.19(-158) = 84%o
A A ~ 4 C - A I 4 C t n , t , a l - AI4Craeasured
: (84) (-120) = 365o0
{1-0.084 / Apparent age = 8,270 In ~ ]
=331y
~0 .88 (Broecker et aL, 1991b). Hence, we get a flux of close to 20 Sv for the northern component (i.e., NADW). It is difficult to assess the error in this estimate but it is probably on the order of 25% (i.e., +5 Sv). To appreciate the immense magnitude of this flux, it is important to be re- minded that it is 20 times the combined flows of all the world's rivers and somewhat larger than the combined rainfall for the entire globe!
I t s D r i v e
My contention is that the conveyor is driven by the excess salt left behind in the Atlantic as the result of vapor export (Broecker el al., 1985). The surface waters of the Atlantic are on the average 1 gm/liter higher in salt content than those in the Pacific (for map see Levitus, 1982). For sea water with temperatures in the range of those consti- tuting the NADW mass (i.e., 2 t o 4°C) 1 gm/liter extra salt has the same impact on the water's den- sity as a cooling of 3 to 4°C. The salinity contrast between surface waters in the northern Atlantic and those at comparable latitudes in the northern Pacific is even larger, ranging from 2 to 3 gm/ liter. This difference is so large that surface waters in the northern Pacific, even when cooled to their freezing point (i.e., -1.8°C), sink to a depth of only a few hundred meters before reaching their buoyancy limit. Hence, no deep water can form in the northern Pacific.
Three means are available by which the mag- nitude of the vapor export flux can be estimated•
The first approach is based on the water budget for the Atlantic Ocean and its continental drainage basin. Baumgartner and Reichel (1975) have con- structed a water budget on the basis of estimates of rainfall and evaporation over the Atlantic Ocean and runoff from its drainage basin. Their result is that vapor is being lost from the Atlantic basin at a rate averaging 0.45 Sv.
A second approach is to estimate the vapor ex- port necessary to maintain the salinity differences in the sea against mixing among the ocean's water masses, which tends to homogenize the sea's salt. If the mixing rates within can be determined and incorporated into an ocean-mixing model, the fresh-water budget for any region of the ocean can be determined. Broecker et al. (1990b) adopted this approach. Using a radiocarbon-cal- ibrated ocean box model, they obtain a flux of 0.25 Sv. The Princeton general circulation model (GCM) for the ocean yields a water vapor loss of 0.45 Sv (Manabe and Stauffer, 1988) and the Hamburg ocean model gives 0.20 Sv (Ernst Maier- Reimer, personal communication).
8 0 ° 6 0 ° 4 0 ° 2 0 ° 0 ° 2 0 ~
60 ° i0 °
50 ° ~0 °
4 0 ° 30 °
30 ° 30 °
20 ' 20 °
10 ' 10 °
0 ' 0 °
10' l 0 ~
20' 2 0 "
30 ' 30"
40' 40"
50' 50 °
60' n ,, 60 ° 8 0 ° 6 0 ° 4 0 ° 20 ° 0 ° 20 °
Fig. 5: Water-column averages for the radiodecay- induced ~4C deficiency (Broecker et al•, 1991a) at stations occupied during geochemical expeditions. The major gradient is from low deficiencies along the western margin to high deficiencies along the eastern margin. The residence times corresponding to the 10, 20, and 30% deficiency contours are, respectively, 83, 166, and 249 years. The mean deficiency for this entire region of the Atlantic is estimated to be 22%, which corresponds to an iso- lation time of ~ 180 years.
. • . the immense
magnitude of the flux
• . . is 20 times the
combined flows of all
the world's rivers and
somewhat larger than
the combined rainfall
for the entire globe!
O C E A N O G R A P H Y - V o l . 4. No. 2-1991 83
• . . the export of salt
via the conveyor's
lower limb must have
balanced the
enrichment of salt by
vapor loss.
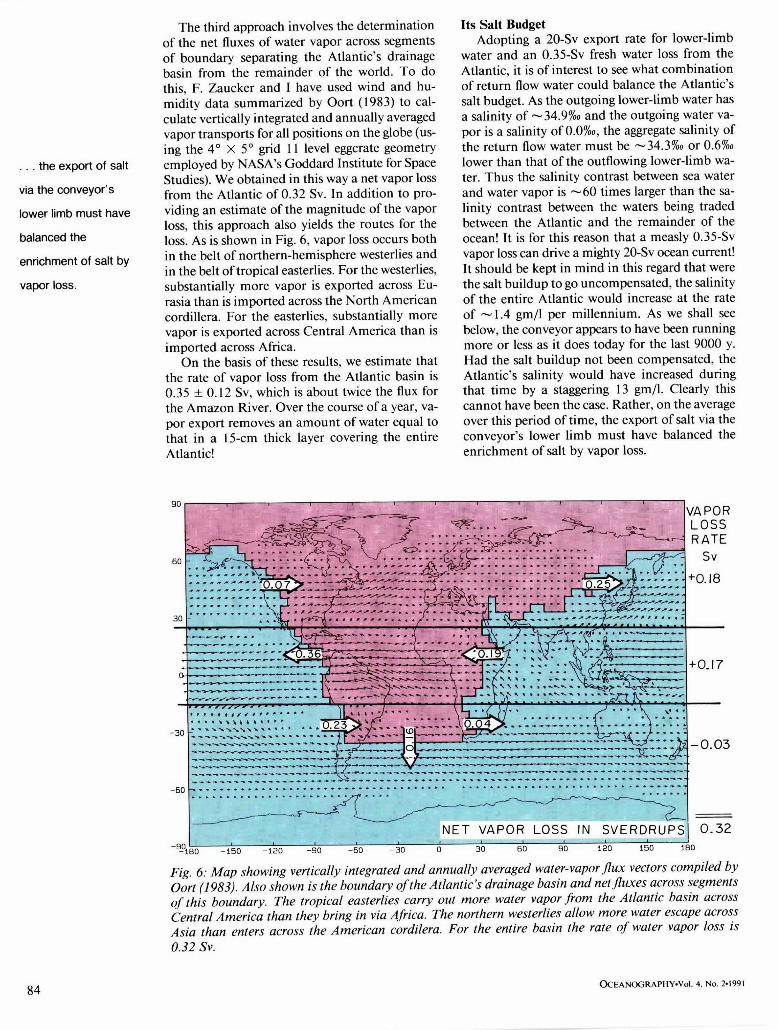
The third approach involves the determination of the net fluxes of water vapor across segments of boundary separating the Atlantic's drainage basin from the remainder of the world. To do this, F. Zaucker and I have used wind and hu- midity data summarized by Oort (1983) to cal- culate vertically integrated and annually averaged vapor transports for all positions on the globe (us- ing the 4 ° X 5 ° grid 11 level eggcrate geometry employed by NASA's Goddard Institute for Space Studies). We obtained in this way a net vapor loss from the Atlantic of 0.32 Sv. In addition to pro- viding an estimate of the magnitude of the vapor loss, this approach also yields the routes for the loss. As is shown in Fig. 6, vapor loss occurs both in the belt of northern-hemisphere westerlies and in the belt of tropical easterlies. For the westerlies, substantially more vapor is exported across Eu- rasia than is imported across the North American cordillera. For the easterlies, substantially more vapor is exported across Central America than is imported across Africa.
On the basis of these results, we estimate that the rate of vapor loss from the Atlantic basin is 0.35 _+ 0.12 Sv, which is about twice the flux for the Amazon River. Over the course of a year, va- por export removes an amount of water equal to that in a 15-cm thick layer covering the entire Atlantic!
Its Salt Budget Adopting a 20-Sv export rate for lower-limb
water and an 0.35-Sv fresh water loss from the Atlantic, it is of interest to see what combination of return flow water could balance the Atlantic's salt budget. As the outgoing lower-limb water has a salinity of ~34.9%0 and the outgoing water va- por is a salinity of 0.0%0, the aggregate salinity of the return flow water must be ~34.3%o or 0.6%0 lower than that of the outflowing lower-limb wa- ter. Thus the salinity contrast between sea water and water vapor is ~ 6 0 times larger than the sa- linity contrast between the waters being traded between the Atlantic and the remainder of the ocean! It is for this reason that a measly 0.35-Sv vapor loss can drive a mighty 20-Sv ocean current! It should be kept in mind in this regard that were the salt buildup to go uncompensated, the salinity of the entire Atlantic would increase at the rate of ~ 1.4 gm/1 per millennium. As we shall see below, the conveyor appears to have been running more or less as it does today for the last 9000 y. Had the salt buildup not been compensated, the Atlantic's salinity would have increased during that t ime by a staggering 13 gm/1. Clearly this cannot have been the case. Rather, on the average over this period of time, the export of salt via the conveyor's lower limb must have balanced the enrichment of salt by vapor loss.
90
60 " °
: : : . : : : : : : :
30 - • • ,q~
. . . . . . . . I i i I
- 3 0
,VAPOR ~ . . . . . . . ",~ LOSS
. . . . . . . . . . . . . s v
: . . . . . : : : : : : : : : : : : : : : + o , 8 : : : : : : : : : : : : : : : : : : : : : : : : : : : : : . . . . . . . . ~" . . . . . . . . . . . . . . . . Y..~2.7C:::
p P t g ~ y V V
: ' - _ . : : : 222222 : : 2~ :221
+0.17
- 0 . 0 3
-BO
l - - , , SVERDRUPS t
-9-°1B0 , , ,NET VAPOR, LOSS, IN , , 0 . 5 2 - 1 5 0 - 1 2 0 - 9 0 - [50 - 3 0 O 3 0 6 0 9 0 120 150 IBO
Fig• 6: Map showing vertically integrated and annually averaged water-vapor f lux vectors compiled by Oort (1983). Also shown is the boundary of the Atlantic's drainage basin and net fluxes across segments of this boundary• The tropical easterlies carry out more water vapor from the Atlantic basin across Central America than they bring in via Africa. The northern westerlies allow more water escape across Asia than enters across the American cordilera. For the entire basin the rate of water vapor loss is
0.32 Sv.
84 OCEANOGRAPHY.Vol. 4, No. 2.1991

The imported water that feeds the upper limb of the Atlantic has three components: Antarctic surface waters passing through the Drake Passage (S _-_ 33.8%0), Indian surface waters passing around the tip of Africa via the Agulhas Current (S 35.1%0), and intermediate waters formed at the northern perimeter of the Atlantic segment of the Antarctic (S _-_ 34.3%o). The salinity of the inter- mediate water matches that required to achieve salt balance. However, this salinity could also be achieved by mixing 1.6 parts Drake Passage sur- face water with 1 part Agulhas water. So, on the basis of salinity alone it is not possible to say how much of the remainder water enters the South Atlantic at intermediate depth and how much en- ters at the surface.
Its Benefits The benefit provided by the conveyor is the
heat it releases to the atmosphere over the north- ern Atlantic. This heat is responsible for Europe's surprisingly mild winters. The amount of heat re- leased to the atmosphere is given by the product of the conveyor's flux and the temperature change required to convert upper-limb water to lower- limb water (i.e., to create NADW). The temper- ature of NADW averages ~-3°C. Temperature of the upper-limb water averages ~ 10°C. Thus each cubic centimeter of upper-limb water releases seven calories of heat to the atmosphere during its conversion to deep water. At an average flux of 20 Sv, this totals 4 × 10²¹ calories each year, an amount of heat equal to 35% of that received from the sun by the Atlantic north of 40 ° latitude?
Manabe and Stauffer (1988) have shown that indeed the thermohaline circulation of the Atlan- tic maintains high surface-water temperatures in the northern Atlantic• Using the Princeton ocean model, they demonstrate that circulation in the Atlantic can assume two quite different modes: one with a strong thermohaline component akin to the conveyor and one with no thermohaline circulation. When the conveyor is operative, the temperature of surface waters in the northern At- lantic average 5°C warmer than when it is off. Considering the fact that strength of the ther- mohaline circulation in Manabe and Stauffer's conveyor-on mode is only 12 Sv, this warming should be even greater in the real ocean with its 20 Sv thermohaline circulation.
Rind et al. (1986) have used an atmospheric model to estimate the geographical pattern of the winter air-temperature change supported by the conveyor's heat output. They adopted for the sur- face-water temperature difference between the conveyor-on and conveyor-off modes that recon- structed by the Climate Mapping (CLIMAP) group for glacial surface water relative to today's. As shown in Fig. 7, the air temperature anomaly obtained in this way extends across Europe into Siberia. We will discuss below this geographic
pattern, which matches very nicely that for the Younger Dryas cooling.
Its Achilles Heel The addition of fresh water to the northern At-
lantic poses a constant threat to the conveyor. Northward of 40°N in the Atlantic, precipitation and continental runoff exceed evaporation by ~0 .30 Sv (Baumgartner and Reichel, 1975). In addition, the 1 Sv of low-salinity (S - 33.0%o) wa- ter entering the Arctic arm of the Atlantic through the Bering Strait contributes the equivalent of 0.06 Sv of fresh water, bringing the total to 0.36 Sv. When the conveyor is running at its current strength of 20 Sv, this fresh water is efficiently swept away causing only a 0.63%0 reduction in the conveyor water's salinity as it passes through the northern Atlantic. If the conveyor was to pro- gressively weaken, this salinity reduction would
- 6 0 0 6 ( i
• | " ~ - , .,.-J
- - z "6 - - I
I,_ a
• . . the heat it releases
to the atmosphere...
is responsible for
Europe's surprisingly
mild winters.
120
- - . (./r
- 6 0 0 6 0 120
Fig. 7: Results of an experiment carried out using an atmospheric general circulation model (Rind et al., 1986). Two runs were made that differed only in the surface ocean temperature assigned to the northern Atlantic (see upper panel). The resulting winter air-temperature change produced by this ocean- temperature change is shown in the lower panel.
OCEANOGRAPHY-Vol. 4, No. 2-1991 8 5

• . . a frenetic glacial
conveyor became
firmly locked in the on
position at the
beginning of
postglacial t ime . . .
grow. It would be 0.94%0 at 15 Sv, 1.26%o at 10 Sv, etc. At some point the salinity reduction would become so large that deep water could no longer form. The conveyor would shut down. If this hap- pened, fresh water would pool at the surface of the northern Atlantic (much as it currently does in the northern Pacific) creating a severe barrier to deep-water formation.
Ocean circulation simulations by Manabe and Stauffer (1988) clearly demonstrate the role of this fresh-water input. For their conveyor-off mode, pooling of fresh waters reduces the salinity of sur- face waters in the northern Atlantic by ~3%o. Maier-Reimer and Mikolajewicz (1989), using the Hamburg ocean GCM, show that a modest dose of excess fresh water to the source region of NADW can kill the model 's thermohaline cir- culation. Furthermore, the demise is abrupt, oc- curring on the time scale of a few decades. The rapidity of this response is not surprising for it depends on the residence time of water in the source region. At a flushing rate of 20 Sv the entire volume of water contained in the Atlantic north of 45°N can be replaced in two decades!
We know of no ocean GCM experiment that shows how the conveyor circulation might be re- started. Because of the strong barrier created by the pooling of fresh water, this may prove to be a tricky task. Microprocesses, which through brine formation increase the density of water beneath sea ice, may have to be invoked.
Its H i s t o r y
The best indicator of the past operation of the conveyor is the air temperature in the northern Atlantic basin. The reason is that as we have al- ready shown, turning on and off the conveyor causes 5 to 8°C changes in the air temperatures over Greenland and Europe. The most detailed record of air temperature in the northern Atlantic basin is the isotope record preserved in the Greenland ice cap. This record (see Fig. 8) had a different character during the last period of gla- ciation than during the present period of inter- glaciation (Dansgaard et al., 1971; Hammer et al., 1985). During glacial time, air temperatures over Greenland underwent excursions of the magni- tude and abruptness expected if the conveyor were turning on and off on a millennial time scale• By contrast, during the nine or so thousand years since the period of glaciation came to a close, Greenland's air temperature has remained nearly constant. The impression I get from this is that a frenetic glacial conveyor became firmly locked in the on position at the beginning of postglacial time and has remained so ever since.
A possible explanation for the behavior of the conveyor during glacial time is that when the northern end of the Atlantic basin is surrounded by ice sheets, stable operation of Atlantic's cir- culation system is not possible (Broecker et al., 1990a). Rather, because the ice sheets constitute a tremendous source of fresh water, circulation in
TODAY---->- ...........
~ 1 0 , 0 0 0 ~" ~_ YRS B.P AGO
........... I
-40
~ 2 o c
I I
IYOU NGER DRYAS ALLEROD
I I -35 -30
s % (%o/
SI80 (%o) DUST CONTENT (mg/kg)
-25
Fig. 8: The left-hand panel shows the oxygen-isotope record Jbr the Camp Century Greenland ice core (Dansgaard et al., 1971) covering the period from ~ 13,000 radiocarbon years B.P. to the present. The right-hand panel shows the oxygen-isotope and dust records for that part of the Dye 3 Greenland ice core covering the time period ~45,000 to ~8,000 years B.P. (Hammer et al., 1985). Note that many of the oxygen-isotope events are characterized by rapid warmings followed by more gradual coolings.
86 OCEANOGRAPHY-VoL 4, No. 2.1991
the Atlantic tends to flip back and forth between the conveyor-on and conveyor-off modes. When the conveyor is operative its heat output tends to melt back the ice, releasing large amounts of fresh water to the Atlantic. The conveyor also efficiently exports excess salt from the Atlantic. The com- bination of meltwater dilution and salt export drives down the density of waters in the Atlantic until the point is reached where the conveyor can no longer function; it goes off. With the conveyor inoperative, the export of salt and the dilution with meltwater are reduced to the point where water vapor export once again begins to enrich salt in the Atlantic. The salt content and hence also the density of Atlantic waters steadily rise until the conveyor turns on again. This cycle re- peats over and over again.
Although a rigorous proof for the existence of an oscillator is not possible, the facts we do have lend strong support to this scenario. First, we know that the 40 X 10 6 km 3 excess ice present in the ice sheets of the northern hemisphere began to melt ~ 13,000 y ago and were gone by ~ 8,000 y ago. Thus the average flux of meltwater during this interval must have been ~0 .25 Sv. Assuming this to be the magnitude of the melting rate during the proposed conveyor-on episodes, then the di- lution of salt due to meltwater would have been comparable with today's rate of vapor export. If the assumption is made that the conveyor was exporting salt at a rate comparable with the rate it was being enriched through vapor export, then during the conveyor-on episodes salt would have been diluted at a rate corresponding to the input of meltwater. When the conveyor was off, the dominant term in the salt budget would be vapor export. As yet we do not have an adequate esti- mate of the rate of water vapor export in the pres- ence of an ice sheet. However, because vapor ex- port is dictated by the interaction of planetary winds with mountain ranges, the rate may not have been very different from today's.
Additional support comes from the observation that the average duration of individual warm and cold episodes recorded in Greenland ice ranges from about one half to two millennia. This spacing is consistent with that expected from the salt os- cillation hypothesis. A vapor loss of 0.35 Sv re- moves a layer 15-cm thick from the Atlantic each year. If uncompensated by salt export, the salt content of Atlantic waters will rise 1.4 gm/liter per millennium! Because a salt buildup or reduc- tion of 1 to 2 gin/liter for the Atlantic is about what is needed to tip the balance between con- veyor-on and conveyor-off, a match exists between the observed timing and that predicted timing (Birchfield and Broecker, 1990). This is a strong point in favor of the oscillator hypothesis!
The operation of an oscillator requires a com- bination of a long-term constant drift (in this case the buildup or drawdown of salt) and of a short-
term constant stabilization mechanism. In the previous section it was shown that a tendency ex- ists for fresh water to pool at the surface of the northern Atlantic. When the conveyor comes on, this pool is quickly destroyed, raising the salinity in the NADW source region. This stabilizes the conveyor in its on-position. Similarly, when the conveyor stops the pool quickly reappears, sta- bilizing the conveyor in its off position.
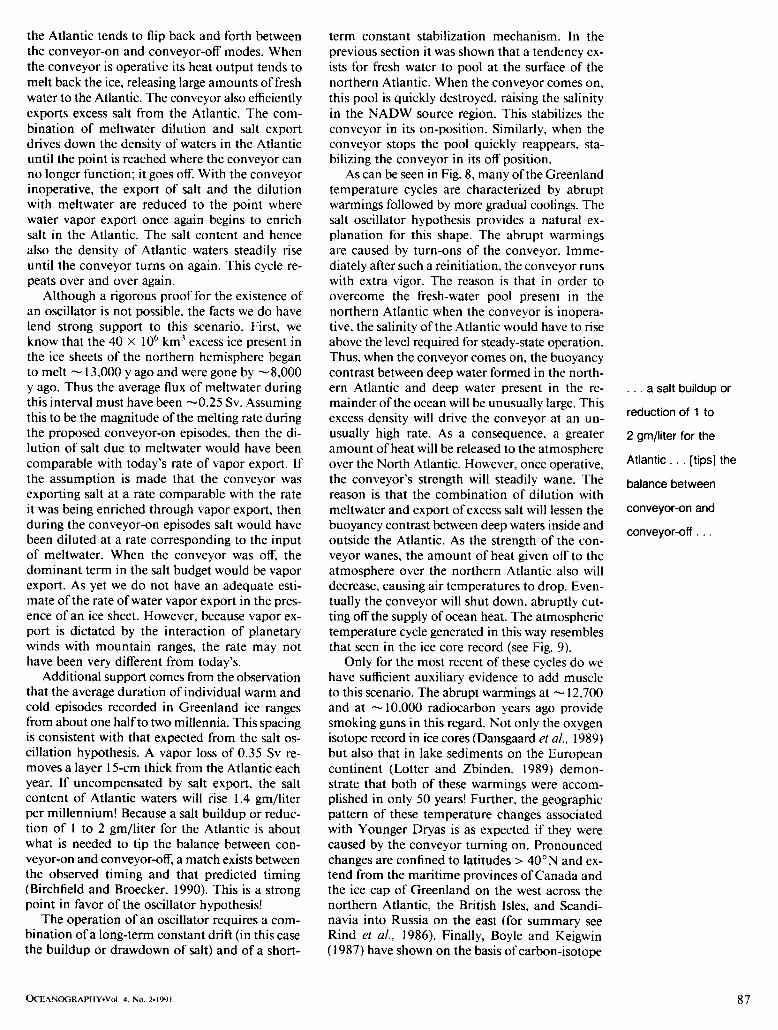
As can be seen in Fig. 8, many of the Greenland temperature cycles are characterized by abrupt warmings followed by more gradual coolings. The salt oscillator hypothesis provides a natural ex- planation for this shape. The abrupt warmings are caused by turn-ons of the conveyor. Imme- diately after such a reinitiation, the conveyor runs with extra vigor. The reason is that in order to overcome the fresh-water pool present in the northern Atlantic when the conveyor is inopera- tive, the salinity of the Atlantic would have to rise above the level required for steady-state operation. Thus, when the conveyor comes on, the buoyancy contrast between deep water formed in the north- ern Atlantic and deep water present in the re- mainder of the ocean will be unusually large. This excess density will drive the conveyor at an un- usually high rate. As a consequence, a greater amount of heat will be released to the atmosphere over the North Atlantic. However, once operative, the conveyor 's strength will steadily wane. The reason is that the combination of dilution with meltwater and export of excess salt will lessen the buoyancy contrast between deep waters inside and outside the Atlantic. As the strength of the con- veyor wanes, the amount of heat given off to the atmosphere over the northern Atlantic also will decrease, causing air temperatures to drop. Even- tually the conveyor will shut down, abruptly cut- ting off the supply of ocean heat. The atmospheric temperature cycle generated in this way resembles that seen in the ice core record (see Fig. 9).
Only for the most recent of these cycles do we have sufficient auxiliary evidence to add muscle to this scenario. The abrupt warmings at ~ 12,700 and at ~ 10,000 radiocarbon years ago provide smoking guns in this regard. Not only the oxygen isotope record in ice cores (Dansgaard et al., 1989) but also that in lake sediments on the European continent (Lotter and Zbinden, 1989) demon- strate that both of these warmings were accom- plished in only 50 years! Further, the geographic pattern of these temperature changes associated with Younger Dryas is as expected if they were caused by the conveyor turning on. Pronounced changes are confined to latitudes > 40°N and ex- tend from the mari t ime provinces of Canada and the ice cap of Greenland on the west across the northern Atlantic, the British Isles, and Scandi- navia into Russia on the east (for summary see Rind et al., 1986). Finally, Boyle and Keigwin (1987) have shown on the basis of carbon-isotope
• . . a salt buildup or
reduction of 1 to
2 gm/liter for the
Atlantic . . . [tips] the
balance between
conveyor-on and
conveyor -o f f . . .
OCEANOGRAPHY.Vol. 4, No. 2.1991 8 7

• . . the abrupt global
warmings that
heralded the
termination of the last
major glaciation
certainly cannot be
explained by the
conveyor alone.
TOWARD PRESENT
WARM
t ,-, 6oc
COLD
P CONVEYOR . ~ , ' ~ 2
co .vf oR 'ON'
I c°?w2,R U 'OFF'
I I I I I 0 I I 12 13
RADIOCARBON AGE
THOUSANDS OF LIBBY YEARS
Fig• 9: Diagrammatic representation of the tem- perature record for the northern Atlantic basin from just &:fore 13,000 to just after 10,000 radiocarbon years before present. The features shown in this diagram appear in records of 1~0 in ice (Dans- gaard et al., 1971), oflSO in lake sediment (L6tter et al., 1989), of ocean planktonic fi)raminifera (Ruddiman and Mclntyre. 1981), of pollen, and of beetles (Atkinson et al.. 1987). Of particular in- terest is rapidity of the warmings at 12,700 years BP and at 10,000 years BP. Detailed measure- ments in the Dye 3 ice core and in varved lake sediments reveal that these warmings took place in ~50 years (Dansgaard et al., 1989)!
and cadmium-concentration measurements on benthic foraminifera shells from a deep-sea core from the vicinity of Bermuda that water of Ant- arctic origin flooded the western basin of the deep Atlantic during Younger Dryas time, confirming that a shutdown of deep-water formation accom- panied this cold event.
Its Future When the Natural History article containing
the great global conveyor belt diagram appeared, the editor put a sales "st imulator" on the cover that stated "Europe beware: the big chill may be coming." At the time I was much annoyed be- cause no mention of the conveyor's future was made in the article. To make matters worse, even after reading the article itself, many people were left with the impression that I was warning of an imminent conveyor shutdown. The fact is that I thought, at that time, that the coming greenhouse warming would, if anything, strengthen the con- veyor by increasing the rate of vapor loss from the Atlantic basin. I had not given serious thought to the question as to whether any changes asso- ciated with human 's activities might threaten the conveyor.
The first activity that comes to mind in this regard is the rerouting of water for agricultural use. Irrigation projects increase the recycling of water on the continents and thereby change the point at which a given water molecule re-enters the ocean. Of particular interest in this regard is the Russian proposal to divert the great northward flowing Siberian Rivers to the south for agricul- tural use. The result of such a diversion would be to increase the vapor loss from the Atlantic basin, for instead of flowing out of river mouths into the Arctic, the water would move through the at- mosphere across Asia into the Pacific basin• The long-term result would be to strengthen the con- veyor.
In addition to increasing vapor export from the Atlantic basin, the greenhouse warming will increase the transport of fresh water to the north- ern Atlantic. On the short term (i.e., decades), the salinity decrease created in northern surface waters would be more important than the Atlantic-wide salinity increase caused by increased vapor loss from the Atlantic basin. The reason is that the replacement time for waters in the northern At- lantic is shorter than the replacement t ime for wa- ters in the upper limb of the conveyor. So if a threat to the conveyor is in the making, it is most likely to come in this way. To be on guard we should pay close attention to the climate and oceanography of the northern Atlantic basin. The finding by Brewer et al. (1983) that the salinity of Atlantic deep waters to the north of 50°N declined between 1972 and 1981 and the finding by Schlosser et al. ( 1991) that deep ventilation of the Greenland Sea was shutdown during the 1980s are indications that changes do occur. Unfortu- nately we have no way to tell whether these changes signal natural fluctuations or anthropo- genically driven trends.
Conclusions The conveyor is only one of many elements
that together constitute the Earth's climatic sys- tem. It stands out because of its dramatic impact on the climate for a single region of our planet. We must keep in mind, however, that the abrupt global warmings that heralded the termination of the last major glaciation certainly cannot be ex- plained by the conveyor alone (Broecker and Denton, 1989 and 1990). Rather, elements of the system, such as the Hadley cell, which influence cloudiness and atmospheric water-vapor content, also must have been involved. The challenge of the Global Change Research Initiative is to un- derstand the complex web of interactions that tie together the operation of these diverse elements.
Acknowledgements I thank the Exxon Corporation and Livermore
National Laboratory for their generous support of my research. Instead of requiring me to write long proposals and reports, they encouraged me
88 OCEANOGRAPHY.Vol. 4, No. 2-1991

i n s t e a d to p u t t h i s e f for t i n t o a r t i c l e s s u c h as this .
M y r e s e a r c h o n o c e a n c h e m i s t r y is s u p p o r t e d b y
D O E ' s CO2 p r o g r a m g r a n t L L N L B 1 3 0 5 4 7 ; o n
t he c l i m a t e h i s t o ry o f t h e A t l a n t i c by N S F C l i m a t e
D y n a m i c s g r a n t A T M 8 9 - 2 1 3 0 6 a n d b y N O A A
g r a n t N A 9 0 - A A - D - A C 5 2 0 ; a n d o n a t m o s p h e r i c
v a p o r t r a n s p o r t b y E P R I g r a n t R P 2333 - 6 .
R e f e r e n c e s
Atkinson, T.C., K.R. Briffa and G.R. Coope, 1987: Seasonal temperatures in Britain during the past 22,000 years, reconstructed using beetle remains. Nature. 325, 587- 592.
Baumgartner, A. and E. Reichel, 1975: Die Weltwasserbilanz. Oldenbourg, Munchen.
Birchfield, G.E. and W.S. Broecker, 1990: A salt oscillator in the glacial northern Atlantic?--Part II: A "Scale Anal- ysis" model. Paleocean., 5. 835-843.
Boyle, E.A, and L. Keigwin, 1987: North Atlantic thermohaline circulation during the past 20,000 years linked to high- latitude surface temperature. Nature. 330, 35-40.
Brewer, P.G., W.S. Broecker, W.J. Jenkins, P.B. Rhines, C.G. Rooth, J.H. Swift, T. Takahashi and R.T. Williams, 1983: A climatic freshening of the deep Atlantic north of 50°N over the past 20 years. Science, 222, 1237- 1239.
Broecker, W.S. and T.-H. Peng. 1982: Tracers in the Sea. EI- digio Press, Palisades, NY, 690 pp.
_ _ , D. Peteet and D. Rind, 1985: Does the ocean-at- mosphere have more than one stable mode of operation? Nature, 315. 21-25.
_ _ 1987: The biggest chill. Nat. Hist. Mag., 97. 74-82. _ _ a n d G.H. Denton, 1989: The role of ocean-atmo-
sphere reorganizations in glacial cycles. Geochim. Cos- mochim. Acta, 53, 2465-2501.
_ _ and G.H. Denton, 1990: What drives glacial cycles? Sci. Am., 262, 49-56.
_ _ , G. Bond, M. Klas, G. Bonani and W. Wolff, 1990a: A salt oscillator in the glacial North Atlantic?--l. The concept. Paleocean.. 5, 469-477.
_ _ . , T.-H. Peng, J. Jouzel and G. Russell, 1990b: The magnitude of global fresh water transports of importance to ocean circulation. Clim. Dynam.. 4, 73-79.
- - , S. Blanton, T. Takahashi, W. Smethie and G. Ost- lund, 1991 a: Radiocarbon decay and oxygen utilization in the deep Atlantic Ocean. Glob. Biogeochem. C)'.. 5, 87-117.
_ _ , A. Virgilio and T.-H. Peng, 199 lb: Radiocarbon age of water in the deep Atlantic revisited. Geophys. Res. Lett.. 18. 1-3.
Chamberlain, T.C., 1906: On a possible reversal of deep-sea circulation and its influence on geologic climates. Jour. Geol.. 363-373.
Dansgaard, W., S.J. Johnsen, H.B. Clausen and C.C. Langway, Jr., 1971 : Climatic record revealed by the Camp Century
Ice Core. In: The Late Cenozoic Glacial Ages, K.K. Turekian, ed., Yale University Press, New Haven, 37- 56.
Dansgaard, W., J.W.C. White and S.J. Johnson, 1989: The abrupt termination of the Younger Dryas climate event. Nature. 339, 532-533.
Gordon, A.L. and A.R. Piola, 1983: Atlantic Ocean upper layer salinity budget. Jour. Phys. Ocean.. 13. 1293-1300.
_ _ 1985: Indian-Atlantic transfer of thermocline water at the Agulhas retroflection. Science, 227. 1030-1033.
_ _ 1986: Interocean exchange of thermocline water. Jour. Geophys. Res., 91. 5037-5046.
Hammer, C.U., H.B. Clausen, W. Dansgaard, A. Neftel, P. Kristinsdottir and E. Johnson, 1985: Continuous im- purity analysis along the Dye 3 deep core. In: Greenland h'e Core: Geophysics, Geochemistr]; and the Environ- ment, C.C. Langway, H. Oeschger and W. Dansgaard, eds., Amer. Geophys. Union Mon., Washington, D.C., 90-94.
Levitus, S., 1982: Climatological Atlas of the World Ocean. NOAA Professional Paper No. 13, U.S. GPO, Wash- ington, D.C.
Lotter, A.F. and H. Zbinden, 1989: Late-Glacial pollen analysis, oxygen-isotope record, and radiocarbon stratigraphy from Rotsee (Lucerne), Central Swiss Plateau. Eclogae Geol. Helv., 82, 191-202.
Maier-Reimer, E. and U. Mikolajewicz. 1989: Experiments with an OGCM on the cause of the Younger Dryas. In: Oceanography, A. Ayala-Castanares, W. Wooster and A. Yanez-Arancibia, eds., UNAM Press, Mexico, 87- 100.
Manabe, S., and R.J. Stauffer, 1988: Two stable equilibria of a coupled ocean-atmosphere model. Jour. Clim., 1, 841- 866.
Oort, A.H., 1983: Global Atmospheric Circulation Statistics, 1958-1973. NOAA Professional Paper 14.
Rind, D., D. Peteet, W.S. Broecker, A. Mclntyre and W. Rud- diman, 1986: The impact of cold North Atlantic sea surface temperatures on climate: implications for the Younger Dryas cooling ( 11 - 1 Ok). Clim. Dynam.. 1.3- 33.
Ruddiman. W.F. and A. Mclntyre, 1981: The North Atlantic Ocean during the last deglaciation. Palaeogeogr., Pa- laeoclimatoL, Palaeoecol., 35. 145-214.
Schlosser, P., G. Bonisch, M. Rhein and R. Bayer, 1991: Re- duction of deepwater formation in the Greenland Sea during the 1980s: evidence from tracer data. Science, 251. 1054-1056.
Wrist, G., 1935: Die stratosphare. Wissenschafiliche Ergebnisse der Deutschen Atlantischen Expedition "'Meteor". 6, 109-288.
and A. Defant, 1936: Atlas zur schichtung und zir- kulation des Atlantischen Ozeans. Schnitte und karten von temperatur, salzgehalt und dichte, l,l'issenschaft- liche Ergebnis~'e der Deutsehen Atlantischen Expedition "Meteor". 6. 103 pp. I~
OCEANOGRAPHY-Vol. 4, No. 2.1991 89